Article

Energy and Mass Balance Assessment of a Microalgae-Based Biomethane Biorefinery: Mesophilic Design vs. Psychrophilic Operation in a Pilot Plant


by
María del Carmen Suárez Rodríguez
,
María-Pilar Martínez-Hernando
,
David Bolonio
,
Marcelo F. Ortega
,
Pedro Mora
and
María-Jesús García-Martínez
*
ETSI Minas y Energía, Universidad Politécnica de Madrid, Ríos Rosas 21, 28003 Madrid, Spain
*
Author to whom correspondence should be addressed.
Energies 2026, 19(6), 1541; https://doi.org/10.3390/en19061541
Submission received: 24 February 2026 / Revised: 11 March 2026 / Accepted: 13 March 2026 / Published: 20 March 2026
(This article belongs to the Special Issue Renewable Fuels: A Key Step Towards Global Sustainability)

Abstract

Decentralized biomethane is vital for the energy transition; however, small-scale plants face significant energy penalties. This study evaluates the mass and energy balance of a TRL 6 pilot biorefinery treating pig manure, integrating anaerobic digestion with a microalgae-based photobioreactor coupled to an absorption column for biogas upgrading (>93 vol% CH4, dry basis). A Life Cycle Inventory (LCI) was used to compared a theoretical mesophilic design (Scenario I, 35 °C) against an experimental psychrophilic baseline (Scenario II, avg. 12 °C). The results indicate that while winter mesophilic heating consumes 58% of gross energy production, the passive psychrophilic strategy eliminates this demand, ensuring a positive Net Energy Balance year-round. Both scenarios achieved competitive Specific Energy Consumption (SEC) (1.20 vs. 4.17 kWh·m−3 CH4), while upgrading reached peak efficiency at a 10 min Hydraulic Residence Time. Furthermore, solar-synchronized load-shifting allowed for 100% electrical self-sufficiency. We conclude that although passive operation offers a superior Energy Return on Investment during cold periods (average EROI of 2.35 vs. 1.44 under winter mesophilic conditions), active mesophilic heating yields a 3-fold revenue increase, making it the superior economic choice despite the thermal penalty.

1. Introduction

The global need to mitigate greenhouse gas (GHG) emissions and transition from fossil fuels has become increasingly urgent on a global scale. The European Union’s “Fit for 55” strategy stipulates a 55% reduction in emissions by 2030 compared to 1990 levels, with the aim of achieving climate neutrality by 2050 [1]. Despite these objectives, the agricultural sector continues to be a major source of climate-forcing agents. In 2023, agriculture was responsible for 142.3 Mt of methane (CH4) emissions, making it the largest contributor to anthropogenic methane worldwide [2]. A substantial portion of these emissions originates from the management of slurry, an environmental issue that has been exacerbated by the expansion of the livestock industry in Europe [3].
Unmanaged manure is a significant source of GHGs, including CH4, carbon dioxide (CO2), and nitrous oxide (N2O), which are frequently categorised as fugitive emissions. Anaerobic Digestion (AD) has been identified as an optimal waste management strategy to mitigate these emissions [4]. AD facilitates the biological conversion of organic residues, such as livestock manure or municipal sludge, into biogas. Biogas is a versatile biofuel that typically comprises CH4 (50–70 vol%) and CO2 (30–50 vol%) [5]. It is saturated with water vapor (H2O, 5–10 vol%) and contains trace components such as oxygen (O2, <1 vol%), and hydrogen sulfide (H2S, <10,000 ppm) [5].
The recent literature extensively documents the versatility of AD by exploring biogas production from a diverse array of alternative organic substrates to optimize energy yields and enhance process stability. For instance, recent studies have successfully evaluated the anaerobic digestion and co-digestion of food waste and municipal solid waste [6], agricultural crop residues and lignocellulosic biomass [7], as well as various complex agro-industrial wastewaters [8].
Nevertheless, the presence of CO2 constitutes a considerable technical barrier, as it reduces the energy density of the gas and diminishes its specific enthalpy. Upgrading is required to convert raw biogas into biomethane. Although engines can function with 85 vol% CH4, the Spanish grid regulation PD-01 (Technical Management of the System) requires concentrations exceeding 95 mol% CH4 (dry basis) to ensure interchangeability [9].
Currently, well-established physicochemical technologies are employed to remove CO2 and refine biogas into biomethane, including water scrubbing, chemical absorption, pressure swing adsorption (PSA), and membrane separation. Although these conventional commercial methods are highly efficient for large-scale industrial facilities, their primary challenges are associated with energetic and economic barriers. Recent comparative studies have highlighted that substantial capital expenditure (CAPEX) and operational costs (OPEX), driven by high-pressure requirements, complex infrastructure, and expensive chemical regeneration or replacement needs, render these systems cost-prohibitive and unsustainable for small-scale, decentralized biogas production plants [10].
To address this challenge, this study introduces an innovative and cost-effective alternative: biological upgrading using autochthonous microalgae. In contrast to conventional methods, this microalgae-based system provides several significant advantages that mitigate both economic and technical constraints. First, it operates under mild environmental conditions (atmospheric pressure and moderate temperatures), substantially reducing energy consumption and overall OPEX. Second, the use of open systems, such as raceway reactors, significantly decreases construction costs, thereby minimizing the initial CAPEX compared to high-pressure industrial facilities. Third, this biological approach allows for the simultaneous removal of CO2 and highly toxic H2S without relying on expensive or hazardous chemical absorbents. Finally, the system generates valuable co-products, such as harvested algal biomass, which serves as a nutrient-rich biofertilizer. This co-product helps offset operational costs and replace synthetic fertilizers, thereby establishing a closed-loop circular economy.
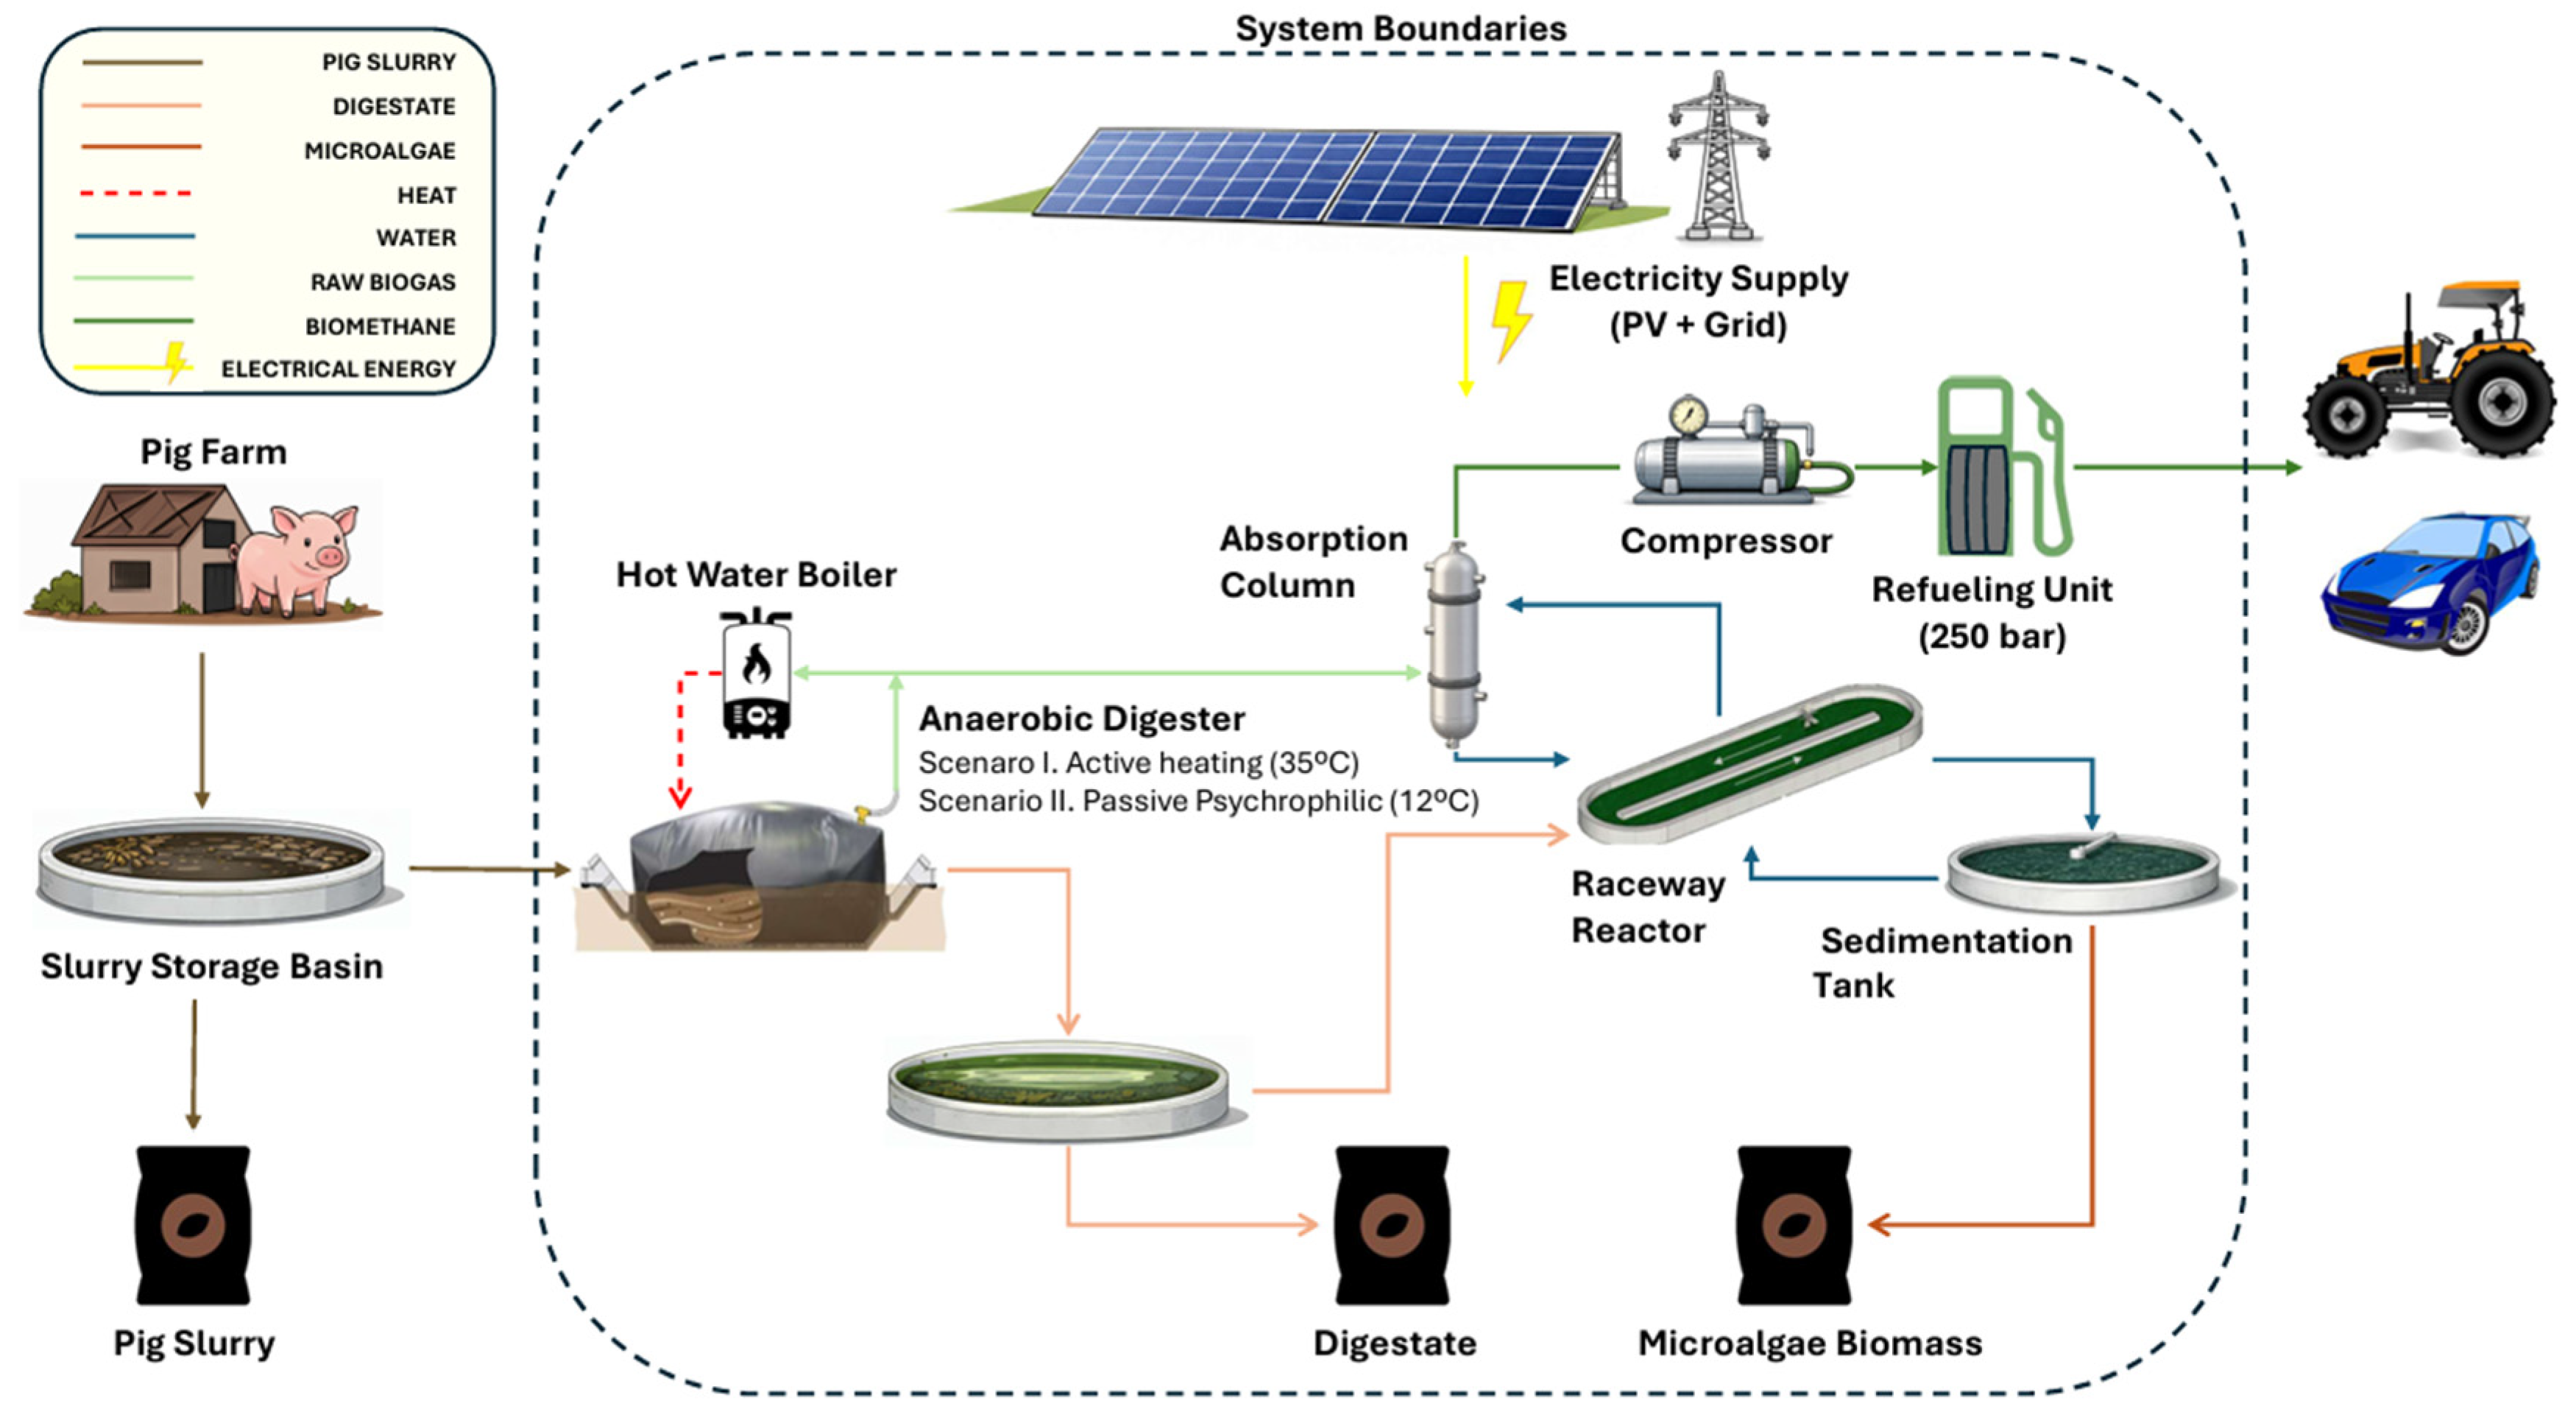
As illustrated in Figure 1, the proposed system integrates an absorption column in which CO2 from the raw biogas is captured in the liquid phase and directed into a raceway reactor for microalgal assimilation. Following sedimentation, the harvested algal biomass is managed as a nutrient-rich biofertilizer, while the upgraded biomethane exiting the absorption column is routed to a gas station, where it is compressed for use in adapted heavy-duty agricultural vehicles, thereby creating a closed-loop circular economy. A comprehensive technical description of each unit and process is provided in the methodology section.
This research is part of the LIFE SMART AgroMobility project (LIFE19 CCM/ES/001206) (Figure 1), which focuses on a pilot-scale prototype (TRL 6) located in Soria, Spain, a rural area experiencing depopulation and facing challenges in waste management.
The primary objective of this study is to establish a Life Cycle Inventory (LCI) through comprehensive mass and energy balances. This methodological approach constitutes a preliminary stage within standardized Life Cycle Assessment frameworks and will serve as the foundation for a subsequent full Life Cycle Assessment (LCA), facilitating a more detailed evaluation of the environmental performance of biomethane production systems, as proposed in the recent literature [11,12,13]. Specifically, a comparative analysis between a theoretical mesophilic operational model (35 °C) and the empirical psychrophilic performance recorded at the pilot plant (avg. 12 °C) is presented. To the best of our knowledge, no previous studies have compared these two scenarios using a real pilot plant. By contrasting these two thermal regimes, this study evaluates the trade-offs between biological kinetics and fugitive thermal loads. Our findings demonstrate that while the passive psychrophilic strategy is superior in terms of Net Energy Balance (NEB) and energy autonomy, the active mesophilic operation yields a three-fold increase in revenue, identifying a critical decision point between energy resilience and economic viability for decentralized systems.

2. Materials and Methods

2.1. Study Area Characterization and Climatological Datasets

The experimental pilot plant is situated at a commercial pig farm in Sauquillo de Boñices, Soria (Spain) (41.59° N, 2.33° W; 977 m a.s.l.). This location is characterized by a Mediterranean-Continental climate, which poses significant thermal challenges for anaerobic digestion.
Meteorological data were synthesized from two primary sources to ensure the accuracy of the mass and energy balances the following:
  • Thermo-Pluviometric Data: Monthly averages for ambient temperature (Tm = 11 °C), annual precipitation (Pm = 512 mm), relative humidity (Hr = 65%), and wind speed (Ws = 3.27 m·s−1) were obtained from the State Meteorological Agency (AEMET) [14], based on the 1981–2010 climatological series.
  • Solar Resource: Global horizontal irradiation was extracted from the Typical Meteorological Year (TMY) via the European Commission’s PVGIS database (2005–2020 series) [15]. These data were utilized to calculate the Peak Sun Hours (PSH) to determine the energy yields of the on-site photovoltaic (PV) system.
The proximity of the Soria meteorological station (21.6 km; 1081 m a.s.l.) ensures the representativeness of the atmospheric variables used in thermal loss modelling and the Net Energy Balance (NEB) calculations.

2.2. Biomethane Plant

The LIFE SMART AgroMobility project is designed as a circular integrated system. The following sections detail the process stages that constitute the biorefinery, providing the basis for the subsequent Mass and Energy Balance (MEB) analysis.

2.2.1. Substrate Management and Anaerobic Digestion (AD)

The process begins with the collection of pig manure from fattening beds. A strategic 25-day consolidation period is implemented for slurry accumulation, which is synchronized with the theoretical Hydraulic Retention Time (HRT) defined in the design phase. This operational synchronization ensures a steady-state feeding regime, optimizing resource management and maximizing biomethane yields.
The raw substrate is homogenized in a storage basin (V-01) (Figure S1). The biorefinery is designed to process a continuous inlet of 5 t·day−1, representing a specific fraction of the farm’s total production. While the surplus slurry follows conventional farm management (outside the scope of this study), the target fraction is fed to the digester (D-01) (Figure S1). This semi-buried reactor, with a 150 m3 total volume and 117 m3 liquid capacity, is equipped with an underfloor radiant heating system supplied by a biogas boiler (H-01) (Figure S1). This infrastructure enables mesophilic operation (Scenario I), which requires conditioning the biogas fuel stream (silica gel and activated carbon filters) to protect the boiler. In contrast, for the experimental baseline assessment (Scenario II), the heating loop is deactivated, resulting in psychrophilic operation.
The AD stage generates two main streams: raw biogas containing >60 vol% CH4 (dry basis), which is subsequently directed to the upgrading system [11], and liquid digestate comprising approximately 3% solids by mass [16] with the remaining fraction in the liquid phase.

2.2.2. Digestate Valorization and Nutrient Conditioning

The effluent from the AD stage is managed through a dual-valorization pathway, prioritizing both agricultural recycling and internal process synchronization. While the bulk of the liquid digestate is stored for controlled agricultural valorization (subject to nutrient management regulations), a strategic fraction is redirected as a specialized nutrient medium for microalgal culture to support the subsequent biogas upgrading process.
To meet the specific metabolic and nutritional requirements of the autochthonous microalgae consortium, the raw digestate undergoes a conditioning stage involving a volumetric dilution of 1:7 (digestate:water) [17]. This process effectively standardizes the concentrations of essential mineral salts, primarily ammonia-nitrogen (NH4+-N) and orthophosphates (PO43−-P), which serve as fundamental substrates for photosynthetic growth.
This conditioning is centralized in a dedicated mixing tank (TK-01) (Figure S1), where the digestate is homogenized with groundwater sourced from the facility’s well. The dilution ratio is strictly controlled to ensure optimal turbidity and nutrient loading, thereby maintaining ammonium concentrations below toxicity thresholds within the photobioreactor. Once standardized, the nutrient medium is fed into the microalgae raceway, facilitating in situ nutrient recovery. This integration transforms the nitrogen and phosphorus present in the livestock waste into high-value algal biomass while simultaneously providing the aqueous medium necessary for the chemical absorption of CO2 during the upgrading stage.

2.2.3. Photosynthetic Biogas Upgrading and Biomass Recovery

Raw biogas is biologically purified using an integrated photosynthetic upgrading system that couples physical absorption with biological CO2 fixation. The core of this process is an open Raceway Pond Reactor (RPR, V-03) (Figure S1), covering a surface area of 1350 m2. The system is operated with a variable depth of 20 to 30 cm, resulting in a working volume ranging from 270 to 405 m3. Initially established with rainwater, the reactor is continuously supplemented with the standardized nutrient medium from TK-01. To enhance microalgae productivity, a motorized Paddle Wheel system (M-01) (Figure S1) is installed to continuously transfer material from the microalgae culture, which is crucial for optimal photosynthesis. Additionally, an auxiliary air blower (S-02) (Figure S1) is integrated to promote the desorption of dissolved oxygen (O2), thereby preventing photosynthetic inhibition caused by high dissolved oxygen concentrations within the aqueous medium.
Gas–liquid transfer occurs in a counter-current absorption column (C-01) (Figure S1) characterized by a height-to-diameter (H:D) ratio of 4:1. An ATEX-certified blower (S-01) (Figure S1) feeds raw biogas into the column, operating with a specific auxiliary daily consumption of 0.1 L of lubricating oil, which is factored into the system’s operational inventory. Within the column, the biogas interacts with the recirculated microalgal culture, facilitating the diffusion of CO2 from the gaseous phase into the liquid phase through carbonate-bicarbonate equilibrium reactions. This configuration is designed to maximize contact time, yielding a high-purity biomethane stream (exceeding 90 vol%, dry basis) at the top of the column. Meanwhile, the carbon-enriched liquid is returned to the raceway (RPR) for biological regeneration. For safety and operational stability, the system includes an emergency bypass line directed to the plant flare.
Simultaneously, the upgrading process operates as an integrated platform for the recovery of a high-value co-product: algal biomass. The microalgal suspension is periodically harvested and directed to a sedimentation tank (TK-02) (Figure S1) for solid–liquid separation. The resulting solid fraction is valorized as a nutrient-rich organic fertilizer [18], thereby closing the agricultural circularity of the system. The settled fluid is redirected back to the PBR to replenish the liquid fraction, minimizing water consumption and maintaining the microbial population within the reactor.

2.2.4. Final Biomethane Refining and High-Pressure Storage

To ensure compliance with strict quality standards (such as PD-01 for grid injection [9] or EN 16723-2 for automotive use [19]), the upgraded biogas undergoes a final polishing stage to reduce residual moisture and trace contaminants to levels below standard detection limits. This refining line integrates a silica gel unit (F-03) (Figure S1) for deep dehydration and an activated carbon filter (F-04) (Figure S1) targeting H2S and VOCs. The mass consumption rates of the filters are 0.13 kg·h−1 and 0.07 kg·h−1, respectively. The refined biomethane is then directed to a gasometer (G-01) (Figure S1), acting as a buffer to stabilize flow and pressure. Downstream, the biomethane is pressurized by the compressor (C-02) (Figure S1) to achieve a storage pressure of 250 bar(a), aligning with the necessary discharge pressure of the Refueling Unit (RU-01) (Figure S1) for subsequent refueling in light and agricultural vehicles.

2.3. Operational Scenarios and Methodological Framework

To evaluate the thermodynamic and operational viability of the decentralized biorefinery, this study compares two scenarios. This approach differentiates between the nominal design capacity, intended for maximized biological kinetics, and the experimental baseline, which reflects the system’s resilience under real-world low-energy constraints.

2.3.1. Scenario I: Theoretical Mesophilic Design (Nominal Performance)

This scenario constitutes the primary analytical baseline for the Mass and Energy Balance (MEB) and the Life Cycle Inventory (LCI). It assumes a steady-state thermal regime of 35 °C and a nominal design inlet flow of 4680 kg slurry·day−1, corresponding to a hydraulic retention time (HRT) of 25 days. In this configuration, biogas boiler provides the active heating required to compensate for conductive and convective-radiative heat losses. To ensure the operational integrity of the combustion unit, raw biogas undergoes a specific pretreatment stage involving silica gel (0.03 kg·day−1) and activated carbon (0.01 kg·day−1) filtration to remove moisture and trace contaminants.

2.3.2. Scenario II: Experimental Psychrophilic Baseline (Passive Resilience)

This scenario reflects the empirical performance recorded at the TRL 6 pilot plant in Soria during an intensive experimental campaign from July 2023 to June 2024. Throughout this period, systematic measurements were conducted approximately once per week to monitor the volumetric flow rate and chemical composition of both the raw biogas exiting the digester and the final upgraded biomethane. To evaluate the facility’s energy self-sufficiency, the active heating loop and its associated pretreatment line were bypassed, allowing the process temperature to fluctuate with environmental conditions, resulting in a psychrophilic regime (average of 11 °C during winter months). During this phase, the system was fed with an influent flow of 3750 kg slurry·day−1, which extended the HRT to approximately 40 days.
Data acquisition was centralized via an industrial SCADA system, providing high-resolution monitoring of electrical consumption, real-time biogas yields, and internal thermal gradients. Rather than a secondary full-scale mass balance, this scenario is utilized to contrast key performance indicators (KPIs) against the theoretical targets of Scenario I, quantifying the trade-offs between biological production rates and the Net Energy Balance (NEB) in decentralized rural contexts.

2.3.3. Functional Unit and System Boundaries

To ensure the transparency and reproducibility of the mass and energy balances, the Functional Unit (FU) is defined as one hour of continuous operation of the biorefinery system. This FU corresponds to a reference output flow of 1.2 Nm3·h−1 of biomethane compressed at 250 bar(a).
The system boundaries are defined using a gate-to-gate approach, encompassing all core processes from the reception of pig slurry in the storage basin to the final compression of biomethane (as shown in Figure 1). Upstream agricultural activities and downstream biomethane combustion are excluded. The co-products, such as liquid digestate and microalgal biomass, are accounted for as output mass and energy flows within this inventory, providing the necessary data for future Life Cycle Assessment (LCA) studies where allocation procedures can be applied according to ISO 14044 [20].

2.4. Mass and Energy Assessments

2.4.1. Feedstock Characterization and Design Parameters

The stoichiometry of biomethane production and nutrient recovery in the biorefinery is governed by the biochemical properties of the input streams and the operational efficiencies of the unit processes. This section details the mass inventory and chemical characterization used in Scenario I modelling.
The conversion of organic waste into biomethane requires a precise understanding of the biochemical properties of feedstocks and intermediate streams. In this study, the primary substrate consists of pig slurry, which was formulated through the strategic dilution of pig manure to optimize the balance between hydraulic manageability and organic loading. While the high-water content of the slurry (90–95 wt%) ensures the fluidity and provides the essential buffering capacity and nutrients necessary for Anaerobic Digestion (AD) [21], the inclusion of manure and associated bedding material enhances the organic nitrogen and Total Volatile Solids (TVS) content.
The AD process transforms these inputs into raw biogas and a nutrient-rich digestate. Anaerobic degradation reduces the TVS while simultaneously concentrating essential nutrients, such as phosphorus (PO43−-P), and mineralizing organic nitrogen into plant-accessible ammonia (NH4+-N). Compared to raw slurry, the resulting digestate offers superior stability, reduced odor profiles, and a nutrient composition better-suited for microalgae cultivation. Subsequently, the integration of a microalgae-based symbiotic platform facilitates the biological sequestration of CO2 from raw biogas, yielding a protein-rich biomass that effectively closes the circular nutrient loop.
The composition of organic matter and nutrients in streams, such as pig manure, slurry, digestate, and microalgae biomass, varies significantly. Key influencing factors include animal diet and manure management practices [22,23], anaerobic digestion operational conditions [24], and the specific microalgae species or cultivation parameters selected [25]. Consequently, the reported data shown in Table 1 should be interpreted as indicative average ranges. All data are expressed on a fresh weight (FW) basis, derived from a synthesis of standardized literature and proprietary pilot plant measurements to ensure a representative baseline for the modelling stage.
Table 1. Elemental characterization of organic matter (input and by-products) from the pilot plant.
MatterDensity
(g·cm−3)
Dry Matter
(%)
Organic Matter
(g·kg−1)
Total-N
(g·kg−1)
NH4-N
(g·kg−1)
Total-P
(g·kg−1)
K
(g·kg−1)
Manure0.9 ± 0.0111.4 ± 5.691.2 ± 44.84.5 ± 1.61.8 ± 0.81.9 ± 0.52.9 ± 1.1
Slurry1.0 ± 0.024.2 ± 2.331.8 ± 15.84.1 ± 2.22.4 ± 1.51 ± 0.71.4 ± 0.8
Digestate1.0 ± 0.022.16 ± 0.459.01 ± 0.074.1 ± 2.23.09 ± 1.91 ± 0.51.4 ± 0.5
Microalgae1.0 ± 0.0515 ± 5117.5 ± 29.0311.45 ± 3.80.34 ± 0.231.14 ± 0.21.21 ± 0.2
All compositions are expressed on a wet weight basis. Source: Design parameters established based on experimental pilot plant data (University of Valladolid, 2020) and literature review [16,26,27,28,29,30,31,32,33,34,35,36].

2.4.2. Process Design and Efficiency Indicators (Scenario I)

To establish a rigorous mass balance for the nominal design, a set of efficiency parameters was defined based on the LIFE SMART AgroMobility engineering specifications. These indicators, summarized in Table 2, represent the steady-state operational thresholds for Scenario I.
The primary driver for energy production is the methane potential, established at 0.5 m3 CH4·kg−1 TVS, assuming a substrate with a Total Volatile Solids (TVS) content of 33.3 g·kg−1. For the upgrading stage, a liquid-to-gas (L/G) ratio of 1.5 (v/v) was selected to optimize CO2 absorption, targeting an overall removal efficiency of 95%. In parallel, the biological system’s capacity for nutrient recovery is determined by a microalgae productivity of 18 g·m−2·day−1, with a corresponding carbon demand of 2.31 kg CO2 per kg of biomass produced.
These parameters, derived from both standardized literature and proprietary detailed engineering, provide the boundary conditions for the Mass and Energy Balance (MEB) calculations.

2.4.3. Energy Assessment and Thermodynamic Modeling

The energy assessment of the biorefinery integrates the theoretical thermal demand for Scenario I (mesophilic) with the electrical consumption inventory. The model specifically addresses the heat transfer mechanisms in the semi-buried anaerobic digester and accounts for its specific geometry and environmental conditions in Soria, Spain. The thermal energy required must support the losses generated by the anaerobic digester, including losses by radiation, convection, conduction and continuous heating of the incoming substrate (pig slurry) inside the digester.
  • Soil Temperature Modelling and Thermal Transmittance.
The anaerobic digester is installed outdoors. Consequently, a semi-buried configuration has been adopted to minimize contact with the atmosphere and reduce heat loss. The 150 m3 digester has a buried surface area of Sd = 262 m2 (lower and lateral) and an aerial surface area of Su = 203 m2. The system has a td = 1.5 mm thick low-density polyethylene (LDPE) insulation; however, an additional tdc = 0.05 m of polystyrene coating has been installed as a lining around the entire digester, completely bonded.
It has been assumed that the input material has an inlet temperature equal to that of the ambient temperature at the site.
The relationship between ambient and ground temperature at the specific installation depth (z = 0.8 m) was modelled using the physical conduction method, as shown in Equation (1) [44]. This model demonstrates that hourly fluctuations are negligible at this depth. Instead, the soil temperature follows a stable annual cycle, characterized by an exponential attenuation (e−z/d) dependent on the soil’s damping depth (d = 1.42 m). This thermal inertia reduces the annual amplitude to 10.62 °C and introduces a time lag (phase shift) of approximately 33 days relative to the surface temperature.
T e z , t = T a v g + A s × e z / d × c o s ( ω t t 0 z d ) ,
where
  • T e z , t : Soil temperature at depth z and time t (°C).
  • T a v g : Mean annual temperature (°C).
  • A s : Annual temperature amplitude at the soil surface (°C).
  • z : Installation depth (0.8 m).
  • d : Damping depth of the soil (1.42 m), representing thermal diffusivity.
  • t : Hour of the year (1–8760).
  • t 0 : Hour of the year with the maximum surface temperature (5448 h).
To calculate the soil thermal transmittance coefficient (Ub,s) [Equation (3)], the thermal conductivity coefficients of the clay soil (λs = 1.5 W·m−1·K−1 [45]), LDPE (λLDPE = 0.35 W·m−1·K−1 [46,47]), and polystyrene (λdc = 0.05 W·m−1·K−1 [48]) were used. Because the envelope is a geotextile bag, no rigid wall is modelled. A surface resistance value of Rsi = 0.17 m2·K·W−1 [46,47] was adopted, assuming a horizontal element subject to downward heat flow.
First, the equivalent ground thickness (dt) is determined according to ISO 13370 [45], as shown in Equation (2). This parameter accounts for the thermal resistance of the floor materials relative to soil conductivity.
d t = w + λ s × R s i + t i λ i = λ s × R s i + t d λ L D P E + t d c λ d c ,
where
  • d t : Equivalent thickness of the ground (m).
  • w : Thickness of the walls (m) (negligible in this geotextile configuration).
  • λ s : Thermal conductivity of the clay soil (1.5 W·m−1·K−1).
  • R s i : Internal surface resistance (0.17 m2·K·W−1).
  • t i : Thickness of each envelope layer (LDPE and polystyrene) (m).
  • λ i : Thermal conductivity of each envelope layer (LDPE and polystyrene) (W·m−1·K−1).
Subsequently, using the characteristic dimension of the digester floor (B’ = 5.35 m [45], the overall buried thermal transmittance (Ub,s) was calculated as 0.201 W·m−2·K−1 using the logarithmic method described in Equation (3):
U b , s = 2 × λ s π × B × ln ( B z   + d t + 1 ) ,
where
  • U b , s : Overall buried thermal transmittance (W·m−2·K−1).
  • λ s : Thermal conductivity of the clay soil (1.5 W·m−1·K−1)
  • B’: Characteristic dimension of the floor (5.35 m), derived from the bottom area (Sb) and perimeter (P) (B’ = Sb/(0.5 · P)
  • z : Installation depth (0.8 m).
  • d t : Equivalent thickness of the ground (m), as calculated in Equation (2).
2.
Aerial Heat Transfer and Sol-Air Temperature
The exterior heat transfer coefficient (hout) was determined at an hourly time-step to accurately capture the rapid temporal fluctuations of ambient temperature ( T m ) and, specifically, the adjusted wind speed (vd). The model integrates a convective component, governed by McAdams’ correlation and a linearized radiative term derived from the Stefan-Boltzmann law, as expressed in Equation (4). The latter explicitly accounts for the specific emissivity of the cover ( ε   = 0.85), consistent with the thermal properties of the polyethylene material employed.
h o u t t = 5.7 + 3.8 × v d t + [ 4 × ε × σ × T m 3 t ] ,
where
  • h o u t t : Hourly exterior heat transfer coefficient (W·m−2·K−1).
  • v d t : Adjusted wind speed at time t (m·s−1).
  • ε : Emissivity of the polyethylene cover (0.85).
  • σ : Stefan-Boltzmann constant (5.67 × 10⁻⁸ W⋅m−2⋅K−4).
  • T m t : Ambient temperature (K).
  • 5.7 and 3.8: Empirical convective constants based on McAdams’ correlation.
Due to the negligible thermal mass of the polyethylene envelope, the heat transfer process is characterized as an instantaneous response model. The high thermal diffusivity and low thickness of the material allow for the omission of heat storage terms ( ρ C p T t 0 ) , leading to a purely boundary-driven energy balance.
The cover total heat transfer rate ( Q c ) is governed by the gradient between the operational temperature (Top = 35 °C) and the dynamic Sol-Air Temperature (TS-A). This interaction condenses the transient environmental conditions, comprising solar short-wave gains, atmospheric long-wave exchange, and convective losses, into a single effective thermal potential modeled in Equation (5). The model accounts for the heat exchange dynamics within the headspace, characterizing the slurry-gas and gas-cover boundaries with convective coefficients of 2 and 1 W·m−2·K−1, respectively [49]. This convective arrangement, integrated with the material properties in Equation (6), yields a total thermal resistance for the cover assembly of  R c T o t =   2.5 m2·K W−1. Finally, the external radiative and convective balance is solved via the Sol-Air temperature in Equation (7).
Q c t = S u × T o p T S A ( t ) R c T o t + 1 h o u t ( t )   ,
R c T o t = ( 1 h S G ) + ( 1 h G C ) + ( t d λ L D P E ) + ( t d c λ d c ) ,
T S A t = T m t + α × G h t ε × ( σ × T m 4 t I R h t ) h o u t ( t ) ,
where
  • Q c t : Total heat transfer rate through the cover at time t ( W ).
  • S u : Upper surface area of the digester cover (m2).
  • R c T o t : Total thermal resistance of the cover assembly (m2⋅K⋅W−1).
  • h o u t t : Hourly exterior heat transfer coefficient calculated in Equation (4) ( W m 2 K 1 ).
  • T o p : Operational temperature of the digestate (35 °C).
  • T S A ( t ) : Sol-Air temperature (K).
  • h S G : Convective coefficient at the slurry-gas interface (2 W·m−2·K−1) [49].
  • h G C : Convective coefficient at the gas-cover interface (1   W m 2 K 1 ) [49].
  • t d ,   t d c :  Thickness of the LDPE and polystyrene, respectively (m).
  • λ L D P E λ d c : Thermal conductivity of the cover materials ( W m 1 K 1 ).
  • T m t : Ambient temperature (K).
  • α : Solar absorptivity of the cover (0.95, blackbody approximation).
  • G h t : Global horizontal solar irradiance ( W m 2 ).
  • ε : Emissivity of the polyethylene cover (0.85).
  • σ : Stefan-Boltzmann constant (5.67 × 10⁻⁸ W⋅m−2⋅K−4).
  • I R h t : Sky longwave (infrared) irradiance on a horizontal plane ( W m 2 ).
3.
Aggregate Thermal Demand and Biogas Consumption
To account for the thermal interaction with the substrate, ground-coupled heat losses ( Q s ) were modeled as explained in Equation (8) (using (1) and (3)):
Q s t =   S d × U b , s × T o p T e t ,
where
  • Q s t : Ground-coupled heat losses at time t ( W ).
  • S d : Lower and lateral buried surface area (m2).
  • U b , s : Overall buried thermal transmittance, calculated in Equation (3) ( W m 2 K 1 ).
  • T o p : Operational temperature of the digestate (35 °C).
  • T e z , t : Soil temperature at depth z and time t, calculated in Equation (1) (°C).
Regarding the thermophysical properties of the substrate, pig slurry was modelled using water as a surrogate owing to its high moisture content. Consequently, a specific heat capacity (Cp) of 4180 J·kg−1·K−1 was adopted [50]. To maintain the anaerobic digestion process within the mesophilic range under varying environmental conditions, the thermal power  ( q )  required to heat the influent substrate to the target temperature is calculated in Equation (9):
q   ( t ) =   m ˙ × c p × T o p T m ( t ) ,
where
  • q   ( t ) : Thermal power required for substrate heating at time t ( W ).
  • m ˙ : Mass flow rate of the substrate (kg·s−1).
  • c p : Specific heat capacity of the substrate (4180 J·kg−1·K−1) [50].
  • T o p : Operational temperature of the digestate (35 °C).
  • T m t : Temperature of the influent substrate at time t, assumed equal to ambient temperature (°C).
To maintain a steady-state mesophilic equilibrium, the boiler must compensate for the cumulative thermal dissipation of the system. The total heat demand,    Q T o t t ,  is defined by the aggregate energy balance of the reactor, summing the cover losses ( Q c , Equation (5)), ground losses ( Q s , Equation (8)), and substrate heating requirements ( q , Equation (9)), as expressed in Equation (10):
Q T o t ( t ) = Q c ( t ) + Q s t + q   ( t ) ,
where
  •   Q T o t t : Total heat demand of the digester at time t ( W ).
  • Q c t : Total heat transfer rate through the cover at time t( W ).
  • Q s t : Ground-coupled heat losses at time t ( W ).
  • q   ( t ) : Thermal power required for substrate heating at time t ( W ).
The required biogas volume ( V b i o g a s ) to satisfy this thermal load depends on the lower heating value (LHV) of the fuel and the boiler’s conversion efficiency ( η ). Assuming a nominal reference of 65 vol% methane content, the LHV was set at 6.58 kWh·m−3 [51] with a 90% efficiency factor ( η  = 0.90). Thus, the annual biogas consumption is determined by integrating the hourly heat demand over the year, as shown in Equation (11):
V b i o g a s =   t = 1 8760 Q T o t t 1000 × L H V B i o g a s × η ,
where
  • V b i o g a s : Annual biogas consumption required for heating (m3·year−1).
  •   Q T o t t : Total hourly heat demand calculated in Equation (10) ( W ).
  • L H V B i o g a s : Lower Heating Value of the biogas (6.58 kWh·m−3 [51]).
  • η : Boiler efficiency factor (0.90).
Although the theoretical model identifies a specific thermal demand to maintain mesophilic conditions, operational data from the pilot plant indicate that biogas production persists even in the absence of external heating, shifting the process to a psychrophilic regime (<25 °C). Although operating within this lower thermal range typically results in a diminished methane yield owing to reduced metabolic kinetics, the system maintains functional stability. Consequently, a techno-economic assessment is required to determine whether the energy investment for mesophilic optimization outweighs the benefits of psychrophilic operation, particularly for small-scale pilot installations, in which heat losses to the environment are proportionally higher.

2.4.4. Electrical Energy Inventory and Operational Duty Cycles

The electrical energy assessment was conducted by quantifying the demand of the 15 key electromechanical components comprising the pilot plant. The daily energy demand (Ed) for each component was determined based on its nominal power rating (P) and its effective daily operating time (t), as expressed in Equation (12):
E d = P × t ,
where
  • E d : Daily electrical energy demand (kWh·day−1).
  • P : Equipment nominal power (kW).
  • t : Effective daily operating time (h·day−1).
The operational strategy of the plant is designed to balance biological stability with energy optimization. Although the biochemical process is continuous, the electromechanical equipment operates under specific duty cycles tailored to the hydraulic retention times, homogenization requirements, and pressure-driven setpoints, as detailed in Table 3. This approach minimizes mechanical wear and reduces the baseload energy demand without compromising the system’s steady-state equilibrium.
Three units operate under a continuous duty cycle (24 h·day−1): the slurry feed pump, raceway paddle wheel, and Supervisory Control and Data Acquisition (SCADA) system. Continuous slurry feed pump operation ensures a constant volumetric loading rate to the anaerobic digester, thereby providing the hydraulic stability required for steady-state methane production. Simultaneously, the paddle wheel functions for 24 h in the microalgae raceway reactor, ensuring effective material transfer through the channel and maintaining the microalgae culture in suspension. This operation enhances algal biomass productivity and prevents inhibition [18,52].
The remaining components, notably the high-pressure biomethane compressor and digestion recirculation pumps, operate intermittently. Their runtimes are regulated by automated set-points derived from stable pilot plant performance data. Given the low operational variability of the semi-automated process, these mean values are representative of the facility’s baseline energy impact, providing a robust foundation for the subsequent Specific Electricity Consumption (SEC) analysis.

2.4.5. Power Supply from Renewable Energy Sources

A dedicated photovoltaic system was installed to meet the electrical requirements of the pilot plant process. For the solar resource assessment, the Typical Meteorological Year (TMY) database was retrieved for the specific location coordinates via the PVGIS API (Photovoltaic Geographical Information System) developed by the European Commission [15]. Subsequently, PVsyst [53] was employed as the simulation tool to model the system and obtain the hourly photovoltaic production profile.
The generator field comprises 24 monocrystalline silicon modules of 420 Wp each (Model: Tiger Neo JKM420N-54HL4, Jinko Solar, Shangrao, China [54]), configured in 4 strings of 6 modules in series. The panels are mounted with an inclination of 15° and an azimuth of −10°. Regarding power conditioning, adhering to the sizing ratio (Pnom,dc/Pnom,ac = 1.008) optimized by PVsyst, a single 10 kW inverter was selected (Model: SUN2000-10KTL-M2, Huawei Technologies, Shenzhen, China [55]), featuring an operating voltage range of 160–950 V.
This configuration ensures high conversion efficiency and system redundancy, thereby allowing the facility to maximize direct self-consumption during peak solar hours, which aligns with the intermittent operation of high-load components, such as the biomethane compressor.

3. Results

3.1. Mass Balance Analysis and Process Assessment: Theoretical Design (Scenario I) vs. Experimental Reality (Scenario II)

The performance of the integrated biorefinery is analyzed by comparing the steady-state mass balance of the mesophilic design (Scenario I) with the experimental psychrophilic operation (Scenario II). Tables S1A,B, in the Supplementary Materials, provides the foundational mass flows for Scenario I (relative error < 0.1%), while the experimental data reflects the pilot plant’s performance from July 2023 to June 2024.

3.1.1. Substrate Management and Anaerobic Digestion

The operational assessment reveals a marked divergence between the theoretical design and in situ performance. Under the mesophilic baseline (Scenario I), the system maintained a steady-state biogas production of 77.95 Nm3·day−1 (equivalent to 3.74 kg·h−1, Stream 7), assuming a biogas density of 1.15 kg m−3. This production rate validates the specific methane potential of 0.5 m3 CH4 kg−1 VS projected for the 4.2% TS slurry influent. Such benchmarks are predicated on an optimized biological degradation efficiency of 55% VS removal, attainable under controlled thermal conditions (35 °C). Thus, after meeting the internal energy demand, 58.9% of the raw biogas production is diverted to the upgrading unit (Stream 9, 2.20 kg·h−1), resulting in a total of 45.85 Nm3·day−1.
In contrast, Scenario II (mean 12 °C) reflects the kinetic constraints of psychrophilic operation. To ensure process stability, the slurry was modulated to 3750 kg day−1 (equivalent to the waste of 850–950 animals), extending the HRT to 40 days. Despite these adjustments, the biological degradation efficiency was limited to 33% VS removal, resulting in an average biogas yield of 14.4 Nm3·day−1, representing approximately 18% of the theoretical mesophilic capacity. Production exhibited strong seasonal dependency, correlating with ambient thermal conditions; yields peaked at 24.1 Nm3·day−1 in August (Tavg = 22.4 °C) and declined to a minimum of 0.9 Nm3·day−1 in January (Tavg = 4 °C), as shown in the monthly production profile in Figure S2A. While the raw biogas maintained a satisfactory methane content (62–77 vol%, wet basis), the H2S concentration consistently exceeded 5000 ppmv, mandating robust downstream desulfurization prior to energy valorization.

3.1.2. Digestate Valorization and Nutrient Conditioning

Digestate management strategies were evaluated based on their capacity to provide stabilized nutrients for secondary processes. In Scenario I, the nutrient conditioning stage successfully stabilizes the ammonium (NH4+) concentration at 0.40 wt% in the liquid phase (Stream 15). This provides a calibrated and constant nutrient flux for the subsequent photosynthetic stage without reaching inhibitory kinetic thresholds for microalgae.
In Scenario II, the process effectively transformed raw slurry into a stabilized effluent despite slower mineralization kinetics. The digestate reached a final VS concentration of 15.36 g·kg−1, compared with 22.97 g·kg−1 of the influent slurry. Experimental fertilization tests validated that this digestate serves as a superior nutrient source compared to raw slurry, attributed to the mineralization of organic matter, which increases the bioavailability of nutrients during the AD stage.

3.1.3. Photosynthetic Biogas Upgrading and Biomass Recovery

The upgrading stage integrates biological CO2 sequestration with high-purity methane recovery. In Scenario I, the mass balance highlights a massive liquid recirculation loop (Streams 19–20) operating at 2865.45 kg·h−1. This maintains a recirculation-to-biogas mass ratio of approximately 1302:1 (defined as m ˙ L/ m ˙ G, wet basis, where m ˙ G corresponds to the biogas in Stream 9 at 2.2 kg·h−1). It is important to note that due to the significant density difference between the liquid digestate and the biogas, this high mass ratio corresponds to a volumetric L/G ratio of approximately 1.5 (v/v), ensuring an extensive contact area for effective CO2 absorption. Consequently, the unit achieves an enrichment that raises the CH4 concentration from 58.85 vol% to 86.60 vol%, wet basis (Stream 10).
This intermediate stage captures the bulk of the gaseous CO2 (approximately 1.25 kg·h−1 directly from the raw biogas stream) and transforms it into 30.50 kg h−1 of microalgal suspension (Stream 23). Furthermore, the elemental mass balance confirms the robust capacity of the raceway to act as a dual-phase sink for biogenic carbon. Supported by the dissolved inorganic carbon and alkalinity provided by the liquid digestate influent, the microalgal biomass assimilates supplementary carbon, resulting in a total biological fixation rate equivalent to 3.70 kg of biogenic CO2 per hour. This carbon is effectively sequestered into algal biomass, with a total carbon content (C-tot) of 3.32 wt% (wet basis). This demonstrates a highly efficient symbiotic carbon-fixation mechanism in which both gaseous emissions and liquid digestate carbon are successfully consolidated into valuable biomass.
Scenario II experimentally validated this symbiotic mechanism, enriching CH4 from an average of 69.35 vol% to 93.10 vol%, wet basis. Notably, the higher initial methane concentration in the raw biogas under this regime is attributed to the increased solubility of CO2 at lower temperatures (Henry’s Law), promoting a spontaneous “pre-upgrading” effect. The experimental results confirmed that the optimal performance was achieved with a Liquid-to-Gas (L/G) ratio close to 1 (v/v) and a significantly reduced contact time of only 10 min in the absorption column. This suggests that small-scale decentralized units can achieve high purity using absorption columns that are significantly more compact than those documented in the literature (>30 min), optimizing the footprint for localized applications.

3.1.4. Final Biomethane Refining and High-Pressure Storage

The refining stage operates as a high-fidelity polishing unit, ensuring that the biomethane meets stringent fuel quality standards. In Scenario I, the process achieves a final CH4 purity of 96.59 vol% (Stream 11), with the mass balance confirming the reduction of H2S and VOCs to below the standard detection threshold (<1 ppm), and the reduction of CO2 to trace levels (0.23 vol%). The final compression to 250 bar(a) yields a high-density renewable fuel (Stream 14, 0.87 kg·h−1). This output reflects a high methane recovery efficiency of 94.9%, serving as a benchmark for the facility’s maximum potential.
Scenario II validated the technical feasibility of decentralized refuelling, consistently producing an average of 302 Nm3·month−1 of biomethane, as shown in Figure S2A. When converted to mass flow, this corresponds to approximately 0.33 kg·h−1. This experimental production represents approximately 38% of the theoretical design capacity. During the experimental period, a total of 334.74 kg of biomethane was successfully compressed. Real-world refuelling tests with a light vehicle (SEAT León) demonstrated that while the theoretical autonomy based on production was 7940 km, individual refuels were limited to 80% of the vehicle’s tank capacity. This limitation is attributed to the specific pressure dynamics and reduced storage volume of the decentralized station compared to industrial facilities. Furthermore, a 15% reduction in autonomy was observed compared to commercial CNG, highlighting the impact of residual trace gases in decentralized production.

3.2. Energy Balance

The energy performance of the biorefinery was evaluated by comparing the theoretical demand of the mesophilic design (Scenario I) with the empirical behavior observed during the experimental campaign (Scenario II).

3.2.1. Thermodynamic Analysis

  • Scenario I:
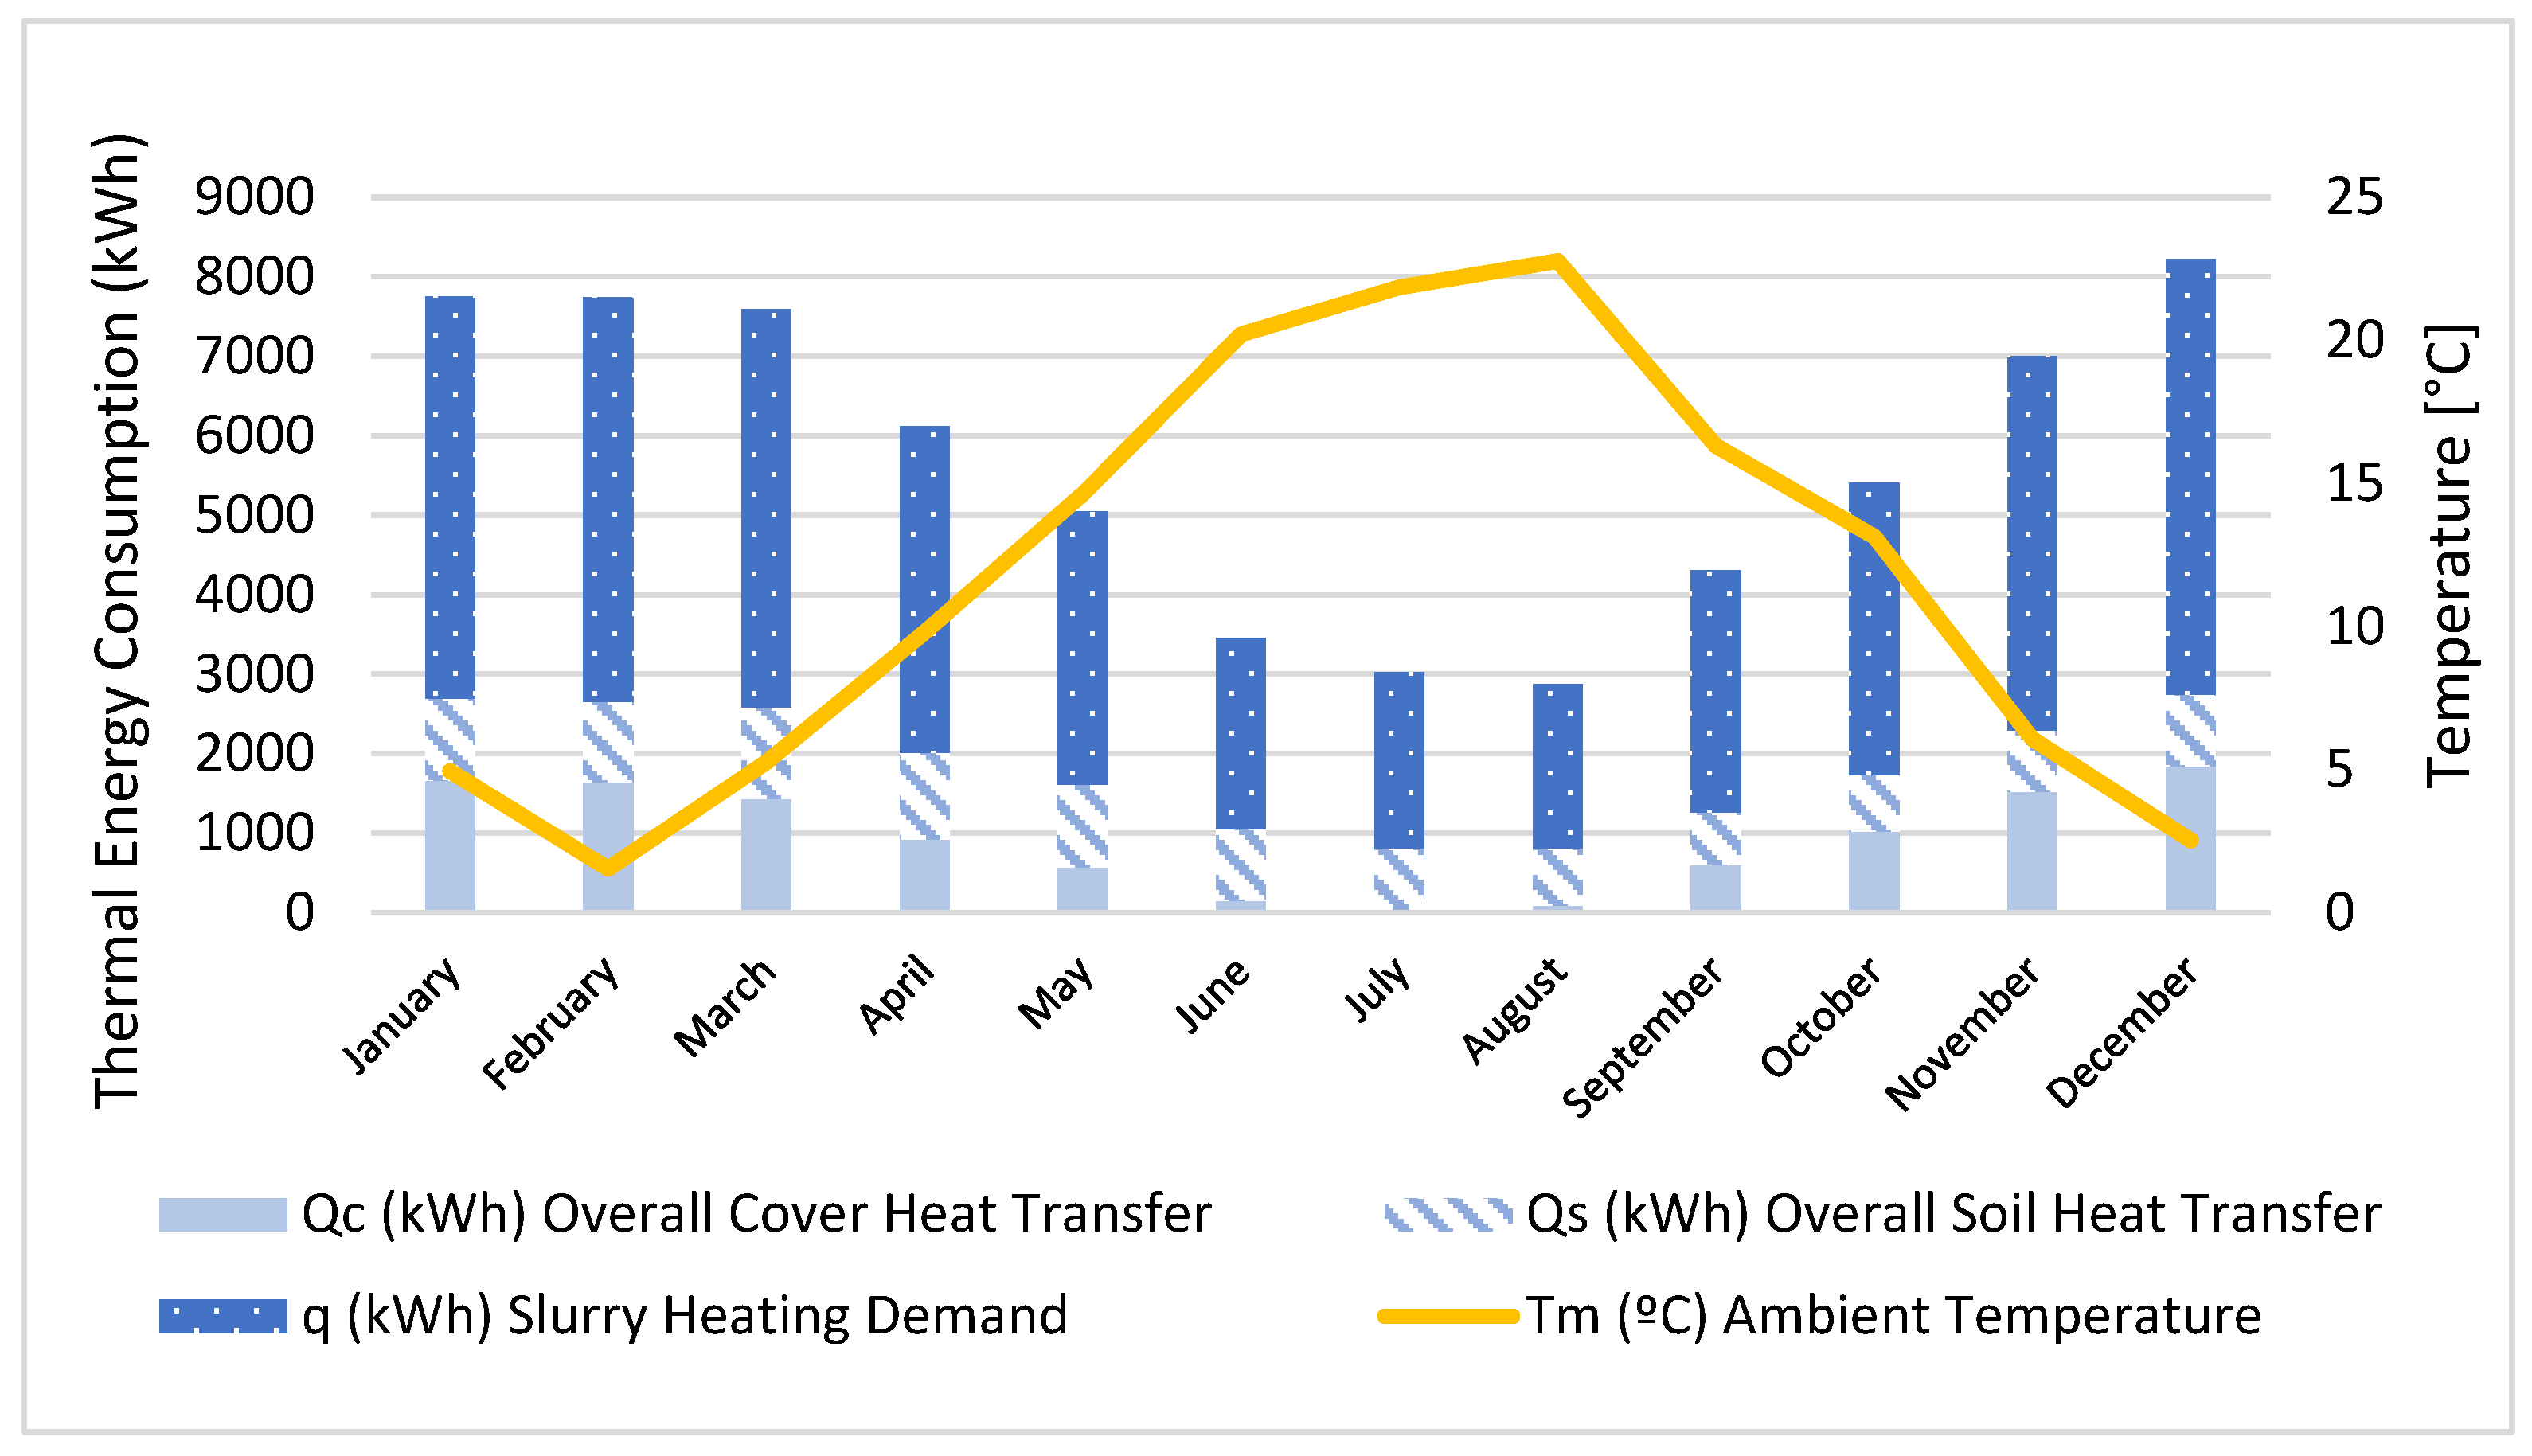
The thermal performance of the biorefinery was evaluated by quantifying the useful energy demand, defined as the net heat transfer required to sustain mesophilic conditions (35 °C) against environmental losses and feedstock variability. Figure 2 illustrates the monthly profile of this thermodynamic load, which is stratified by cover and soil heat transfer mechanism (QC, QS) and substrate conditioning requirements (q).
The analysis reveals marked seasonality in the total thermal duty, driven primarily by the sensible heat required to condition the influent substrate (q). As shown in Figure 2, the substrate heating demand—represented by the dark blue segment at the top of the bars—constitutes the dominant thermodynamic load during the winter period (from November to February), accounting for approximately 67% of the total energy requirement in December. This directly correlates with the methodology’s assumption of equating the inlet temperature to ambient conditions (Tm), creating a maximum thermal gradient (∆T ≈ 30 °C) during the coldest months. Conversely, during the summer peak (July and August), the contribution of q diminishes significantly as Tm approaches the operational setpoint, thereby reducing the boiler load to its annual minimum.
The effectiveness of the insulation and excavation strategy is evidenced by the stability of the ground-coupled heat losses (QS). Unlike atmospheric losses (QC), which fluctuate synchronously with the ambient temperature (Tm), the useful energy dissipated to the soil (shown by the medium-blue segment) maintains a quasi-steady profile throughout the annual cycle. This behavior validates the physical conduction model utilized [Equation (1)], confirming that the soil depth effectively attenuates thermal oscillations. The buried configuration acts as a thermal buffer, stabilizing the useful energy baseload even when ambient temperatures drop below 5 °C.
Heat loss through the cover (QC, light blue basal segment) represents a secondary but non-negligible fraction of the total demand. Despite the use of a simplified instantaneous response model [Equation (4)] due to the low thermal mass of the polyethylene, the results indicate that the radiative and convective losses are effectively mitigated during the warmer months. However, in winter, the divergence between the internal operational temperature and the dynamic Sol-Air Temperature increases the driving force for heat transfer, necessitating a continuous thermal input.
The total useful energy demand peaks at approximately 8200 kWh month−1 in December, in sharp contrast to the summer minimum. This disparity underscores the significant thermodynamic burden imposed by the heating system during the cold season, necessitating further assessment of the net energy balance to determine whether the biological gain justifies this intensive thermal investment.
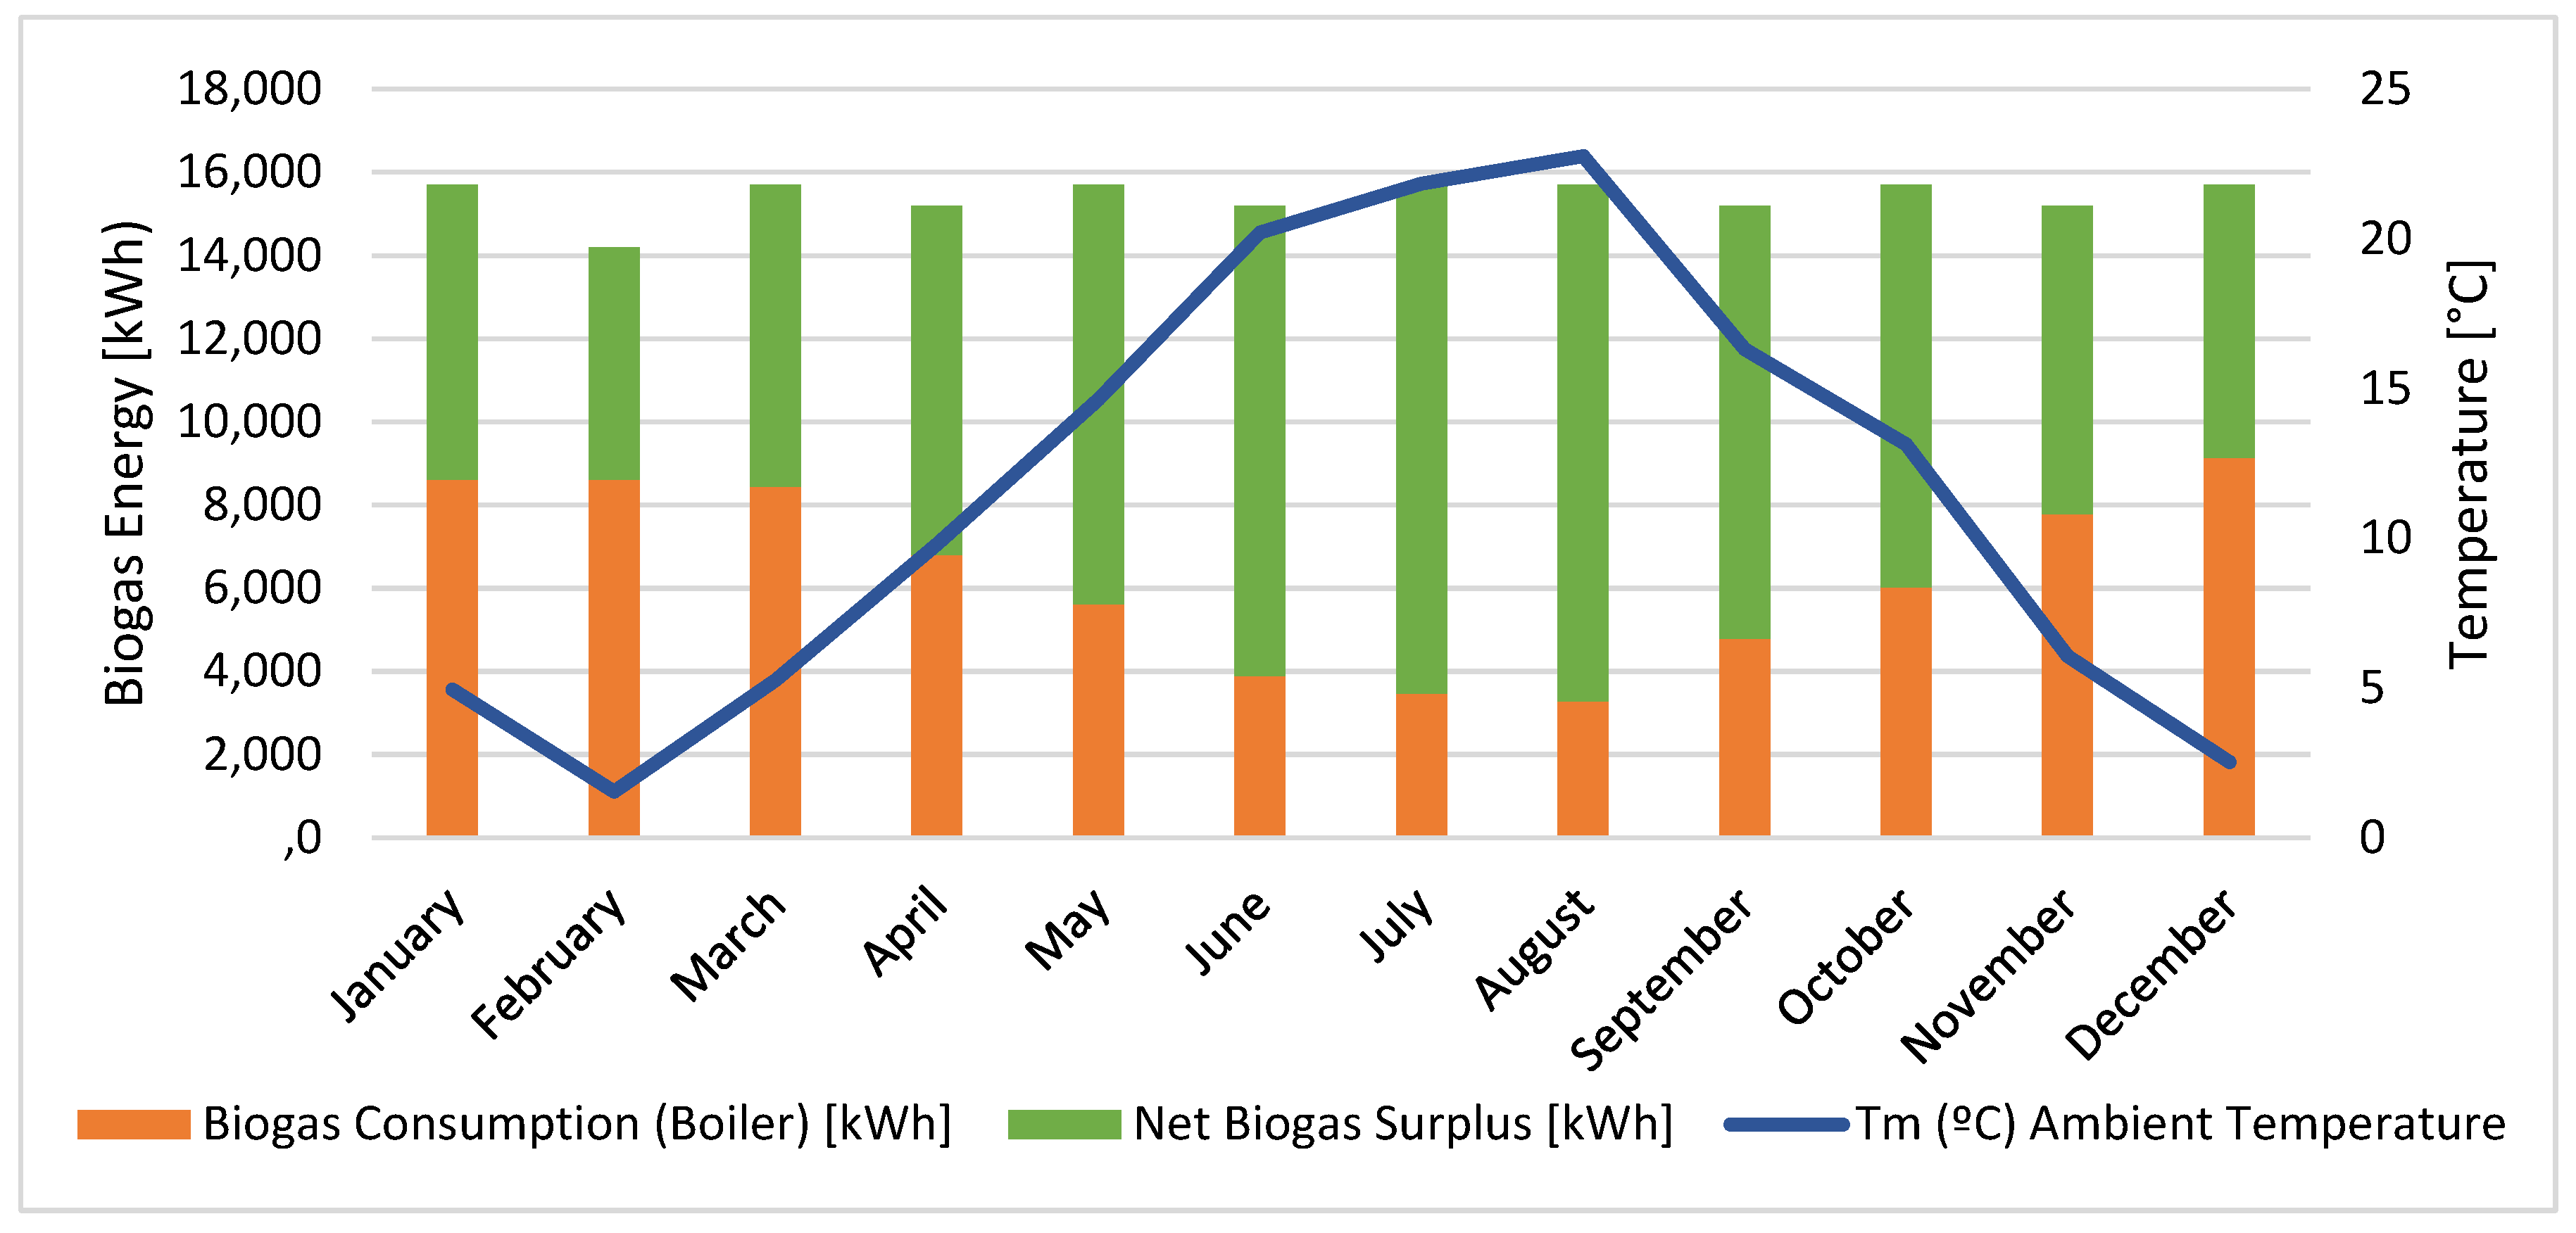
To rigorously assess the energetic viability of the mesophilic operational strategy (35 °C), the gross energy potential of the produced biogas was compared with the process thermal demand. Figure 3 illustrates the monthly energy balance, stratifying the total energy output into the fraction consumed for reactor heating (orange segment) and the net surplus available for downstream valorization (green segment), overlaid with the ambient temperature profile (Tm).
The analysis confirms that the biorefinery achieves complete thermal autonomy year-round, validating the decision to operate in the mesophilic range rather than the psychrophilic regime. However, the system exhibits a pronounced seasonal dichotomy. During the critical winter period (from December to February), the thermal duty imposes a substantial energy penalty owing to the maximized gradient between the ambient intake and reactor setpoint. As shown in Figure 3, the boiler consumption peaks in December, absorbing approximately 58% of the gross energy production. Crucially, despite this high demand, the Net Energy Balance remains positive, demonstrating that the metabolic enhancement driven by the controlled temperature generates sufficient energy to sustain the process thermodynamics with a safety margin.
Conversely, the summer season (June–September) demonstrates the optimal thermodynamic performance of the system. As Tm increases, the conductive losses and substrate heating requirements diminish drastically, causing the Thermal Self-Consumption Ratio to drop below 25%. Consequently, the net biogas surplus is maximized during this period, ensuring a robust and continuous feedstock supply (>10,000 kWh month−1) for the upgrading unit.
Although the persistence of the surplus throughout the annual cycle confirms the robustness of the design, the contraction of available energy in winter highlights a specific opportunity for intensification. To flatten the seasonal curve observed in Figure 3, the implementation of a heat exchanger to recover energy from the effluent digestate (Stream 24) to preheat the influent (Stream 4) is proposed. This strategy would effectively decouple the hydraulic loading rate from the heating demand, minimizing the “orange” burden and maximizing the biomethane yield during the coldest months.
2.
Scenario II:
To validate the thermal insulation parameters and efficiency of the underfloor heating system, a specific thermodynamic stress test was conducted within the Scenario II framework. Although Scenario II operates passively, the boiler was temporarily activated to evaluate the reactor’s thermal response.
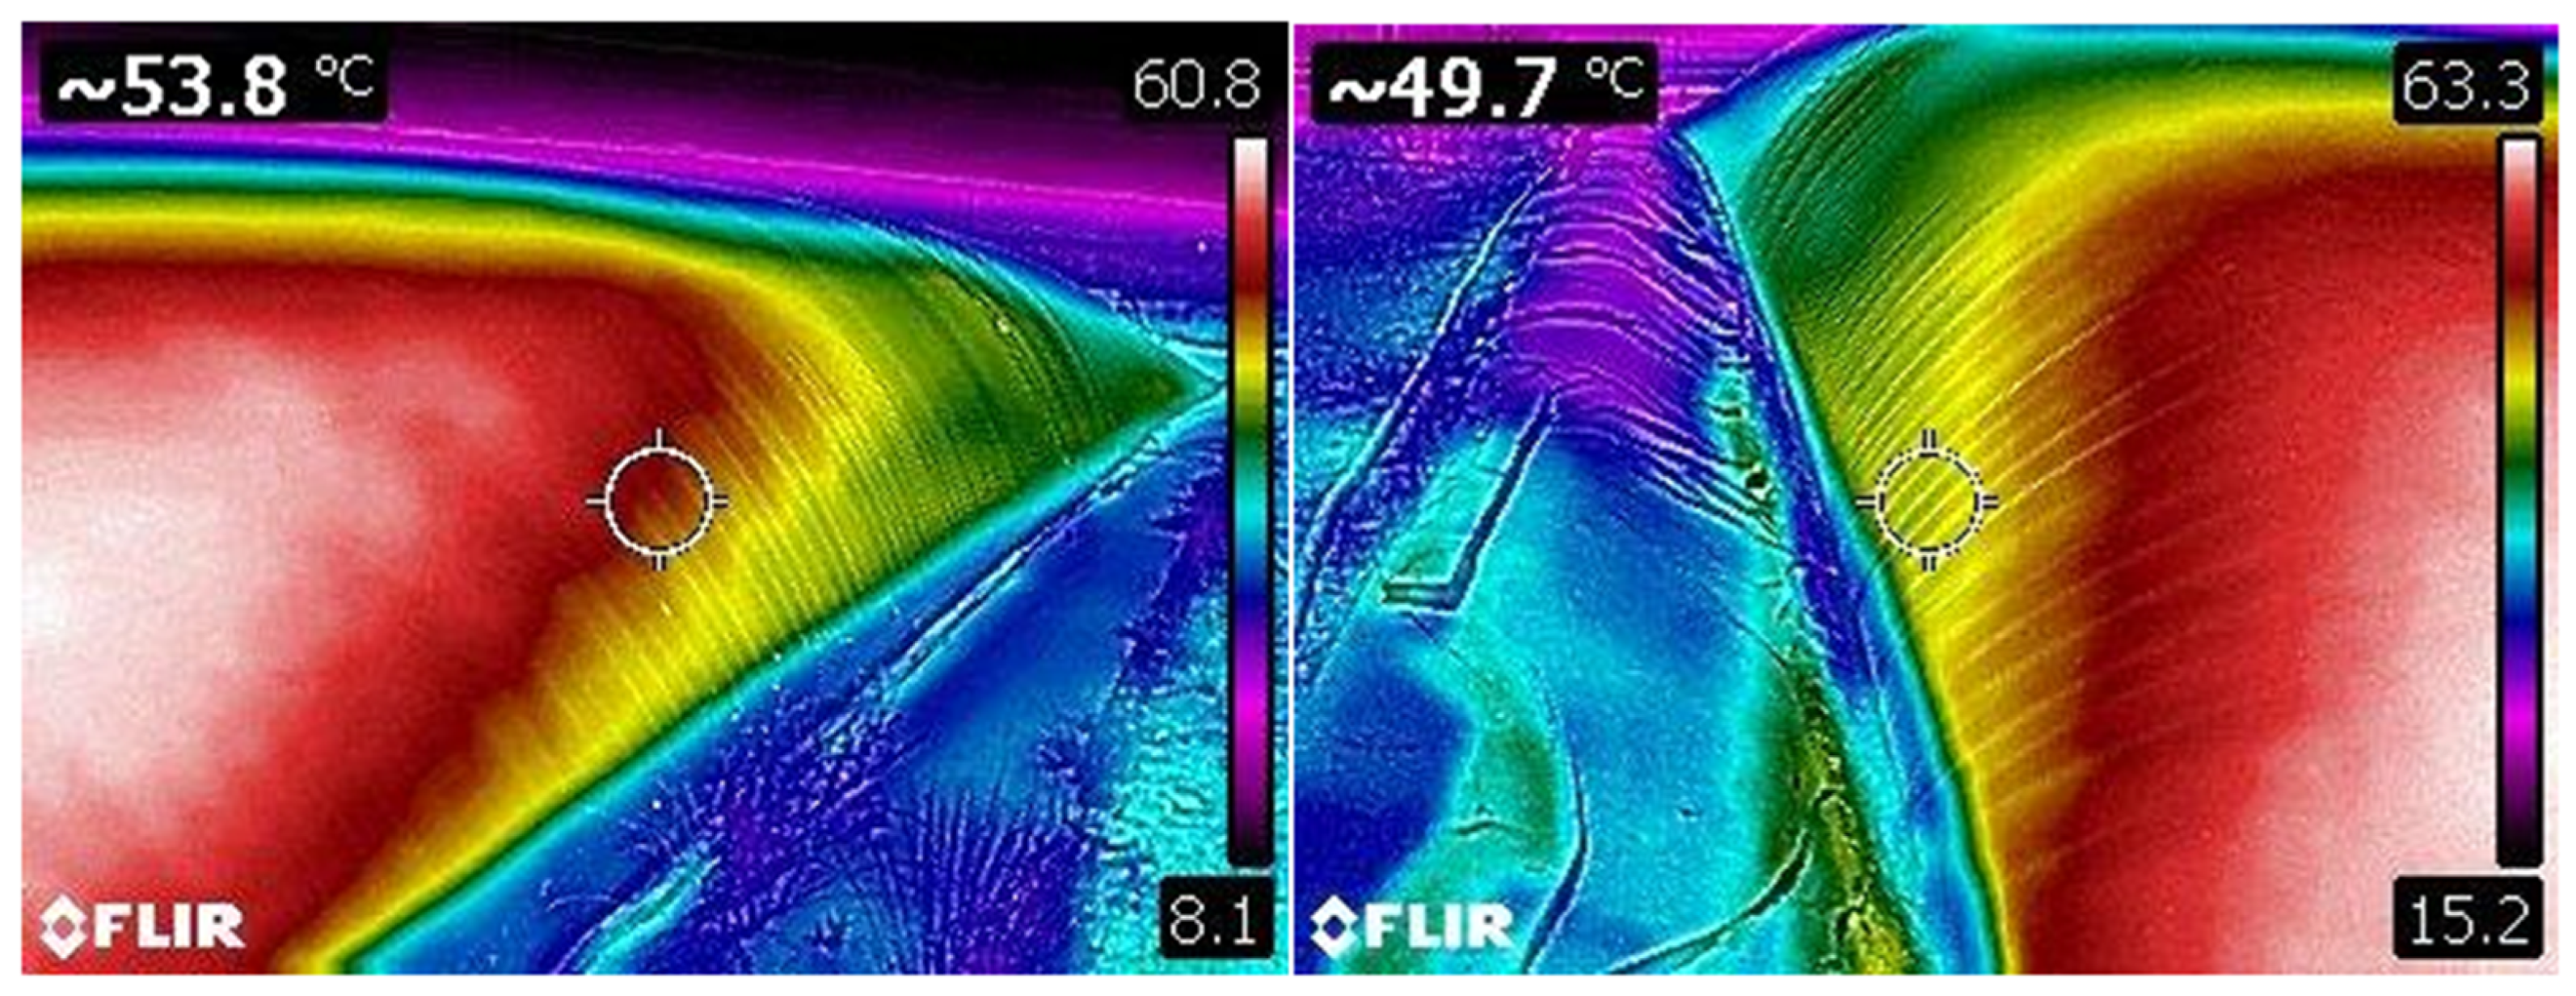
As evidenced in the pilot plant records, the digestate temperature exhibited a clear upward trend when the underfloor heating system was engaged, confirming effective heat transfer from the radiant floor to the biomass. A detailed thermographic analysis (Figure 4) maps the resulting temperature gradients. The imaging reveals that the upper reactor zones maintained high thermal stability (spot temperatures of 49.7–53.8 °C and peaks up to 63.3 °C), confirming that the gas headspace acts as an effective secondary insulating layer. Conversely, the lower peripheral areas exhibited a sharp temperature drop (reaching minimums of 8.1–15.2 °C). This thermal stratification is driven by the physical properties of the phases; the liquid digestate in the lower section has higher thermal conductivity, transferring heat more rapidly to the boundaries compared to the insulating gas phase above. This demonstrates significantly higher heat losses through the buried surfaces acting as heat sinks.
This experimental evidence confirms that the pilot plant has the necessary thermal inertia to transition into a mesophilic regime, even though the psychrophilic operation is maintained as the primary efficiency strategy due to Soria’s environmental constraints.

3.2.2. Photovoltaic Energy Production and Model Validation

The renewable energy strategy is evaluated by comparing the modelled solar potential (Scenario I) with the actual generation recorded (Scenario II) at the Soria pilot plant. This analysis focuses on the system’s production capacity to validate the reliability of TMY-based (Typical Meteorological Year) simulations for decentralized biorefineries.
3.
Scenario I: Modelled Solar Potential
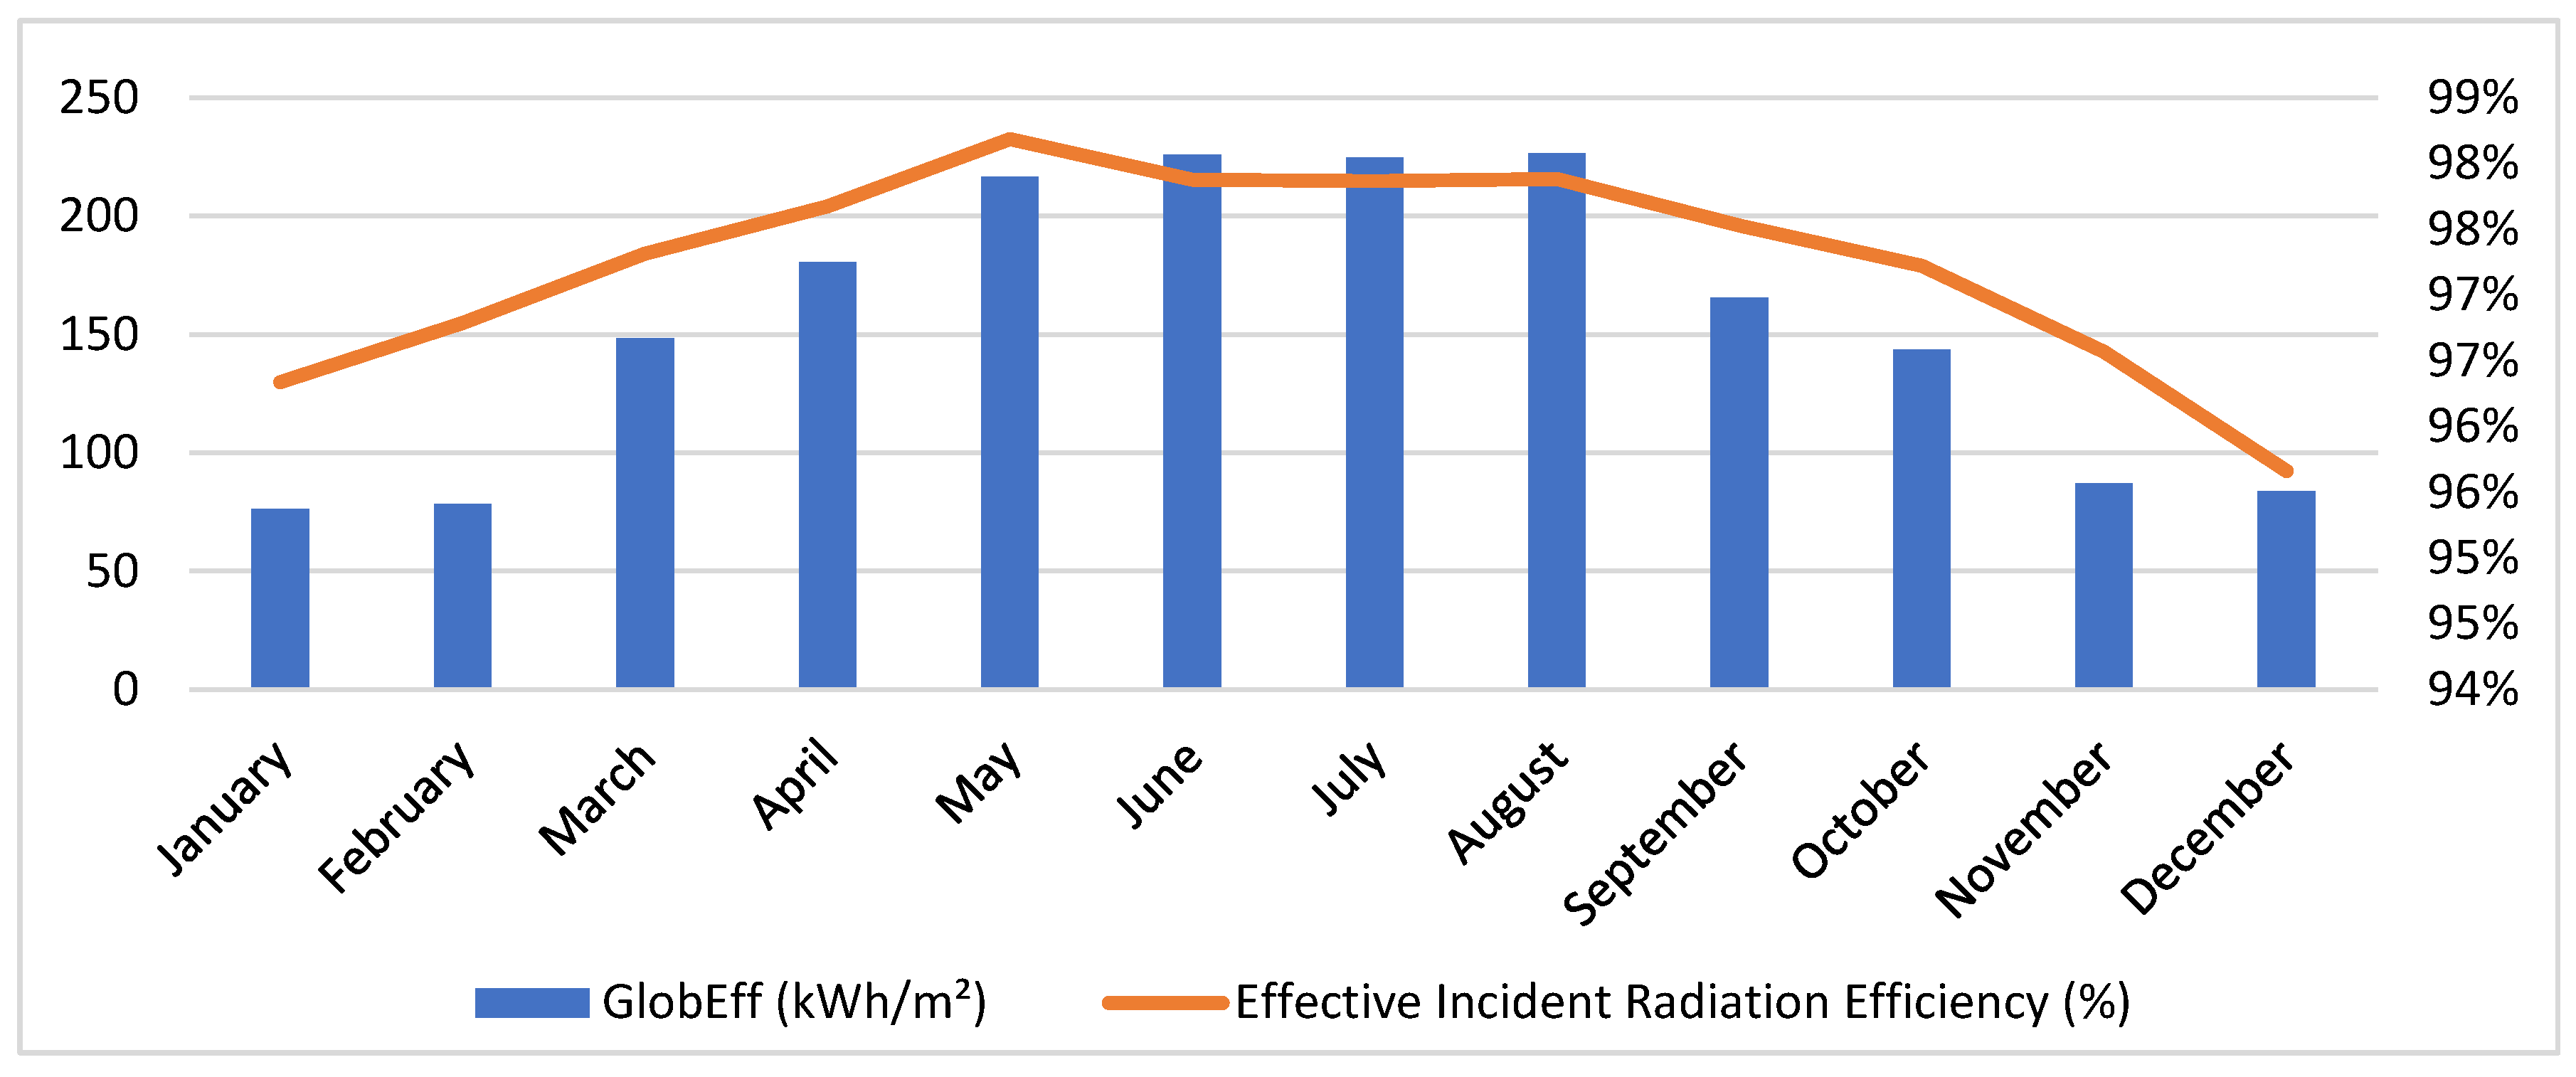
The assessment of the photovoltaic (PV) generator reveals a distinct seasonal irradiance profile dictated by the annual solar declination cycle, with the peak effective radiation occurring during the summer solstice period (Figure 5). The system demonstrates high optical efficiency (Effective Incident Radiation Efficiency > 95%), indicating minimal losses arising from shading or incidence angle modifiers.
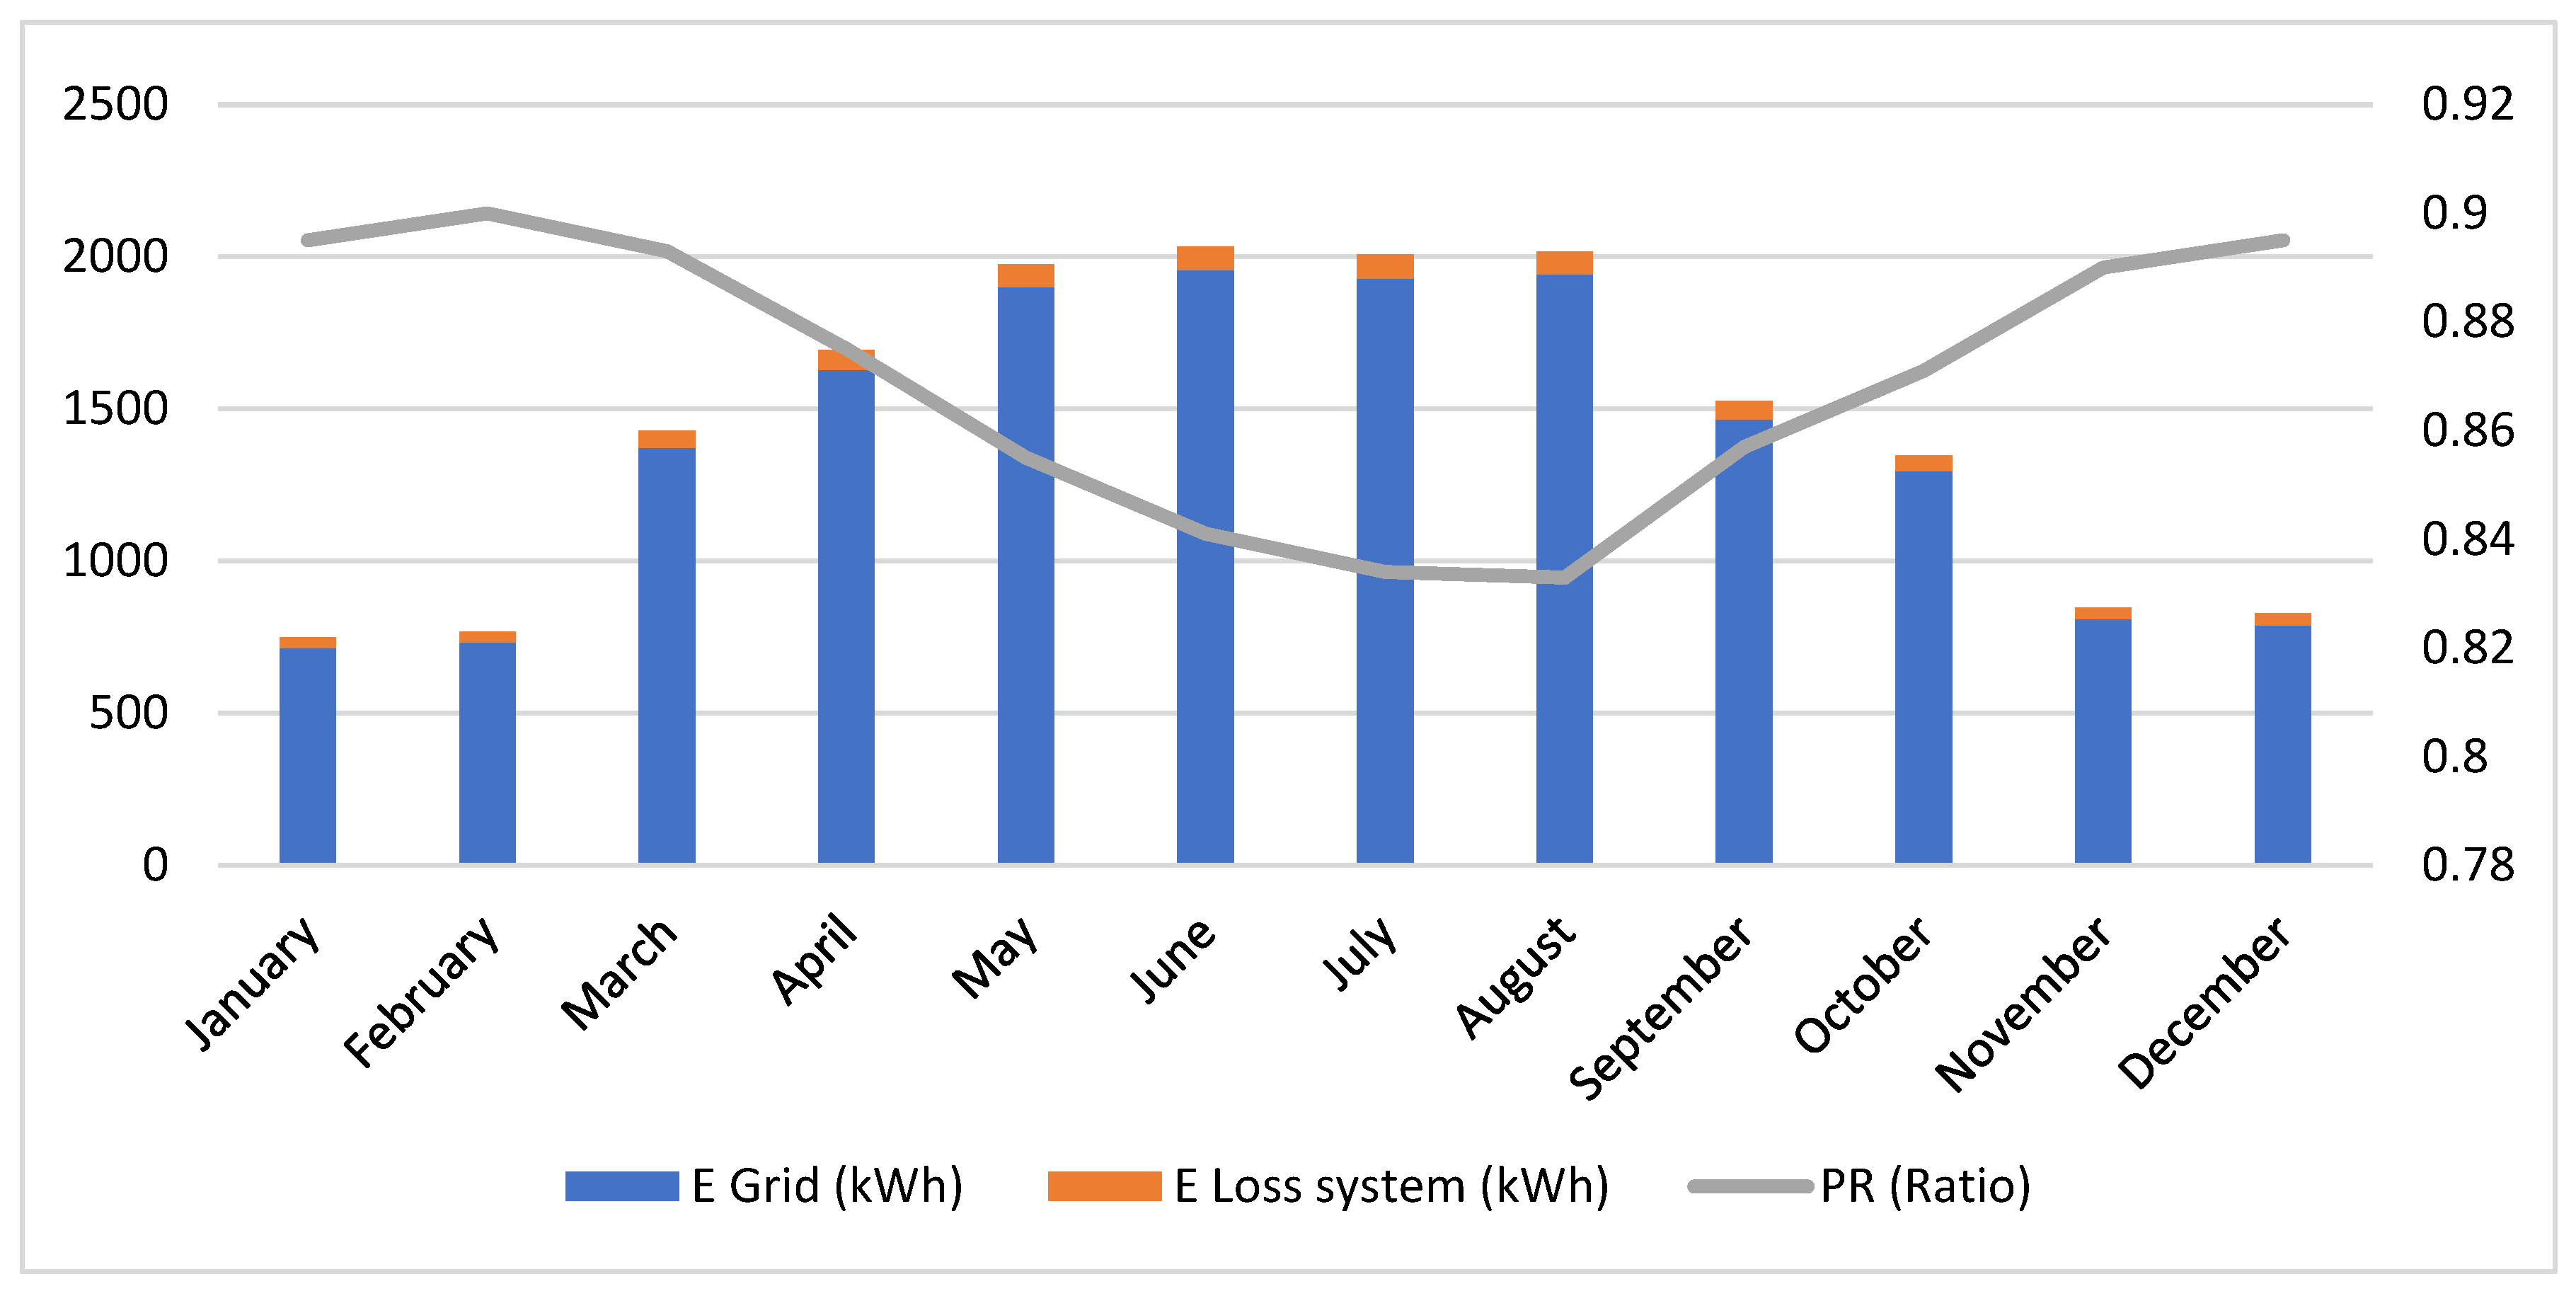
In terms of energy yield, the specific production peaked at 6.5 kWh·kWp−1·day−1 in June, averaging 4.5 kWh·kWp−1·day−1 annually (Figure 6). A critical analysis of the Performance Ratio (PR), which averaged 0.861, highlights an inverse correlation with ambient temperature. While the PR reached 0.90 during cooler months, it declined to 0.83 during the peak summer. This behavior is consistent with the thermal derating of crystalline silicon cells, where elevated operating temperatures reduce conversion efficiency despite higher solar availability. Finally, electrical losses (DC/AC conversion and cabling) remained consistently low (1–3%), confirming the robustness of the electrical sizing.
4.
Scenario II: Real PV energy generation
During the collection of solar irradiance data (from July 2023 to June 2024), the 10 kWp photovoltaic array demonstrated high operational reliability. The monthly generation followed the expected solar cycle, with peak values recorded in July, as shown in Figure S2B (1670 kWh). Interestingly, real-world operation prioritized equipment usage during peak irradiation hours, specifically for the digestor feeding pumps, microalgae raceway, and biomethane compressor, to maximize direct self-consumption and minimize grid reliance.

3.2.3. Electric Consumption

  • Scenario I: Theoretical equipment power demand
The total electrical energy consumption of the pilot plant was determined to be 55.10 kWh·day−1. The distribution of the energy demand across the functional units reveals distinct operational hotspots (Table 3, Section 2.4.4). The breakdown indicates that gas handling units (blowers and refuelling unit) account for approximately 34% of the total load, while liquid handling (pumping systems) represents the largest share at roughly 46%, with the remainder attributed to agitation and control systems.
Specifically, the biomethane compressor and the digester recirculation pump were identified as the most energy-intensive components, accounting for 10.50 kWh·day−1 (19.1%) and 7.60 kWh day−1 (13.8%), respectively. The high consumption of the compressor is attributed to the thermodynamic work required to reach the storage pressure (250 bar), compounded by the discontinuous start-stop cycles described in the Energy Assessment Section. Conversely, the load on the recirculation pump underscores the impact of the digestate’s rheological properties. The high viscosity and solids content of the anaerobic sludge necessitate higher torque and power input compared to water-based streams, a phenomenon consistent with non-Newtonian fluid behavior in anaerobic digesters [56,57].
Notably, the raceway agitation (paddle wheel) accounts for 13.1% of the daily demand. Although it operates continuously (24 h), its specific power density remains low (0.25 W·m−2), confirming the energy efficiency of paddle wheels for low-head hydraulic mixing compared to alternative aeration or mixing methods.
To assess process efficiency, the Specific Energy Consumption was calculated relative to the net biomethane production. Considering a daily biogas production of 77.95 Nm3·d−1 with an average methane content of 58.85 vol% (wet basis), the system exhibited an electrical demand of 1.20 kWh·m−3 of CH4 produced.
This energy intensity aligns closely with that of full-scale industrial anaerobic digestion plants coupled with upgrading systems, which typically report total consumption values ranging between 0.6 and 1.2 kWh·m−3 CH4 depending on the technology used [58,59]. The fact that this pilot unit achieves a SEC at the upper end of the industrial range, despite the scale-down effects where diffusive loads (e.g., control systems, SCADA) have higher proportional impacts, highlights the efficiency of the implemented continuous feeding strategy and low-energy agitation system.
2.
Scenario II: Experimental consumption
Contrary to the theoretical projections, the experimental performance in Scenario II demonstrated that the actual electricity consumption averaged 42 kWh·day−1 (Table 4). Significantly lower values, in the range of 11–13 kWh·day−1, were observed as isolated exceptions. These temporary drops are attributed to the intermittent operation of the electromechanical equipment, which momentarily avoided the accumulation of loads, as assumed in the steady-state model.
A pivotal factor in this performance was the implementation of a solar-synchronized scheduling strategy. Most electrical units were preferentially operated during the central hours of the day to align the energy demand with the peak on-site photovoltaic generation. However, during peak summer irradiance, the upgrading operation was restricted to prevent photosynthetic oxygen production from exceeding the 1 vol% limit required for automotive fuel. This strategic load shifting directly reduced the daily duty cycles of energy-intensive tasks, including the feeding pumps for both the anaerobic digester and microalgae raceway, biomethane upgrading line, high-pressure biomethane compression system, and microalgae harvesting process within the sedimentation unit.
The determination of the SEC for Scenario II reveals the operational efficiency under these optimized intermittent conditions. Based on an average monthly biomethane production of 302 Nm3, equivalent to a daily output of 10.07 Nm3·day−1 of CH4, the system exhibited an electrical demand of 4.17 kWh·m−3 of CH4 produced.

3.2.4. Global Energy Balance and System Sustainability

The integration of electrical and thermal energy flows provides a holistic view of the pilot plant’s energy profile by contrasting the Theoretical Mesophilic Design (Scenario I) with the Experimental Psychrophilic Operation (Scenario II).
  • Scenario I: Integrated Energy Model and Net Surplus
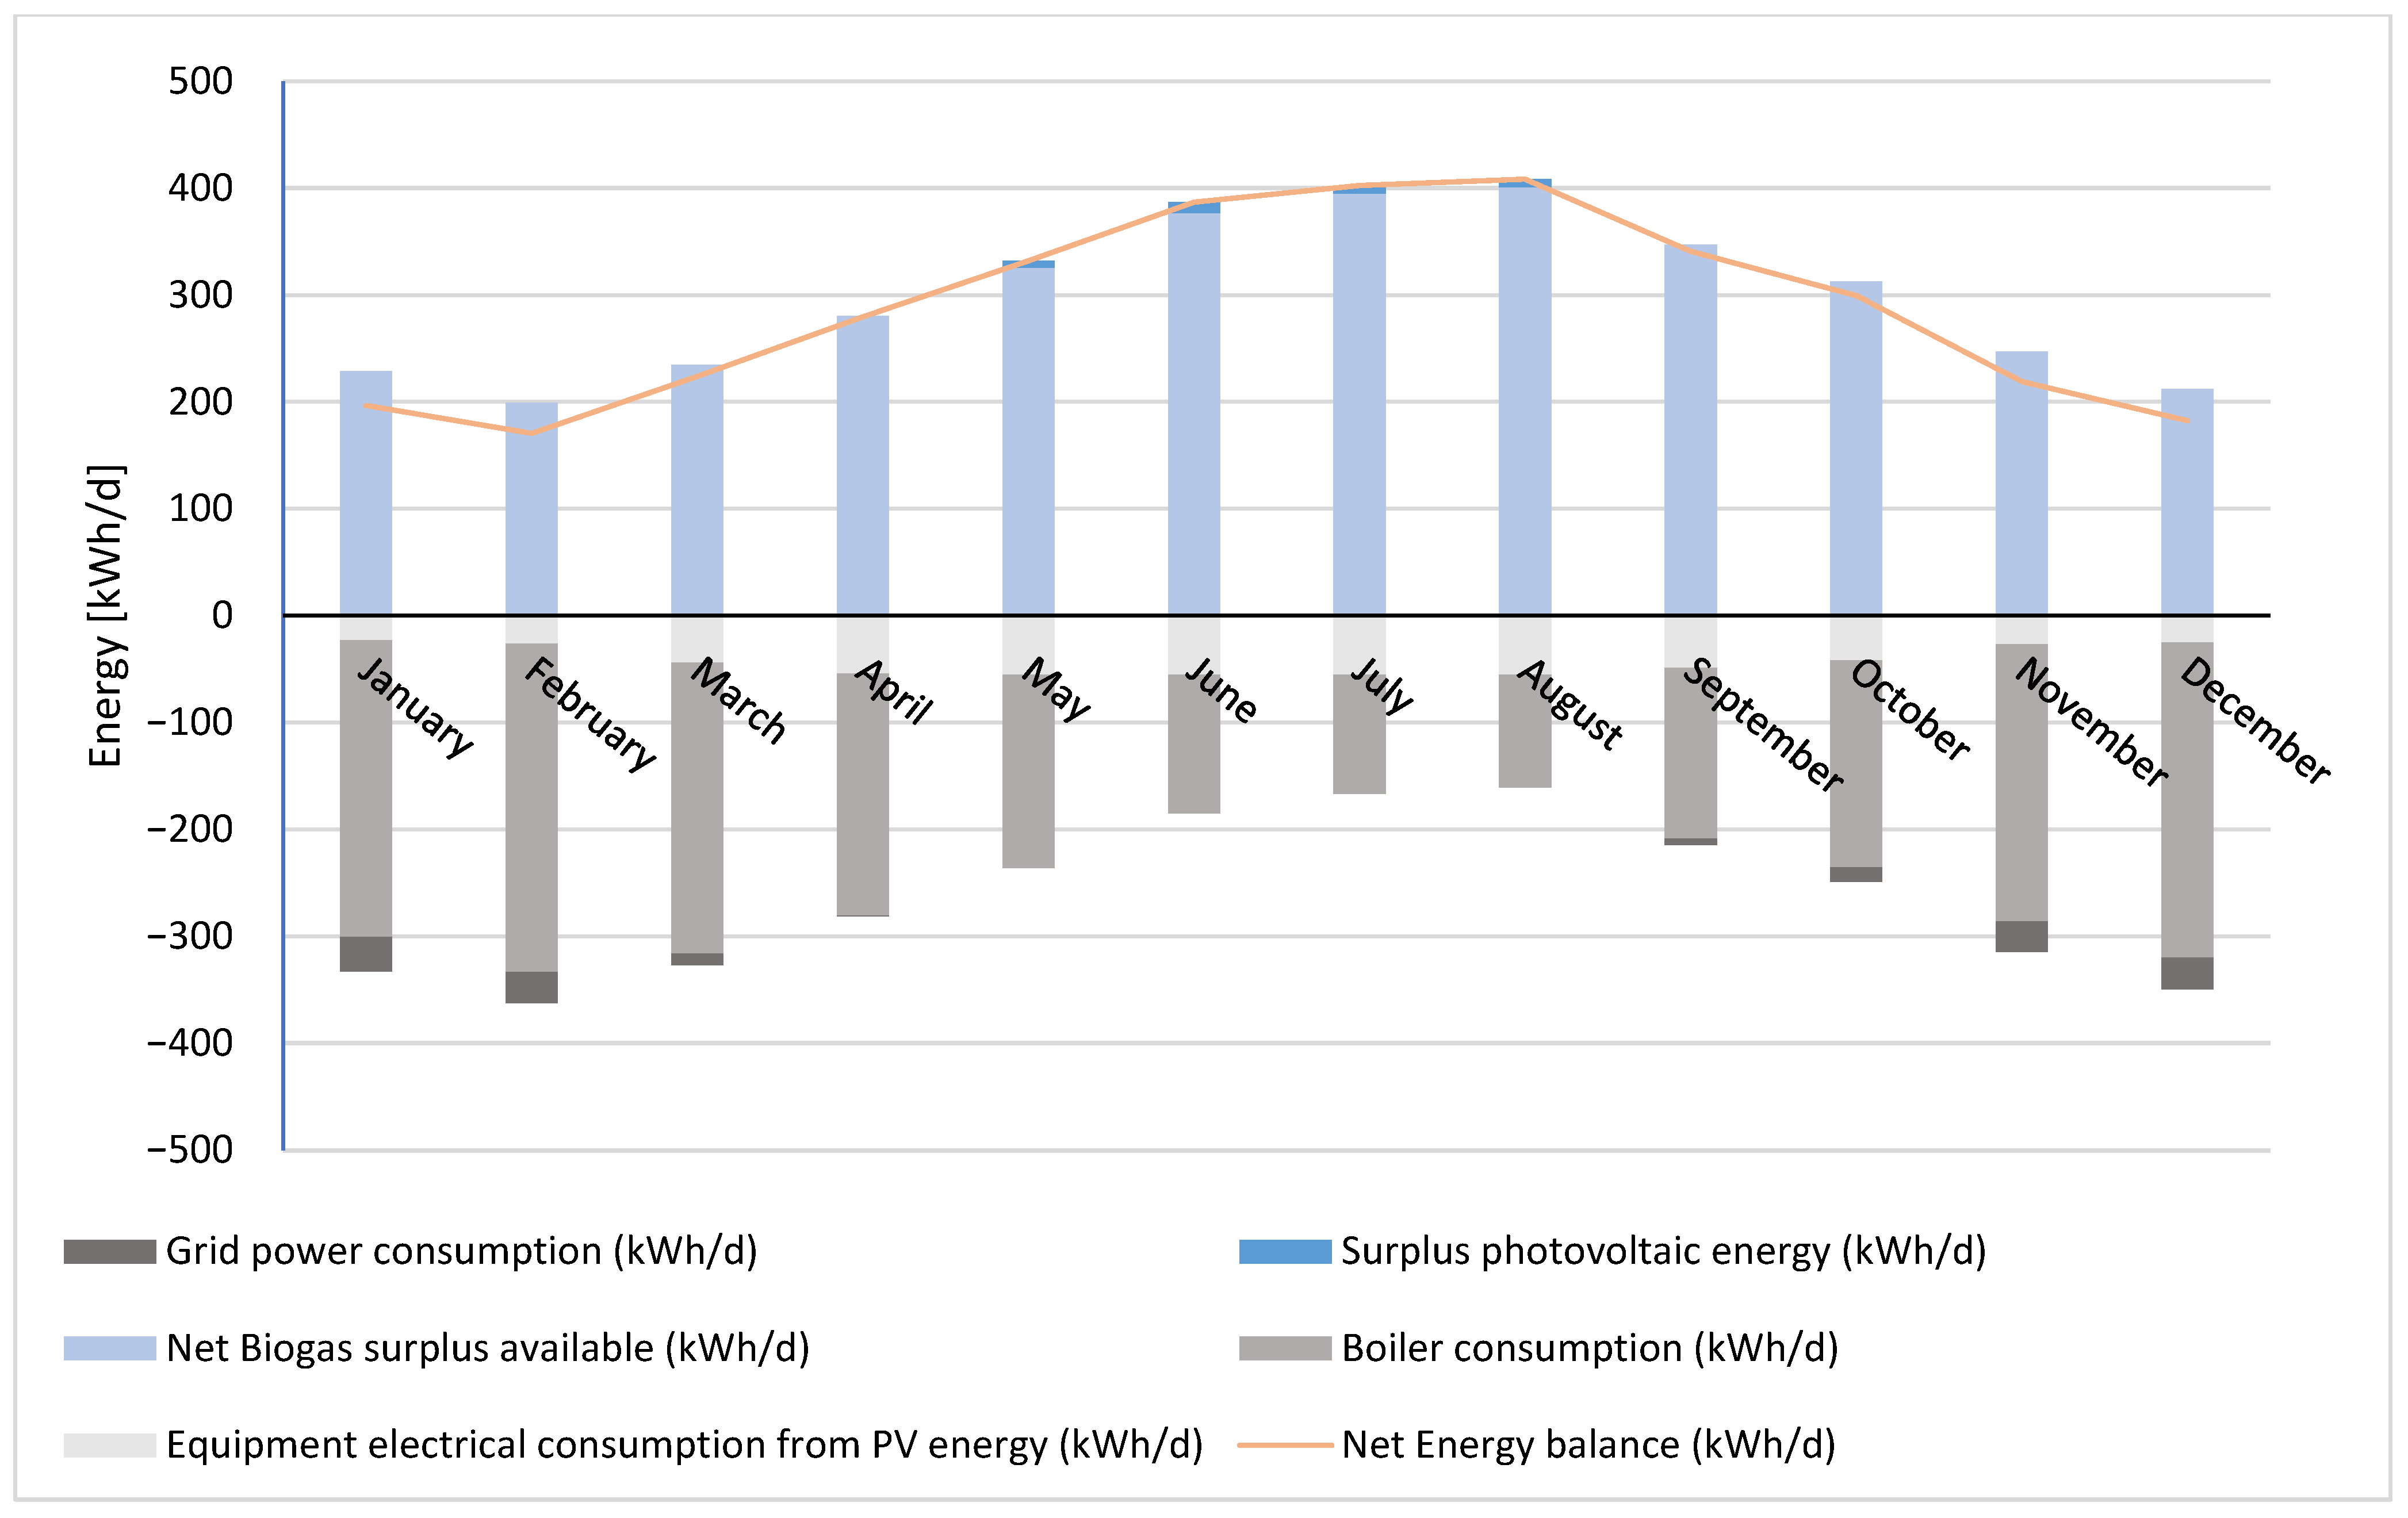
The seasonal evolution of the global energy balance for Scenario I is shown in Figure 7. Specifically, the analysis demonstrates that the gross biogas potential equates to the sum of the thermal demand consumed by the boiler (gray bars) and the net biogas surplus available (light blue bars). The bars represent the individual energy vectors (biogas potential, PV generation, and consumption loads), whereas the orange line illustrates the resulting Net Energy Balance, confirming a positive energy surplus throughout the annual cycle.
The thermal demand for the digester (gray bars) peaks in winter because of low ambient temperatures, which requires significant energy input. However, the energy content of the net biogas surplus generated (light blue bars) consistently exceeds these requirements. Electrically, the system shifts from a grid-dependent state in winter to a self-sufficient, net-exporting state in summer (May to August), driven by a high photovoltaic yield (dark blue bars).
The overall system performance is summarized by the Net Energy Balance trend line (orange line). This indicator remains positive throughout the entire annual cycle, ranging from a minimum of 170 kWh·day−1 in February to a peak of 408 kWh·day−1 in August.
Notably, even during the coldest months, when grid imports are necessary (dark gray bars), the surplus energy potential of the produced biomethane adequately compensates for the electrical deficit. This confirms that the facility operates as a net energy-positive system year-round, thereby validating the technical feasibility of the proposed energy-neutral operational strategy.
2.
Comparative assessment: Theoretical Mesophilic vs. Operational Psychrophilic scenarios
The global sustainability of the biorefinery is assessed by comparing the Mesophilic Design (Scenario I), optimized for maximum biological throughput, with the Experimental Psychrophilic Baseline (Scenario II), driven by operational resilience in the Soria climate. Although the global energy balance in Figure 7 assumes a 35 °C setpoint to maximize biogas yields, the experimental campaign was operated at an average ambient temperature of 12 °C without active thermal input. This allows for a critical evaluation of the flexibility of the system (Table 5).
In the theoretical mesophilic scenario, the thermal demand of the digester represents the largest energy sink (up to 300 kWh·day−1 in winter). However, the theoretical biogas production is sufficient to cover this load, maintaining a positive net balance.
In contrast, the experimental results reveal that the thermal penalty is completely bypassed when operating under a psychrophilic regime without active heating. Although this temperature range limits degradation kinetics, the 33% VS removal measured via macroscopic evaluation was sufficient to sustain a positive Net Energy Balance. Further research is required to determine the specific hydrolysis constants and biochemical pathways omitted in this foundational assessment. The energy content of the generated biogas, even at reduced volumes (e.g., 27–723 m3·month−1 depending on seasonality), combined with 100% solar self-sufficiency, effectively offsets all parasitic electrical loads.
This thermal performance is complemented by the utilization of solar resources, where Scenario I projects a specific production potential of 4.5 kWh·kWp−1 day−1 with a Performance Ratio (PR) of 0.86. The theoretical model predicts an efficiency drop in summer due to the thermal derating of crystalline silicon cells, a phenomenon corroborated experimentally in Scenario II. The actual generation recorded during the campaign showed a 90% correlation with the model, with a deviation of only 10% in peak months, such as July, attributable to inter-annual meteorological variability compared to that in the TMY databases. Nevertheless, the 10 kWp photovoltaic array was sufficient to cover the plant’s entire electrical demand throughout all operational months.
This total electrical self-sufficiency in Scenario II resulted from an optimized load-management strategy compared to the constant demand model of Scenario I. While the theoretical design assumes a consumption of 55.10 kWh·day−1, the operational reality of the prototype averaged 42 kWh·day−1. This notable reduction was achieved through the intermittent operation of electromechanical equipment, thereby avoiding the accumulation of parasitic loads. A decisive factor was solar synchronization: the SCADA system prioritized energy-intensive tasks, such as slurry pumping, biogas upgrading, CNG compression to 250 bar, and microalgae harvesting, during peak irradiance hours. This strategy allowed the system to completely decouple from the electrical grid, even though the actual SEC was significantly higher than the theoretical target (4.17 vs. 1.20 kWh·m−3 CH4) due to scale effects and reduced psychrophilic kinetics.
Finally, the integration of all energy flows confirms the feasibility of the LIFE SMART AgroMobility model. Scenario I demonstrates a high-production system with surpluses of 170 and 408 kWh·day−1, where biomethane compensates for any winter electrical deficit. Scenario II demonstrates the evolution of the system into a highly autonomous grid-independent configuration. In both cases, the positive net balance and the capacity for biological CO2 sequestration validate the transition toward a decentralized rural circular economy, operating as energy-neutral modules.

4. Discussion

The Specific Energy Consumption (SEC) of 1.20 kWh·m−3 of biomethane in Scenario I aligns with high-efficiency industrial standards of 0.5–1.5 kWh·m−3 [55]. This industrial-level efficiency at the pilot scale is largely attributed to the continuous feeding strategy, which mitigates power spikes and high-efficiency paddle wheel agitation. Operating at a low specific power density of 0.25 W m−2, this configuration suggests significant energetic advantages for open raceway geometries compared with traditional submersible propellers; however, further comparative studies are required to quantify this superiority.
The transition to the psychrophilic regime (Scenario II) caused the SEC to increase by a factor of 3.47 (to 4.17 kWh·m−3). Although methane production was stable, the biological yields were significantly lower than the mesophilic potential. However, the economic analysis confirms that the mesophilic strategy is the most robust model for green mobility. At a retail price of 1.25 € per Nm3, Scenario I generates an annual revenue of 13,596 €, compared with 4530 € in Scenario II. Even considering a realistic CAPEX for a specialized boiler system (approx. €30,000 for this scale), the additional revenue of 9066 € per year ensures a favorable Internal Rate of Return (IRR) for decentralized units prioritizing high-yield throughput.
The divergence between theoretical thermal demand and the actual zero-heating operation in Scenario II highlights a critical trade-off. Although mesophilic digestion (35 °C) is kinetically superior, it imposes a thermal liability that can consume 30–50% of the energy output in cold climates. The experimental results confirm that the plant could sustain biological activity without external heating, relying on a “passive thermal strategy” (insulation and seasonal variation). Although this resulted in a lower VS removal (33%), the Energy Return on Investment (EROI) remained favorable because the energy input for heating was eliminated. For small-scale agricultural applications, where operational simplicity is paramount, this passive model reduces the capital costs and maintenance complexity associated with active heating loops.
The solar-synchronized strategy successfully reduced daily grid electricity consumption by 24% (from 55.10 to 42 kWh·day−1), with sporadic drops to the 11–13 kWh·day−1 range). The biological drop (slow but steady [60]) in methane production during winter months was more pronounced. Achieving 100% electrical self-sufficiency confirms that operational synchronization, matching peak mechanical loads with peak solar production, is a more critical parameter for decentralized autonomy than absolute specific efficiency. Despite this, liquid handling remained the dominant consumer (approximately 47% of the load). The non-Newtonian pseudoplastic behavior of the digestate (high TS content) necessitates a higher starting torque and power compared to water-based fluids, identifying positive displacement pumps as a priority for future hydraulic optimizations.
The pilot plant leverages a high annual solar irradiation of GlobEff = 1904.7 kWh·m−2, as corroborated by the PVGIS-TMY database. The system demonstrates high photovoltaic efficiency with a favorable Performance Ratio (PR). Although photovoltaic (PV) energy is an excellent strategy for reducing daytime OPEX, the energy density of the produced biogas provides the necessary “Net Energy Positive” status during winter months. This complementarity supports the deployment of hybrid bio-solar plants as decentralized energy hubs, capable of decoupling waste treatment from fossil-fuel dependency and transforming rural residues into a reliable vector for green mobility.

5. Conclusions

This study confirms the technical viability of operating a pilot-scale anaerobic digestion plant as a net-energy-positive system, successfully overcoming the energy inefficiencies typically associated with downscaled experimental units. The assessment of the Specific Energy Consumption (SEC) demonstrated that this facility can achieve efficiency levels of 1.20 kWh·m−3, which are comparable to full-scale industrial standards, despite the expected increase to 4.17 kWh·m−3 during psychrophilic operation (Scenario II).
This research provides three major technical insights. First, the microalgae-based symbiotic system demonstrated high efficiency for low-energy upgrading, achieving biomethane purities up to 93.27 vol% (dry basis). Remarkably, peak performance was reached with a gas–liquid contact time of only 10 min, proving that decentralized upgrading units can be significantly more compact than those documented in the current literature. Second, rigorous modelling revealed that maintaining mesophilic conditions (35 °C) in cold climates imposes a substantial thermal liability, potentially consuming over 50% of the gross energy production during winter. Third, while a “passive thermal strategy” (psychrophilic operation at 12 °C) offers a superior Energy Return on Investment (achieving an EROI of 2.35 compared to 1.44 under mesophilic winter conditions) by eliminating heating loads, it results in a marked reduction in biological throughput. Consequently, the mesophilic regime remains the most robust model for maximizing biomethane production and ensuring project feasibility, as the higher kinetic yields effectively justify the requirement for active thermal management.
The integration of photovoltaic (PV) generation, supported by a high annual irradiation of 1904.7 kWh·m−2, is essential for enhancing energy autonomy. Although certain electromechanical components require continuous operation, the implementation of a solar-synchronized strategy and scheduling of energy-intensive tasks, such as high-pressure compression (250 bar), during peak irradiance hours allowed the plant to significantly reduce its grid dependency.
Based on the operational insights from this study, the optimal running mode for this biomethane plant provides a clear trajectory toward carbon neutrality and low-emission operation. This is achieved through a dual strategy. First, by implementing the solar-synchronized intermittent scheduling (Scenario II), the plant drastically minimizes the indirect carbon footprint associated with grid electricity consumption. Second, the biological upgrading stage actively functions as a dual-phase carbon sink, sequestering approximately 3.70 kg·h−1 of biogenic CO2 into valuable microalgal biomass. Together, this solar-driven, biogenically sequestering operational mode offers a highly sustainable blueprint for transitioning standard biogas facilities into near-zero.
Ultimately, these findings validate the scalability of the proposed operational strategy. They demonstrate that decentralized, small-scale biomethane plants can operate as reliable, carbon-negative modules within the circular economy framework. This model transforms rural organic waste into high-quality fuel for green mobility, providing a sustainable solution for energy security and waste management in isolated agricultural communities.

Supplementary Materials

The following supporting information can be downloaded at https://www.mdpi.com/article/10.3390/en19061541/s1, Figure S1: Process Flow Diagram LIFE SMART AgroMobility; Table S1A. Detailed Mass and Energy Balance Inventory: Gas streams (thermodynamic properties, volumetric flows, and compositions in vol% wet basis). Table S1B. Detailed Mass and Energy Balance Inventory: Liquid and solid streams (thermodynamic properties, mass flows, and compositions in wt% wet basis) [61,62,63]. Figure S2 Seasonal performance of the pilot plant under psychrophilic operation (Scenario II) during a full-year continuous monitoring campaign (July 2023–June 2024). (A) Monthly biogas and biomethane production profiles (bars) correlated with the average ambient temperature (line). (B) Monthly photovoltaic energy generation from the 10 kWp on-site array.

Author Contributions

Conceptualization, methodology, investigation and writing—original draft preparation, M.d.C.S.R.; validation, resources, writing—review and editing, M.-P.M.-H.; validation, resources, D.B.; validation, resources, M.F.O.; resources, methodology and supervision, P.M.; methodology, writing—review and editing, supervision, M.-J.G.-M. All authors have read and agreed to the published version of the manuscript.

Funding

This research was funded by the LIFE Programme of the European Union, grant number LIFE19 CCM/ES/001206 (LIFE SMART AgroMobility).

Data Availability Statement

The data presented in this study are available upon request from the corresponding authors.

Acknowledgments

The authors wish to dedicate this work to the memory of Bernardo Llamas, director of the LIFE SMART AgroMobility project. His leadership and involvement in the development of the project were fundamental to its success and, thus, the publication of this article.

Conflicts of Interest

The authors declare no conflicts of interest.

Abbreviations

The following abbreviations are used in this manuscript:
ADAnaerobic Digestion
AEMETState Meteorological Agency (Agencia Estatal de Meteorología)
APIApplication Programming Interface
A.s.l.Above sea level
ATEXAtmosphères Explosibles (Explosive Atmospheres)
CAPEXCapital Expenditure
CNGCompressed Natural Gas
DC/ACDirect Current/Alternating Current
DWDry Weight
EROIEnergy Return on Investment
FLIRForward Looking Infrared
FWFresh Weight
GHGGreenhouse Gas
HRTHydraulic Retention Time
IRRInternal Rate of Return
KPIsKey Performance Indicators
L/GLiquid-to-Gas ratio
LCILife Cycle Inventory
LDPELow-Density Polyethylene
LHVLower Heating Value
MEBMass and Energy Balance
NEBNet Energy Balance
OPEXOperational Expenditure
PBRPhotobioreactor (referenced as Raceway)
PRPerformance Ratio
PSAPressure Swing Adsorption
PSHPeak Sun Hours
PVPhotovoltaic
PVGISPhotovoltaic Geographical Information System
RPRRaceway Pond Reactor
SCADASupervisory Control and Data Acquisition
SECSpecific Energy Consumption
TMYTypical Meteorological Year
TRLTechnology Readiness Level
TSTotal Solids
TVSTotal Volatile Solids
VOCsVolatile Organic Compounds
VSVolatile Solids

Nomenclature

The following nomenclature is used in this paper:
AsAnnual temperature amplitude at the soil surface (°C)
B′Characteristic dimension of the digester floor (m)
CpSpecific heat capacity (J⋅kg−1⋅K−1)
dDamping depth of soil (m)
dtEquivalent thickness of the ground (m)
EdDaily electrical energy demand (kWh·day−1)
GhGlobal horizontal solar irradiance (W·m−2)
GlobEffEffective global solar radiation on the collector plane (kWh·m−2)
HrRelative humidity (%)
hG-CConvective coefficient at the gas-cover interface (W⋅m−2⋅K−1)
houtExterior heat transfer coefficient (W⋅m−2⋅K−1)
hS-GConvective coefficient at the slurry-gas interface (W⋅m−2⋅K−1)
IRhSky longwave (infrared) irradiance on a horizontal plane (W·m−2)
mSubstrate mass flow (kg⋅s−1)
PPerimeter of the digester floor (m)/Equipment nominal power (kW)
PmAnnual precipitation (mm)
Pnom,acNominal AC power for PV sizing (kW)
Pnom,dcNominal DC power for PV sizing (kW)
qThermal power required for substrate heating (W)
QcTotal heat transfer rate through the cover (W)
QsHeat losses through the soil (W)
QTotTotal heat demand of the digester (W)
RcTotTotal thermal resistance of the cover assembly (m2⋅K⋅W−1)
RsiSurface resistance (m2⋅K⋅W−1)
SbBottom area of the digester (m2)
SdLower and Lateral Buried Surface Area (m2)
SuUpper Surface Exposed to Air (m2)
tHour of the year (h)/Effective daily operating time (h·day−1)
t0Hour of the year with the maximum surface temperature (h)
tdThickness of the LDPE cover (m)
tdcThickness of the polystyrene coating (m)
tiThickness of each envelope layer (m)
TavgMean annual temperature (°C)
Tez,tSoil temperature at depth z and time t (°C)
TmAmbient temperature (°C)
TopSubstrate temperature in the mesophilic range (35 °C)
TS−ASol-Air Temperature (K)
Ub,sOverall buried thermal transmittance (W⋅m−2⋅K−1)
vdAdjusted wind speed (m⋅s−1)
VbiogasAnnual biogas consumption required for heating (m3·year−1)
wThickness of the walls (m)
WsWind speed (m·s−1)
zInstallation depth (m)
αSolar absorptivity (dimensionless)
ϵEmissivity (dimensionless)
ηBoiler efficiency (%)
λdcPolystyrene thermal conductivity coefficient (W⋅m−1⋅K−1)
λiEnvelope layer thermal conductivity coefficient (W⋅m−1⋅K−1)
λLDPELDPE thermal conductivity coefficient (W⋅m−1⋅K−1)
λsSoil thermal conductivity coefficient (W⋅m−1⋅K−1)
σStefan-Boltzmann coefficient (5.67 × 10⁻⁸ W⋅m−2⋅K−4)
ω Angular frequency

References

  1. LSánchez-Martín, L.; Romero, M.O.; Llamas, B.; Rodríguez, M.d.C.S.; Mora, P. Cost Model for Biogas and Biomethane Production in Anaerobic Digestion and Upgrading. Case Study: Castile and Leon. Materials 2023, 16, 359. [Google Scholar] [CrossRef] [Scilit]
  2. Global Methane Tracker 2024—Analysis—IEA. Available online: https://www.iea.org/reports/global-methane-tracker-2024 (accessed on 19 February 2026).
  3. Reparaz, C.; Sánchez-Martín, L.; de Godos, I.; Mora, P.; Llamas, B. A distributed biogas production model and its use in the livestock sector. Case study: Castile and león. Appl. Sci. 2021, 11, 5326. [Google Scholar] [CrossRef] [Scilit]
  4. Kadam, R.; Jo, S.; Lee, J.; Khanthong, K.; Jang, H.; Park, J. A Review on the Anaerobic Co-Digestion of Livestock Manures in the Context of Sustainable Waste Management. Energies 2024, 17, 546. [Google Scholar] [CrossRef] [Scilit]
  5. Iglesias, R.; Muñoz, R.; Polanco, M.; Díaz, I.; Susmozas, A.; Moreno, A.D.; Guirado, M.; Carreras, N.; Ballesteros, M. Biogas from Anaerobic Digestion as an Energy Vector: Current Upgrading Development. Energies 2021, 14, 2742. [Google Scholar] [CrossRef] [Scilit]
  6. Wainaina, S.; Awasthi, M.K.; Sarsaiya, S.; Chen, H.; Singh, E.; Kumar, A.; Ravindran, B.; Awasthi, S.K.; Liu, T.; Duan, Y.; et al. Resource recovery and circular economy from organic solid waste using aerobic and anaerobic digestion technologies. Bioresour. Technol. 2020, 301, 122778. [Google Scholar] [CrossRef] [Scilit]
  7. Karwasra, N.; Yadvika; Verma, K. Recent Advances in Pre-treatment Strategies for Anaerobic Digestion of Lignocellulosic Biomass: A Review. Asian J. Adv. Agric. Res. 2025, 25, 38–58. [Google Scholar] [CrossRef] [Scilit]
  8. Gomes, A.; Borges, A.; Peres, J.A.; Lucas, M.S. Bioenergy Production from Agro-Industrial Wastewater Using Advanced Oxidation Processes as Pre-Treatment. Catalysts 2023, 13, 1186. [Google Scholar] [CrossRef] [Scilit]
  9. Ministerio de Industria, Energía y Turismo. Resolución de 21 de diciembre de 2012, de la Dirección General de Política Energética y Minas, por la que se modifica el protocolo de detalle PD-01 «Medición, Calidad y Odorización de Gas» de las normas de gestión técnica del sistema gasista. Boletín Oficial del Estado (BOE) 2012, 312, 88818–88849. Available online: https://www.boe.es/diario_boe/txt.php?id=BOE-A-2013-185 (accessed on 20 February 2026).
  10. Melas, G.A.; Habtu, N.G.; Worku, A.K.; Getahun, E. Recent Progresses and Future Perspective of Biogas-Upgrading Techniques. BioEnergy Res. 2025, 18, 80. [Google Scholar] [CrossRef] [Scilit]
  11. Torre, R.M.; Álvaro, A.G.; Palomar, C.R.; de Godos Crespo, G.C.; de Almeida Guimarães, V.; Hedo, E.B. Developmental Perspectives of the Biofuel-Based Economy. Biofuels Circ. Econ. 2023, 20, 133–156. [Google Scholar] [CrossRef] [Scilit]
  12. Esteves, E.M.M.; Herrera, A.M.N.; Esteves, V.P.P.; Morgado, C.D.R.V. Life cycle assessment of manure biogas production: A review. J. Clean. Prod. 2019, 219, 411–423. [Google Scholar] [CrossRef] [Scilit]
  13. ISO 14040:2006; Environmental Management—Life Cycle Assessment—Principles and Framework. International Organization for Standardization: Geneva, Switzerland, 2006. Available online: https://www.iso.org/standard/37456.html (accessed on 20 February 2026).
  14. Agencia Estatal de Meteorología—AEMET; Gobierno de España. Available online: https://www.aemet.es/es/ (accessed on 20 February 2026).
  15. JRC Photovoltaic Geographical Information System (PVGIS)—European Commission. Available online: https://re.jrc.ec.europa.eu/pvg_tools/en/ (accessed on 20 February 2026).
  16. Tambone, F.; Terruzzi, L.; Scaglia, B.; Adani, F. Composting of the solid fraction of digestate derived from pig slurry: Biological processes and compost properties. Waste Manag. 2015, 35, 55–61. [Google Scholar] [CrossRef] [Scilit] [PubMed]
  17. Fernandes, F.; Silkina, A.; Fuentes-Grünewald, C.; Wood, E.E.; Ndovela, V.L.; Oatley-Radcliffe, D.L.; Lovitt, R.W.; Llewellyn, C.A. Valorising nutrient-rich digestate: Dilution, settlement and membrane filtration processing for optimisation as a waste-based media for microalgal cultivation. Waste Manag. 2020, 118, 197–208. [Google Scholar] [CrossRef] [Scilit] [PubMed]
  18. Llamas, B.; Suárez-Rodríguez, M.C.; González-López, C.V.; Mora, P.; Acién, F.G. Techno-economic analysis of microalgae related processes for CO2 bio-fixation. Algal Res. 2021, 57, 102339. [Google Scholar] [CrossRef] [Scilit]
  19. UNE-EN 16723-2:2018; Natural Gas and Biomethane for Use in Transport and Biomethane for Injection in the Natural Gas Network—Part 2: Automotive Fuels Specification. Spanish Association for Standardization: Madrid, Spain, 2018. Available online: https://www.une.org/encuentra-tu-norma/busca-tu-norma/norma?c=N0060341 (accessed on 20 February 2026).
  20. ISO 14044:2006; Environmental Management—Life Cycle Assessment—Requirements and Guidelines. International Organization for Standardization: Geneva, Switzerland, 2006. Available online: https://www.iso.org/standard/38498.html (accessed on 20 February 2026).
  21. Álvaro, A.G.; Palomar, C.R.; Torre, R.M.; Redondo, D.H.; de Godos Crespo, I. Hybridization of anaerobic digestion with solar energy: A solution for isolated livestock farms. Energy Convers. Manag. X 2023, 20, 100488. [Google Scholar] [CrossRef] [Scilit]
  22. Antezana, W.; De Blas, C.; García-Rebollar, P.; Rodríguez, C.; Beccaccia, A.; Ferrer, P.; Cerisuelo, A.; Moset, V.; Estellés, F.; Cambra-López, M.; et al. Composition, potential emissions and agricultural value of pig slurry from Spanish commercial farms. Nutr. Cycl. Agroecosystems 2016, 104, 159–173. [Google Scholar] [CrossRef] [Scilit]
  23. Moral, R.; Perez-Murcia, M.D.; Perez-Espinosa, A.; Moreno-Caselles, J.; Paredes, C.; Rufete, B. Salinity, organic content, micronutrients and heavy metals in pig slurries from South-eastern Spain. Waste Manag. 2008, 28, 367–371. [Google Scholar] [CrossRef] [Scilit]
  24. Möller, K.; Müller, T. Effects of anaerobic digestion on digestate nutrient availability and crop growth: A review. Eng. Life Sci. 2012, 12, 242–257. [Google Scholar] [CrossRef] [Scilit]
  25. Posadas, E.; García-Encina, P.A.; Soltau, A.; Domínguez, A.; Díaz, I.; Muñoz, R. Carbon and nutrient removal from centrates and domestic wastewater using algal–bacterial biofilm bioreactors. Bioresour. Technol. 2013, 139, 50–58. [Google Scholar] [CrossRef] [Scilit]
  26. Van Kessel, J.S.; Reeves, J.B. On-farm quick tests for estimating nitrogen in dairy manure. J. Dairy Sci. 2000, 83, 1837–1844. [Google Scholar] [CrossRef] [Scilit]
  27. Sánchez, M.; González, J.L. The fertilizer value of pig slurry. I. Values depending on the type of operation. Bioresour. Technol. 2005, 96, 1117–1123. [Google Scholar] [CrossRef] [Scilit]
  28. Greses, S.; Tomás-Pejó, E.; Markou, G.; González-Fernández, C. Microalgae production for nitrogen recovery of high-strength dry anaerobic digestion effluent. Waste Manag. 2022, 139, 321–329. [Google Scholar] [CrossRef] [Scilit]
  29. Di Lena, G.; Casini, I.; Lucarini, M.; del Pulgar, J.S.; Aguzzi, A.; Caproni, R.; Gabrielli, P.; Lombardi-Boccia, G. Chemical characterization and nutritional evaluation of microalgal biomass from large-scale production: A comparative study of five species. Eur. Food Res. Technol. 2020, 246, 323–332. [Google Scholar] [CrossRef] [Scilit]
  30. Pomares, F. Aprovechamiento de los purines del porcino como fertilizante. Comunitat Valencia. Agrar. 1996, 92, 35–41. [Google Scholar]
  31. Moset, V.; Riera, P.F.; López, M.C.; CERISUELO, A.; Salvador, A.G.T. Co-digestión anaerobia de purines de cerdo: Una alternativa de gestión sostenible. RETEMA Rev. Técnica Medio Ambiente 2011, 153, 40–45. [Google Scholar]
  32. Álvarez, A.S.-B. Biorrefinería de Microalgas para la Producción de Biocombustibles. 2019. Available online: https://eciencia.urjc.es/handle/10115/16209 (accessed on 3 December 2024).
  33. Becker, E.W. Microalgae-Biotechnology and Microbiology; Cambridge University Press: Cambridge, UK, 1994; Available online: https://books.google.com/books/about/Microalgae.html?hl=es&id=KAKx4I7NWEYC (accessed on 26 January 2026).
  34. Husted, S.; Husted, S. The chemical buffer system in raw and digested animal slurry. J. Agric. Sci. 1995, 124, 45–53. [Google Scholar] [CrossRef] [Scilit]
  35. Masse, L.; Massé, D.I.; Beaudette, V.; Muir, M. Size distribution and composition of particles in raw and anaerobically digested swine manure. Trans. Am. Soc. Agric. Eng. 2005, 48, 1943–1949. [Google Scholar] [CrossRef] [Scilit]
  36. ASABE. Manure Production and Characteristics; ASAE D384.2 MAR2005; American Society of Agricultural and Biological Engineers: St. Joseph, MI, USA, 2005; pp. 1–21. [Google Scholar] [CrossRef] [Scilit]
  37. García, D.; Posadas, E.; Grajeda, C.; Blanco, S.; Martínez-Páramo, S.; Acién, G.; García-Encina, P.; Bolado, S.; Muñoz, R. Comparative evaluation of piggery wastewater treatment in algal-bacterial photobioreactors under indoor and outdoor conditions. Bioresour. Technol. 2017, 245, 483–490. [Google Scholar] [CrossRef] [Scilit]
  38. de Godos, I.; Blanco, S.; García-Encina, P.A.; Becares, E.; Muñoz, R. Long-term operation of high rate algal ponds for the bioremediation of piggery wastewaters at high loading rates. Bioresour. Technol. 2009, 100, 4332–4339. [Google Scholar] [CrossRef] [Scilit] [PubMed]
  39. Herrera, A.; D’iMporzano, G.; Clagnan, E.; Pigoli, A.; Bonadei, E.; Meers, E.; Adani, F. Pig Slurry Management Producing N Mineral Concentrates: A Full-Scale Case Study. ACS Sustain. Chem. Eng. 2023, 11, 7309–7322. [Google Scholar] [CrossRef] [Scilit]
  40. Gavrilova, O.; Leip, A.; Dong, H.; MacDonald, J.D.; Bravo, C.A.G.; Amon, B.; Rosales, R.B.; del Prado, A.; de Lima, M.A.; Oyhantçabal, W.; et al. Emissions from Livestock and Manure Management. In 2019 Refinement to the 2006 IPCC Guidelines for National Greenhouse Gas Inventories; Calvo Buendia, E., Tanabe, K., Kranjc, A., Jamsranjav, B., Fukuda, M., Ngarize, S., Osako, A., Pyrozhenko, Y., Shermanau, P., Federici, S., Eds.; IPCC: Geneva, Switzerland, 2019; Volume 4, Chapter 10. [Google Scholar]
  41. Ouyang, C.F.; Lin, H.Y. A Study of Controlled Recirculation of Anaerobic Activated Sludge Digestion Reactors. Water Sci. Technol. 1992, 26, 2449–2452. [Google Scholar] [CrossRef] [Scilit]
  42. Sawalha, H.; Maghalseh, M.; Qutaina, J.; Junaidi, K.; Rene, E.R. Removal of hydrogen sulfide from biogas using activated carbon synthesized from different locally available biomass wastes—A case study from Palestine. Bioengineered 2020, 11, 607–618. [Google Scholar] [CrossRef] [Scilit] [PubMed]
  43. Index—LIFE SMART AgroMobility. Available online: https://lifesmartagromobility.eu/en/index/ (accessed on 20 February 2026).
  44. Hillel, D. Introduction to Environmental Soil Physics; Academic Press: Cambridge, MA, USA, 2003; pp. 1–494. [Google Scholar] [CrossRef] [Scilit]
  45. ISO 13370:2017; Thermal Performance of Buildings—Heat Transfer via the Ground—Calculation Methods. International Organization for Standardization: Geneva, Switzerland, 2017. Available online: https://www.iso.org/standard/65716.html (accessed on 6 January 2026).
  46. Asociación Española de Normalización. Componentes y elementos para la edificación. Resistencia térmica y transmitancia térmica. Métodos de cálculo (ISO 6946:2017); UNE-EN ISO 6946:2021; UNE: Madrid, Spain, 2021; Available online: https://www.une.org/. (accessed on 6 January 2026).
  47. ISO 6946:2017; Building Components and Building Elements—Thermal Resistance and Thermal Transmittance—Calculation Methods. International Organization for Standardization: Geneva, Switzerland, 2017. Available online: https://www.iso.org/standard/65708.html (accessed on 6 January 2026).
  48. Álvaro, A.G.; Palomar, C.R.; Redondo, D.H.; Torre, R.M.; de Godos Crespo, I. Simultaneous production of biogas and volatile fatty acids through anaerobic digestion using cereal straw as substrate. Environ. Technol. Innov. 2023, 31, 103215. [Google Scholar] [CrossRef] [Scilit]
  49. Pedersen, S.V.; Martí-Herrero, J.; Singh, A.K.; Sommer, S.G.; Hafner, S.D. Management and design of biogas digesters: A non-calibrated heat transfer model. Bioresour. Technol. 2020, 296, 122264. [Google Scholar] [CrossRef] [Scilit]
  50. Lazaro, R.; Frizera-Neto, A.; Marques, C.; Castellani, C.E.S.; Leal-Junior, A. FBG-Based Sensor for the Assessment of Heat Transfer Rate of Liquids in a Forced Convective Environment. Sensors 2021, 21, 6922. [Google Scholar] [CrossRef] [Scilit]
  51. Vögeli, Y.; Lohri, C.R.; Gallardo, A.; Diener, S.; Zurbrügg, C. Anaerobic Digestion of Biowaste in Developing Countries Practical Information and Case Studies with Financial Support from the Swiss Agency for Development and Cooperation (SDC) and the Swiss National Centre of Competence in Research (NCCR) North-South. 2014. Available online: www.sandec.ch (accessed on 18 April 2024).
  52. Rogers, J.N.; Rosenberg, J.N.; Guzman, B.J.; Oh, V.H.; Mimbela, L.E.; Ghassemi, A.; Betenbaugh, M.J.; Oyler, G.A.; Donohue, M.D. A critical analysis of paddlewheel-driven raceway ponds for algal biofuel production at commercial scales. Algal Res. 2014, 4, 76–88. [Google Scholar] [CrossRef] [Scilit]
  53. PVsyst|Photovoltaic System Simulation Software Products. Available online: https://www.pvsyst.com/en/ (accessed on 20 February 2026).
  54. Jinko Solar Co., Ltd. Tiger Neo N-type 54HL4-(V) 400-420 Watt: Product Datasheet. 2023. Available online: https://www.jinkosolar.com/uploads/JKM420-440N-54HL4R-B-F1.3-EN.pdf (accessed on 20 February 2026).
  55. Huawei Technologies Co., Ltd. SUN2000-3/4/5/6/8/10KTL-M1 Smart Energy Controller: Data Sheet. Shenzhen, China: Huawei. 2022; Available online: https://solar.huawei.com/en-GB/download?p=/-/media/Solar/attachment/pdf/eu/datasheet/SUN2000-3-10KTL-M1.pdf (accessed on 20 February 2026).
  56. Eshtiaghi, N.; Markis, F.; Yap, S.D.; Baudez, J.C.; Slatter, P. Rheological characterisation of municipal sludge: A review. Water Res. 2013, 47, 5493–5510. [Google Scholar] [CrossRef] [Scilit]
  57. Yataganbaba, A.; Kurtbaş, I. A scientific approach with bibliometric analysis related to brick and tile drying: A review. Renew. Sustain. Energy Rev. 2016, 59, 206–224. [Google Scholar] [CrossRef] [Scilit]
  58. Kim, H.; Kim, W. A way of achieving a low $/W and a decent power output from a thermoelectric device. Appl. Energy 2015, 139, 205–211. [Google Scholar] [CrossRef] [Scilit]
  59. Li, W.; Wang, J.; Chen, R.; Xi, Y.; Liu, S.Q.; Wu, F.; Masoud, M.; Wu, X. Innovation-driven industrial green development: The moderating role of regional factors. J. Clean. Prod. 2019, 222, 344–354. [Google Scholar] [CrossRef] [Scilit]
  60. Massé, D.I.; Masse, L.; Croteau, F. The effect of temperature fluctuations on psychrophilic anaerobic sequencing batch reactors treating swine manure. Bioresour. Technol. 2003, 89, 57–62. [Google Scholar] [CrossRef] [Scilit]
  61. Cocolo, G.; Hjorth, M.; Zarebska, A.; Provolo, G. Effect of acidification on solid–liquid separation of pig slurry. Biosyst. Eng. 2016, 143, 20–27. [Google Scholar] [CrossRef] [Scilit]
  62. Marcato, C.E.; Pinelli, E.; Pouech, P.; Winterton, P.; Guiresse, M. Particle size and metal distributions in anaerobically digested pig slurry. Bioresour. Technol. 2008, 99, 2340–2348. [Google Scholar] [CrossRef] [Scilit] [PubMed]
  63. Kusuma, M.; Afrianisa, R. Initial Characterization of Bio-Slurry as Liquid Fertilizer. J. Phys. Conf. Ser. 2021, 2117, 012007. [Google Scholar] [CrossRef] [Scilit]
Figure 1. LIFE SMART AgroMobility process diagram: biomethane production, system boundaries, and operational thermal scenarios.
Energies 19 01541 g001
Figure 2. Monthly Thermal Energy Consumption (kWh).
Energies 19 01541 g002
Figure 3. Seasonal profiles of gross biogas potential, thermal process demand, and net energy surplus relative to ambient temperature variations.
Energies 19 01541 g003
Figure 4. Digester thermographic images captured with a Forward Looking Infrared (FLIR) camera.
Energies 19 01541 g004
Figure 5. Photovoltaic effective production.
Energies 19 01541 g005
Figure 6. Photovoltaic energy production.
Energies 19 01541 g006
Figure 7. Seasonal evolution of the global energy balance and net energy profile of the pilot plant. The bars represent the individual energy vectors (biogas potential, PV generation, and consumption loads), and the orange line illustrates the resulting Net Energy Balance (kWh·day−1), confirming a positive energy surplus throughout the annual cycle.
Energies 19 01541 g007
Table 2. Key operational parameters and process design efficiencies for the Scenario I mass balance model.
StagesParametersDataSource
Farm
(Feedstock: Pig Manure and Slurry)
No. Animals (pcs.)1000LIFE SMART AgroMobility *
Manure per pig (kg·day−1·animal−1)3.8[36]
Slurry per pig (L·day−1·animal−1)4.68[37,38]
Slurry density (kg·m−3)≈1000[39]
Total Solids (g·kg−1) 45.3[21]
TVS: Total Volatile Solids (g·kg−1)33.3[21]
Methane production potential (m3 CH4 kg−1 TVS)0.5[21,40]
Anaerobic DigesterTotal volume (m3)150LIFE SMART AgroMobility *
Useful volume (%)78LIFE SMART AgroMobility *
Operating temperature (°C)35[21]
HRT: Hydraulic Retention Time (day)25[21]
Digester recirculation ratio0.5[41]
Microalgae RacewayBiomass productivity (g DW·m−2·day−1)18LIFE SMART AgroMobility *
Carbon demand (kg CO2 ·kg−1 dry biomass)2.31[18]
Evaporation (m3 day−1)0.986LIFE SMART AgroMobility *
Up-grading
(Absorption Column)
Outgassing (%)6LIFE SMART AgroMobility *
Absorption rate (%)95LIFE SMART AgroMobility *
L/G ratio (v/v)1.5LIFE SMART AgroMobility *
RefiningSilica gel yield (%)100LIFE SMART AgroMobility *
Active carbon yield (%)98[42]
* Data extracted from the detailed engineering documentation of the LIFE SMART AgroMobility project (LIFE19 CCM/ES/001206) [43].
Table 3. Electrical inventory and daily energy consumption of the pilot plant functional units.
SystemID.EquipmentPower
(kW)
t
(h·Day−1)
Ed
(kWh·Day−1)
Pre-treatment and FeedingB-01Slurry pump0.2524.006.00
M-02Agitation pump1.600.250.40
B-03Water pump2.201.002.20
Anaerobic DigestionB-02Digester recirculation pump1.904.007.60
B-04Digestate extraction pump0.750.880.66
Upgrading and PBRB-05Digestate to mixer pump0.832.001.66
B-06Diluted digestate pump0.450.930.42
B-07Reactor pump0.407.002.80
M-01Paddle wheel0.3024.007.20
S-01Biogas blower0.157.001.05
S-02Air blower0.453.001.35
B-08Sediment pump0.616.003.66
Biomethane RefiningC-02Biomethane compressor1.507.0010.50
RU-01Refueling Unit 1.504.006.00
Monitoring -SCADA0.1524.003.60
55.10
Table 4. Electrical inventory and intermittent daily energy consumption during Scenario II.
SystemID.EquipmentPower
(kW)
t
(h·day−1)
Ed
(kWh·day−1)
Pre-treatment and FeedingB-01Slurry pump0.2512.003.00
M-02Agitation pump1.600.250.40
B-03Water pump2.201.002.20
Anaerobic DigestionB-02Digester recirculation pump1.904.007.60
B-04Digestate extraction pump0.750.880.66
Upgrading and PBRB-05Digestate to mixer pump0.832.001.66
B-06Diluted digestate pump0.450.930.42
B-07Reactor pump0.404.001.60
M-01Paddle wheel0.3024.007.20
S-01Biogas blower0.153.000.45
S-02Air blower0.453.001.35
B-08Sediment pump0.611.000.61
Biomethane RefiningC-02Biomethane compressor1.503.505.25
RU-01Refueling Unit 1.504.006.00
Monitoring -SCADA0.1524.003.60
42.00
Table 5. Comparative performance indicators: theoretical mesophilic design vs. experimental psychrophilic operation.
IndicatorScenario I
(Mesophilic Design)
Scenario II
(Experimental Psychrophilic)
Impact Analysis
Thermal DemandHigh (277–300 kWh d−1)Passive (0 kWh d−1)100% Saving
Biogas YieldHigh (78 Nm3 d−1)Low (14 Nm3 d−1)Kinetic limitation
Net Energy BalancePositive (170–408 kWh d−1)Positive (Low-Input surplus)Stability maintained
Electrical AutonomySeasonal (6 months)Total (12 months)Grid Independence
Electrical SEC1.20 kWh·m−3 CH44.17 kWh·m−3 CH4Scale penalty (+247%)
Disclaimer/Publisher’s Note: The statements, opinions and data contained in all publications are solely those of the individual author(s) and contributor(s) and not of MDPI and/or the editor(s). MDPI and/or the editor(s) disclaim responsibility for any injury to people or property resulting from any ideas, methods, instructions or products referred to in the content.