Article

Environmental Benefit Assessment of Biomass Power Generation Supply Chain: A Case of Substituting Coal with Straw in China

1
College of Mechanical and Electrical Engineering, Henan Agricultural University, Zhengzhou 450002, China
2
Digital Technology School, Sias University, Zhengzhou 451199, China
3
Institute of Agricultural Engineering, Huanghe Science & Technology University, Zhengzhou 450061, China
*
Authors to whom correspondence should be addressed.
Energies 2026, 19(6), 1537; https://doi.org/10.3390/en19061537
Submission received: 4 March 2026 / Revised: 18 March 2026 / Accepted: 18 March 2026 / Published: 20 March 2026

Abstract

Straw substitution for coal in direct-fired power generation can significantly reduce pollutant emissions. However, there are numerous challenges to using straw in direct-burning power generation, and the question of benefits also looms large. In this study, an environmental benefit assessment model for the straw power supply chain was developed using the life cycle assessment method from an environmental emission cost perspective. Pollutant emissions and environmental benefits were analyzed for four straw power supply chain models under the assumptions of this study. The results indicates that the CO2 in the straw power generation supply chain system mainly comes from the straw collection and transport stages, which account for 29% and 70%, respectively. The SO2 and PM10 emissions mainly originate from the power generation stage. The environmental benefits of substituting straw for coal-fired power generation range from 1,859,895.02 to 1,875,326.36 USD. Further sensitivity analysis suggests that fertilizer application rates and transport distance are negatively correlated with the system’s environmental benefit, whereas the adoption of advanced dust removal technologies, increases in the charge standards and improvements in energy efficiency are positively correlated. These results can promote the sustainable development of the biomass power generation industry.

1. Introduction

As global energy supply–demand imbalances intensify, environmental pollution and energy security issues have become increasingly serious; more and more countries are paying attention to the utilization of renewable energy [1,2,3]. As an influential contributor to global economic development, China has proposed the “dual carbon” strategy to alleviate environmental problems [4,5]. As an essential biomass resource, straw has the potential to reduce pollutant emissions and alleviate the energy crisis and climate change by replacing coal for power generation. The theoretical annual harvesting volume of straw-based biomass in China is approximately 900 million tons. However, the annual energy utilization of biomass is about 100 million tons, accounting for only 11% [6]. This is because straw has the characteristics of low density and strong seasonality, and many resources need to be invested for its utilization in power generation utilization [7,8,9]. To enhance the energy utilization potential of straw, it is necessary to study the straw power generation supply chain from an environmental perspective and evaluate its environmental benefits. This is of great significance for the sustainable development of this supply chain.
Straw power generation plays a crucial role in the biomass energy sector [10,11]. Reaño et al. [12] demonstrated that agricultural residues are a promising feedstock for electricity generation. They used Geographic Information System (GIS) tools to assess the spatial potential of crop straw for bioenergy production in India and estimated the available biomass resources for power generation. Straw power generation faces numerous challenges, mainly due to the excessive cost and low operation efficiency [13,14,15]. To reduce operational costs, Wu et al. [16] proposed a biomass supply chain model incorporating several minor preprocessing units. This model enables economies of scale in biomass utilization while minimizing the transportation and warehousing costs of the biomass supply chain. Banas et al. [17] analyzed the logistics and transportation issues of biomass and established a mixed-integer programming model to optimize the supply chain system. Wang et al. [18] developed the Integrated Biomass Supply Analysis and Logistics (IBSAL) model to optimize the supply cost of biomass. Cao et al. [19] considered the distribution of straw and road conditions to construct a straw supply network incorporating transfer stations. They carried out an economic analysis using the life cycle cost method. The results indicate that adopting an indirect transportation supply chain in power plants can reduce collection costs. Mao et al. [5] established a multi-period straw supply chain model, taking into account the uncertainty of straw raw material supply and equipment failure risks. The research results show that multi-period supply can improve system efficiency and reduce supply costs. Wang et al. [20] constructed a life cycle cost model for the straw power generation supply chain to analyze the economic benefits of using straw as a substitute for coal-fired power generation. The results indicate that the supply chain structure has a significant impact on the economic efficiency of the system. The improved economic benefits could boost the straw power generation industry.
To enhance the efficiency of power generation from straw, Li et al. [21] proposed a U-Net model to address the uncertainty in power generation caused by the fluctuation in the calorific value of biomass fuel. Harun et al. [22] researched the sustainable management of straw supply chain, finding that efficient waste management can reduce environmental impact. Sun et al. [23] compared the costs of the manual and mechanical collection of straw materials, finding that mechanical collection was more efficient. Roni et al. [24] constructed a hub-and-spoke supply chain network for biomass collection and conducted structural optimization to improve operational efficiency. Turki et al. [25] also transformed the spoke supply chain into a closed-loop supply chain and proposed an optimization model to enhance the sustainability of the system. These studies demonstrate that optimizing the biomass supply chain can enhance the efficiency of raw material supply.
Straw power generation has significant environmental benefits. Yang et al. [26] conducted an environmental assessment of agricultural waste gasification power generation technology and compared it with alternative technologies, finding that agricultural waste gasification confers the best environmental benefits. Liu et al. [27] applied life cycle assessment (LCA) to analyze the global warming potential and energy consumption in straw power generation systems. The results indicate that straw power generation has a greater emission reduction advantage compared to natural gas power generation. Sastre et al. [28] developed a life cycle evaluation model to assess the energy use and environmental impacts of straw power generation. Guo et al. [29] performed an LCA on a straw direct combustion power generation system, and the results indicated that biomass power generation contributes to reducing greenhouse gas emissions. Sokrethya et al. [30] conducted a life cycle assessment of a biomass power plant with an installed capacity of 10 MW in Cambodia. The results showed that biomass generation could reduce CO2 emissions by 1.06 million tons per year compared to coal-fired power plants. Biomass power generation can bring significant environmental benefits.
In summary, the prevailing academic literature on straw power generation supply chains is dominated by supply chain configuration optimization, operational efficiency improvement, and lifecycle assessment. The research methods employed encompass life cycle assessment, life cycle costing, and techno-economic analysis. The characteristics of the relevant research methods are summarized in Table 1. It can be observed that the evaluation perspective on biomass power generation has mainly focused on the environmental, economic, and techno-economic dimensions, with few studies combining the environmental and economic aspects. Particularly, there has been little research on the monetization of pollutant emissions in the straw power generation supply chain.
The environmental benefits of the straw power generation supply chain can be better quantified by converting pollutant reductions into monetary value. This study integrates the monetized costs of key pollutants into a life cycle assessment (LCA) framework to develop an environmental benefit model. The aim is to clarify the reduction in pollutant emissions achieved by replacing coal-fired power generation with straw-based power generation. At the same time, it aims to identify the environmental benefits of a straw-based power generation supply chain system. Therefore, based on the life cycle assessment method, this study analyzes the environmental costs (also called monetized cost of the environment) of pollutant emissions at different stages of the straw power generation supply chain. It then compares straw power generation with coal-fired power generation to analyze the environmental benefits. This has important implications for the sustainable development of the straw power generation supply chain and the promotion of biomass power generation technology.
The rest of the paper is structured as follows: Section 2 constructs an environmental benefit assessment model for the straw power generation supply chain; Section 3 presents a concrete case study analyzing the environmental benefits of a 25 MW biomass power plant; Section 4 discusses the results and analyzes the impact of some key factors on environmental benefits; and conclusions are provided in Section 5.

2. Methods

The environmental benefit of pollutants refers to the economic value of the environmental damage avoided by reducing one pollutant unit. Therefore, the environmental cost can be defined as the economic loss due to the emission of one unit of pollutant. The environmental cost is directly determined by the degree of environmental harm caused by the pollutant. If the degree of harm is higher, the corresponding environmental cost is larger. Therefore, this study draws on the concepts of environmental cost and environmental benefit to analyze the economic performance of pollutant emissions in a straw power generation supply chain system. The aim is to analyze the environmental benefit of replacing coal-fired power generation with straw. This study conducted an environmental impact analysis using the annual electricity output from the biomass power plant as the evaluation unit. The modeling framework proceeds in three steps:
(1)
Conducting a cradle-to-grave life cycle assessment to quantify the environmental costs of pollutant emissions at different stages of the straw power generation supply chain.
(2)
Performing a parallel LCA to determine the environmental cost of coal-fired power generation delivering the same amount of electricity generation.
(3)
By calculating the environmental cost difference between the two power generation methods, the environmental benefits can be obtained.

2.1. Boundary of the Supply Chain of Straw Power Generation

Straw is characterized by its large volume, low density, and widely dispersed distribution, which presents significant challenges for raw material recovery. Two primary collection methods are employed: mechanical baling and manual decentralized collection. Mechanical baling offers notable advantages in terms of higher efficiency, lower operational costs, and reduced labor requirements, making it increasingly adopted in practice [31,32]. Correspondingly, this study focuses on evaluating the environmental benefits of straw power generation systems under mechanical baling, while also conducting a comparative analysis with manual collection. The straw supply chain system is used as an analytical framework in this study. Straw is a byproduct of agricultural production. During cultivation, electricity and pesticides are consumed, which leads to energy consumption and a large amount of pollutant emissions. Life cycle assessment (LCA) is a standardized methodology, defined in ISO 14040/14044, for quantifying the cumulative environmental impacts of a product, process, or service across its entire life span—i.e., from raw material extraction (“cradle”) through manufacturing, use, and end-of-life treatment (“grave”) [33]. (For further information, refer to the research published in [34].) This study defines the system boundaries to cover five key stages: planting, collection, transportation, storage, and power generation. The functional roles and key material inputs associated with each phase are summarized in Table 2.
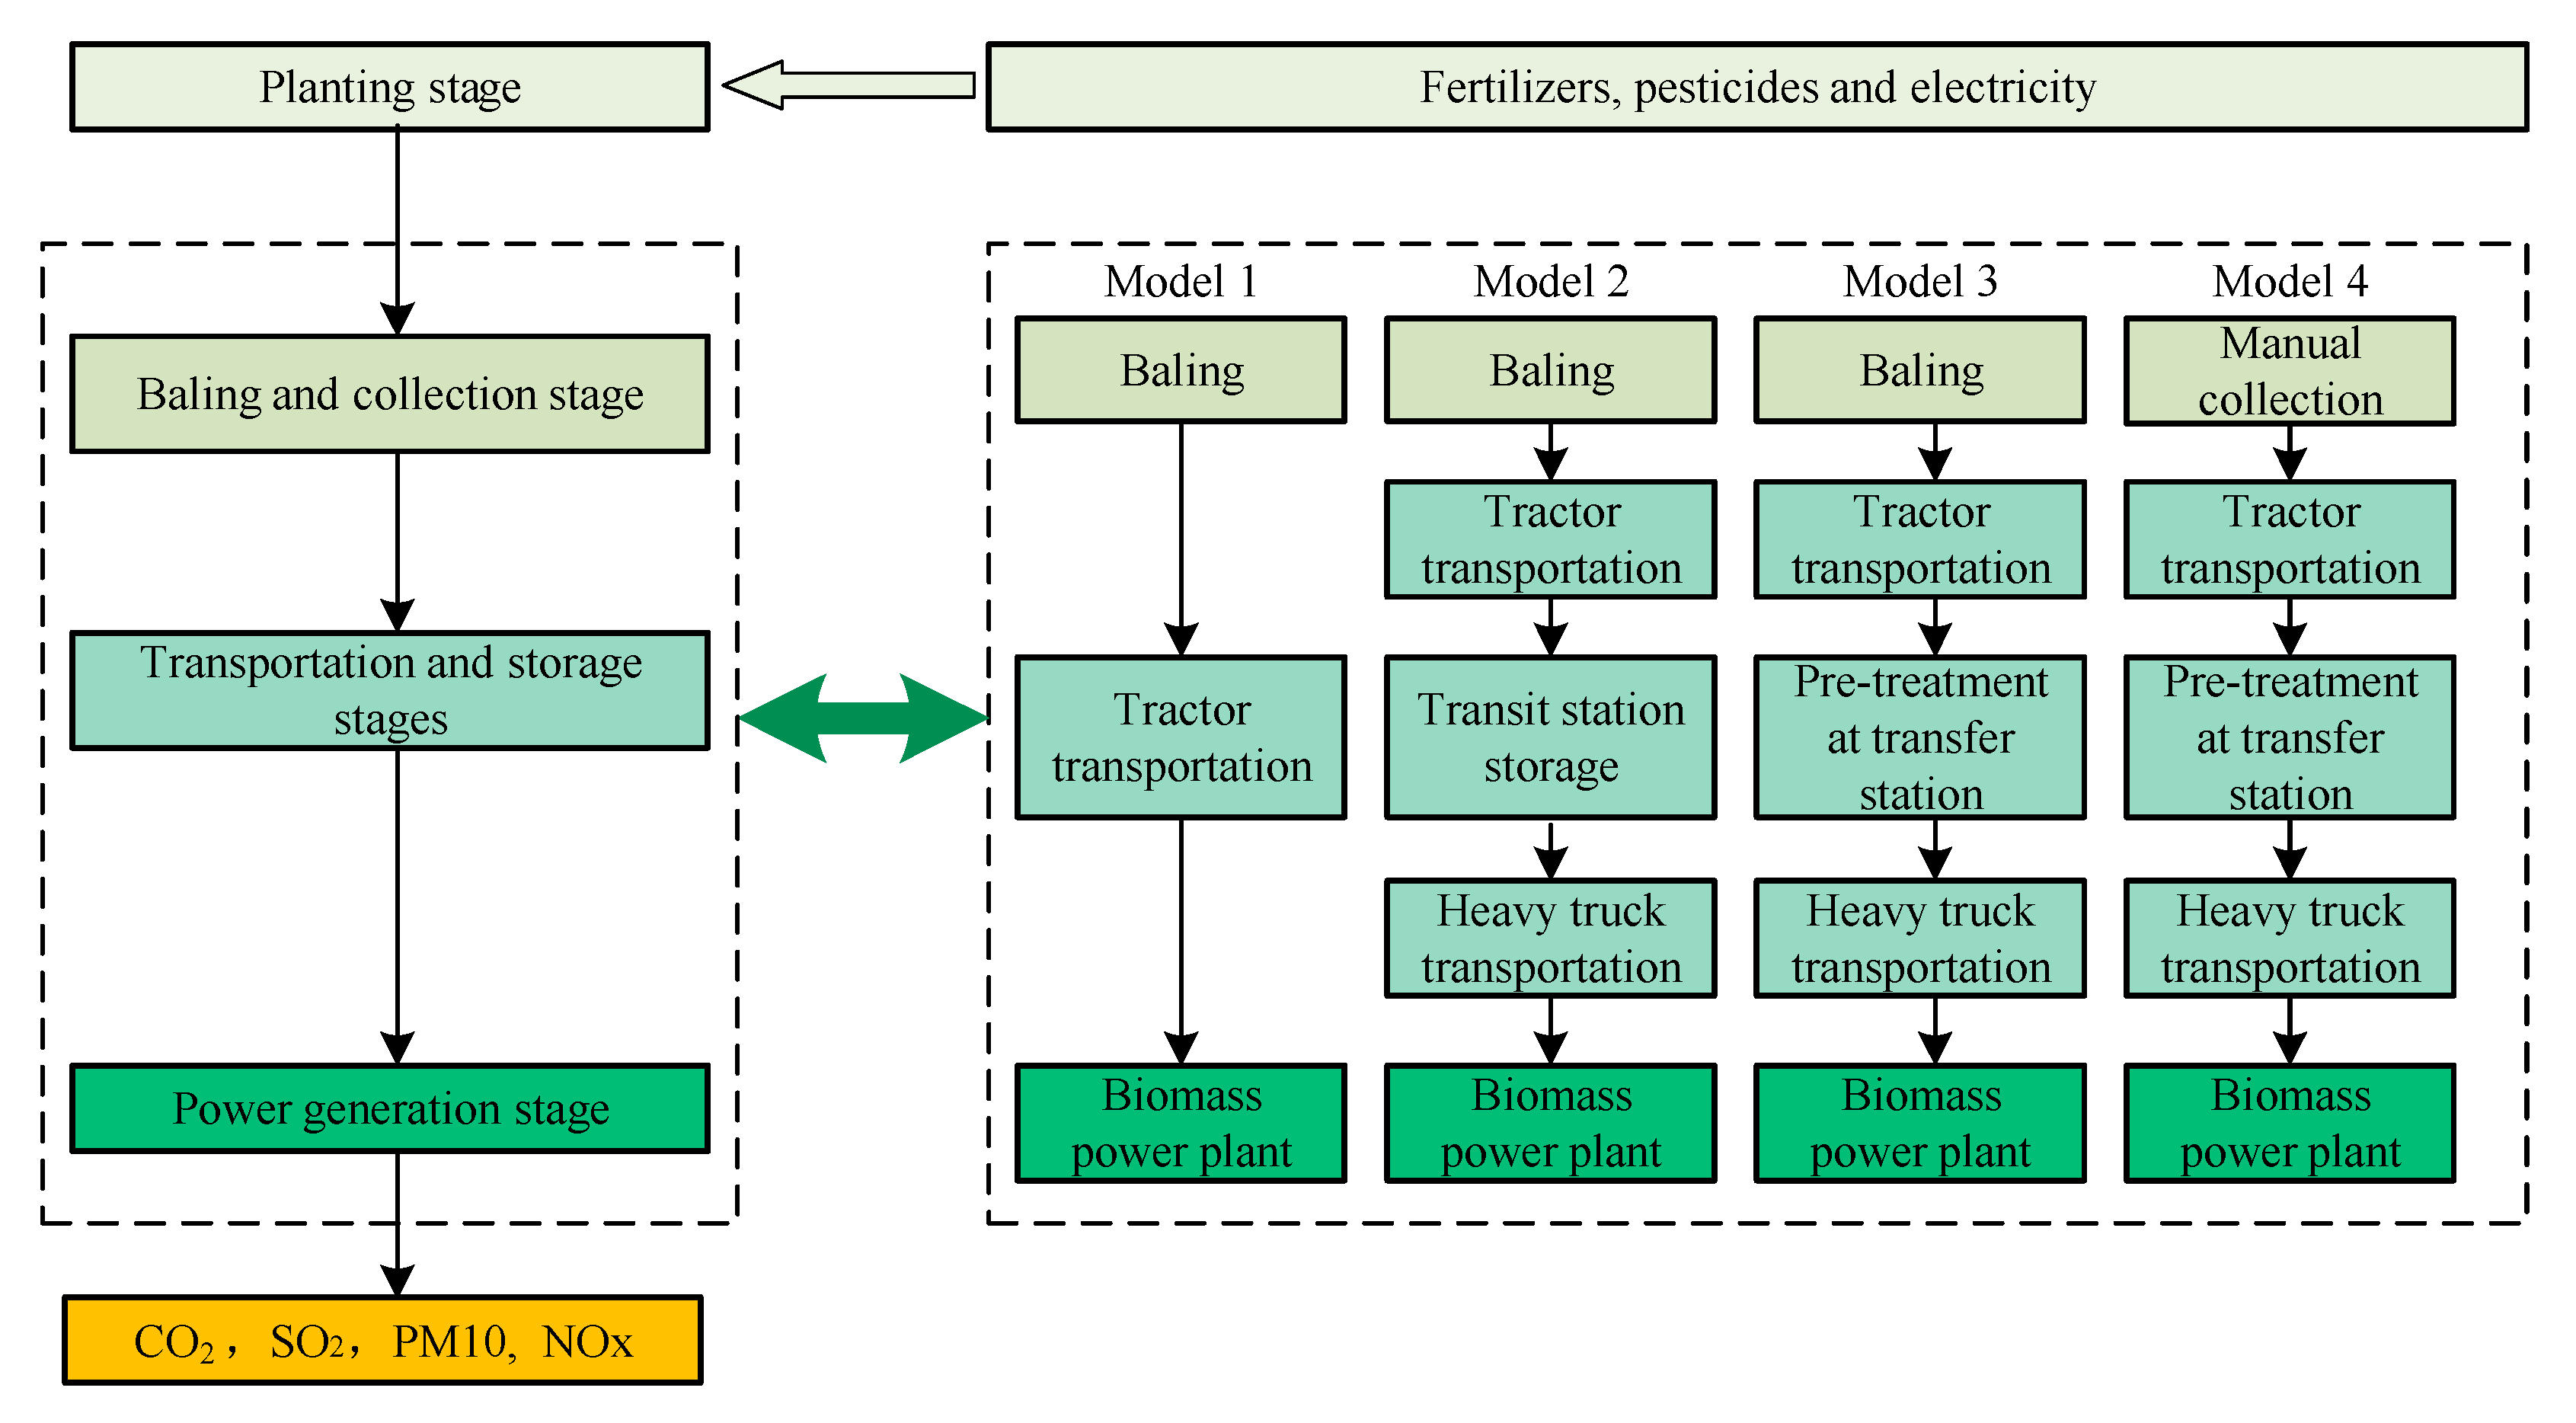
The treatment of the straw has a significant impact on the environmental performance of the system. Therefore, this study builds upon the framework proposed in [34] to develop four distinct supply modes for straw. The system boundary and stage division of the straw power generation supply chain are illustrated in Figure 1.

2.2. Environmental Cost List of Pollutant Emissions at Different Stages

2.2.1. Planting Stage

As an agricultural by-product, straw is produced during the growing of crops, which requires the use of various pesticides, fertilizers, and electrical irrigation. These agricultural activities lead to the emission of pollutants. In particular, the use of fertilizers and pesticides brings environmental pollution issues. As a result, the pollutant emissions during this stage mainly come from the use of pesticides, fertilizers, and electric irrigation. The environmental cost of pollutant emissions during the planting stage can be calculated as shown in Equation (1) [34].
V P = i = 1 n C i × ( F 1 i + F 2 i + F 3 i ) × δ p
F 1 i = A p × ω p i
F 2 i = A f × α f i
F 3 i = E e × β i × 0.001
A f = Q Q b × U f
A p = Q Q b × U p
E e = Q Q b × W e × H e  
where V P represents the environmental cost during the planting stage (USD); F 1 i is the emission of the i -th pollutant due to pesticide use (kg); F 2 i is the emission of the i -th pollutant due to the use of fertilizers (kg); F 3 i is the emission of the i-th pollutant during the irrigation (kg); C i is the monetized cost coefficient of the i -th pollutant (USD/kg); A p is the amount of pesticide used (kg); A f is the amount of fertilizer used (kg); ω p i is the emission coefficient of the i -th pollutant due to pesticide utilization (kg·kg−1) (given the availability of data, ω p i and α f i , only CO2 emissions were considered); α f i is the emission coefficient of the i -th pollutant due to the utilization of fertilizers (kg·kg−1); E e is the electricity consumption for irrigation (kWh); β i is the emission coefficient of the i -th pollutant due to electricity usage (g·kWh−1); δ p represents the distribution coefficient of the straw environmental burden (in view of the lack of references, the economic value ratio of straw and grain was utilized); Q represents the collection volume of straw (tone); Q b indicates the yield of straw per hectare of farmland (t·hm−1); U f represents the fertilizer usage per hectare of farmland (kg·hm−1); U p indicates the pesticide usage per hectare of farmland (kg·hm−1) ;   W e represents the electricity irrigation power of the motor (kW); and H e represents the irrigation time per hectare of farmland (h·hm−1).

2.2.2. Collection Stage

The collection stage mainly involves the use of a baler. The total pollutant emissions during this phase are attributed to the operation of the baling machinery. The environmental cost of the straw collection stage can be calculated using Equation (8).
V m = i = 1 n C i F 4 i
F 4 i = D m × F m i × 0.001
D m = c y × Q Q b
where V m represents the environmental cost during the collection stage (USD); F 4 i is the emission of the i -th pollutant during the mechanical operation process (kg); D m is the consumption of fossil energy during the collection stage (L); F m i is the emission coefficient of the i -th pollutant of the baling machinery (g·L−1); and   c y is the baling machine fuel consumption coefficient (L·hm−1).

2.2.3. Transportation Stage

Pollutant emissions during the transportation stage primarily arise from the operation of the transport vehicles and energy consumption. Depending on the configuration of the straw power generation supply chain, two transportation modes are distinguished: direct and indirect transportation (including transportation-a and -b). Although these modes differ in their logistical structure, the methodology for calculating pollutant emissions remains consistent. Therefore, the environmental cost at this stage can be determined as follows.
V T = i = 1 n C i F T i
F T i = D y × L y × Q × k j i
where V T denotes the environmental cost of the transportation stage (USD); F T i represents the emission of the i -th pollutant from transport vehicles (kg); D y is the fuel consumption rate of the vehicle (L·t−1·km−1); L y is the transportation distance (km); and   k j i represents the emission coefficient of the j -th type of transportation vehicle for the i -th pollutant under typical operating conditions (g·L−1).

2.2.4. Storage Stage

The storage stage refers to the short- or long-term storage of the straw after collection. In storage, the straw material is stacked within designated sites to improve space utilization efficiency and minimize land rental costs. At this stage, emissions primarily arise from fuel consumed by forklifts during material handling. The environmental cost of the storage stage is calculated as shown in Equation (13).
V s = i = 1 n C i F s i
F s i = l s t ×   c s t × Q × μ i
where V s is the environmental cost of the storage stage (USD); F s i represents the emissions of the i -th pollutant due to forklift fuel use (kg); μ i is the emission coefficient of the i -th pollutant per unit distance traveled by forklifts loading (g·L−1); l s t is the average distance of straw transported by forklift at the storage point (km); and c s t is the fuel consumption coefficient of the forklift (L·t−1·km−1).

2.2.5. Power Generation Utilization Stage

Upon arrival at the power plant, the straw has to undergo a series of processing steps to enable energy conversion. Primary activities include the in-plant transport of straw via forklifts, mechanical crushing, material delivery, and combustion. The CO2 produced during straw burning is considered as carbon balance. The amount of pollutant emission during this process is closely related to the dust removal technology of the system. Therefore, the environmental cost of pollutant emissions during the generation phase is calculated as follows.
V e = i = 1 n C i × ( F i e t + F i e h + F i e f )
F i e t = l e t × c s t × Q × μ i
F i e h = Q × k e × β i
F i e f = Q × ρ e i  
where V e denotes the environmental cost of pollutant emissions during the power generation stage (USD); F i e t represents the emission of the i -th pollutant associated with forklift transportation within the plant (kg); l e t is the average transport distance of forklift within the power plant (km); F i e h is the emission of the i -th pollutant from the on-site crushing and conveying processes (kg); k e is the specific energy consumption coefficient for straw crushing and conveying per unit mass (kWh·kg−1); β i is the emission coefficient of the i -th pollutant due to electricity usage (g·kWh−1); F i e f is the emission of the i -th pollutant resulting from straw combustion (kg); and   ρ e i is the emission coefficient of the i -th pollutant per unit of straw power generation (g·kg−1).

2.2.6. Environmental Cost of Coal-Fired Power Generation

Coal-fired power generation has played a crucial role in ensuring the country’s energy security and supporting China’s economic development. However, coal utilization results in substantial emissions of pollutants throughout its entire life cycle—from mining and transport to combustion. From a life cycle assessment perspective, pollutant emissions associated with coal-fired power generation primarily occur during three stages: mining, transportation and combustion. The environmental cost of coal-fired power generation is calculated as follows [20,35].
V c = j 3 i 4 C i × M × φ j i
where V c denotes the environmental cost of coal-fired power generation (USD); M represents the amount of coal that is substituted under equivalent power generation with straw (tone); φ j i is the emission coefficient of the i -th pollutant in the j -th stage (g·kg−1); i represents the type of pollutant; 4 indicates the number of pollutants analyzed in this study (CO2, SO2, PM10, NOX); j represents the stage of the coal life cycle; and 3 represents the three stages (mining, transportation, and combustion).

2.3. Construction of the Environmental Benefit Assessment Model for Straw Substituting Coal-Fired Power Generation

Straw is a renewable and cleaner energy source compared to fossil fuels. Replacing coal-fired power generation with straw can significantly reduce pollutant emissions and mitigate adverse environmental impacts. To quantify these results, the environmental benefits of replacing coal with straw were assessed using the following model:
V   =   V c     V s t  
V s t = V P + V m + V T + V s + V e  
where V represents the environmental benefit achieved by substituting coal-fired power with straw power (USD), and V s t represents the total environmental cost associated with the straw power generation supply chain (USD).

3. Case Study

3.1. System Parameter Settings

This study is based on an empirical analysis of the Y Biomass Power Plant in Henan, China. Based on field research, the power plant is equipped with a 25 MW generating unit. According to statistics from straw consumption data over the years, the power plant consumes approximately 200,000 tons of straw annually (calculated on a dry basis, with a moisture content of ≤25%) and generates 1.428 × 10⁸ kWh of electricity. Therefore, the analysis in this study is based on data from power plants operating for more than one year. Based on the long-term operation monitoring data from the power plant, 1 kWh of electricity can be generated using 1.4 kg of straw. The Lower Heating Value (LHV) of standard coal is 29.308 MJ/kg. A total of 0.123 kg of standard coal is needed to produce 1 kWh of power [20]. Therefore, this study assumes that 1.4 kg of straw can replace 0.123 kg of coal. The survey indicates that the theoretical maximum collection radius of straw at this power plant is 45 km. Therefore, in the direct transport mode, the average transport distance from the field to the power plant is 45 km. In the intermediate transportation mode, the average distance from the field to the temporary collection point is 10 km, and the average transportation distance from the collection point to the power plant is 35 km. The sum of these distances is consistent with the direct distance, ensuring comparability among different transportation routes. More system parameters are shown in Table 3 [20,34].
Each type of pollutant has its corresponding monetization cost coefficient, which refers to the degree of harm caused to the environment by the pollutant. To improve the ecological environment, it is necessary to impose treatment fees on pollutant emissions. According to the regulations of the National Development and Reform Commission of China, the pollutant discharge fees are calculated in terms of pollution equivalents. According to the Environmental Protection Tax Law, the charge for air pollutants is 0.17 USD (refer to the exchange rate of the US dollar and the Chinese yuan (CNY) on February 10, 2026: 1 USD = 6.91 CNY) per pollution equivalent [36]. According to government data, China’s environmental protection tax can only cover 20% to 30% of environmental losses. He [37] pointed out that in China, the charge standard for pollutants is much lower than the cost of pollution control, and the charge standard can only compensate for 25% of the loss of environmental pollution. Based on these data, this study assumes that the environmental compensation degree is 25%. Therefore, the monetized cost coefficient of different pollutants is shown in Table 4.
The research is based on a study of regional biomass power generation in Henan province. The coefficients of pollutant emissions at different stages of the straw power generation supply chain are shown in Table 5.

3.2. Result Calculation

3.2.1. Emission Quantities of Pollutants at Different Stages

The LCA method was applied to quantify pollutant emissions across these stages. The resulting emissions for each stage under various straw supply chain models are presented in Table 6.

3.2.2. Calculation of Pollutant Emission Reduction Results

Substituting straw for coal in power generation effectively reduces pollutant emissions. The resulting emission reductions under various straw power supply chain models are presented in Table 7 through a comparative analysis between straw and coal-based power generation systems.

3.2.3. Environmental Benefit of the Straw Power Generation Supply Chain

Both coal-fired power generation and straw power generation emit a large number of pollutants (e.g., SO2, NOx, CO2, PM10). Each pollutant carries an associated environmental cost, reflecting its potential harm to ecosystems and human health. To promote environmental protection, regulatory authorities impose emission treatment fees based on the amount and type of pollutants released. Replacing coal with straw for electricity generation could reduce pollutant emissions and thus lower environmental governance costs for businesses. This can bring environmental benefits to power plants. Under the assumptions of this study. The environmental costs (En-costs) and environmental benefits (En-benefits) under various straw power generation supply chain models and coal-fired power generation are presented in Table 8.
The environmental benefits of substituting straw for coal in power generation can be deduced from the table, and range from a minimum of 1,859,895.02 USD to a maximum of 1,875,326.36 USD. This indicates that straw power generation is significantly more environmentally friendly than coal-fired power. From an economic perspective, these results suggest that straw power generation has significant environmental benefits.

3.3. Result Analysis

3.3.1. Analysis of Pollutant Emissions at Different Stages of the Supply Chain

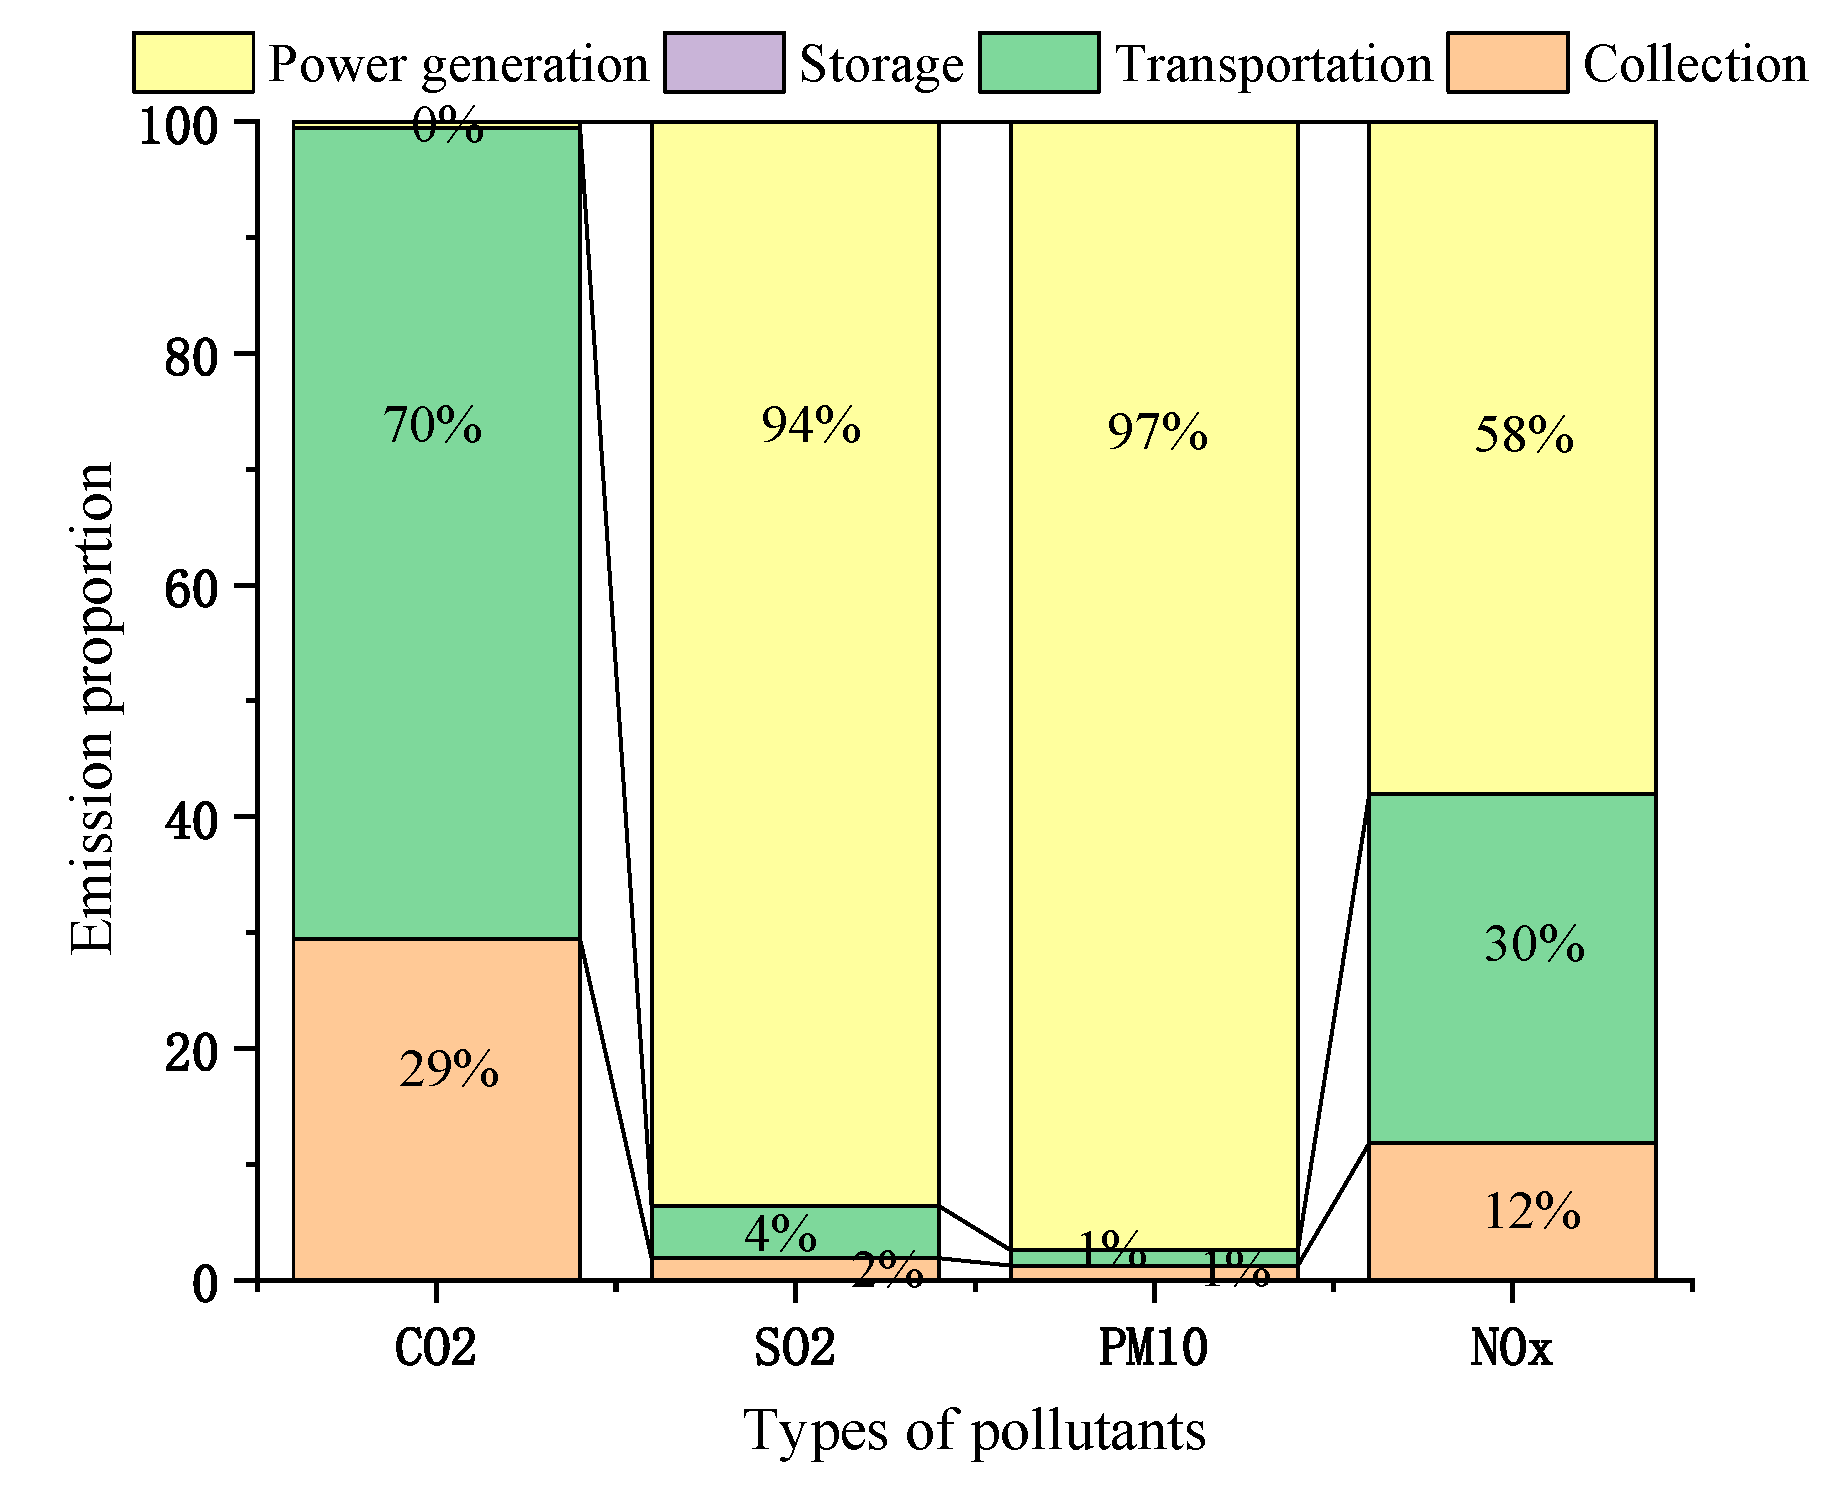
Significant differences exist in the emission of pollutants at different stages of the straw power generation supply chain. To clarify these differences, this study analyzes the pollutant emission share in the key stages (including collection, transportation, storage, and power generation) of the supply chain. According to the average data of the four straw power supply chain models. The results are shown in Figure 2.
As shown in Figure 2, the CO2 emissions are primarily generated during the collection and transportation stages, accounting for 29% and 70% of total emissions, respectively. This is due to the large amount of mechanical equipment and fuel used in these stages. SO2 and PM10 emissions are predominantly associated with the power generation stages. This is attributed to the crushing and burning processes during power generation, which release substantial amounts of pollutants.

3.3.2. Analysis of Pollutant Emissions Under Different Supply Chain Models

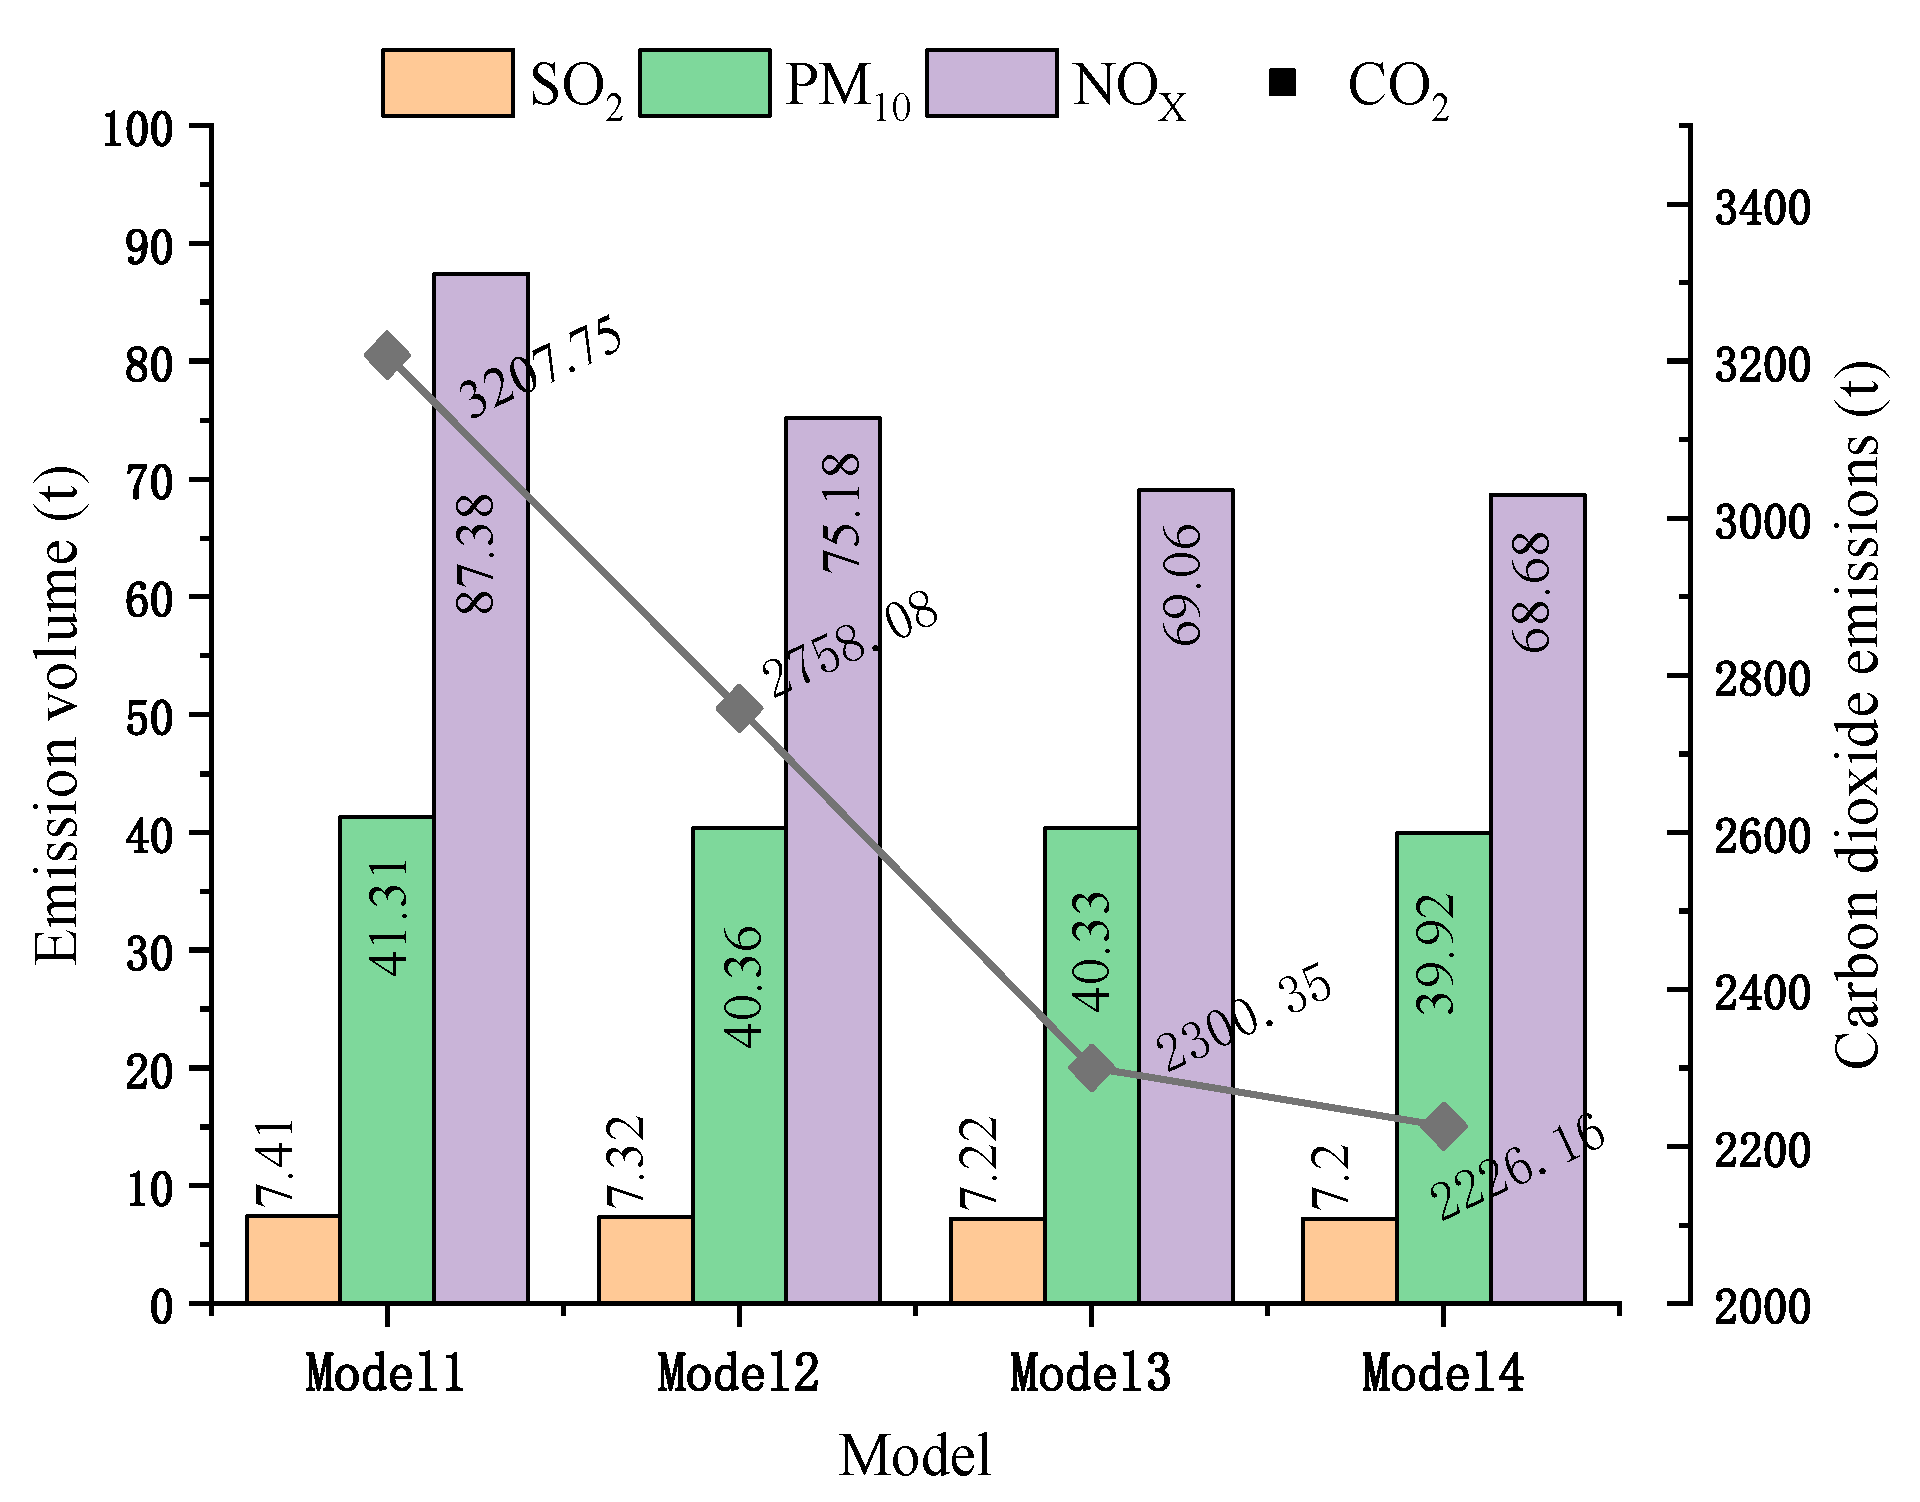
The choice of the straw power supply chain mode affects the environmental performance of the system. In order to clarify the differences between pollutant emissions in different supply chain modes, this study compares the pollutant emissions in different modes. The results are shown in Figure 3.
As shown in Figure 3, CO2 emissions vary across different supply chain modes. Model 4 showed the lowest level of emission at 2226.16 tons, while Mode 1 showed the highest at 3207.75 tons. This variation is mainly attributed to differences in collection methods and transport techniques. Model 4 uses manual collection, which minimizes fossil fuel consumption. In contrast, Model 1 relies on mechanical collection and direct transport, leading to higher emissions. The CO2 emissions in Models 2 and 3 are also significantly reduced compared to those Model 1. This is because the transit transport methods are used in these modes, which increases the efficiency of straw transport and reduces fuel consumption. It can also be observed that there is a slight difference between SO2 and PM10 emissions. This is because these pollutants mainly come from the straw burning and power generation stage and are less affected by the collection and transport modes. Therefore, the control of these pollutants should be focused on the straw power generation process.

3.3.3. Emission Analysis of Coal Fired and Straw Power Generation

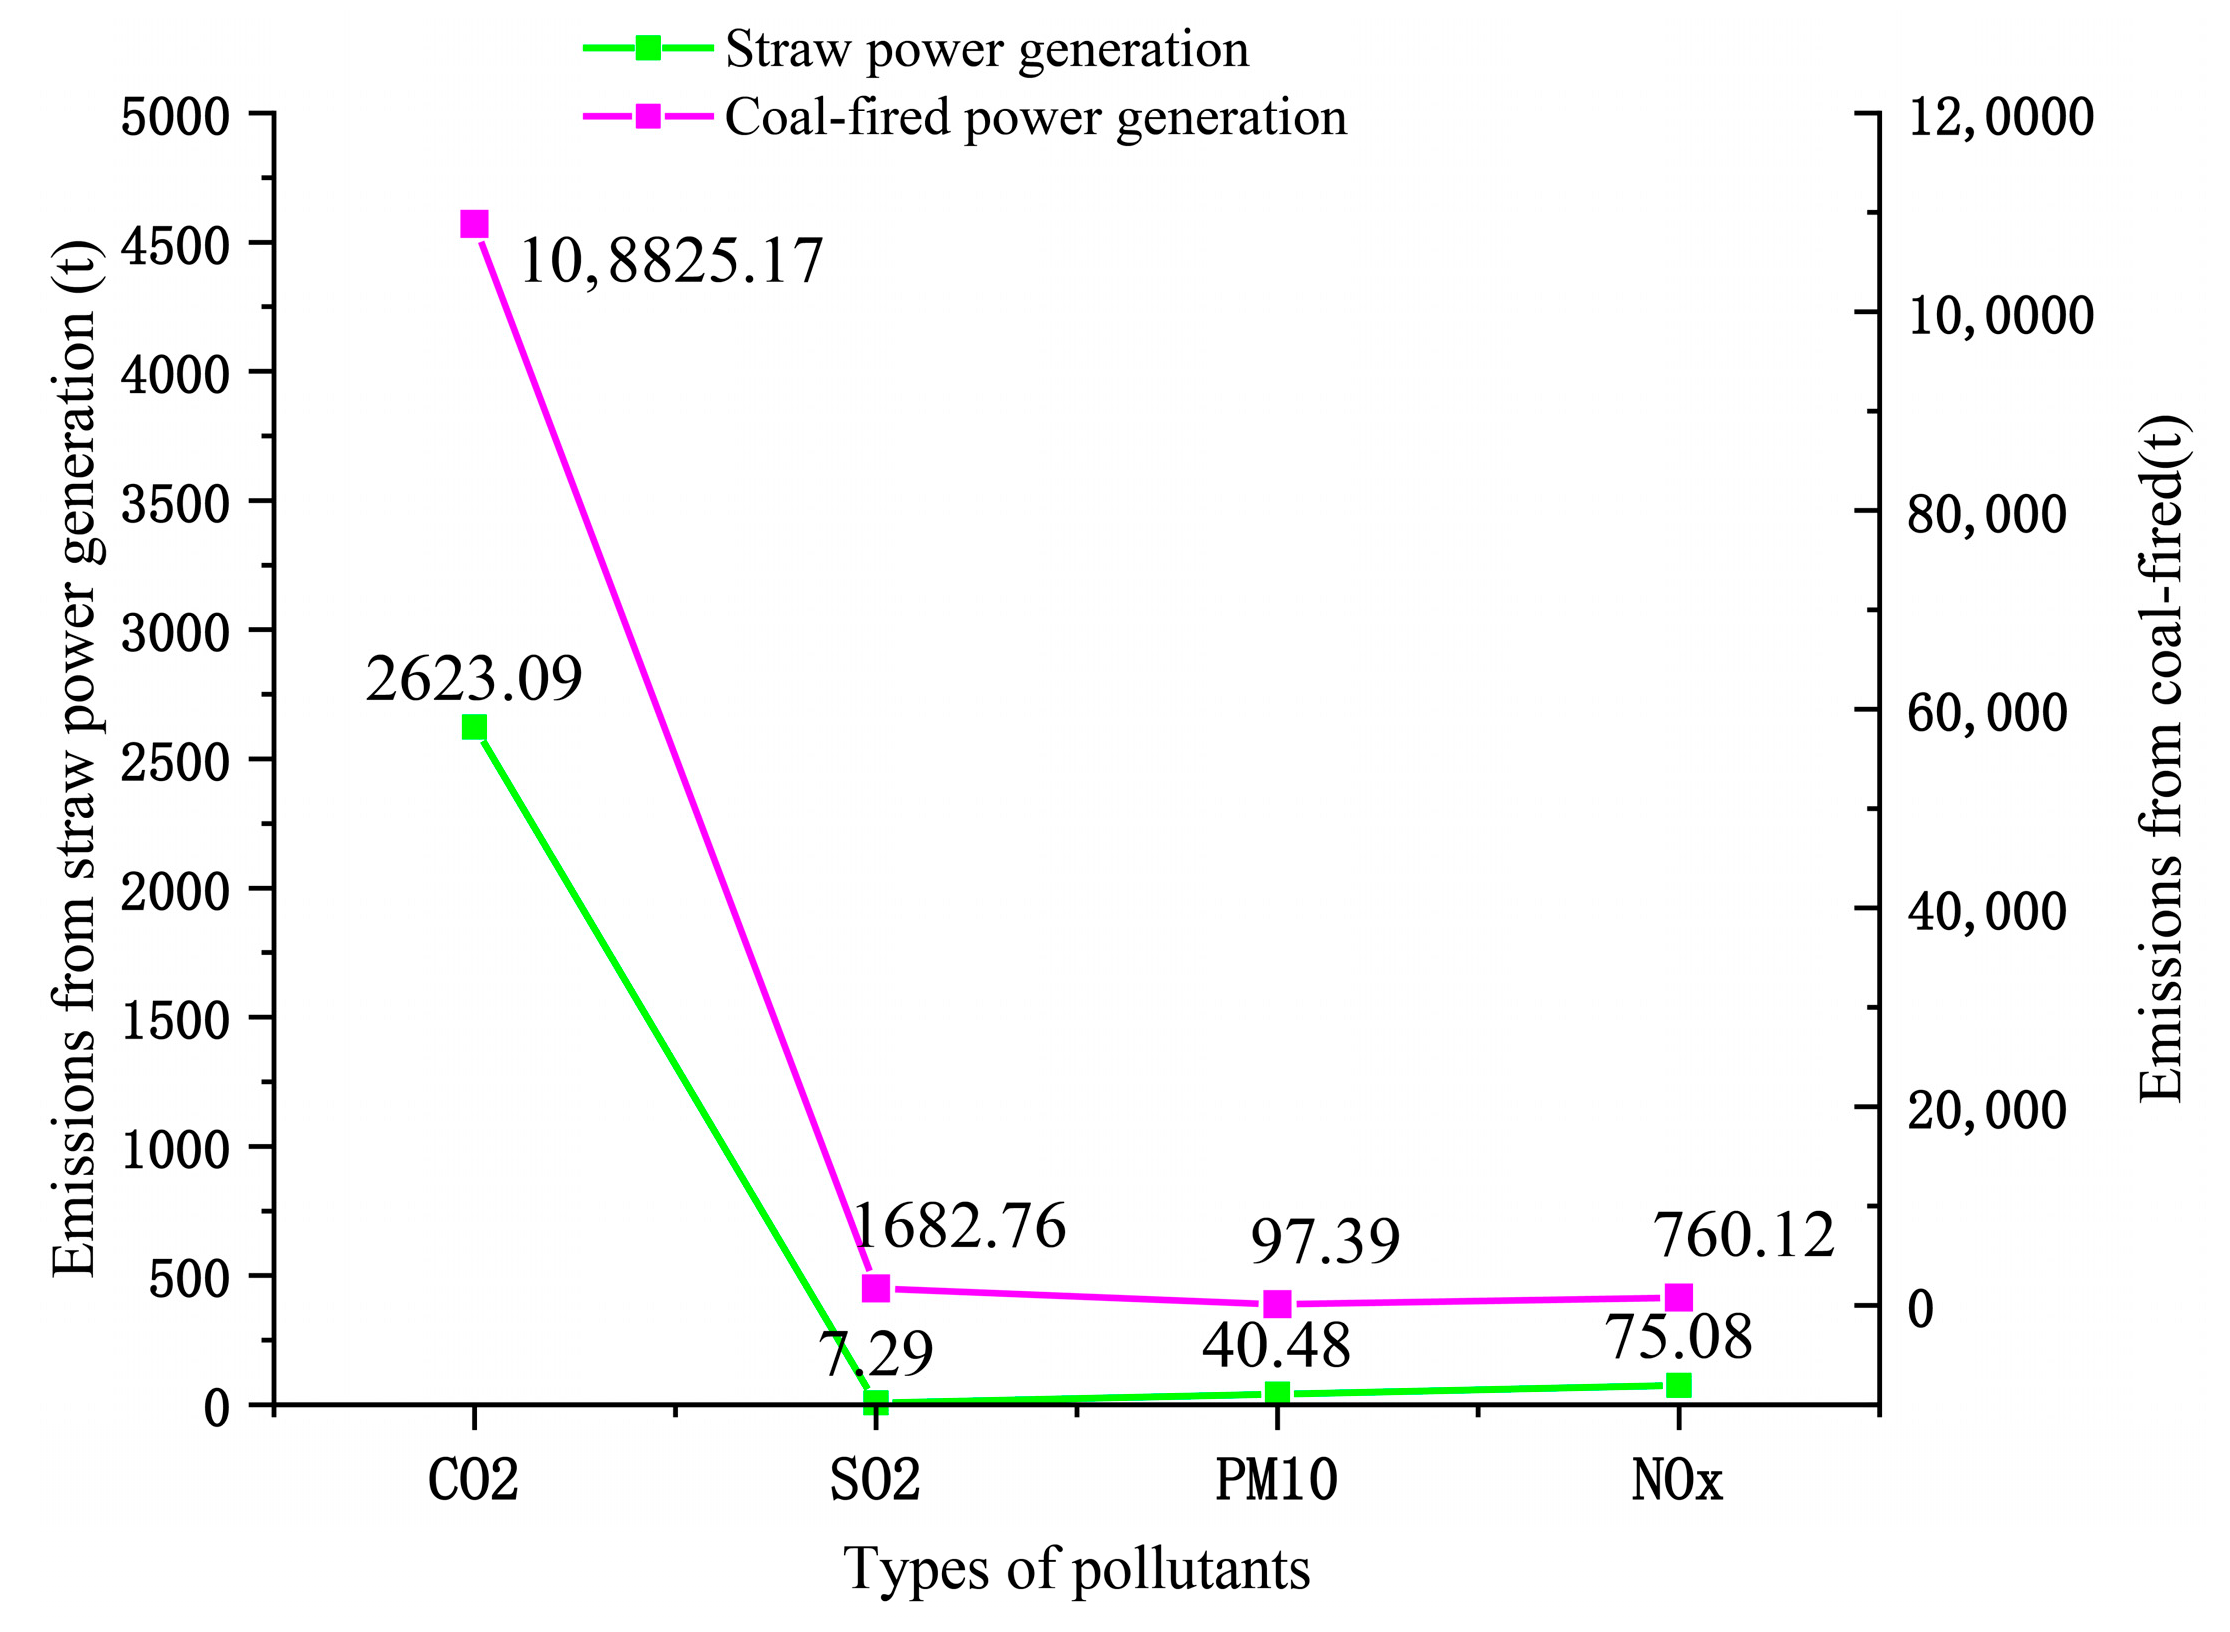
Straw is a clean and renewable resource. Replacing coal-fired power with straw has significant environmental benefits. To clarify the difference in environmental performance between the two power generation methods, in this study, the average emissions of pollutants from four straw power generation systems were compared with those from coal-fired power generation. The results are presented in Figure 4.
It is clear from Figure 4 that straw power generation has a greater capacity to reduce emissions than coal-fired power generation. The reduction in CO2 emissions is the most obvious, about 23.4 thousand tons. This is mainly because straw is considered a carbon-neutral raw material. It absorbs carbon dioxide during its growth and emits CO2 during its combustion and power generation. Only the straw supply process emits a limited amount of CO2. In contrast, coal-fired power generation releases substantial amounts of CO2 through the oxidation of carbon during combustion. The second is that the NOx emissions are very different. This disparity arises from the higher nitrogen content in coal, which promotes NOx formation during combustion. In addition, the difference in denitrification technology also leads to the NOx emissions of coal-fired power generation being much higher than those of straw power generation. SO2 emissions also differ between the two methods. This is because the high sulfur content of coal leads to the generation of a large amount of SO2. The sulfur content of straw is very low, only 0.02% to 0.1% [38].

3.3.4. Environmental Benefit Analysis of Straw Replacing Coal for Power Generation

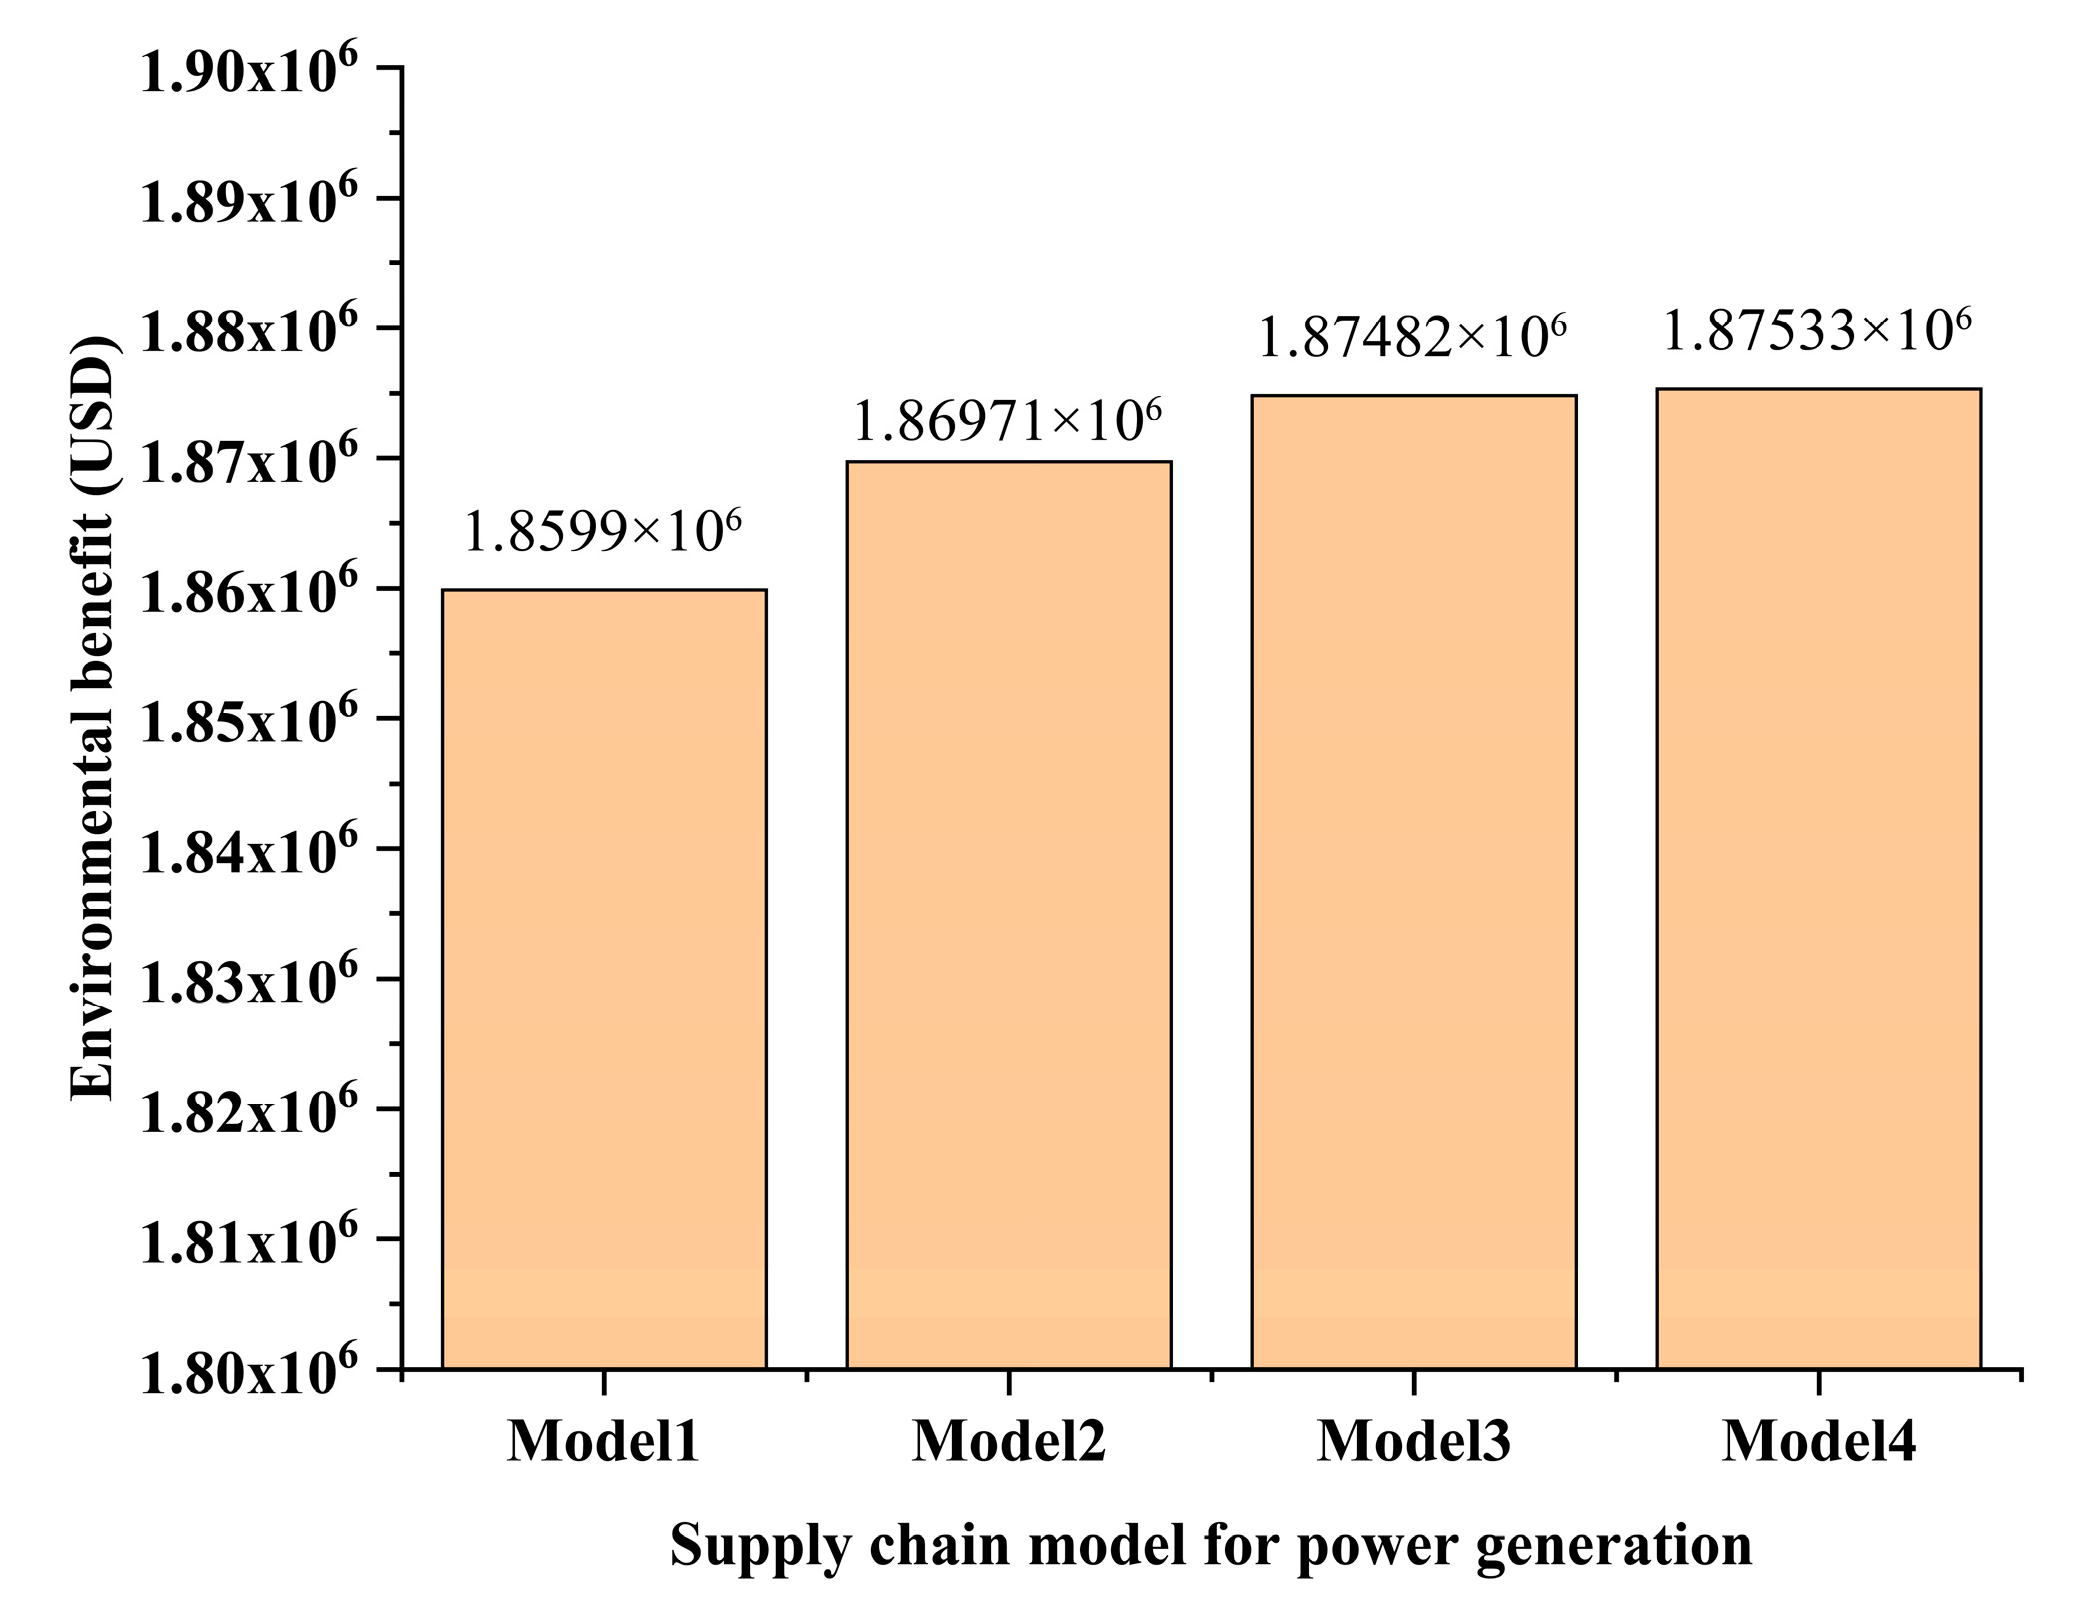
Replacing coal-fired power with straw reduces pollutant emissions. This helps biomass power companies to obtain government environmental subsidies. To clarify the environmental benefits of the different straw power generation supply chain models, this study analyzed the environmental benefits of straw power generation. The results are shown in Figure 5.
Figure 5 shows that Model 4 achieves the highest environmental benefit, whereas Model 1 yields the lowest. These differences are mainly attributed to variations in the supply method of straw feedstock. In Model 4, manual collection is employed to reduce the consumption of machinery and fuel. In Model 1, direct transport is used, which leads to low transport efficiency and additional fossil fuel consumption. This result is consistent with the study in the literature [20]. Reducing the input of fossil fuels in straw power plants can improve the environmental benefits of the system.

4. Discussion

To explore the impact of key factors on the environmental benefits of the straw power supply chain, a sensitivity analysis is presented here to discuss the impact of these factors on pollutant emissions and environmental benefits. Based on field investigations of straw power generation enterprises, several factors were identified as impacting system performance. Correspondingly, sensitivity analyses were performed for these key parameters.

4.1. The Impact of Fertilizer Usage

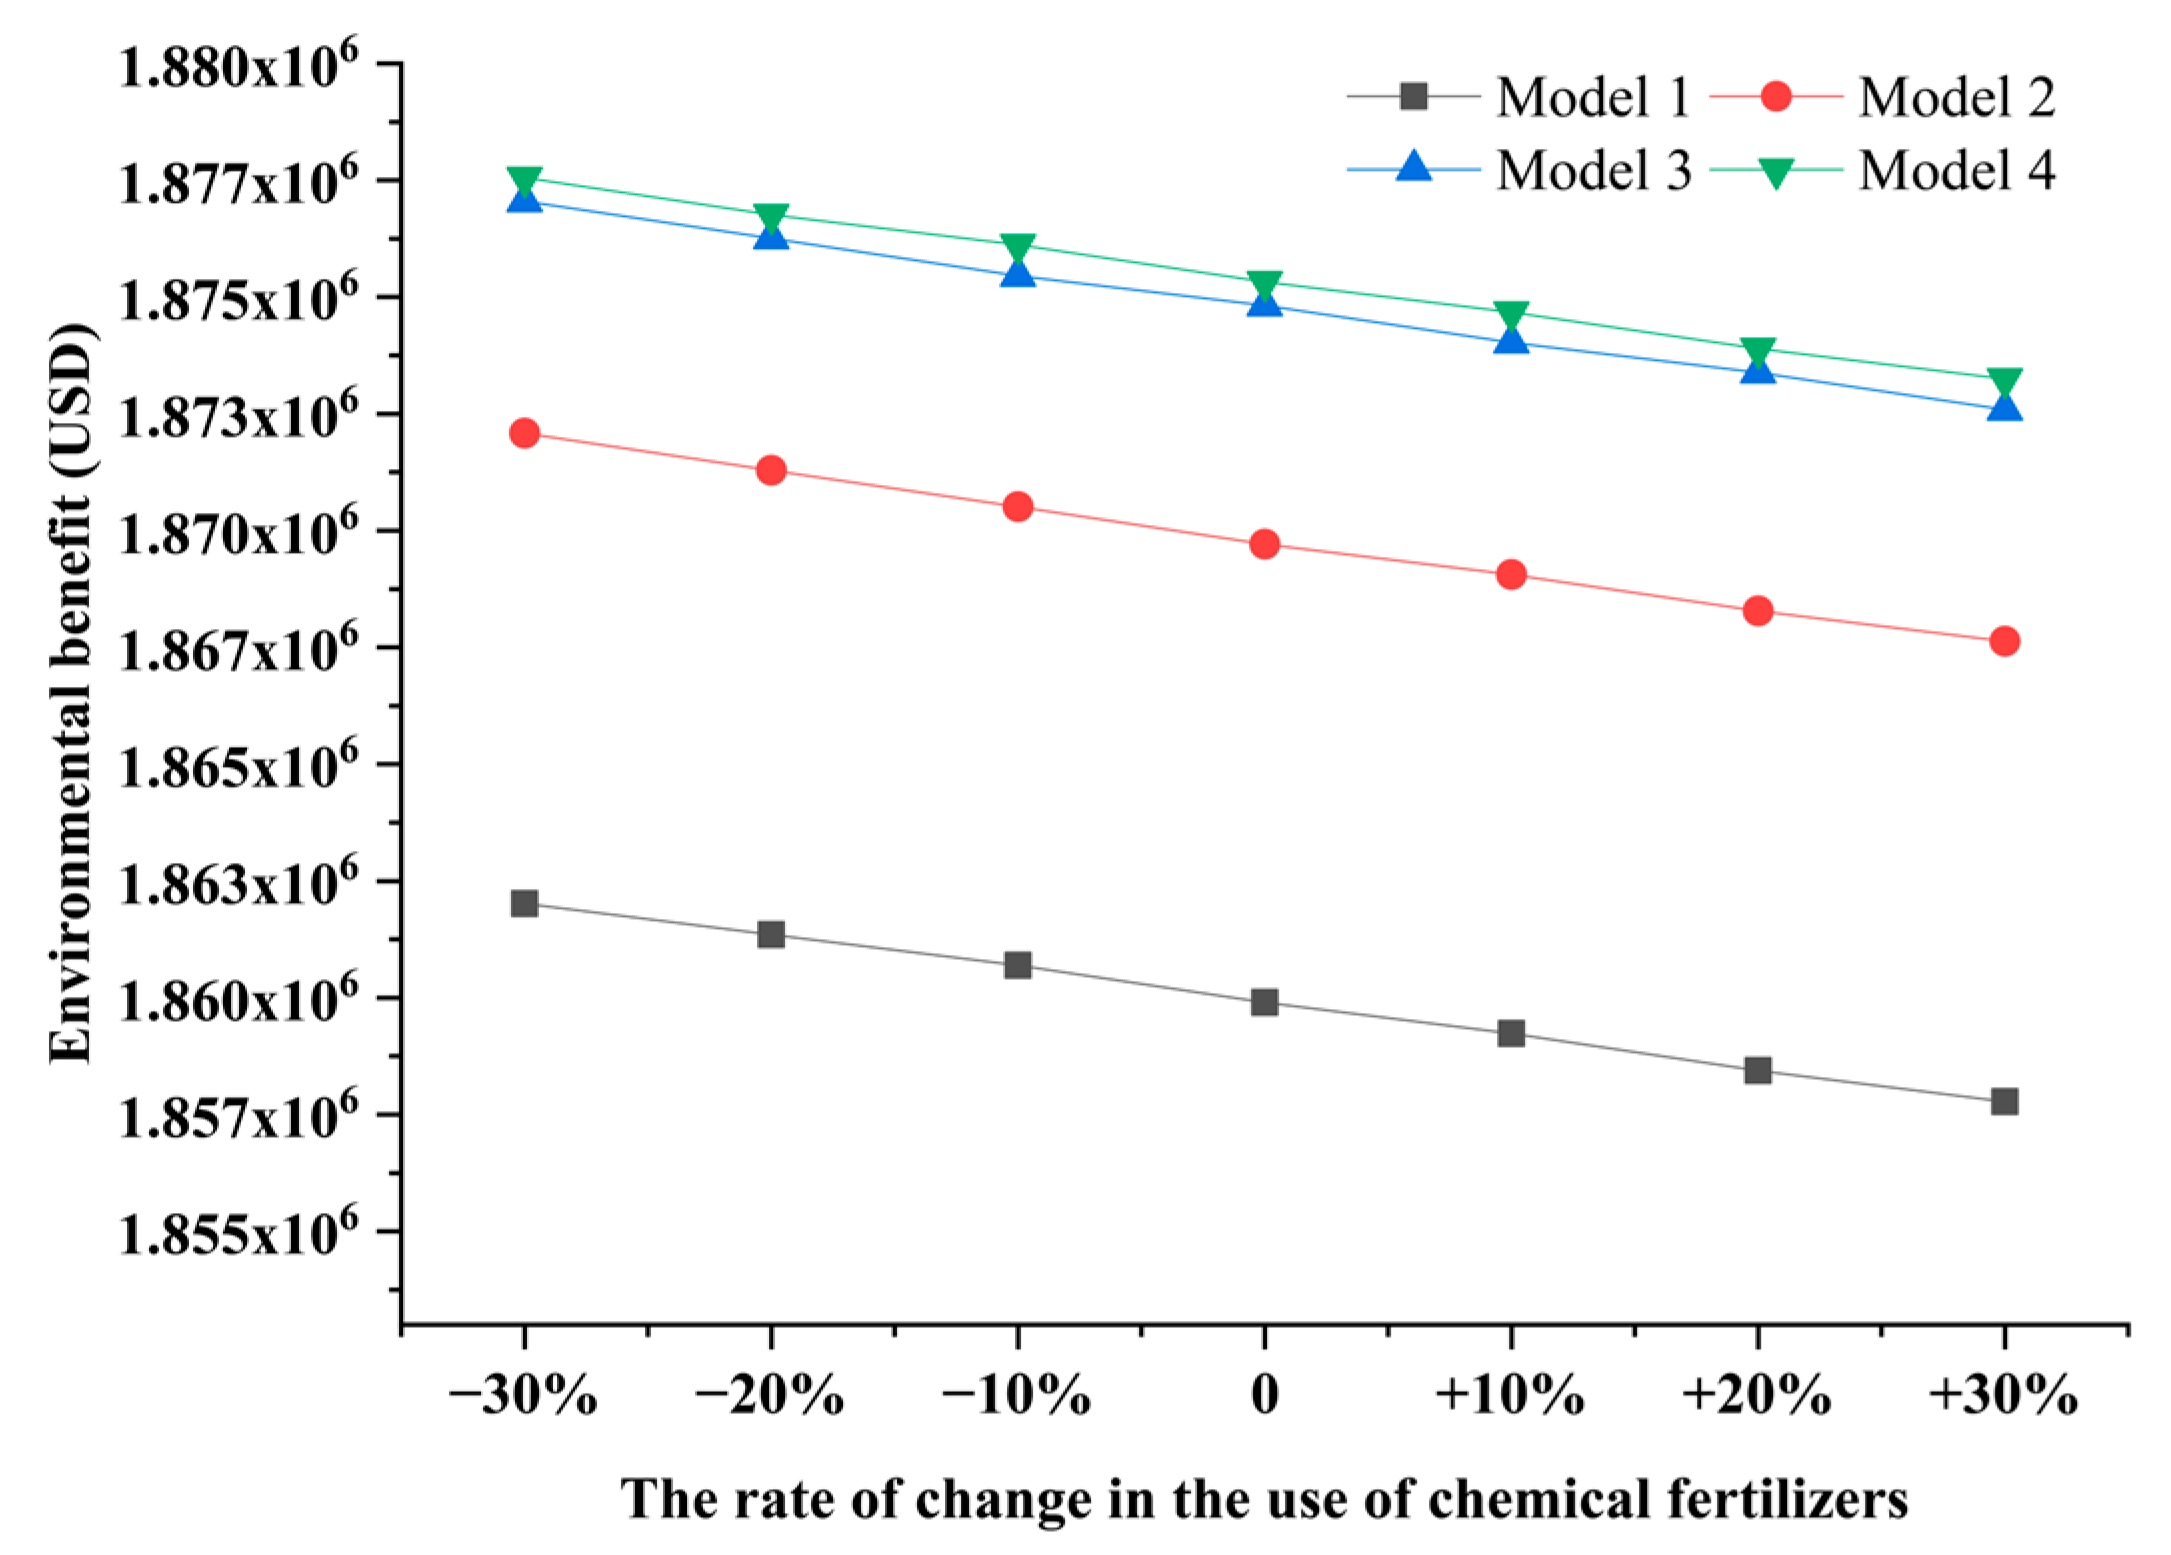
The amount of fertilizer used during the growing phase of the straw feedstock supply chain is a key factor affecting pollutant emissions. Fertilizer application leads to significant pollutant emissions. This study analyzed the environmental benefits of straw power generation under the scenarios of 10%, 20%, and 30% changes in fertilizer use. The results are shown in Figure 6.
From Figure 6, it can be seen that an increase in fertilizer use leads to a decrease in the environmental benefit of the straw power supply chain system. Moreover, the four supply chain modes exhibit similar trends in response to changes in fertilizer application. This is because fertilizer use and its trend of change are the same in the straw planting stage under the four modes. Therefore, it has been suggested that reducing the use of chemical fertilizers or replacing them with biological fertilizers can reduce the pollutant emissions and increase the environmental benefits.

4.2. The Impact of Transportation Distance on the Supply Chain

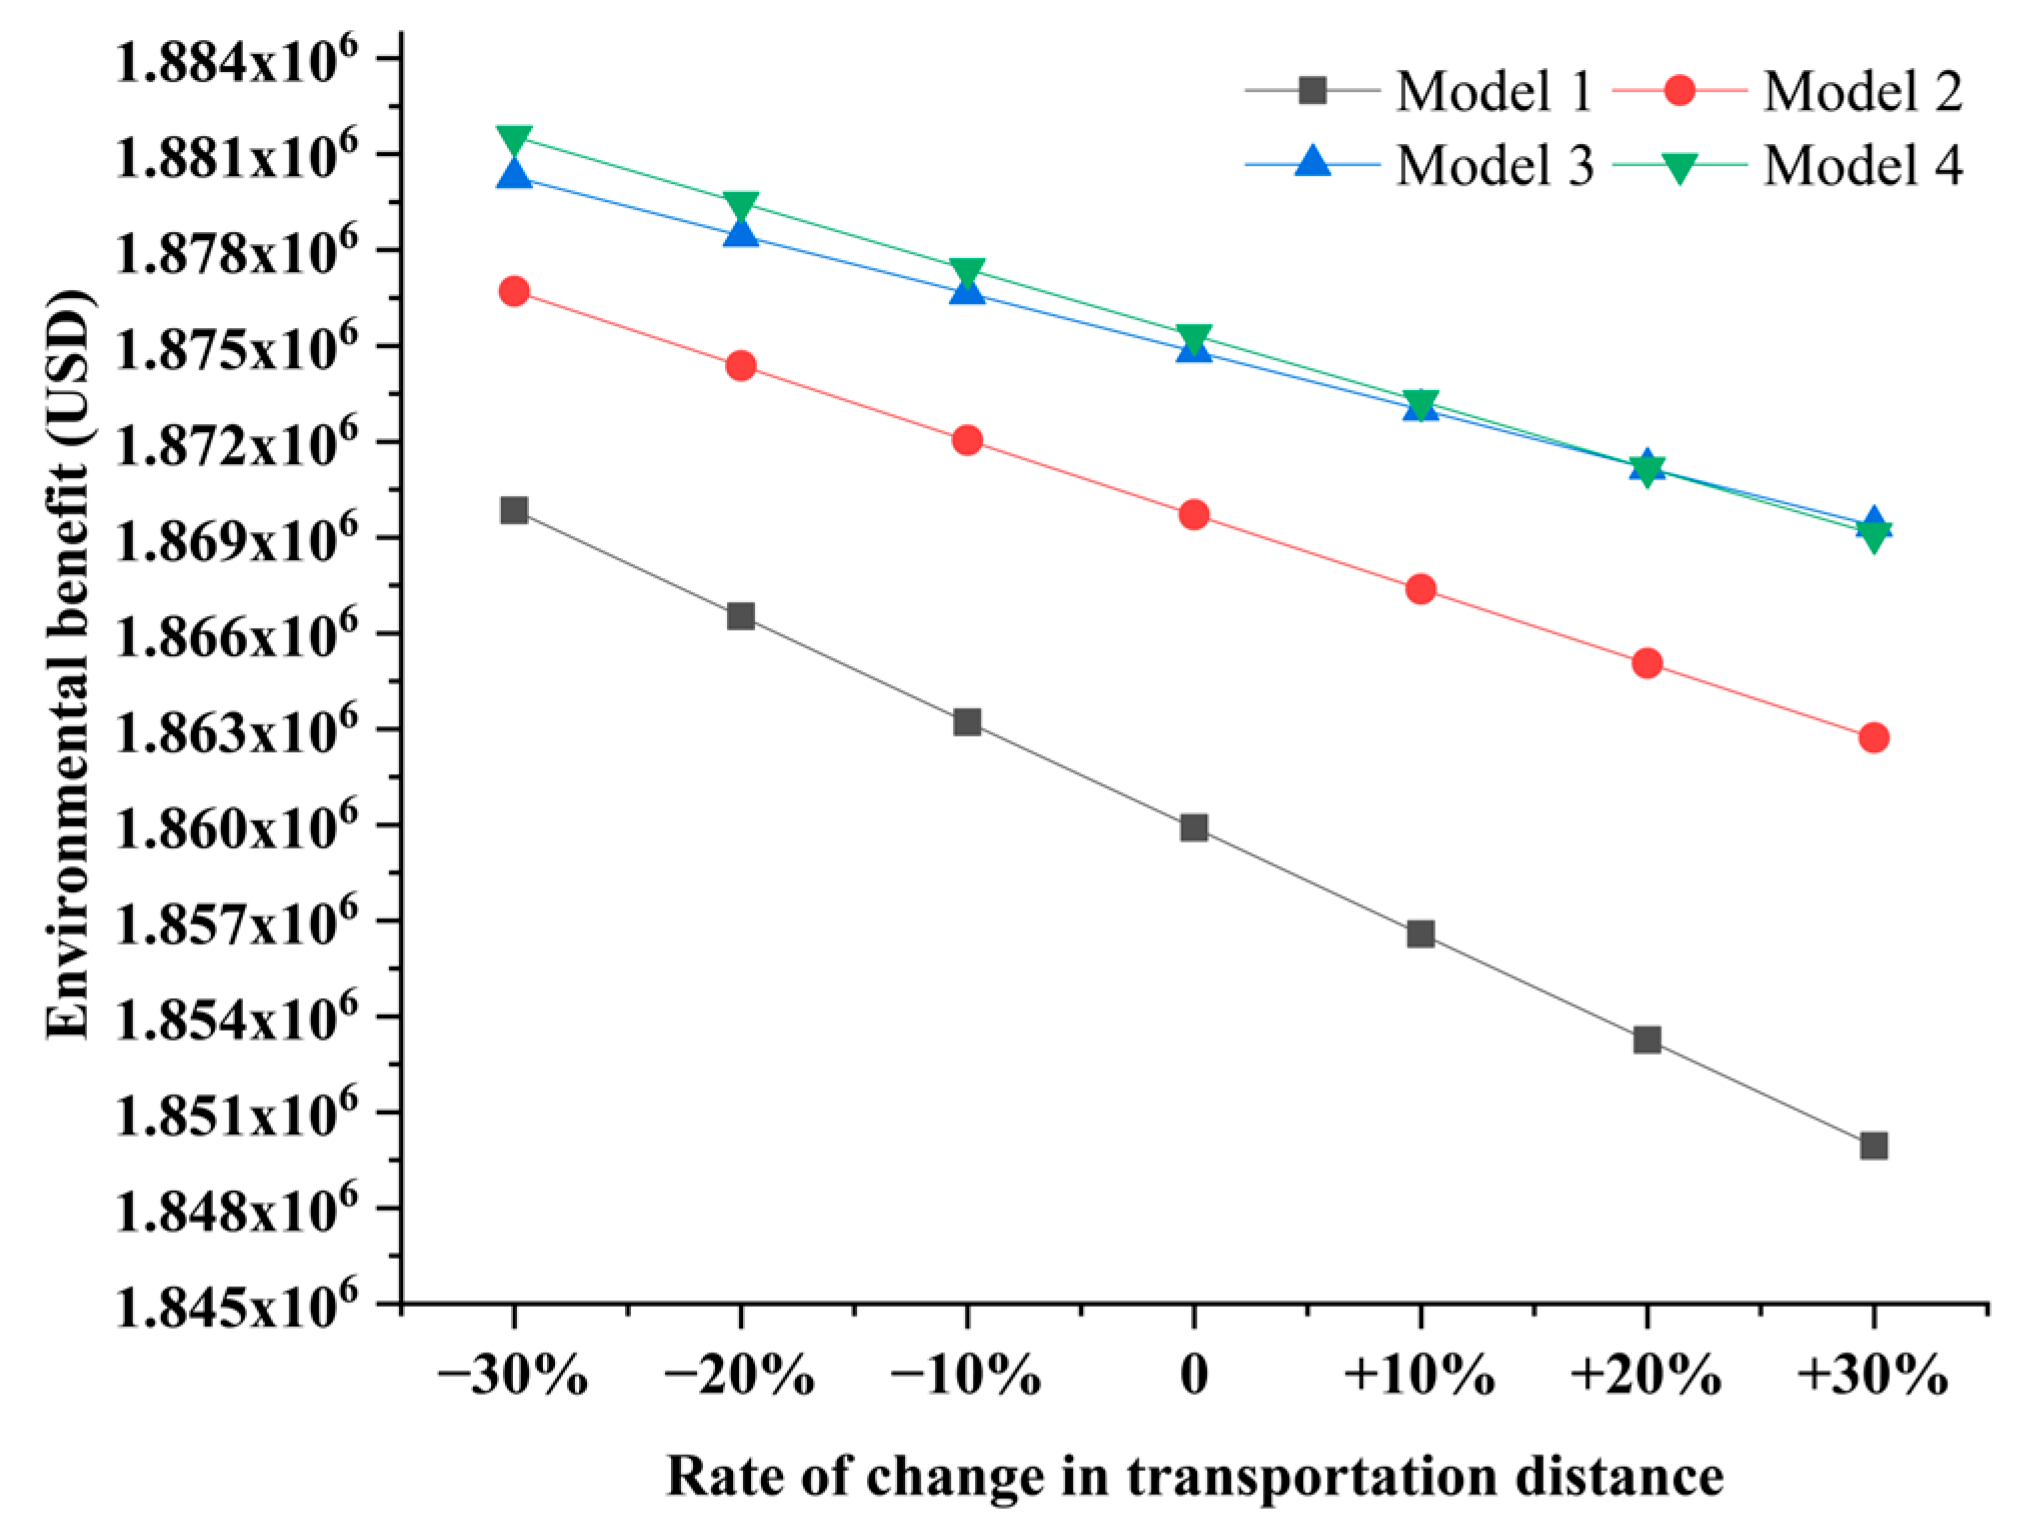
The emission of pollutants during the transport stage is significantly higher compared to that during the collection and storage phase. This indicates that transport plays a critical role in the system performance. These emissions mainly come from the energy consumption of transport vehicles. When the type of transport tool is fixed, the transport distance becomes the dominant factor affecting the system emissions. Therefore, the impact of transport distance on the environmental benefits of straw power generation is evaluated here. The results are presented in Figure 7.
It can be seen that an increase in transport distance reduces the environmental benefit of the straw power generation system. However, there are large differences among the four models. Under Model 1, the environmental benefit decreases rapidly as the transportation distance increases. This is because this mode uses agricultural tractors for direct transport. The transport efficiency of such an instrument is low, and changes in transport distance have a large impact on environmental benefits. Model 3 is minimally affected by the transport distance. Because straw is the most efficiently transported in this mode, the change in transport distance has a slight effect on the environmental benefit.

4.3. The Impact of Dust Removal Technology

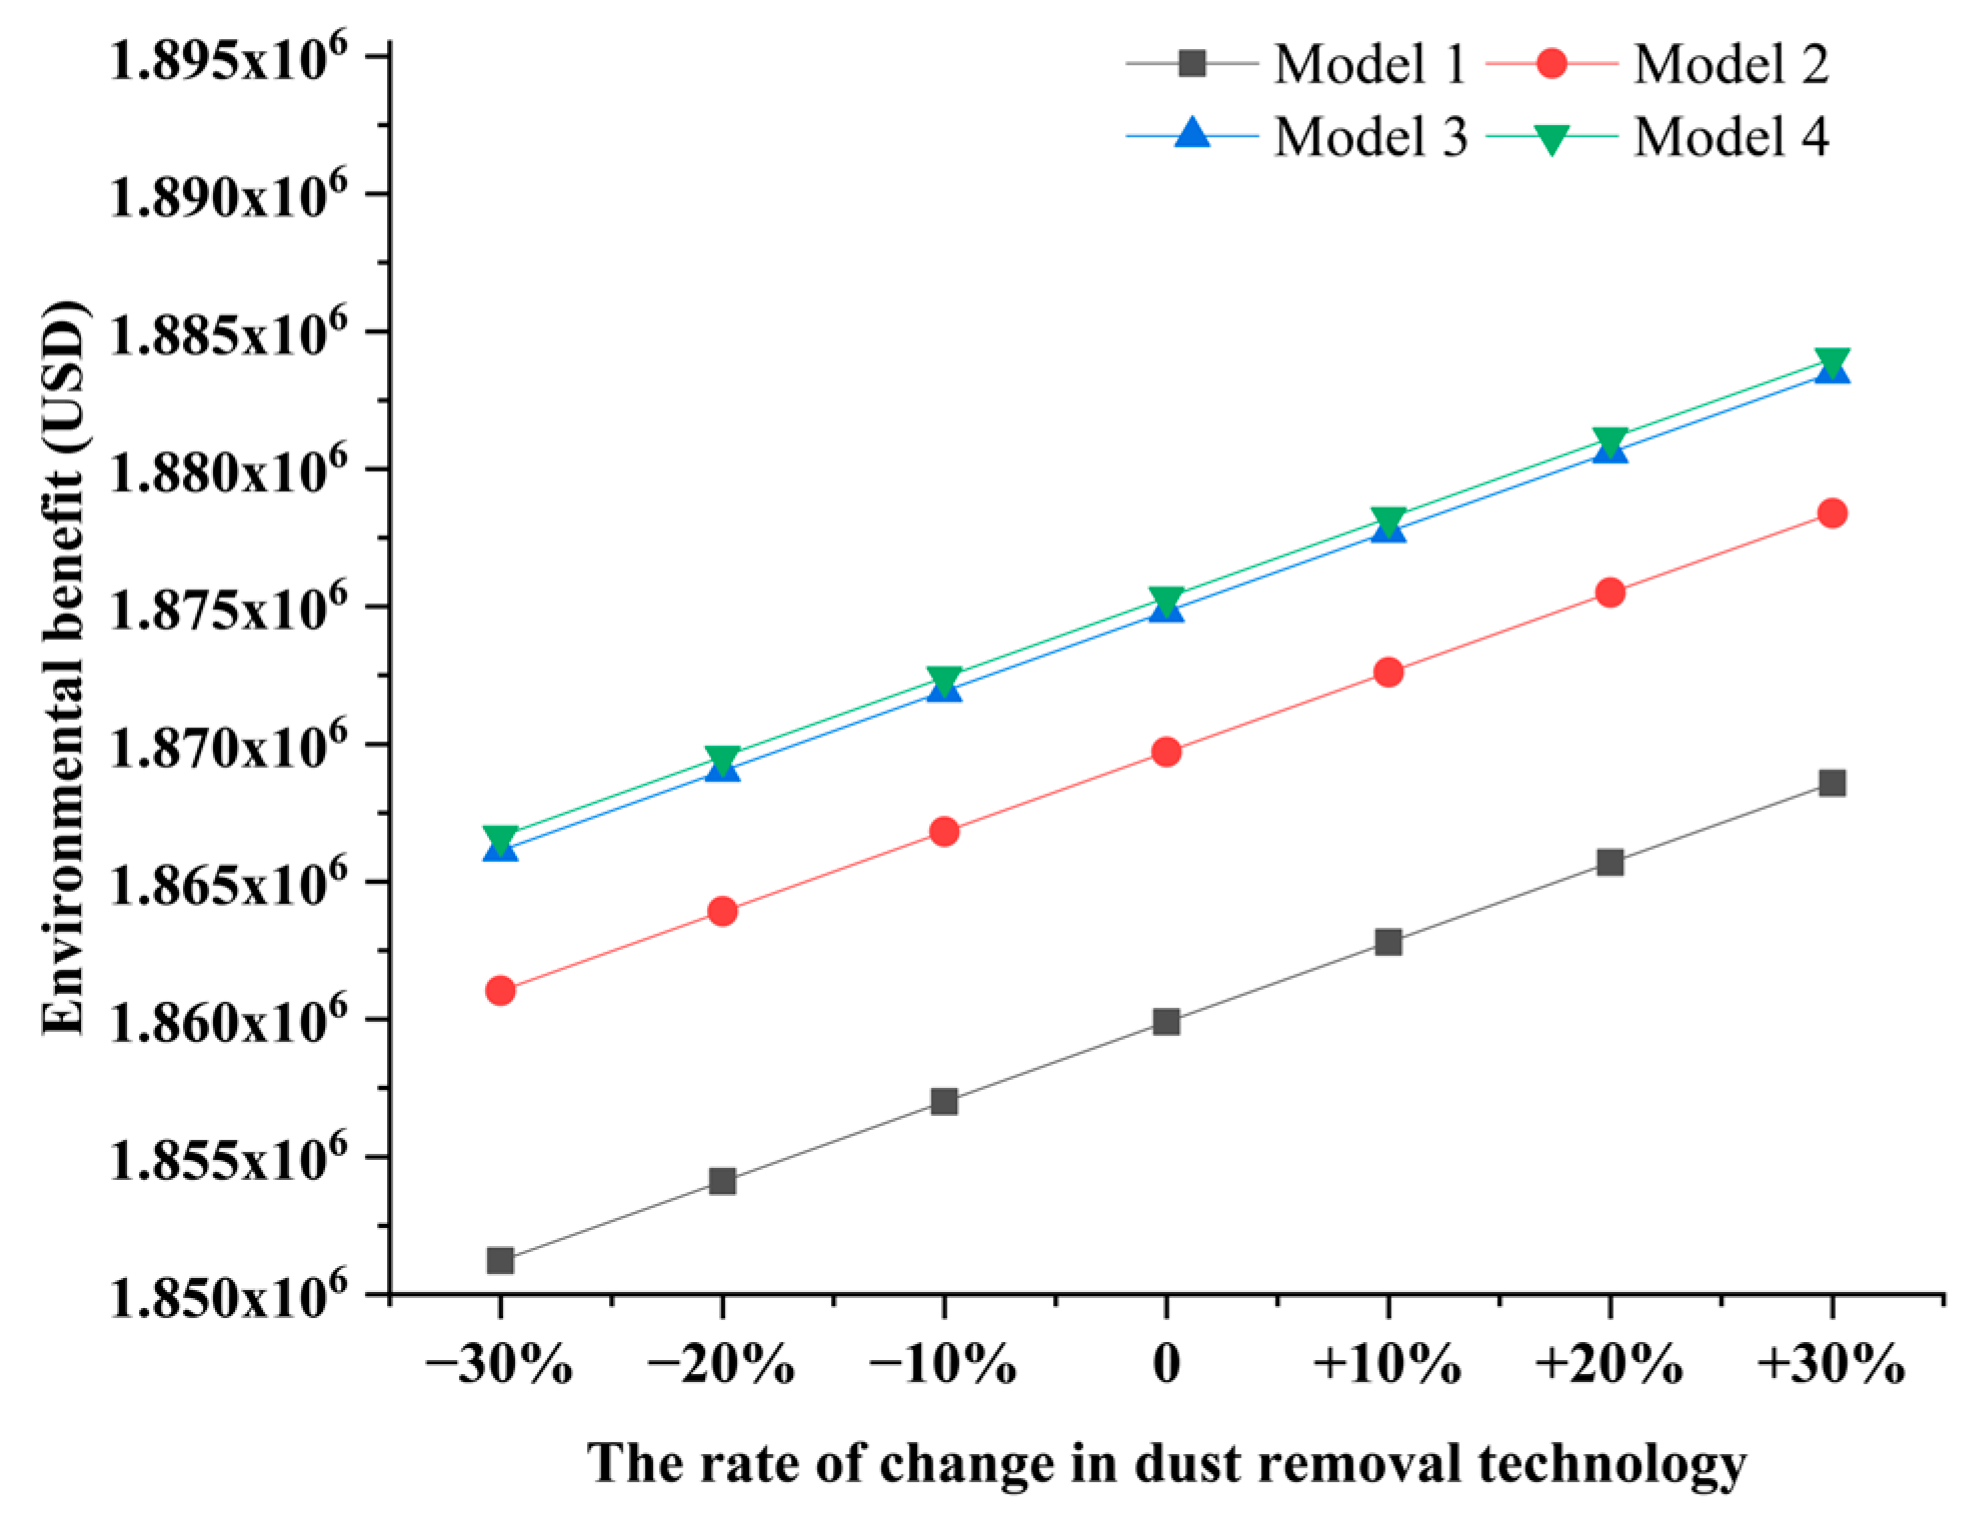
Pollutant emissions during the straw power generation stage primarily originate from boiler combustion. Due to the variety of dust removal techniques available, pollutant emissions vary widely. The multistage dust removal technology used by power plants can reduce pollutant emissions, but it increases operational costs. However, improvements in dust removal technology can increase the environmental benefits of straw power generation enterprises. Therefore, this study analyzes the impact of changes in dust removal technology on the environmental benefit. The results are presented in Figure 8.
As shown in Figure 8, the environmental benefits of the power generation system have progressively increased with the advancement of dust removal technology. This is because improvements in dust removal technology have reduced the emission of pollutants. Furthermore, the four straw power generation supply chain models exhibit consistent variation patterns. This is because the pollutant emission and treatment conditions are the same during the straw burning power generation phase.

4.4. The Impact of Pollutant Charging Standards

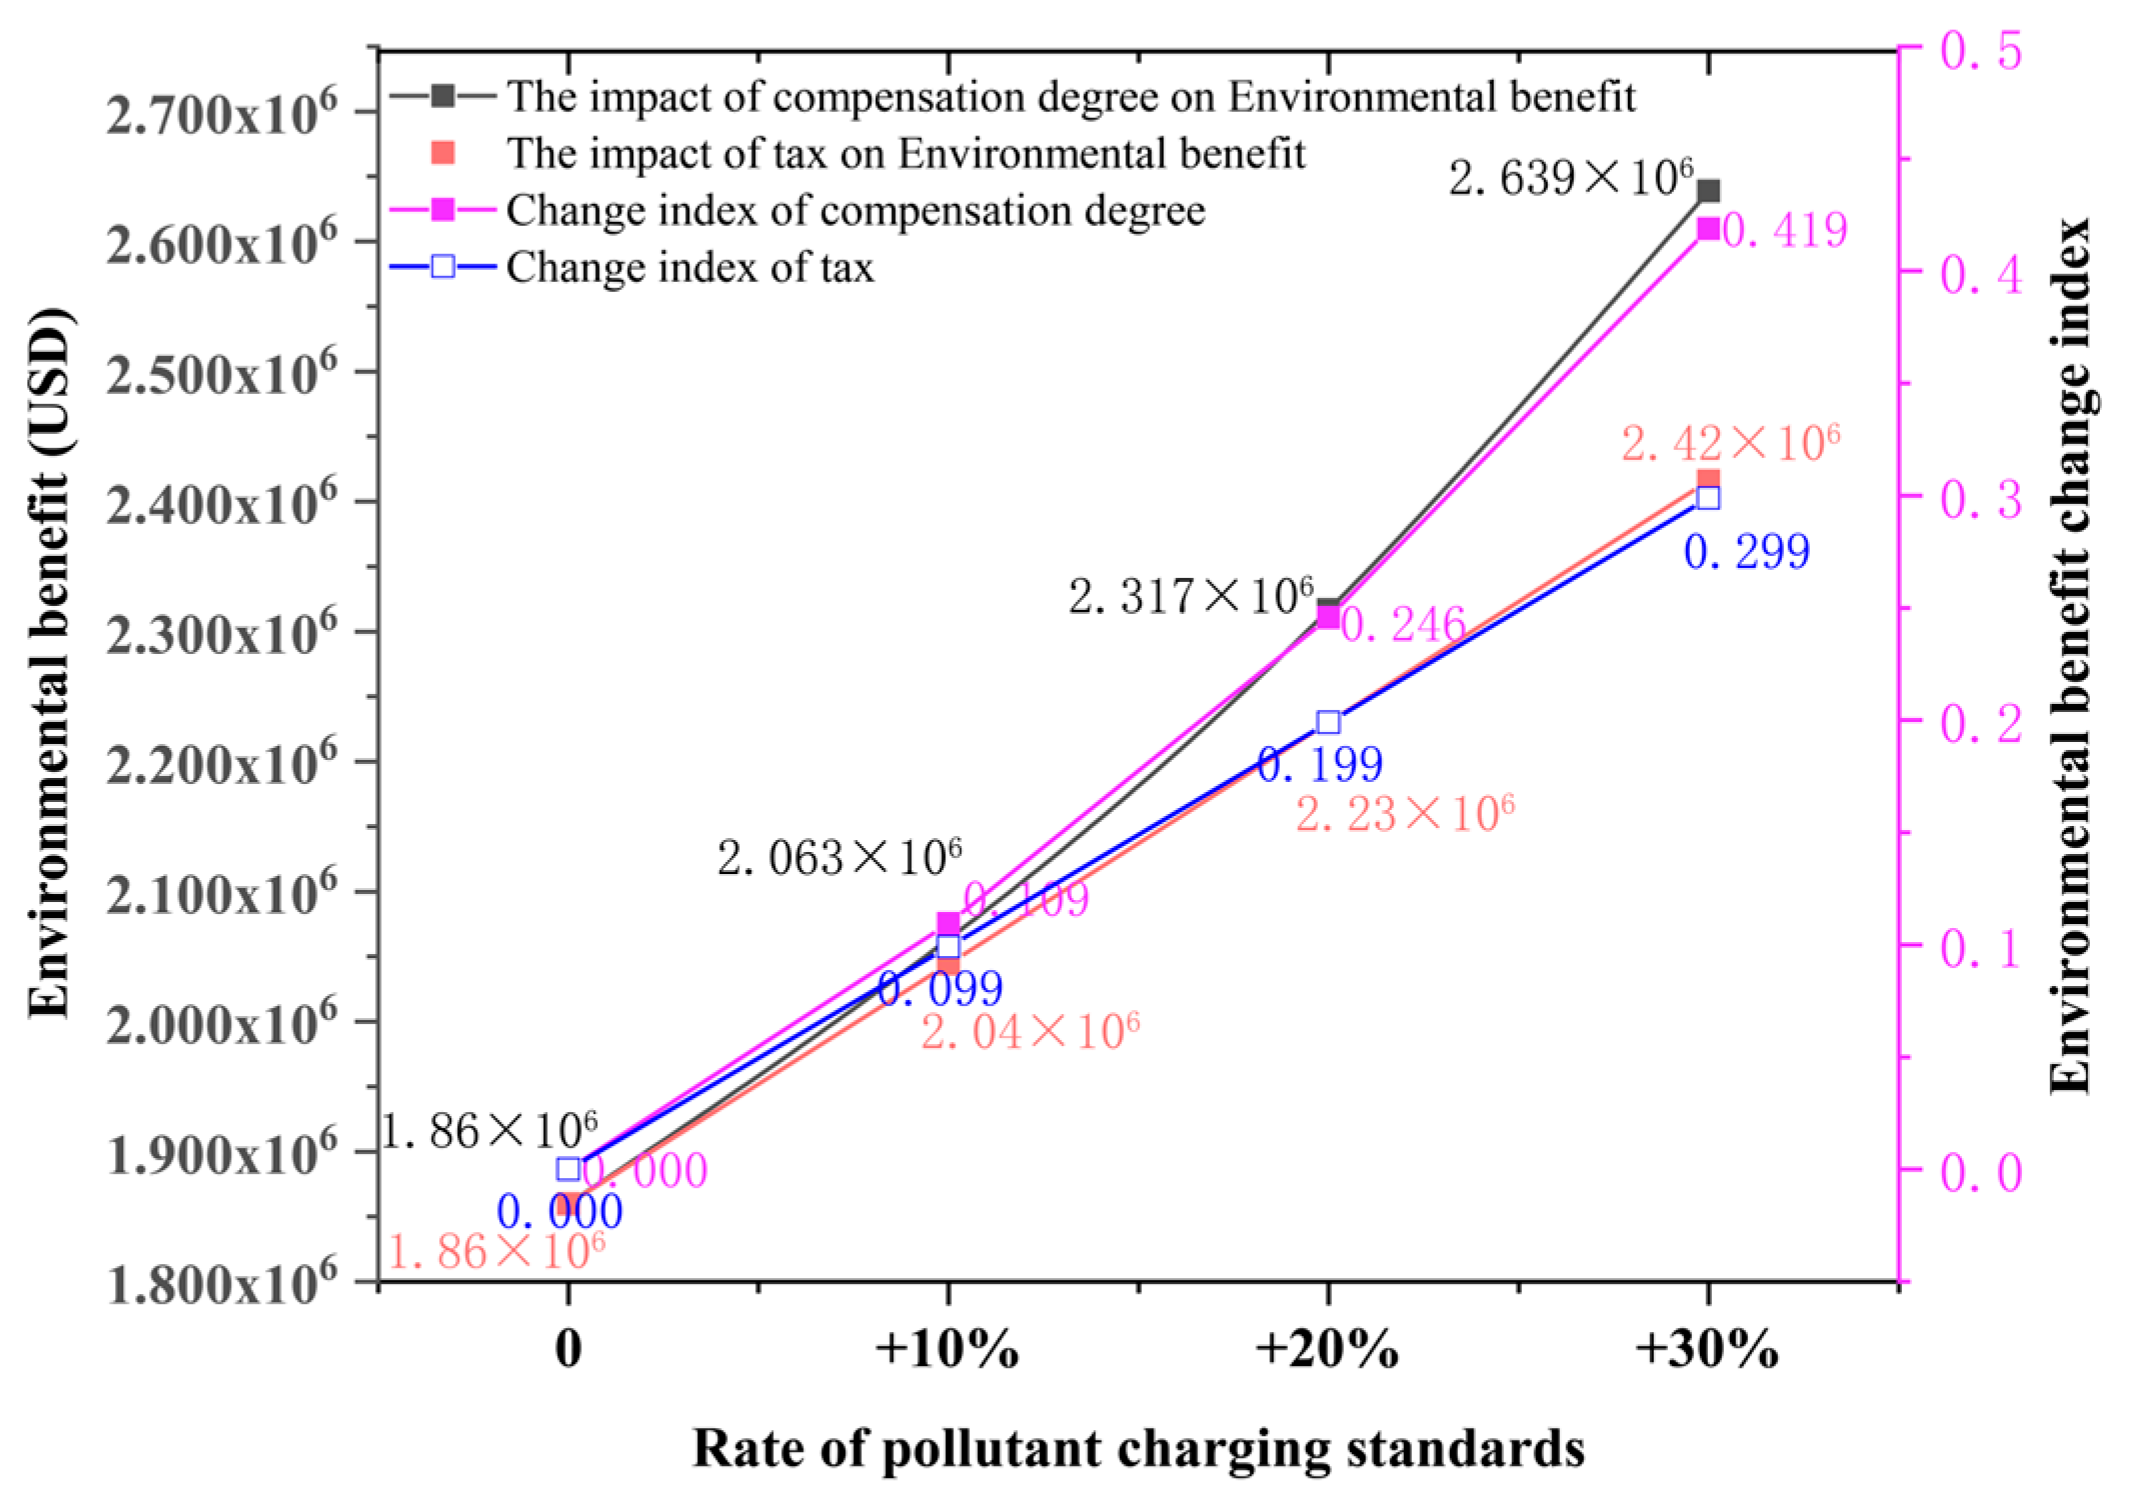
The environmental monetization cost coefficient for pollutants in this study is determined by the environmental protection tax rate and the ecological compensation degree. To clarify the impact of these factors on the environmental benefits of the straw power generation system, a sensitivity analysis was performed. The results are shown in Figure 9.
Figure 9 illustrates that increasing the degree of taxation or compensation leads to greater environmental benefits for the straw power supply chain system. However, the degree of compensation has a greater impact on the environmental benefits of the system than the tax. The impact of taxation on environmental benefits follows a linear relationship. The effect of the degree of compensation on the environmental benefits follows a nonlinear relationship. The greater the increase in compensation degree, the greater the change in the environmental benefits. This indicates that the compensation degree is more sensitive to a change in the environmental benefit of the system.

4.5. The Impact of Energy Efficiency

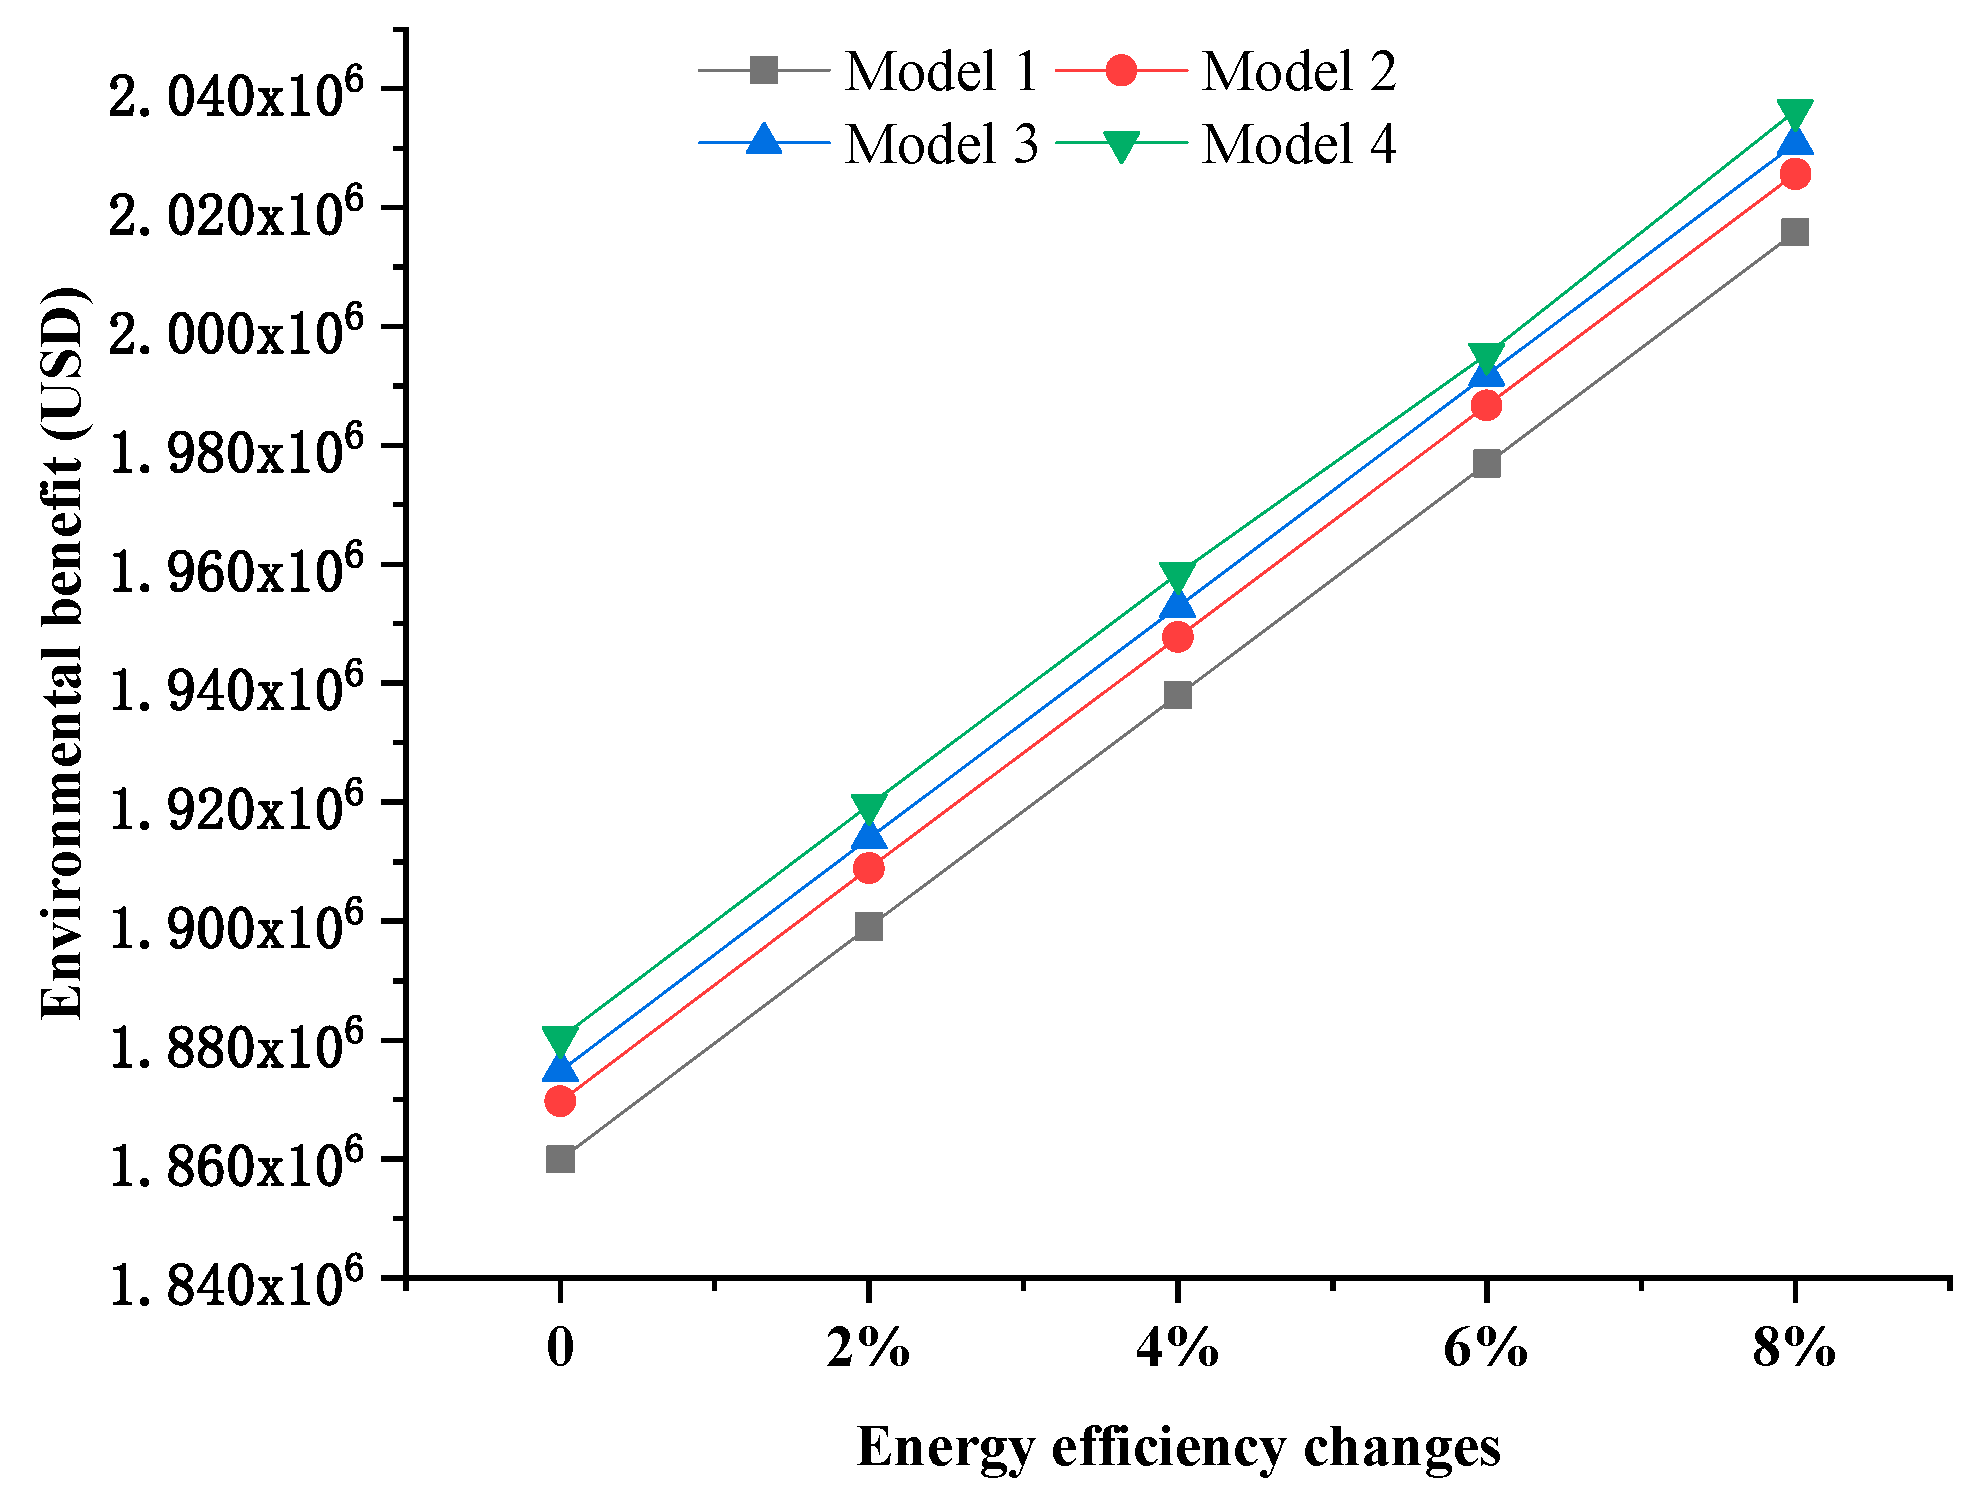
In case analysis, 1.4 kg of straw can replace 0.123 kg of coal. As power generation technology advances, the efficiency of energy utilization will increase. This means that straw can replace the extra coal resources. Therefore, this study analyzes the impact of increasing the energy utilization rate on the environmental benefits of the straw power generation system. The results are shown in Figure 10. It can be seen that, as the energy efficiency of straw generation increases, its environmental benefits are gradually increasing. This is because, the higher the power generation efficiency of straw, the more the electricity that can be produced. Thus, it can replace a larger proportion of coal in the power system.

4.6. The Impact of the Distribution Coefficient of the Straw Environmental Burden

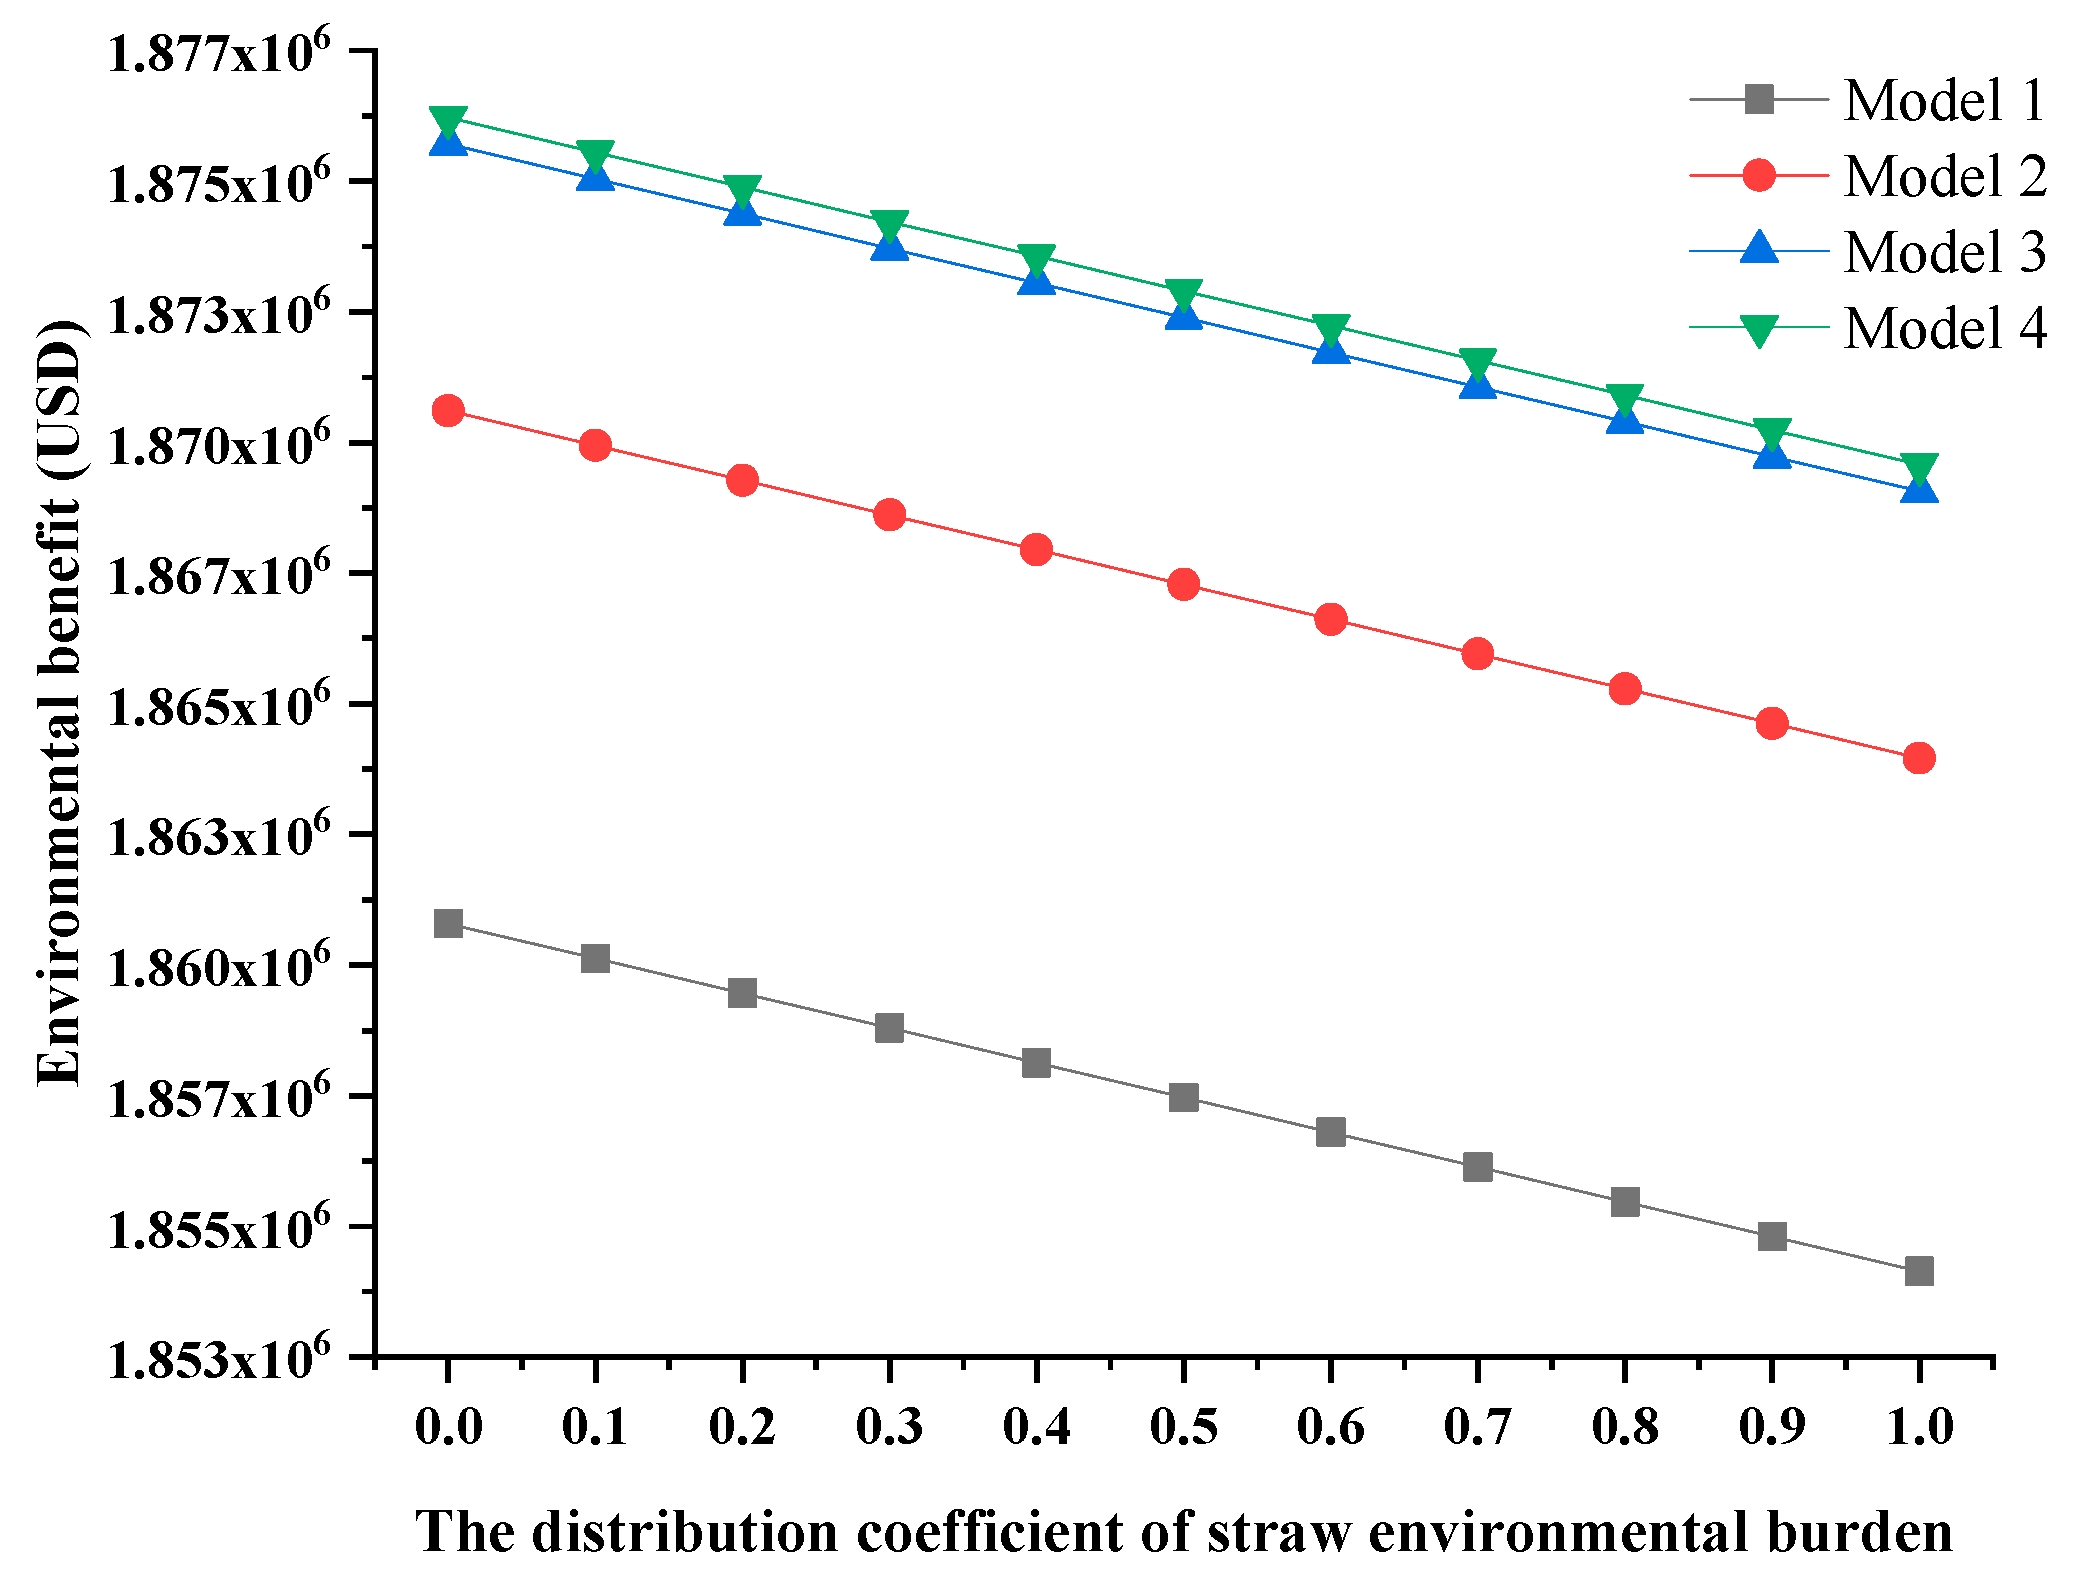
The distribution coefficient of the environmental burden associated with straw affects the calculation of pollutant emissions during the planting stage. In addition, it impacts the assessment of the environmental benefits derived from replacing coal-fired power with straw. In this study, the environmental burden distribution coefficient of straw was assumed to be 0.1. To elucidate the impact of the environmental burden distribution coefficient of the environmental benefits, various environmental burden distribution coefficients were examined. The results are presented in Figure 11.
A comparative analysis was conducted on the environmental benefits of substituting coal with straw under varying distribution coefficients. The findings revealed that, as the environmental burden coefficient increased, the environmental benefits gradually decreased. This is because an increase in the environmental burden distribution coefficient causes more pollution to be included in the environmental assessment, resulting in an increase in the overall environmental cost of straw power generation. As a result, the overall environmental cost of straw power generation increases, resulting in a decrease in environmental benefits.

5. Conclusions

To assess the environmental benefits of replacing coal-fired power generation with straw, this study developed an environmental benefit assessment model based on the life cycle assessment method and the monetization cost of pollutants. The pollutant emission reduction results for coal-fired power generation with straw were evaluated. The concept of the environmental monetization cost of pollutants was then introduced to analyze the environmental cost of the system. Finally, the environmental benefits of replacing coal with straw are investigated under the assumptions of this study. Four supply chain modes of straw power generation were studied. The results show that straw power generation has greater potential for emission reduction and higher environmental benefits. The study also noted that the environmental benefits of the straw power supply chain under the manual collection model are the largest. From the analysis of the emission results, it can be seen that straw transport and combustion power generation are the major discharge processes of pollutants, accounting for more than 50%. In the sensitivity analysis of the environmental benefits, the results suggest that fertilizer use and transport distance are negatively correlated with the environmental benefits of the system. Dust removal technology, pollutant charge standards and energy efficiency are positively correlated with the environmental benefits. This study provides a fresh perspective on the environmental benefit assessment of biomass power generation. The results can promote the sustainable development of the biomass power generation industry.
The study also has some limitations. The process of the operation of the supply chain was simplified in the construction of the environmental benefit assessment model. The supply behavior of straw feed has been found to be more complex. Farmers not only use tractors and trucks for transport but also use smaller tools. This study assumes that the four straw power supply chain models operate independently. But in the production process, there are several modes of straw supply operating simultaneously. Therefore, future research can incorporate the actual situation of straw supply and refine the supply chain model. On the other hand, the carbon trading markets can be used as a research focus for pollutant monetization. The environmental benefits of replacing coal-fired electricity generation with straw can be studied in terms of the market economy of carbon reduction.

Author Contributions

Conceptualization, Z.W. and J.L.; methodology, Z.W. and B.L.; software, H.G.; validation, Z.W., B.L., and H.G.; formal analysis, B.L.; investigation, B.L.; resources, G.X.; data curation, Z.W. and B.L.; writing—original draft preparation, Z.W. and B.L.; writing—review and editing, Z.W. and B.L.; visualization, G.X.; supervision, H.G. and J.L.; project administration, Z.W. and J.L.; funding acquisition, Z.W. All authors have read and agreed to the published version of the manuscript.

Funding

This study was supported by the Natural Science Foundation of Henan Province (Grant No: 252300420852).

Data Availability Statement

The original contributions presented in the study are included in the article. Further inquiries can be directed to the corresponding author.

Conflicts of Interest

The authors declare no conflicts of interest.

References

  1. Onochie, U.P.; Ofomatah, A.C.; Owamah, H.I.; Ikpeseni, S.C.; Onwusa, S.C.; Erokare, T.E.; Orugba, H.O. Assessment of the compatibility of biomass-coal blends for cleaner energy utilization and sustainable development. Biomass Convers. Biorefinery 2025, 15, 7421–7434. [Google Scholar] [CrossRef]
  2. Liu, S.; Song, X.; Jiang, D.; Shen, Q.; Shang, L.; Men, D.; Wei, W.; Sun, N. To convert or not to convert: A comparative techno-economic analysis on CO2-to-methanol and CO2-EOR. Appl. Energy 2025, 388, 125698. [Google Scholar] [CrossRef]
  3. Guo, J.-X.; Tan, X.; Gu, B.; Zhu, K. Integration of supply chain management of hybrid biomass power plant with carbon capture and storage operation. Renew. Energy 2022, 190, 1055–1065. [Google Scholar] [CrossRef]
  4. Zhao, G.; Jiang, P.; Zhang, H.; Li, L.; Ji, T.; Mu, L.; Lu, X.; Zhu, J. Mapping out the regional low-carbon and economic biomass supply chain by aligning geographic information systems and life cycle assessment models. Appl. Energy 2024, 369, 123599. [Google Scholar] [CrossRef]
  5. Mao, J.; Zhou, Y.; Shan, L.; Cheng, J. Optimization of straw supply chain considering carbon emissions, supply uncertainty and facility disruption risk. Environ. Dev. Sustain. 2024, 28, 4855–4889. [Google Scholar] [CrossRef]
  6. Gao, J.; Wang, Z.F.; Wang, Z.W.; Wang, C.; Zhang, R.K.; Xu, G.Y.; Wu, X. Macro-site selection and obstacle factor extraction of biomass cogeneration based on comprehensive weight method of Game theory. Energy Rep. 2022, 8, 14416–14427. [Google Scholar] [CrossRef]
  7. Chen, A.; Liu, Y. Designing globalized robust supply chain network for sustainable biomass-based power generation problem. J. Clean. Prod. 2023, 413, 137403. [Google Scholar] [CrossRef]
  8. Chen, G.; Li, Q.; Peng, F.; Karamian, H.; Tang, B. Henan Ecological Security Evaluation Using Improved 3D Ecological Footprint Model Based on Emergy and Net Primary Productivity. Sustainability 2019, 11, 1353. [Google Scholar] [CrossRef]
  9. Costa, M.; Piazzullo, D.; Di Battista, D.; De Vita, A. Sustainability assessment of the whole biomass-to-energy chain of a combined heat and power plant based on biomass gasification: Biomass supply chain management and life cycle assessment. J. Environ. Manag. 2022, 317, 115434. [Google Scholar] [CrossRef] [PubMed]
  10. Huang, Y.; Zhao, Y.J.; Hao, Y.H.; Wei, G.Q.; Feng, J.; Li, W.Y.; Yi, Q.; Mohamed, U.; Pourkashanian, M.; Nimmo, W. A feasibility analysis of distributed power plants from agricultural residues resources gasification in rural China. Biomass Bioenergy 2019, 121, 1–12. [Google Scholar] [CrossRef]
  11. Yi, Q.; Zhao, Y.; Huang, Y.; Wei, G.; Hao, Y.; Feng, J.; Mohamed, U.; Pourkashanian, M.; Nimmo, W.; Li, W. Life cycle energy-economic-CO2 emissions evaluation of biomass/coal, with and without CO2 capture and storage, in a pulverized fuel combustion power plant in the United Kingdom. Appl. Energy 2018, 225, 258–272. [Google Scholar] [CrossRef]
  12. Reaño, R.L.; de Padua, V.A.N.; Halog, A.B. Energy efficiency and life cycle assessment with system dynamics of electricity production from rice straw using a combined gasification and intemal combustion engine. Energies 2021, 14, 4942. [Google Scholar] [CrossRef]
  13. Sun, Y.F.; Wang, Y.P.; Yang, B.; Zheng, Z.P.; Wang, C.; Chen, B.; Li, S.L.; Ying, J.L.; Liu, X.P.; Chen, L.; et al. Emergy evaluation of straw collection, transportation and storage system for power generation in China. Energy 2021, 231, 120792. [Google Scholar] [CrossRef]
  14. Singh, A.; Basak, P. Economic and environmental evaluation of rice straw processing technologies for energy generation: A case study of Punjab, India. J. Clean. Prod. 2019, 212, 343–352. [Google Scholar] [CrossRef]
  15. Xu, J.; Liu, Z.; Dai, J. Environmental and economic trade-off-based approaches towards urban household waste and crop straw disposal for biogas power generation project-a case study from China. J. Clean. Prod. 2021, 319, 128620. [Google Scholar] [CrossRef]
  16. Wu, J.J.; Zhang, J.; Yi, W.M.; Cai, H.Z.; Li, Y.; Su, Z.P. Agri-biomass supply chain optimization in north China: Model development and application. Energy 2022, 239, 122374. [Google Scholar] [CrossRef]
  17. Banaś, J.; Utnik-Banaś, K.; Zięba, S. Optimizing Biomass Supply Chains to Power Plants under Ecological and Social Restrictions: Case Study from Poland. Energies 2024, 17, 3136. [Google Scholar] [CrossRef]
  18. Wang, S.; Yin, C.; Jiao, J.; Yang, X.; Shi, B.; Richel, A. StrawFeed model: An integrated model of straw feedstock supply chain for bioenergy in China. Resour. Conserv. Recycl. 2022, 185, 17. [Google Scholar] [CrossRef]
  19. Cao, J.; Pang, B.; Mo, X.; Xu, F. A new model that using transfer stations for straw collection and transportation in the rural areas of China: A case of Jinghai, Tianjin. Renew. Energy 2016, 99, 911–918. [Google Scholar] [CrossRef]
  20. Wang, Z.W.; Wang, Z.F.; Xu, G.Y.; Ren, J.Z.; Wang, H.; Li, J. Sustainability assessment of straw direct combustion power generation in China: From the environmental and economic perspectives of straw substitute to coal. J. Clean. Prod. 2020, 273, 122890. [Google Scholar] [CrossRef]
  21. Li, L.; Wang, Z.; He, D. U-Net Semantic Segmentation-Based Calorific Value Estimation of Straw Multifuels for Combined Heat and Power Generation Processes. Energies 2024, 17, 5143. [Google Scholar] [CrossRef]
  22. Harun, S.N.; Hanafiah, M.M.; Noor, N.M. Rice Straw Utilisation for Bioenergy Production: A Brief Overview. Energies 2022, 15, 5542. [Google Scholar] [CrossRef]
  23. Sun, Y.; Cai, W.; Chen, B.; Guo, X.; Hu, J.; Jiao, Y. Economic analysis of fuel collection, storage, and transportation in straw power generation in China. Energy 2017, 132, 194–203. [Google Scholar] [CrossRef]
  24. Roni, M.S.; Eksioglu, S.D.; Searcy, E.; Jha, K. A supply chain network design model for biomass co-firing in coal-fired power plants. Transp. Res. Part E Logist. Transp. Rev. 2014, 61, 115–134. [Google Scholar] [CrossRef]
  25. Turki, S.; Didukh, S.; Sauvey, C.; Rezg, N. Optimization and Analysis of a Manufacturing-Remanufacturing-Transport-Warehousing System within a Closed-Loop Supply Chain. Sustainability 2017, 9, 561. [Google Scholar] [CrossRef]
  26. Yang, Y.; Liang, S.; Yang, Y.; Xie, G.H.; Zhao, W. Spatial disparity of life-cycle greenhouse gas emissions from corn straw-based bioenergy production in China. Appl. Energy 2022, 305, 117854. [Google Scholar] [CrossRef]
  27. Liu, Y.; Huang, J.; Wang, W.; Sheng, G.; Wang, S.; Wu, J.; Li, J. Evaluating the sustainability of demand oriented biogas supply programs under different flexible hierarchies: A suggested approach based on the triple bottom line principle. Sci. Total Environ. 2023, 895, 165047. [Google Scholar] [CrossRef] [PubMed]
  28. Sastre, C.M.; González-Arechavala, Y.; Santos-Montes, A. Global warming and energy yield evaluation of Spanish wheat straw electricity generation—A LCA that takes into account parameter uncertainty and variability. Appl. Energy 2015, 154, 900–911. [Google Scholar] [CrossRef]
  29. Guo, J.X.; Zhu, K. Operation management of hybrid biomass power plant considering environmental constraints. Sustain. Prod. Consum. 2022, 29, 1–13. [Google Scholar] [CrossRef]
  30. Sokrethya, S.; Aminov, Z.; Van Quan, N.; Xuan, T.D. Feasibility of 10 MW Biomass-Fired Power Plant Used Rice Straw in Cambodia. Energies 2023, 16, 651. [Google Scholar] [CrossRef]
  31. Huang, X.; Ji, L.; Xie, Y.; Luo, Z. Robust optimization of regional biomass supply chain system design and operation with data-driven uncertainties. Food Bioprod. Process. 2025, 149, 176–189. [Google Scholar] [CrossRef]
  32. Mao, J.; Zhang, S.; Liu, J. Straw Logistics Network Optimization Considering Cost Importance and Carbon Emission under the Concept of Sustainable Development. Sustainability 2024, 16, 6235. [Google Scholar] [CrossRef]
  33. ISO 14040:2006; Environmental management—Life cycle assessment—Principles and framework. ISO: Geneva, Switzerland, 2006.
  34. Zhang, H.; Gao, X.; Wang, H.; Wang, Z.; Qu, Q. Study on supply chain mode of straw power generation based on life cycle evaluation. J. Henan Agric. Univ. 2024, 58, 663–673. (In Chinese) [Google Scholar]
  35. Wang, Z.F.; Ren, J.Z.; Goodsite, M.E.; Xu, G.Y. Waste-to-energy, municipal solid waste treatment, and best available technology: Comprehensive evaluation by an interval-valued fuzzy multi-criteria decision making method. J. Clean. Prod. 2018, 172, 887–899. [Google Scholar] [CrossRef]
  36. MEEPRC. Environmental Protection Tax Law of the People’s Republic of China. 2018. Available online: https://www.mee.gov.cn/ywgz/fgbz/fl/201811/t20181114_673632.shtml (accessed on 8 June 2025). (In Chinese)
  37. He, J. Environmental tax legislation from the perspective of value. Law 2016, 8, 83–91. (In Chinese) [Google Scholar]
  38. Wang, B.; Song, J.; Ren, J.; Li, K.; Duan, H.; Wang, X.E. Selecting sustainable energy conversion technologies for agricultural residues: A fuzzy AHP-VIKOR based prioritization from life cycle perspective. Resour. Conserv. Recycl. 2019, 142, 78–87. [Google Scholar] [CrossRef]
Figure 1. Boundary of the supply chain system.
Energies 19 01537 g001
Figure 2. Proportions of pollutant emissions at different stages.
Energies 19 01537 g002
Figure 3. Pollutant emissions of different supply chain models.
Energies 19 01537 g003
Figure 4. Comparison results of pollutant emissions from two power generation methods.
Energies 19 01537 g004
Figure 5. Environmental benefit of straw power generation under different models.
Energies 19 01537 g005
Figure 6. The impact of the fertilizer application rate on the environmental benefit.
Energies 19 01537 g006
Figure 7. The impact of transport distance on the environmental benefit.
Energies 19 01537 g007
Figure 8. Impact of dust removal technology on the environmental benefit.
Energies 19 01537 g008
Figure 9. The impact of pollutant charging standards.
Energies 19 01537 g009
Figure 10. The impact of energy efficiency.
Energies 19 01537 g010
Figure 11. The impact of the distribution coefficient of the straw environmental burden.
Energies 19 01537 g011
Table 1. Comparison of related research methods.
MethodLife Cycle Assessment
(LCA)
[27,28,29]
Life Cycle Cost
(LCC)
[18,19,23]
Techno-Economic Analysis
(TEA)
[20,26]
The Environmental Benefit Model Based on LCA
(This Study)
Core positioningEnvironmental impact assessment tools.Life cycle cost accounting tools.Comprehensive technical and economic feasibility.Economic losses caused by pollutant emissions.
Evaluation perspectiveEnvironmental dimension.Economic cost dimension.Technical feasibility + economic efficiency.Environment + Economy.
System boundaryThe life cycle (from cradle to grave), focusing on pollutant emissions.The entire life cycle,
focusing on cost flow.
Flexible setting (focusing on the overall project/technology, not necessarily strictly following the entire life cycle).The entire life cycle, focusing on the environmental monetization cost of pollutants.
IndicatorGlobal warming potential, acidification, eutrophication, energy consumption, water consumption, environmental load, etc.Initial investment, operating costs, maintenance costs, disposal costs, total costs, etc.Net Present Value (NPV), Internal Rate of Return (IRR), Payback Period, Cost, Capacity, Efficiency, etc.The environmental costs of pollutant emissions, environmental governance costs, environmental protection costs, environmental benefits, etc.
PurposeIdentify pollutant emissions and reduce environmental impact.Identify the economic performance of the system and reduce the total life cycle cost.Assess whether a technology/project is worth investing in, scaling up, and industrializing.Clarify the monetized benefits of reducing environmental damage through the substitution of traditional energy with new energy.
Table 2. The stages of the straw power generation supply chain.
StageNameFunction IntroductionPrimary Material Input
1Planting StagePrimarily produce straw resources Agrochemicals, electricity for irrigation
2Collection StageBale and collect strawCollecting tools, fossil energy
3Transportation StageTransport straw to biomass power generation enterprises Tractors/trucks, fossil energy
4Storage StageShort-term storage and management of collected strawStorage energy consumption, forklifts, fossil energy
5Power generation stageConvert the biomass energy of straw into electricityElectricity, forklifts, fuel
Table 3. System parameters.
ParametersValueUnit
Pesticide CO2 emission factor4.93kg·kg −1
Fertilizer CO2 emission factor0.896kg·kg −1
Pesticide application amount24.2kg·hm−1
Fertilizer application amount298.82kg·hm−1
Electricity irrigation power2kW
The distribution coefficient of straw environmental burden0.1/
Tractor transportation fuel consumption0.136L·t−1·km−1
Tractor baling transportation fuel consumption rate0.101L·t−1·km−1
Large truck transportation fuel consumption rate0.053L·t−1·km−1
Fuel consumption of the baling machine7.5L·hm−1
Straw yield of unit field15t·hm−1
Energy consumption coefficient for crushing and conveying within the factory0.021kWh·kg−1
Irrigation time10 h·hm−1
The average distance of straw transported by forklift at the storage point0.5km
Average transport distance of forklift within the power plant1km
Fuel consumption coefficient of forklifts0.04 L·t−1·km−1
Table 4. The monetized cost coefficient of pollutants.
PollutantsPollutant Equivalent Value (kg)Charging Standards (USD/kg)Degree of Compensation (%)Monetized Cost Coefficient (USD/kg)
CO2/0.0001250.0006
SO20.950.1828250.7311
PM102.180.0796250.3186
NOX0.950.1828250.7311
Note: The data is calculated indirectly based on the benchmark tax rate stipulated in China’s “Environmental Protection Tax Law”. Charging standard = tax amount/pollutant equivalent value.
Table 5. Pollutant emission coefficients.
TypeCO2SO2PM10NOxReferences
Electric irrigation (g·kwh−1)6109.9320.26.46[34]
Baling machinery (g·L−1)2616.640.5885.19934.988[20]
Agricultural tractor (g·L−1)2664.460.5761.48644.4[20]
Large truck (g·L−1)2616.640.5880.19934.988[20]
Forklift loading (g·L−1)1308.310.2940.09919.794[34]
Straw power generation (g·kg−1)/40823642604[20]
Coal mining (g·kg−1)5000.02150.37[20]
Coal transportation (g·kg−1)14.8490.00450.003734.988[20]
Coal combustion (g·kg−1)105.0873.2490.0120.27[20]
Table 6. Emission quantities of pollutants at different stages (unit: t).
ModelStageCO2SO2PM10NOx
Model 1Planting515.600.030.060.02
Collecting260.620.060.523.48
Transportation2421.020.521.3540.34
Power generation10.516.8039.3943.54
Model2Planting515.600.030.060.02
Collecting260.620.060.523.48
Transportation-a538.000.120.308.97
Storage5.230.000.000.08
Transportation-b1428.110.320.1119.10
Power generation10.516.8039.3943.54
Model 3Planting515.600.030.060.02
Collecting260.620.060.523.48
Transportation-a538.000.120.308.97
Storage5.230.000.000.08
Transportation-b970.380.220.0712.98
Power generation10.516.8039.3943.54
Model 4Planting515.600.030.060.02
Transportation-a724.440.160.4012.07
Storage5.230.000.000.08
Transportation-b970.380.220.0712.98
Power generation10.516.80 39.3943.54
Table 7. Emission reductions in pollutants (unit: t).
CO2SO2PM10NOx
Coal-fired power generation108,825.171682.7697.39760.12
Model 1 105,617.411675.3556.08672.74
Model 2 106,067.091675.4357.02684.94
Model 3 106,524.811675.5357.05691.06
Model 4 106,599.001675.5557.47691.44
Table 8. Environmental costs and benefits of straw and coal-fired power generation (unit: USD).
PollutantModel 1Model 2Model 3Model 4Coal-Fired
CO23806.133272.572729.462641.43129,125.41
SO25417.505355.385280.185266.831,230,281.21
PM1013,161.6412,861.7812,850.6912,718.8331,028.37
NOX63,890.1854,968.2150,493.4850,217.01555,735.48
En-costs86,275.4576,457.9571,353.8170,844.111,946,170.47
En-benefits1,859,895.021,869,712.521,874,816.61,875,326.36/
Disclaimer/Publisher’s Note: The statements, opinions and data contained in all publications are solely those of the individual author(s) and contributor(s) and not of MDPI and/or the editor(s). MDPI and/or the editor(s) disclaim responsibility for any injury to people or property resulting from any ideas, methods, instructions or products referred to in the content.