1. Introduction
With respect to the growing demand for energy efficiency and sustainable development, the water and sewage sector is facing the challenge of transformation. In the recent years, rising energy prices have led to a marked increase in interest in energy-efficient and passive construction. Therefore, a growing number of investors were willing to adopt new solutions that would, on the one hand, reduce the costs of hot water preparation and, on the other, protect the natural environment. In many cases, problems related to the purchase of coal and its high prices in 2023 and 2024 contributed to the replacement of traditional installations with systems powered by renewable energy sources [
1]. Heat pumps and domestic hot water tanks were increasingly installed in new and modernized installations. In the light of the issues mentioned, systems and installations that allow heat recovery from domestic sewage have undoubtedly significant potential. In Poland, such solutions are still rarely used, but their adoption appears to be widespread over time. The contemporary approach to municipal services is evolving toward a circular economy, where waste and sewage are seen as valuable energy resources. Heat recovery from municipal sewage is a part of this trend, and heat pump (HP) technologies are considered the most effective and the most mature. There are different types of HP (air-to-water, ground-to-water, water-to-water, and air-to-air). However, in case of sewage, water-to-water heat pumps are most commonly used, and they directly benefit from the constant temperature of the sewage as a heat source. Scientific studies [
2,
3,
4] confirm that these systems are highly efficient and their use contributes to a significant reduction in CO
2 emissions. Municipal wastewater, generated mainly as a result of the domestic and economic activities of the population, has a significant energy potential. However, it has remained unexploited for many years. The major energy potential is due to the fact that wastewater has a relatively high temperature—between 10 and 20 °C on average—and a stable flow rate. Due to the high heat capacity of water, even a slight reduction in the temperature of wastewater allows the recovery of significant amounts of thermal energy [
5]. Heat recovery from wastewater contributes to reducing fossil fuel consumption and thus reducing CO
2 emissions and other air pollutants. This solution contributes to the EU’s climate neutrality strategy and circular economy policy. From an economic point of view, the following factors are of key importance: the volume and continuity of wastewater flow, temperature stability, investment costs, and the possibility of integration with renewable energy sources. Despite their significant potential, wastewater heat recovery technologies are still rarely used in Poland [
6,
7,
8]. In Western European and Scandinavian countries, these solutions are widely implemented, and their potential is estimated at 10–15% of the total demand for district heating. The development of this technology requires further popularization and integration with local energy strategies. Wastewater is a stable source of thermal energy because, unlike atmospheric air, its temperature varies insignificantly throughout the year. This allows it to be applied as a lower heat source for heat pumps with higher efficiency than air installations. Thermal energy recovery from wastewater is primarily achieved through the use of water-to-water heat pumps. On a larger scale, heat recovery from sewage can be employed in conjunction with wastewater treatment systems. This has been confirmed, among others, by studies conducted in references [
9,
10,
11,
12]. The simple payback time of investment is usually estimated at 6–12 years, with financial benefits appearing sooner in large-scale facilities (for agglomerations with an equivalent population of over 50,000 PE) [
6,
7]. Therefore, the development of this technology requires further popularization and integration with local energy strategies [
9].
Two principal configurations are used for heat recovery from wastewater systems: indirect and direct. In an indirect configuration, wastewater passes through a heat ex-changer where thermal energy is transferred to a secondary, clean working fluid that subsequently supplies a heat pump. In a direct configuration, wastewater serves as the primary heat source for the heat pump itself, which requires additional pre-treatment steps, including the removal of suspended solids and enhanced filtration. Heat can be recovered from several locations within wastewater and related infrastructure, including raw sewage in sewer networks, treated effluent at wastewater treatment plant outlets, process water from industrial facilities, and mine water streams [
5,
9,
12,
13,
14,
15,
16,
17]. The energy recovered from wastewater has a variety of applications: building heating, preparing domestic hot water, and supporting district heating systems and technological processes [
3].
The aim of this publication is to assess the energy potential, as well as the economic analysis of heat recovery from municipal sewage on the basis of a treatment plant in the municipality of Gorzyce, Podkarpackie Province. Due to its demographic characteristics and infrastructure, the municipality of Gorzyce is a representative example of other smaller and medium-sized Polish municipalities. The research focuses on the use of heat pumps as a key element in the heat recovery system. As part of the work, a detailed data analysis was conducted, including key wastewater parameters from 2025. Particular emphasis was placed on the amount of treated wastewater and its energy potential.
2. Materials and Methods
2.1. An Artificial Neural Network in a Sewage Treatement Plant
The operation of a sewage treatment plant is a complex control task. The settings in the bioreactor depend on the conditions at the inflow to the treatment plant and are characterized by the quality of the sewage and the amount of raw sewage. The other of these factors is particularly important, as it determines the amount of incoming pollutants and the load on the activated sludge chambers, which affects the operation of the biological reactor (sludge age, substrate load of the activated sludge chambers, and wastewater retention time) and the quality of the wastewater at the effluent outlet [
13,
18]. A sudden increase in the amount of wastewater entering the treatment plant often leads to the disruption of the pollutant removal process, hence predicting that the volume of the incoming wastewater has a positive impact on the operation of the facility. Currently, the inflow volume to sewage treatment plants is predicted using physical models. However, these models have disadvantages, as it is difficult to collect relevant information about the catchment area, and the costs of continuous measurements of sewage volume and quality are high. Furthermore, despite the collection of adequate data, the results of inflow forecasting are not always satisfactory [
19,
20,
21]. Therefore, parametric (black box) models have been increasingly used to simulate the amount of wastewater flowing into treatment plants, often using the MLP method [
22,
23,
24,
25,
26]. This method has currently been widely implemented, which is, among other reasons, due to the fact that it is implemented in the most available statistical packages. Despite the numerous applications of the MLP method and other data mining methods, the authors of many papers [
20,
21,
24] limit research to using only one method. MLP (multi-layer perceptron) and RBF (radial basis function) networks belong to the group of artificial neuron networks employed in nonlinear function approximation. However, the differences between them include the architecture and the dependence modeling method [
27]. An MLP network presents a multi-layer structure and implies neurons with global activation functions (e.g., sigmoide, hyperbolic tangent, and ReLU). The iterative learning process is conducted through the application of the backpropagation algorithm. In the model, the global transformation of input data is presented, where each neuron influences the final result in the entire data range. A typical RBF network presents a three-layer structure where the hidden layer is constructed with neurons with radial basis functions, most often Gaussian. The network response is a linear matrix of local functions that depend on the center distance. The learning process is divided into two stages: first, the basic functions centers are appointed, and then the output layer weighs are estimated [
28,
29,
30]. The basic discrepancy between the two models includes the approximation nature. The global approximation is analyzed using an MLP network, whereas the local approximation is analyzed using an RBF network. As a result, RBF networks present high interpolation properties but are more susceptible to overfitting with large number of neurons. Therefore, the obtained results often present an individual nature, as they do not allow to determine whether less complex models (with a simpler structure, requiring less computing power and shorter calculation times, etc.) could have been employed for the analyzed data set.
2.2. Basic Characteristic of the Treatment Plant in Gorzyce
According to the design data, the capacity of the treatment plant in Gorzyce is 11,593 PE, and its throughput is Q(avg) = 4200 m
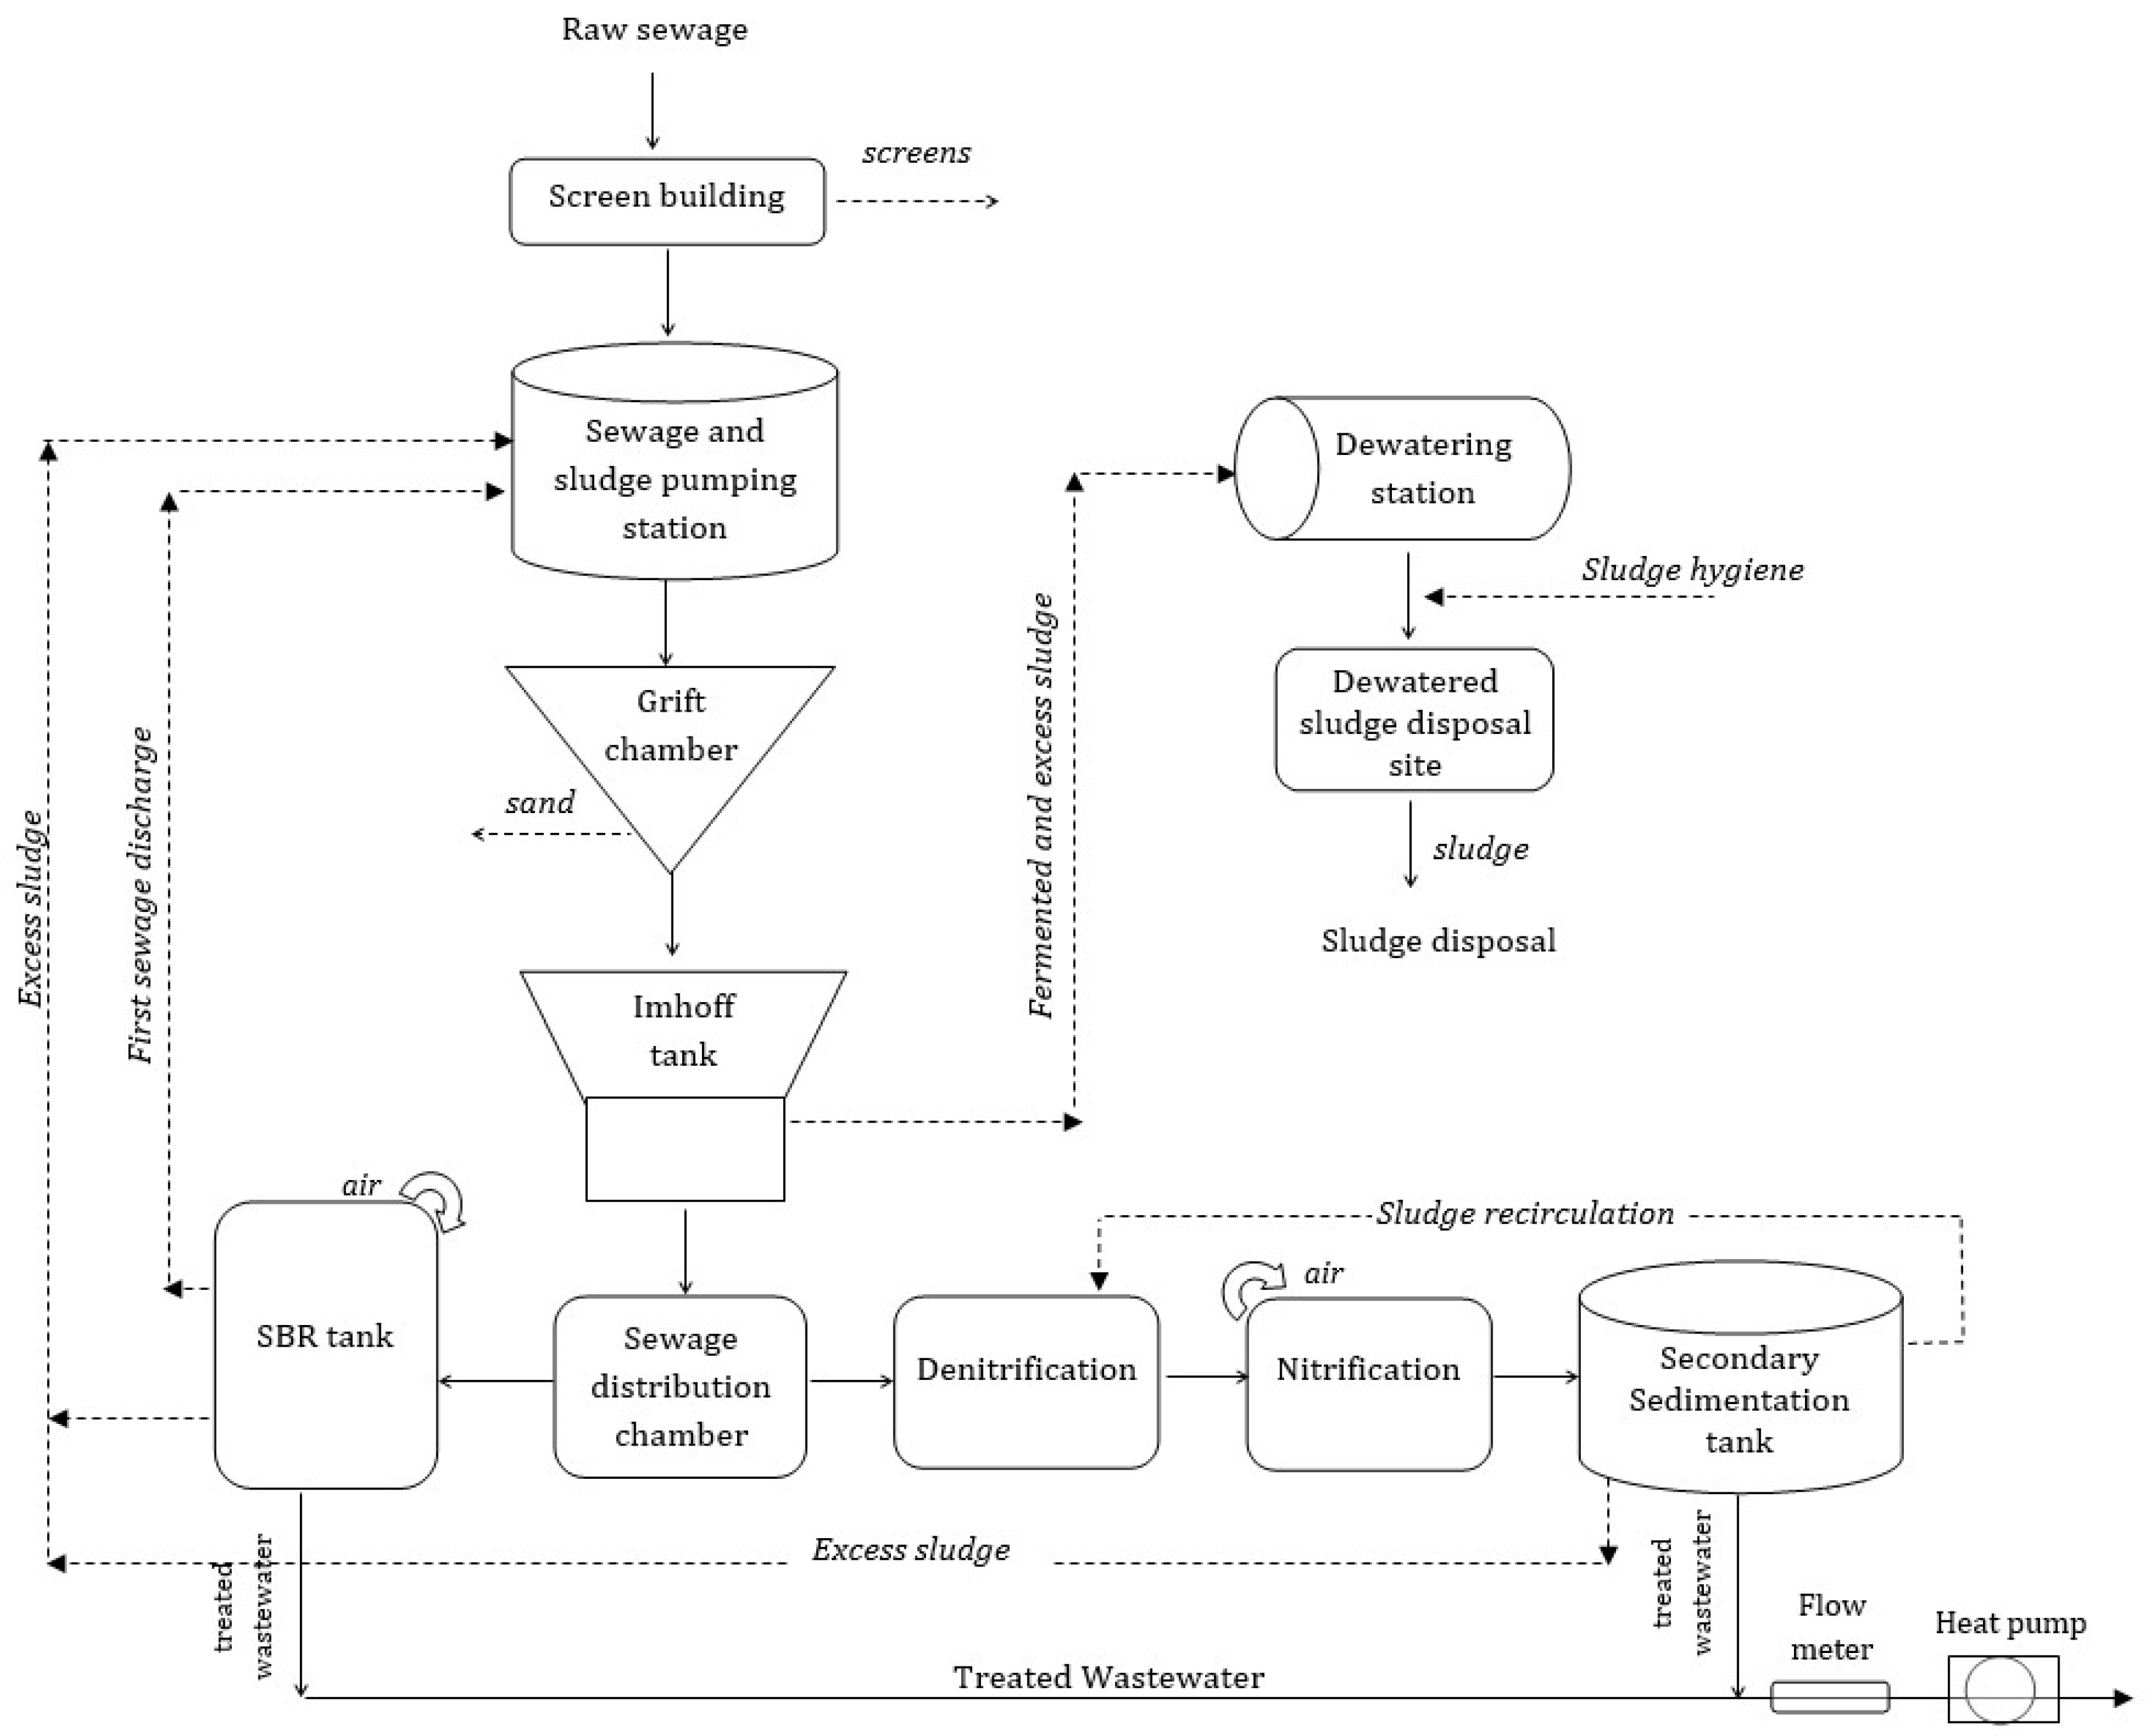
3/d. The sewage treatment plant in Gorzyce operates on two parallel technological lines. The first one consists of a conventional system based on an activated sludge with denitrification. The other one has been incorporated since 2018. It is a batch SBR sequential biological reactor system using activated sludge with a continuous inflow and discontinuous effluent discharge. It was manufactured by SADEKO, Poddebice, Poland. Wastewater is mechanically treated in an Imhoff tank and flows through a wastewater distribution chamber, where a specific volume of wastewater is transported to the “traditional” part of the biological wastewater treatment plant, i.e., to the denitrification, nitrification, and secondary settling tanks. The other part of the sewage flows into a sequential biological reactor, i.e., a tank where the entire process of treatment and separation of treated sewage from sludge flocs occurs cyclically in a single tank. During the filling of the chamber with pre-treated sewage, an alternating process of aeration and mixing of sewage begins. Such solution increases the efficiency and stability of the biological part of the treatment plant (
Figure 1).
The data on the temperature and effluent flow of treated wastewater from municipal wastewater decontamination equipment covers the period from 1 January 2025 to 1 October 2025. The calculations were based on data obtained from a wastewater treatment plant in Gorzyce, including monthly values of treated wastewater flow and temperature. Monthly wastewater flows [m3/month] were determined from daily measurement data [m3/d] recorded by a PSK-4 flow meter manufactured by PIAP Warsaw. Wastewater temperature was determined as a monthly average based on automatic daily measurements conducted using a Sonoff Basic device manufactured by Sonoff Trechnologies, Shenzhen, China and equipped with a DS18B20 temperature sensor manufactured by Maxim Integrated, San Jose, CA, USA, and the SUPLA Cloud system (version 25.12.04). The data was collected in the effluent channel and used to assess the heat recovery potential of treated wastewater. The research methodology is based on the mass and energy balance of treated wastewater, which allowed a precise estimation of the thermal potential and the required heat pump capacity, including seasonal variability. Data mining methods based on the analysis of wastewater flow data from 2025 were used for the calculation procedure.
2.3. Data Collection and Analysis
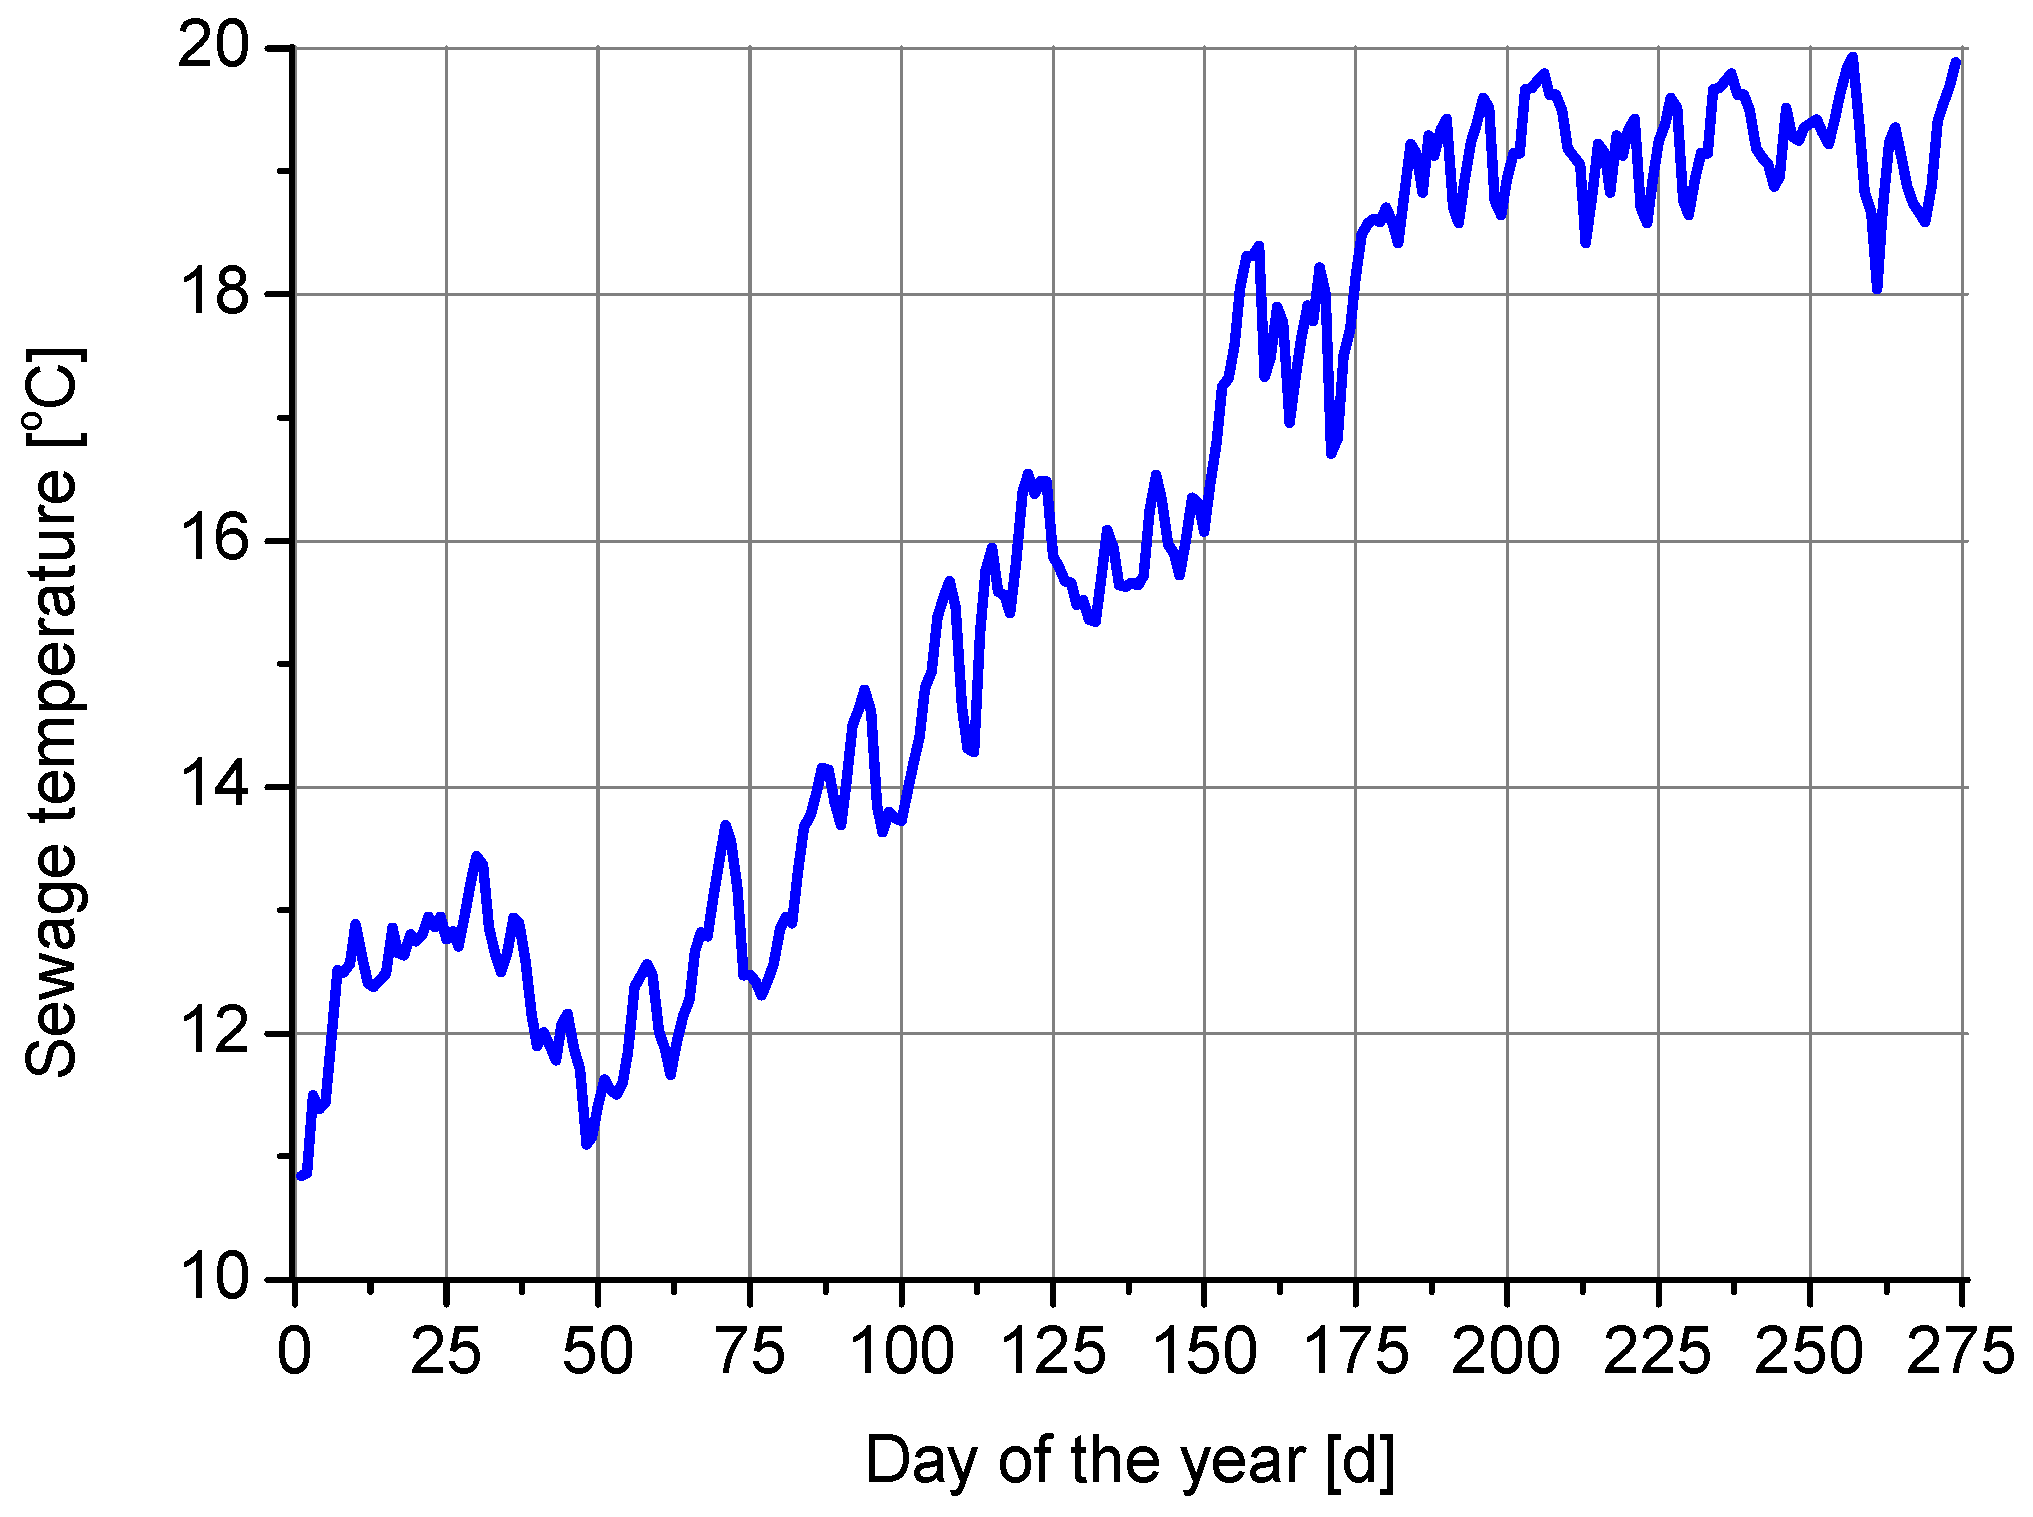
The data was obtained directly from the wastewater treatment plant in Gorzyce and comprises the parameters necessary to assess the thermal potential, including temperature (
Figure 2) and treated wastewater flow (in m
3/d), which is a key factor to determining the amount of available energy. The collected daily and monthly data enabled the development of a seasonal variability model. For this purpose, the Statistica 12 software was used with the Data Mining module implemented [
31]. The data for treated wastewater flow is important in terms of the favorable operation of the system, including the biochemical characteristics of treated wastewater, which is characterized by low BOD
5, COD, and total suspended solids.
In the Gorzyce municipality, a separate sewage system is applied. The sewage temperature variability is relatively low comparing to the external air temperature. However, in the summer, the sewage temperature reaches 20 °C. In a typical separate system, DN200-400, the sewage volume increase does not exceed 3–6%.
These indicators are crucial in assessing the negative impact of wastewater on the operation of heat exchangers.
Figure 2 shows the temperature variation in wastewater leaving the biochemical reactor (KOC) in the period from 1 January 2025 to 1 October 2025. It is worth noting the small range of variation in this temperature. This indicates that during the analyzed period of time, the wastewater presented high thermal stability with a slight tendency to increase in temperature. This trend will reverse in the third quarter of the year, but the wastewater temperature will not decrease below 10 °C [
1,
4,
9].
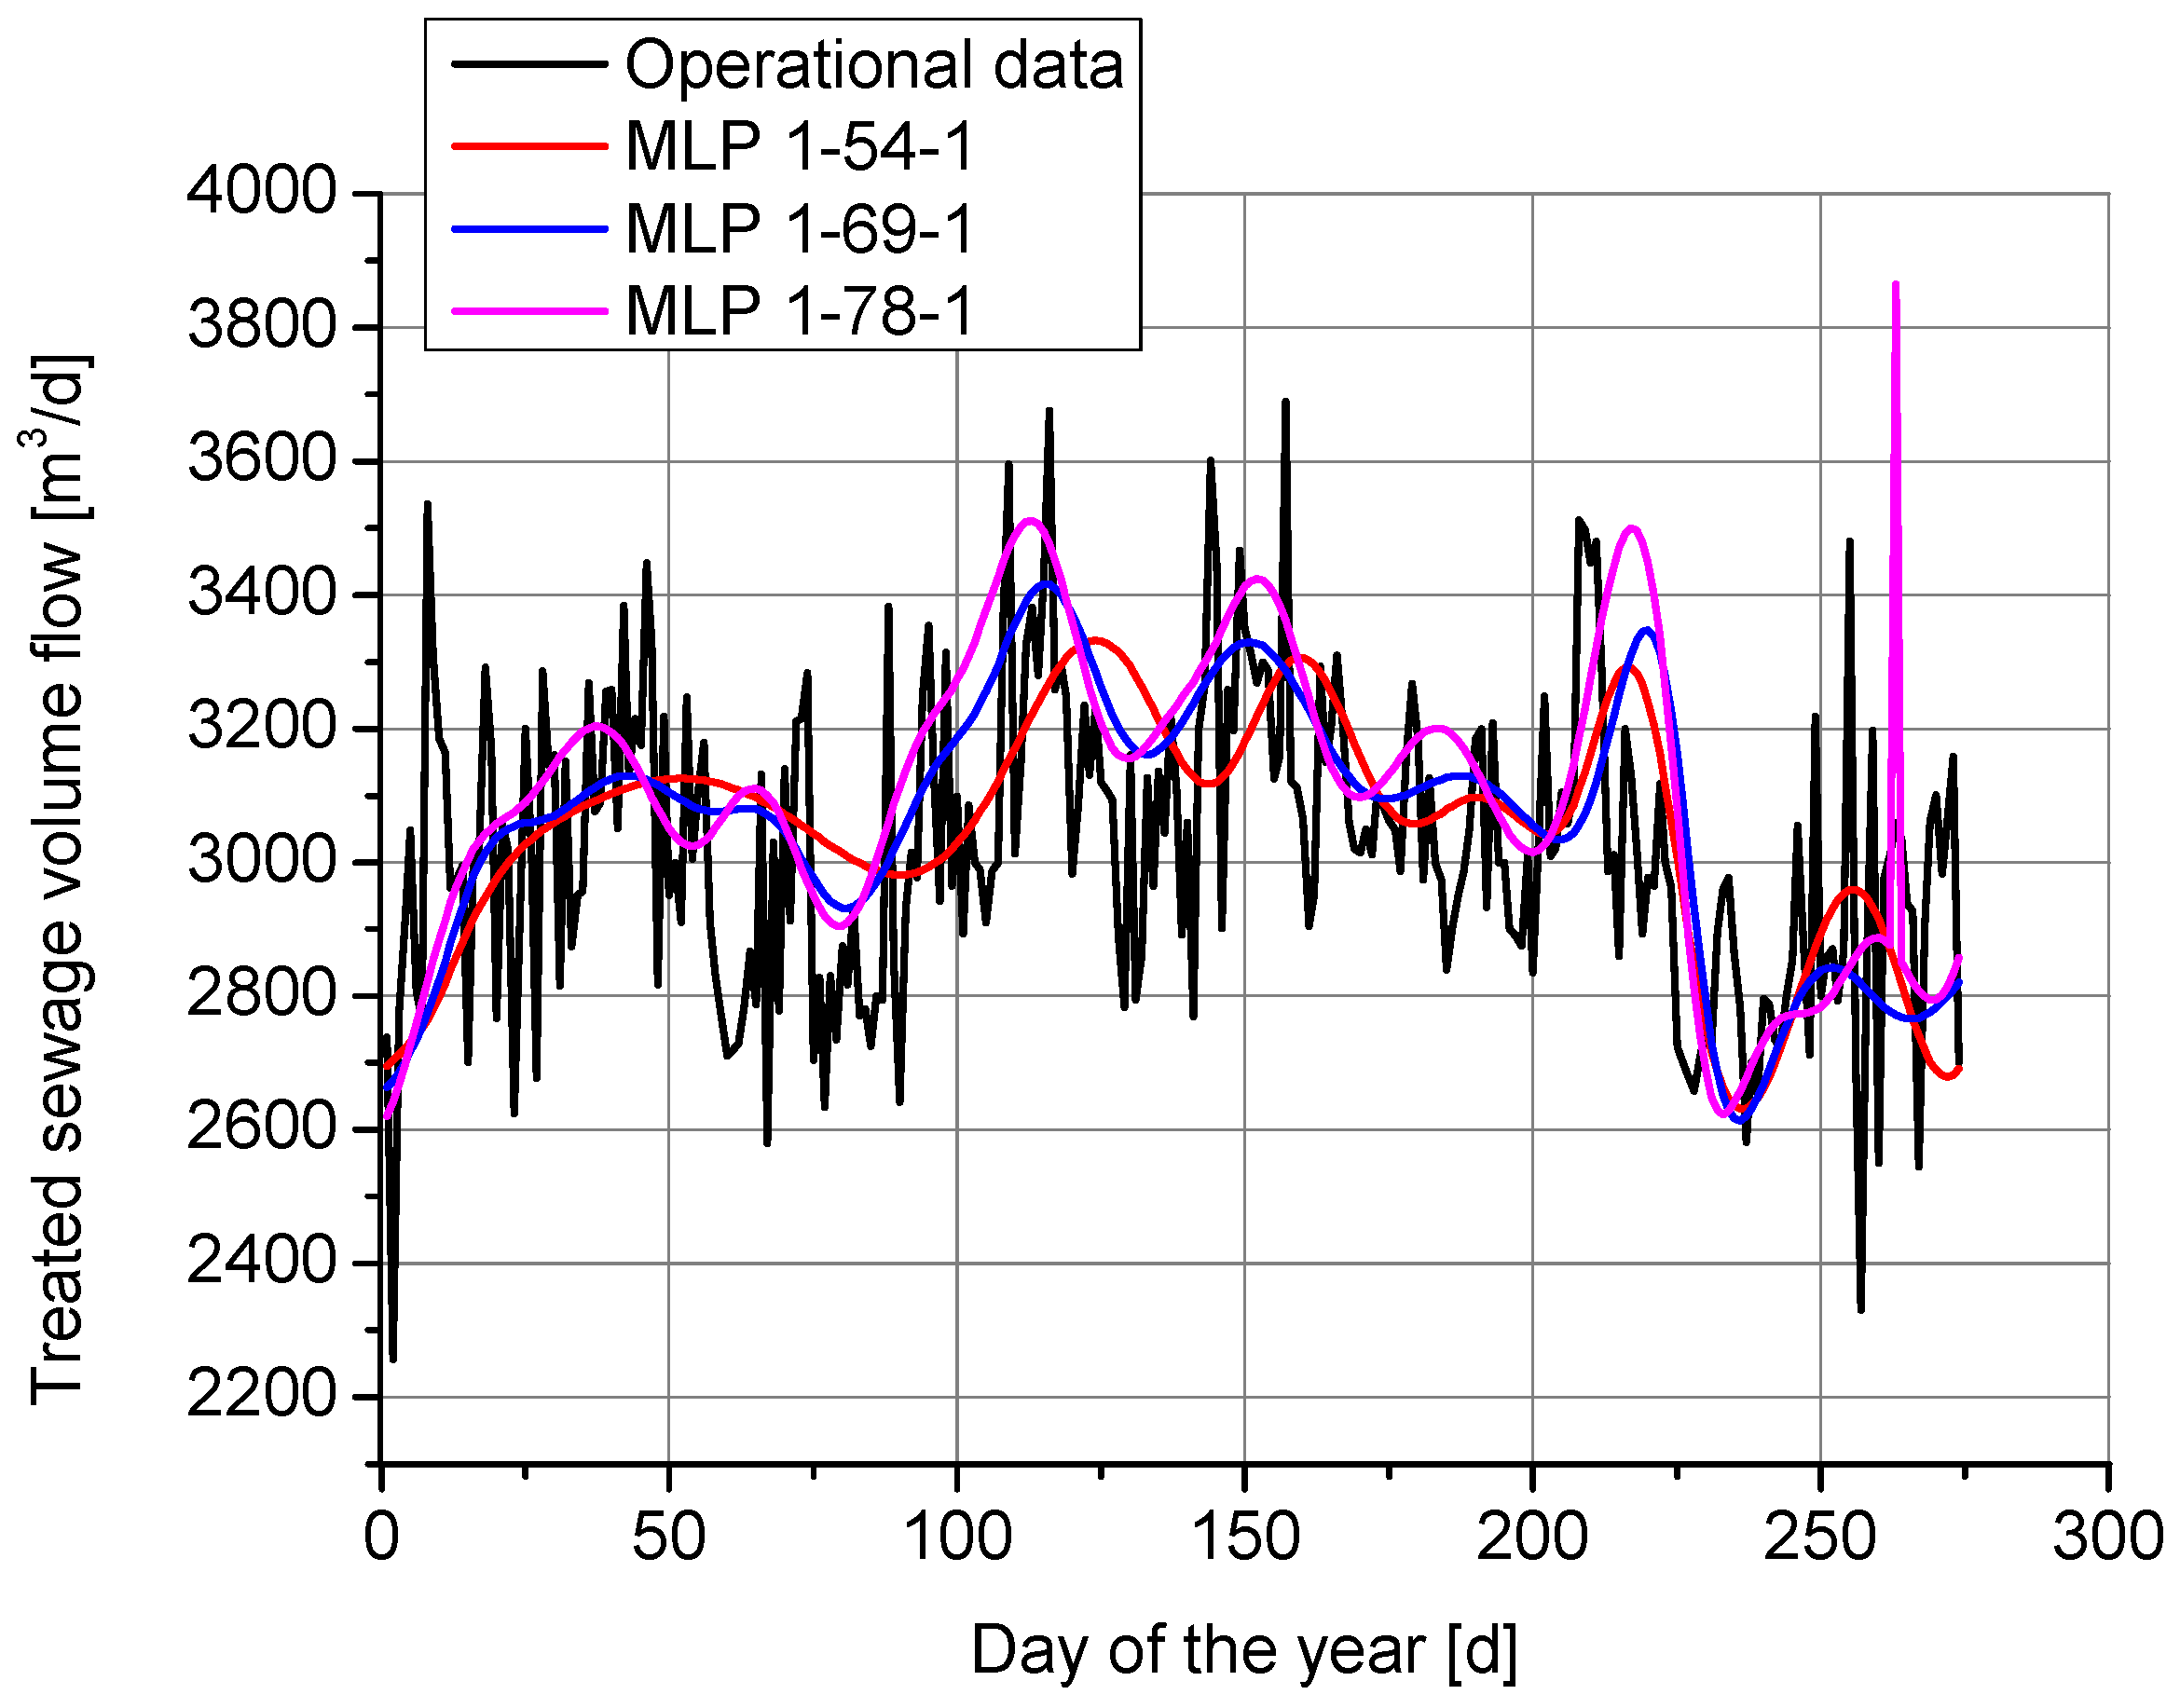
Figure 3 presents the variability of the effluent flow of treated wastewater from KOC. Based on the collected data on wastewater flow, an MLP model of wastewater effluent from KOC was developed. The networks were optimized in Statistica 12 with a priority of 70% training data, 15% test data and 15% validation data. The software used to develop the model only allows for the construction of MLP and RBF networks. The simulations were conducted with various configurations for training, test, and validation data for 30,000 networks. Optimizations were attempted for splits of (80/10/10), (90/5/5), (60/20/20), and even (80/1/19). While the split itself proved not to be critical, the way the data was split and employed did impact the reliability of the RBF model, particularly in engineering applications such as wastewater flow modeling.
The results obtained by means of Statistica software are presented in
Figure 3. The analysis of the fit curves for three neural networks, i.e., MLP 1-78-1, MLP 1-69-1, and 1-54-1, leads to the conclusion that the proposed model does not reflect the variability of treated wastewater discharge from the technological line in Gorzyce (
Figure 1) in a satisfactory manner. Similarly, the coefficients of determination obtained for the trained MLP networks are average at best (
Table 1,
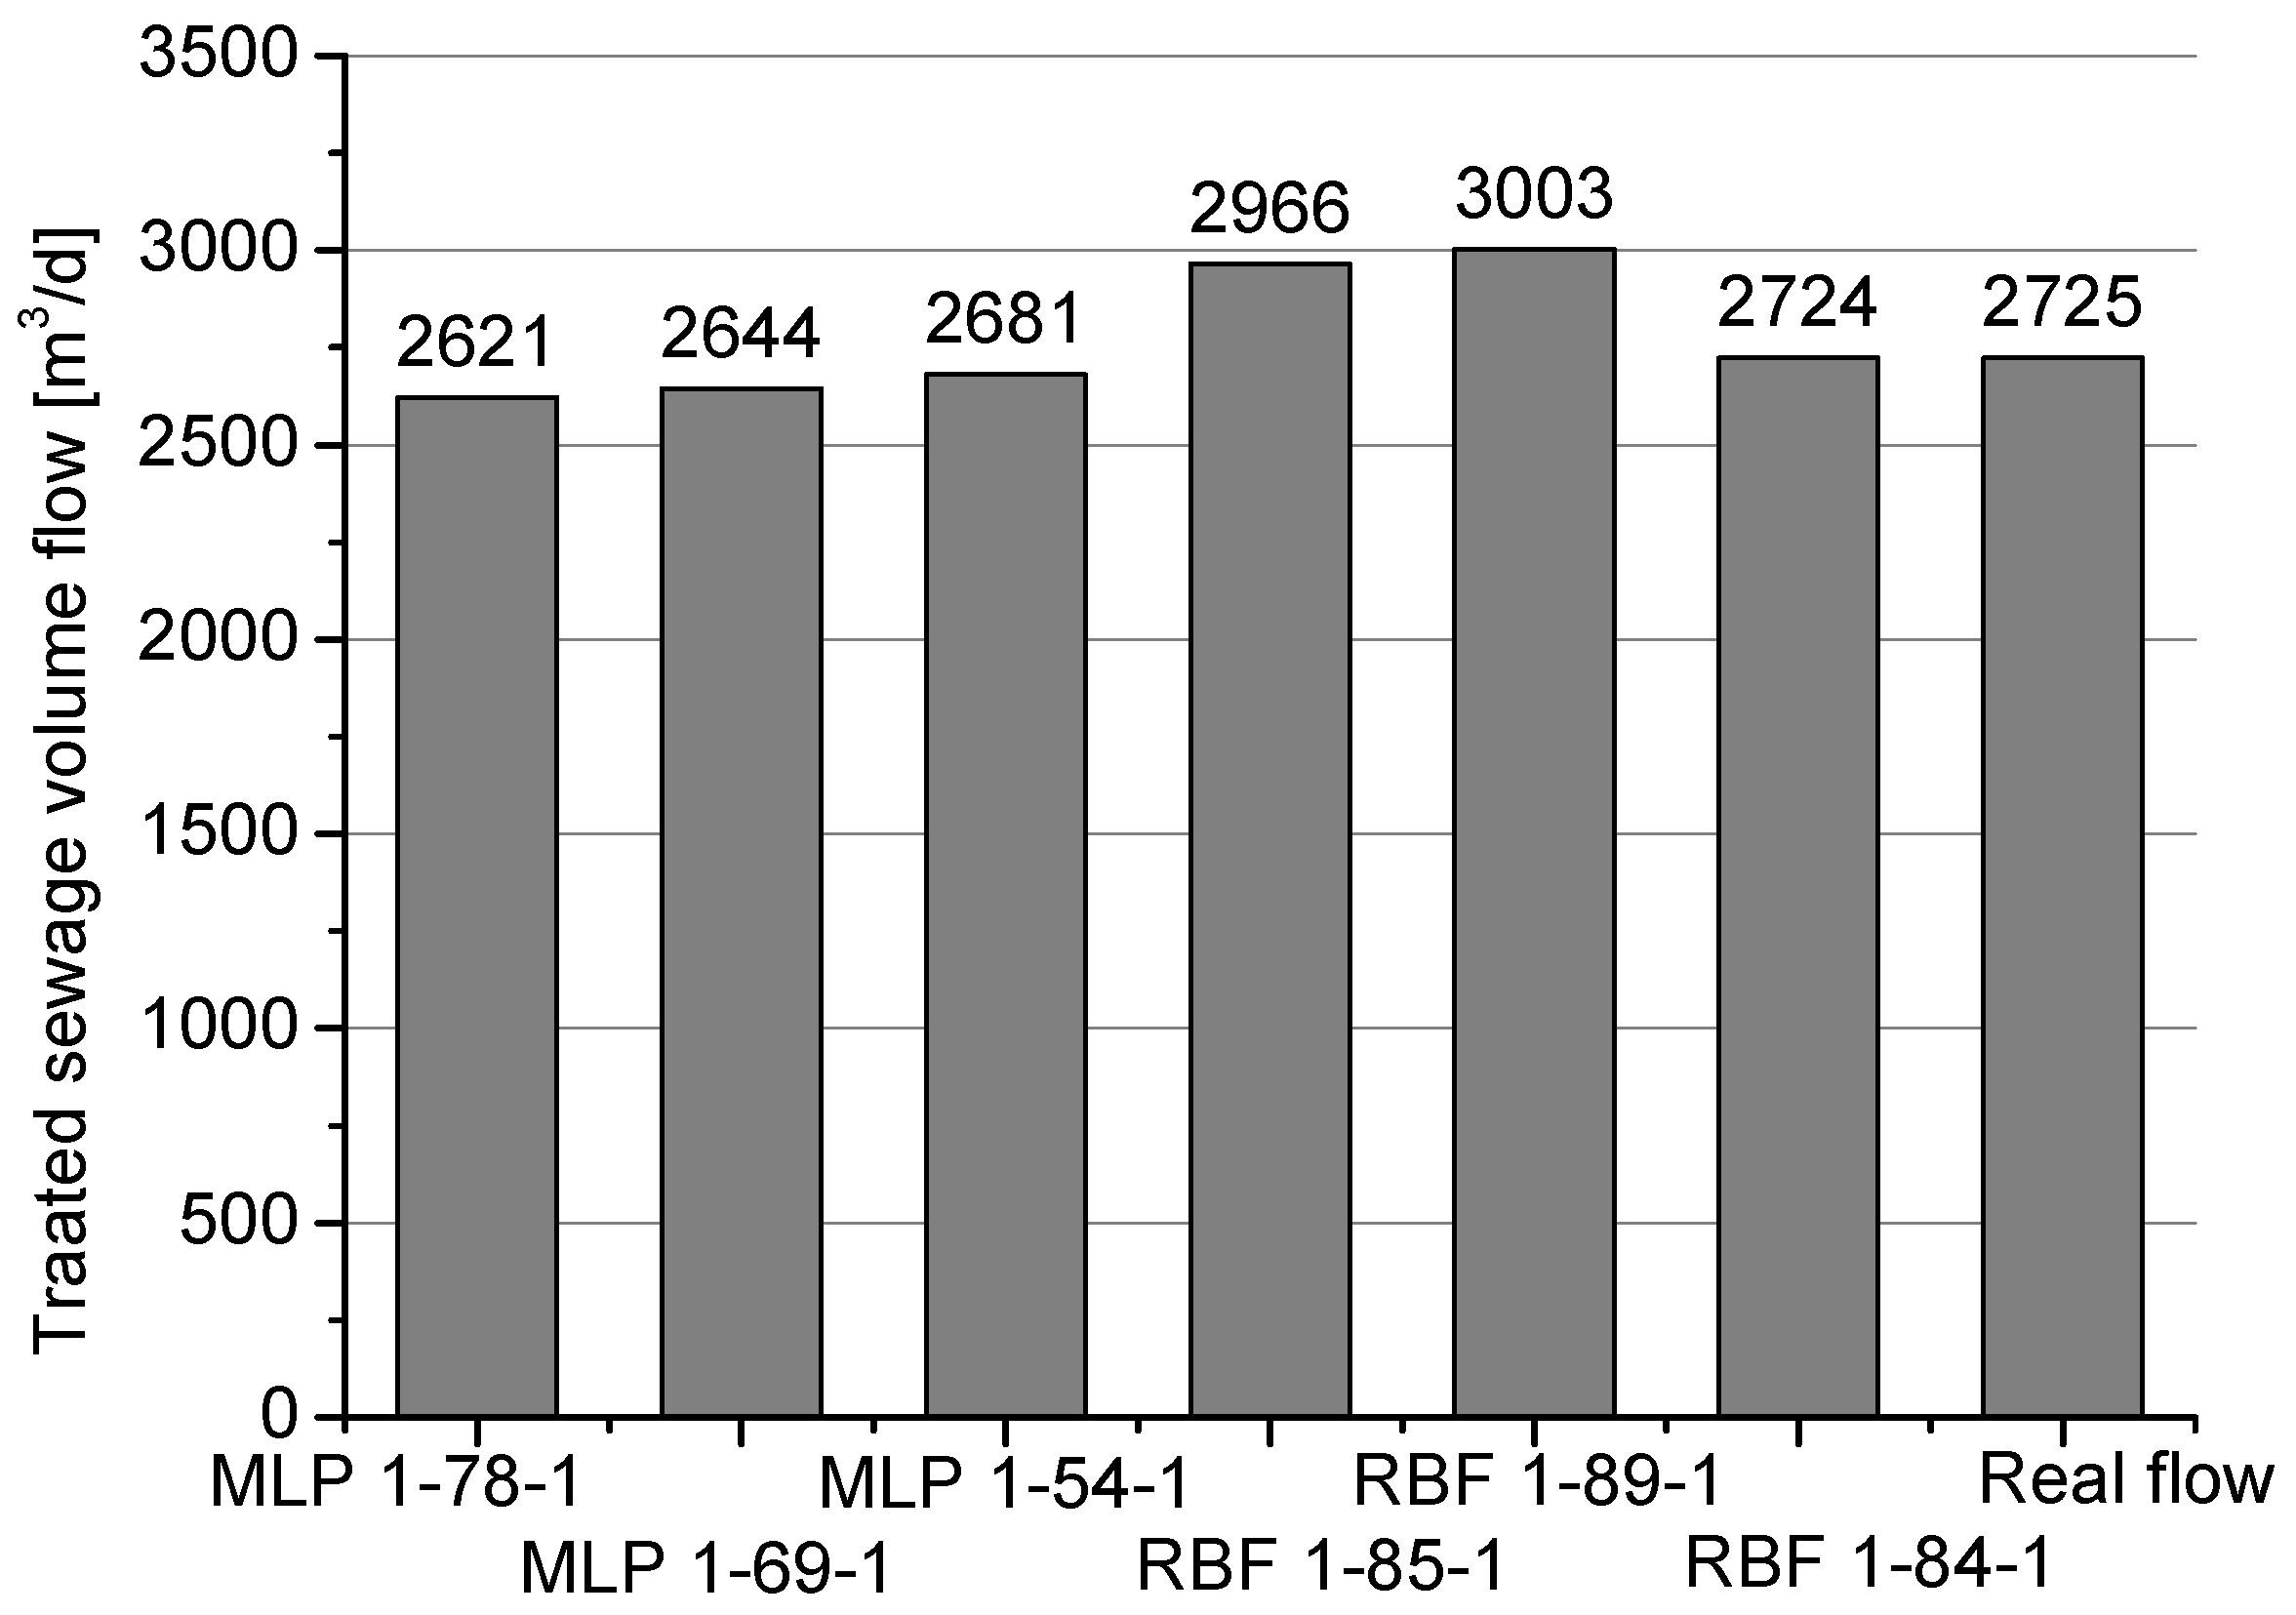
Figure 4). This leads to a significant underestimation of the wastewater discharge forecast for the next day (t + 1). The forecast value is in the range of 2621–2681 m
3/d (
Table 1,
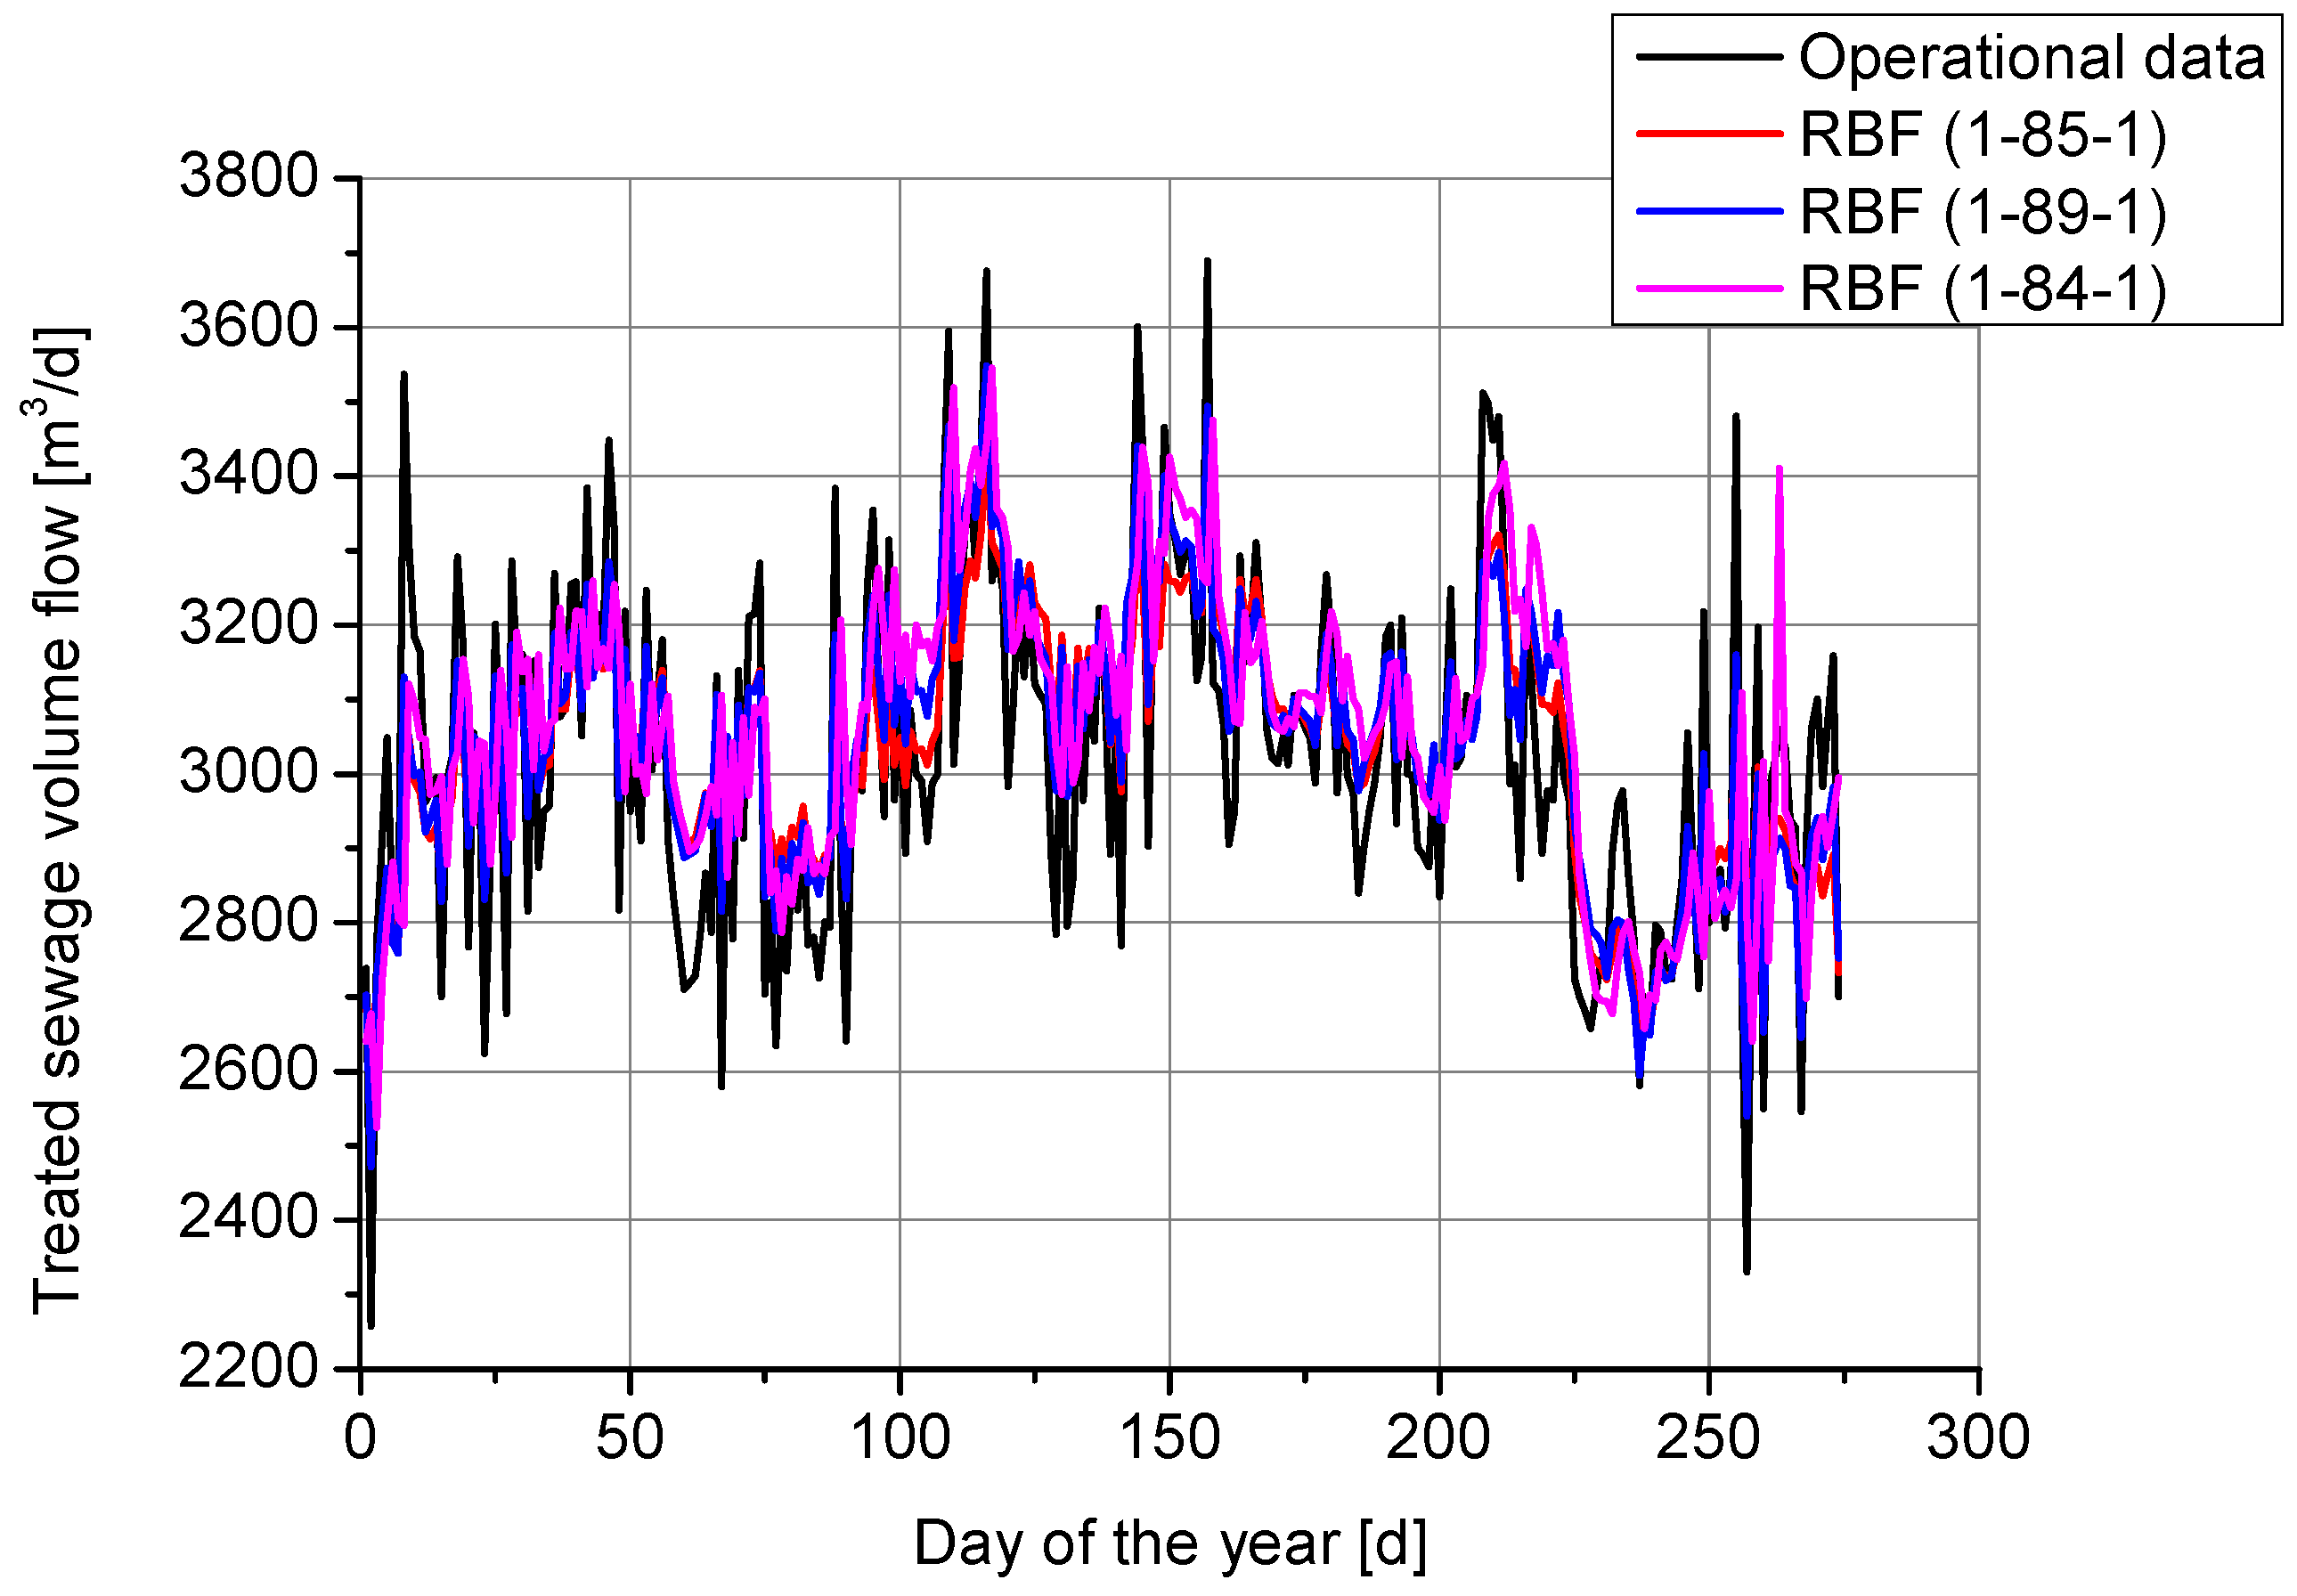
Figure 4). In this respect, the model based on RBF networks performed much better. It is a type of unidirectional neural network that implies the technique of radial basis functions (RBF) and radial neurons. A typical radial network consists of an input layer (as always, not directly involved in information processing), a hidden layer composed of radial neurons, and an output layer that generates the network’s response.
Radial neurons are used to recognize repetitive and characteristic features of groups (clusters) of input data. A specific radial neuron is activated when the radial network is confronted with a case similar to the one that it has previously learned to recognize as representative of a certain group. In the output layer of a radial network, there is usually only one linear neuron [
25].
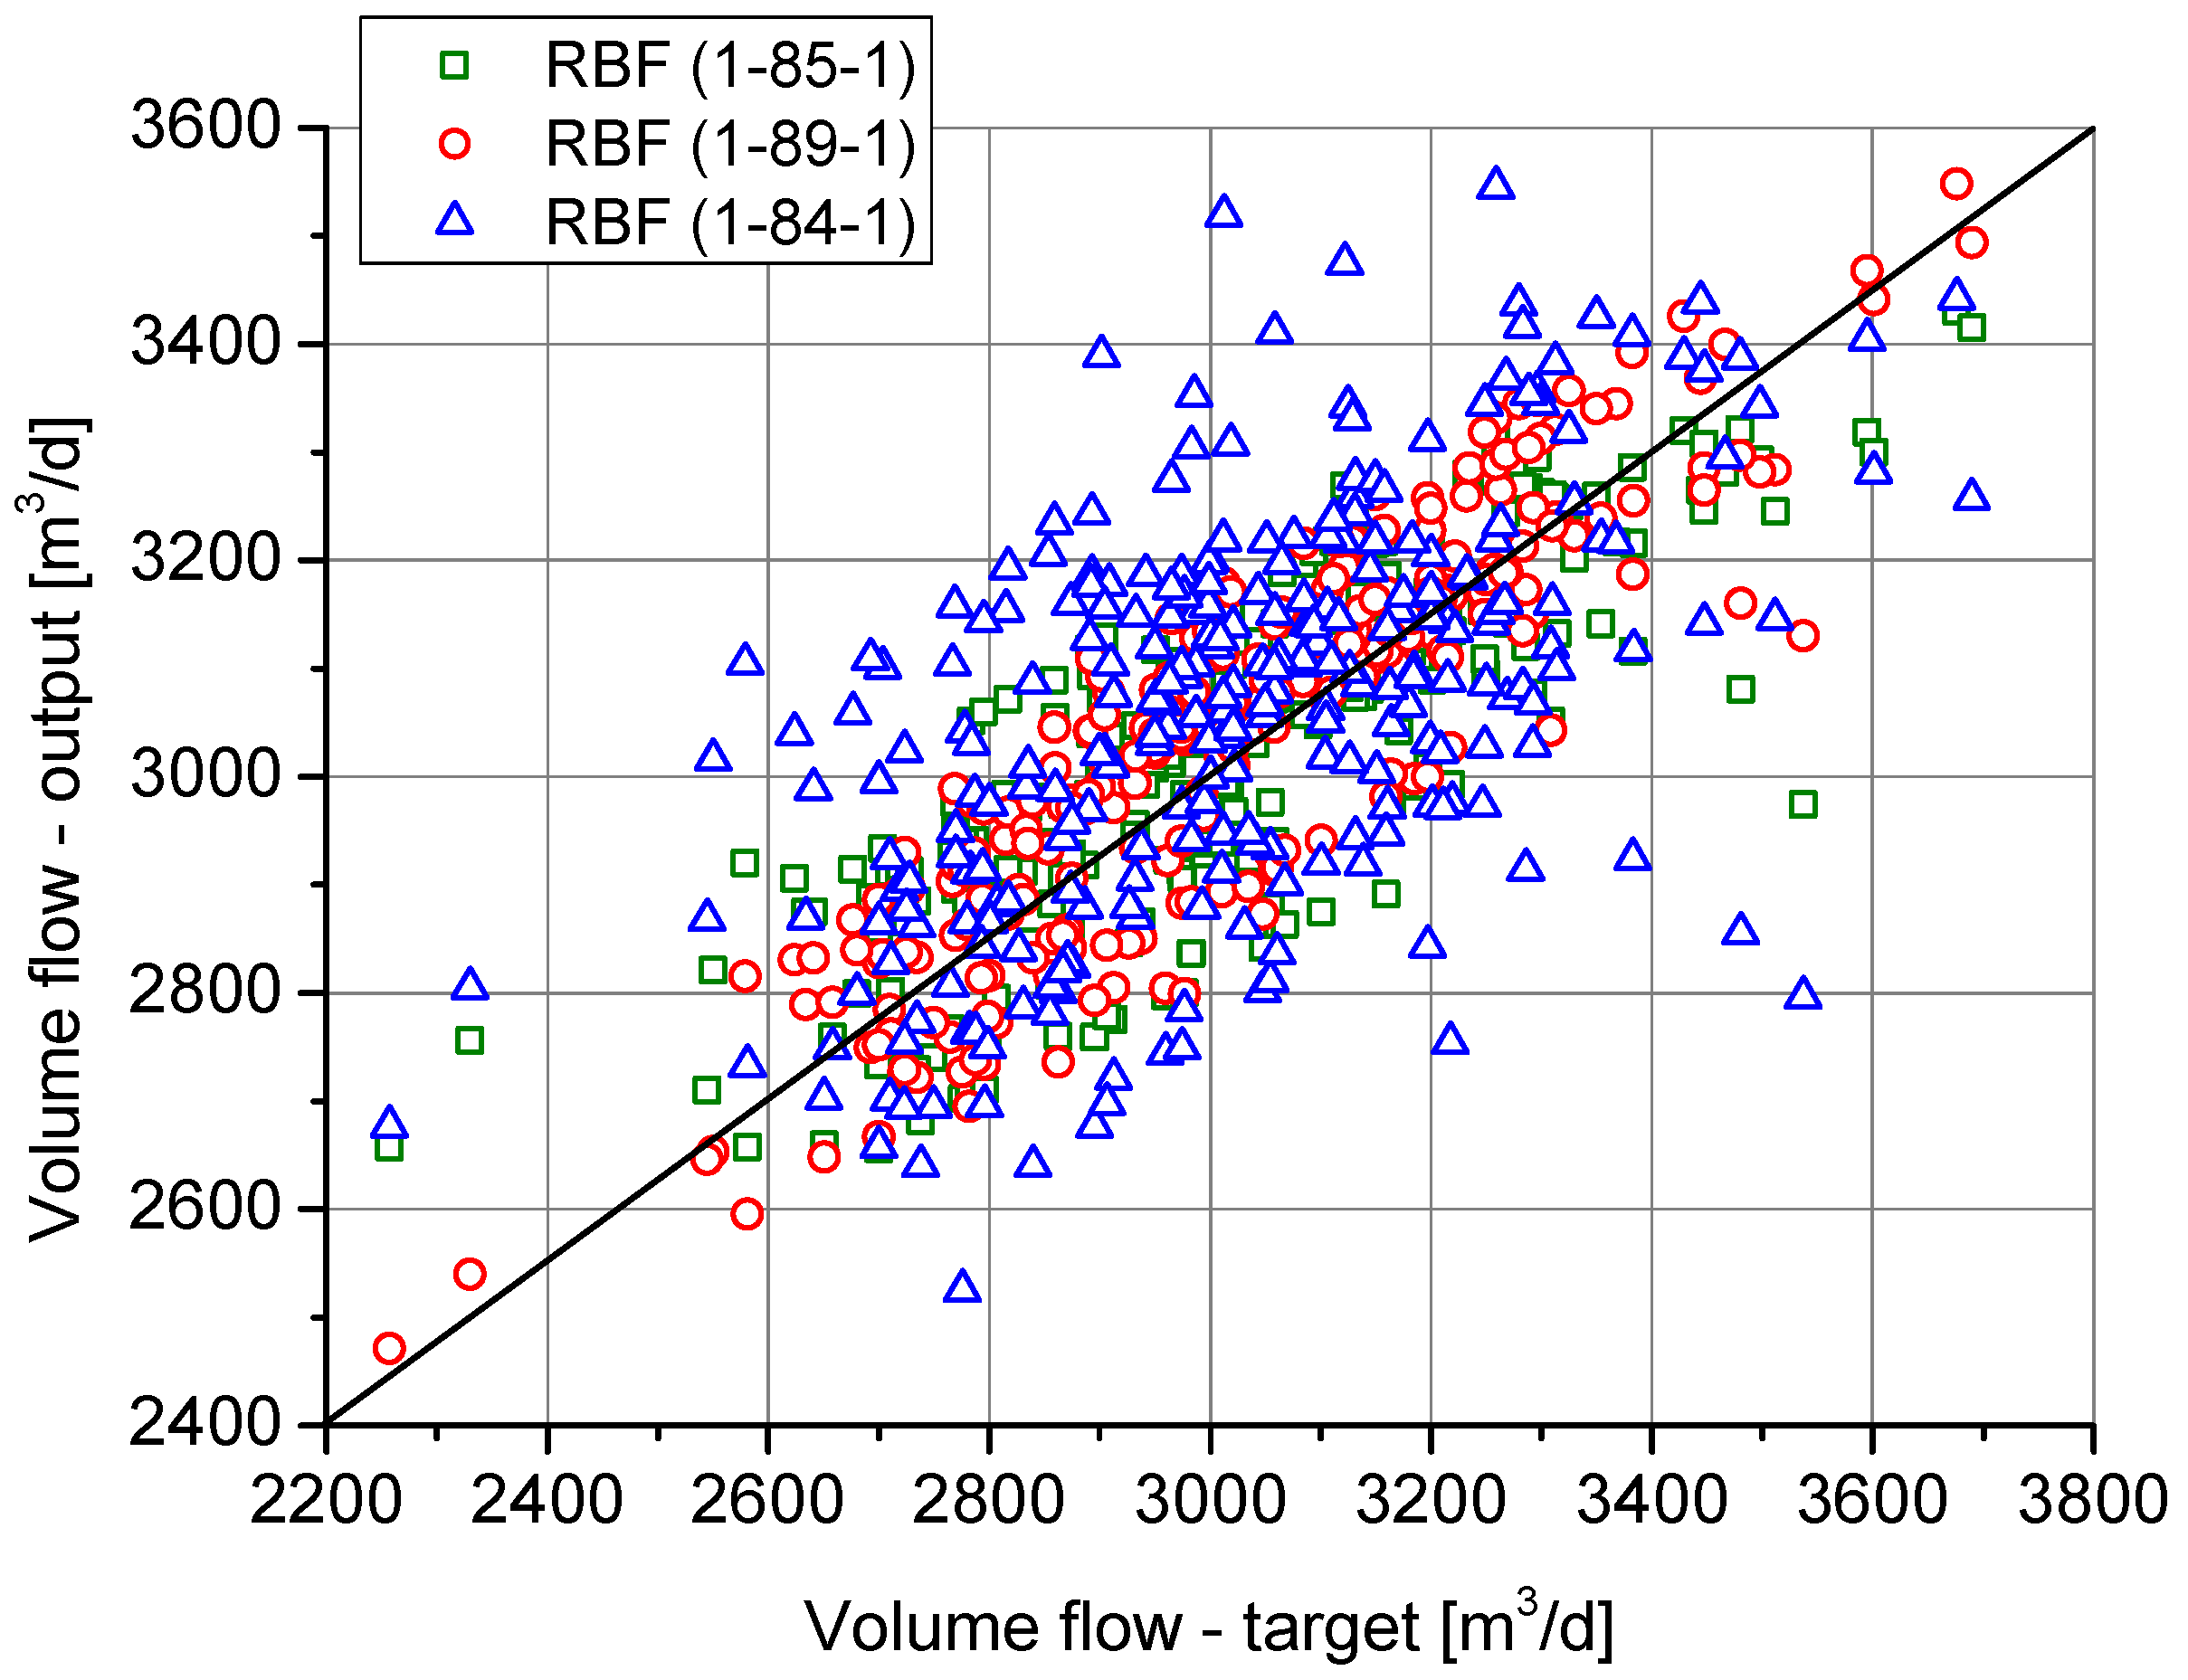
The analysis of the fit curves for three neural networks, i.e., RBF 1-85-1, RBF 1-84-1 and 1-89-1, leads to the conclusion that the proposed model correctly determines the variability of wastewater outflow from the remediation system. Similarly, the coefficients of determination obtained for the trained RBF networks are significantly higher than those obtained for the MLP networks (
Figure 5).
This leads to higher values of the forecasted wastewater effluent for the next day (t + 1). The estimation of the amount of wastewater leaving the activated sludge chamber is crucial for assessing the energy potential of wastewater and the possibility of heat recovery from wastewater. According to the literature [
5,
6,
7], excessive cooling of wastewater is not recommended, therefore the temperature of wastewater discharged into the receiving body of water should be at least 277 K. Various scenarios were considered, but the most desirable outcome is the least possible cooling of wastewater [
1,
5,
10]. In further considerations, it was therefore assumed that the depth of wastewater cooling would be at constant value equal to 1 K. In the RBF neural network model, satisfactory determination coefficients were obtained, significantly higher than for trained MLP networks (
Table 1). This leads to a correct forecast of the wastewater inflow the next day (t + 1). The predicted value is in the range of 2724–3003 m
3/d (
Figure 4). The actual flow, Q(t + 1), for day 275, based on information obtained from the wastewater treatment plant operator, was 2725 m
3/d. The lowest prediction error was 0.04% and was obtained for the RBF 1-84-1 network. The lowest prediction error for the MLP network was 1.63% and was obtained for MLP 1-54-1. In this respect, the results obtained for both types of networks can be considered satisfactory.
Figure 6 presents the correlation between the actual wastewater discharge data from the municipal treatment plant in Gorzyce and the values obtained from the RBF model for three selected radial networks. The results confirm the high effectiveness of RBF neural networks in forecasting wastewater discharge from facilities with well-known variability characteristics presented in the form of time series. Nevertheless, alternative approaches to solving this problem can be found in the literature [
20].
2.4. Method for Determining Energy Potential
The energy potential of sewage (Q) was calculated using the heat balance, according to equation [
9]:
where
ρ—density of sewage (assumed ρ ≈ 1000 kg/m3);
cw—specific heat of sewage (assumed Cw ≈ 4186 J/(kg·K));
QV—wastewater flow volume [m3/s];
T—wastewater temperature [K];
Tref—reference temperature, minimum temperature to which wastewater is cooled [K].
The calculations were based on daily treated wastewater flows, which allows the estimation of the total amount of available energy, with the actual heat recovered from wastewater being slightly lower [
9]:
where:
Qrecovered—energy recovered from wastewater;
ε—heat exchanger efficiency (≈0.8).
2.5. Determination of the Heat Pump’s Thermal Power and Efficiency Indicators
On the basis of the calculated energy potential of the wastewater, the heat pump capacity was determined, including the efficiency of the recovery system.
The heat pump extracts power, Q
c, from the wastewater and transfers heating power, Q
h, to the heating system [
32]:
where:
Qw—input power supplied in the form of electricity to the compressor and accessories.
If we recover Q
recovered from the wastewater and the system has a heat transfer efficiency to the pump circuit of η
hx, then [
24]:
Equation (5) was used to assess the energy efficiency of the heat pump that is its coefficient of performance (COP) [
24]:
3. Results
This section presents and interprets the results of calculations based on the data from the Gorzyce sewage treatment plant in 2025. The results of calculations of the electrical power demand for a compressor heat pump operating in a water-to-water system with η
HP = 0.45 and a wastewater temperature of T = 283.15 K at a given cooling depth of 1 K are presented in
Table 2. The supply temperature of the installation is T
hz = 328.15 K.
The calculated COP value, for the reference temperature of sewage of 283.15 K, is 3.044, and it increases to 3.394 when the sewage reaches its maximum temperature, i.e., 288.15 K.
3.1. Operational Factors Influencing System Efficiency
The actual operating performance of a wastewater heat recovery system depends on several interacting hydraulic, thermal, and technical factors. Based on the measured operational data from the Gorzyce treatment plant, the most influential parameters include wastewater flow variability, temperature stability, cooling depth, and auxiliary system efficiency. Daily wastewater flow varied between 2257 and 3690 m3/d, which translated into an available wastewater heat power range of 109–179 kW. This variability directly affects instantaneous heat pump loading and compressor power demand (42.8–70 kW). Higher flows increase recoverable thermal power but may also require larger heat exchanger surface and higher circulation energy. Forecast-based control using RBF neural networks reduced flow prediction error to 0.04%, improving operational sizing reliability and reducing the risk of heat pump oversizing or undersupply.
Wastewater temperature remained within a relatively narrow range (approx. 10–15 °C), which is a key operational advantage compared to air-source systems. Sensitivity calculations show that a 5 K difference in source temperature increases the COP from 3.04 to 3.39, confirming that even moderate seasonal temperature shifts have measurable efficiency impact. System efficiency is also influenced by assumed heat exchanger effectiveness (ε ≈ 0.8) and allowable cooling depth (1 K). A lower exchanger efficiency or operational fouling would proportionally reduce recoverable heat. Therefore, exchanger condition and maintenance frequency are critical operational parameters. In real operating conditions, total system efficiency is additionally reduced by auxiliary electricity consumption for pumps, controls, and filtration units. These parasitic loads were included in the compressor-side electrical balance, but sensitivity analysis shows that they can lower seasonal performance indicators by several percent. When combined with on-site photovoltaic generation, operational efficiency is improved at the system level due to reduced effective electricity cost and lower indirect emissions. Monthly photovoltaics (PV) production exceeded heat pump demand even in low-irradiation months, indicating favorable operational coupling under the observed load profile.
3.2. The Role of Photovoltaics as a Supplementary Power Source
Heat pumps require electricity to operate. In order to increase economic and environmental efficiency, hybrid systems are often used, combining heat pumps with other renewable energy sources (RESs), such as photovoltaics or wind turbines. These systems prove that the production of electricity for own purposes from PV or wind turbines can significantly reduce operating costs, thus shortening the payback period. The wastewater treatment plant in Gorzyce currently uses a PV photovoltaic cell system consisting of 300 Jinko Solar Holding Co. Ltd., Shangrao, China JKM540M-72HL4-TV 540Wp BiFacial SF panels, with the parameters presented in
Table 3.
3.3. The Amount of Recovered Heat and Energy Efficiency
Annual heat potential: The analysis of the data showed that the annual heat potential of wastewater when cooled by only 1 K is 1.16 GWh/year. This value is a key indicator of how much energy can theoretically be recovered. The fluctuations in wastewater temperature throughout the year were minor, remaining within the range of 10–15 °C. Such stability is beneficial for the operation of a heat pump, which distinguishes it from weather-dependent sources such as photovoltaics. The calculated seasonal coefficient of performance (SCOP) for the heat pump was 3.21. This means that the system delivers at least 3.21 units of heat for every unit of electricity consumed, which indicates high efficiency. From an operational perspective, the seasonal efficiency is influenced not only by source temperature but also by part-load operation, daily flow variability, and auxiliary electricity consumption of circulation pumps and control systems. Using the observed daily flow range, the effective heat pump loading varies significantly, which implies that real operating COP values fluctuate around the nominal point values. This confirms that forecast-supported sizing and control strategies are necessary to maintain high seasonal efficiency under variable hydraulic conditions.
3.4. Estimated Financial Savings
Assuming that the treatment plant consumes 45.1 MWh of energy per year for heating, the heat recovery system can cover up to 100% of this demand. This translates into financial savings of EUR 2310 per year compared to gas heating (
Table 4).
On the basis of the data compiled in
Table 4, it is evident that even with moderate coverage of 50% of demand, the cost of electricity for a heat pump is significantly lower than the cost of the corresponding amount of heat from gas, despite the use of a gas boiler with 92% efficiency. The annual savings in this model amount to EUR 1155. With a COP in the range of 3–3.5, a wastewater heat recovery system is economically justified. The use of a sufficiently efficient heat pump allows the full demand for DHW and heating to be covered. This is possible with just one NIBE AP-BW 30-85H heat pump manufactured by NIBE-Biawar, Białystok, Poland with a COP of 3.20.
3.5. Economic Analysis
The estimated CAPEX investment cost is EUR 30,308. The use of an 85 kW NIBE AP-BW30 heat pump to heat the staff building at the sewage treatment plant in Gorzyce (heat demand 45,100 kWh/year) significantly reduces both operating costs and carbon dioxide emissions compared to a gas boiler. When the pump is powered by electricity from the grid, annual heating costs are reduced by approximately EUR 2310 (ΔK), resulting in a payback period (SPBT) of 13 years.
where:
SPBT—simplified formula for simple payback period, [years];
CAPEX—total capital expenditure, [EUR];
ΔK—annual cost savings, [EUR/year].
Table 5 presents a simplified sensitivity analysis of thermal performance and economic indicators with respect to heat exchanger effectiveness, reflecting possible degradation due to fouling and scaling under wastewater operating conditions.
The SPBT index will increase to 14.5 when the efficiency of the heat exchanger system decreases to 0.5. This corresponds to a situation in which the exchanger is heavily fouled (
Table 5). The results show that although exchanger degradation reduces seasonal efficiency and increases electricity consumption, the overall economic feasibility remains preserved, because the available wastewater heat potential substantially exceeds the facility demand.
Even though the SPBT value presents a short period of time for the investment costs recovery, the economic aspect with respect to discounted cash flow analysis is more reliable than a simple index estimation. Therefore, net present value (NPV) was calculated.
where:
NPV—net present value, [EUR];
CFt—net cash inflow or outflow during a single period (t), [EUR/year];
r—discount rate, [%];
t—time period, [year];
CAPEX—total capital expenditure, [EUR].
NPV involves the analysis of change in the value of money over time, and that is why the calculation procedure included the 3% discount rate. The heat pump purchase is considered as a safe investment. The risk-free rate in euros is typically the yield on 10-year government bonds (e.g., German Bunds) or the OIS swap rate, which are presently expected to hover around 2.5–3.0%. Due to the fact that heat pump installation presents the pollution reduction, as well as energy efficiency increase, the sewage treatment plant may benefit from several EU funds or national programs in order to decrease their own investment costs. Therefore, it was assumed that most of the expenses are not based on the sewage plant assets: EUR 15,000 is a co-financed investment funding in water and sewage infrastructure, and EUR 10,000 is a contracted subsided loan for 5 years with a 1.5% interest rate. Moreover, the heat pump maintenance costs were calculated as EUR 400 per year, which constitutes the financial outflows.
Table 6 presents the NPV after 15 years of system operation, calculated for the economic results (the annual savings, which are considered the financial inflows) with respect to heat pump’s heat exchanger effectiveness. What is more, in the last column, one may read the period of time after which the heat pump investment supplied with sewage system presents economic viability (the year in which NPV is above 0).
Comparing the estimation results presented in
Table 6 with the SPBT range, the discounted cash flow proves the financial benefits obtained by means of the proposed investment are potentially high. The SPBT value is above 13 years, whereas NPV > 0 is achieved in 10 to 11 years due to the financial support for investment costs. With respect to the investment profitability aspect, the value below 15 years does not require equipment replacement cycles inclusion in the calculation procedure.
When analyzing the electricity produced by own photovoltaic modules, the savings increase to approximately EUR 3981 per year (for ε = 0.8), and the payback period is reduced to 7–8 years with NPV equal to EUR 27,862 after 15 years.
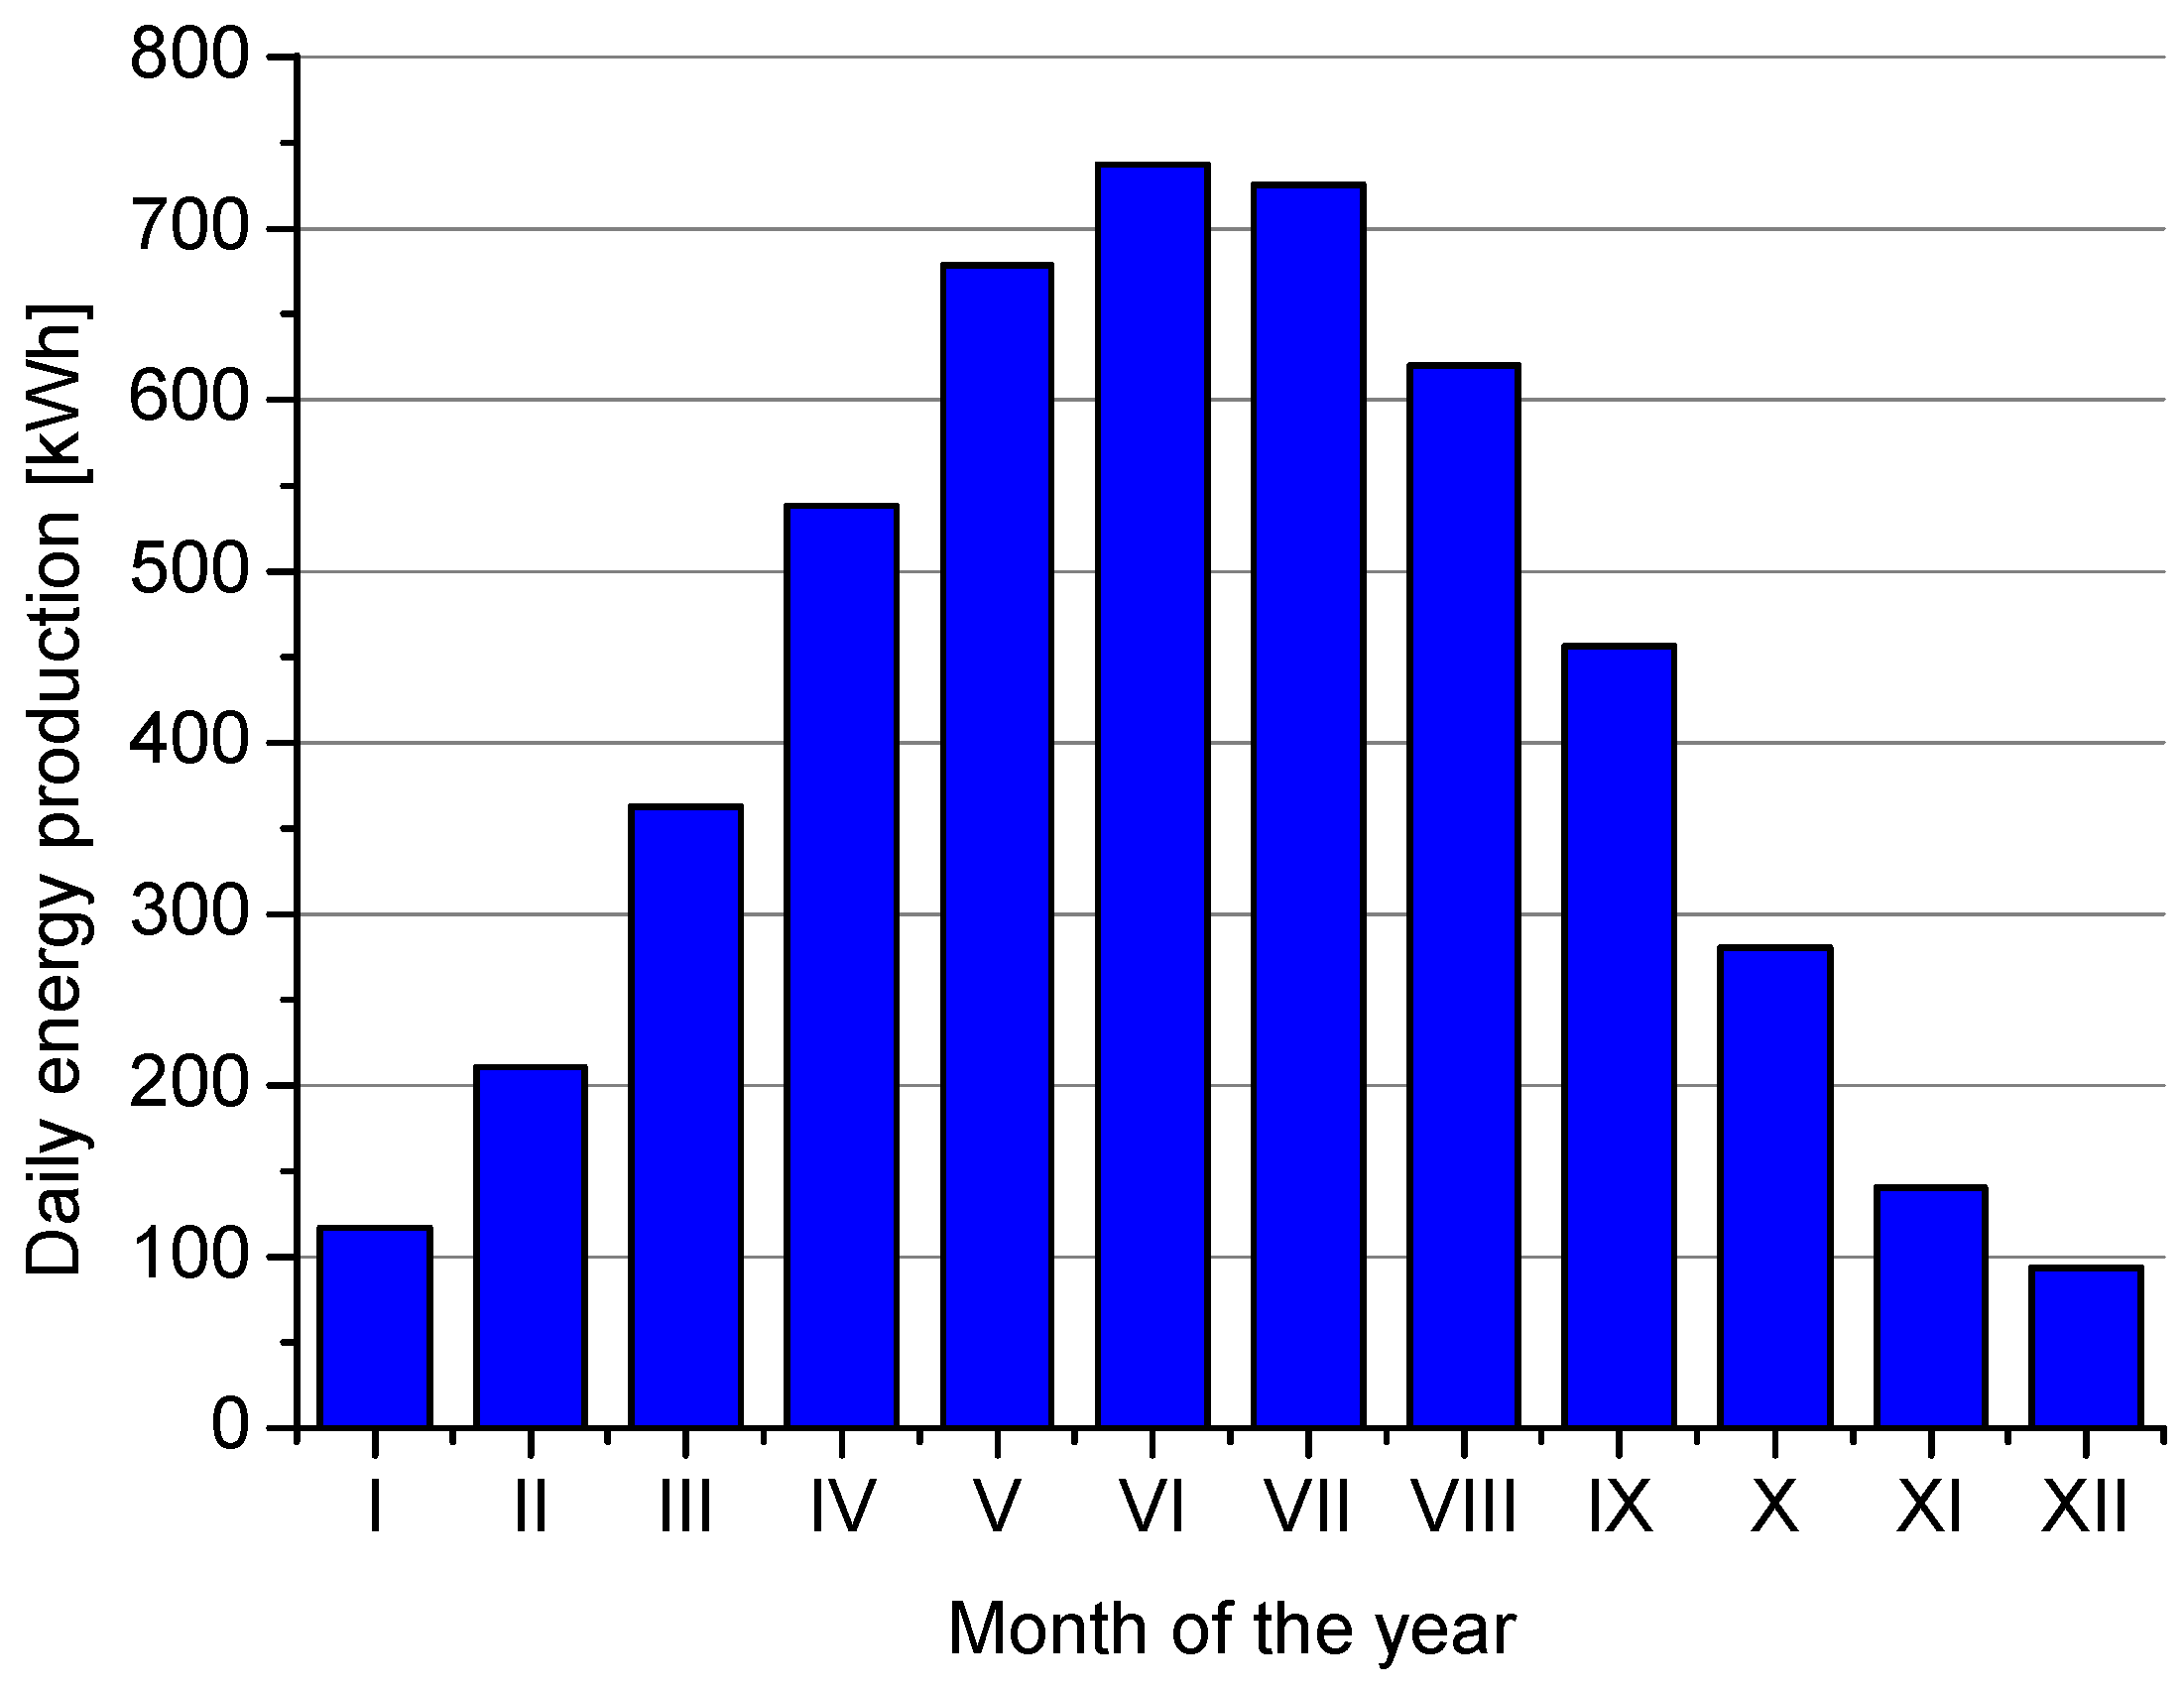
Figure 7 shows the electricity yield from photovoltaics in individual months of the year at the sewage treatment plant in Gorzyce, Podkarpackie Province. Even in December, daily energy production does not fall below 93.6 kWh. This translates into 2900 kWh of energy or approximately 145% of the monthly energy demand for a heat pump, which is 2000 kWh, according to the typical monthly distribution of heating demand. It proves that 120 kW PV covers the entire annual demand of the compressor with a large surplus, even in winter.
From an environmental point of view, with full PV power supply, CO
2 emissions fall was estimated by approximately 4.3 tones per year compared to gas heating. It was calculated by comparing the reference gas-based heating scenario with the wastewater heat pump system supplied by on-site photovoltaics. For the annual heat demand of 45,100 kWh, a conservative emission factor for delivered heat from natural gas (≈0.12 kg CO
2/kWh, including boiler efficiency) was assumed. For the heat pump supplied with PV electricity, only the life-cycle carbon footprint of photovoltaic generation was considered, resulting in substantially lower equivalent emission and a net avoided emission of about 6.7 t CO
2 per year (for SCOP = 3.21). As it was presented in the paper, the PV system energy production exceeds the compressor electricity demand even during months with low solar energy accessibility (see
Figure 7,
Table 2). However, auxiliary electricity consumption may influence the ecologic indexes, and when the compressor’s energy needs are supplied from the power grid, the net avoided emission decreases to about 1.8 t CO
2 per year (for SCOP = 3.21). Heat exchanger fouling may result in further environmentally friendly decline, as presented in
Table 7.
However, these results still show that a hybrid heat pump and photovoltaic installation are economically viable solutions and clearly more environmentally friendly than traditional gas heating.
4. Discussion
The results obtained in this study indicate that municipal wastewater can constitute a stable and technically accessible low-temperature heat source; however, the actual operating performance of wastewater heat recovery systems is determined by several interacting operational factors. In this study, particular attention was given to flow variability, temperature stability, forecast accuracy, exchanger efficiency, and auxiliary energy demand, as these parameters directly influence real system efficiency and recoverable heat under field conditions.
Although the measured wastewater temperature in the Gorzyce treatment plant remained within a range favorable for heat pump operation, the dataset covers only 1 operational year and does not include extreme multi-year variability, abnormal hydraulic events, or long-term climate-related trends. Therefore, the demonstrated thermal stability should be treated as site-specific and time-limited rather than universally representative. A key component of the analysis was the application of artificial neural networks for wastewater flow forecasting. The superior performance of RBF networks compared to MLP models is consistent with their known suitability for local approximation problems. Nevertheless, the model evaluation was based primarily on short-term forecasting accuracy and a limited set of input variables. The models did not explicitly include exogenous drivers such as precipitation intensity, infiltration/inflow dynamics, operational disturbances, or seasonal population variability. This means that while the short-horizon forecasts are accurate under normal operating conditions, model robustness under atypical hydraulic loads remains unverified. There is also a non-negligible risk of overfitting in RBF structures with a relatively high number of neurons, which may reduce transferability to other treatment plants without recalibration.
The estimated annual heat potential of approximately 1.16 GWh/year (for a 1 K cooling depth) demonstrates high theoretical availability of thermal energy, but this value should be interpreted as a technical upper bound rather than an operationally guaranteed yield. In practice, effective heat recovery is constrained by exchanger fouling, hydraulic losses, maintenance downtime, control strategy limitations, and minimum discharge temperature requirements imposed by environmental regulations. Long-term performance degradation of heat exchangers operating in wastewater environments—due to scaling and biofilm formation—was not modeled and may significantly reduce real efficiency over time.
The reported COP and SCOP values are based on design-point assumptions and steady-state thermodynamic relations. In real installations, seasonal performance is influenced by part-load operation, auxiliary energy consumption (pumps, controls, filtration), and transient temperature variations at both source and sink sides. These effects typically lower field performance factors relative to nominal values. Therefore, the presented efficiency indicators should be interpreted as expected ranges rather than guaranteed operational metrics.
An extended sensitivity analysis was performed to evaluate how reduced heat exchanger effectiveness affects seasonal efficiency and economic performance. While the base case assumed exchanger effectiveness ε = 0.8, additional scenarios with ε = 0.7, 0.6, and 0.5 were analyzed to represent progressive fouling conditions. Even at ε = 0.5, the annual recoverable heat potential (≈0.73 GWh/year) remains significantly higher than the facility’s heating demand (0.045 GWh/year), indicating that the system is demand-limited rather than source-limited.
The economic assessment also depends strongly on boundary assumptions. Energy price levels, electricity–gas price ratios, and PV self-consumption rates were treated as fixed parameters for the SPBT calculation procedure. In reality, they are volatile and policy-dependent, and that is why the inclusion of a discounted cash flow analysis (NPV) was proposed to enhance the investment attractiveness. Moreover, the favorable payback period obtained with PV support assumes high coincidence between PV production and heat pump electricity demand, without detailed hourly matching analysis. Therefore, this synergy may be overestimated.
From an environmental standpoint, the calculated CO2 reduction is significant, yet it is based on simplified life cycle assumptions. A full life cycle assessment, including equipment manufacturing, refrigerant leakage risk, and infrastructure modifications, would provide a more complete environmental balance. Additionally, large-scale deployment of wastewater heat recovery could, in some contexts, influence downstream wastewater temperatures and biological treatment kinetics. This effect was not evaluated in the paper but noted in recent process-level studies.
From an operational engineering perspective, the sensitivity results also highlight the importance of exchanger monitoring and preventive maintenance strategies in wastewater heat recovery systems. Because thermal output and effective seasonal performance decrease approximately linearly with exchanger effectiveness, periodic inspection and cleaning intervals can be directly linked to the expected efficiency and payback stability. In the analyzed case, even substantial exchanger degradation does not eliminate economic viability due to the large surplus of available wastewater heat relative to building demand. However, neglecting maintenance would measurably extend the payback period and increase electricity consumption. Therefore, integrating exchanger performance diagnostics, fouling indicators, and forecast-based load control into system operations is recommended. Such measures improve long-term performance predictability and reduce the gap between nominal design parameters and field efficiency, which is critical for scaling wastewater heat recovery solutions in municipal infrastructure.
5. Conclusions and Future Prospects
This study demonstrates that treated municipal wastewater can serve as a stable and technically viable low-temperature heat source for heat pump systems at wastewater treatment plants. Based on measured operational data from 2025 and model-supported flow forecasting, the analyzed case confirms both technical feasibility and practical applicability of sewage heat recovery under real operating conditions.
The results show that even with a conservative cooling depth of 1 K, the available annual wastewater heat potential (approximately 1.16 GWh/year at exchanger effectiveness ε = 0.8) substantially exceeds the heating demand of the analyzed facility (45.1 MWh/year). This indicates that in similar plants, the system is typically demand-limited rather than source-limited, which increases design flexibility and operational robustness.
Forecasting of the wastewater flow using artificial neural networks proved to be useful for operational planning and system sizing. In particular, RBF networks achieved higher predictive accuracy than MLP structures for short-term flow estimation, improving reliability of load assessment and reducing the risk of heat pump oversizing or undersupply under variable hydraulic conditions.
Thermodynamic and seasonal performance indicators confirm high efficiency of the proposed configuration, with the COP values in the range of approximately 3.0–3.4 and the SCOP around 3.2 under base assumptions. Extended sensitivity analyses showed that exchanger degradation due to fouling (ε reduced from 0.8 to 0.5) lowers effective seasonal efficiency and increases electricity consumption but does not eliminate economic feasibility in the analyzed case. The simple payback period increases only moderately (from about 13 to about 15 years), confirming resilience of the investment outcome to realistic operational deterioration with the NPV above 0 (proving the investment viability) in 10 to 11 years.
The economic performance remains strongly dependent on electricity and gas price relations, as well as on on-site renewable electricity supply. Coupling the heat pump with photovoltaic generation significantly improves economic and environmental indicators and reduces the exposure to energy price volatility. Hybrid configurations with local renewable sources should therefore be considered a preferred implementation pathway.
From an operational standpoint, achieving the expected field performance requires the inclusion of flow variability, part-load behavior, auxiliary energy consumption, and exchanger condition in the system assessment. Forecast-supported control, exchanger performance monitoring, and preventive maintenance strategies are key factors in ensuring that real efficiency approaches design values.
Future work should include multi-year datasets, fouling-aware exchanger performance modeling, and dynamic hourly energy matching between heat pump and PV generation. Extending the methodology to multiple treatment plants of different scales would further improve the transferability and support broader deployment of wastewater heat recovery in municipal energy systems.




 ,
,