Article

A Dynamic Decision-Making Framework for Prioritizing Renewable Energy Technologies in Smart Cities Using Deep Learning and Hybrid Multi-Criteria Decision-Making


1
Department of Computer Engineering, Gachon University, Sujeong-gu, Seongnam-si 13120, Gyeonggi-do, Republic of Korea
2
Department of Artificial Intelligence, Tashkent State University of Economics, Tashkent 100066, Uzbekistan
3
Department of Information Systems and Technologies, Tashkent State University of Economics, Tashkent 100066, Uzbekistan
4
Centre of Excellence for Electric Vehicle and Related Technologies, Department of Electrical Engineering, Delhi Technological University, Delhi 110042, India
*
Author to whom correspondence should be addressed.
Energies 2026, 19(4), 1095; https://doi.org/10.3390/en19041095
Submission received: 18 January 2026 / Revised: 7 February 2026 / Accepted: 11 February 2026 / Published: 21 February 2026
(This article belongs to the Section A2: Solar Energy and Photovoltaic Systems)

Abstract

Rapid energy planning in cities needs decision-support tools that can change based on the supply of renewable resources and the needs of stakeholders. This paper introduces an innovative adaptive decision-support framework that integrates Long Short-Term Memory (LSTM)-based short-term renewable energy forecasting with an interval-valued Pythagorean fuzzy Best-Worst Method–TOPSIS (IVPF-BWM–TOPSIS). This enables forecast-driven and temporally adaptive prioritisation of urban energy technologies, as opposed to static expert-based evaluation. Using criteria based on forecasted technical feasibility and scalability, the five green energy options that are looked at are rooftop solar, wind energy, smart grids, solar-integrated electric vehicle infrastructure, and battery energy storage. The best score is for rooftop solar (RDC = 0.65), followed by solar-integrated EV infrastructure (RDC = 0.566), and finally smart grids (RDC = 0.55). Wind energy gets the lowest score because it will not be very useful in cities. Sensitivity analysis (±20% weight change) and 15 scenario-based stress tests show that the framework is strong and does not change the order of the ranks. The results show that the proposed mixed AI and fuzzy method can be used to make plans for renewable energy in smart cities that are both based on data and can be used by many people.

1. Introduction

Smart cities are cities that use information and communication technology to make things work better, last longer, and be better for people who live there. The use of sustainable energy systems is a key feature of smart cities. These systems are meant to meet the energy needs of cities in an environmentally friendly way, which helps the long-term health of the urban environment [1,2]. Every day, the demand for energy around the world goes up. Traditional ways of making energy have a big effect on both the cost of running a business and the environment. The world is getting better at technology, and it is easier to find other sources of energy. This makes it easier to make clean, sustainable energy while also dealing with important problems like climate change and population growth. Governments are seeing renewable energy (RE) sources as more and more attractive options because of the unstable political climate and rising oil prices. Because technology has come so far and there are other sources of energy, it is now easier to make clean, sustainable energy and deal with big problems like climate change and population growth. Governments see renewable energy sources as more appealing options because of the recent unstable political situation and rising oil prices [3,4]. Different renewable energies will be exploited by smart cities, which include solar energy, wind power, hydropower, and modern batteries, along with lower-energy-using buildings. Information technology is frequently used to provide real-time monitoring and control of the various means of producing and consuming energy. Sustainable energy systems will become increasingly important as smart cities continue to be built. Due to rapid urbanization, demand for clean, efficient sources of energy is increasing [5,6]. In this study, the factors affecting the implementation of sustainable energy technologies in smart cities will be identified. One of the key factors will be reducing greenhouse gas emissions. As cities are continuing to be pressured to reduce their carbon footprint due to the growing climate crisis, there is a need for cities to stop relying on fossil fuels and instead turn to renewable energy sources such as solar, wind, and hydroelectric generation. In addition, by using clean energy sources to reduce pollution, cities can provide residents with better health. Furthermore, the transition to sustainable energy solutions may result in decreased energy costs for cities. Now, renewable energy can be produced at prices similar to fossil fuel energy [7,8,9]. Undoubtedly, one of the major issues with utilizing sustainable smart city energy systems is figuring out how to properly integrate them into an existing urban infrastructure. To do so requires careful planning, coordination, and financial investment to adopt the new technology and develop the necessary infrastructure to support it. Additionally, there are many different types of user groups that will have varying degrees of priorities concerning their concerns for using energy sustainably. While one group may prioritize the reduction of greenhouse gas emissions as the primary focus, another group may not consider it a high priority and may be more focused on how to reduce their cost of delivered energy. In order to create a comprehensive and well-designed solution for sustainable energy Systems in Smart Cities, it is essential that all user groups’ concerns are taken into account when determining how to create the most sustainable energy system [10,11]. Changes in solar irradiance and wind speed, which are both important factors that affect how well renewable energy sources perform, are not often taken into account when making decisions under the planning frameworks that are now in place. Multi-criteria decision-making, or MCDM, is a method that has been used a lot in the field of energy planning to solve difficult problems. To utilize this method, many different things must be considered, and they will all have to agree with each other in a certain way. Most of the MCDM-based frameworks that are available presently assume that the weights of the criteria are determined, hence they do not use predictive analytics. Because of this, traditional methods cannot fully describe the dynamic and data-driven character of the smart city energy systems that are now in place. This is the situation because of how the systems work. Recent advancements in artificial intelligence, especially deep learning models such as Long Short-Term Memory (LSTM) networks, have enabled the development of strong skills for making short-term predictions about renewable energy sources. These skills have been able to grow. Even though these models are good at making predictions, they are usually employed on their own and not with decision-support frameworks. This means that they do not have much of an effect on strategic energy planning. Lastly, conventional analytical techniques seldom incorporate predictive modelling, optimisation, and fuzzy methodologies for Multi-criteria decision analysis (MCDA) within a single framework that effectively accounts for the complex nature of real-life decision-making contexts, where criteria can be subjective, uncertain, and dynamic.
In this paper, a novel way of using deep learning to forecast demand for renewable energy and further combining these forecasts with interval-valued Pythagorean fuzzy multi-criteria decision-making methodologies is introduced. The approach differs from those of previous authors who base their work on expert opinions. Instead, this method adjusts based on estimated levels of solar irradiance and wind velocity, as well as taking into consideration other relevant information such as technical feasibility and scalability. This empirical approach based on data provides a greater degree of confidence, relevance, and reliability in the area of renewable energy prioritisation as applied to smart cities.
The objectives of this study are:
  • To integrate deep-learning-based forecasts of solar irradiance and wind speed within the multi-criteria decision-making framework such that they can provide adaptability to the environment in real-time.
  • To develop a hybrid evaluation model that combines IVPF-BWM and IVPF-TOPSIS to enhance accurate and dependable prioritisation of renewable energy alternatives.
  • To test the adopted approach in a real-world smart city by assessing renewable energy options using technology-based, environment-based, economy-based, society-based and scalability-based factors.
  • To assess the impact of forecast-driven adjustments on final rankings and offer recommendations to policymakers, engineers, and planners for making informed decisions.
The paper is organized into 5 sections. The research context, motivation, and objectives are introduced in Section 1. Section 2 offers a thorough examination of the current body of literature on renewable energy evaluation methods, with a particular emphasis on the significance of imprecise decision-making and artificial intelligence. Section 3 delineates the hybrid methodology that has been proposed, which integrates interval-valued fuzzy logic with deep learning-based forecasting to facilitate multi-criteria decision analysis. The case study implementation is detailed in Section 4, which includes the evaluation of energy alternatives, expert input, and data analysis. The paper is concluded in Section 5 by providing a summary of the primary findings, implications for the planning of energy in smart cities, and recommendations for future research.

Related Work

A lot of research has been done on how to rate and rank renewable energy solutions in smart cities using multi-criteria decision-making (MCDM) methods. These approaches are especially effective at solving complicated problems that involve a lot of conflicting factors, like how they affect the environment, how much they cost, how feasible they are from a technological point of view, and how socially acceptable they are.
The best–worst method (BWM) and the technique for order of preference by similarity to ideal solution (TOPSIS) are two examples of classical multi-criteria decision-making (MCDM) strategies that have been widely used in the field of energy planning because they can consistently weigh and rank options [12,13]. TOPSIS assesses alternatives by gauging their proximity to the positive and negative ideal solutions, determining the optimal option as the one closest to the positive ideal solution (PIS) and furthest from the negative ideal solution (NIS). The author in [14] developed Pythagorean fuzzy sets (PFSs), which improve the representation of uncertainty by broadening the scopes of membership and non-membership. In [15] Pythagorean fuzzy sets, outlines comple-ment and aggregation procedures, and implements them in multicriteria decision-making for the efficient comparison of possible outcomes. This study employs PFSs to tackle expert uncertainty in the evaluation of smart energy systems. In [16], the author used a Choquet integral and multi-hesitant fuzzy language set to look at green energy sources in smart towns and see how well they met demand. In [17], the authors used an approach that combined spherical fuzzy AHP and EDAS based on fuzzy c-means clustering to check how sustainable, resilient, and livable European towns are. In [18], the author looked at a difficult energy decision-making issue and suggested two methods, Fuzzy-Weighted Zero-Inconsistency (FWZIC) and Multi-Attributive Border Approximation Area Comparison (MABAC), to test and compare different sustainable energy systems. The author in [19] suggested the CRITIC-SWARA-CODAS method with interval-valued picture fuzzy sets to look at the problem of sustainable growth and how to use green energy. The authors of [20] used a method that combines fuzzy reasoning and solutions based on nature to make building projects more energy-efficient. A recent study concentrated on the examination of energy and urban mobility systems, particularly investigating advanced fuzzy and multi-criteria decision-making (MCDM) methodologies. The research was executed in the United States. In [21], the authors showed that spherical fuzzy sets could help people make decisions about energy when things are unclear or not exact. To evaluate potential energy storage technologies in Egypt, a spherical fuzzy multi-criteria decision-making (MCDM) framework was developed. Using the MCDM framework, the authors of [22] came up with a similar method for evaluating micro-mobility services. The APPRESAL approach was able to show an increase in service efficiency by carefully combining a number of different performance measures. To improve uncertainty modeling, ref. [23] suggested a framework for a multi-criteria decision-making (MCDM) mechanism that is based on a Fermatean fuzzy Aczel–Alsina framework. This made the modeling even more accurate. This framework is especially useful when there is a lot of uncertainty because it lets you show expert evaluations in a more flexible way. The study utilized interval-valued Pythagorean fuzzy sets (IVPFS) to generate a representation of membership and non-membership degrees that was both more comprehensive and more adaptable [24]. This was especially useful when things were not clear and when it was hard to get information. IVPFS-based MCDM techniques have been effectively employed across various domains, including resilience evaluation, supply chain performance assessment, and renewable energy system analysis [25]. Recently, probabilistic decision-making was used to find the best battery electric vehicle (BEV) out of ten options. MEREC, CRITIC, and equal-weight algorithms looked at eleven research criteria before choosing. The probabilistic BEV selection method always found the best BEV and made rankings that were similar to those from PIV, TOPSIS, and SAW [26]. Recent studies have combined text-mining and multi-criteria decision-making (MCDM) approaches to support consumer-oriented battery electric vehicle (BEV) selection. In particular, an LDA-based fine-grained sentiment analysis framework integrated with DEMATEL, DANP, and VIKOR methods was used to evaluate BEV alternatives based on consumer concerns such as safety, technology, performance, comfort, and cost, leading to consistent ranking and optimization strategies for BEV adoption [27]. These studies show that MCDM may solve multi-criteria and uncertain decision issues in sustainable energy and transportation planning, prompting the usage of sophisticated fuzzy MCDM approaches in this study.
There remains a considerable research gap, notwithstanding the extensive literature on fuzzy MCDM and AI-driven energy forecasting. Most of the frameworks that are currently in use do not include short-term forecasting of renewable energy in fuzzy decision-making models, and they also do not properly assess resilience in a range of policy-driven and scenario-based situations. This gap is what led to the development of an adaptive, forecast-driven decision-support system that combines AI-based prediction with interval-valued fuzzy MCDM in the context of smart city energy planning.

2. Interval-Valued Pythagorean Fuzzy BWM & TOPSIS Methodology

Preliminaries on PFS as well as the stages of the proposed IVPF BWM and IVPF TOPSIS approach are described in this part in a sequential order.

2.1. IVPF-BWM for Criteria Weights

The interval-valued Pythagorean fuzzy best–worst method (IVPF-BWM) is used to assess the relative significance weights of assessment criteria amongst ambiguity via expert evaluations. The procedure includes the following stages:
Step 1: Selection of Best and Worst Criteria: Experts identify the most and least important criterion, which are Cx, Cy, respectively. Comparisons are made using a predefined linguistic scale, converted into IVPFNs.
Step 2: Best-to-Others Vector Construction: Each expert compares the best criterion Cx to all other criteria Cj, forming the best-to-others IVPF preference vector:
R X k ~ = (   r X 1 k ~ ,   r X 2 k ~ ,   r X 3 k ~ , . r X n k ~ )
With:
r X j k ~ =   ( [ μ L x j   , μ L x j ] ,   ϑ L x j ,   ϑ U x j )
Step 3: Others to worst vector construction
R y k ~ = (   r Y 1 k ~ ,   r Y 2 k ~ ,   r Y 3 k ~ , . r Y n k ~ )
With:
r Y j k ~ =   ( [ μ L Y j   , μ L Y j ] ,   ϑ L Y j ,   ϑ U Y j )
Equations (1)–(4) define the best-to-others and others-to-worst comparison vectors R X k ~ and R y k ~ as established by the kth decision maker, where r X j k ~ and r Y j k ~ show the fuzzy preferences of the best and j-th criterion compared to the worst and others. To make it easier to model uncertainty in expert judgments using Pythagorean fuzzy numbers, the symbols μ and ϑ show the degrees of membership and non-membership, respectively, and L and U show their lower and upper limits.
Step 4, Optimal IVPF weights W j k ~ where j and k are obtained by reducing the largest difference between subjective assessments and fuzzy weight ratios. The primary limitations encompass:
Consistency between optimal-to-suboptimal and suboptimal-to-minimal evaluations
Conditions of membership and non-membership:
( μ 2 U + ϑ 2 U )     1
Normalization and interval bounds:
0 μ L μ L 1 , 0 ϑ L ϑ u 1
a minimum value that is subject to numerous consistency restrictions є for every j.
Step 5: Aggregation of Expert Weights: The fuzzy weights that are provided by a number of different experts are compiled with the use of an IVPF generalized weighted averaging (IVPF-GWA) operator, which guarantees that there is a collective agreement.
Step 6: Score Function and Normalization: The fuzzy weights W c j ~ that are provided by several different experts are compiled with the use of an IVPF generalized weighted averaging (IVPF-GWA) operator, which ensures that there is a collective agreement.
s ( W c j ) ~ = μ 2 ϑ 2
W j = ( s ( W c j ) ~ + 1 ) / 2 j = 1 n ( s ( W c j ) ~ + 1 ) / 2
The present paper describes the development of an innovative hybrid decision support framework addressing the dynamism of sustainable energy assessment in smart cities via the integration of artificial intelligence (AI) based time series prediction with complex fuzzy multi criteria decision making (MCDM) methods. This framework represents the combination of two distinct methodologies: the application of the long short term memory (LSTM) model as a predictive tool for estimating the amount of available renewable energy to be produced over time (solar, wind) by means of both historical and present day weather data, and then interlinking these predicted renewable energy candidates into a structured MCDM process utilizing the interval valued Pythagorean fuzzy best–worst method (IVPF-BWM) and the interval valued Pythagorean fuzzy technique for order of preference by similarity to ideal solution (IVPF-TOPSIS). The LSTM model provides predictions of solar irradiance and wind velocity, and will be a significant asset in evaluating the applied feasibility and potential for scale of renewable energy options. In addition, with the use of artificial intelligence (AI)-enhanced outcomes, we will be able to create an adaptive, context specific and data-driven process to develop the respective decision matrix that will guide the implementation of renewable energy technologies in urban environments. The IVPF-BWM component addresses uncertainty in expert preference through the representation of subsets of belief and non-belief on an interval-valued Pythagorean fuzzy scale, as a result representing a more precise representation of human judgment. The respective weights will be used to rank alternatives using IVPF-TOPSIS and to calculate the relative proximity of potential solutions to the optimal solution. This hybrid approach combining forecast-informed modelling with fuzzy logic decision analysis leads to improved innovation and resilience by enhancing the understanding of real-world variances in renewable energy systems. This method is well suited for smart city planning, where a significant amount of flexibility, precision and resilience are required to deal with uncertainty from environmental conditions and to accommodate the complexities associated with multiple stakeholders in a shared decision-making process [25].

2.2. IVPF TOPSIS

The interval-valued Pythagorean fuzzy TOPSIS (IVPF-TOPSIS) technique is an advanced multi-criteria decision-making methodology that uses interval-valued membership and non-membership values to account for uncertainty and subjective expert judgments. The detailed instructions are provided below.
Step 1: Create the IVPF Decision Matrix: Experts create an initial IVPF decision matrix, which includes interval-valued membership degrees [μL, μU] and non-membership degrees [vL, νU] for each criterion. This matrix enables the capturing of uncertainty throughout the assessment process.
Step 2: Expected Fuzzy judgments: An expert’s optimism level is represented by a coefficient λ ∈ [0, 1]. An optimistic expert (λ > 0.5) favors higher boundaries, while a pessimistic expert (λ < 0.5) prefers lower bounds. It is presumed that the optimism parameter λ remains constant at a value of λ = 0.5 for all experts on the subject. By doing so, it is ensured that the evaluations of experts remain consistent with one another and that the subjective variability is reduced to the greatest extent possible. The neutral setting, which is a representation of a balanced expectation between optimistic and pessimistic evaluations, is commonly utilised in research on interval-valued fuzzy decision-making. This setting is a representation of a balanced expectation. The expected values are computed as follows:
μ i j k = 1 λ k μ L , i j k + λ k μ u , i j k
ν i j k = λ k μ L , i j k + 1 λ k μ u , i j k
Equations (9) and (10) delineate the defuzzification of interval-valued membership information supplied by the k-th expert for criteria j and alternatives. In this context, μ L , i j k ,     μ u , i j k represent the lower and upper limits of the membership degree, respectively, while λ k ∈ [0, 1] signifies the preference coefficient that indicates the expert’s risk disposition. The numbers   μ i j k and ν i j k indicate the adjusted degrees of membership and non-membership, respectively, derived as weighted combinations of the interval boundaries.
Step 3: The Aggregated IVPF Decision Matrix: Expert views are gathered using weighted geometric techniques. Expert weights (γk) show their relative credibility. To compute aggregated IVPF values, use the following formula:
In Equation (11), the aggregated membership degree μ i j a g g is determined by integrating the membership values μ i j k of all experts, while considering their significance γk, thereby ensuring consensus yet maintaining a degree of uncertainty. Equation (12) computes the aggregated non-membership degree ν i j a g g by applying weights to the individual expert non-membership values Π ν i j k k γ
μ i j a g g = s q r t Π 1 μ i j k 2 k γ
ν i j a g g = Π ν i j k k γ
Step 4: Identify Ideal Solutions
The positive ideal solution (PPIS) and negative ideal solution (PNIS) are determined by the highest and lowest score values across all choices. The scoring function is stated as follows:
S c o r e A ~ i = μ 2 ν 2
PPIS is made up of the highest score values, whilst PNIS has the lowest.
Equation (13) uses the score function to turn a fuzzy evaluation into a number. Higher scores mean better options. The negative ideal solution (PNIS) gets the lowest score, and the positive ideal solution (PPIS) gets the highest.
Step 5: Distance to Ideal Solutions: The distance between each option and the PPIS and PNIS is determined using a weighted Euclidean-like distance metric. The equation is:
D + A ~ i = 1 2 Σ w j μ i j 2 μ j + 2 + ν i j 2 ν j + 2 + π i j 2 π j + 2
D A ~ i = 1 2 Σ w j μ i j 2 μ j 2 + ν i j 2 ν j 2 + π i j 2 π j + 2
Equation (14) is used to find the weighted distance of each choice from the PPIS by looking at the degrees of membership, non-membership, and hesitation. Furthermore, Equation (15) gives each option’s PNIS deviation a weight.
Step 6: Rank Alternatives with RDC: To calculate the relative degree of closeness (RDC) for each option, use the following Equation (16), which looks at different options. A higher RDC means a better choice.
R D C i = D A ~ i D A ~ i + D + A ~ i   f o r   i   =   1 , 2 , 3 . m
Alternatives are listed in decreasing order of RDCi. Higher RDC values suggest that alternatives are closer to the ideal and, therefore, more desirable [28,29].

2.3. Overview of the Evaluation Framework

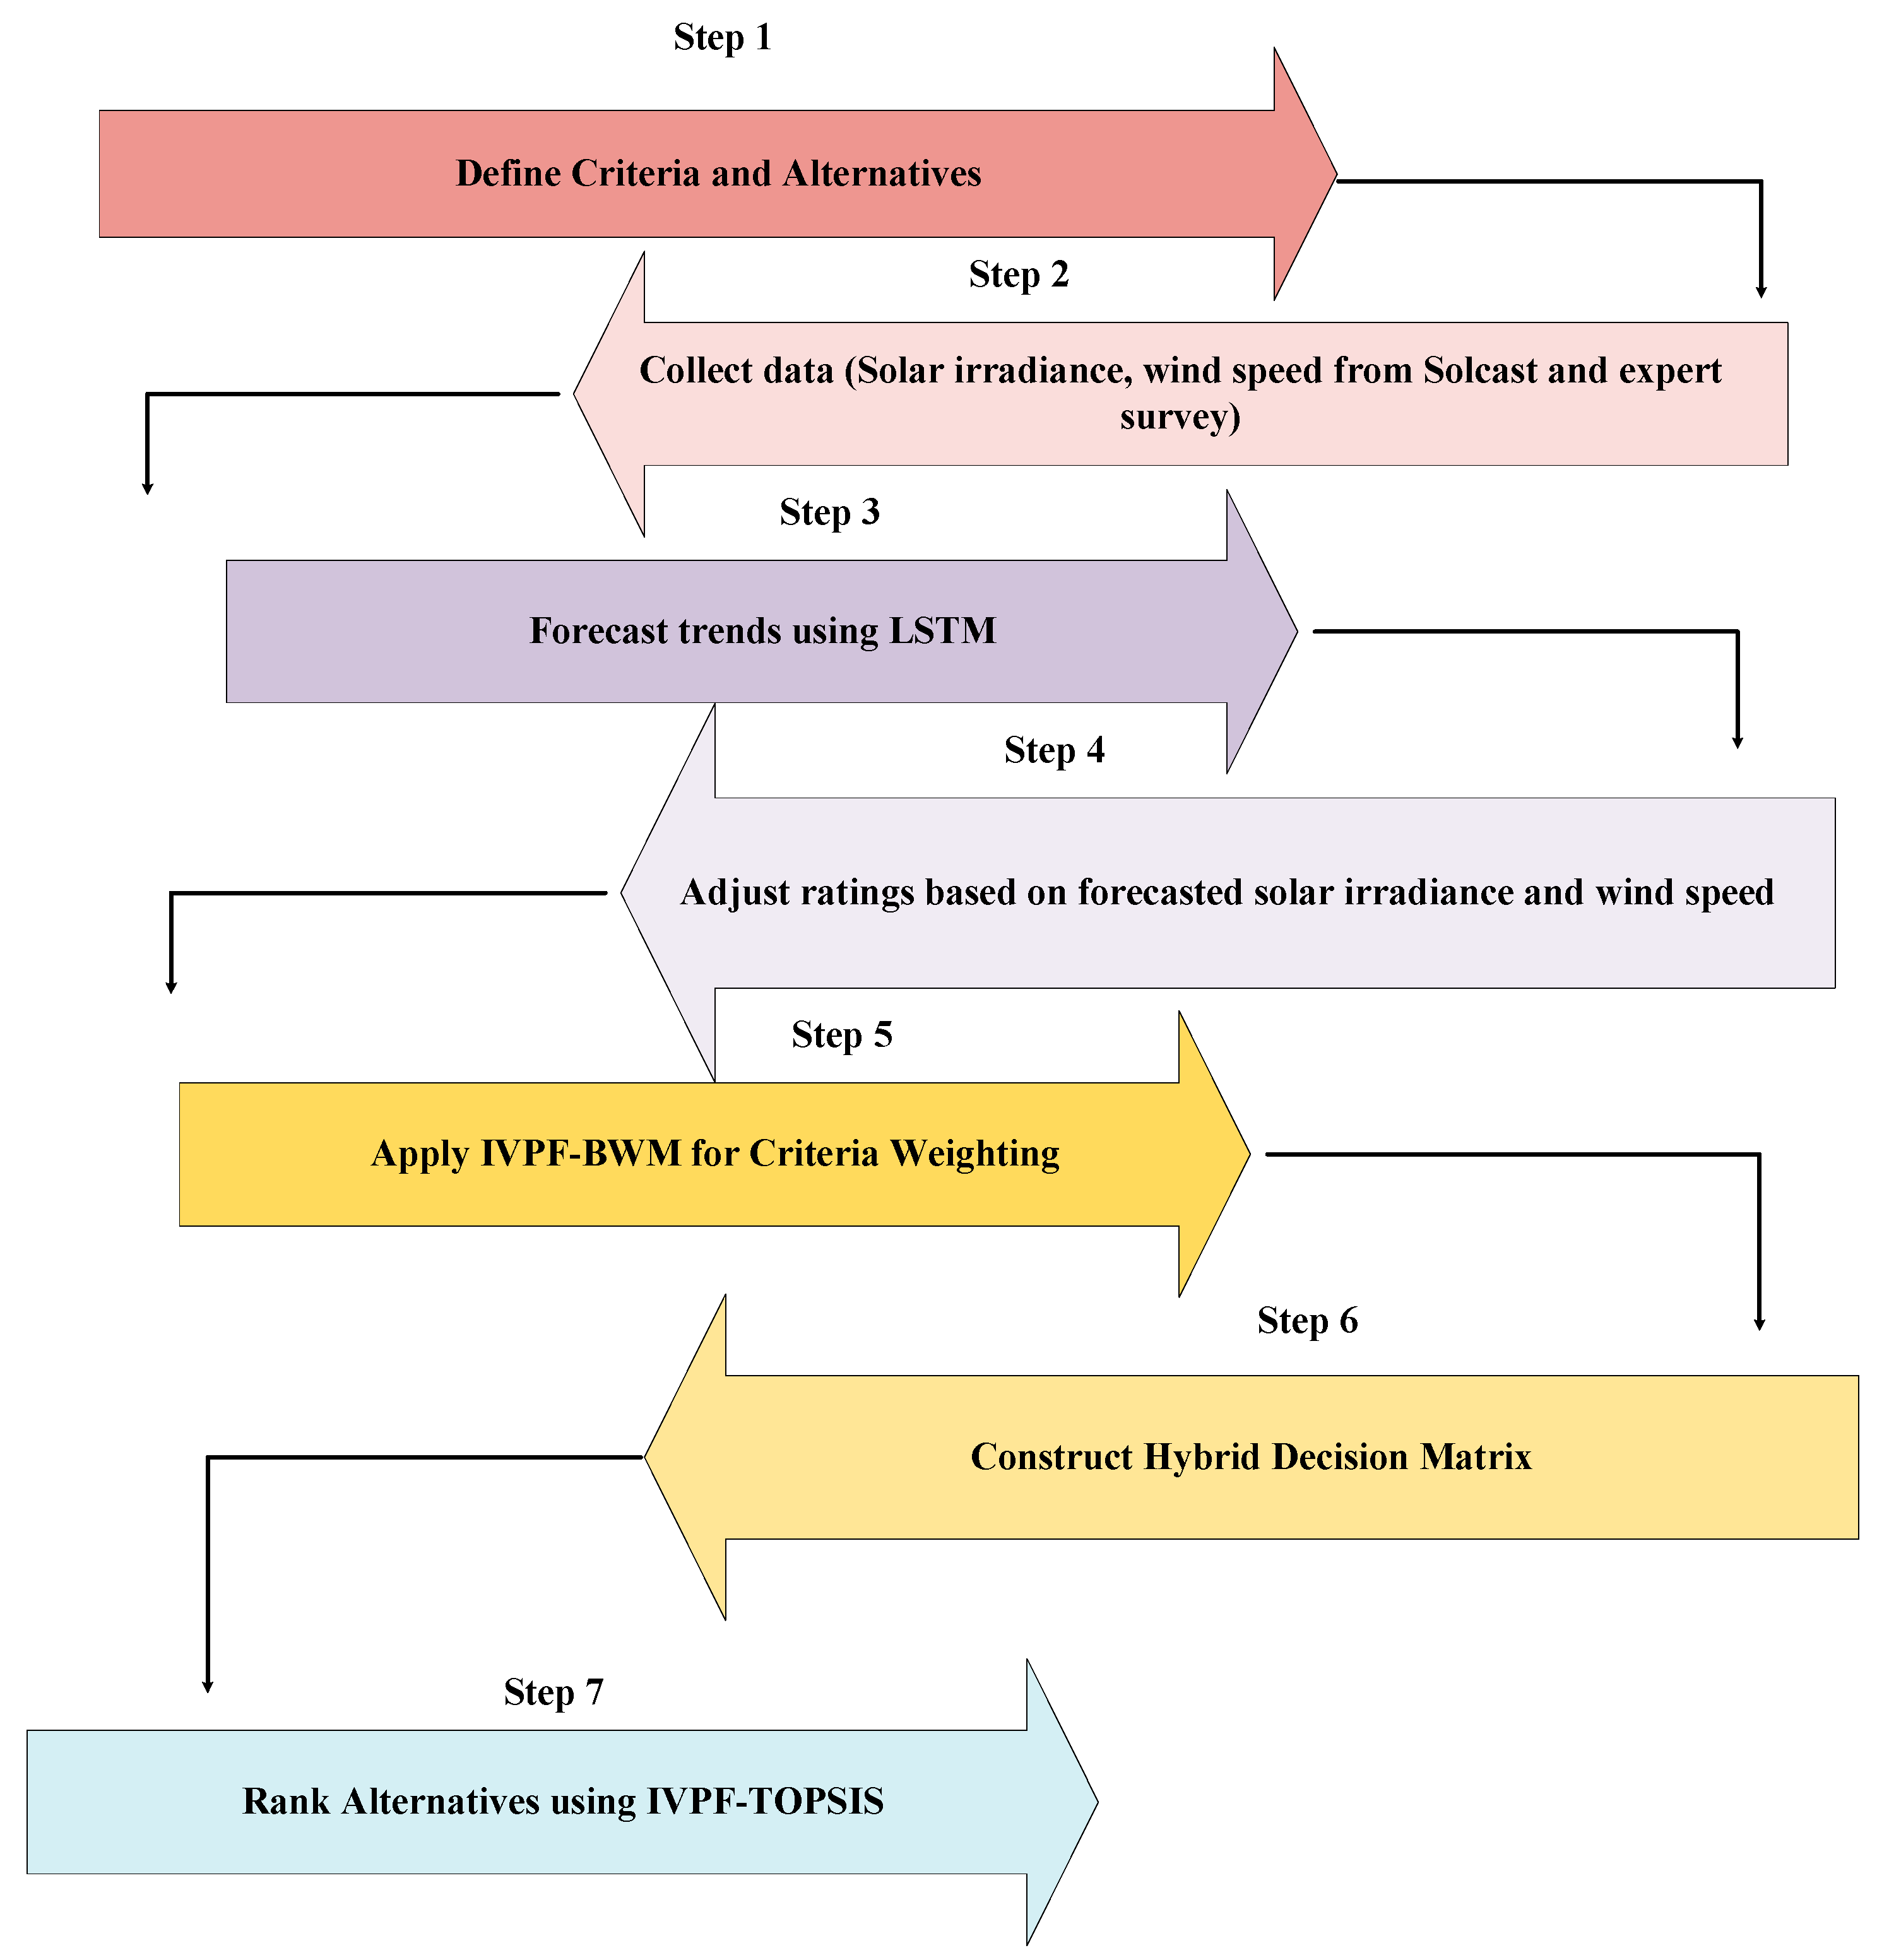
By utilizing Method IVPF-BWM in conjunction with TOPSIS, researchers can make better decisions when faced with uncertainty due to a lack of belief in one value or option. Method IVPF-BWM allows researchers to take into account both expert indecision and variability regarding the weighting of multiple criteria, while TOPSIS provides an effective way to rank the options based on their distance from an ideal option. The hybrid combination of these two types of techniques offers the necessary degree of realism and robustness needed to evaluate the complexities of developing energy systems. In addition, the flowchart in Figure 1 demonstrates how expert judgment can be combined with AI’s ability to predict renewable energy systems under conditions of uncertainty. The first step is to determine which criteria are most important for assessing renewable energy systems, including their environmental sustainability, their capital costs, and their technical feasibility and scalability (i.e., whether they are able to be deployed at different scales etc.). Second, the assessment framework is developed, and the relevant data are obtained. The environmental and stakeholder assessments in this paper focus on the availability of renewable resources at specific sites. The solar irradiation data coordinates for India, 20.5937° N, 78.9629° E, were sourced from the Solcast database [30]. These solar irradiance and wind speed data from Solcast are also used, as well as qualitative insights from subject matter experts obtained through structured questionnaires, to reflect local conditions and stakeholder preferences. Third, using LSTM neural networks in conjunction with both wind speed and solar irradiance, a short-term forecast of wind and solar supply will be generated, including future variability in these resources. Furthermore, a short-term forecast will be employed to adjust the technical feasibility (C4) and scalability (C6) of scores. A consistent and rising resource availability trend will boost energy option ratings. This dynamic adjustment adapts the model to real-world renewable energy performance swings. The interval-valued Pythagorean fuzzy best-worst Method (IVPF-BWM) to weight each assessment criterion is utilised. As experts choose the most and least significant criteria, fuzzy logic handles human judgment’s ambiguity and subjectivity to provide consistent and balanced weights. Further integrating expert assessments with LSTM-informed changes creates a hybrid decision matrix. The model successfully handles data and assessment uncertainty by expressing each element in this matrix as an IVPFN. The final ranking algorithm employs IVPF-TOPSIS on this matrix. Relative degree of closeness (RDC) scores are calculated by identifying ideal and non-ideal solutions and comparing them to standards. The ratings are used to evaluate energy choices, providing comprehensive, adaptable, and data-driven prioritizing. Finally, deep learning and fuzzy multi-criteria decision-making build a robust and context-aware decision-support tool. Its capacity to combine temporal projections and expert expertise makes it ideal for smart city energy planning, where flexibility, accuracy, and changeability are essential.
The selection of the best and worst criteria by each expert (E1 to E5), which is based on the multi-expert assessment framework. It is essential that this first step be completed in order to successfully apply the interval-valued Pythagorean fuzzy best-worst method (IVPF-BWM). In the predetermined set of criteria (C1 to C6), the experts were asked to assess which criteria were the most important and which were the least significant. According to the findings, there is a significant tendency toward C1 (Environmental Sustainability) and C4 (Technical Feasibility) as the best criterion, whilst C2 (Initial Investment) and C5 (Social Acceptability) are often considered to be the least essential criteria. The subjective character of the prioritizing of criteria based on individual viewpoints and contextual knowledge is shown by the fact that there is a diversity in the judgment of experts.

3. Implementation of IVPF Methodology

This section utilizes an integration of data-driven forecasting, fuzzy multi-criteria decision-making, and scenario-based robustness analysis to rank renewable energy technologies in smart cities. Long short-term memory (LSTM) neural networks are employed for the short-term prediction of solar irradiance and wind speed. These predicted values are used in two different methods: the interval-valued Pythagorean fuzzy best–worst method (IVPF-BWM) for weighting criteria and the interval-valued Pythagorean fuzzy TOPSIS (IVPF-TOPSIS) for ranking options. Furthermore, sensitivity analysis and scenario-based stress testing are performed to assess the stability and reliability of the derived rankings under diverse decision-making conditions.

3.1. Problem Definition

This paper presents a case study that was conducted in India. In addition to having a permanent population of over 18.6 million people, the territory also has a transient population that exceeds 500,000 people daily. The region has a total area of 1483 km2. Solar power, smart grid infrastructure, and urban storage systems are all areas that have the potential to provide renewable energy for a metropolitan region that is on the verge of quickly urbanising. Over 45,000 rooftop solar systems that generate more than 250 MW [31], 12 interstate wind power purchase agreements (PPAs) that provide nearly 1000 MW for grid compliance, and pilot battery storage systems that enhance grid stability are inside the city. More than 5.5 million smart meters are being installed, and over 4000 electric vehicle charging stations, most of which are powered by solar energy, i.e., Solar photovoltaic (SPV) systems, particularly rooftop SPV systems, are already in operation [32]. In accordance with India’s non-fossil energy objective of 500 GW by the year 2030, the considered location intends to develop its sustainable energy systems by implementing technologies that are intelligent, integrated, and climate-resilient [33]. The decision-making challenge entails picking the best appropriate energy choice from the following five options:
A1: Renewable energy systems mounted on top of existing roofs; having a SPV system installed will typically refer to buildings.
A2: Renewable energy suppliers can sell wind-generated energy to municipalities that lack sufficient wind-generated capacity due to participation from wind generators in other areas of the country. This conceptual approach allows municipalities to conform to renewable energy standards while simultaneously diversifying the energy supply they have available locally without having to build their own wind generation facilities. This concept will help facilitate de-carbonization of the grid through utilization of existing transmission lines.
A3: This approach utilizes new technology such as smart meters, demand forecasting algorithms, IoT-based monitoring systems, and automatic load balancing systems to create what are called “Smart Grids” and the development of smart energy management systems (“SEM”) that provide real-time visibility, increased energy efficiency, transition towards Smart Energy Grids and the assurance of reliable grid services in urban areas.
A4: Solar Powered Electric Vehicle (EV) Charging Stations.
This option uses solar energy to power up EV charging stations. The goal is to reduce the pollution created by urban transportation systems and provide cleaner air in urban areas. By using integrated EV infrastructure, electric vehicle charging stations (EVCS) can assist in reaching sustainable mobility targets while enabling the rapid deployment of green transportation technology.
A5: Urban Battery Energy Storage Systems (BESS)
Large-scale hydro storage is often unfeasible in urban areas because of limited space availability. Instead, battery-based energy storage systems provide a versatile alternative for storing surplus renewable energy, controlling peak demand, and ensuring grid stability. BESS increases the resilience of urban energy networks and supplements intermittent renewable sources such as solar and wind.
Each alternative is a strategic approach to a more robust and sustainable urban energy infrastructure. Furthermore, these possibilities are evaluated using the IVPF-MCDM model, which incorporates expert assessments and scenario-based criterion weighting to provide a reliable ranking of alternatives.

3.2. Evaluation of Sustainable Energy Systems Using IVPF Methodology

The expert evaluations in Table 1 and Table 2 show that there are different priorities when analyzing sustainable energy systems. Environmental Sustainability (C1) and Technical Feasibility (C4) were the most often ranked top criteria are C1 for its role in decreasing emissions (E1, E3) and C4 for assuring dependable supply and integration, especially with LSTM assistance (E2, E4).
Conversely, Initial Investment (C2) and Social Acceptability (C5) were often ranked as the least significant. Experts rated C2 as less crucial owing to lower expenses and increased financing (E2, E4), whereas C5 was seen as less variable due to strong public and policy support (E3, E5). The IVPF-BWM requires a comprehensive and multi-dimensional assessment of all variables in the energy planning process for smart cities. For E1, the technical feasibility (C4) and scalability (C6) criteria require projections of solar irradiance and wind speed; these are the variables most directly dependent on the future resource availability and performance of the energy sources. In contrast, C4 and C6 are also the most variable, and as such require continued data input to accurately reflect operational capacity and expansion. By employing an LSTM-based forecasting algorithm within the IVPF-BWM method, E1 can ensure that their scoring for both feasibility and scalability criteria are based upon projected trends rather than only on the author’s assumptions. This allows for greater precision and reliability of the evaluation and provides competent planners with the tools to make more informed and proactive decisions relative to the deployment of renewable energy in smart city infrastructure.
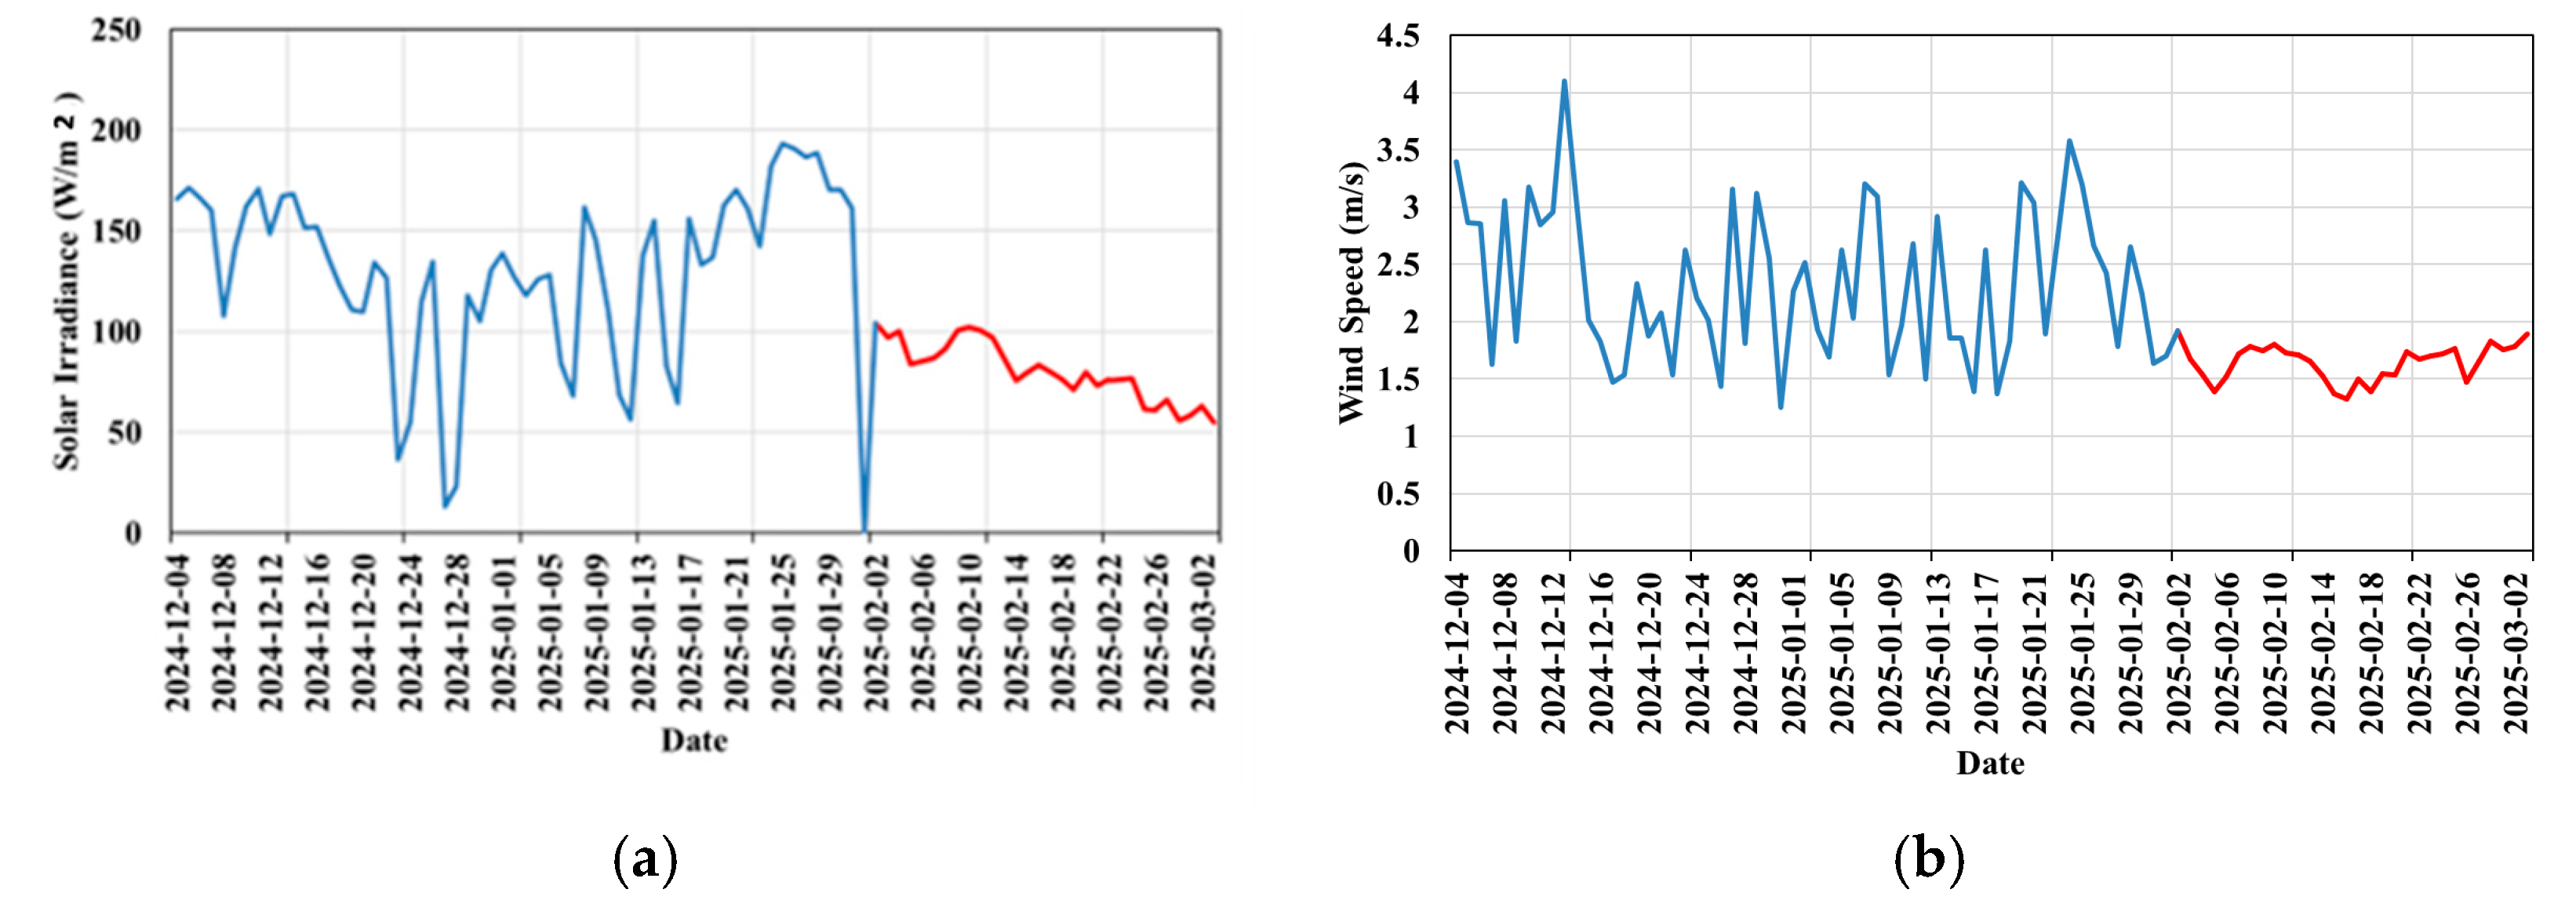
AI-based forecasting, specifically 30-day predictive modelling of solar irradiance (GHI) and wind speed at 100 m [30], improves MCDM decision-making accuracy. These estimates help evaluate C4 (Technical Feasibility) and C6 (Scalability), which are crucial for appraising renewable energy systems in smart cities. According to Figure 2a, solar irradiance predictions would continue to steadily and uniformly increase. The GHI values for each of the days are between 74 W/m2 (lowest) to 134 W/m2 (maximum daily output). For this reason, SPV technologies are expected to perform well within acceptable environmental conditions as long as this trend of consistently increasing GHI values continues. The 30-day forecasting horizon helps with short-term urban energy planning and making decisions like managing the grid, scheduling infrastructure, and planning for EV charging demand. Shorter forecasts are more accurate and less uncertain than longer or randomly chosen horizons. This makes them better for adaptive decision-support applications that need quick and useful information. Therefore, the relative ranking of solar-powered alternatives (under C4) will also have greater fuzzy membership grade (μL, μU) in MCDM based upon these two factors; i.e., consistent output reliability and ability to be easily incorporated into the current energy infrastructure. The lack of rapid irradiance reductions improves operating stability and technological maturity, which are crucial to technical feasibility. Forecasted irradiance has major consequences for C6 (Scalability). As urban energy needs rise, solar energy systems may be scaled across areas due to their regular and seasonal availability. Solar-dominant options such as rooftop PV installations and solar-integrated EV charging systems deserve higher IVPF ratings under C6. The capacity to duplicate performance across regions, legislative support, and public acceptability strengthen their long-term scalability. Conversely, the predicted wind speed is stable at 3.7–4.1 m/s with just slight variations as shown in Figure 2b. In Figure 2, the blue curve shows the actual values, and the red curve shows the predicted values. This consistency shows some operational predictability, although the magnitude is below the recommended threshold, usually >5 m/s, for effective utility-scale wind turbine operation. Wind energy options in urban areas with modest wind profiles may be technically constrained in C4 (Technical Feasibility). This evaluation shows lower fuzzy membership values and somewhat higher non-membership scores (vL, νU) for wind-related options. Additionally, the low wind prediction limits wind-based system expansion under C6 (Scalability). In low-wind zones, wind systems may have geographical, regulatory, and performance limits, unlike solar PV, which can be modularly expanded. To account for empirical limits, fuzzy weight allocation for wind energy under scalability must be adjusted. Embedding LSTM-derived forecasts into the fuzzy decision matrix makes the MCDM model data-responsive and dynamically adaptive, allowing decision-makers to align alternative rankings with environmental trends and performance indicators rather than theoretical or expert-assumed values. For smart cities, this results in a more scientifically grounded, temporally necessary, and context-aware assessment of sustainable energy technologies.
The hybrid LSTM-fuzzy MCDM framework is able to immediately adapt to fluctuations in the supply of renewable energy and the needs of stakeholders because it allows for the combination of short-term forecasting and fuzzy decision-making methodologies. The system uses LSTM-based forecasts of solar irradiance and wind velocity to adjust the technical feasibility and scalability requirements, as opposed to static MCDM procedures, which are dependent on the judgments of specialists. The present condition of the resources may be determined by doing a study of the rankings. For the purpose of capturing the preferences of stakeholders, interval-valued Pythagorean fuzzy sets are used. Being an expert comes with a certain amount of caution and doubt, and this makes it simpler to represent those feelings. In contrast, scenario-based dominance analysis is used for the purpose of analysing changes to the objectives of planning and policy. The framework is strong and adaptive as a result of the combination of these two features, which is especially valuable for planning energy usage in cities that are constantly expanding. This decision-support system that has been suggested is naturally scalable because of the modular structure that it has. It is possible to include additional renewable energy sources, assessment criteria, expert groups, and regulatory limitations without having to make any changes to the fundamental IVPF-BWM–TOPSIS technique. It is possible to retrain the LSTM forecasting models by making use of meteorological data that is particular to the city, but the fuzzy decision-making structure stays the same. This makes it possible to apply the concept in a simple manner to bigger metropolitan areas that include a variety of renewable portfolios and regulatory frameworks.

4. Results and Discussion

This section describes and addresses the findings of the proposed IVPF-BWM-TOPSIS framework, involving LSTM-based forecasting. First, expert judgments are transformed into IVPF scores in order to provide consistent and optimal criteria weights, which are then used to build the IVPF decision matrix for all renewable energy sources. Using these inputs, the aggregated weighted scores and relative closeness coefficients are calculated to produce the final ranking of choices for the urban energy scenario under consideration. Following this, the subsequent subsection provides an interpretation of how the performance of every decision is influenced by technical feasibility, scalability, and other sustainability factors. Finally, the section determines whether or not the decisions are robust by conducting scenario-wise and sensitivity assessments.

4.1. IVPF-Based Criteria Evaluation

Each of the five experts evaluated the “best-to-others” and “others-to-worst” comparisons, and the results are shown in Table 3, which contains the IVPF ratings. For the purpose of providing a more nuanced representation of linguistic uncertainty in expert assessments, these ratings are stated using interval-valued membership (μL, μU) and non-membership (vL, vU) values. The scores that are obtained as a consequence of the IVPF scoring function are a range that extends from −1 to 1 and are indicative of the relative intensity of different preferences; it is a typical approximation for fuzzy multi-criteria decision-making (MCDM) that converts interval-valued Pythagorean fuzzy numbers (IVPFNs) into a crisp scalar value for ranking or subsequent mathematical processing. For instance, Expert 1 gave criteria C5 a high score of 0.7588, which indicates that it is believed to be of high relevance in comparison to the criterion that is considered to be the least important. These scores will serve as the foundation for the subsequent phase, which will include the derivation of consistent and optimal criterion weights.
Following that, Table 4 provides a summary of the calculated IVPF scores and the normalised weights that correspond to each criterion, including the information supplied by individual experts. In order to ensure logical coherence in the comparison assessments, these weights are determined by using the IVPF-BWM model. This is accomplished by reducing the inconsistency parameter (ε). The findings indicate that different experts place different emphasis on different aspects. For example, Expert 2 assigned the greatest weight, i.e., 0.2488, to C4 (Technical Feasibility), but Expert 1 assigned the highest weight of 0.2062 to C5 (Social Acceptability). There are a variety of expert viewpoints that have been molded by their distinct areas of expertise and interpretations of sustainability goals, and these variances reflect those differences
Furthermore, Table 4 shows the normalized weights that were calculated for each expert using the IVPF-BWM method. These weights show the local criteria weights that have been worked out. The final ranking does not directly consider these local weights, which are based on the views of certain experts. The interval-valued Pythagorean fuzzy generalized weighted averaging (IVPF-GWA) operator is used to put together the local weights from all of the experts in the next step. This is done so that the IVPF-TOPSIS analysis can use the collective criterion weights. Table 5 presents expert-based assessments of five different renewable energy sources, namely solar, wind, smart grid, solar integrated EV, and BESS with regard to each of the six criteria. The fuzzy assessments of the experts are captured in each evaluation, which is represented by interval-valued membership and non-membership pairs. An example of this would be Expert 3′s rating of solar energy (A1) under criteria C1 with an IVPF value of ⟨[0.80, 0.95], [0.05, 0.15]⟩, which indicates a very high positive view. These interval-valued fuzzy assessments, when taken as a whole, comprise the decision matrix for the IVPF-TOPSIS technique. This matrix will be used in further analysis to rank the options according to the degree to which they are similar to the ideal response.
According to the modified MCDM weights, A2: Wind Energy exhibited a snall increase in wind speeds from LSTM projections, indicating its technical viability, i.e., C4, of 0.13 and reasonable scalability, i.e., C6, of 0.116. Conversely, A1: Solar Energy, despite optimistic irradiance projections, encountered deployment limitations, resulting in a C4 of 0.184 and a C6 of 0.186. A4: The solar-integrated electric vehicle capitalized on favourable solar projections and infrastructural synergy, achieving notable scores in C4, i.e., 0.16, and C6, i.e., 0.176 represented in Table 6.
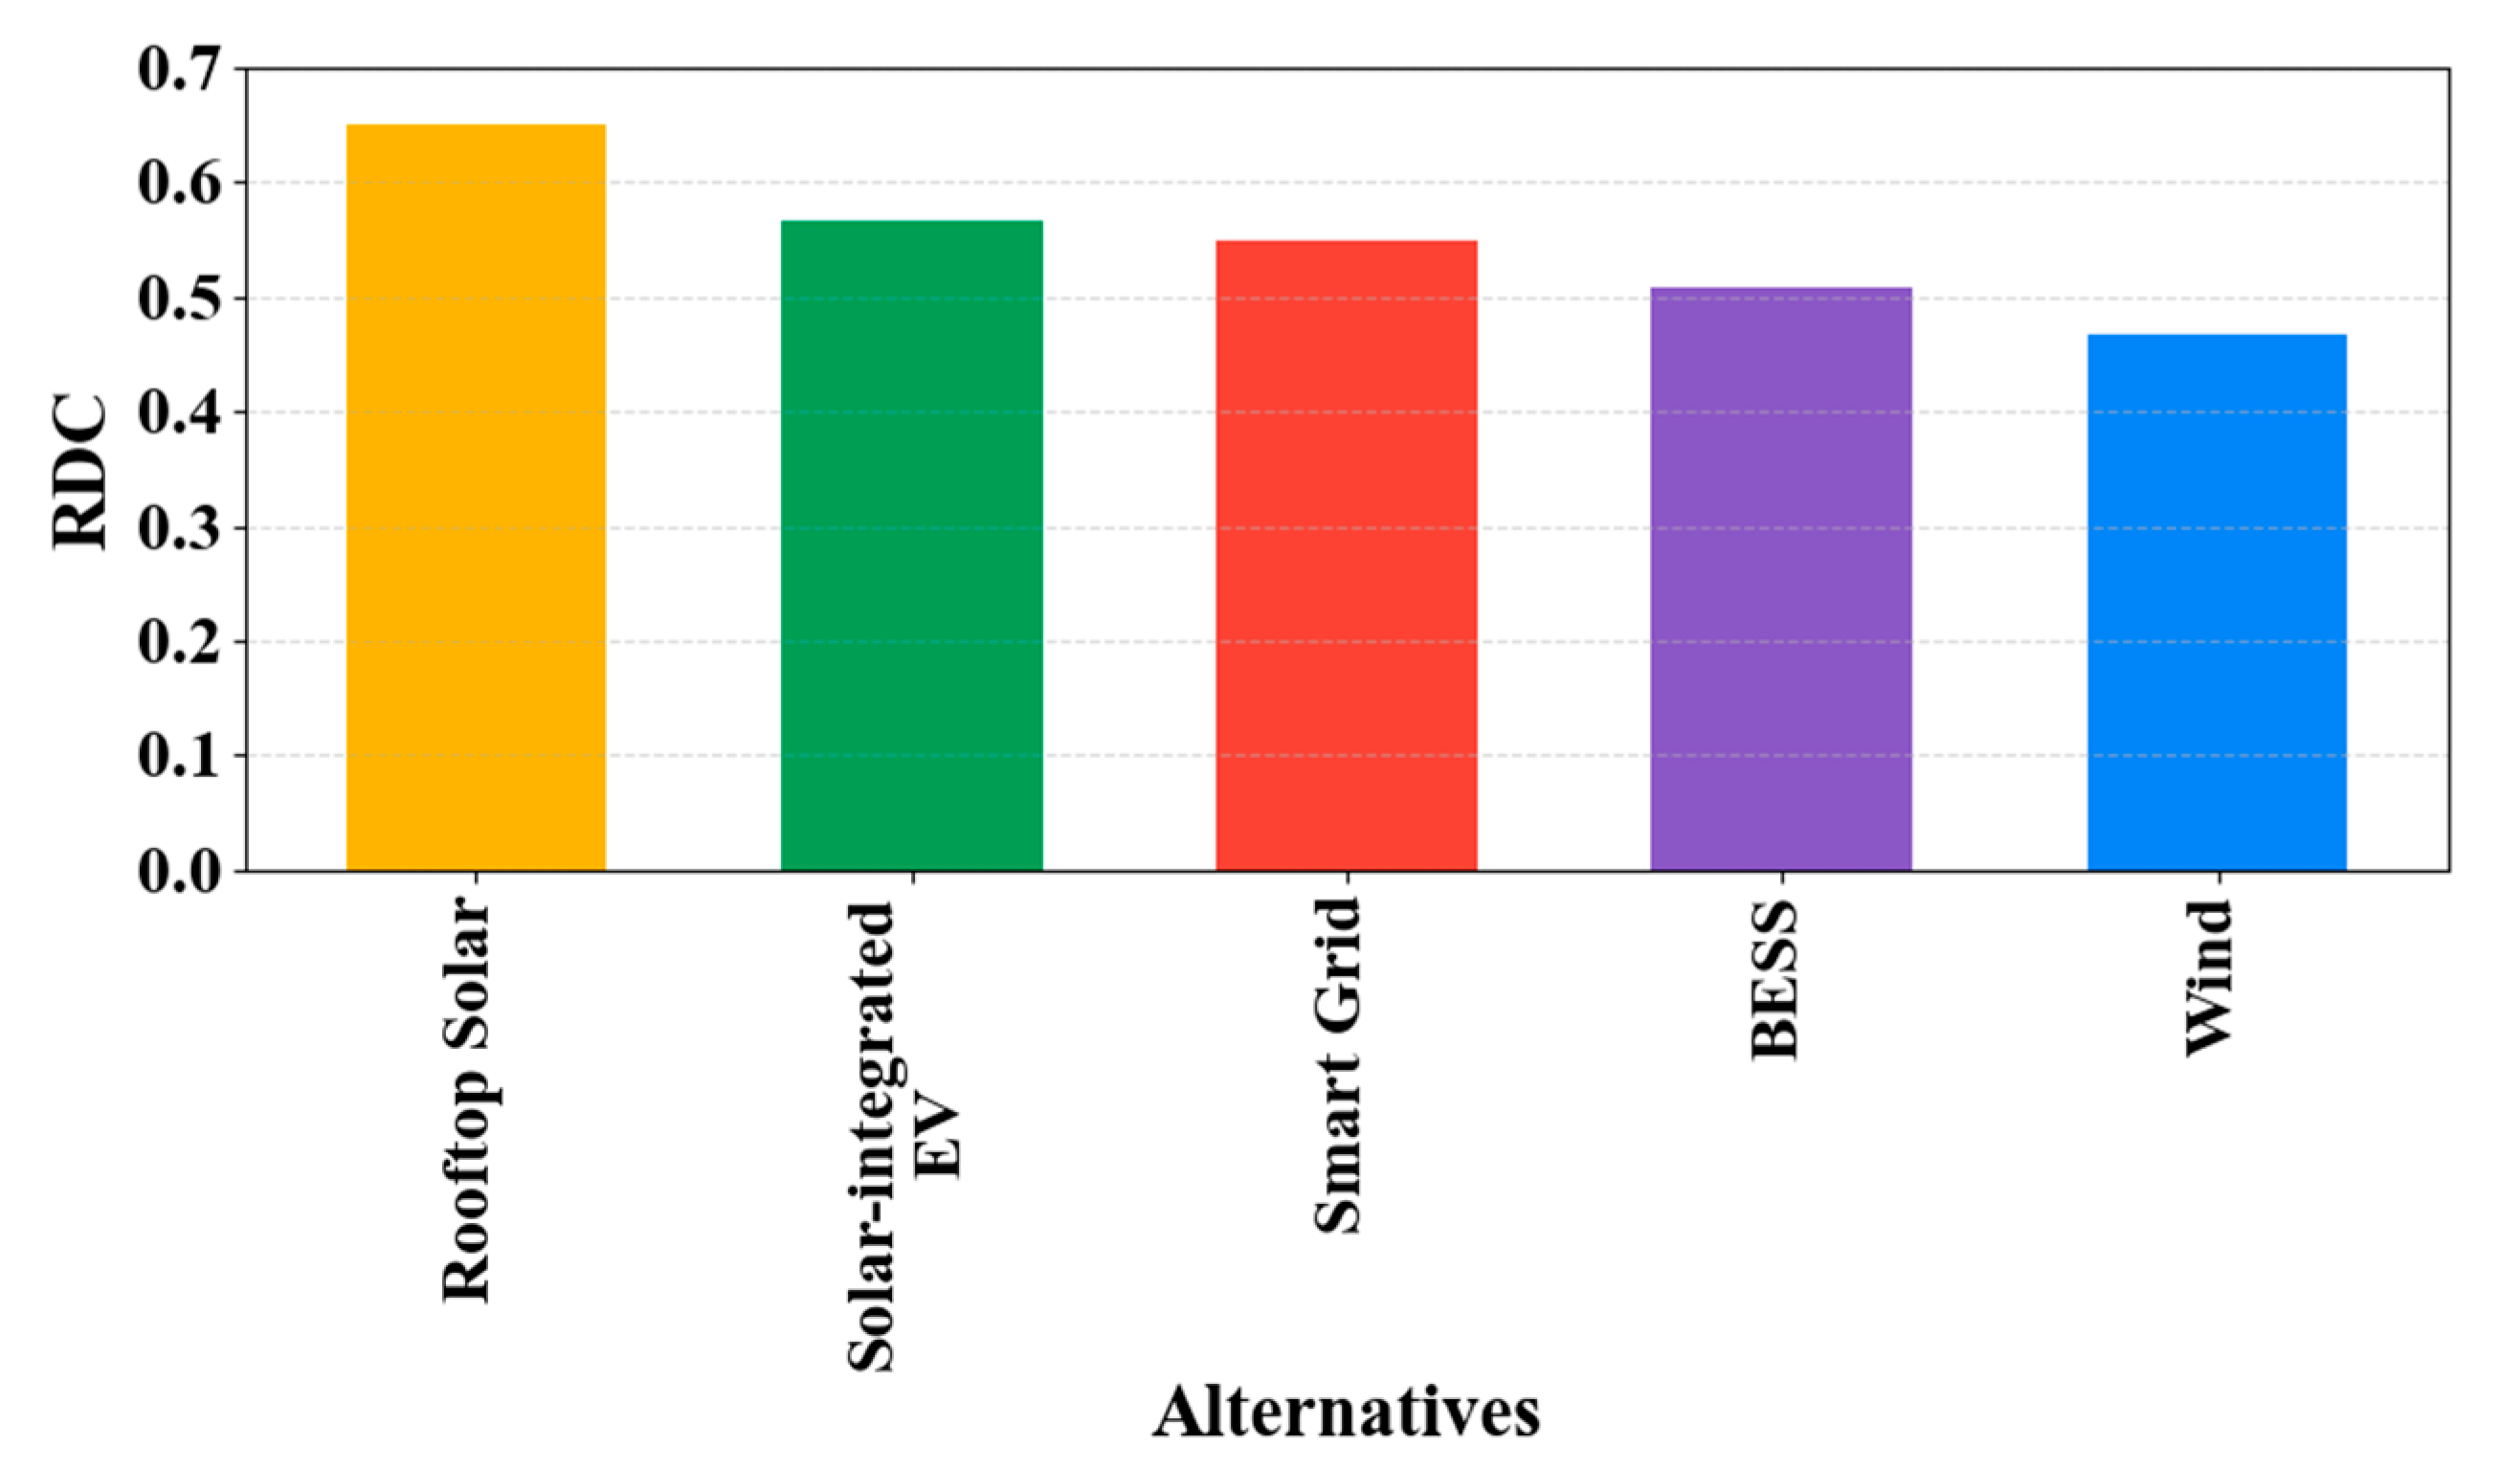
The Smart Grid provided system-level flexibility with a C4 of 0.176 and a C6 of 0.170 (as shown in Item A3), while BESS (as shown in Item A5) improved system reliability with a C4 of 0.14 and a C6 of 0.152, despite being unable to provide forecast driven capabilities. The estimated distances from both PIS and NIS for all the alternatives can be seen in Table 7. Based on TOPSIS analysis, Rooftop Solar (Item A1) was the best option based on the RDC value of 0.65, due to its high level of technological feasibility, scalability, and compatibility with the Delhi Solar Policy. Solar Integrated EV Infrastructure (Item A4), the second-best option, had an RDC value of 0.567 due to the high adoption rates of electric vehicles in the city as well as multiple initiatives for solar charging. Smart Grid Technologies (A3) follow closely with an RDC of 0.55, supported by widespread smart meter deployment and real-time energy management goals. Battery Energy Storage Systems (A5) rank fourth with an RDC of 0.508 due to their potential for grid stability, albeit with high costs and limited deployment. Virtual Wind Energy (A2) has the lowest RDC of 0.468, as shown in Figure 3.
LSTM helped assess future dependability, which influenced technical feasibility (C4) and scalability (C6). IVPF-MCDM combines AI forecasts with expert judgments and contextual constraints. Solar irradiance is stronger and more predictable than local wind resources; therefore, rooftop solar ranks higher.
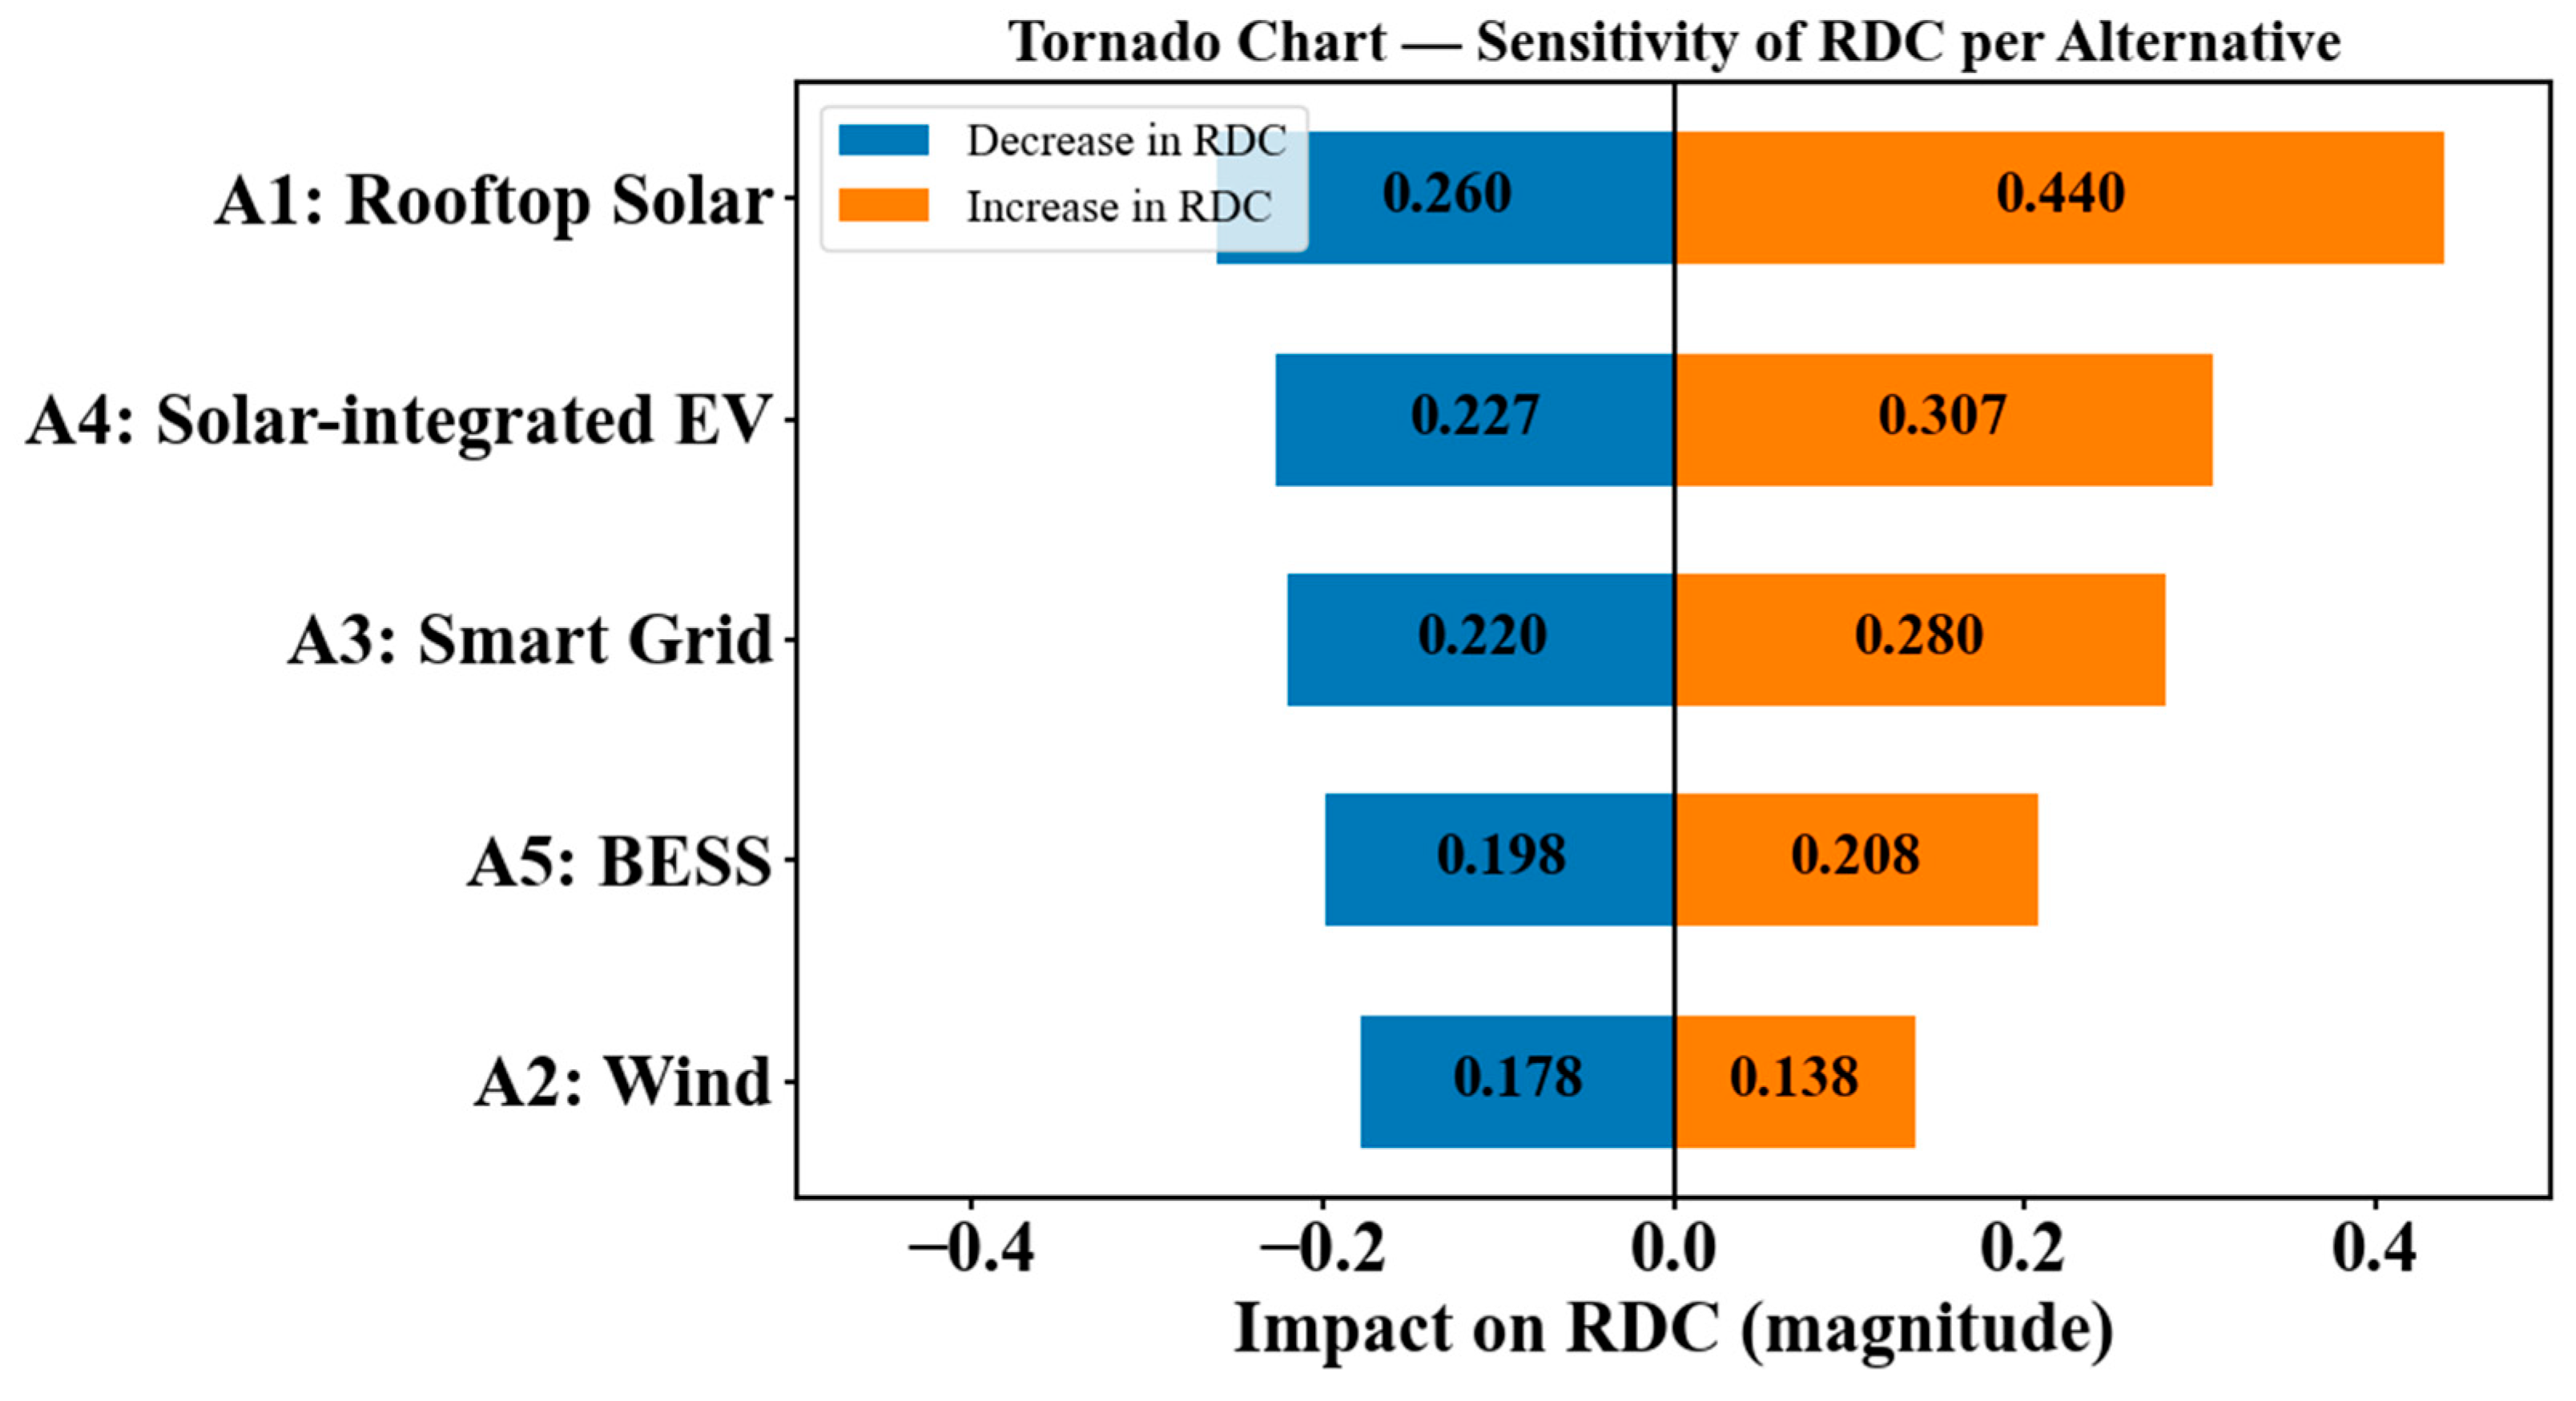
Figure 4 gives an overview and visual assessment of each alternative’s sensitivity to alterations in the MCDM framework’s decision inputs. The positive and negative swings in RDC values demonstrate how much the ranking of each alternative is based on underlying assumptions and expert opinions. Rooftop Solar (A1) has the broadest sensitivity range, showing that it responds significantly to both increases and decreases in input values; while this validates its excellent performance, it also demonstrates that uncertainty in the criteria has a greater influence on its ultimate score. Solar-integrated EV (A4) and Smart Grid (A3) have moderate sensitivity, implying steady but responsive behaviour under input disturbances. In contrast, BESS (A5) and Wind (A2) have small sensitivity bands, signifying higher stability and low variation in their priority even when assumptions vary. Overall, the research shows that the ranking structure is still precise. It also shows which alternatives need to be interpreted more carefully because they depend more on input conditions.

4.2. Sensitivity Analysis

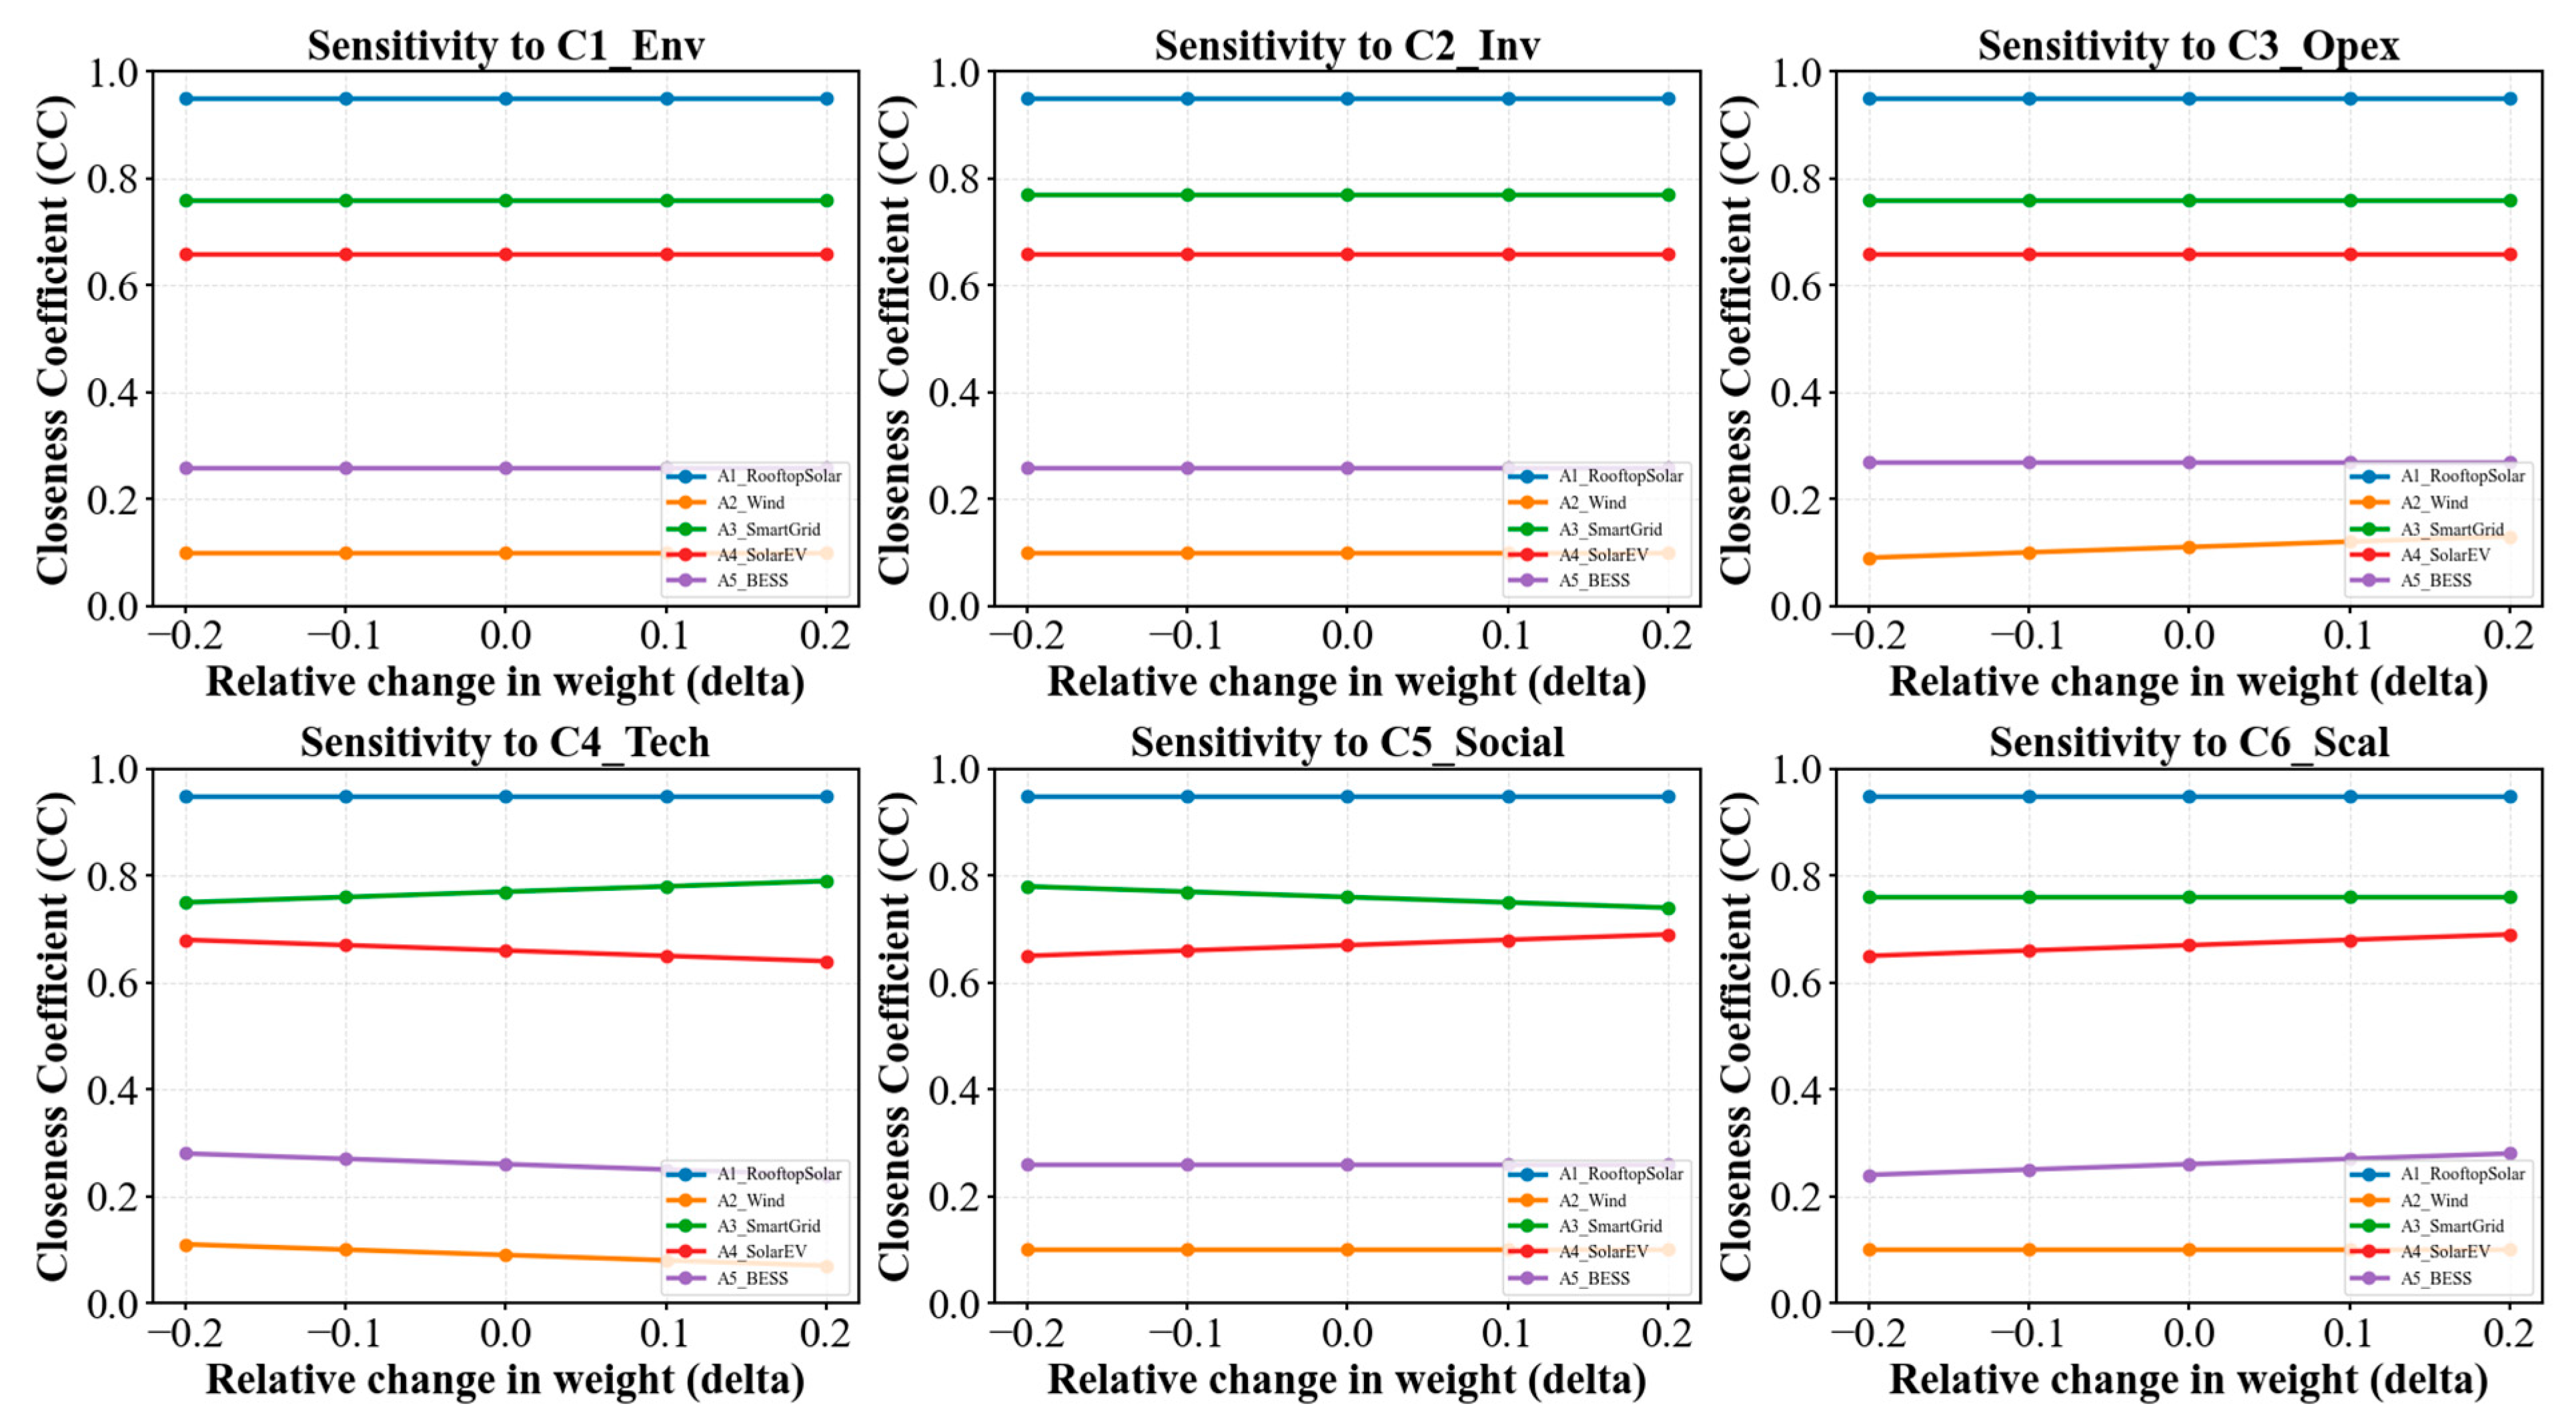
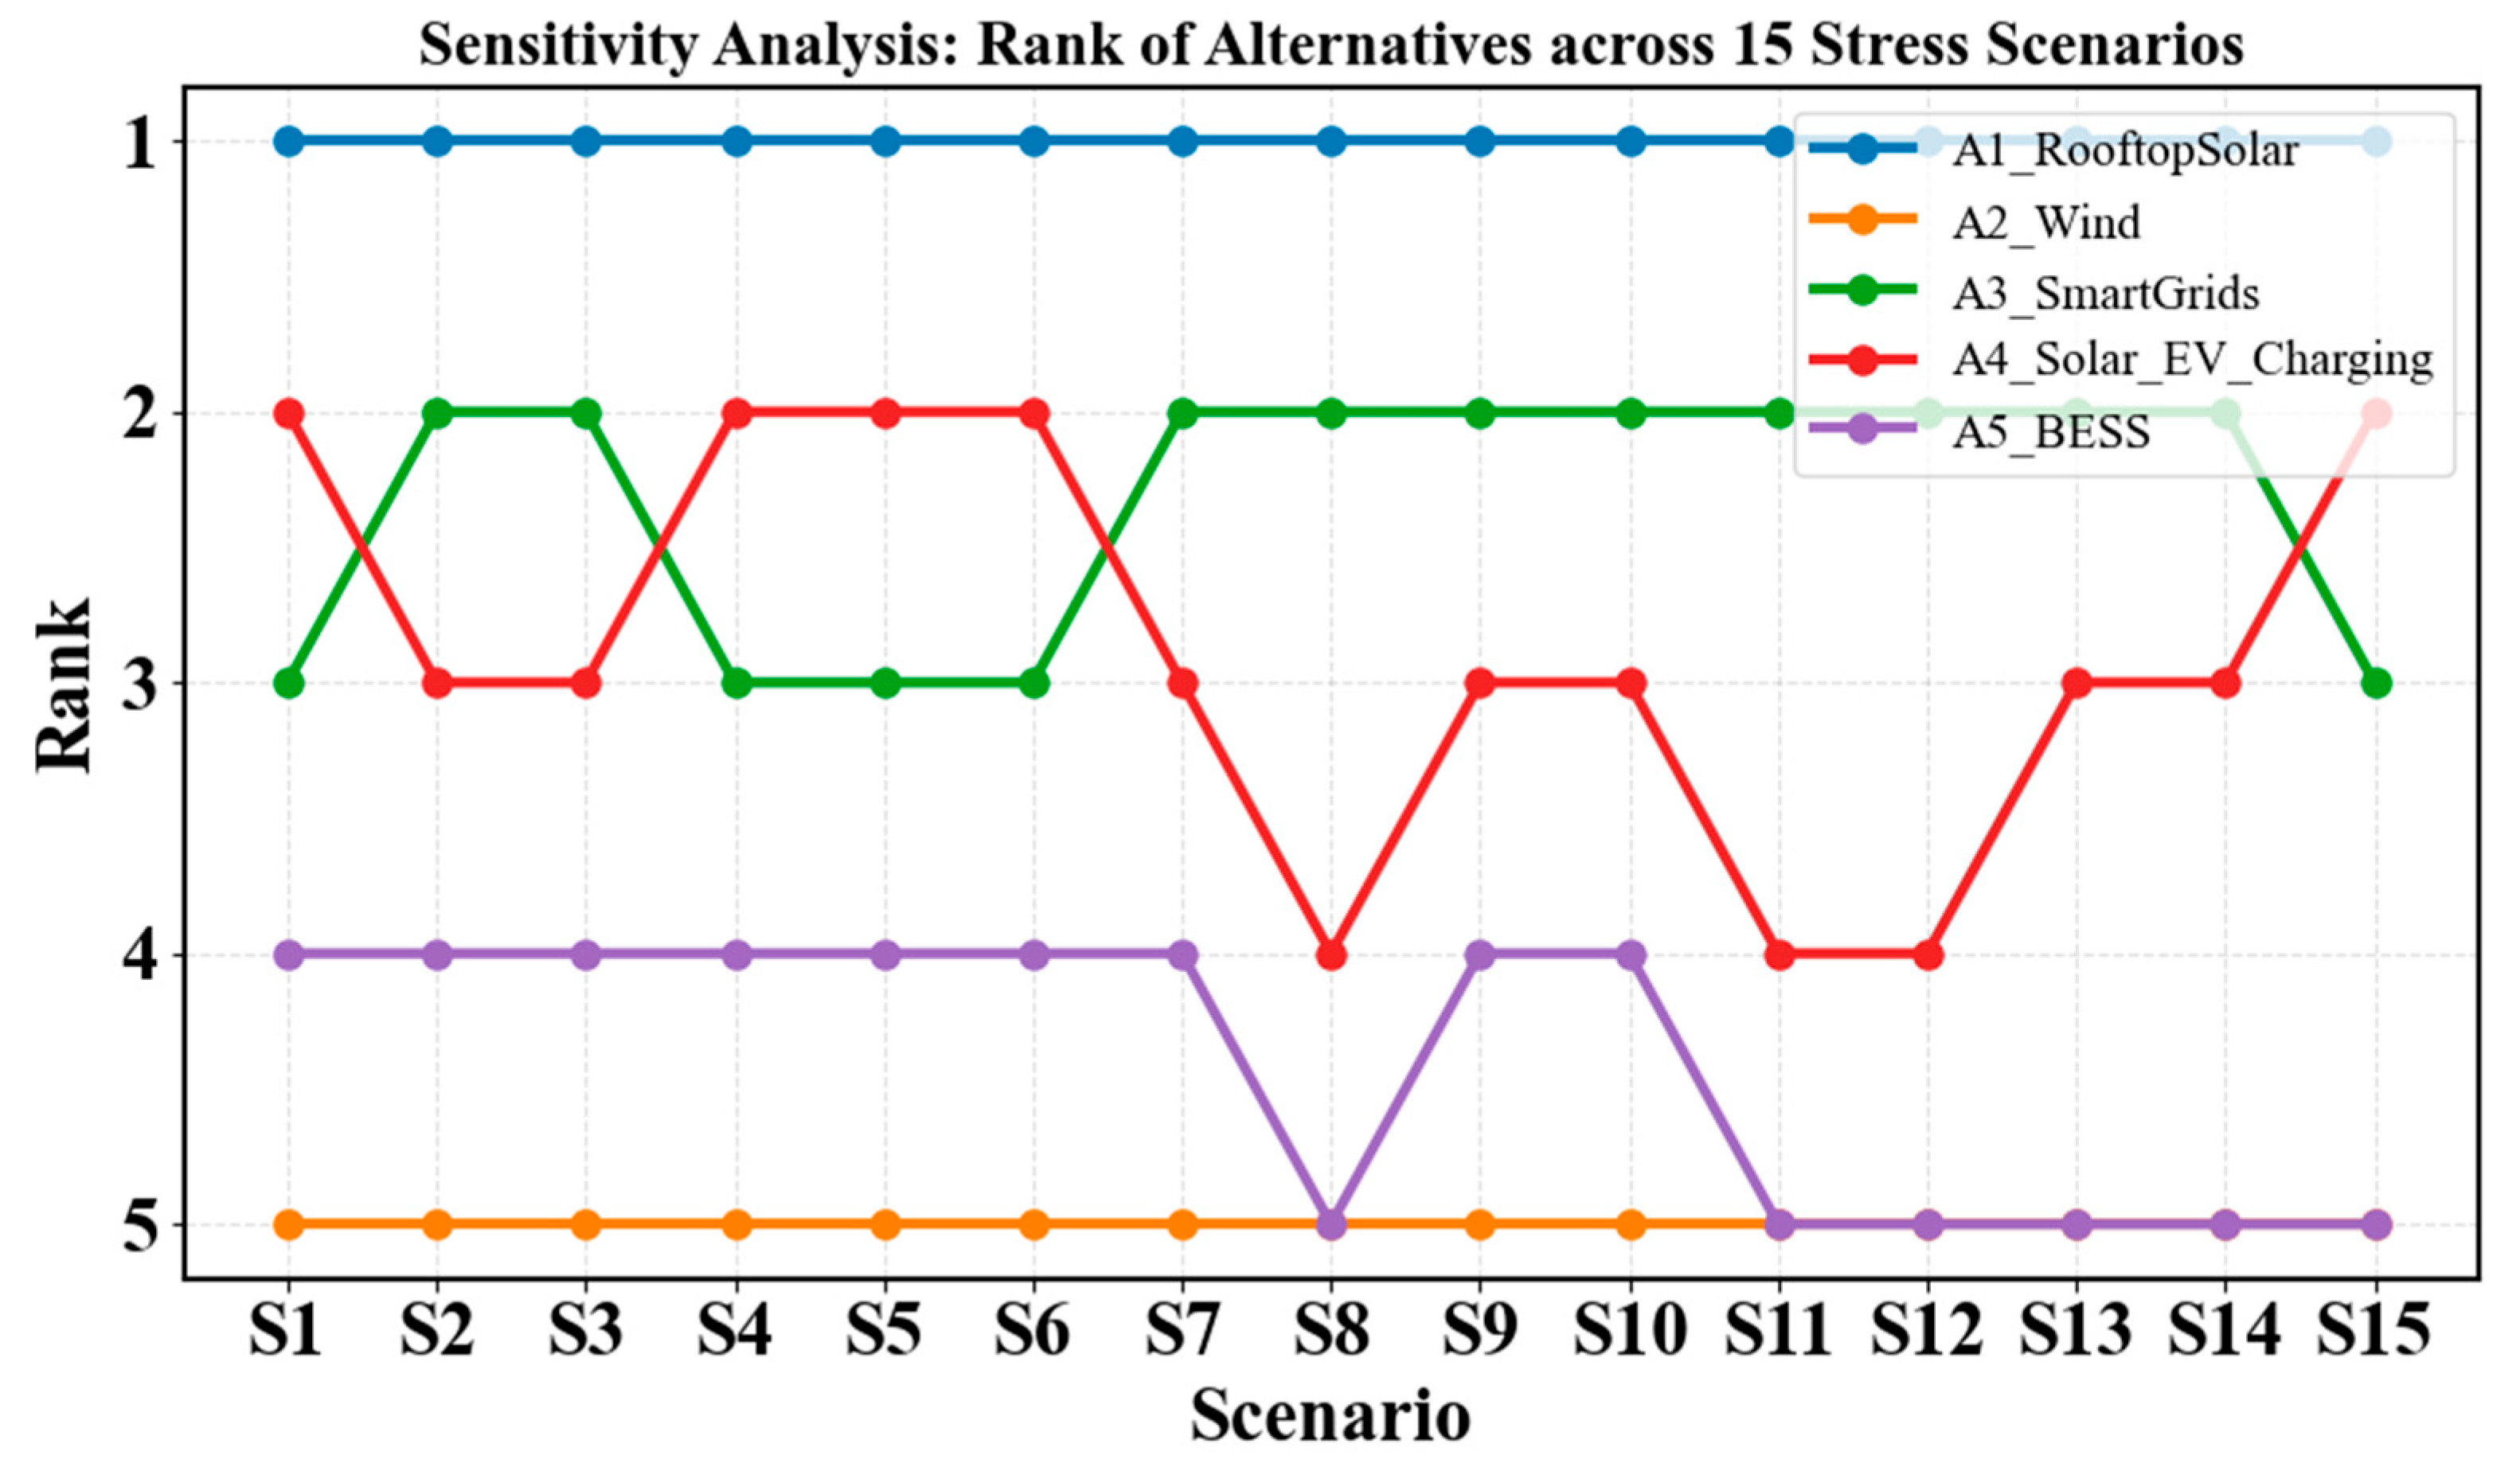
Sensitivity analysis is an essential feature of multi-criteria decision-making (MCDM) as it provides insight into the effect of the change in the input assumptions of the MCDM process, such as the weightings given to each criterion, on the final rankings of alternatives, and also looks at how the changes influence the final rankings of the evaluated alternatives. Since expert judgment is typically used to establish the weightings of the criteria, there can be subjectivity or uncertainty in these weightings. Conducting a sensitivity analysis will assist in determining whether small or reasonable changes in the weightings can significantly affect the outcome of a decision. A sound model will provide consistent rankings for the evaluated alternatives even when the weightings are changed in a reasonable range. Therefore, conducting a sensitivity analysis increases confidence in the reliability and robustness of the proposed decision-making framework, especially for complex energy planning issues where decision-making parameters are rarely fixed or completely known. Figure 5 provides the results of the sensitivity analysis regarding the variations in the closeness coefficients for the five alternatives when the weight of each criterion is individually changed from −20% to +20%. The graphs demonstrate that while fluctuations in closeness coefficients do occur for some alternatives when changes in the weightings of the criteria are made, the overall rankings of alternatives remain consistent across all criteria. Solar (A1) continues to demonstrate the highest closeness coefficient, followed by Smart Grid (A3), Solar EV (A4), BESS (A5), and Wind (A2). The technological criterion (C4) exhibits a comparatively greater influence, particularly on Smart Grid and Solar EV alternatives, underscoring its significant significance in determining the conclusion. Nevertheless, none of the differences in criteria resulted in rank reversal, affirming that the model exhibits considerable stability and is not excessively responsive to moderate alterations in expert-assigned weights. This indicates that the suggested decision model provides dependable and uniform outcomes, rendering it appropriate for facilitating sustainable energy system planning amidst uncertainty. The framework for scenario-based stress testing was systematically developed by adjusting the relative significance of decision criteria to simulate both extreme and policy-driven planning scenarios. One criterion was given a dominant weight at a time to create the single-criterion dominance scenarios (S1–S6). These scenarios illustrate decision-making contexts predominantly influenced by environmental, economic, technical, social, or scalability factors. In addition, pairwise-criterion dominance scenarios (S7–S15) were developed by jointly putting an emphasis on two related criteria in order to model realistic urban energy planning trade-offs. To keep the analysis clear and avoid unnecessary repetition in scenario analysis, 15 situations were looked at. This set of scenarios covers a wide range of both extreme and realistic decision-making situations.
Furthermore, Figure 6 shows IVPF-BWM–TOPSIS framework robustness under 15 systematically constructed stress scenarios (S1–S15). The fifteen stress scenarios evaluate how the importance changes effect energy alternative rankings. Scenarios S1 to S6 use single-criterion dominance to test the model when one factor drives the decision: environmental impact (C1), cost (C2), sustainability (C3), technical feasibility (C4), social acceptability (C5), and scalability (C6). Scenarios S7 to S15 use pairwise dominance to reflect realistic planning demands, such as Environment with Cost in S7, Environment with Technical Feasibility in S8, Cost with Technical Feasibility in S10, and Technical Feasibility with Scalability in S12. Rankings across all fifteen scenarios show how stable and reliable the decision model is under various policy preferences and expert-driven weighting conditions. Rooftop Solar (A1) consistently ranks first in all scenarios, demonstrating its resistance to changes in decision-making. Solar-EV Charging (A4) and Smart Grids (A3) show moderate sensitivity, altering somewhat when cost, sustainability, or technical feasibility matters. The lower ranks of Wind Energy (A2) and BESS (A5) indicate stable but inferior performance. Low ranking variation shows that the hybrid IVPF-BWM–TOPSIS technique is robust, reliable, and can make consistent conclusions even when criteria weights change, making it suitable for smart-city renewable-energy planning.
The IVPF-BWM–TOPSIS decision-making framework’s robustness and stability are assessed in Figure 5 and Figure 6. Figure 5 shows how ranks change when criterion weights are adjusted from −20% to +20%, reflecting tiny but significant expert judgment changes. Even when criteria weights change from baseline, the closeness coefficient trends for all alternatives show only slight variations and no rank reversals, proving that the model is stable. Figure 6 analyses fifteen carefully developed stress situations (S1–S15) with single- and pairwise-criterion dominance. These scenarios imitate extreme or policy-driven conditions like prioritizing environmental effects or technical feasibility and scalability. Rooftop Solar (A1) regularly ranks first, however Smart Grid (A3) and Solar-EV Charging (A4) show moderate but predictable changes, and Wind (A2) and BESS (A5) remain lower. The results show that the hybrid IVPF-BWM–TOPSIS model is not affected by assumptions, which makes it reliable for real-world energy planning where priorities may change between stakeholders, contexts, and policy goals. The results show that the rank does not change when the weight of the criterion changes by ±20% or when there are more than 15 dominating scenarios with small changes to the inputs used for predicting. Interval-valued Pythagorean fuzzy sets are used to help with the uncertainty that comes with making predictions. Even though estimates of solar and wind power can change, this use makes sure that the rankings will stay the same and reliable.

5. Conclusions

This manuscript creates a dynamic decision support system (DSS) that prioritizes renewable energy in smart cities using LSTM-based environmental forecasts and IVPF-BWM and IVPF-TOPSIS models. The approach uses 30-day solar irradiance and wind speed projections to accurately represent real-world uncertainty while assessing technology solution’s viability and scalability. The rooftop SPV system installed is best (RDC = 0.65), according to case study data. Rooftop solar’s efficient utilisation of plentiful urban solar resources and great integration with smart grids and solar-integrated electric car charging facilities explain this. Wind energy ranks last in urban wind velocities owing to poor projections. This robustness research verifies the framework’s stability, since no rank reversal occurs under weight adjustments of ±20% or across various policy scenarios based on gathered data. MCDM-based energy planning is improved by incorporating deep learning predictions into an interval-valued Pythagorean fuzzy framework. This aids flexible, ambiguous decision-making. The framework gives urban planners and energy authorities a data-driven tool to make sustainable energy investment choices, improve urban energy resilience, and support carbon reduction goals. Future projects will include probabilistic forecasting, real-time IoT data, sophisticated AI models, and policy simulation modules on the platform. Scalability and accuracy of emerging urban energy systems will improve.

Author Contributions

Conceptualization, R.N. and R.A.; methodology, S.K. and R.A.; Supervision, J.K., S.K. and A.K.; validation, J.K. and A.K.; formal analysis, R.A.; investigation, R.A.; resources, R.A.; data curation, R.A.; writing—original draft preparation, R.A. All authors have read and agreed to the published version of the manuscript.

Funding

This research received no external funding.

Data Availability Statement

The data presented are available on request from the corresponding author, since part of the dataset is being analysed and utilised in follow-up research.

Conflicts of Interest

The authors declare no conflicts of interest.

Correction Statement

This article has been republished with a minor correction to clearly separate the roles of References [14] and [15]. This change does not affect the scientific content of the article.

References

  1. Bibri, S.E. Backcasting in futures studies: A synthesized scholarly and planning approach to strategic smart sustainable city development. Eur. J. Futures Res. 2018, 6, 1–27. [Google Scholar] [CrossRef]
  2. Nasimov, R.; Kumar, D.; Rizwan, M.; Panwar, A.K.; Abdusalomov, A.; Cho, Y.I. A novel approach for state of health estimation of lithium-ion batteries based on improved PSO neural network model. Processes 2024, 12, 1806. [Google Scholar] [CrossRef]
  3. Dey, S.; Sreenivasulu, A.; Veerendra, G.T.N.; Rao, K.V.; Babu, P.S.S.A. Renewable energy present status and future potentials in India: An overview. Innov. Green Dev. 2022, 1, 100006. [Google Scholar] [CrossRef]
  4. Alhammadi, H.; Alghailani, M.; Alkhzaimi, N.; Alsuwaidi, D.; Mayyas, A. Multi-criteria decision-making methods for selecting the best energy storage systems in arid regions. Energy Rep. 2025, 13, 3575–3592. [Google Scholar] [CrossRef]
  5. Abu-Rayash, A.; Dincer, I. Development of an integrated model for environmentally and economically sustainable and smart cities. Sustain. Energy Technol. Assess. 2025, 73, 104096. [Google Scholar] [CrossRef]
  6. Tightiz, L.; Nasimov, R.; Nasab, M.A. Implementing AI solutions for advanced cyber-attack detection in smart grid. Int. J. Energy Res. 2024, 2024, 6969383. [Google Scholar] [CrossRef]
  7. Tyagi, U.; Anand, N. Solar Energy and Smart Cities: A Holistic Approach for Sustainable Development. In Renewable Energy Development: Technology, Material and Sustainability; Springer Nature: Singapore, 2025; pp. 91–109. [Google Scholar] [CrossRef]
  8. Weitzel, T.; Glock, C.H. Energy management for stationary electric energy storage systems: A systematic literature review. Eur. J. Oper. Res. 2018, 264, 582–606. [Google Scholar] [CrossRef]
  9. Yuksel, S.; Ubay, G.G. Identifying the influencing factors of renewable energy consumption in Turkey with MARS methodology. Ekon. İşletme ve Maliye Araştırmaları Derg. 2020, 2, 1–14. [Google Scholar] [CrossRef]
  10. Rafique, W.; Hafid, A.S.; Qadir, J. Developing smart city services using intent-aware recommendation systems: A survey. Trans. Emerg. Telecommun. Technol. 2023, 34, e4728. [Google Scholar] [CrossRef]
  11. Ahmed, S.T.; Kumar, V.V.; Jeong, J. Heterogeneous workload-based consumer resource recommendation model for smart cities: EHealth edge-cloud connectivity using federated split learning. IEEE Trans. Consum. Electron. 2024, 70, 4187–4196. [Google Scholar] [CrossRef]
  12. Hasan, M.G.; Ashraf, Z.; Khan, M.F. Multi-choice best-worst multi-criteria decision-making method and its applications. Int. J. Intell. Syst. 2022, 37, 1129–1156. [Google Scholar] [CrossRef]
  13. Madanchian, M.; Taherdoost, H. A comprehensive guide to the TOPSIS method for multi-criteria decision making. Sustain. Soc. Dev. 2023, 1, 2220. [Google Scholar] [CrossRef]
  14. Yager, R.R. Pythagorean membership grades in multicriteria decision making. IEEE Trans. Fuzzy Syst. 2014, 22, 958–965. [Google Scholar] [CrossRef]
  15. Atanassov, K.T. Intuitionistic fuzzy sets. In Intuitionistic Fuzzy Sets: Theory and Applications; Physica-Verlag HD: Heidelberg, Germany, 1999; pp. 1–137. [Google Scholar]
  16. Krishankumar, R.; Pamucar, D.; Deveci, M.; Aggarwal, M.; Ravichandran, K.S. Assessment of renewable energy sources for smart cities’ demand satisfaction using multi-hesitant fuzzy linguistic based Choquet integral approach. Renew. Energy 2022, 189, 1428–1442. [Google Scholar] [CrossRef]
  17. Kutty, A.A.; Kucukvar, M.; Onat, N.C.; Ayvaz, B.; Abdella, G.M. Measuring sustainability, resilience and livability performance of European smart cities: A novel fuzzy expert-based multi-criteria decision support model. Cities 2023, 137, 104293. [Google Scholar] [CrossRef]
  18. Aljburi, M.T.; Albahri, A.S.; Albahri, O.S.; Alamoodi, A.H.; Mohammed, S.M.; Deveci, M.; Tomášková, H. Exploring decision-making techniques for evaluation and benchmarking of energy system integration frameworks for achieving a sustainable energy future. Energy Strateg. Rev. 2024, 51, 101251. [Google Scholar] [CrossRef]
  19. Alkan, N. Evaluation of sustainable development and utilization-oriented renewable energy systems based on CRITIC–SWARA–CODAS method using interval-valued picture fuzzy sets. Sustain. Energy Grids Netw. 2024, 38, 101263. [Google Scholar] [CrossRef]
  20. Bressane, A.; Fengler, F.H.; de Castro Medeiros, L.C.; Urban, R.C.; Negri, R.G. Enhancing energy sustainability of building projects through nature-based solutions: A fuzzy-based decision support system. Nat. Based Solut. 2024, 5, 100107. [Google Scholar] [CrossRef]
  21. Gamal, A.; Abdel-Basset, M.; Hezam, I.M.; Sallam, K.M.; Alshamrani, A.M.; Hameed, I.A. A computational sustainable approach for energy storage systems performance evaluation based on spherical-fuzzy MCDM with considering uncertainty. Energy Rep. 2024, 11, 1319–1341. [Google Scholar] [CrossRef]
  22. Manirathinam, T.; Narayanamoorthy, S.; Geetha, S.; Ahmadian, A.; Ferrara, M.; Kang, D. Assessing performance and satisfaction of micro-mobility in smart cities for sustainable clean energy transportation using novel APPRESAL method. J. Clean. Prod. 2024, 436, 140372. [Google Scholar] [CrossRef]
  23. Yang, Y.; Zhang, C.; Zhao, Q.; Zhang, Y. A sustainability evaluation framework for the urban energy Internet using the Fermatean fuzzy Aczel–Alsina hybrid MCDM method. Expert Syst. Appl. 2024, 238, 122115. [Google Scholar] [CrossRef]
  24. Luo, Y.; Ni, M.; Zhang, F. A design model of FBS based on interval-valued Pythagorean fuzzy sets. Adv. Eng. Inform. 2023, 56, 101957. [Google Scholar] [CrossRef]
  25. Otay, İ.; Onar, S.Ç.; Öztayşi, B.; Kahraman, C. Evaluation of sustainable energy systems in smart cities using a multi-expert Pythagorean fuzzy BWM & TOPSIS methodology. Expert Syst. Appl. 2024, 250, 123874. [Google Scholar] [CrossRef]
  26. Trung, D.D.; Dudić, B.; Bao, N.C.; Thinh, H.X.; Van Duc, D.; Ašonja, A. Applying Probability Method for Battery Electric Vehicle Selection. In Proceedings of the 24th International Symposium INFOTEH-JAHORINA (INFOTEH 2025), East Sarajevo, Bosnia and Herzegovina, 19–21 March 2025; pp. 1–5. [Google Scholar] [CrossRef]
  27. Ren, X.; Sun, S.; Yuan, R. A study on selection strategies for battery electric vehicles based on sentiments, analysis, and the MCDM model. Math. Probl. Eng. 2021, 2021, 9984343. [Google Scholar] [CrossRef]
  28. Li, J.; Zhang, Y. A modified TOPSIS algorithm for the assessment of sports quality in higher education using circular Pythagorean fuzzy information. Sci. Rep. 2025, 15, 18846. [Google Scholar] [CrossRef]
  29. Demir, G. Fuzzy multi-criteria decision-making based security management: Risk assessment and countermeasure selection in smart cities. Knowl. Decis. Syst. Appl. 2025, 1, 70–91. [Google Scholar] [CrossRef]
  30. Solcast. Historical Timeseries API. Available online: https://toolkit.solcast.com.au/historical/timeseries/request (accessed on 24 September 2025).
  31. Ministry of New and Renewable Energy, “Rooftop Solar Progress Report,” Government of India, 2024. Available online: https://mnre.gov.in/ (accessed on 24 September 2025).
  32. Dialogue and Development Commission of Delhi. Accelerating Electric Mobility in Delhi: Implementation Report. Government of NCT of Delhi, 2024. Available online: https://ev.delhi.gov.in/ (accessed on 10 February 2026).
  33. Ministry of Power, Government of India, “Renewable Energy Targets and Policies”. Available online: https://powermin.gov.in/ (accessed on 28 September 2025).
Figure 1. Proposed interval-valued Pythagorean fuzzy best-worst and TOPSIS-based methodology.
Energies 19 01095 g001
Figure 2. (a) Wind speed and (b) solar irradiance forecasting.
Energies 19 01095 g002
Figure 3. Relative closeness coefficient (RDC) of alternatives.
Energies 19 01095 g003
Figure 4. Influence of positive and negative fluctuations on RDC scores for different alternatives.
Energies 19 01095 g004
Figure 5. Sensitivity of alternative ranks to a ± 20% fluctuation in criteria weights.
Energies 19 01095 g005
Figure 6. Scenario-based sensitivity analysis illustrating the rank fluctuations of alternatives across various stress scenarios.
Energies 19 01095 g006
Table 1. Evaluation criteria for sustainable energy systems [25].
C.CriteriaDescription
C1Environmental SustainabilityReduction of greenhouse gas emissions, ecological footprint, and adherence to long-term sustainability objectives. Applicable to all renewable-based alternatives.
C2Initial InvestmentInfrastructure, technology procurement, and integration capital expenditures (e.g., BESS, smart systems, EV chargers, PV panels).
C3Operating ExpensesRecurrent expenses for technical support, energy losses, component degradation, labor, and maintenance.
C4Technical FeasibilitySupply reliability, technology maturity, and integration with existing infrastructure are anticipated. This can be dynamically modified based on the predicted performance of solar and wind.
C5Social AcceptabilityChange in behavior requirements (e.g., rooftop ownership, EV adoption), policy support, and public acceptance, as well as cultural alignment.
C6ScalabilityGrowth potential, replicability, and geographic/sectoral adaptability are forecasted in accordance with anticipated trends in energy demand and availability.
Table 2. Best and worst criteria by five experts.
ExpertBest CriterionWorst Criterion
E1C1C2
E2C4C3
E3C6C5
E4C4C2
E5C1C5
Table 3. Best-to-ithers IVPF ratings by five experts.
ExpertCriterionμLμUvLvUScore
E1C10.50.50.50.50.0
E1C20.550.70.30.450.5
E1C30.70.850.10.251.2
E1C40.60.750.20.350.8
E1C50.80.950.050.151.55
E1C60.70.850.10.251.2
E2C10.10.250.70.85−1.2
E2C20.50.50.50.50.0
E2C30.550.70.30.450.5
E2C40.80.950.050.151.55
E2C50.60.750.20.350.8
E2C60.550.70.30.450.5
E3C10.50.50.50.50.0
E3C20.60.750.20.350.8
E3C30.70.850.10.251.2
E3C40.80.950.050.151.55
E3C50.550.70.30.450.5
E3C60.60.750.20.350.8
E4C10.10.250.70.85−1.2
E4C20.50.50.50.50.0
E4C30.60.750.20.350.8
E4C40.70.850.10.251.2
E4C50.550.70.30.450.5
E4C60.60.750.20.350.8
E5C10.60.750.20.350.8
E5C20.550.70.30.450.5
E5C30.70.850.10.251.2
E5C40.80.950.050.151.55
E5C50.50.50.50.50.0
E5C60.50.50.50.50.0
Table 4. IVPF scores and normalized weights.
ExpertCriterionScoreNormalized Weight
E1C10.00.0
E1C20.50.0952
E1C31.20.2286
E1C40.80.1524
E1C51.550.2952
E1C61.20.2286
E2C1−1.20.0
E2C20.00.0
E2C30.50.1493
E2C41.550.4627
E2C50.80.2388
E2C60.50.1493
E3C10.00.0
E3C20.80.1649
E3C31.20.2474
E3C41.550.3196
E3C50.50.1031
E3C60.80.1649
E4C1−1.20.0
E4C20.00.0
E4C30.80.2424
E4C41.20.3636
E4C50.50.1515
E4C60.80.2424
E5C10.80.1975
E5C20.50.1235
E5C31.20.2963
E5C41.550.3827
E5C50.00.0
E5C60.00.0
Table 5. Expert IVPF evaluations of alternatives.
CriterionExpertA1: SolarA2: WindA3: Smart Grid A4: Solar-Integrated EVA5: BESS
C1E1<[0.10, 0.25], [0.70, 0.85]><[0.55, 0.70], [0.30, 0.45]><[0.80, 0.95], [0.05, 0.15]><[0.05, 0.15], [0.80, 0.95]><[0.60, 0.75], [0.20, 0.35]>
C1E2<[0.55, 0.70], [0.30, 0.45]><[0.60, 0.75], [0.20, 0.35]><[0.70, 0.85], [0.10, 0.25]><[0.20, 0.35], [0.60, 0.75]><[0.10, 0.25], [0.70, 0.85]>
C1E3<[0.80, 0.95], [0.05, 0.15]><[0.60, 0.75], [0.20, 0.35]><[0.50, 0.50], [0.50, 0.50]><[0.10, 0.25], [0.70, 0.85]><[0.10, 0.25], [0.70, 0.85]>
C1E4<[0.05, 0.15], [0.80, 0.95]><[0.70, 0.85], [0.10, 0.25]><[0.70, 0.85], [0.10, 0.25]><[0.20, 0.35], [0.60, 0.75]><[0.10, 0.25], [0.70, 0.85]>
C1E5<[0.05, 0.15], [0.80, 0.95]><[0.70, 0.85], [0.10, 0.25]><[0.50, 0.50], [0.50, 0.50]><[0.10, 0.25], [0.70, 0.85]><[0.05, 0.15], [0.80, 0.95]>
C2E1<[0.50, 0.75], [0.20, 0.40]><[0.50, 0.75], [0.20, 0.40]><[0.50, 0.75], [0.20, 0.40]><[0.50, 0.75], [0.20, 0.40]><[0.50, 0.75], [0.20, 0.40]>
C2E2<[0.50, 0.75], [0.20, 0.40]><[0.50, 0.75], [0.20, 0.40]><[0.50, 0.75], [0.20, 0.40]><[0.50, 0.75], [0.20, 0.40]><[0.50, 0.75], [0.20, 0.40]>
C2E3<[0.50, 0.75], [0.20, 0.40]><[0.50, 0.75], [0.20, 0.40]><[0.50, 0.75], [0.20, 0.40]><[0.50, 0.75], [0.20, 0.40]><[0.50, 0.75], [0.20, 0.40]>
C2E4<[0.50, 0.75], [0.20, 0.40]><[0.50, 0.75], [0.20, 0.40]><[0.50, 0.75], [0.20, 0.40]><[0.50, 0.75], [0.20, 0.40]><[0.50, 0.75], [0.20, 0.40]>
C2E5<[0.50, 0.75], [0.20, 0.40]><[0.50, 0.75], [0.20, 0.40]><[0.50, 0.75], [0.20, 0.40]><[0.50, 0.75], [0.20, 0.40]><[0.50, 0.75], [0.20, 0.40]>
C3E1<[0.50, 0.75], [0.20, 0.40]><[0.50, 0.75], [0.20, 0.40]><[0.50, 0.75], [0.20, 0.40]><[0.50, 0.75], [0.20, 0.40]><[0.50, 0.75], [0.20, 0.40]>
C3E2<[0.50, 0.75], [0.20, 0.40]><[0.50, 0.75], [0.20, 0.40]><[0.50, 0.75], [0.20, 0.40]><[0.50, 0.75], [0.20, 0.40]><[0.50, 0.75], [0.20, 0.40]>
C3E3<[0.50, 0.75], [0.20, 0.40]><[0.50, 0.75], [0.20, 0.40]><[0.50, 0.75], [0.20, 0.40]><[0.50, 0.75], [0.20, 0.40]><[0.50, 0.75], [0.20, 0.40]>
C3E4<[0.50, 0.75], [0.20, 0.40]><[0.50, 0.75], [0.20, 0.40]><[0.50, 0.75], [0.20, 0.40]><[0.50, 0.75], [0.20, 0.40]><[0.50, 0.75], [0.20, 0.40]>
C3E5<[0.50, 0.75], [0.20, 0.40]><[0.50, 0.75], [0.20, 0.40]><[0.50, 0.75], [0.20, 0.40]><[0.50, 0.75], [0.20, 0.40]><[0.50, 0.75], [0.20, 0.40]>
C4E1<[0.50, 0.75], [0.20, 0.40]><[0.50, 0.75], [0.20, 0.40]><[0.50, 0.75], [0.20, 0.40]><[0.50, 0.75], [0.20, 0.40]><[0.50, 0.75], [0.20, 0.40]>
C4E2<[0.50, 0.75], [0.20, 0.40]><[0.50, 0.75], [0.20, 0.40]><[0.50, 0.75], [0.20, 0.40]><[0.50, 0.75], [0.20, 0.40]><[0.50, 0.75], [0.20, 0.40]>
C4E3<[0.50, 0.75], [0.20, 0.40]><[0.50, 0.75], [0.20, 0.40]><[0.50, 0.75], [0.20, 0.40]><[0.50, 0.75], [0.20, 0.40]><[0.50, 0.75], [0.20, 0.40]>
C4E4<[0.50, 0.75], [0.20, 0.40]><[0.50, 0.75], [0.20, 0.40]><[0.50, 0.75], [0.20, 0.40]><[0.50, 0.75], [0.20, 0.40]><[0.50, 0.75], [0.20, 0.40]>
C4E5<[0.50, 0.75], [0.20, 0.40]><[0.50, 0.75], [0.20, 0.40]><[0.50, 0.75], [0.20, 0.40]><[0.50, 0.75], [0.20, 0.40]><[0.50, 0.75], [0.20, 0.40]>
C5E1<[0.50, 0.75], [0.20, 0.40]><[0.50, 0.75], [0.20, 0.40]><[0.50, 0.75], [0.20, 0.40]><[0.50, 0.75], [0.20, 0.40]><[0.50, 0.75], [0.20, 0.40]>
C5E2<[0.50, 0.75], [0.20, 0.40]><[0.50, 0.75], [0.20, 0.40]><[0.50, 0.75], [0.20, 0.40]><[0.50, 0.75], [0.20, 0.40]><[0.50, 0.75], [0.20, 0.40]>
C5E3<[0.50, 0.75], [0.20, 0.40]><[0.50, 0.75], [0.20, 0.40]><[0.50, 0.75], [0.20, 0.40]><[0.50, 0.75], [0.20, 0.40]><[0.50, 0.75], [0.20, 0.40]>
C5E4<[0.50, 0.75], [0.20, 0.40]><[0.50, 0.75], [0.20, 0.40]><[0.50, 0.75], [0.20, 0.40]><[0.50, 0.75], [0.20, 0.40]><[0.50, 0.75], [0.20, 0.40]>
C5E5<[0.50, 0.75], [0.20, 0.40]><[0.50, 0.75], [0.20, 0.40]><[0.50, 0.75], [0.20, 0.40]><[0.50, 0.75], [0.20, 0.40]><[0.50, 0.75], [0.20, 0.40]>
C6E1<[0.50, 0.75], [0.20, 0.40]><[0.50, 0.75], [0.20, 0.40]><[0.50, 0.75], [0.20, 0.40]><[0.50, 0.75], [0.20, 0.40]><[0.50, 0.75], [0.20, 0.40]>
C6E2<[0.50, 0.75], [0.20, 0.40]><[0.50, 0.75], [0.20, 0.40]><[0.50, 0.75], [0.20, 0.40]><[0.50, 0.75], [0.20, 0.40]><[0.50, 0.75], [0.20, 0.40]>
C6E3<[0.50, 0.75], [0.20, 0.40]><[0.50, 0.75], [0.20, 0.40]><[0.50, 0.75], [0.20, 0.40]><[0.50, 0.75], [0.20, 0.40]><[0.50, 0.75], [0.20, 0.40]>
C6E4<[0.50, 0.75], [0.20, 0.40]><[0.50, 0.75], [0.20, 0.40]><[0.50, 0.75], [0.20, 0.40]><[0.50, 0.75], [0.20, 0.40]><[0.50, 0.75], [0.20, 0.40]>
C6E5<[0.50, 0.75], [0.20, 0.40]><[0.50, 0.75], [0.20, 0.40]><[0.50, 0.75], [0.20, 0.40]><[0.50, 0.75], [0.20, 0.40]><[0.50, 0.75], [0.20, 0.40]>
Table 6. Aggregated weighted scores for alternatives.
AlternativeC1C2C3C4C5C6
A1: Solar0.170.0650.1350.1840.13050.186
A2: Wind0.140.0550.120.130.090.116
A3: Smart grid 0.150.060.1320.1760.11250.17
A4: Solar-integrated EV0.160.070.12750.160.1230.176
A5: BESS0.1560.050.11250.140.09750.152
Table 7. Final Alternative Ranking (RDC Method).
AlternativeD+D−RDCRank
A1: Rooftop Solar0.210.390.651
A4: Solar-integrated EV0.260.340.5672
A3: Smart Grid0.270.330.553
A5: BESS0.30.310.5084
A2: Wind0.330.290.4685
Disclaimer/Publisher’s Note: The statements, opinions and data contained in all publications are solely those of the individual author(s) and contributor(s) and not of MDPI and/or the editor(s). MDPI and/or the editor(s) disclaim responsibility for any injury to people or property resulting from any ideas, methods, instructions or products referred to in the content.