1. Introduction
For many years now, a global battle has been waging against climate change caused by anthropic activities. To give an idea of how broad and complex this battle is, nearly 200 countries are currently party to the United Nations Framework Convention on Climate Change (UNFCCC), and, to date, the framework has held 30 annual Conferences of the Parties (COPs). Since the UNFCCC began operating, several treaties have been enacted to address environmental issues, influencing the policies of countries around the world to address the problems arising from the massive exploitation of fossil fuels. These include landmark agreements such as the Kyoto Protocol in 1997 and the Paris Agreement in 2015, which established significant Nationally Determined Contributions (NDCs) to effectively address the problem.
Green hydrogen, produced through electrolysis powered by renewable sources, is considered one of the pillars for achieving the objectives set by international agreements (COP28, COP29, COP30) and national NDCs. Green hydrogen is important for at least three reasons [
1,
2,
3]: (i) there are sectors, such as heavy-duty transport (maritime, aviation, long-distance trucks, trains) or high-temperature industry (e.g., foundries) that are difficult to electrify; (ii) in the most recent COPs, hydrogen was identified as a strategic technology for tripling renewables by 2030 and favoring the replacement of fossil fuels; (iii) the availability of funds for adaptation and energy transition defined at COP29 and COP30 include investments in electrolyzers and hydrogen infrastructure with scalable projects especially in emerging countries.
Furthermore, the use of green hydrogen offers numerous advantages. For instance, when its production is powered by renewable energy sources, it results in zero direct emissions, it enables large-scale energy storage, and it can be integrated with Medium-Voltage DC (MVDC) grids and, more broadly, with microgrids, thereby enhancing overall grid stability. Obviously, there are also several challenges to address, including the high cost of electrolysis, the need to build dedicated infrastructure (pipelines, storage and distribution systems), and competition with blue/gray hydrogen [
4,
5].
The energy mix for producing hydrogen is broad. Theoretically, any renewable source can be used for this purpose. Among the renewable sources, an interesting possibility is the exploitation of the motion of sea waves that has been the focus of attention of numerous researchers for several years [
6,
7,
8,
9,
10,
11,
12,
13].
Despite this, wave energy is one of the least exploited renewable energy sources, but it offers significant potential advantages: relatively high energy density, predictability in many locations, distributed potential along the coast, and complementarity with wind and solar power. Combining a wave energy converter (WEC) with a hydrogen production system (e.g., based on electrolysis) can offer a path to exploit these marine resources more directly, reducing losses and costs associated with long transmissions, electricity storage, and grid fluctuations.
Many seas, such as the Adriatic Sea or other regions of the Mediterranean Sea, have a wave regime characterized by significant, low wave heights, averaging less than 1 m, but with high frequency and relatively even energy distribution. These low-energy sites have only recently begun to attract interest. Over the past decade, several converters have been proposed, mostly at the proof-of-concept level rather than prototypes, with most applications targeted at the Mediterranean Sea [
14,
15,
16,
17].
Projects experimenting with the use of WECs originally developed for more energetic oceans have shown lower performance levels in the Mediterranean Sea. This suggests that existing technologies may not be suitable for low-energy seas. As a result, research has recently focused on scaling up existing technology using Froude similarity, with different scaling ratios depending on the specific technology and site being considered.
While WECs are primarily intended for electricity generation, in the literature, they are also applied to functions considered secondary, such as desalination, multipurpose offshore platforms, and hydrogen production and storage.
Although low-energy sites may not be ideal for installing large-scale offshore systems, they could provide favorable conditions for testing and developing low-power WECs that can be integrated into existing seaport or beach infrastructure. This environment can allow for testing innovative devices under real, yet controlled, operating conditions, with low installation and maintenance costs.
Since wave motion in many cases is characterized by inconstancy and unpredictability, the production of electrical energy from such a system by directly supplying a load with particular voltage requirements is almost impossible. As a result, having a storage system becomes very advantageous. An interesting possibility in this sense is represented by hydrogen, which is a non-polluting element. It can be produced with electrolysis and easily stored in small quantities, at reduced pressures, and used to power fuel cells, gas heaters or internal combustion engines [
18]. This may represent a significant step toward local production of green hydrogen for seaport and maritime applications. Looking ahead, the growing focus on emissions in ports and the spread of fuel cell-powered vessels make hydrogen a particularly attractive option for the development of sustainable maritime mobility.
In this paper, a WEC based on an oscillating body and an innovative electric power-take-off composed of a linear electrical generator and a power converter specifically made to supply an electrolyzer is considered. Details of the primary power take-off (PTO), which can potentially be used for other functions such as the more classic generation of electricity for general purposes, are not disclosed at this stage.
The proposed energy harvesting system, planned to be installed along the coastal stretch of the Italian Northern Adriatic Sea, generates a DC voltage output suitable for a variety of applications. For instance, it can be used to charge a battery or power low-voltage DC devices. Examples include instrumented buoys that collect and transmit oceanographic, environmental, and meteorological data, or for coastal lighting, among other uses. Our project, however, focuses on storing electrical energy by producing hydrogen, which is one of the most promising energy carriers.
From a technological standpoint, one of the main challenges is managing the variability of the electrical signal generated by wave motion. The energy produced by the generator is intrinsically pulsating, with voltage and frequency varying over time. To make this energy usable by an electrolyzer, a power conversion and conditioning system capable of stabilizing the output current is required, minimizing losses and maximizing the overall efficiency of the process.
Furthermore, to optimize system performance, a load adapted to the generator is needed. The impedance adaption between the load and the windings resistances of the electric generator is almost mandatory, to maximize the power carried between the generator and the load [
19]. Direct coupling to electrical loads, if a reversible machine is used, is possible, as well [
20], if no particular conditions for load voltage and current are needed.
In the development of power electronic converters for interfacing induction generators with electrolyzers, it is worth noting that a literature search focused specifically on WECs yields a limited number of scientific publications. Most of the available literature focuses on systems where the energy sources, such as wind or solar, exhibit dynamic behaviors that differ significantly from those of sea waves [
21,
22,
23,
24,
25]. While it is true that the topology of the power electronic converter can be inspired by what has already been developed for other energy sources, for WECs the problem of developing ad hoc controls remains because sea waves have strong irregularities.
The objectives of the project introduced here are several, focusing on developing various components of the WEC and testing prototypes in artificial wave basins and real maritime sites. However, this article concentrates on designing a linear generator optimized for low speeds and limited oscillations, aimed at maximizing mechanical-electrical conversion in low-wave conditions, as well as on designing the power conversion stage that transforms the energy produced by the linear induction machine into a stable DC voltage suitable for powering an electrolyzer. In summary, what sets the devices presented here apart from those found in the existing literature includes the following:
The use of Finite Element Method (FEM) to design an innovative tubular linear generator, featuring a central stator with windings and ring-shaped permanent magnets in an outer slider.
The design of an electronic power converter with three phase inputs and one output, enabling the linear generator to interface with an electrolyzer. This topology can effectively harvest energy from multiple windings (specifically, three).
The development of a power electronic converter control that maintains a well-regulated DC voltage even with irregular waves that generate significant input disturbances.
The design relies on numerical models that can be interconnected, even if they are developed using different software environments. This approach is important not only for a first sizing of these blocks, but also for creating models that can be coupled with other components’ models of the system, including the oscillating body that interacts with the waves and the electrolyzer. The goal is to develop a self-consistent model of the entire system that enables overall optimization while considering the mutual interactions among the various devices.
The paper is organized as follows. The next section provides a concise overview of the latest advancements in WECs for hydrogen production. Following this, the paper outlines the main features of the proposed system and highlights the key results obtained from simulations. The paper concludes with an outline of the proposed system.
2. Current Developments in Wave Energy Converters for Hydrogen Production
Historically, WECs have been designed primarily for general-purpose electricity generation. Potentially, any WEC can be used to power electrolyzers for hydrogen production. Given the growing interest in this energy carrier, in recent years, international research has increasingly focused on integrating wave energy conversion devices with hydrogen production systems. Studies and projects such as GreenH2Wave [
26], experimental prototypes with oscillating water columns in Portugal and Scotland, and Proton Exchange Membrane electrolyzers (PEM) coupled to point absorber models [
27] demonstrate the technical feasibility of these systems and the potential synergies between marine and hydrogen technologies. However, most experiments focus on high-energy sites, leaving the field of devices designed for low-wave areas, such as the Northern Adriatic, largely unexplored. In fact, there are not many works published specifically for WECs intended for low energy sites, such as those already cited in the introduction [
14,
15,
16,
17].
In parallel with the aforementioned studies and projects, recent years have seen growing interest in modular solutions integrated with coastal infrastructure. These solutions can reduce installation and maintenance costs while improving landscape acceptability. In this context, point absorbers, such as those foreseen in the R&D project of this article, installed on port structures or piers represent a promising direction. In fact, they can be compact, scalable, and installed close to energy use sites.
Considering the scalability of hydrogen production systems, research often explores their potential by examining various energy sources available in marine environments. Studies tend to focus on hybrid systems combining sea waves with wind, rather than solar radiation [
24,
25,
28].
The issues addressed are diverse as summarized in
Table 1. They concern economic aspects, rather than feasibility issues that require estimating potential energy production. For example, in [
29], some details about the producibility of an oscillating wave surge converter are estimated and shown, with proper considerations. Other important topics are those relating to technologies for making electrolyzers and storage systems. From the point of view of the storage, some natural cavities, such as salt caverns, may be used for hydrogen reservoirs [
30]. In [
31], a discussion about possible generation of hydrogen directly from sea water, together with some topologies for electrolyzers, is presented, just as a reference about the state of the art. Instead, in [
32], a discussion about a hydrogen generator from wave energy and its possible integration in a smart grid is presented.
Table 1 provides a summary overview of the current main developments, challenges and recent projects related to the use of wave energy for hydrogen production, highlighting the main aspects.
It is possible to summarize the current technologies and innovations that have recently rekindled interest in wave-powered hydrogen conversion systems with the following list of key points:
A wide range of solutions for the construction of WECs, with the development of devices that exploit vertical and horizontal movements, and pressure variations in seawater.
Development of increasingly efficient power electronics, with increasingly high-performance and smart converter management.
Development of new advanced PTO control systems to maximize energy extraction.
Testing and production of more corrosion-resistant materials and development of modular structures to facilitate maintenance and scalability.
The work presented here focuses on issues related to the second of the points outlined above: the design of a linear permanent magnet generator (LPMG) and an electronic power converter, the former suitable for the floating system that will transmit the motion generated by its interaction with the waves, the latter suitable for powering an electrolyzer.
Regarding the design of the LPMG, today, the common methodology is based on finite element modeling (FEM). In the literature, there are several works on the design and development of LPMGs for WECs. For example, refs. [
39,
40,
41,
42,
43] are among the most recent and relevant to our work. Examining these works reveals solutions where the stator is positioned outside the slider. In our case, the static part will be mounted on pylons fixed to the seabed. Then, a novelty lies in the fact that the windings will be located internally with respect to the permanent magnets, which will be integrated within a floating body. The sizing of the LPMG was functional to the development of the static electronic power converter.
Numerous publications in the literature discuss power electronic converters for WECs, as evidenced by various reviews on this topic [
44,
45,
46]; however, the existing literature is limited regarding the design and development of power electronic converters for WECs intended for hydrogen production. One exception is the work by Boscaino et al. [
47]. This work has some similarities to ours, but it does not address some issues:
Each LPMG winding is equipped with a power electronic converter, a hydrolyzer, and a tank to store the hydrogen produced.
Access to the hydrogen produced is not easy because it is stored within the floating body of the WEC.
Although a cost analysis has not yet been performed, our approach will be more cost-effective than that of the system proposed in [
47], because the system provides a single power electronic converter for all the LPMG windings, which allows only one electrolyzer to supply hydrogen to a single tank. In the case of an array of buoys equipped with the proposed LPMG, the tank, as well as the hydrolyzer, can be unified for the entire array.
Furthermore, in our case, we plan to install the WEC on pier pylons, i.e., on fixed structures where an electrolyzer and a tank can be more easily accessible. This arrangement not only reduces hydrogen distribution costs but also lowers maintenance expenses.
Finally, the design of the electric PTO in [
47] was demonstrated only under a burst equivalent to a regular wave. As will be shown later, our work demonstrates that the control system has been tuned to ensure good output regulation even in the presence of significant irregularities in the LPMG slider oscillations.
3. Architecture of the Proposed System
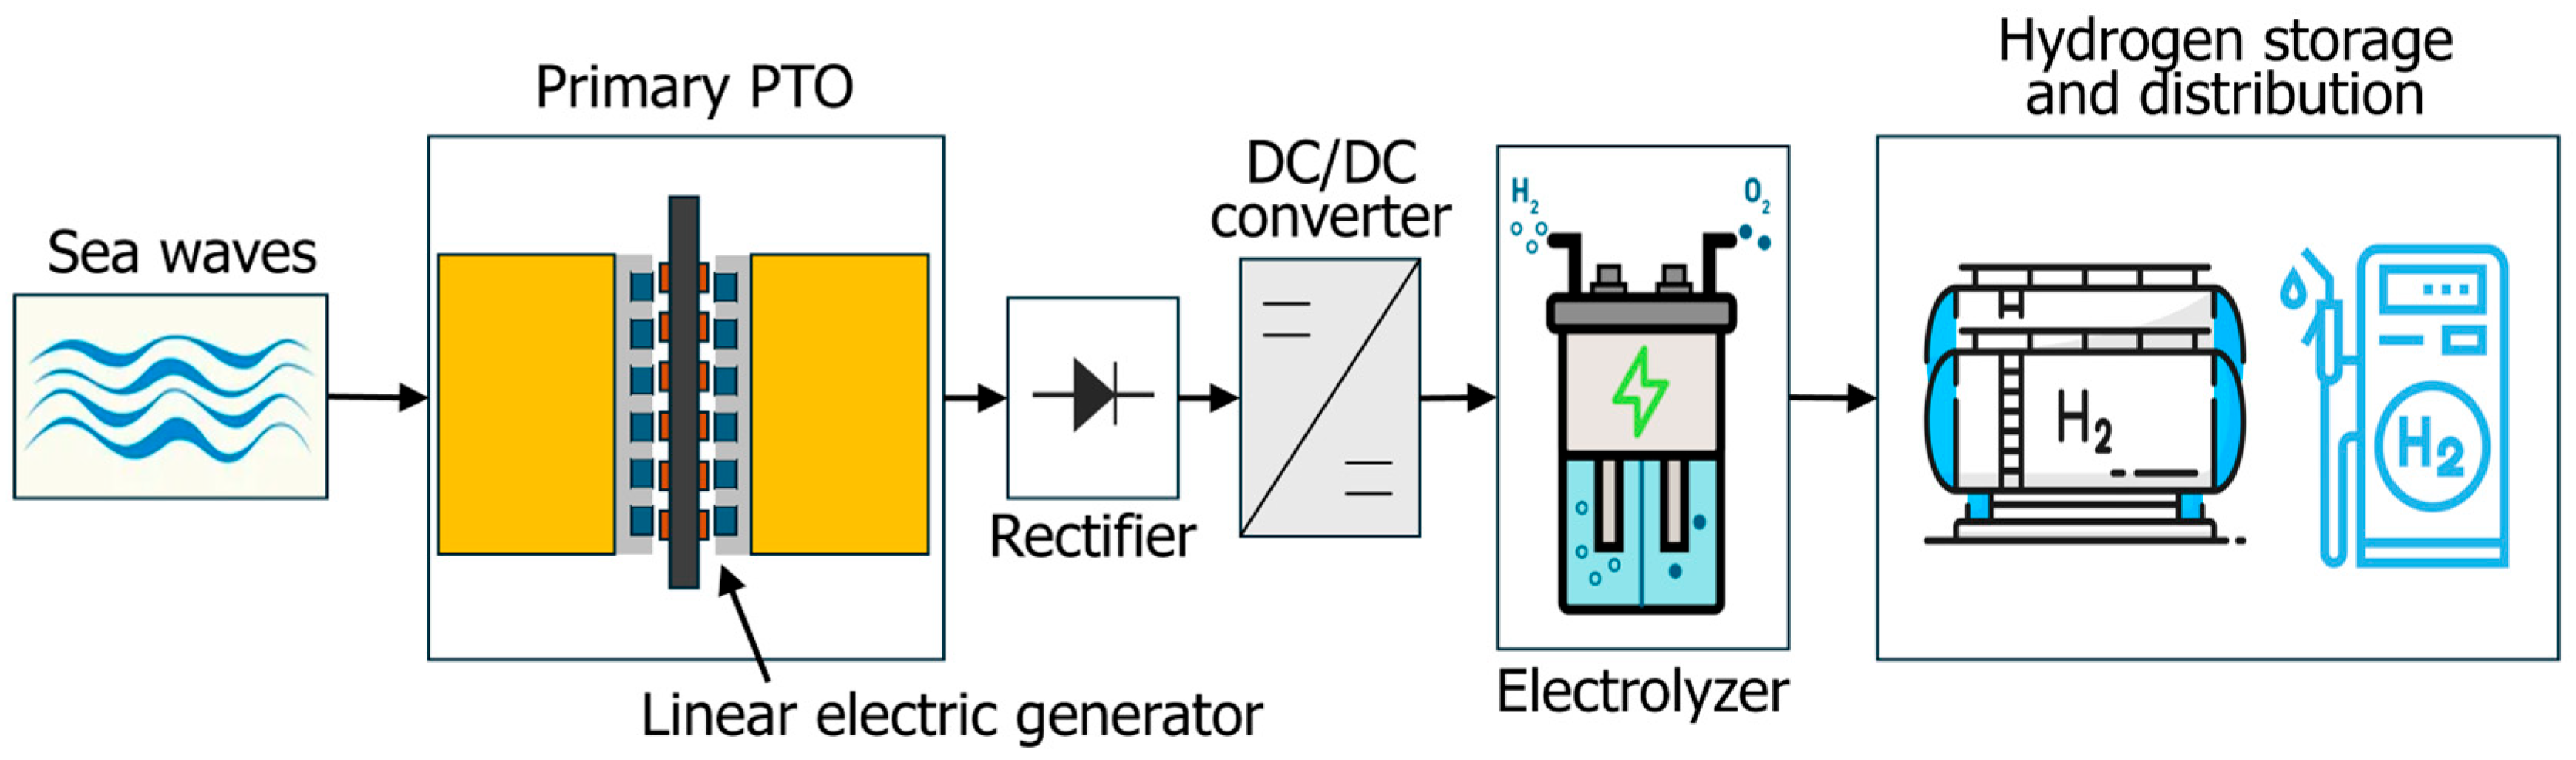
The block diagram of the proposed system is shown in
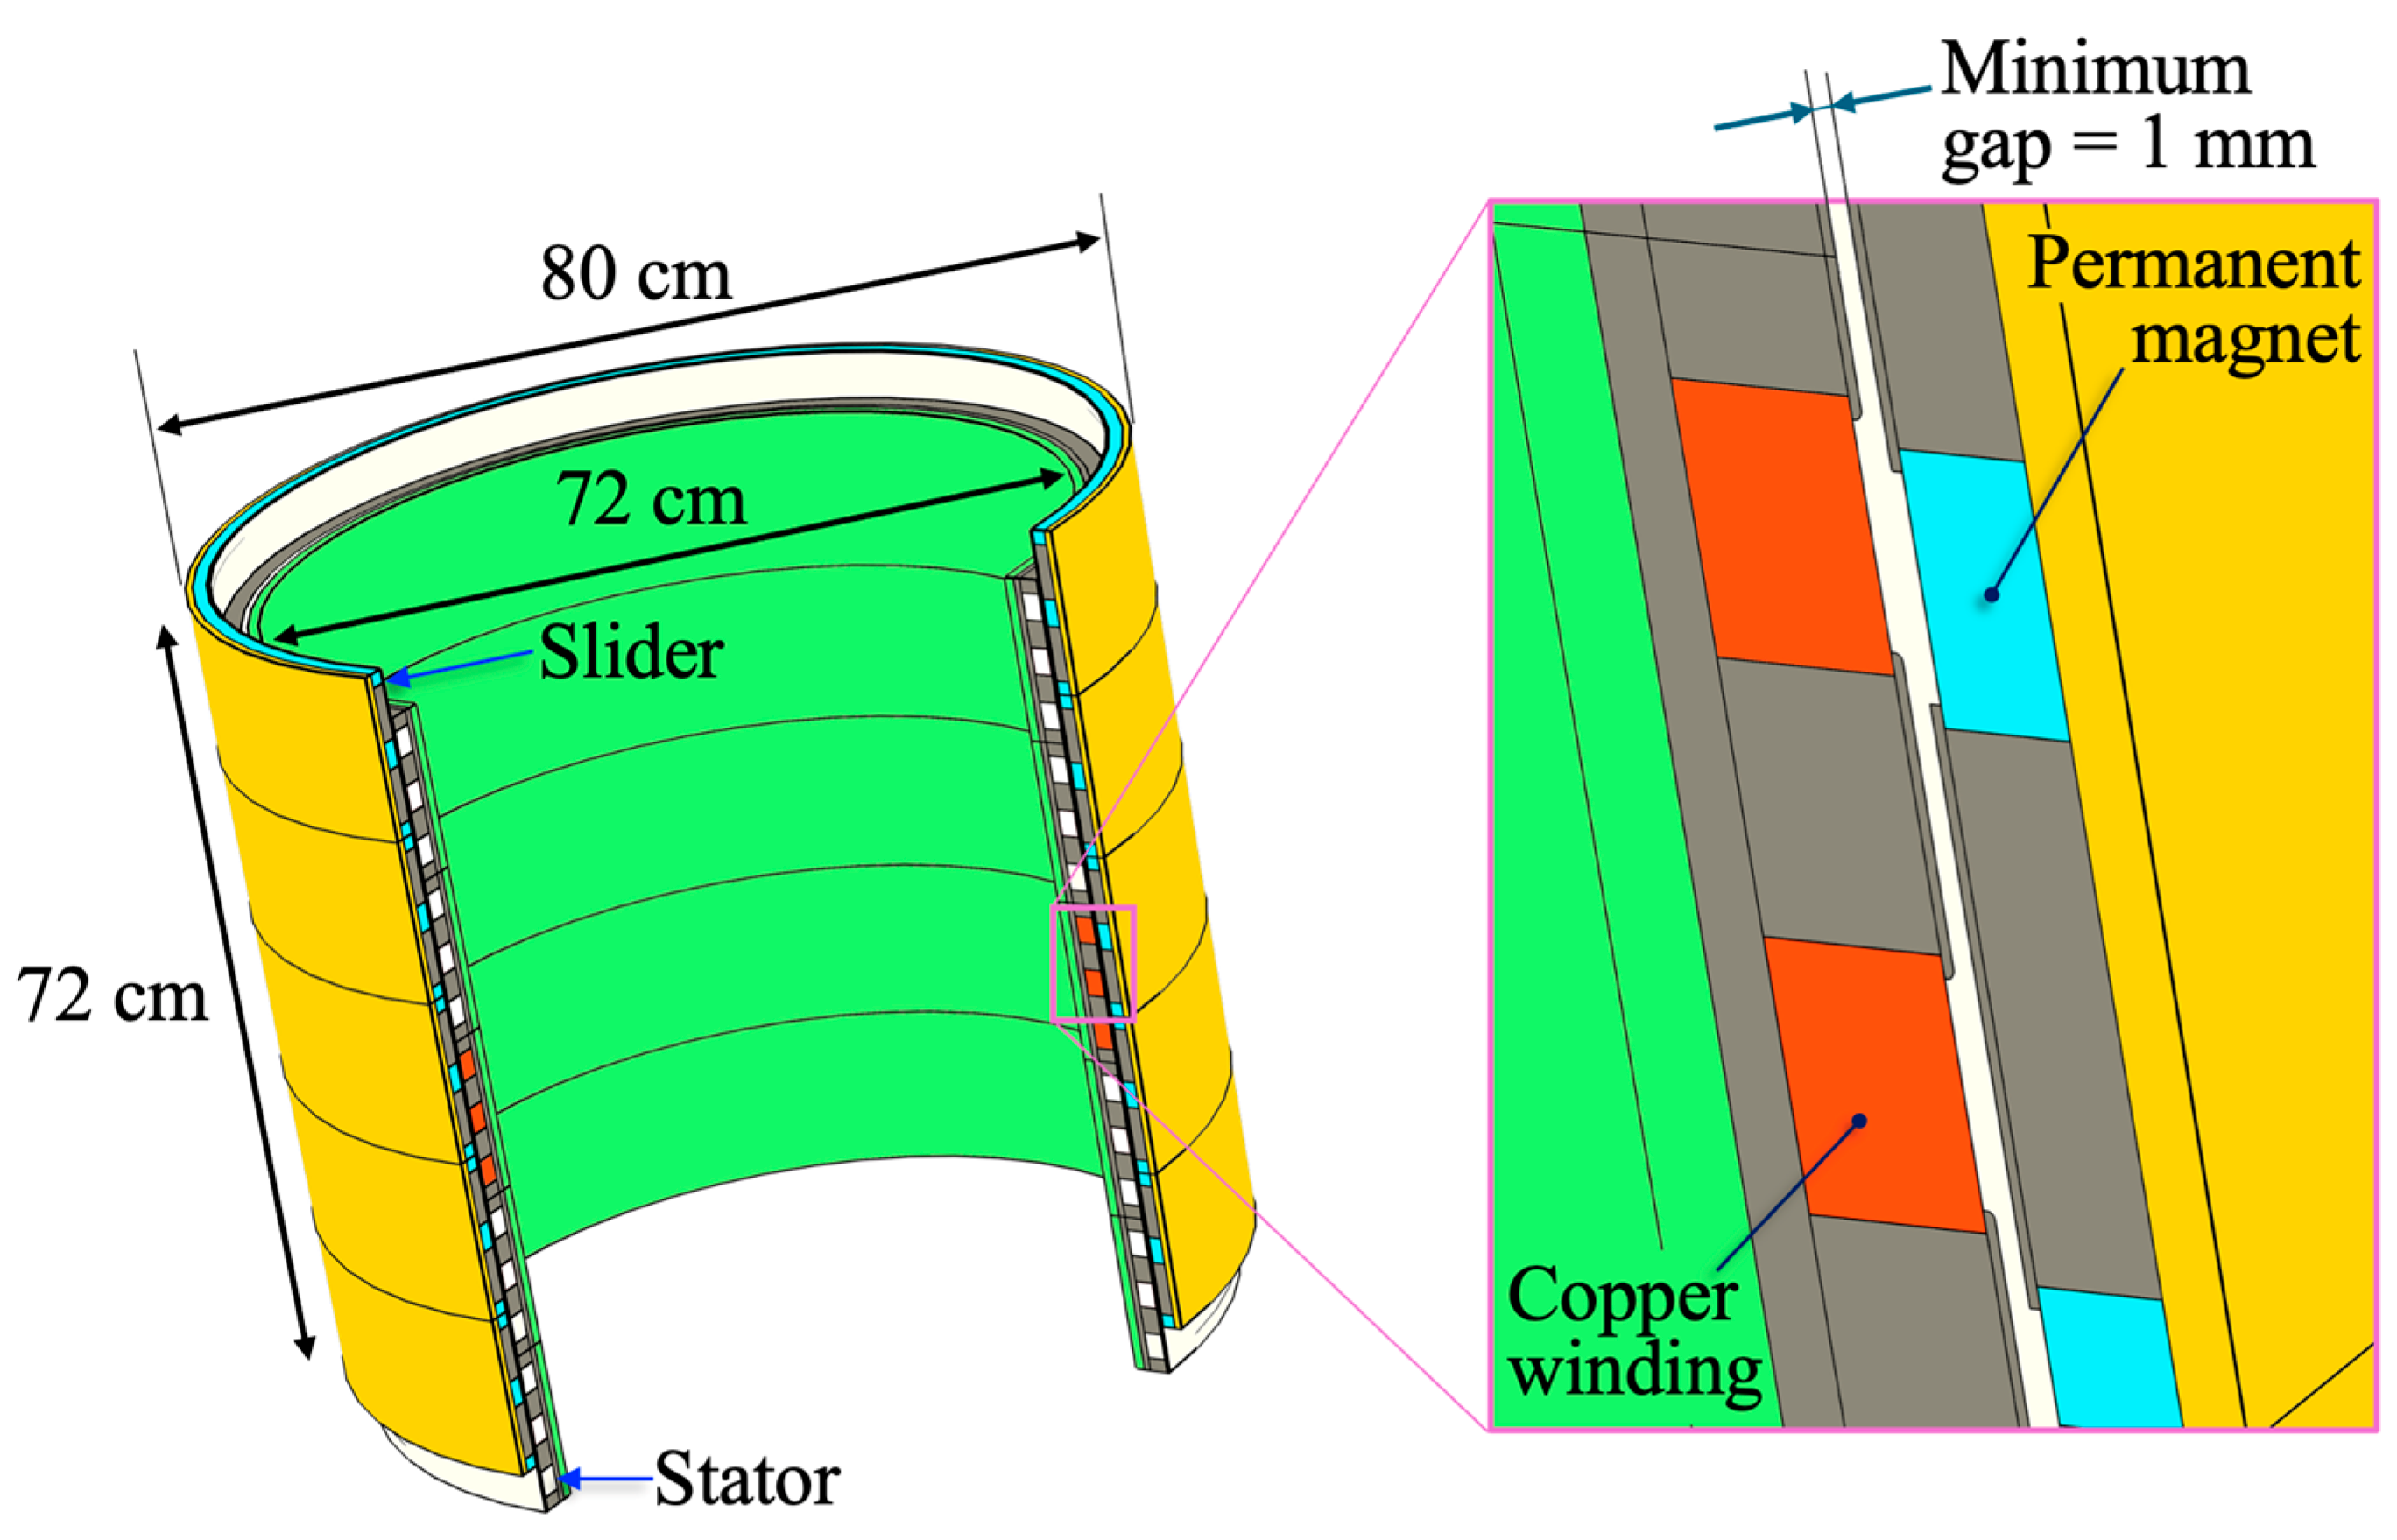
Figure 1. The most important part of the system is represented by the cylindrical linear generator, i.e., composed of a sliding part equipped by nine rings of neodymium permanent magnets, spaced appropriately to have an output similar to that of a three-phase generator, with a magnetic flux of 0.6 T, whose field is conveyed to the appropriate points by a circuit made of ferromagnetic material, equipped with polar expansions. The internal fixed part, again equipped with magnetic circuit and polar expansions, contains three copper windings.
The slider is mechanically connected to the prime mover (primary PTO), i.e., a system consisting of a float free to move on a guide that allows the recovery of kinetic energy from the wave motion. The reciprocal movement between slider and stator allows the induction of an electromotive force on the windings that, if connected to a load, can generate electrical energy. The main details about the generator geometry will be shown in the following paragraphs.
The electrical output of the three windings of the generator is connected to an AC/DC converter, to rectify the voltages from each winding and to adapt the impedance of the load to the series resistance of the generator, to maximize the power extraction and give proper values of current and voltage to the load.
As mentioned before, the system is completed by an electrolyzer that produces hydrogen, which can be stored in a suitable reservoir. This hydrogen can then be used as automotive fuel, as heating fuel or to power small vehicles or portable devices equipped with fuel cells. For the specific application that will be implemented, it is expected to be able to supply hydrogen for a small tourist vessel.
In the uncoupled model of the primary PTO, the floating body oscillations are driven only by the incident waves, but when the LPMG generator delivers electric energy, opposing electromagnetic forces will modify its behavior. Therefore, to optimize the overall system, it is crucial to develop all the numerical models of the system’s component blocks so that they have the inputs and outputs that allow for consideration of their possible mutual interactions (
Figure 2). Specifically, here once the Wave-to-Hydrogen diagram, which models the WEC at a high level of abstraction, has been drawn, it is possible to translate it into a numerical model. The hydrodynamic model of the WEC, once the test campaign in an artificial wave basin for the characterization of a prototype is completed, will be a set of MATLAB R2024a scripts, where the dynamic behavior of the oscillating body will be computed considering the coupling with the generator loaded with the secondary PTO. Then, the input of the resulting model will be the sea state (e.g., defined by the peak period
Tp, the significant wave height
Hs, for regular waves) and the electromagnetic force (acting as a brake) that opposes the prime slider’s translation.
The FEM model of the LPMG will be fully coupled with the SPICE model of the electrical power converter, and the MATLAB/Simulink model of the electrolyzer. The electrolyzer model will also be obtained with a characterization of the prototype that is being developed.
The hydrodynamic model of the WEC and the systems of equations governing mass/energy balance, voltage, current, and reaction kinetics for modeling the electrolyzer’s behavior, are not within the scope of this work.
4. FEM Analysis of the Linear Generator
To design the generator for the system, an ad hoc finite element model was developed using COMSOL Multiphysics 6.4. This software allows for FEM-Spice co-simulations of the linear generator coupled to a rectifier and a load matched to the generator series resistance. Additionally, it can be integrated with other software, such as MATLAB/Simulink, to enhance FEM simulations with block-based behavioral models.
The permanent magnet linear generator (
Figure 3) is designed in a tubular shape, featuring a central fixed component (the stator) and an external movable component (the slider). The windings are housed within the central part, while the permanent magnets are positioned in the external slider. This configuration is relatively uncommon in oscillating WEC systems, which necessitate the use of this type of generator.
The following paragraphs provide further details of the implemented model, and the results obtained from the simulations.
4.1. Modeling and Geometry Details
The model was implemented with COMSOL’s Magnetic Fields interface, where the following differential equations are solved in the media:
The Ampère’s law , where is the magnetic field and is the current density;
, where is the magnetic flux density and is the magnetic vector potential;
The generalized Ohm’s law that describes the total current density in a moving conductor , where σ is the material’s electrical conductivity, is the electric field, is the conductor’s velocity (or charge carriers within it), and is the external current density (i.e., the additional current density not caused by the conductor’s motion).
For this study, the axial symmetry of the device enables the simulation to a 2D model. This approach significantly saves computational resources and time while maintaining accuracy compared to a 3D model that corresponds to a full 360° revolution of half the cross-section of the cylindrical structure along its central axis. Then, for the first design stage of the linear generator with permanent magnets (PM) [
48] the FEM electromagnetic model was developed to simulate electromagnetic fields and induced currents in the time domain, and to estimate the generated power.
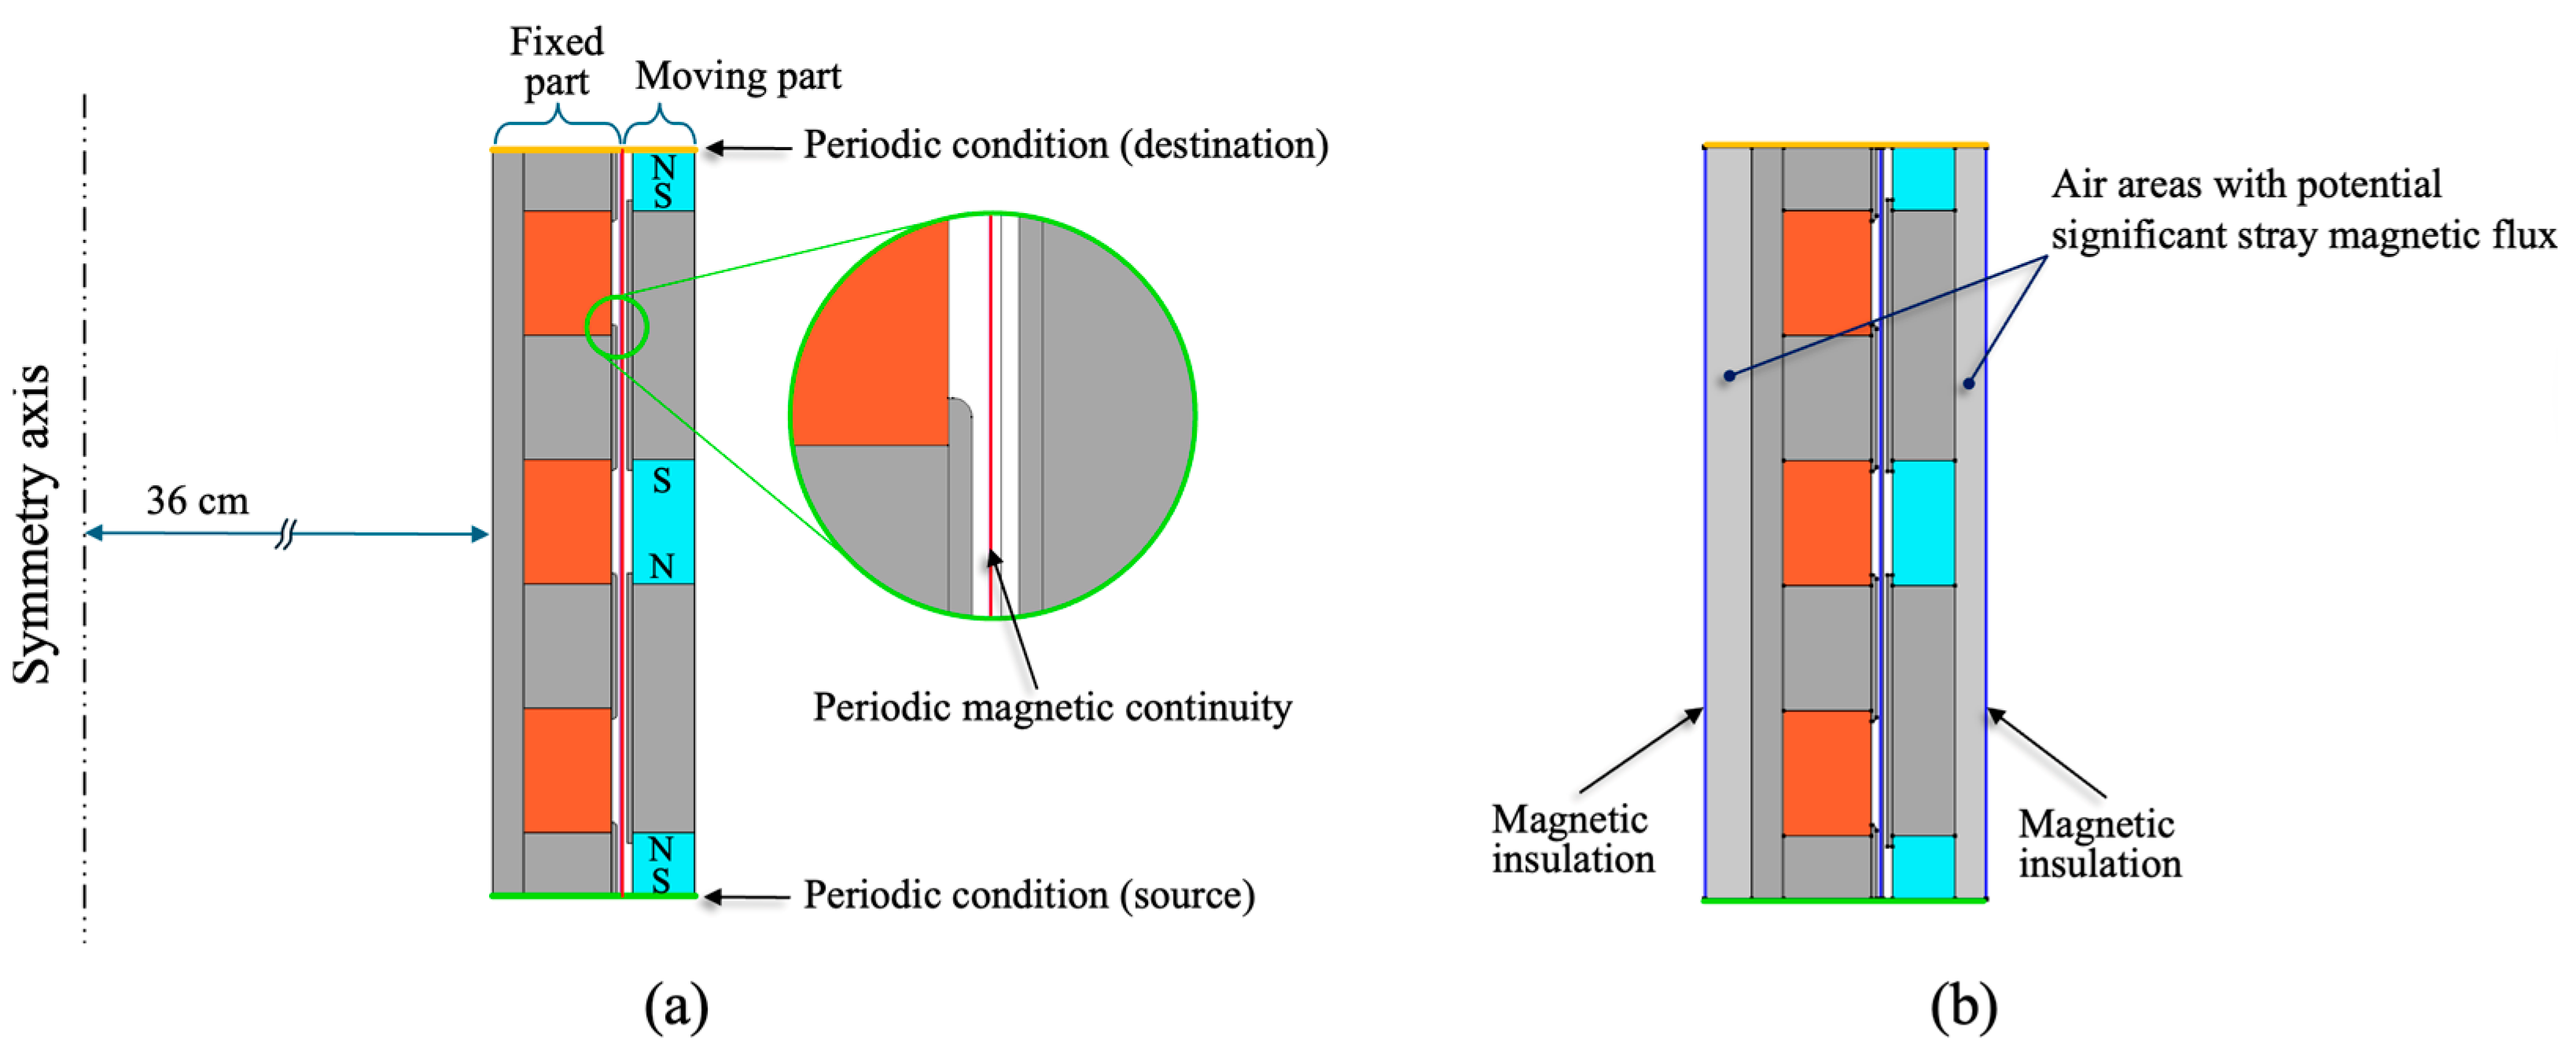
Figure 4 shows some FEM model’s details. The slider consists of an array of ring-shaped magnets with alternating magnetic polarities and separated by soft iron for induction machines (darker gray areas in
Figure 4). The slider is modeled using a
Moving Mesh with the desired displacement over time and is connected to the stator through a
Periodic Magnetic Continuity boundary pair.
Since the slider consists of a periodic array of magnets, and the core of the stator, made of soft iron, also exhibits periodicity, symmetry can be utilized to reduce computational cost. Then, only one unit cell of the structure is modeled, and a periodic condition is applied to the top and bottom boundaries of the 2D geometry to represent the rest of the array. This is performed by applying continuous
Periodic Conditions to the edges of the slider and stator [
49]. This means that the magnetic vector potential for these boundaries is
.
The magnets were set as neodymium with a remanent flux density of 0.6 T. For the magnetic circuit core, the material chosen was soft iron, modeled with B-H hysteresis. The Jiles–Atherton model [
50] available in the COMSOL library, was used, with the model parameters extracted from [
51] for a non-oriented laminated core with a maximum magnetic flux density of
Bmax = 1.6 T.
Instead, the windings were modeled using copper as the material and with the specific COMSOL Domain Coil setting, characterized by a Homogenized multiturn winding model in which the number of turns, the section area of the copper wire, and the coil excitation type are specified. By choosing the Circuit (current) type for the latter, COMSOL, when performing the FEM simulation, allows the coil to be equivalent to a voltage source within an Electrical Circuit, i.e., a SPICE model that is solved in co-simulation with the electromagnetic FEM model. Then, this allows a load to be added to each winding of the LPMG. In this case, the windings were connected to three resistors with identical resistance to that of the windings to obtain the optimal load-generator matching.
For the simulation of the sliding part, a moving mesh with a time dependent displacement generates the motion. It was included in the model, onto the domains representing the slider, with a function of time, either sinusoidal or derived from an irregular wave. The stator, instead, was simulated with a standard fixed mesh.
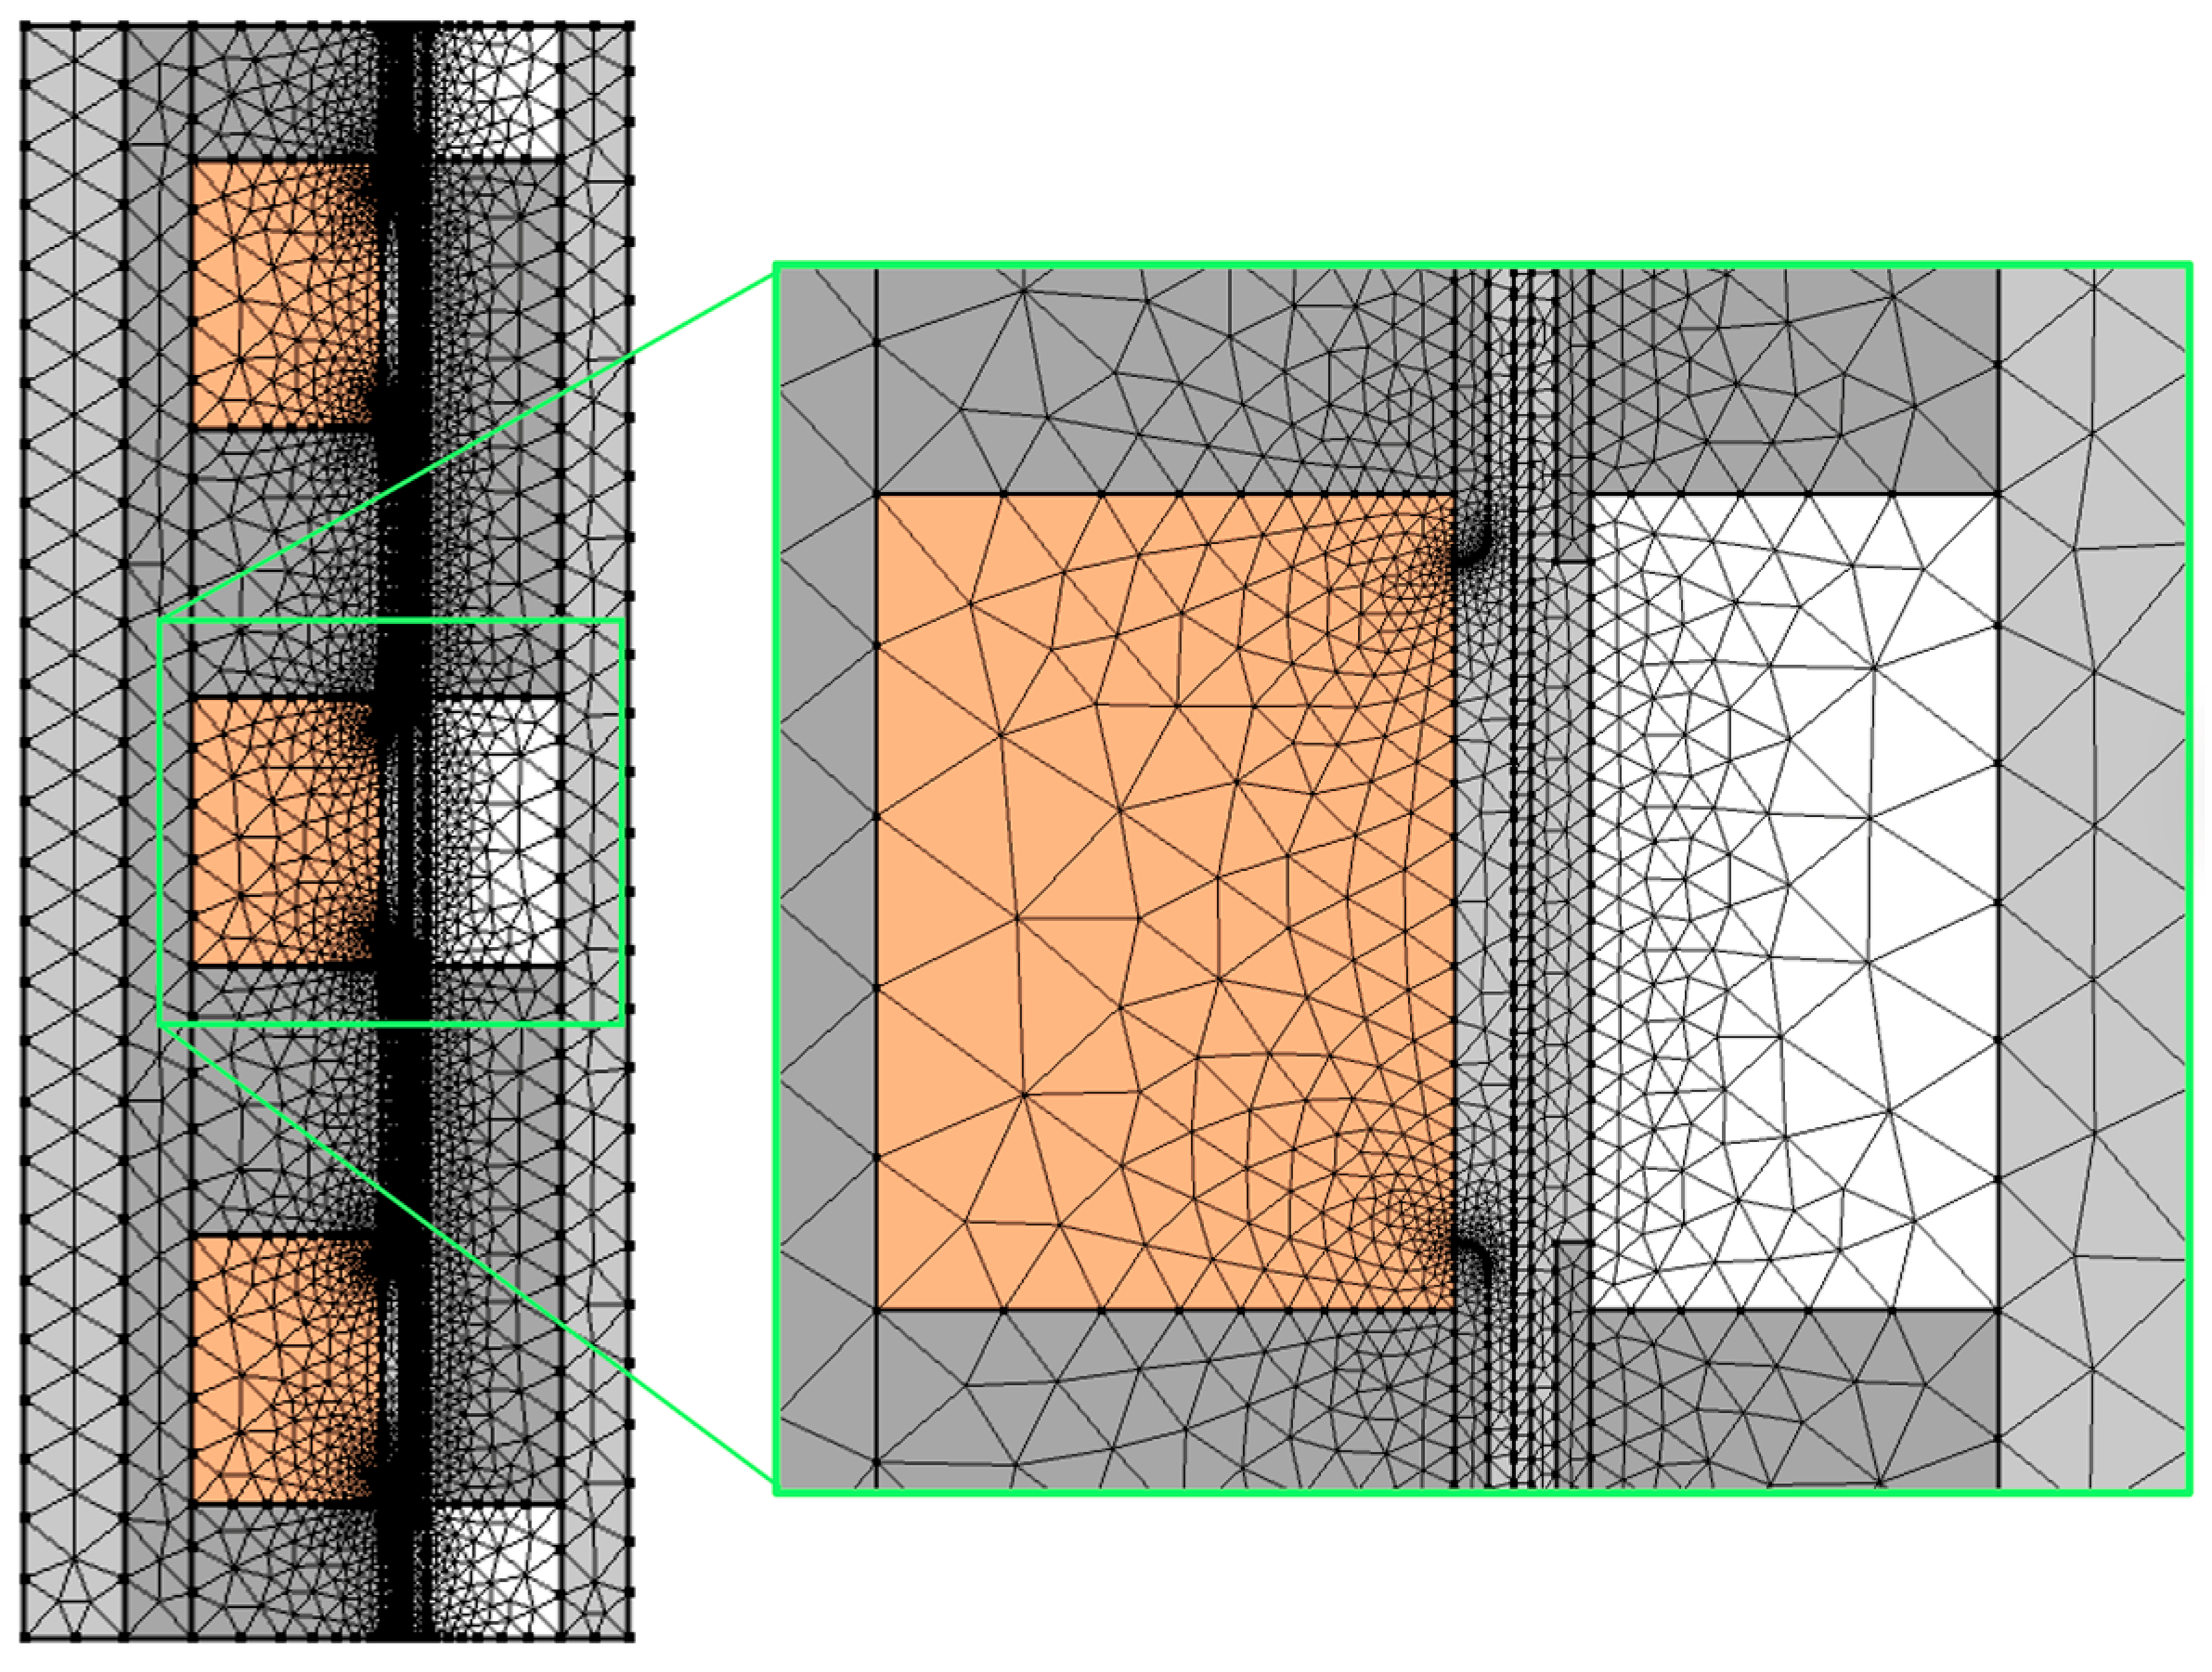
Regarding the mesh, we opted for a composition of triangular elements, allowing COMSOL’s calculation engine to freely generate it with the automatic triangulation algorithm for
General physics, but with the constraint of imposing equality between the source and destination elements on the boundaries where the periodicity conditions were set. By applying COMSOL’s default resolutions, we were able to verify that by refining the mesh beyond the
Finer degree, the simulation results did not show significant changes in the values of the calculated variables. The resulting mesh appears as in
Figure 5, and it is composed of 7969 triangular elements.
4.2. FEM Simulation Results
As far as the generator windings are concerned, the number of turns and the wire cross-section area, equal to 600 and 0.65 mm
2, respectively, were chosen through a FEM simulation campaign, varying the number of turns and adapting the load each time, keeping constant the total section area (computed as product between turn numbers and section of the wire, considering an ideal case with unitary packing factor) to maximize the extracted power. The results of all evaluated cases from the simulation campaign are presented in
Table 2. The theoretical power at the load (P
rms) is around 82 W for all cases. It is obtained with different voltages and loads matching the series resistances of the windings.
The case with 600 turns was identified as the best tradeoff among market availability of the wire, as well as values of the generated voltages and currents. With the oscillations imposed on the slider, in this case the average voltage is approximately 33 V (with a Vmax = 93 V) and a maximum current of approximately 3.7 A. With these values, it is not difficult to find silicon switches on the market suitable for the conversion circuit presented below.
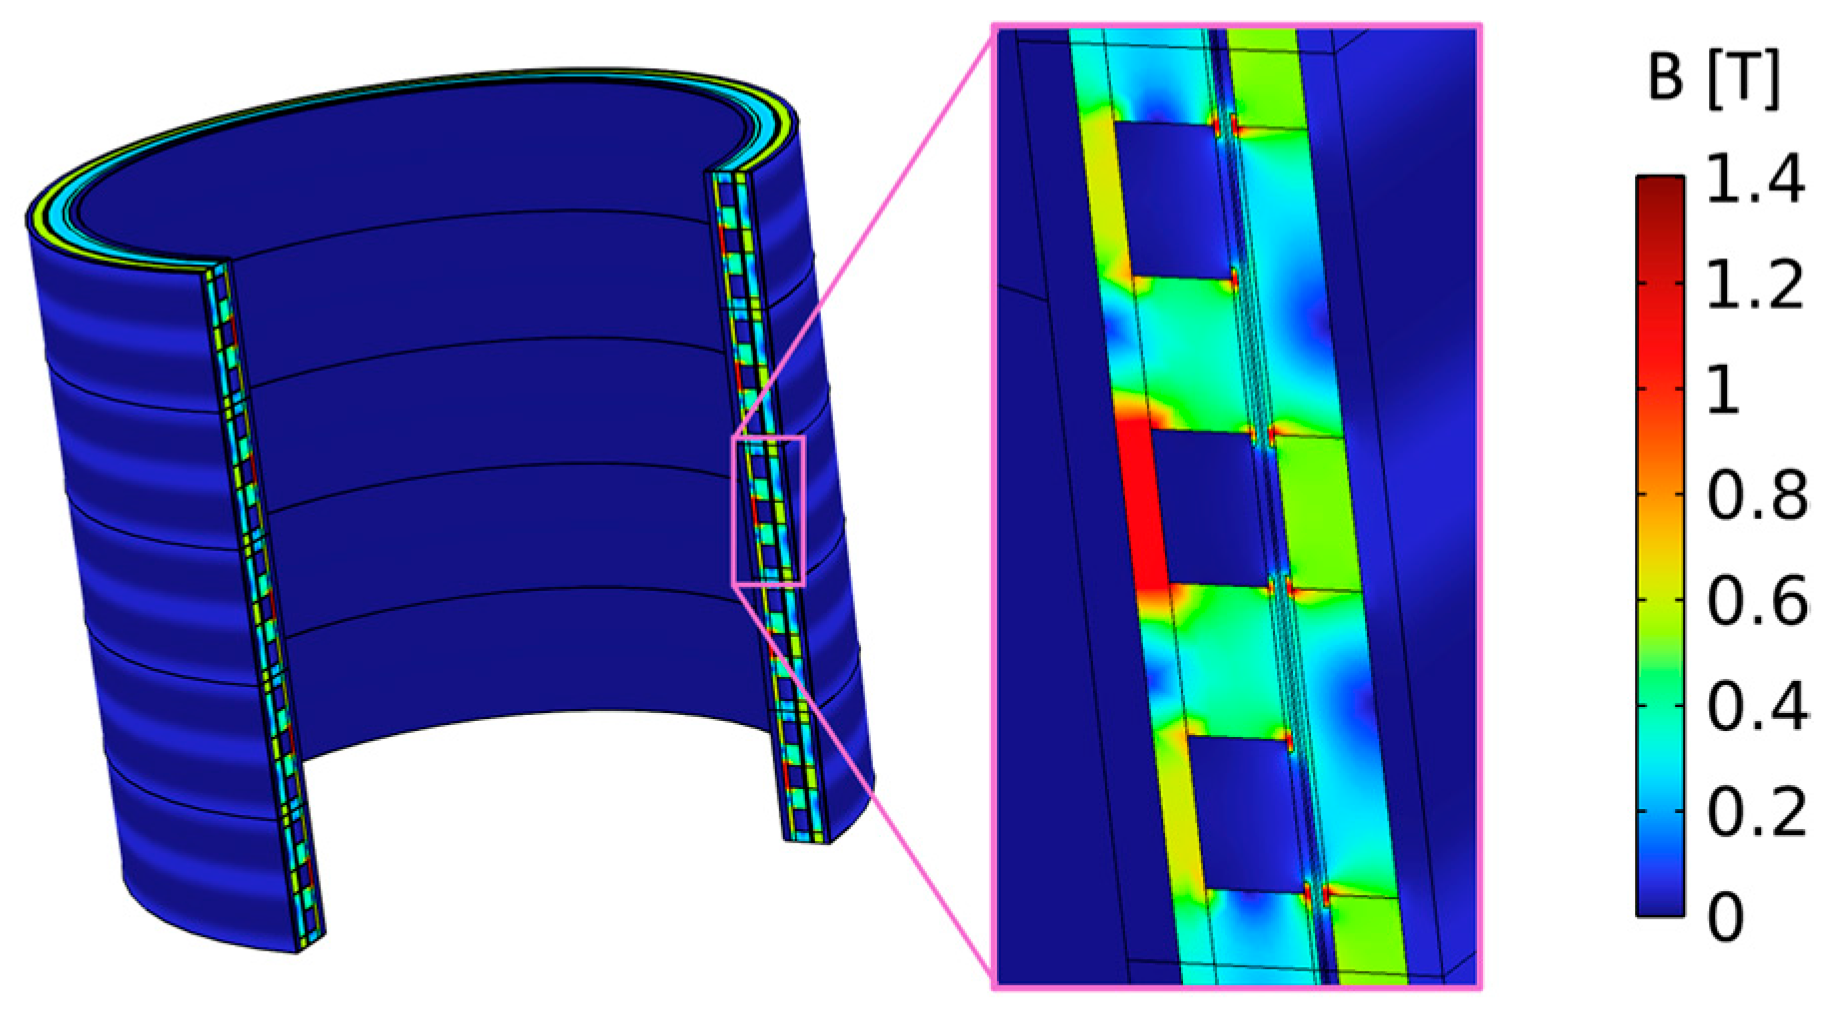
With the first version of the model including 1.2 T magnets, saturation in wide zones of the ferromagnetic circuit was evident. This suggested the hypothesis of changing magnets with different ones, with a lower magnetic flux, such as equal to 0.6 T, as performed in the final model. As an example,
Figure 6 represents the map of magnetic flux at the beginning of the time-domain stimulation, that can be obtained with a stationary study without movement and, therefore, not yet with induced currents.
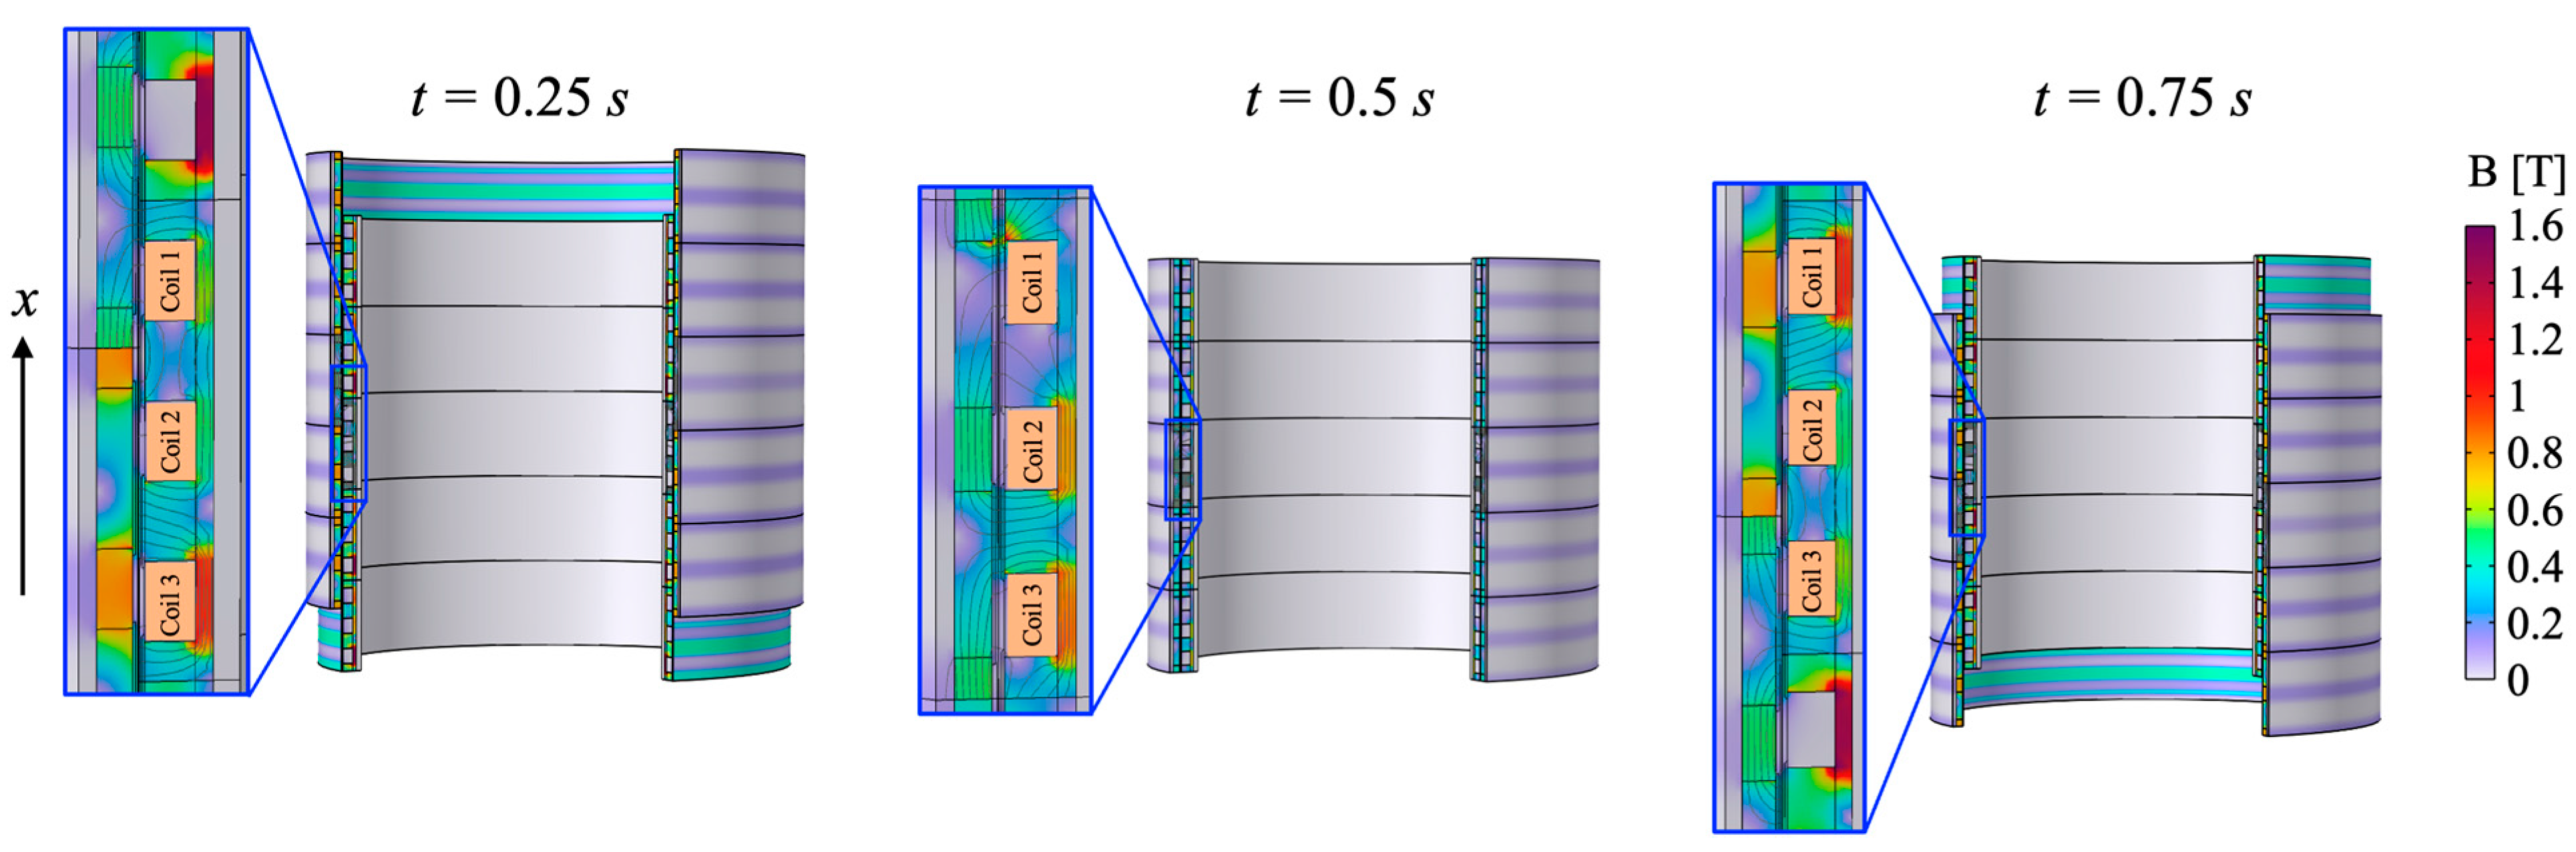
Figure 7 shows some snapshots of the magnetic flux obtained from a transient simulation that includes permanent magnets in the model, with a sinusoidal oscillation of the slider at a frequency of 1 Hz and an amplitude of 10 cm (20 cm peak-to-peak).
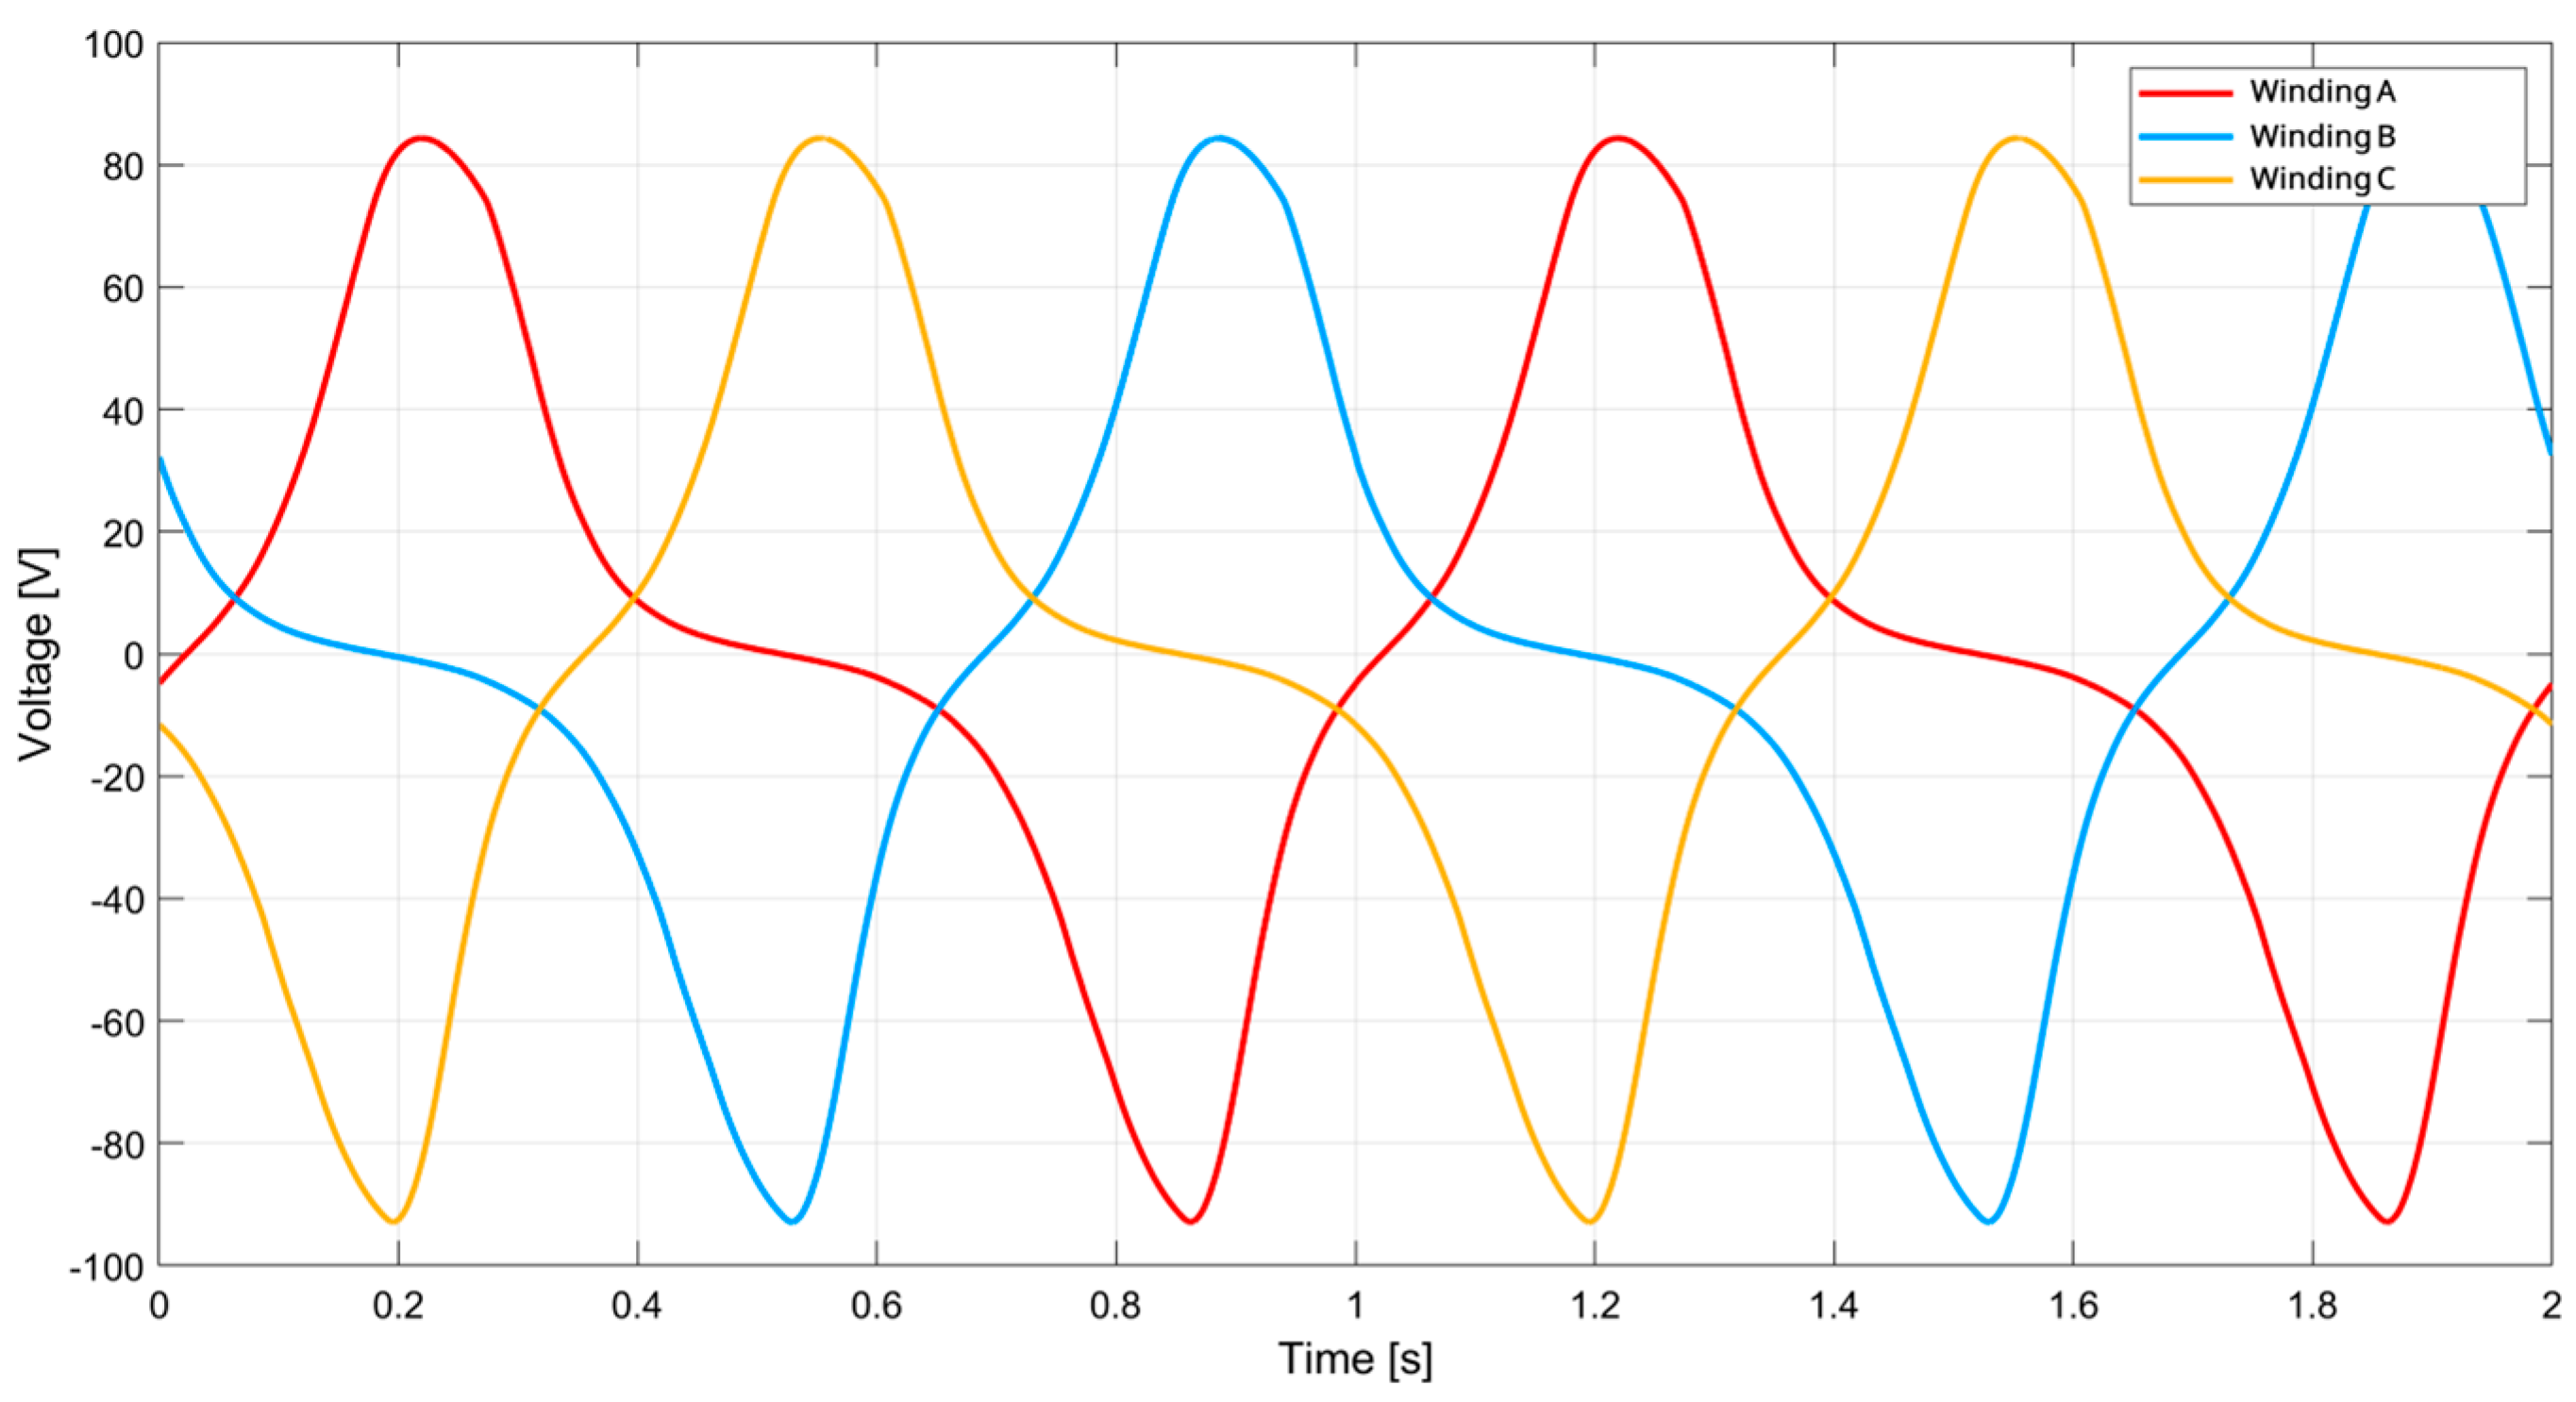
Figure 8, instead, represents the three voltages generated by the windings. In a wave motion energy harvesting system, the three output voltages obtained from the oscillatory motion of the generator do not behave like those of an ideal three-phase generator. Unlike a perfectly symmetrical three-phase set, where each phase has equal amplitude and is shifted by 120° from the others, the voltages generated by ocean waves are irregular and unbalanced because the structure of the linear generator is fixed with specific spacings between magnets and between windings. Thus, a standard three-phase voltage set can be obtained only for a specific oscillation. Then, unfortunately, the stochastic and irregular nature of the excitation prevents the formation of a true symmetrical three-phase system.
If these voltages are directly combined in series connection before rectification, the lack of symmetry would cause partial cancelation among the signals. In practice, this means that when two phases are out of alignment, their instantaneous contributions may oppose each other, leading to destructive interference. Consequently, part of the harvested energy would be lost, and the effective power delivered to the load would be significantly reduced. To mitigate this issue, it is essential to rectify each phase independently.
5. Analysis of the AC/DC Converter
As previously mentioned, a standard three-phase AC/DC converter is not able to properly handle the signals in
Figure 8, much less those produced by wave motion which is by its nature extremely irregular. In fact, traditional three-phase rectification often assumes balanced and symmetrical phases. For this reason, an innovative architecture has been proposed and developed. It is able to work even with signals whose phase relationship is random.
Unlike conventional designs, the proposed architecture, by converting every individual voltage into a unidirectional current before combining them, avoids phase opposition and ensures that all contributions are additive. This strategy maximizes the net energy extraction, prevents internal losses due to destructive interactions, and increases the overall efficiency of the harvesting process. In summary, individual rectification of each generated voltage is a fundamental design requirement whenever the three signals cannot be guaranteed to form a balanced and symmetrical three-phase set.
The proposed AC/DC converter demonstrates a notable level of innovation due to its novel approach to handling multiple AC sources. Moreover, the architecture significantly enhances overall conversion efficiency, particularly in situations where three-phase signals cannot be guaranteed to be balanced. While most conventional converters rely on ideal assumptions of phase symmetry, this method introduces a robust design principle capable of handling real-world irregularities.
The proposed converter introduces an innovative control approach that ensures a stable output voltage even when the input experiences large and irregular fluctuations, as in the case of a wave harvesting system. Traditional feedback strategies, such as standard Proportional–Integral–Derivative (PID) control, are insufficient to maintain stability under such unpredictable conditions. To overcome this limitation, the design incorporates a feed-forward corrective action, which actively compensates for input variations and guarantees stable operation across all operating conditions. This combination of feedback and feed-forward control represents an interesting advancement, enabling reliable performance in wave energy harvesting environments where conventional controllers fail. More details are discussed at the end of this chapter.
5.1. Proposed Converter Architecture
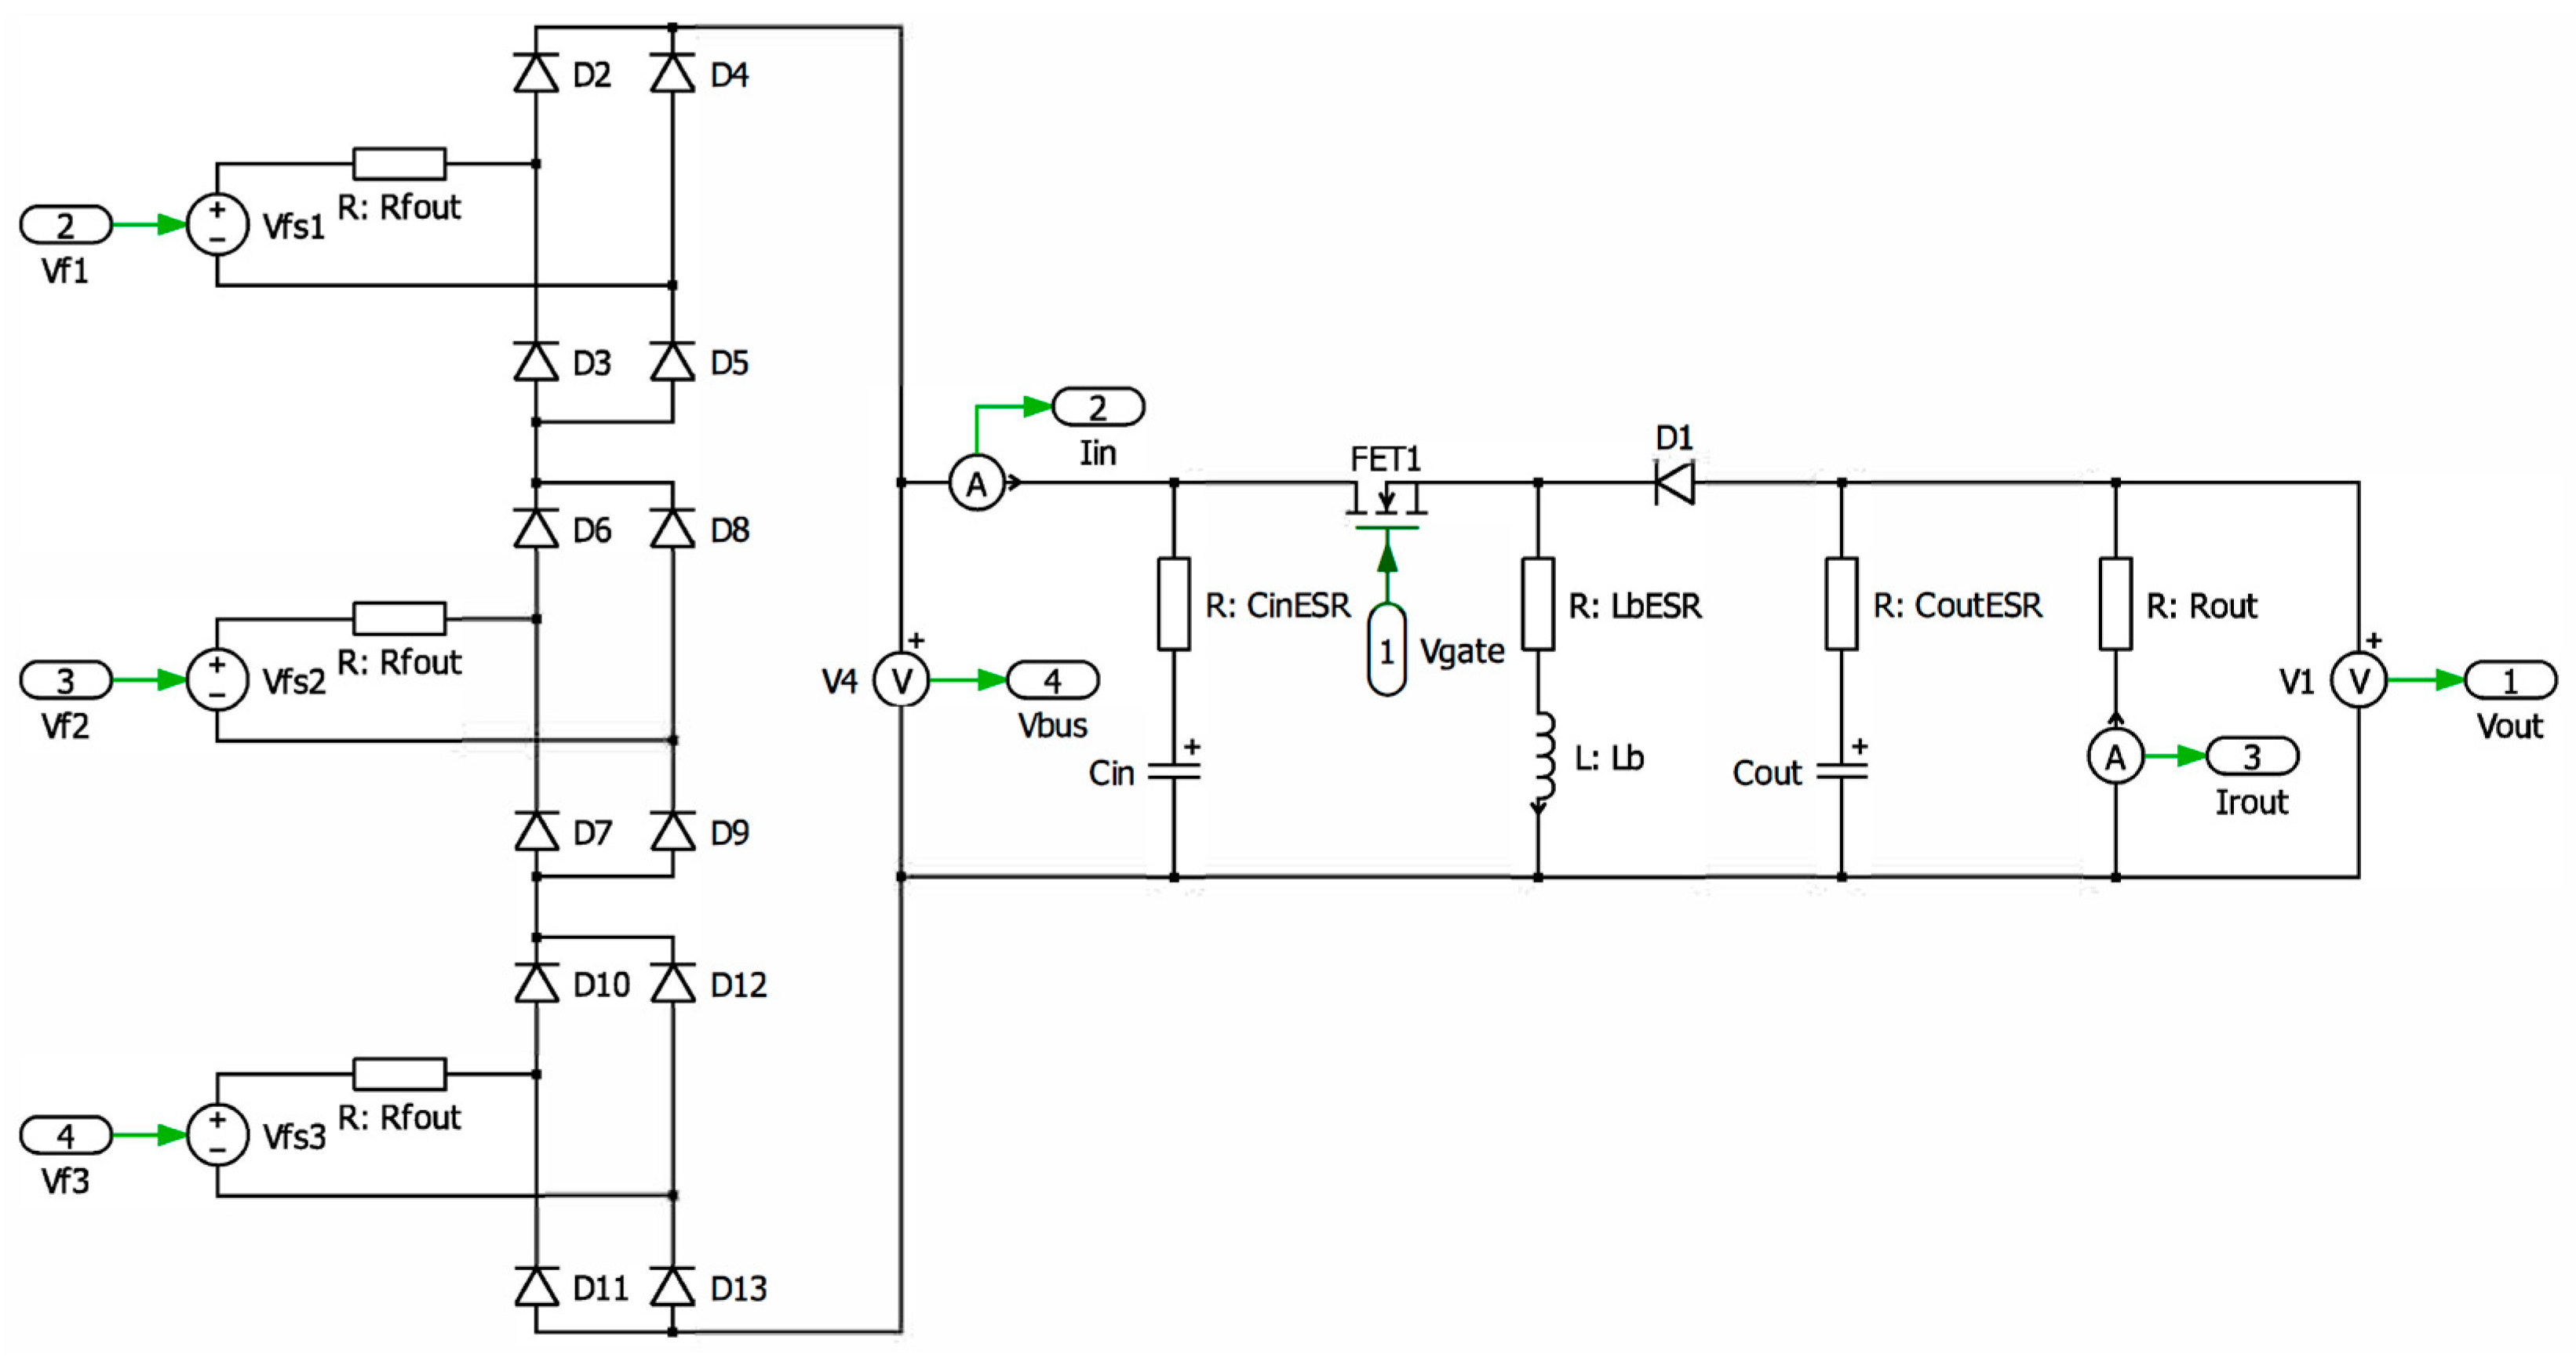
The proposed AC/DC converter architecture is depicted in
Figure 9. It is composed of a rectifier section followed by a DC/DC converter. As can be seen, each winding (whose output is represented by the generators
Vfs1,
Vfs2, and
Vfs3 and their respective output resistances) is rectified using a full bridge, then the three contributions are put in series. The voltage thus obtained, partially smoothed by a filter capacitor (
Cin), is called
Vbus, and represents the input of a buck–boost converter whose purpose is to power a hydrolyzer with a DC voltage (
Vout) of about 15 V.
First of all, to verify if it works properly, this power electronic converter has been simulated with the voltage waveforms of
Figure 8.
The first stage of this converter is composed of three full bridge rectifiers, whose outputs are connected in series with each other. The voltage of this series, obtained rectifying the AC voltages in
Figure 8, is shown in
Figure 10. It is smoothed by an electrolytic capacitor C
in.
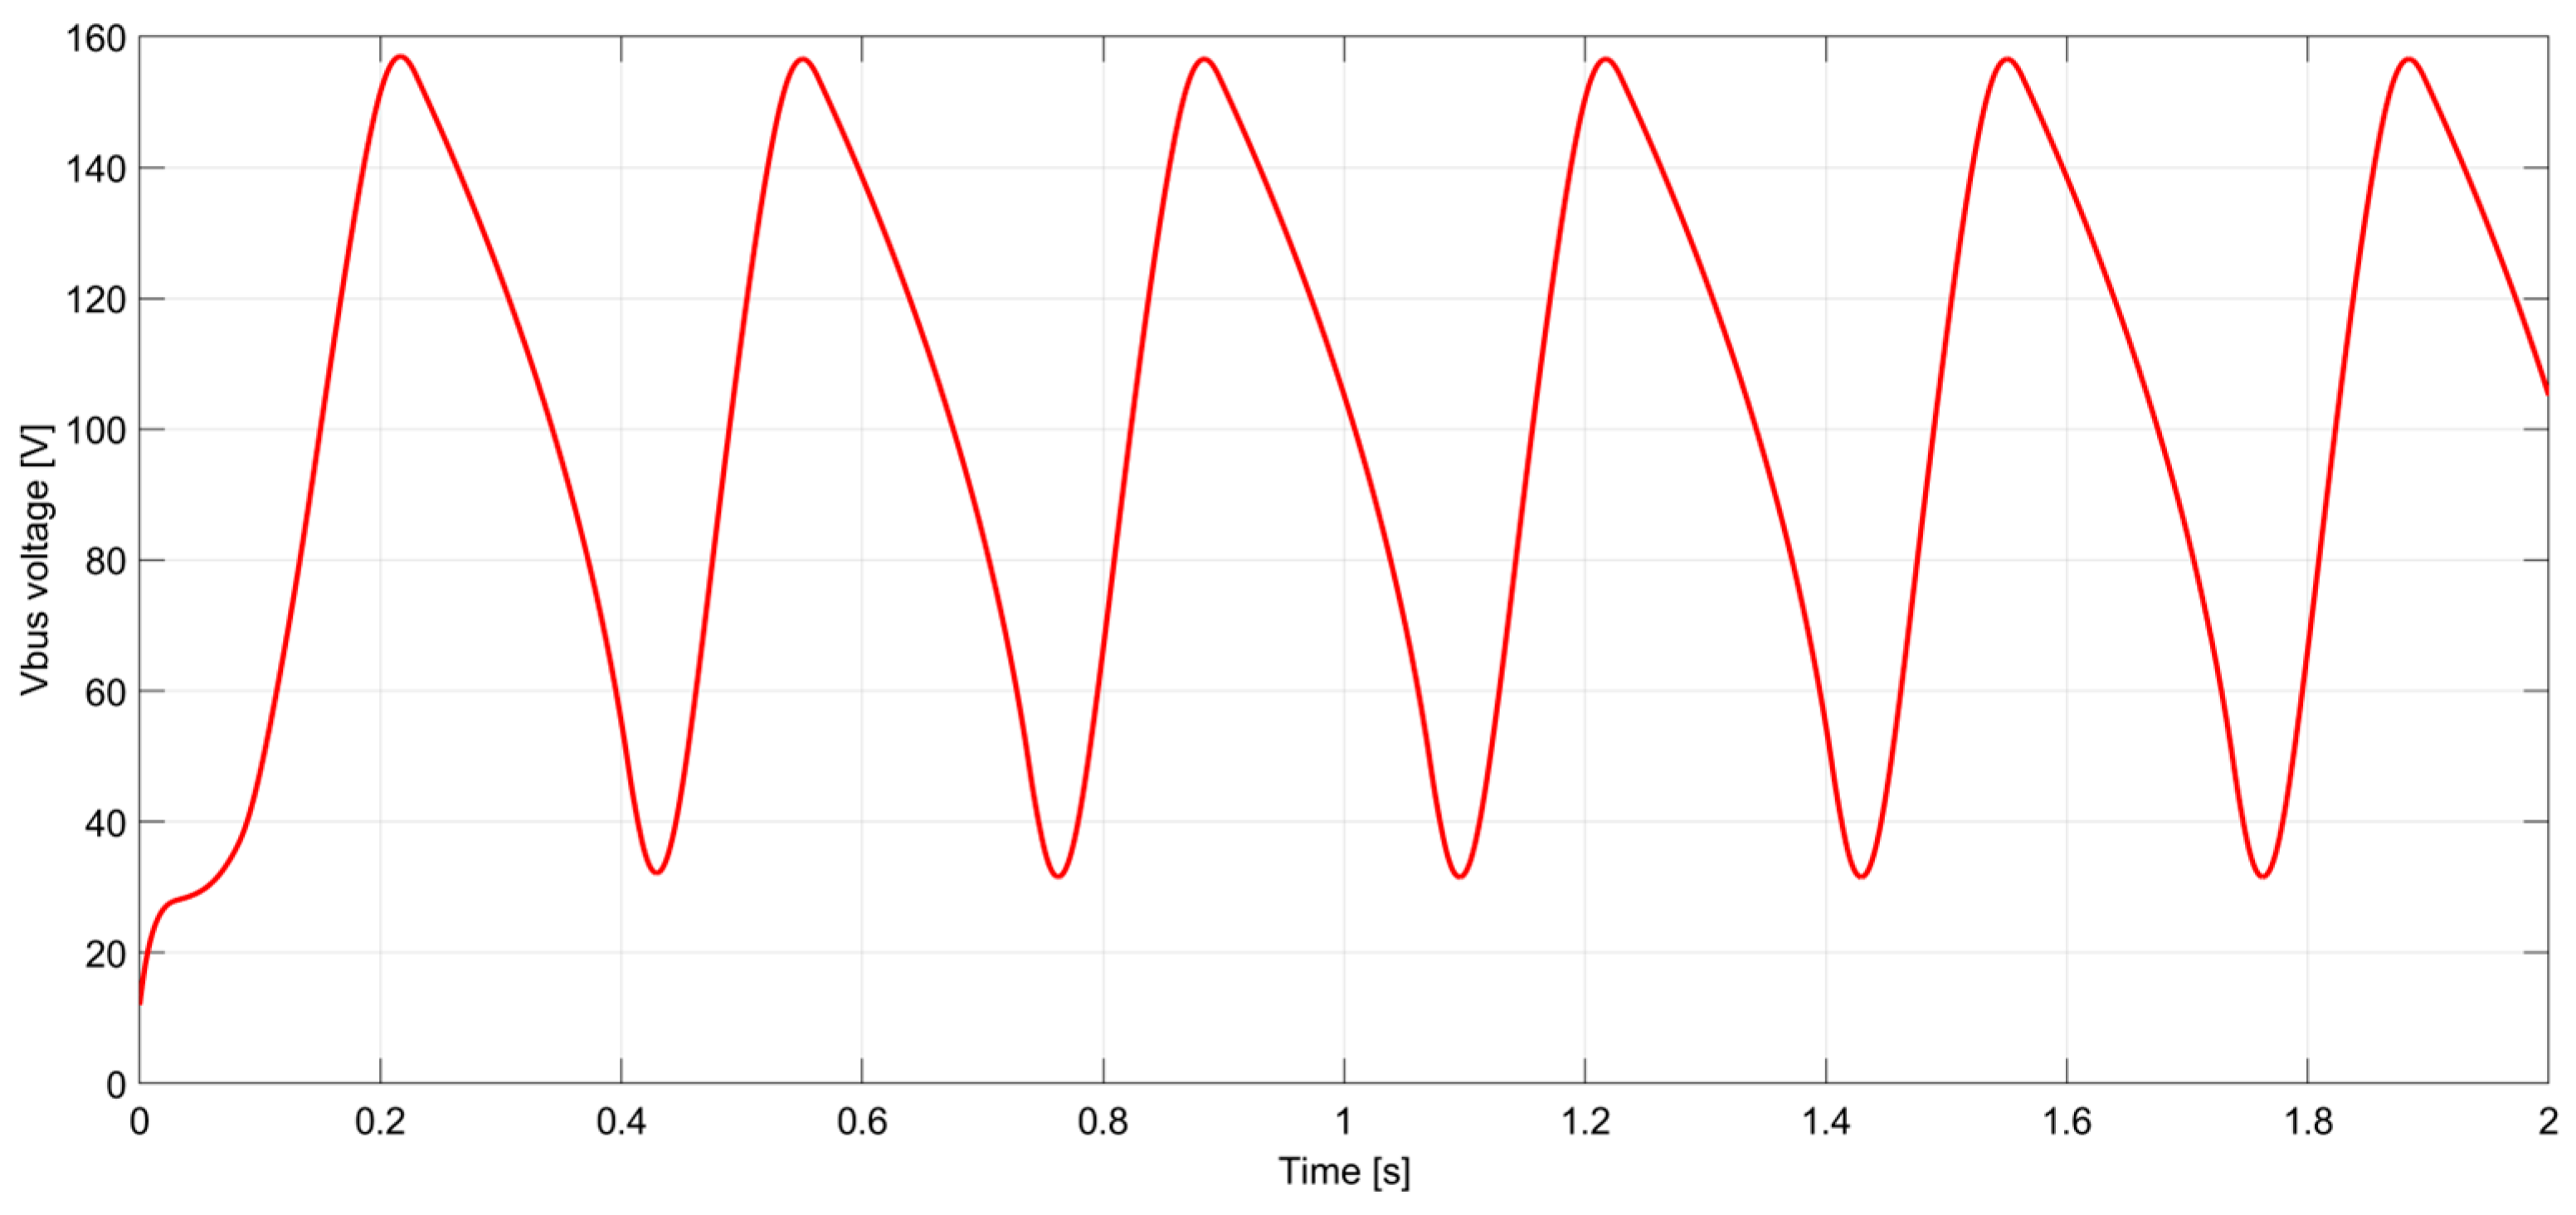
Despite the three-phase structure of the generator, the output voltage of the rectifier exhibits pronounced oscillatory behavior. This irregularity arises from the inherent variability of the wave-induced motion, which prevents the voltages from maintaining a constant amplitude or frequency. Therefore, the resulting electrical signal is highly fluctuating and cannot be directly employed to supply an electrolyzer that requires a well-regulated direct current (DC) voltage, since its efficiency and durability strongly depend on the stability of the electrical input. Operating with an unstable or pulsating voltage would not only decrease the hydrogen production rate but could also accelerate the degradation of the electrochemical components. For this reason, an additional stage is mandatory. In particular, the integration of a DC-DC buck–boost converter becomes essential. Such a converter is capable of regulating the voltage by either stepping it down or boosting it up, depending on the instantaneous conditions, and delivering a stable and continuous output. This ensures that the harvested energy can be effectively converted into hydrogen without compromising system performance.
As stated before, the buck–boost converter can provide an output voltage that can be either higher or lower than the input voltage, depending on the duty cycle of the switching signal. Its operation is based on the controlled storage and release of energy in an inductor. When the power switch is on, the inductor stores energy from the input source, while the output is supplied by the output capacitor. When the power switch is off, the inductor releases the stored energy to the load, reversing the polarity relative to the input. As a result, the output voltage is inverted with respect to the input voltage. The ideal input-output relationship is expressed as
where
D is the duty cycle, defined as the ratio between the switch-on time and the total switching period,
Vbus is the input voltage and
Vout is the output voltage.
For duty cycles smaller than 0.5, the magnitude of the output voltage is lower than the input (buck mode), while for duty cycles larger than 0.5, the output magnitude exceeds the input (boost mode). This makes the buck–boost converter particularly suitable in applications where the input voltage is highly variable, but the load requires a regulated DC voltage.
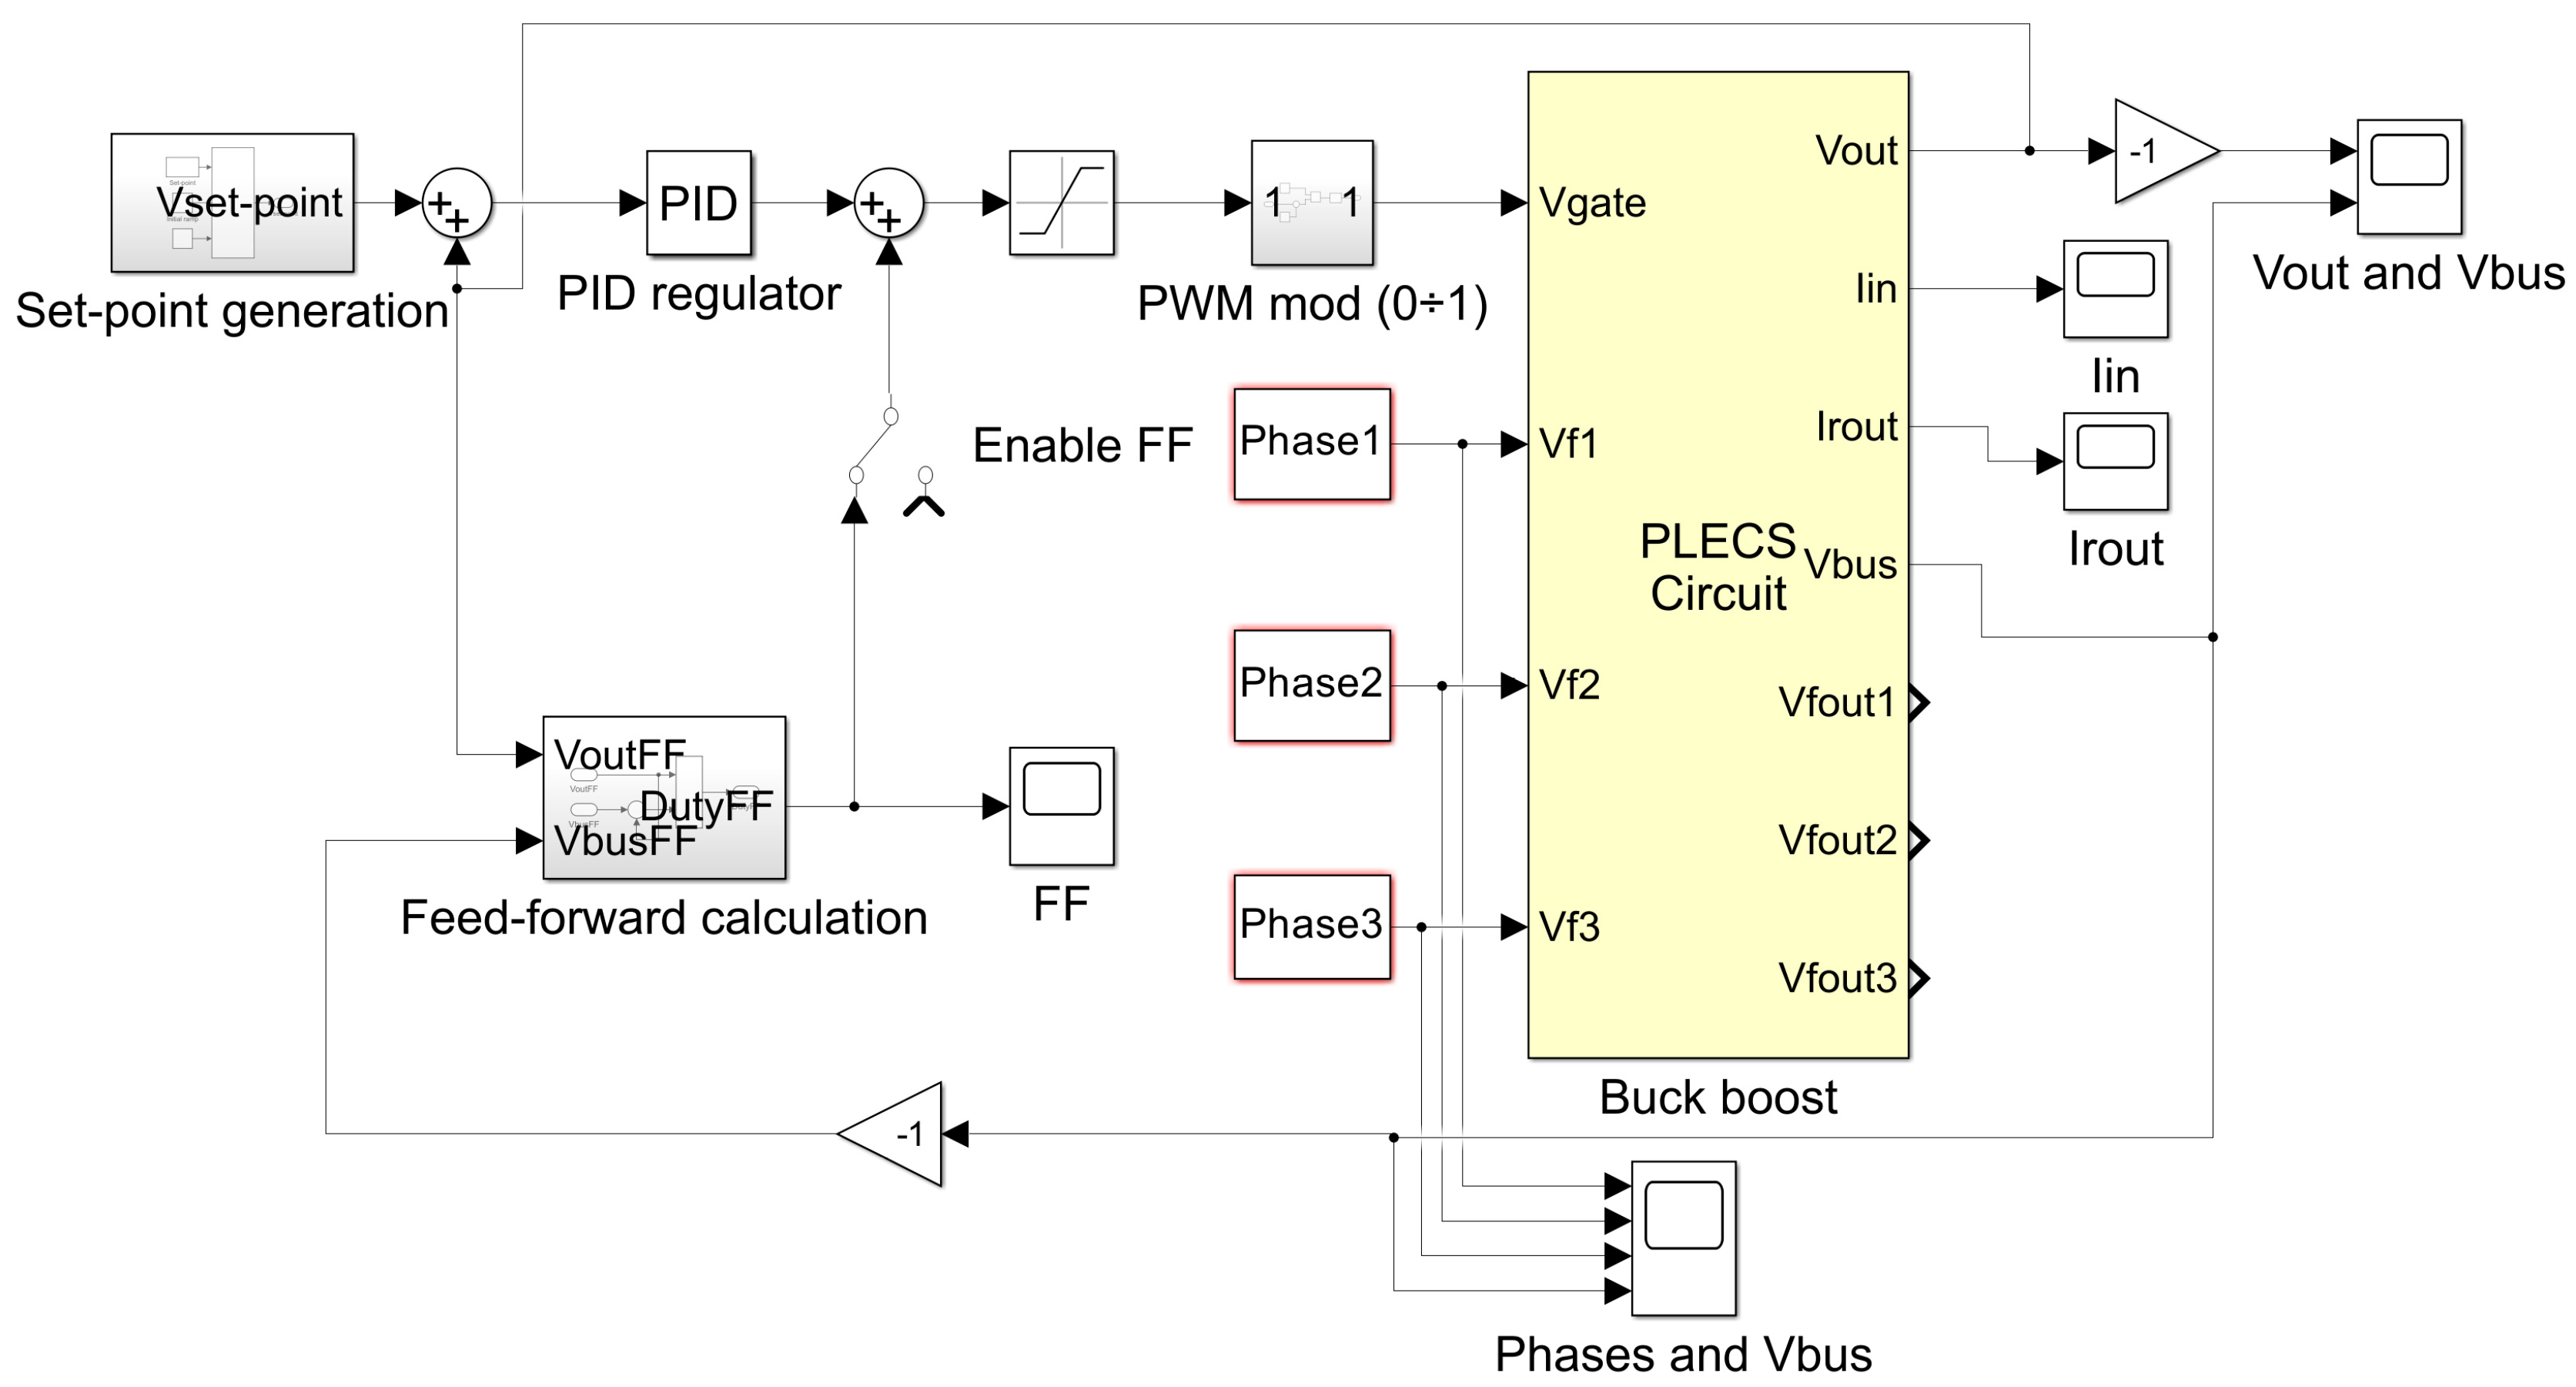
The control of the buck–boost converter has been simulated using MATLAB/Simulink, and PLECS blockset. The control scheme is depicted in
Figure 11.
The set-point is the DC voltage required by the hydrolizer (15 V), while the task of the PID regulator is to keep the output fixed at that value regardless of the value of the input voltage, by acting on the duty cycle
D. With reference to
Figure 11, the values of the parameters used in the simulation are summarized in
Table 3.
As written before, reliability has been considered since the initial stages of this project. Knowing that among the components with the lowest mean time to failure (MTTF) are electrolytic capacitors, or in any case, capacitors that operate with higher-frequency AC components, once the capacitors were selected, an analysis was carried out following the procedure in [
52]. Regarding the input capacitor, there are no heating problems due to the sufficiently small equivalent series resistor (ESR) and the lower thermal resistance (larger exchange surface with the external environment). On the contrary, the output capacitor is smaller both in terms of its capacity (56 μF, compared to the 330 μF of the input capacitor) and the maximum voltage that can be applied. Then, the typical ESR values for the output capacitor range between 0.5 and 2 Ω. Considering that the effective value of the current in the output capacitor is of the order of 0.9 A, it is advisable to use low-ESR electrolytic capacitors. A suitable choice may be the Rubycon YXS series capacitors, for which the ESR indicated in
Table 3 can be evaluated. Thus, the power dissipated in this device is approximately 0.45 W at room temperature. As it heats up, the ESR drops to values that further reduce the power dissipation to non-critical levels.
To improve the dynamic performance of the control, a feed-forward block has been designed. In fact, the combination of a PID controller with a feed-forward action offers significant performance advantages in dynamic systems. A conventional PID controller regulates the process by reacting to the error between the reference signal and the measured output. While this approach ensures stability and robustness, it often results in slower responses, especially when the system is subject to large disturbances, as in our conditions, since input voltage variation can be seen as control disturbance. By adding a feed-forward term, the controller can anticipate the effect of known signals and compensate for them before they impact the system output.
This proactive action reduces the burden on the PID feedback loop, leading to faster transient responses and smaller overshoot. Moreover, it minimizes steady-state error and enhances disturbance rejection, since the controller does not rely solely on reactive correction. In practice, the feed-forward contribution improves the overall efficiency of the control system, reduces oscillations, and allows the PID gains to be tuned less aggressively, which can enhance stability margins. As a result, PID control with feed-forward is particularly beneficial in systems with predictable disturbances or highly variable operating conditions, where both precision and responsiveness are critical.
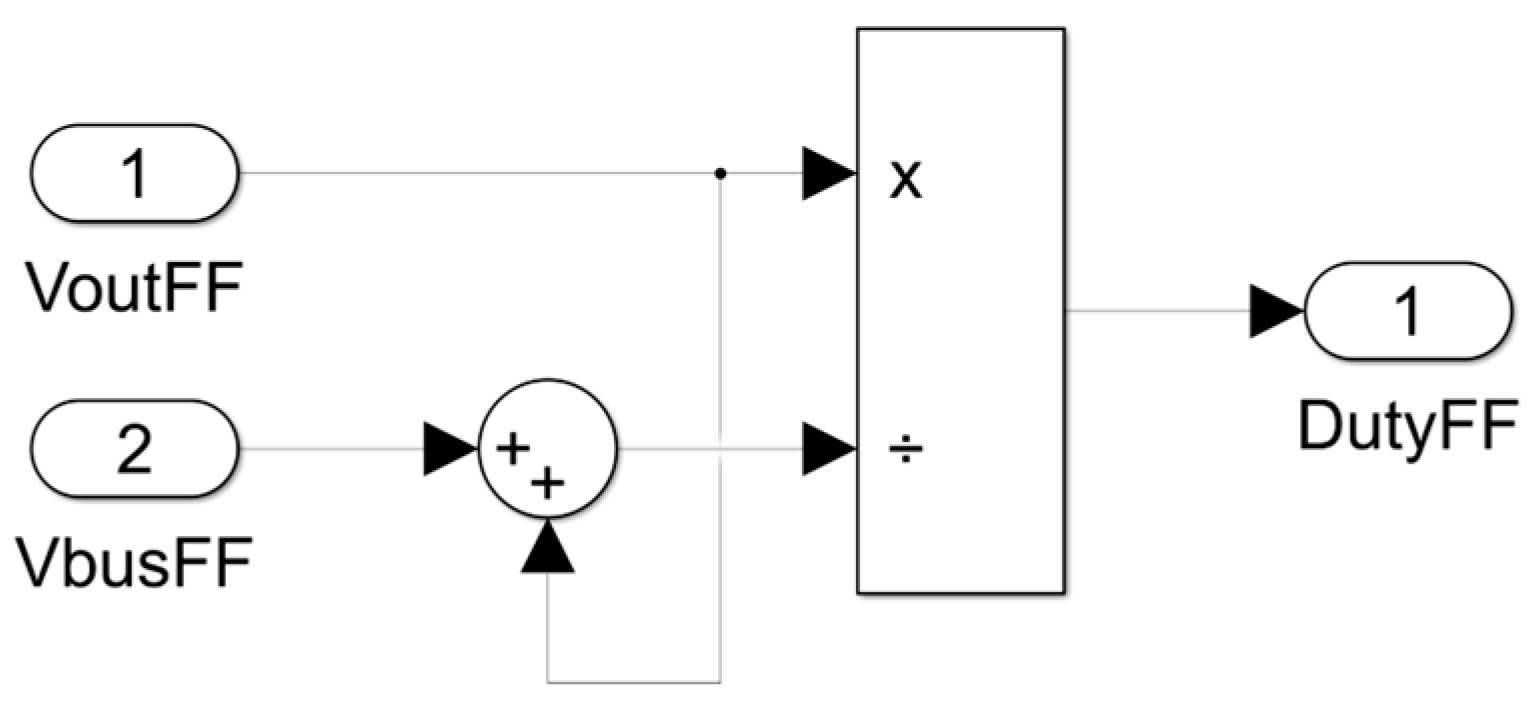
The proposed feed-forward block has been designed starting from the inverse formula of (1), which allows to calculate the duty cycle
D when
Vbus and
Vout are known:
The block that implements the feed-forward correction that must be added to the output of the PID regulator is shown in
Figure 12.
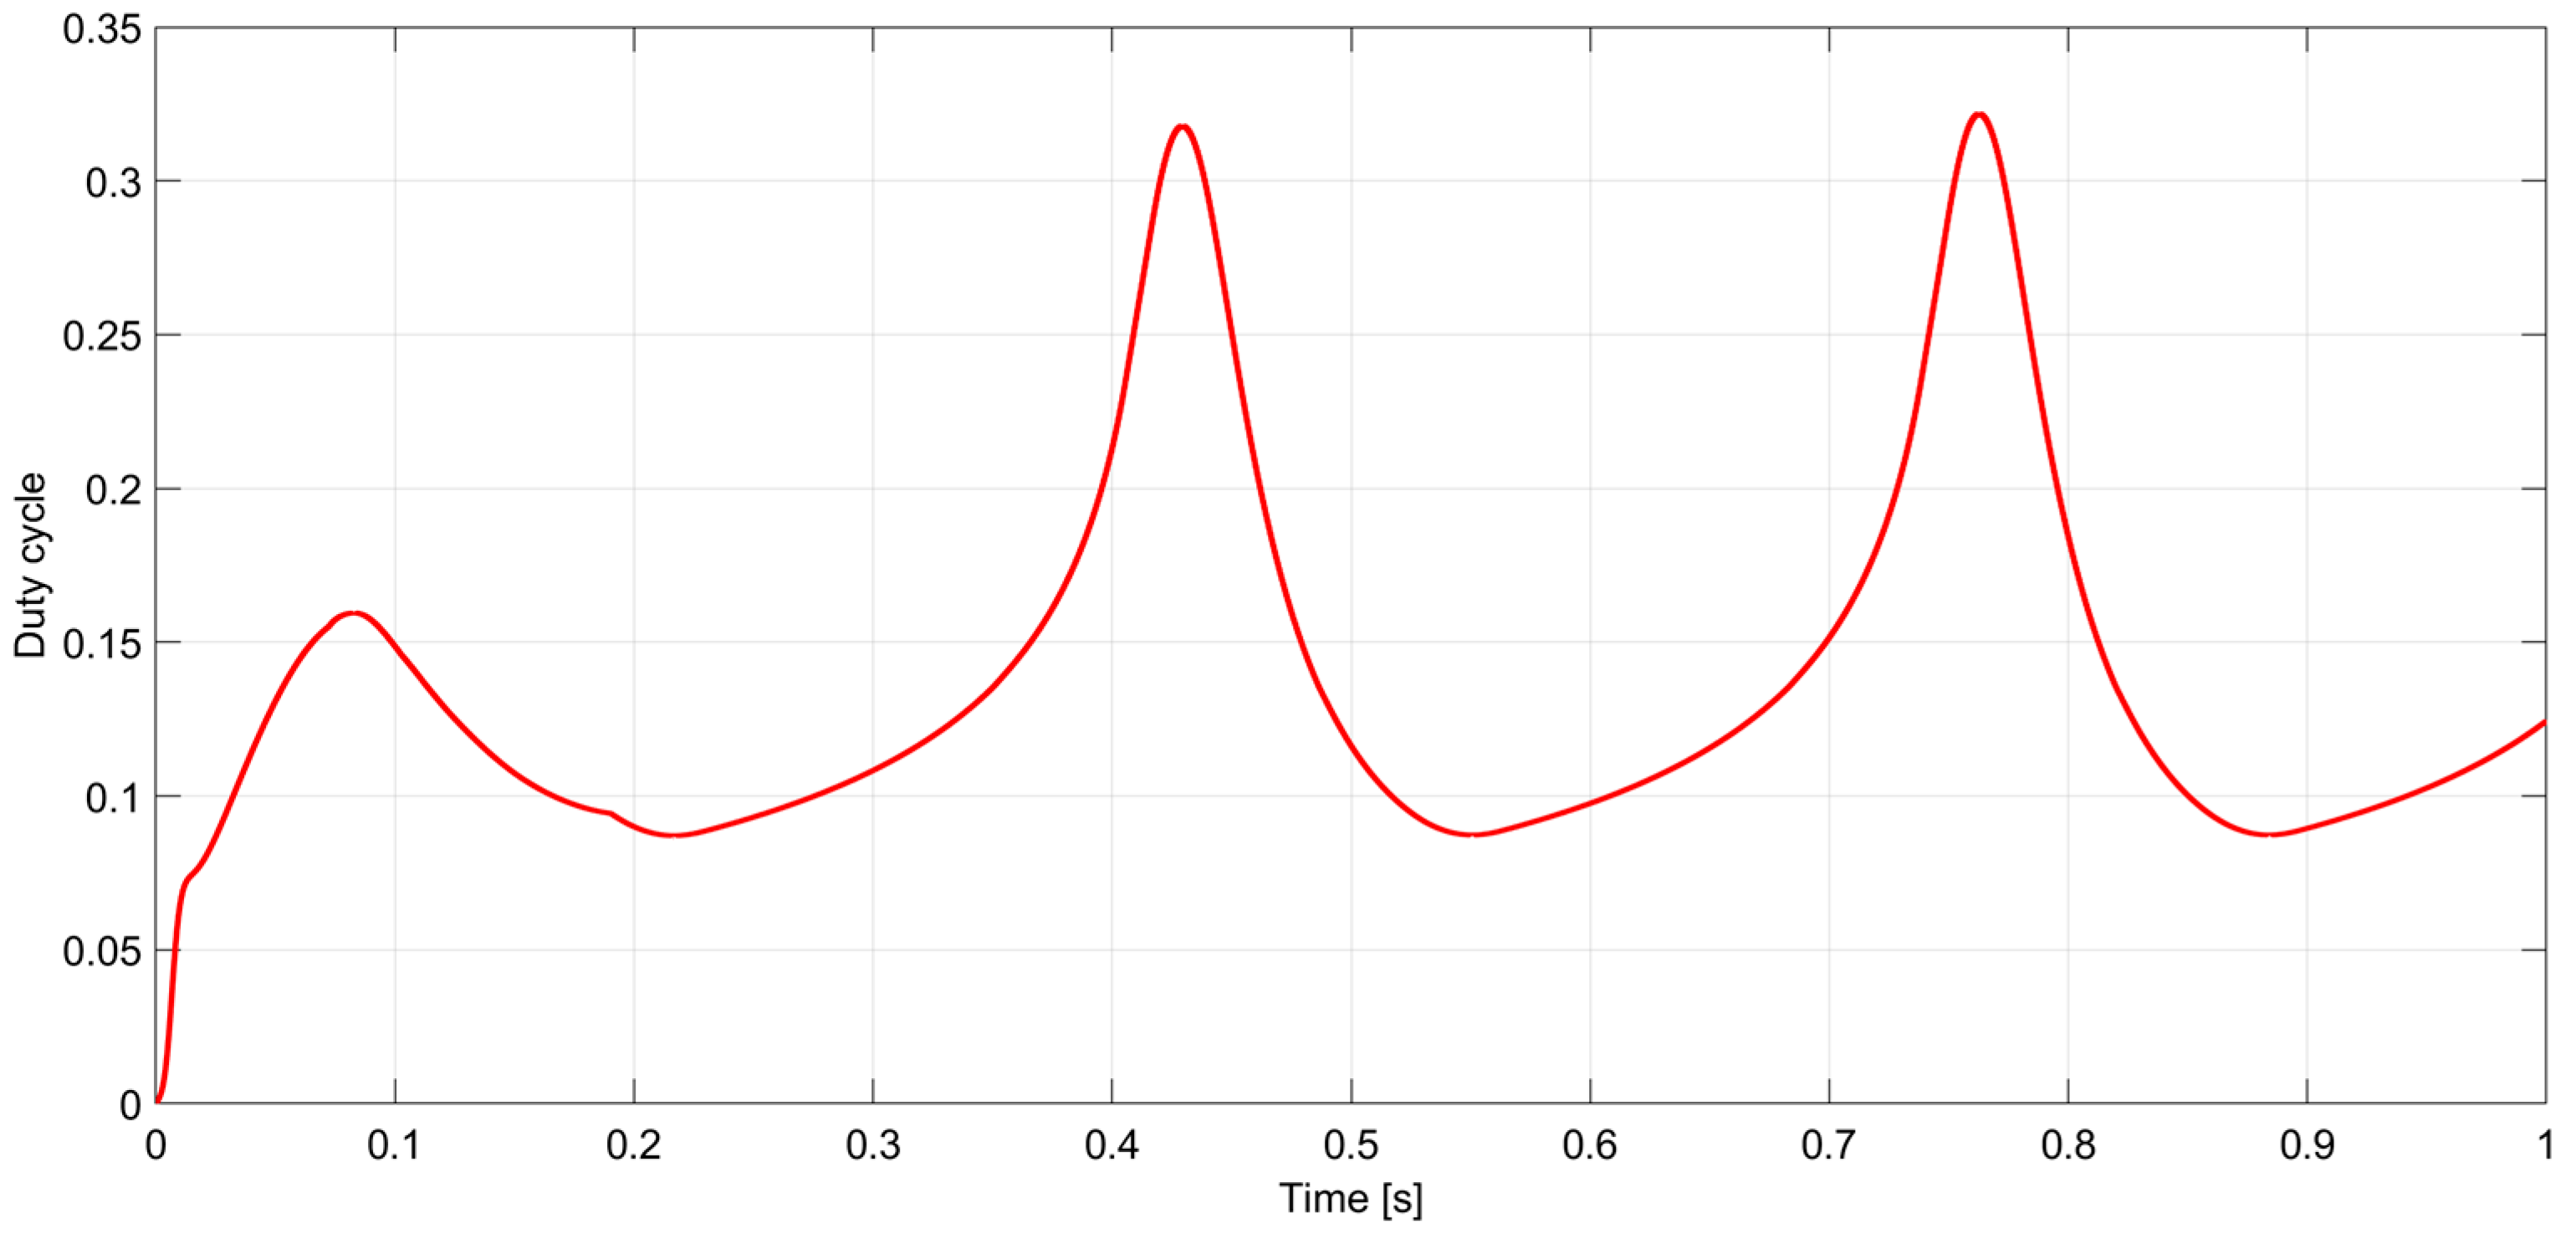
Given the buck–boost input voltage obtained by the simulation of the rectifier stage, the duty cycle computed using Equation (2) is shown in
Figure 13. The plot shows significant variation in the duty cycle as the input voltage varies. Since, in the proposed case, the input voltage is always higher than the output voltage, the buck–boost converter always works as a buck, and the duty cycle is always less than 0.5.
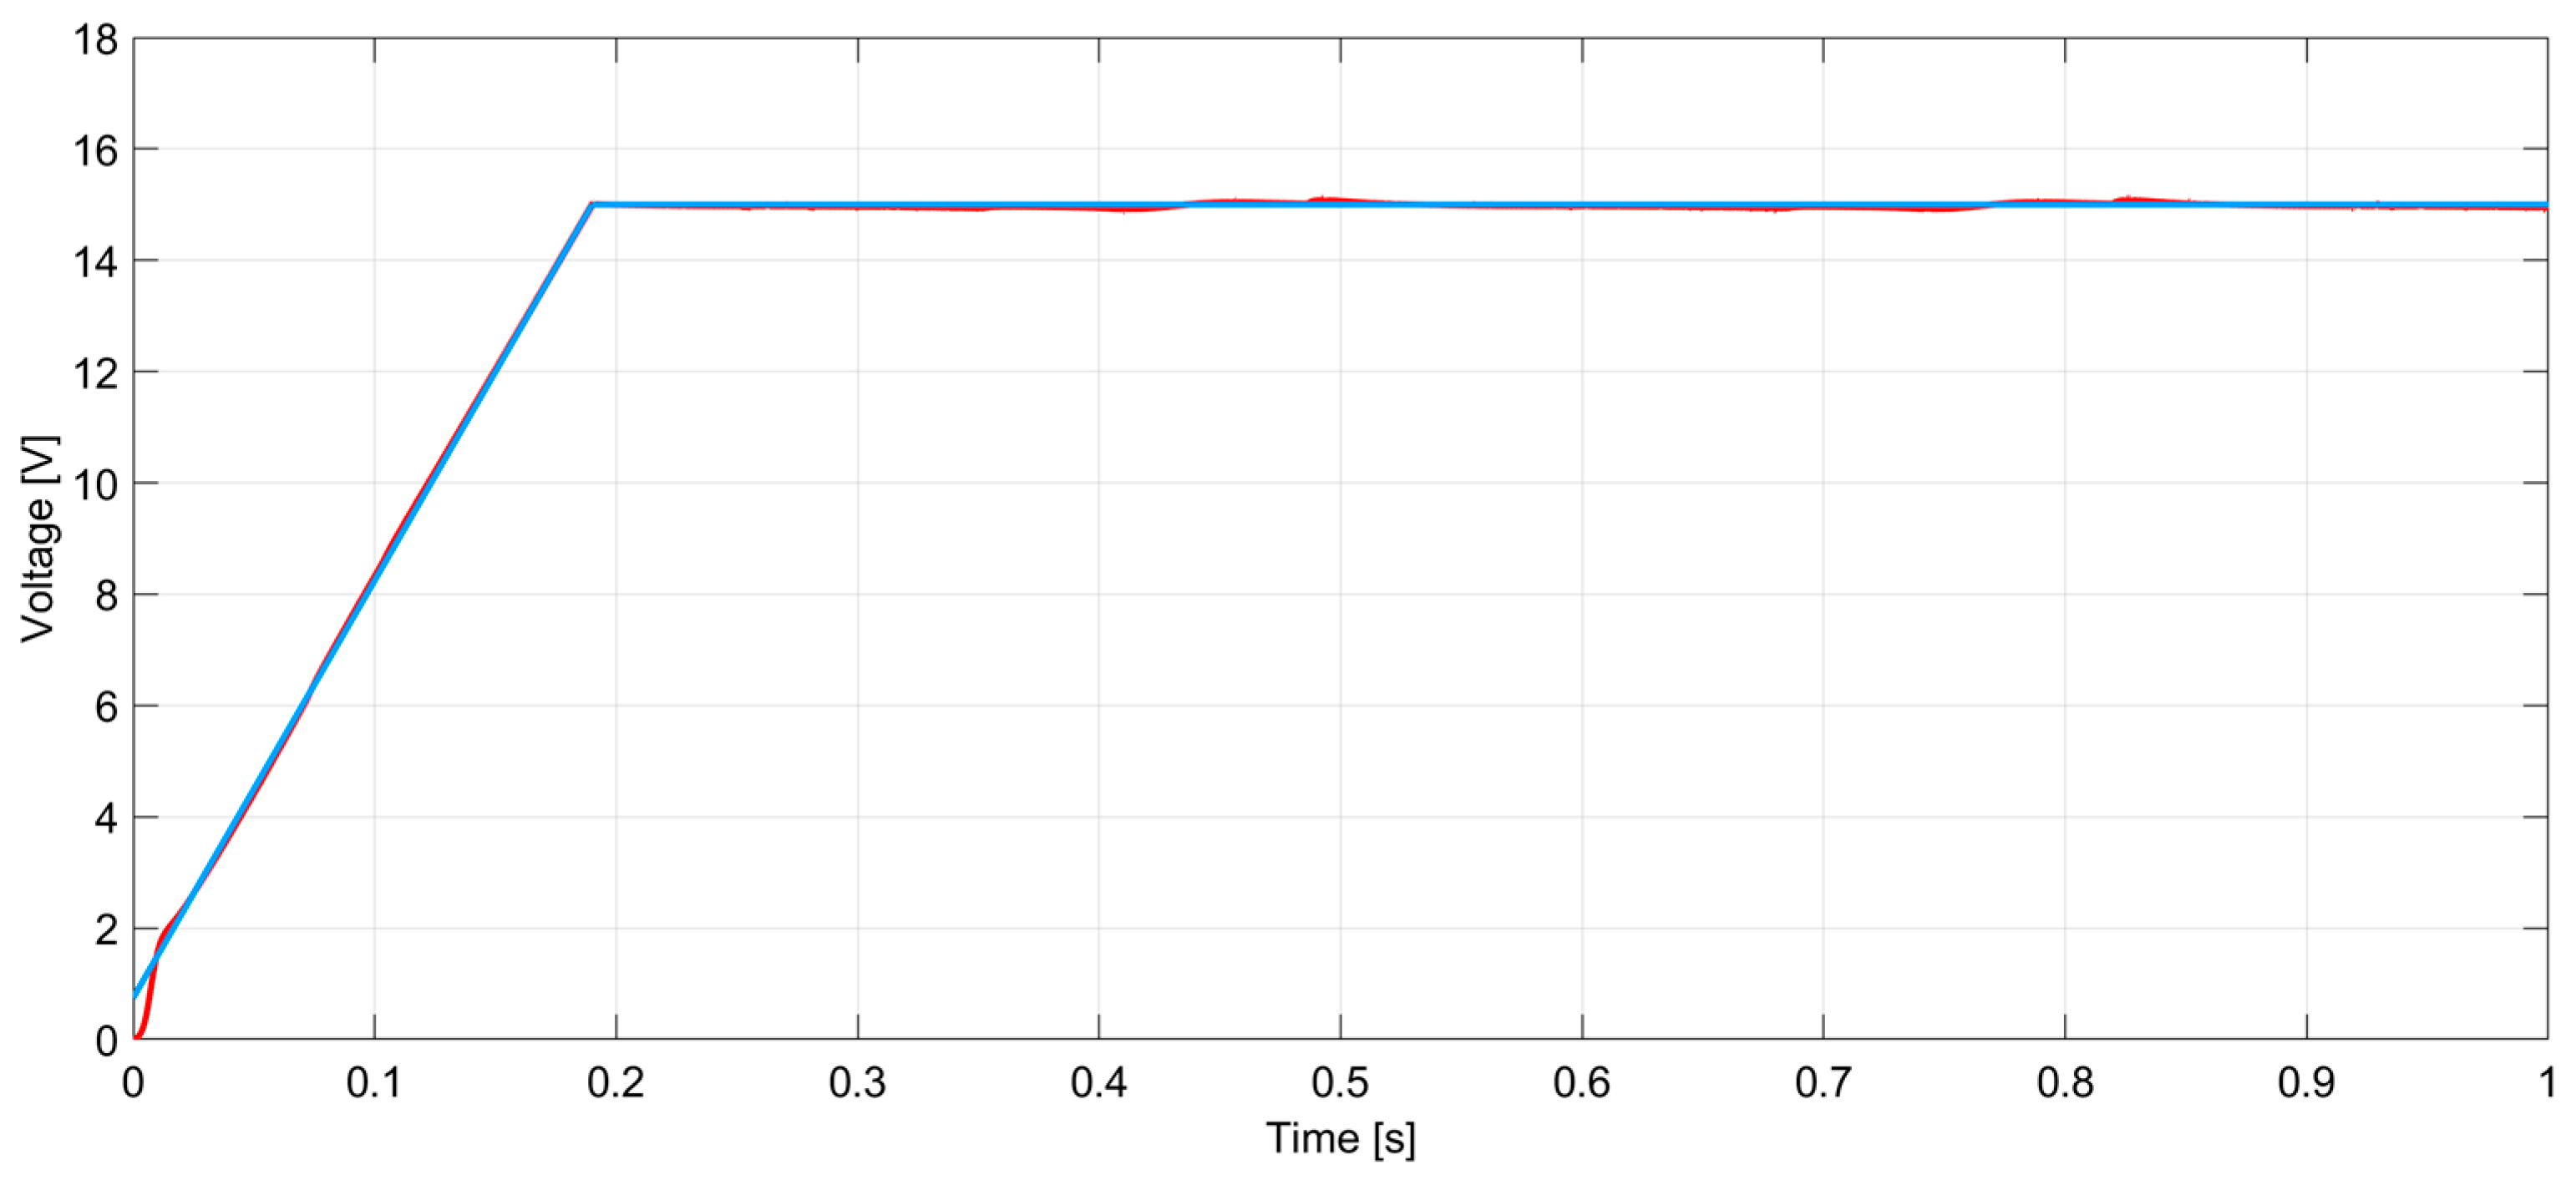
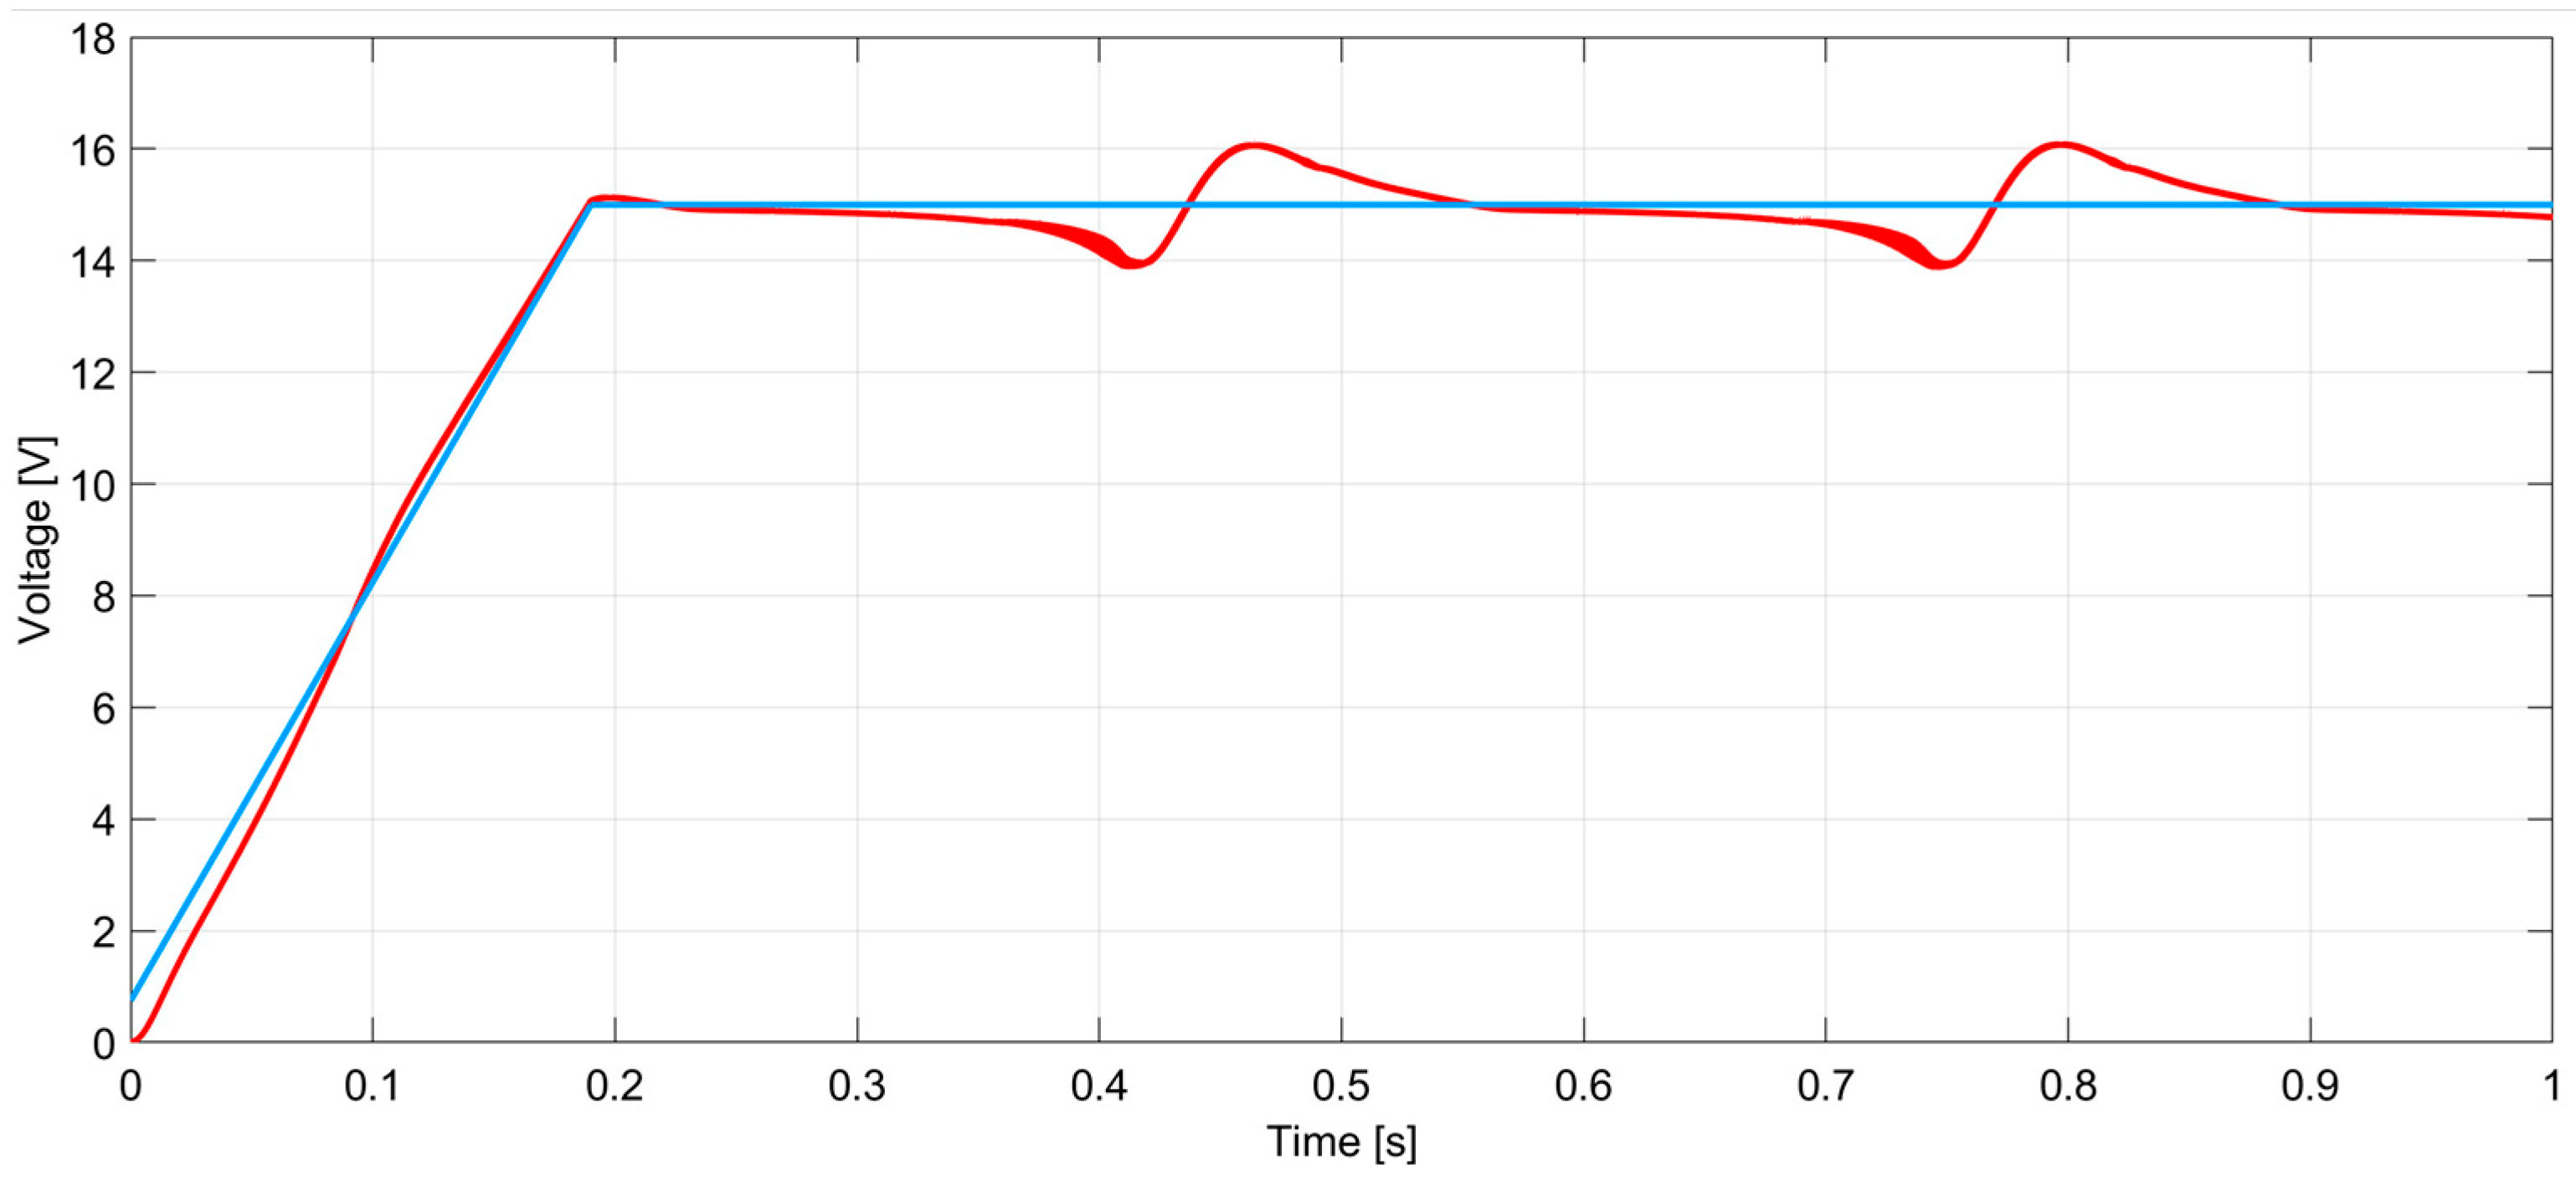
Since the input and output capacitors need to be charged at turn-on, to avoid drawing too much current from the windings at the start-up phase, the voltage set-point presents a ramp that lasts approximately 200 ms.
Figure 14 and
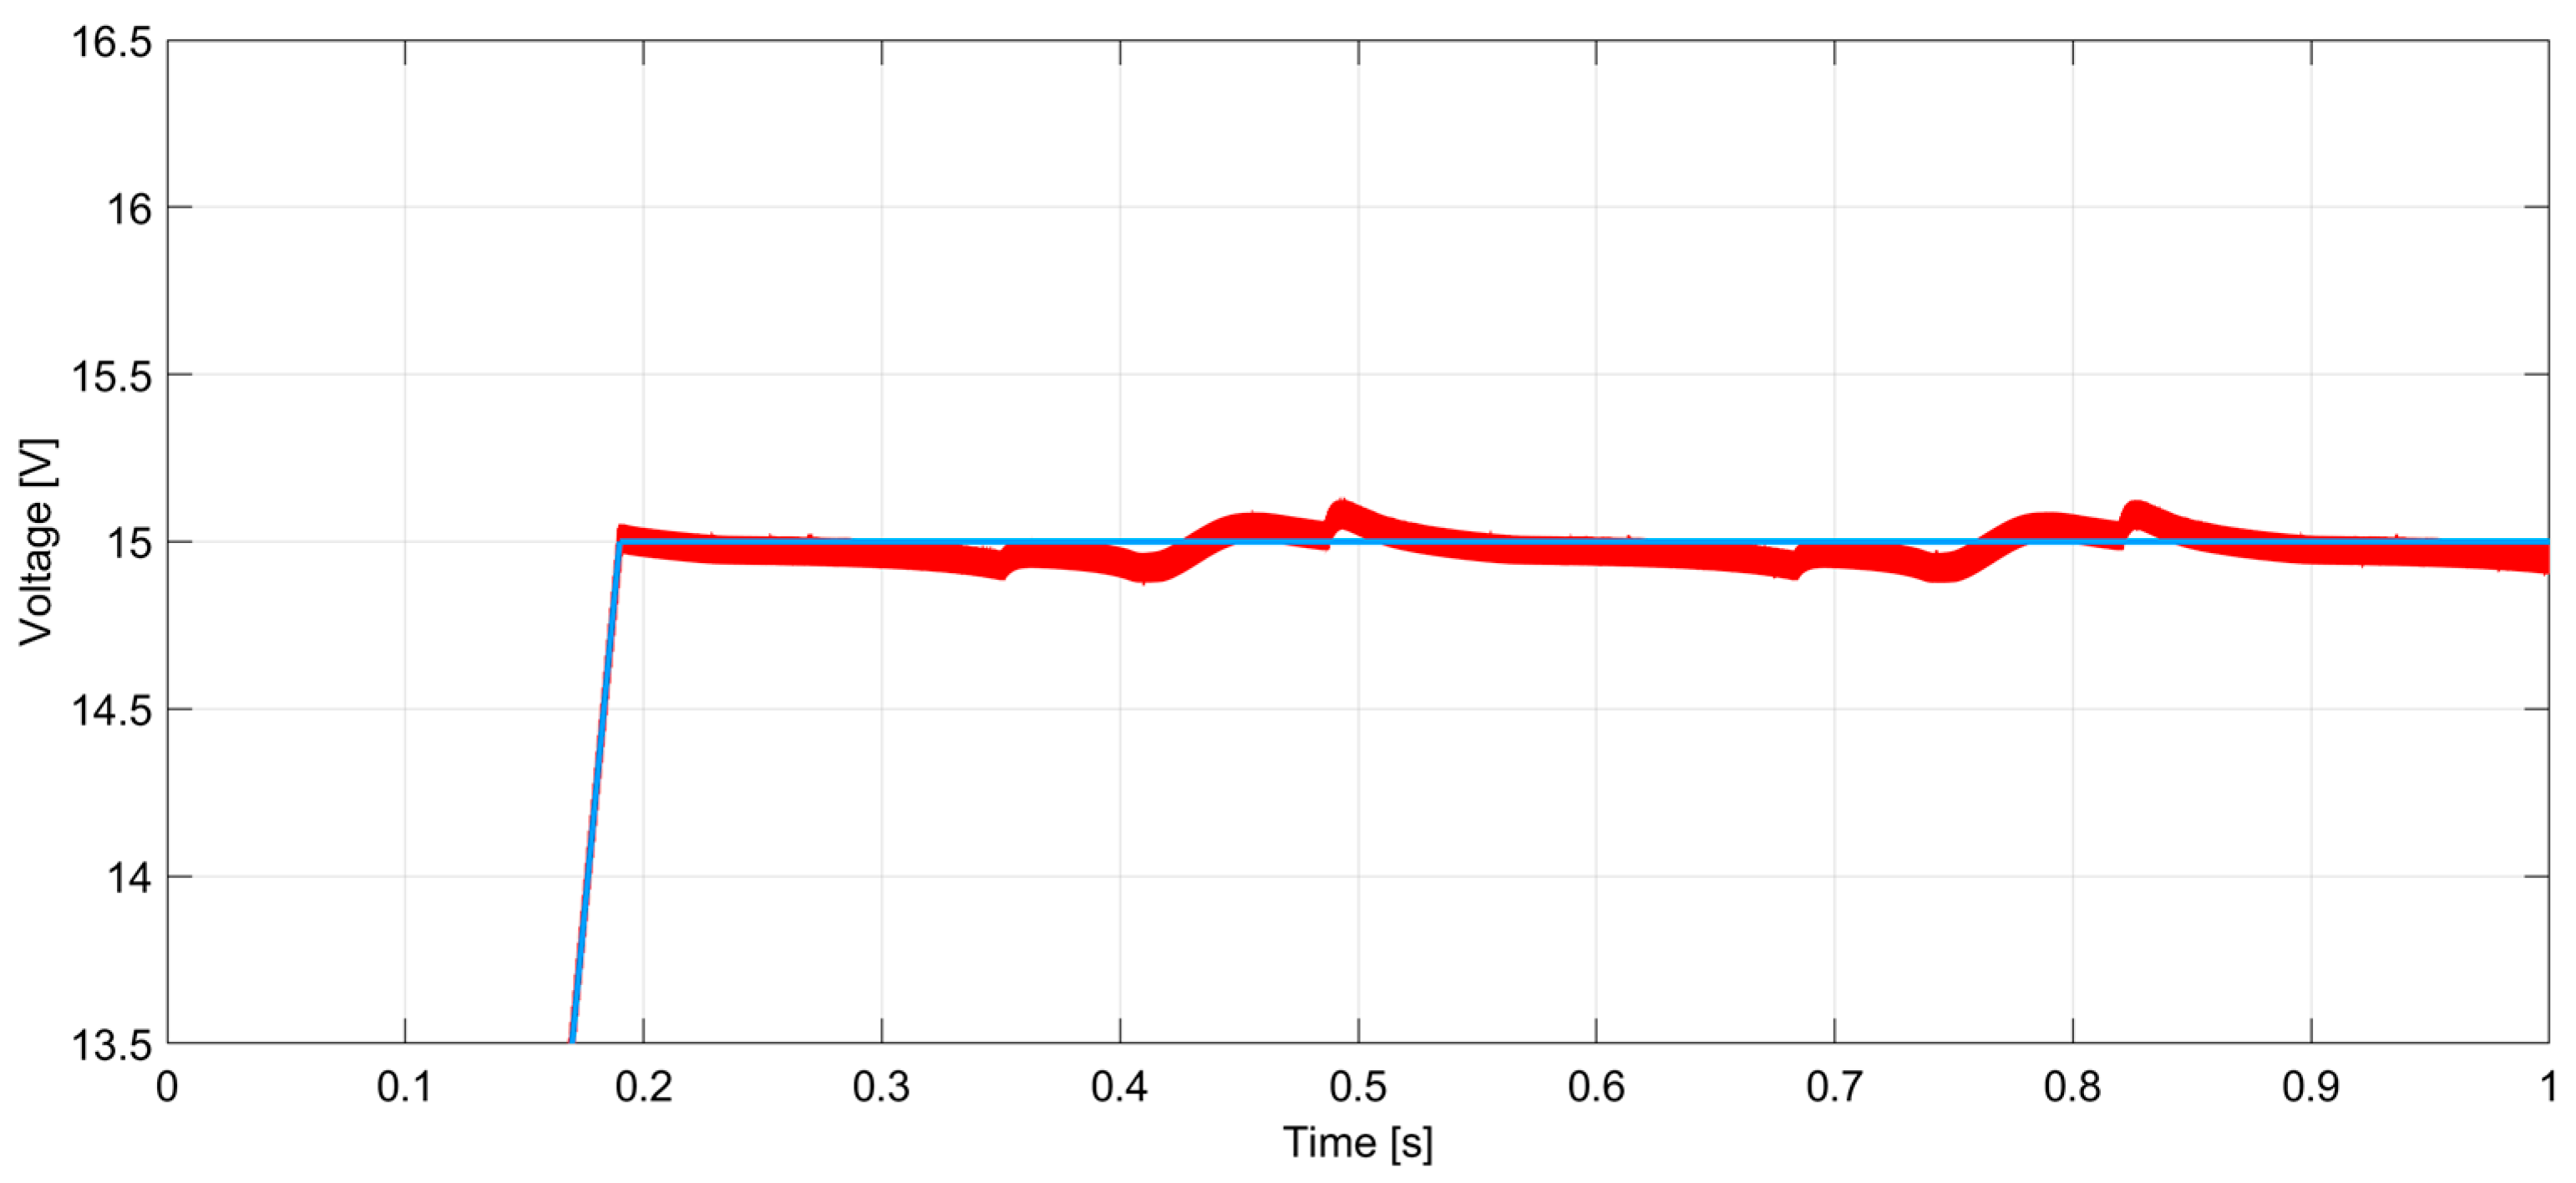
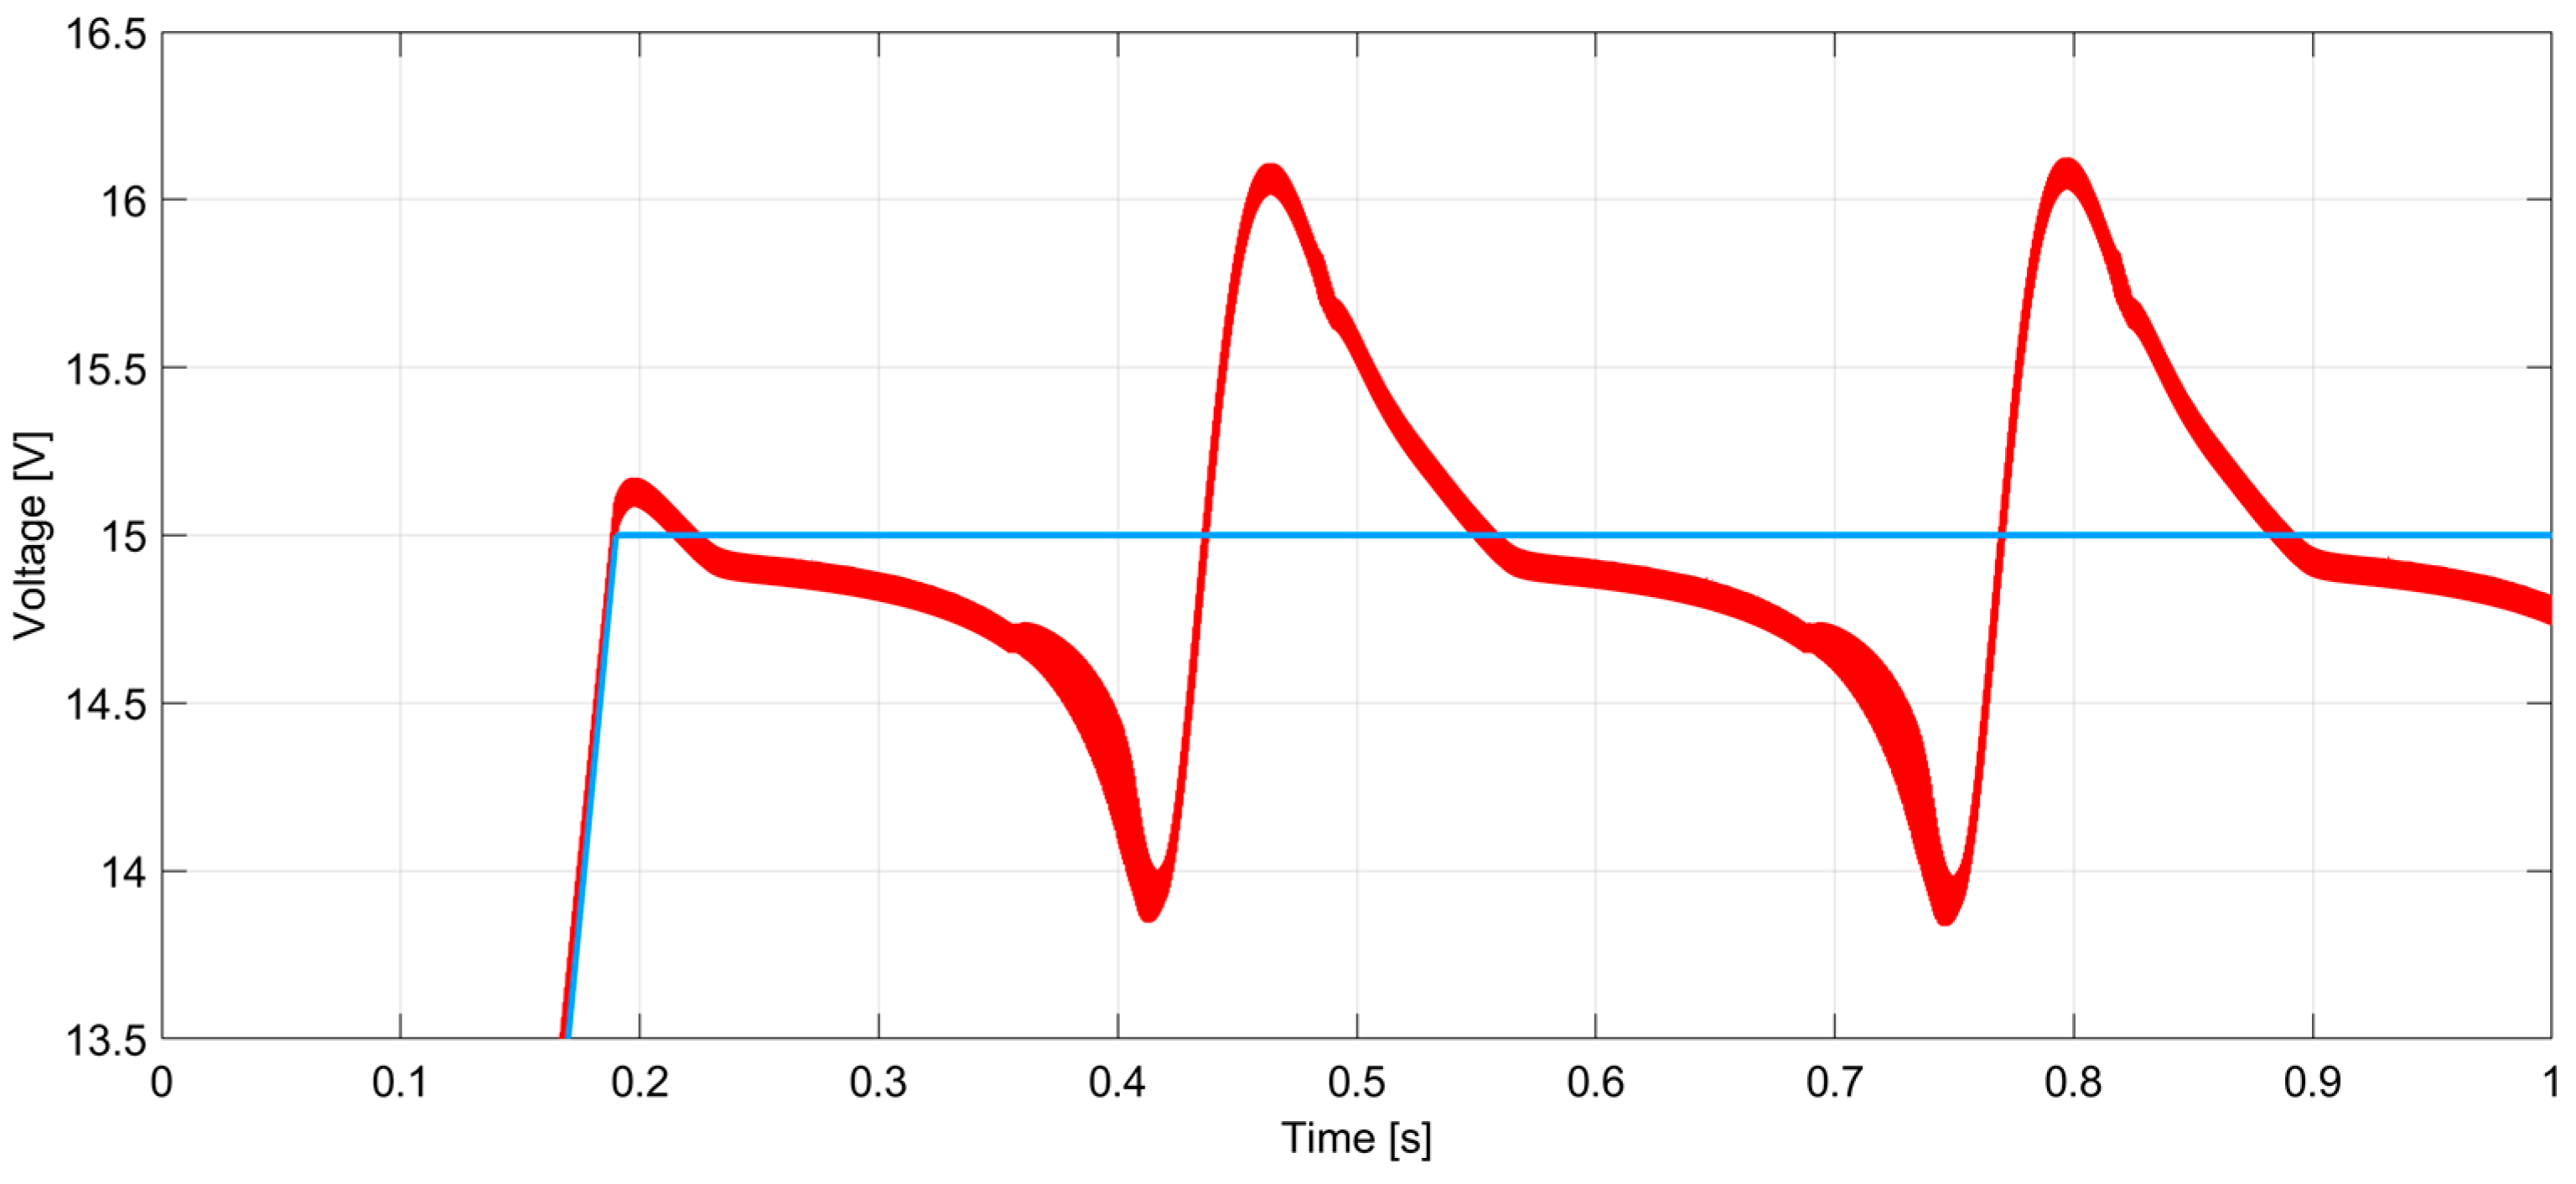
Figure 15 show the response to the set-point with and without feed-forward corrective action, respectively. As expected, the response obtained with feed-forward compensation performs better in terms of input disturbance rejection, as can be seen from
Figure 16 and
Figure 17.
5.2. Simulation Under Irregular Wave Conditions
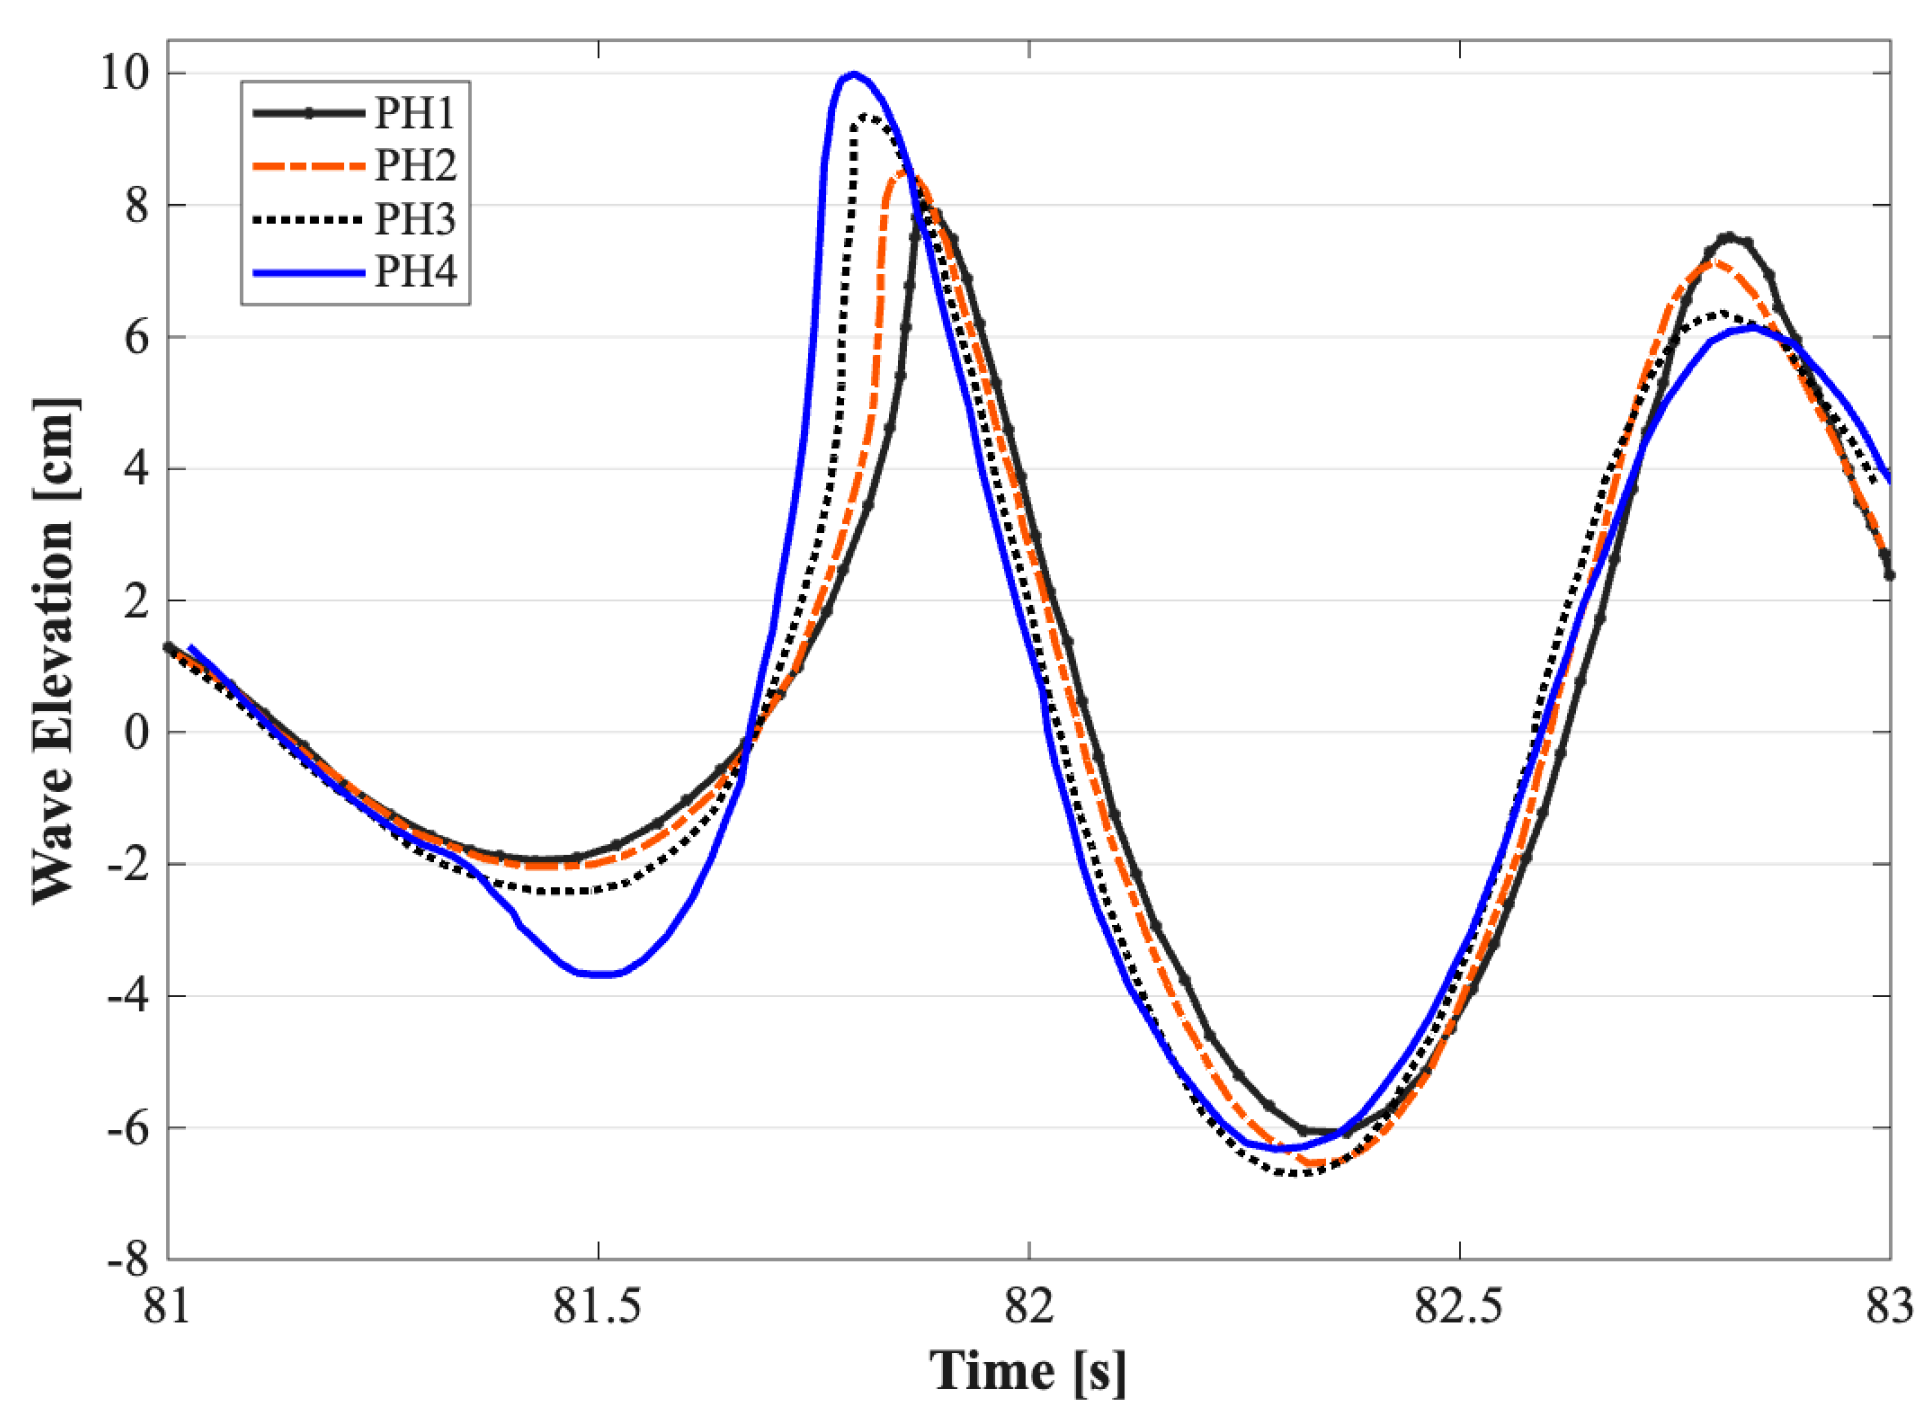
Although the analysis presented above has been focused on regular, nearly sinusoidal wave conditions, such an idealization does not represent real sea environments. In real conditions, wave motion is inherently irregular and results from the superposition of multiple wave components with different frequencies, amplitudes, and random phases. Incorporating irregular waves is therefore essential to accurately evaluate the performance, efficiency, and reliability of the proposed harvesting systems under irregular wave conditions. These irregular wave conditions were obtained by processing the data from the time series of
Figure 18, collected by H.J. Choi et al. [
53] with artificial waves in a 2-D wave tank. They were chosen because they exhibit peak-to-peak oscillations of just under twenty centimeters, which is similar to the regular sinusoidal wave with an amplitude of 10 cm and a frequency of 1 Hz, which resulted in the generation of the three voltages in
Figure 8. The processing of the four original data series has been carried out to obtain a single longer time series.
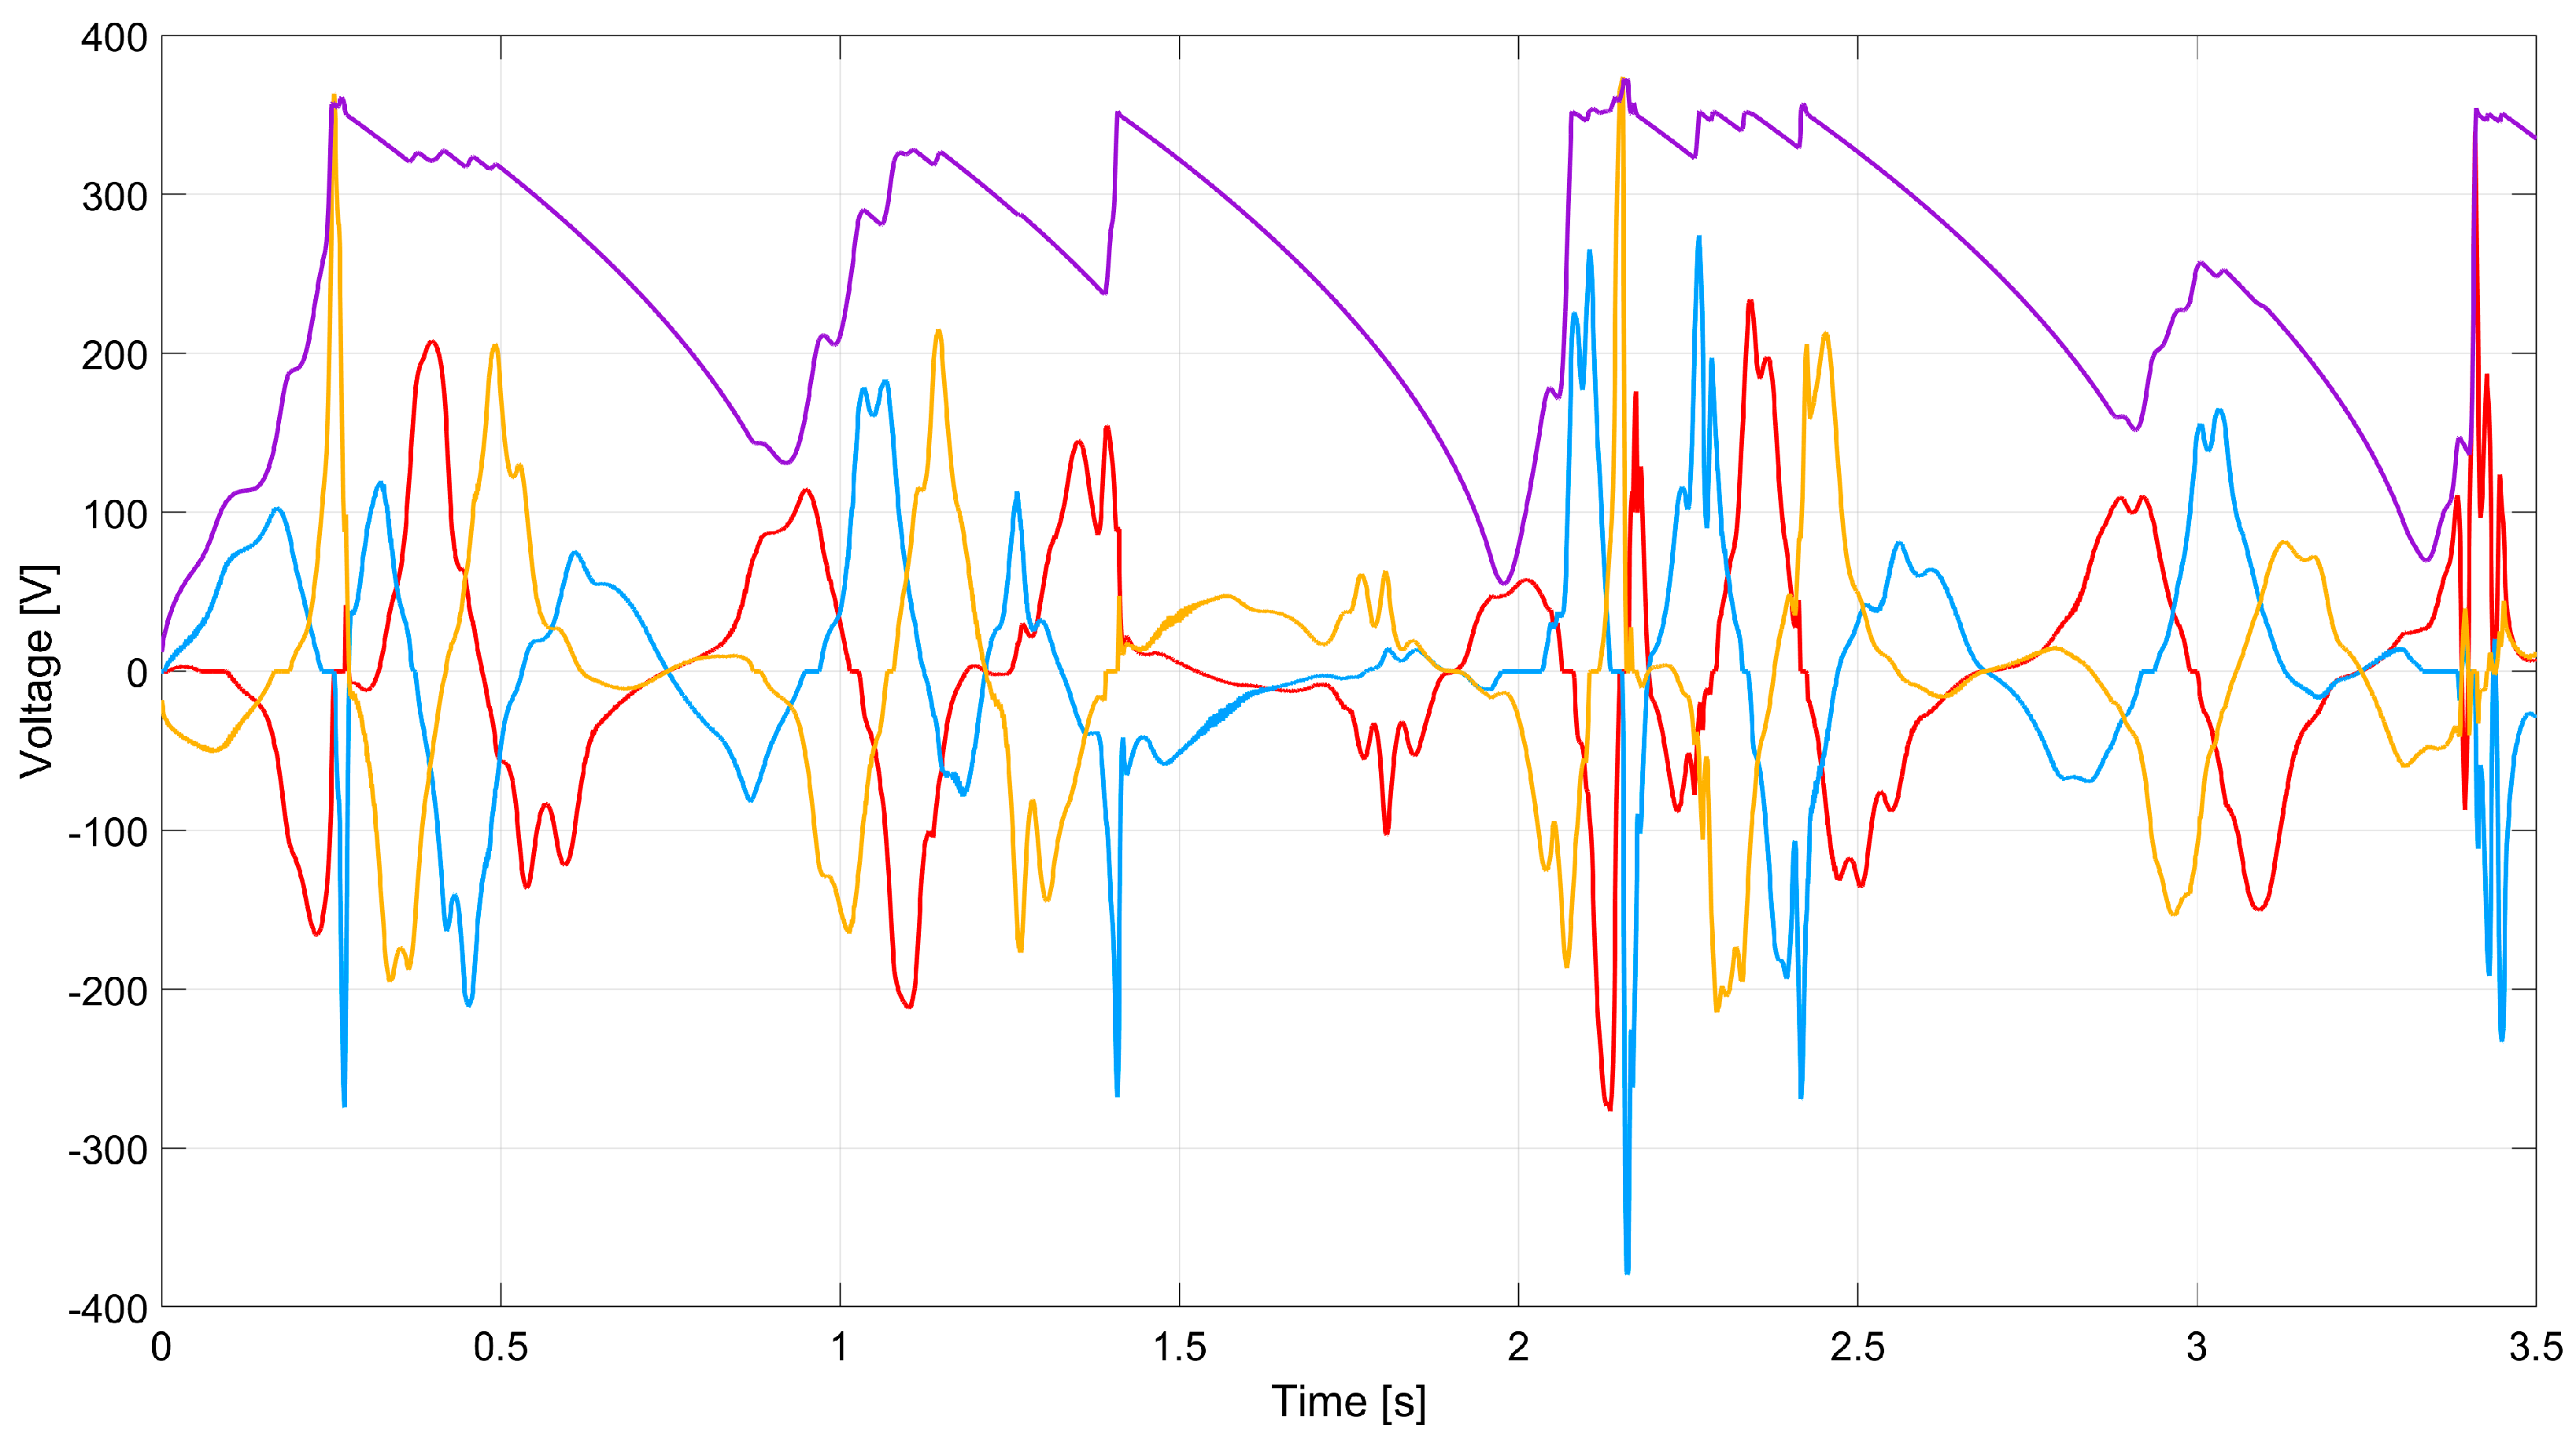
The voltages produced by the linear generator under these conditions are shown in
Figure 19, together with the output voltage obtained from the rectifier stage of the AC/DC converter. As can be seen, the DC bus voltage, despite the smoothing capacitor, is highly variable over time. For this reason, the control behavior of the buck–boost DC/DC converter is particularly important.
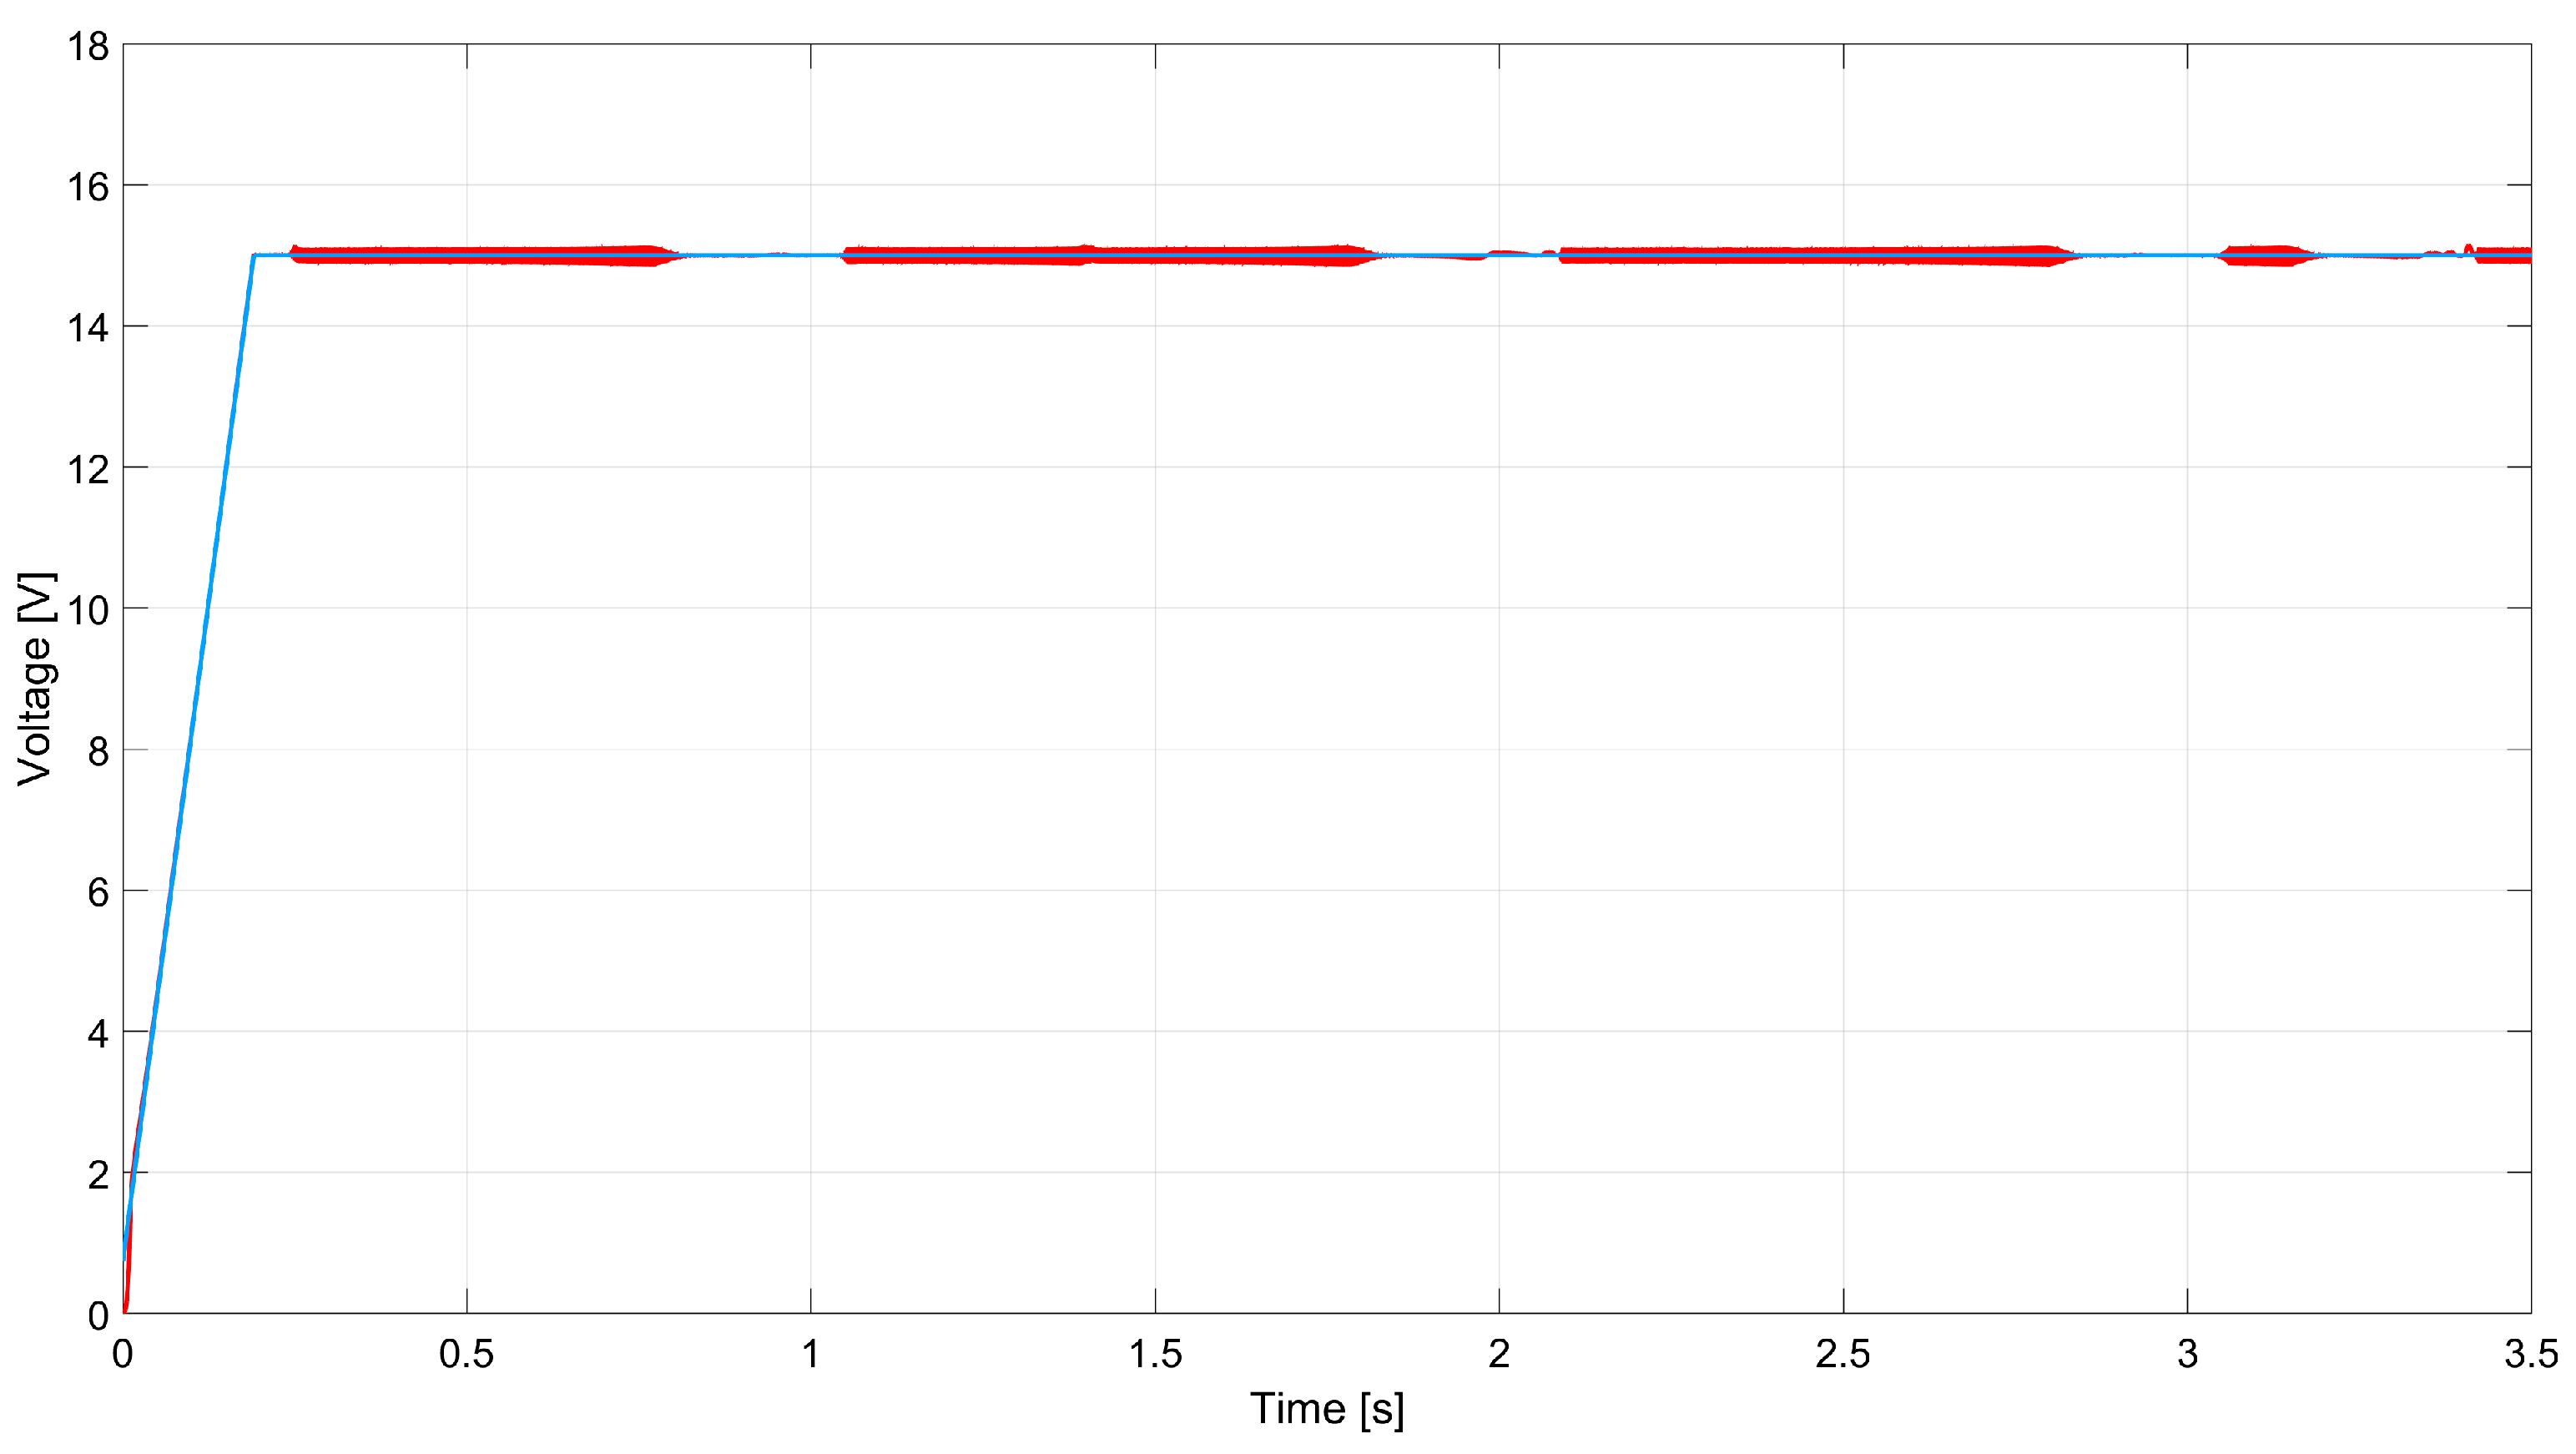
As can be seen from
Figure 20, the proposed converter, thanks to the feed-forward corrective action, is able to maintain a stable output voltage even in case of large and rapid variations in the input voltage such as those shown in
Figure 19.
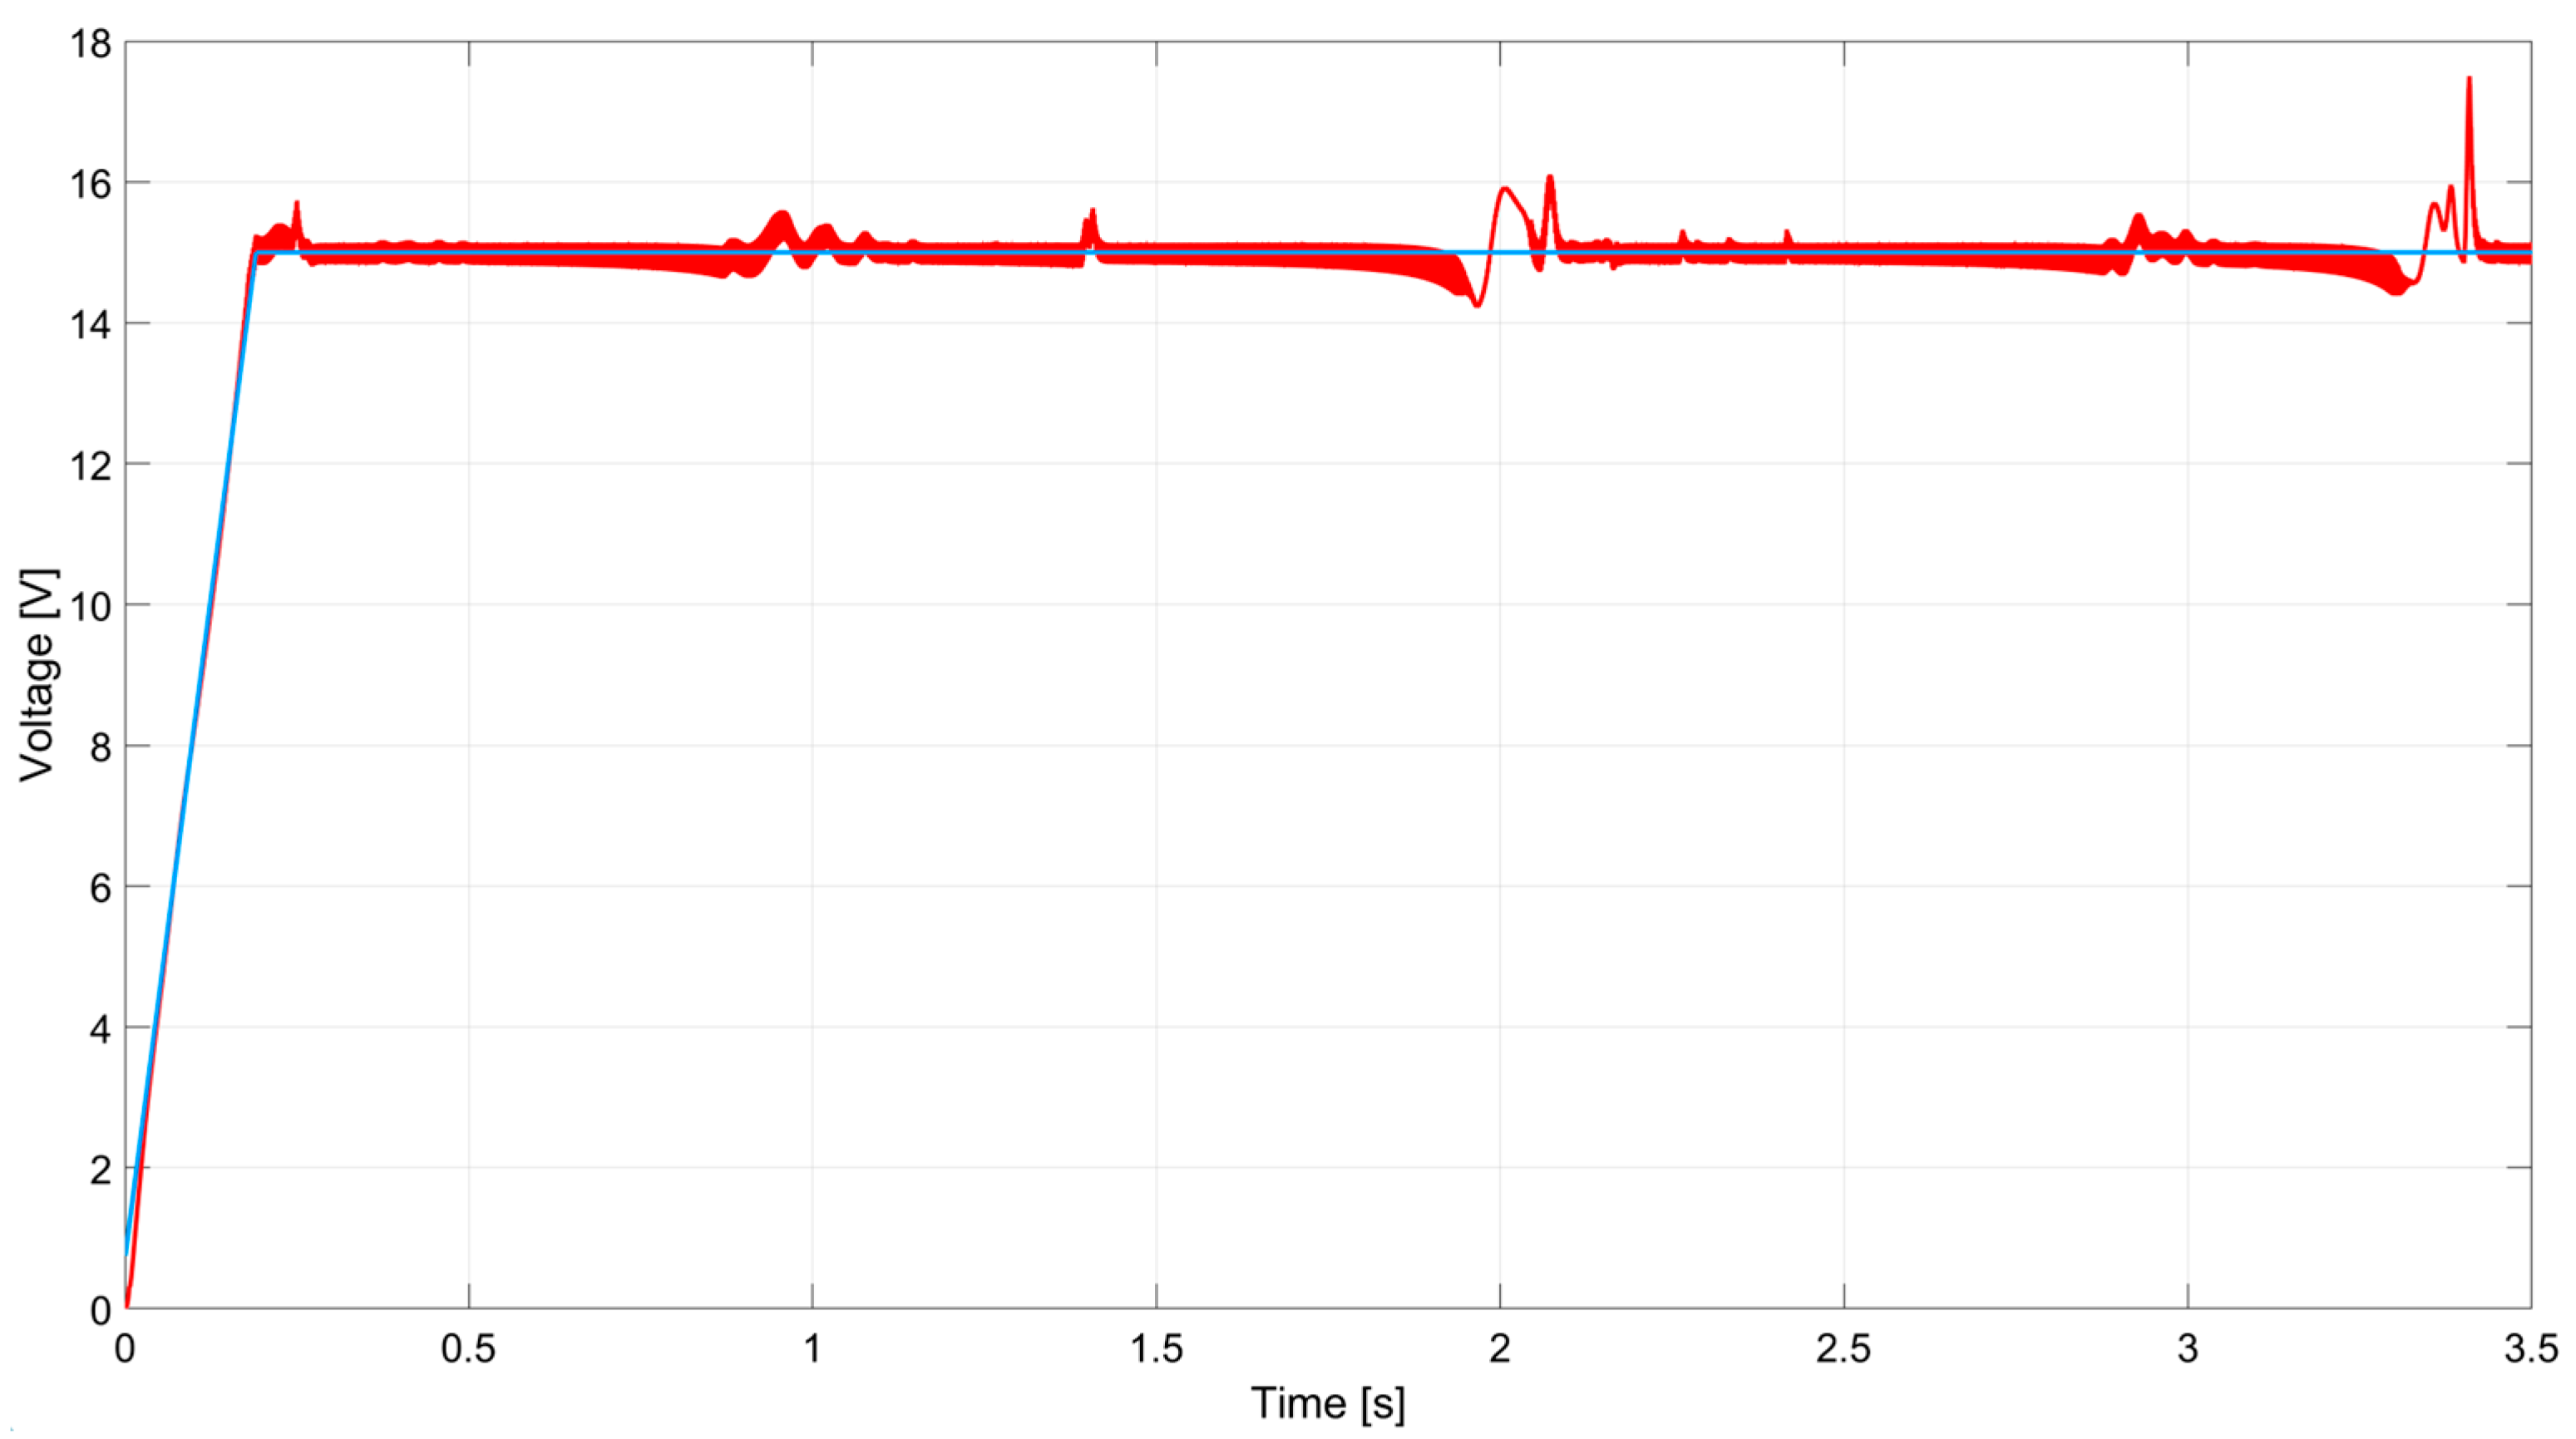
Figure 21, instead, shows the behavior of a simple PID regulator. It is clear that the control response is not fast enough to keep the output voltage constant, in response to rapid changes in input.
Comparing the behavior of
Figure 20 with that of
Figure 21, it can be noted that the presence of the feed-forward control attenuates the residual oscillation of more than 10 times, from ~3.3 Vpp to ~0.3 Vpp.
5.3. Hydrogen Production Estimation
Once the electrical power supplying the hydrolyzer has been established, and the characteristics of the hydrolyzer itself are known, it is possible to calculate the quantity of hydrogen that can be produced. Commercial electrolyzers are made using cells arranged in series connection. Each cell has specific electrical characteristics that determine its performance and efficiency. Typically, the cell operates at a low voltage, depending on the technology (alkaline, PEM, or solid oxide) and operating conditions. From a thermodynamic perspective, the ideal cell voltage for water splitting is approximately 1.23 V under standard conditions. In real operation, however, additional losses increase the operating voltage to around 1.8–2.2 V.
Electrical efficiency depends on these losses, which are influenced by temperature, pressure, electrode materials, and electrolyte conductivity. Cell efficiency can be estimated as the ratio between the theoretical voltage and the actual operating voltage. In practice, this results in a typical commercial electrolyzer whose efficiency is about 65–75%. An efficiency of around 70% represents a reasonable average value under nominal operating conditions. Higher efficiencies are usually achieved at higher temperatures and optimized current densities, but this is not applicable to the system addressed in this work.
Regarding the hydrogen production rate, this can be calculated starting from the current absorbed by the hydrolyzer. According to Faraday’s law of electrolysis, the amount of hydrogen produced depends only on the electric charge passed through the cell. In particular, two electrons produce one molecule of hydrogen, and one mole of electrons equals to about 96 C; this leads to a practical rule: at 1 A of current, about 0.42 mNl of hydrogen per minute is produced per cell. Since in our case the electrolyzer is made up of seven cells connected in series and the current flowing through them is 2 A, considering an efficiency of 70%, the production in about 4.12 mNl/min. Since the system works 24 h a day, in one day it is possible to produce 5.93 Nl of hydrogen. Just to give a reference, using higher heating value (HHV, 142 MJ/kg) with the proposed system, it is possible to obtain, every day, an energy of 75.8 kJ.
6. Conclusions
This manuscript highlights how the development of a wave energy converter for hydrogen production is motivated by the convergence of technological drivers, environmental opportunities, and political/economic pressures toward decarbonized and resilient energy solutions. The state-of-the-art shows that, although much is already well understood, the key challenges of real-world efficiency, cost, reliability in marine conditions, scale, integration, and storage remain. Certainly, a well-designed trial can significantly contribute to bridging the gap between theoretical potential and practical applications at a useful scale.
Regarding what has been shown here about the early stages of a research and development project for a WEC for producing green hydrogen from even low-energy waves, there are important aspects both in the development of the linear generator and in that of the converter interfaced with the hydrolyzer. In both cases, numerical modeling is a fundamental tool for saving time and money in system implementation.
FEM simulations allowed us to size the magnets and windings of the linear generator. Furthermore, developing an electromagnetic FE model was crucial for obtaining, although with an ideal wave and real time series taken by the literature, the waveforms that allowed us to develop a new conversion chain with a specific control strategy suited to exploiting irregular waves. Indeed, the work carried out clearly demonstrated that obtaining a converter with a well-regulated output to optimally power a hydrolyzer is quite challenging.
The proposed topology includes a first rectification stage consisting of full-bridge rectifiers connected in series that feed a buck–boost converter. The output voltage control is achieved by a PID regulator assisted by a feed-forward block, which has been shown to offer significant performance advantages in the various dynamic responses tested. In response to a constant set-point, with a variable input voltage obtained by the rectification state directly applied to the energy harvester, it showed an output swing of less than 300 mV for an input variation of about 300 V. For comparison, under the same conditions, the PID regulator without any feed-forward corrective action produces an output voltage swing of more than 3.3 V.
The importance of the work carried out goes beyond what has been achieved so far, because the FEM physical model can be coupled with the behavioral model developed in Simulink to perform co-simulations under irregular wave conditions. This will allow for refinement of both PI feedback and feed-forward controls and, if necessary, for comparing different topologies of the conversion chain.
These preliminary simulation activities are extremely important, because a design oriented towards an optimal solution from the prototype stage is key to the success of a WEC’s R&D. In the future, several activities will need to be carried out regarding the electric PTO devices.
As for uncertainty and error analysis, we currently lack both reference real devices and measurements to validate the numerical models, making it unattainable quantifying these factors currently. Then, testing prototypes of both the generator and the power electronic converter will be essential. Validating the FEM simulations for the generator is particularly important, as it will serve as a fundamental tool for any revisions to the LPMG. This validation will enable the inclusion of mechanical forces and various types of losses among the possible results. Mechanical forces are important for coupling the LPMG model to the hydrodynamic model of the floating system, while losses are crucial for assessing efficiency.
It should be noted that, although not described because this paper focused on the generation and conversion of electrical energy to be used for powering a hydrolyzer, the FEM model is already prepared for calculating losses (e.g., setting the ferroelectric material of the core with a B-H curve with hysteresis). Additionally, the model is ready for calculating electromagnetic forces. However, as previously stated, the analyses that have been very preliminarily performed with this data have not been included in this paper.
Equally important will be testing the power electronic converter, because second-order effects not considered in its behavioral model often led to adjustments in the control, rather than revising the components used for implementing it.