1. Introduction
Carbon capture is needed in industrial and energy systems whose process emissions cannot be eliminated through fuel switching or electrification alone. Post-combustion capture is particularly relevant for retrofit applications because it treats flue gas after combustion, but the low CO
2 partial pressure and large inert-gas fraction make separation energy-intensive [
1,
2,
3,
4]. Chemical absorption with aqueous amines remains the industrial benchmark. Adsorption cycles based on pressure or temperature swings offer a solvent-free alternative and may reduce regeneration demand in suitable operating windows [
2,
3,
4,
5,
6,
7].
Carbon utilization adds a further design constraint. Artificial photosynthesis and downstream methanol synthesis require a CO
2-rich feed, yet the value of that feed depends on the energy and emissions required to produce it. A capture section with high recovery can still provide little or no net climate benefit when heat or electricity is carbon intensive. Technology selection therefore requires common technical, environmental, and cost metrics rather than purity and recovery alone [
8].
Previous studies have examined amine absorption [
9,
10,
11,
12,
13], TSA and zeolite 13X adsorption/desorption [
5,
14,
15,
16,
17], and PSA/VPSA [
6,
18,
19,
20]. These studies established the importance of solvent regeneration, sorbent working capacity, feed pressure, evacuation pressure, moisture, and cyclic stability. Fewer studies compare these technology families using process outputs as the foreground inventory of the same life-cycle model. The resulting gap is material for capture-to-conversion chains because an upstream choice changes both the quality of the CO
2 stream and the residual carbon benefit available to downstream conversion. Cormos et al. [
8] compared reactive absorption and adsorption in different industrial decarbonization settings, while Zanco et al. [
21] compared piperazine absorption, zeolite 13X adsorption, and membranes for a humid 12% CO
2 feed using technical and economic criteria. Relative to those studies, the present work focuses on MDEA versus 13X TSA and PSA/VPSA for a dry 35% feed and combines simulated utility and material inventories with gate-to-gate climate impact, the technical–environmental index (TEI), and an operating expenditure (OPEX) screen per kilogram captured.
This work compares 30 wt% MDEA absorption, TSA on zeolite 13X and PSA/VPSA on zeolite 13X using common capture-unit criteria. The adsorption models are checked against published performance data, the TSA regeneration temperature and the PSA/VPSA feed and evacuation pressures are varied, and the simulated mass and energy flows are converted into gate-to-gate climate impacts and operating costs. The contribution is a consistent screening framework for a dry, CO2-enriched stream upstream of artificial photosynthesis. The 35 mol% CO2 feed differs from untreated power-plant flue gas (about 15 mol%), and MDEA is used as the absorption reference; the results therefore do not rank other amines or lower-CO2 feeds.
2. Materials and Methods
2.1. Study Basis and Comparison Framework
The capture section was modeled independently from downstream CO2 conversion. Aspen Plus V11 was used for steady-state MDEA absorption and solvent regeneration, and Aspen Adsorption for the dynamic TSA and PSA/VPSA simulations, because cyclic fixed-bed behavior requires time-resolved mass, momentum and energy balances. The principal comparison used a dry feed containing 35 mol% CO2 and 65 mol% N2; literature cases at 15 mol% CO2 were used to check both adsorption models. Water, O2, SOx and NOx were excluded, so the results apply to a pretreated dry gas. For a wet, untreated stream, competitive H2O uptake on hydrophilic 13X would reduce the CO2 working capacity, and maintaining capture would require drying, more adsorbent or modified regeneration; this additional energy is outside the present scope.
Cases were compared by recovery, product purity and specific energy consumption. Aspen outputs supplied the foreground inventory for OpenLCA, and environmental and cost results were normalized to 1 kg of captured CO
2. A 10-year plant life and 8150 operating hours per year were applied to allocate solvent and adsorbent replacement. Configurations were first required to deliver a product purity above 90%; recovery, impact on climate change (ICC) and OPEX were then compared. The comparison screens the simulated operating points; no global cycle optimization or weighted multi-criteria optimum is claimed. The simulation basis and reference configurations are summarized in
Table 1.
Table 1.
Simulation basis and reference configurations.
Table 1.
Simulation basis and reference configurations.
| Process | Model and Material | Reference Operating Basis | Primary Sensitivity |
|---|
| MDEA absorption | Aspen Plus V11; ELECNRTL liquid phase; Peng–Robinson vapor phase; 30 wt% MDEA | 35 mol% CO2; 313.15 K; about 1 bar; 95% capture target | Stage number, solvent flow, reboiler duty, reflux ratio |
| TSA | Aspen Adsorption; zeolite 13X bed; inventory train: 13 beds at 383 K, 11 at 420/450 K | 288 K adsorption; 1 bar; 35 mol% CO2 comparison case | Regeneration at 383, 420, and 450 K |
| PSA/VPSA | Aspen Adsorption; zeolite 13X bed; inventory train: 7 beds at 3–8 bar, 8 at 10 bar | 370 K; 35 mol% CO2; evacuation at 0.11 bar | Feed pressure 3–10 bar; evacuation pressure 0.11–0.33 bar |
Inlet temperatures differ between the models: 313.15 K for MDEA, 288 K for TSA and 370 K for PSA/VPSA. Conditioning of a common upstream gas to these temperatures, nitrogen-purge production, cooling duties and auxiliary electricity for MDEA and TSA lie outside the capture-unit boundary (
Section 4.3).
2.2. Chemical Absorption Model
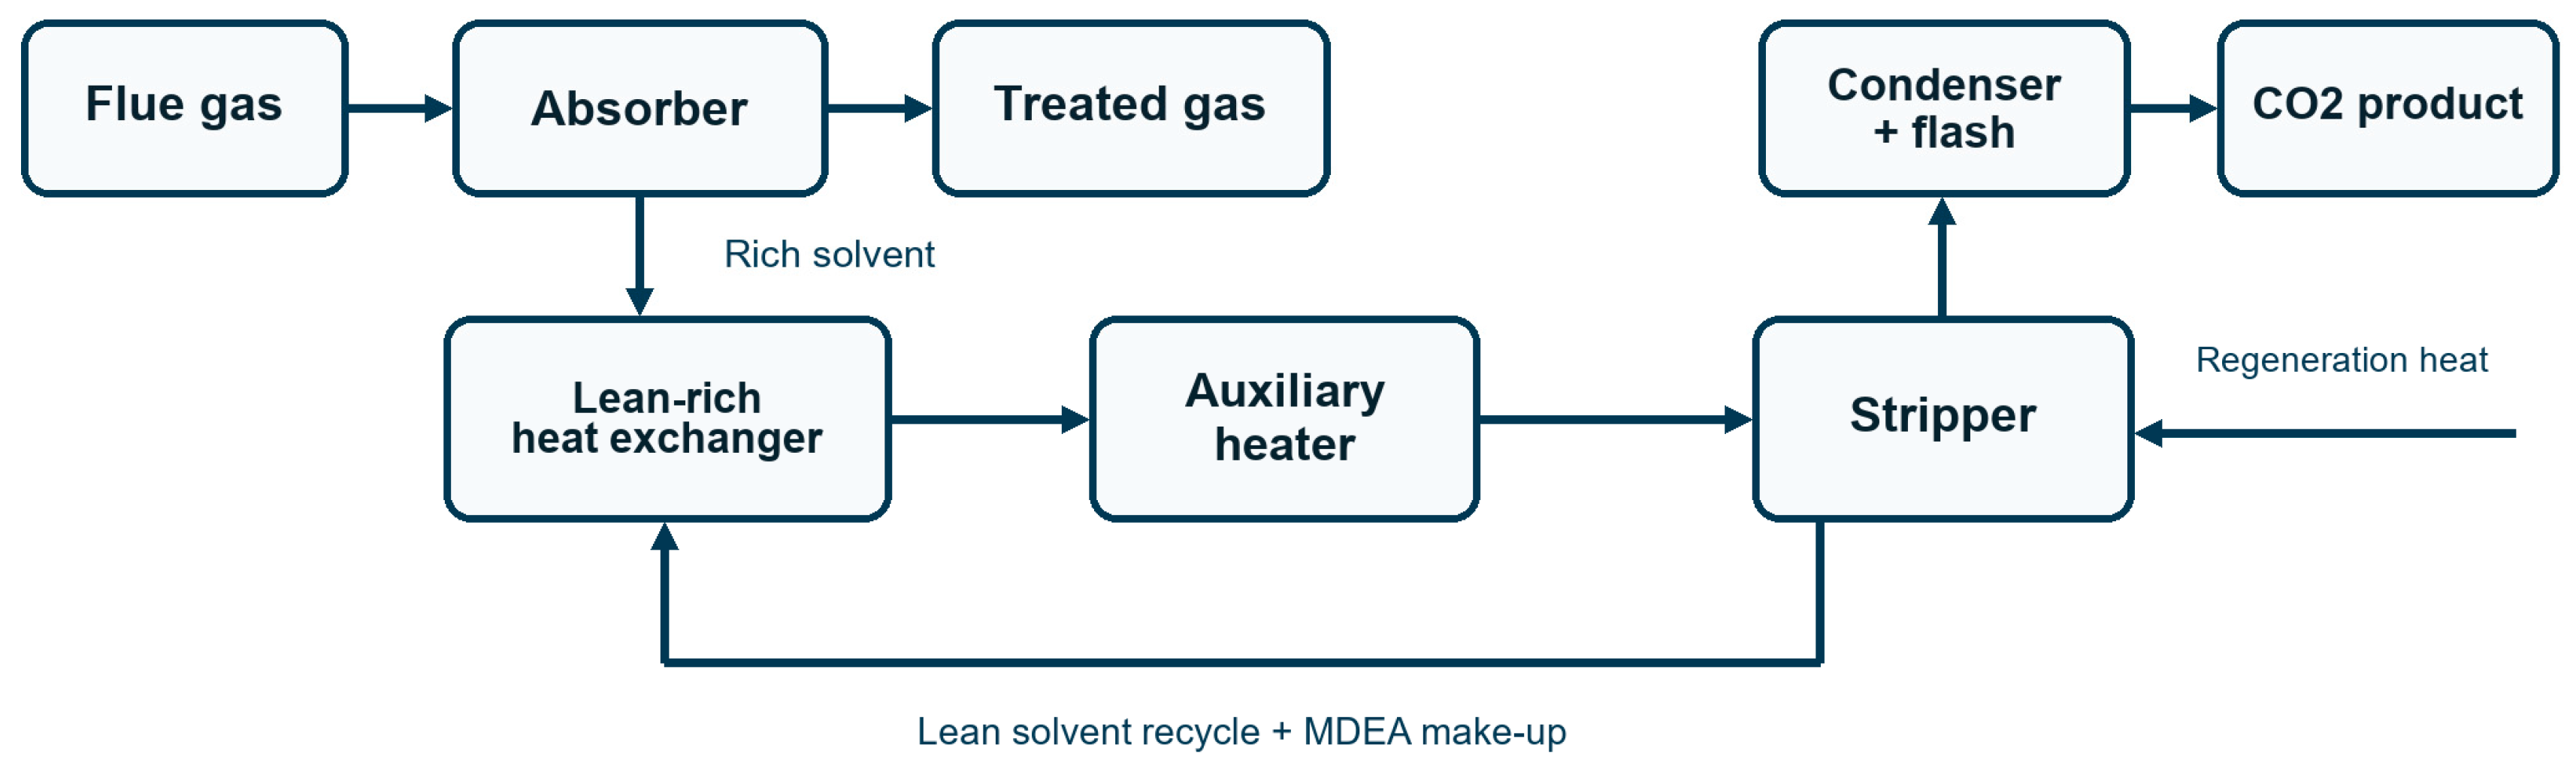
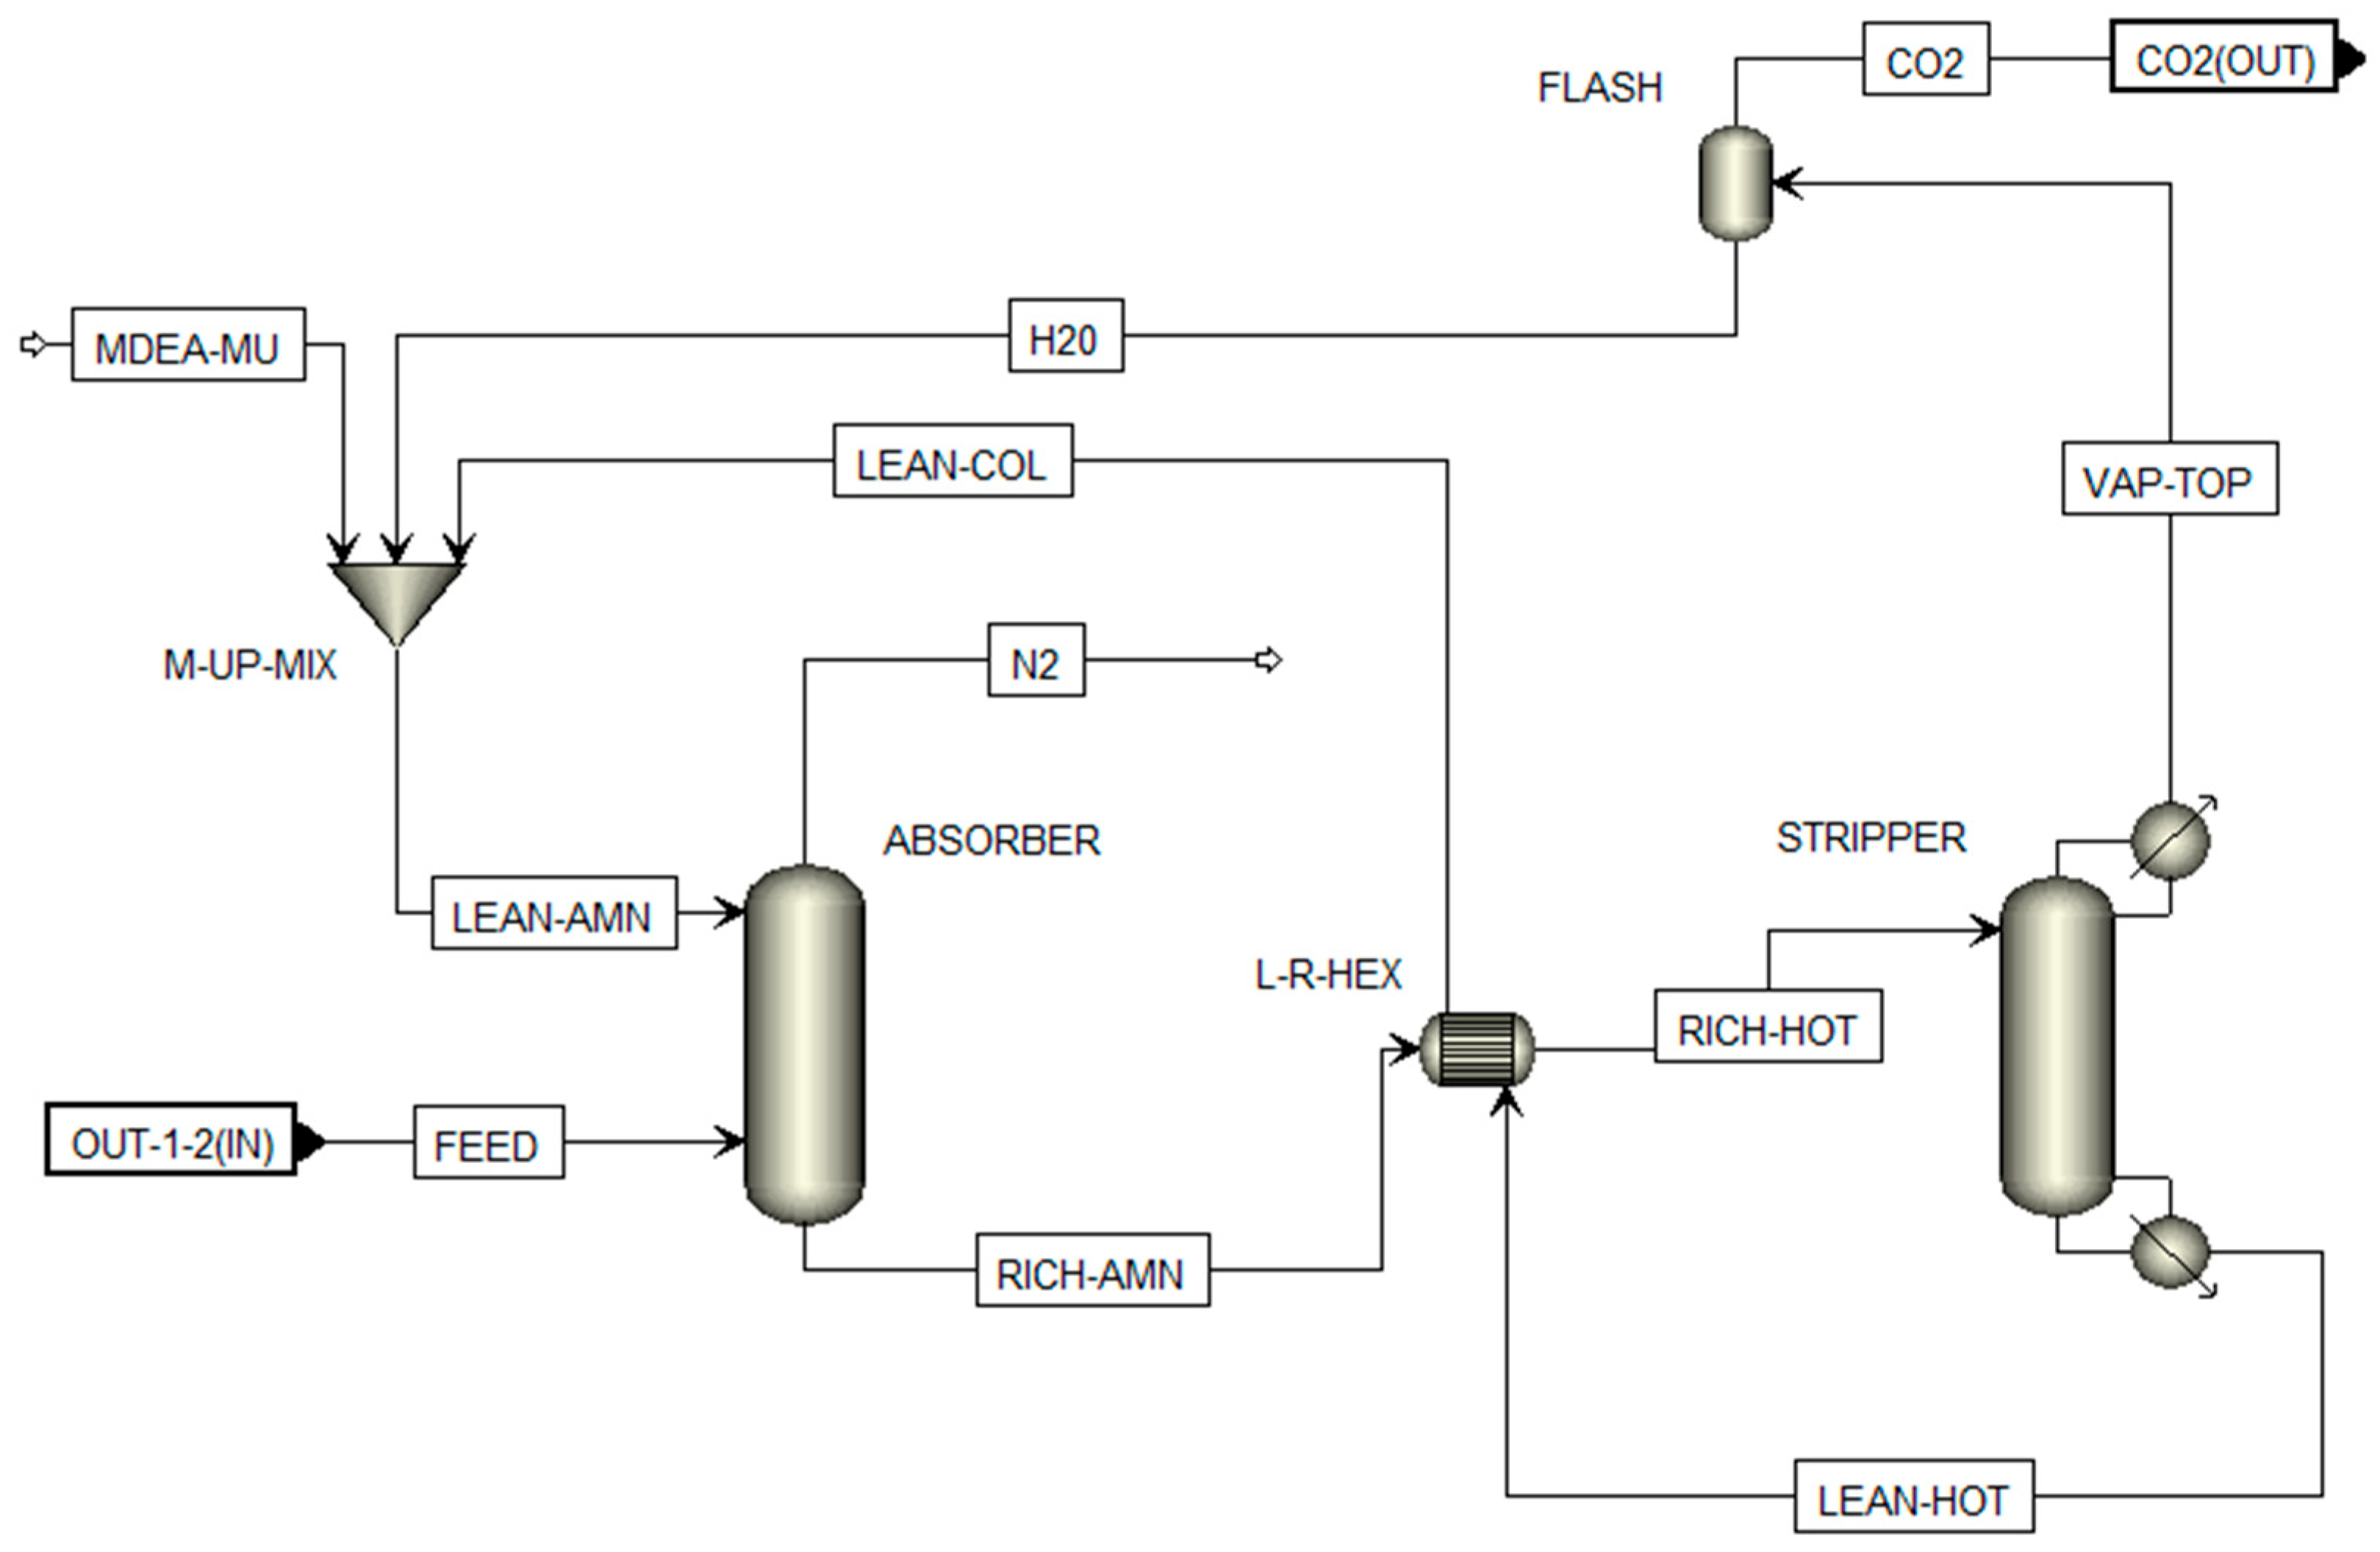
The absorption flowsheet (
Figure 1) comprised an absorber, stripper, lean–rich heat exchanger, condenser, flash separator, solvent recycle and make-up. Flue gas entered the absorber at the bottom and contacted lean solvent countercurrently. Rich solvent was preheated before the stripper; overhead vapor was condensed to remove most water, and regenerated solvent returned to the absorber. The liquid phase used the electrolyte non-random two-liquid model (ELECNRTL) to represent the strongly non-ideal water–amine–electrolyte system, and the vapor phase used the Peng–Robinson equation of state; electrolyte-NRTL thermodynamics for aqueous MDEA are described in [
13]. Both columns were represented with RadFrac equilibrium stages and a Murphree stage efficiency of 0.5 [
22], which approximates mass-transfer limitations without resolving reaction kinetics at the gas–liquid interface.
The reaction set included MDEA protonation, CO
2 hydration, bicarbonate and carbonate equilibria, and water autoprotolysis. A design specification adjusted the solvent circulation to achieve 95% CO
2 capture. The stage sensitivity showed little additional benefit beyond approximately 9–10 stages, and a reflux ratio of 1.5 was selected to control the stripper overhead temperature and wet CO
2 purity. At the operating point, the regeneration heat demand is 3.96 MJ kg
−1 captured, of which approximately 2.7 MJ kg
−1 is reboiler duty and 1.2 MJ kg
−1 is auxiliary heating of the rich solvent after lean–rich heat recovery. The Aspen Plus layout is shown in
Figure 2.
In
Figure 2, OUT-1-2(IN) is the upstream connection to FEED, the dry CO
2/N
2 gas entering ABSORBER. N2 denotes the CO
2-depleted overhead gas, not pure nitrogen. RICH-AMN is CO
2-loaded MDEA; RICH-HOT is that solvent after lean–rich heat exchange. VAP-TOP is the wet stripper overhead; CO
2 and CO
2(OUT) identify the gas leaving FLASH and the CO
2-rich product. H20 is the condensed-water recycle. LEAN-HOT and LEAN-COL are the regenerated solvent before and after the exchanger, MDEA-MU is amine make-up and LEAN-AMN is the mixed lean solvent returning to the absorber.
Figure 1.
Conceptual MDEA absorption–desorption flow based on the unit operations in the simulation.
Figure 1.
Conceptual MDEA absorption–desorption flow based on the unit operations in the simulation.
Figure 2.
Aspen Plus model flowsheet for the MDEA absorption–regeneration loop. Arrows indicate the direction of each stream; boxed labels are Aspen Plus stream names, open arrowheads (MDEA-MU, N2) mark external inlets and outlets, and black port symbols (OUT-1-2(IN), CO2(OUT)) mark connections to the rest of the flowsheet.
Figure 2.
Aspen Plus model flowsheet for the MDEA absorption–regeneration loop. Arrows indicate the direction of each stream; boxed labels are Aspen Plus stream names, open arrowheads (MDEA-MU, N2) mark external inlets and outlets, and black port symbols (OUT-1-2(IN), CO2(OUT)) mark connections to the rest of the flowsheet.
2.3. TSA Model
The TSA model used a one-dimensional non-isothermal fixed bed with axial dispersion. Pressure drop followed the Ergun equation, mass transfer used a linear driving-force expression, and CO
2/N
2 equilibrium on zeolite 13X used a dual-site Langmuir isotherm with temperature-dependent affinity parameters [
15,
16,
17]. A coaxial internal heat exchanger represented bed heating and cooling. The bed was 0.76 m long and 0.08 m in diameter, with interparticle porosity 0.565, intraparticle porosity 0.37, solid density 650 kg m
−3, particle radius 2.15 mm, and solid heat capacity 0.92 kJ kg
−1 K
−1. The heat exchanger used an overall coefficient of 100 W m
−2 K
−1.
Each TSA cycle comprised adsorption, thermal desorption with N
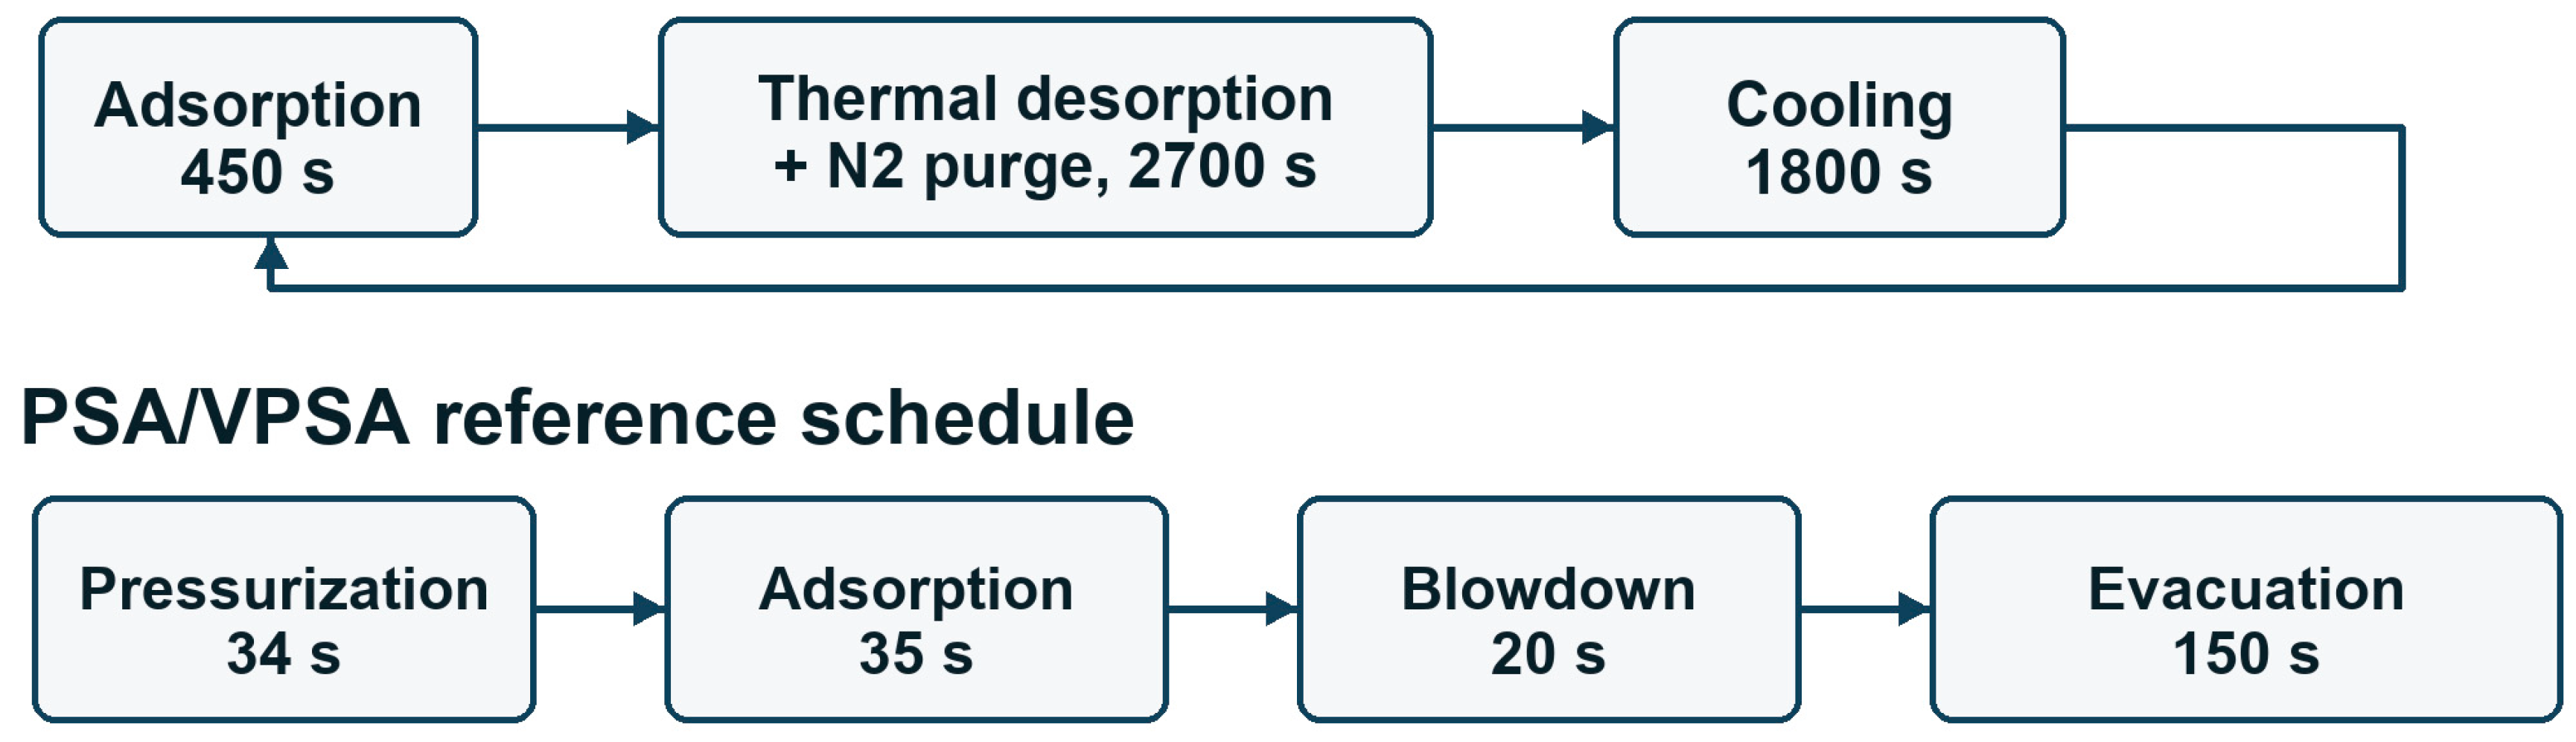
2 purge, and cooling. For the 15 mol% check mixture, the step times were 1100, 2500 and 1500 s. At 35 mol% CO
2, faster breakthrough required 450 s adsorption, followed by 2700 s desorption and 1800 s cooling. Simulated breakthrough occurred near 1100 s at 15 mol% and near 530 s at 35 mol%, reproducing the expected acceleration with increasing CO
2 partial pressure. The regeneration temperature was then varied from 383 to 450 K. The annual cycle counts and bed numbers used in the inventory are listed in
Appendix B (
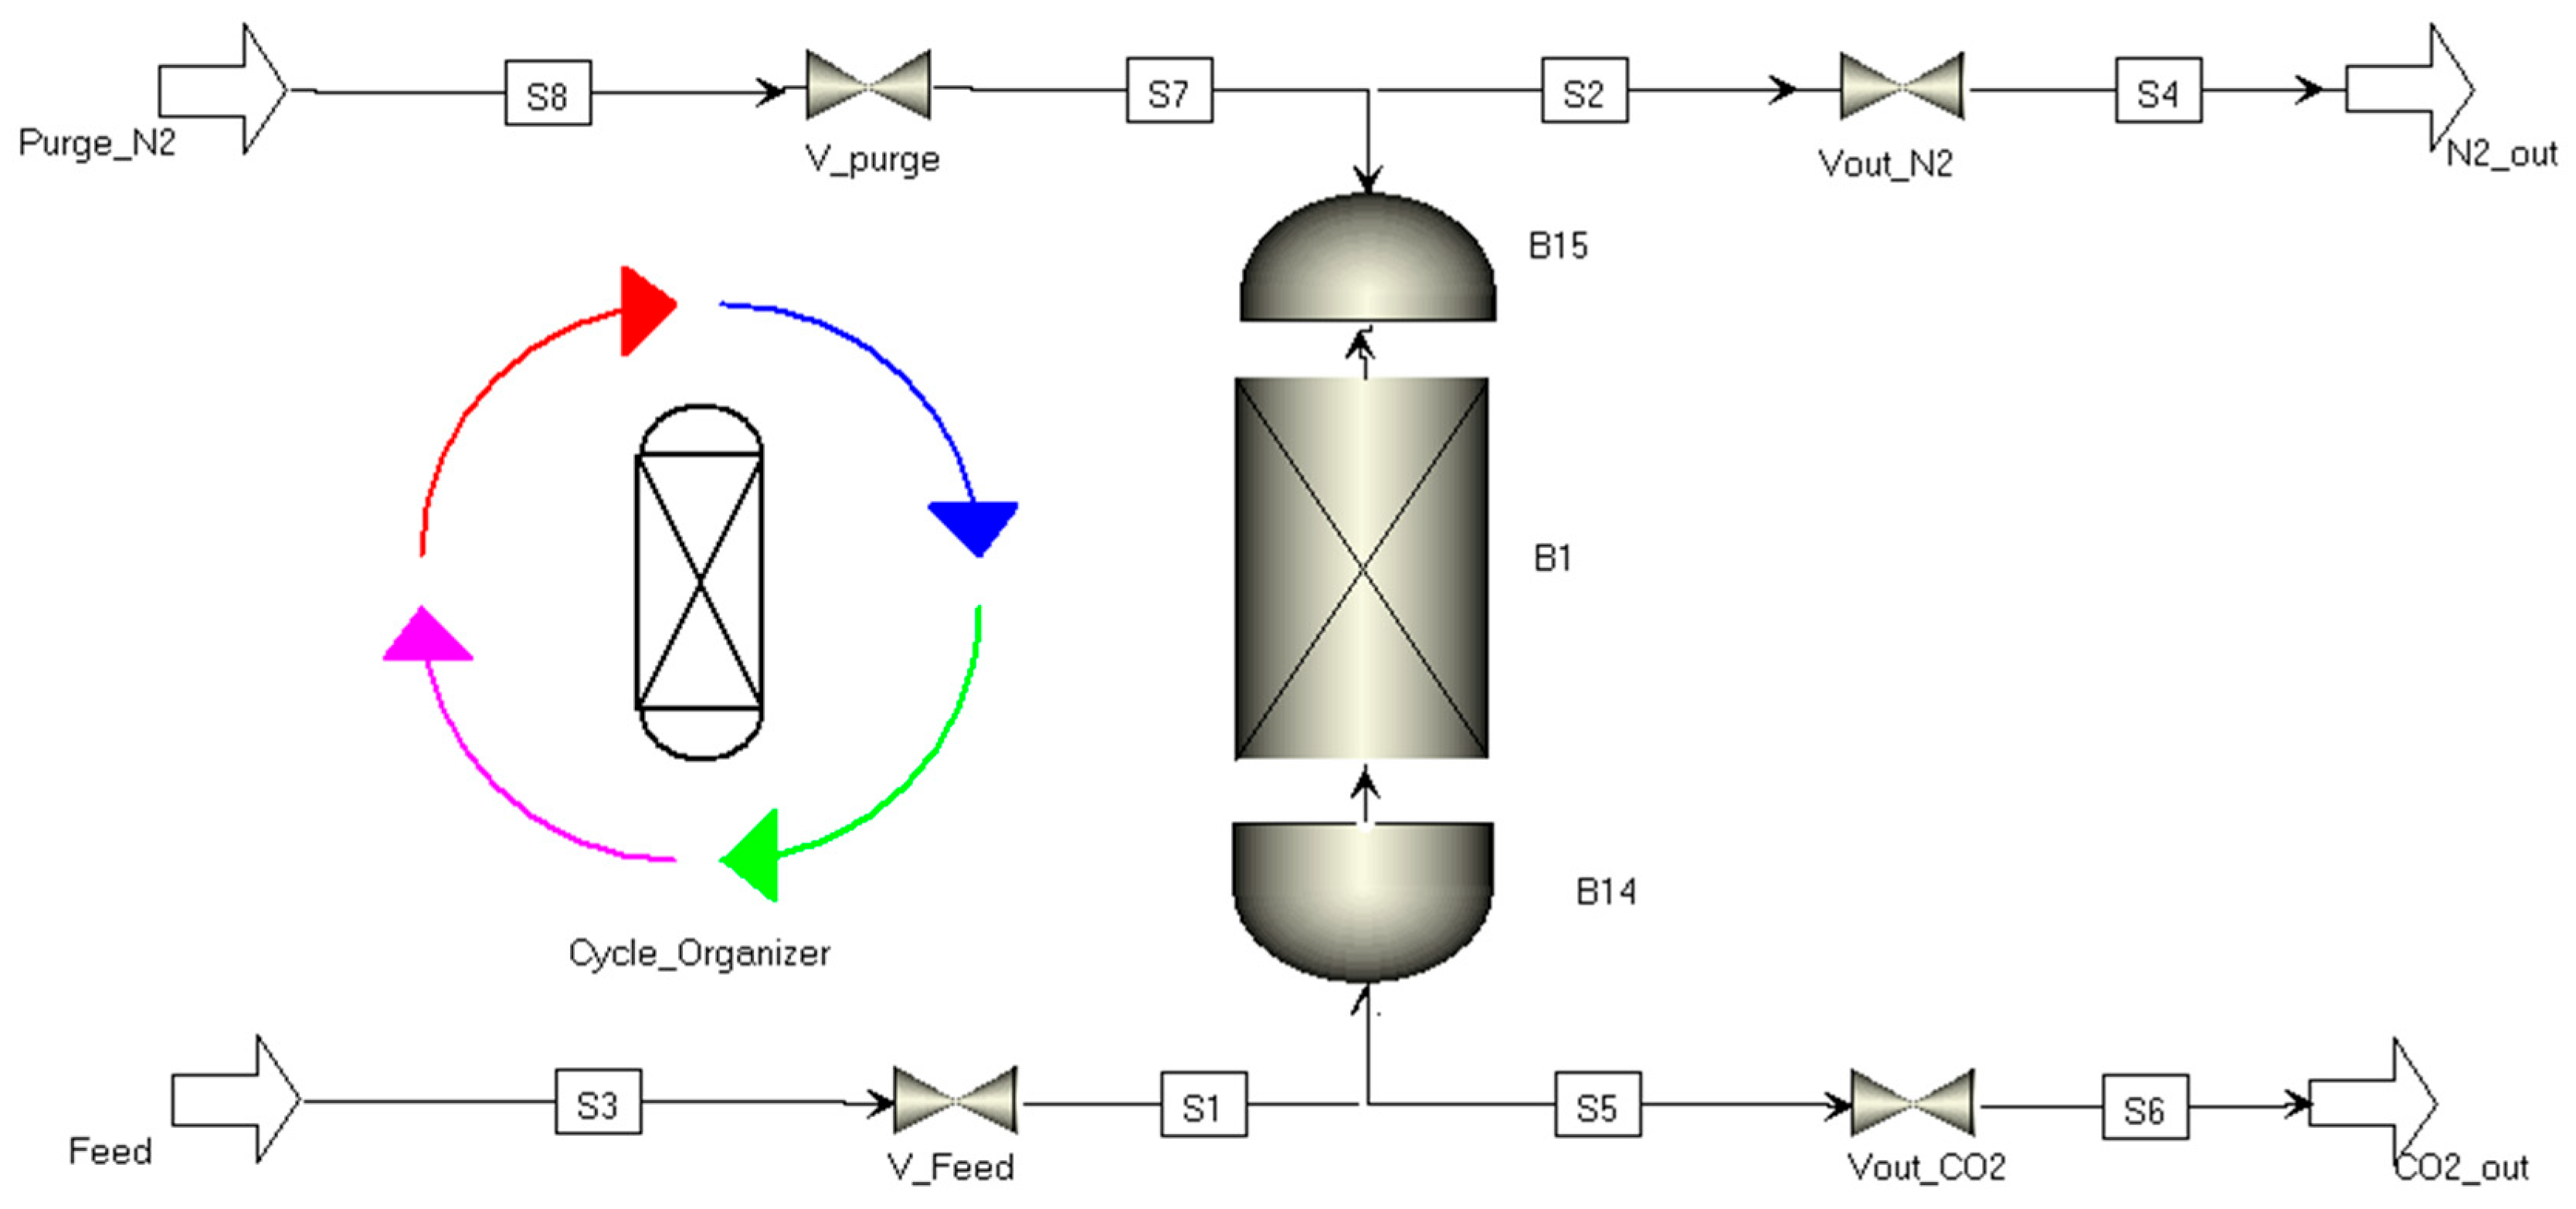
Table A3). The Aspen Adsorption layout is shown in
Figure 3.
In
Figure 3, Feed–S3–V_Feed–S1 supplies the CO
2/N
2 mixture to the lower bed block B14 and adsorbent bed B1. During adsorption, N
2-enriched gas leaves the upper block B15 through S2–Vout_N2–S4 to N2_out. During regeneration, Purge_N2–S8–V_purge–S7 introduces nitrogen at the top; CO
2-enriched desorbate leaves the bottom through S5–Vout_CO
2–S6 to CO
2_out. B14 and B15 are the lower and upper bed blocks, while Cycle_Organizer controls the valve sequence. S-numbers identify Aspen connections, not separate chemical species.
2.4. PSA and VPSA Model
The PSA/VPSA model used the same pressure-drop, mass-transfer, equilibrium and non-isothermal energy-balance framework. The reference VPSA bed was 0.25 m long and 0.02 m in diameter, with interparticle porosity 0.35, intraparticle porosity 0.37, solid density 720 kg m
−3, particle radius 1 mm and solid heat capacity 0.92 kJ kg
−1 K
−1. A four-step cycle included pressurization, adsorption, blowdown and evacuation, with literature-derived reference step times of 34, 35, 20 and 150 s (239 s in total). The inventory cycle counts for each feed pressure are given in
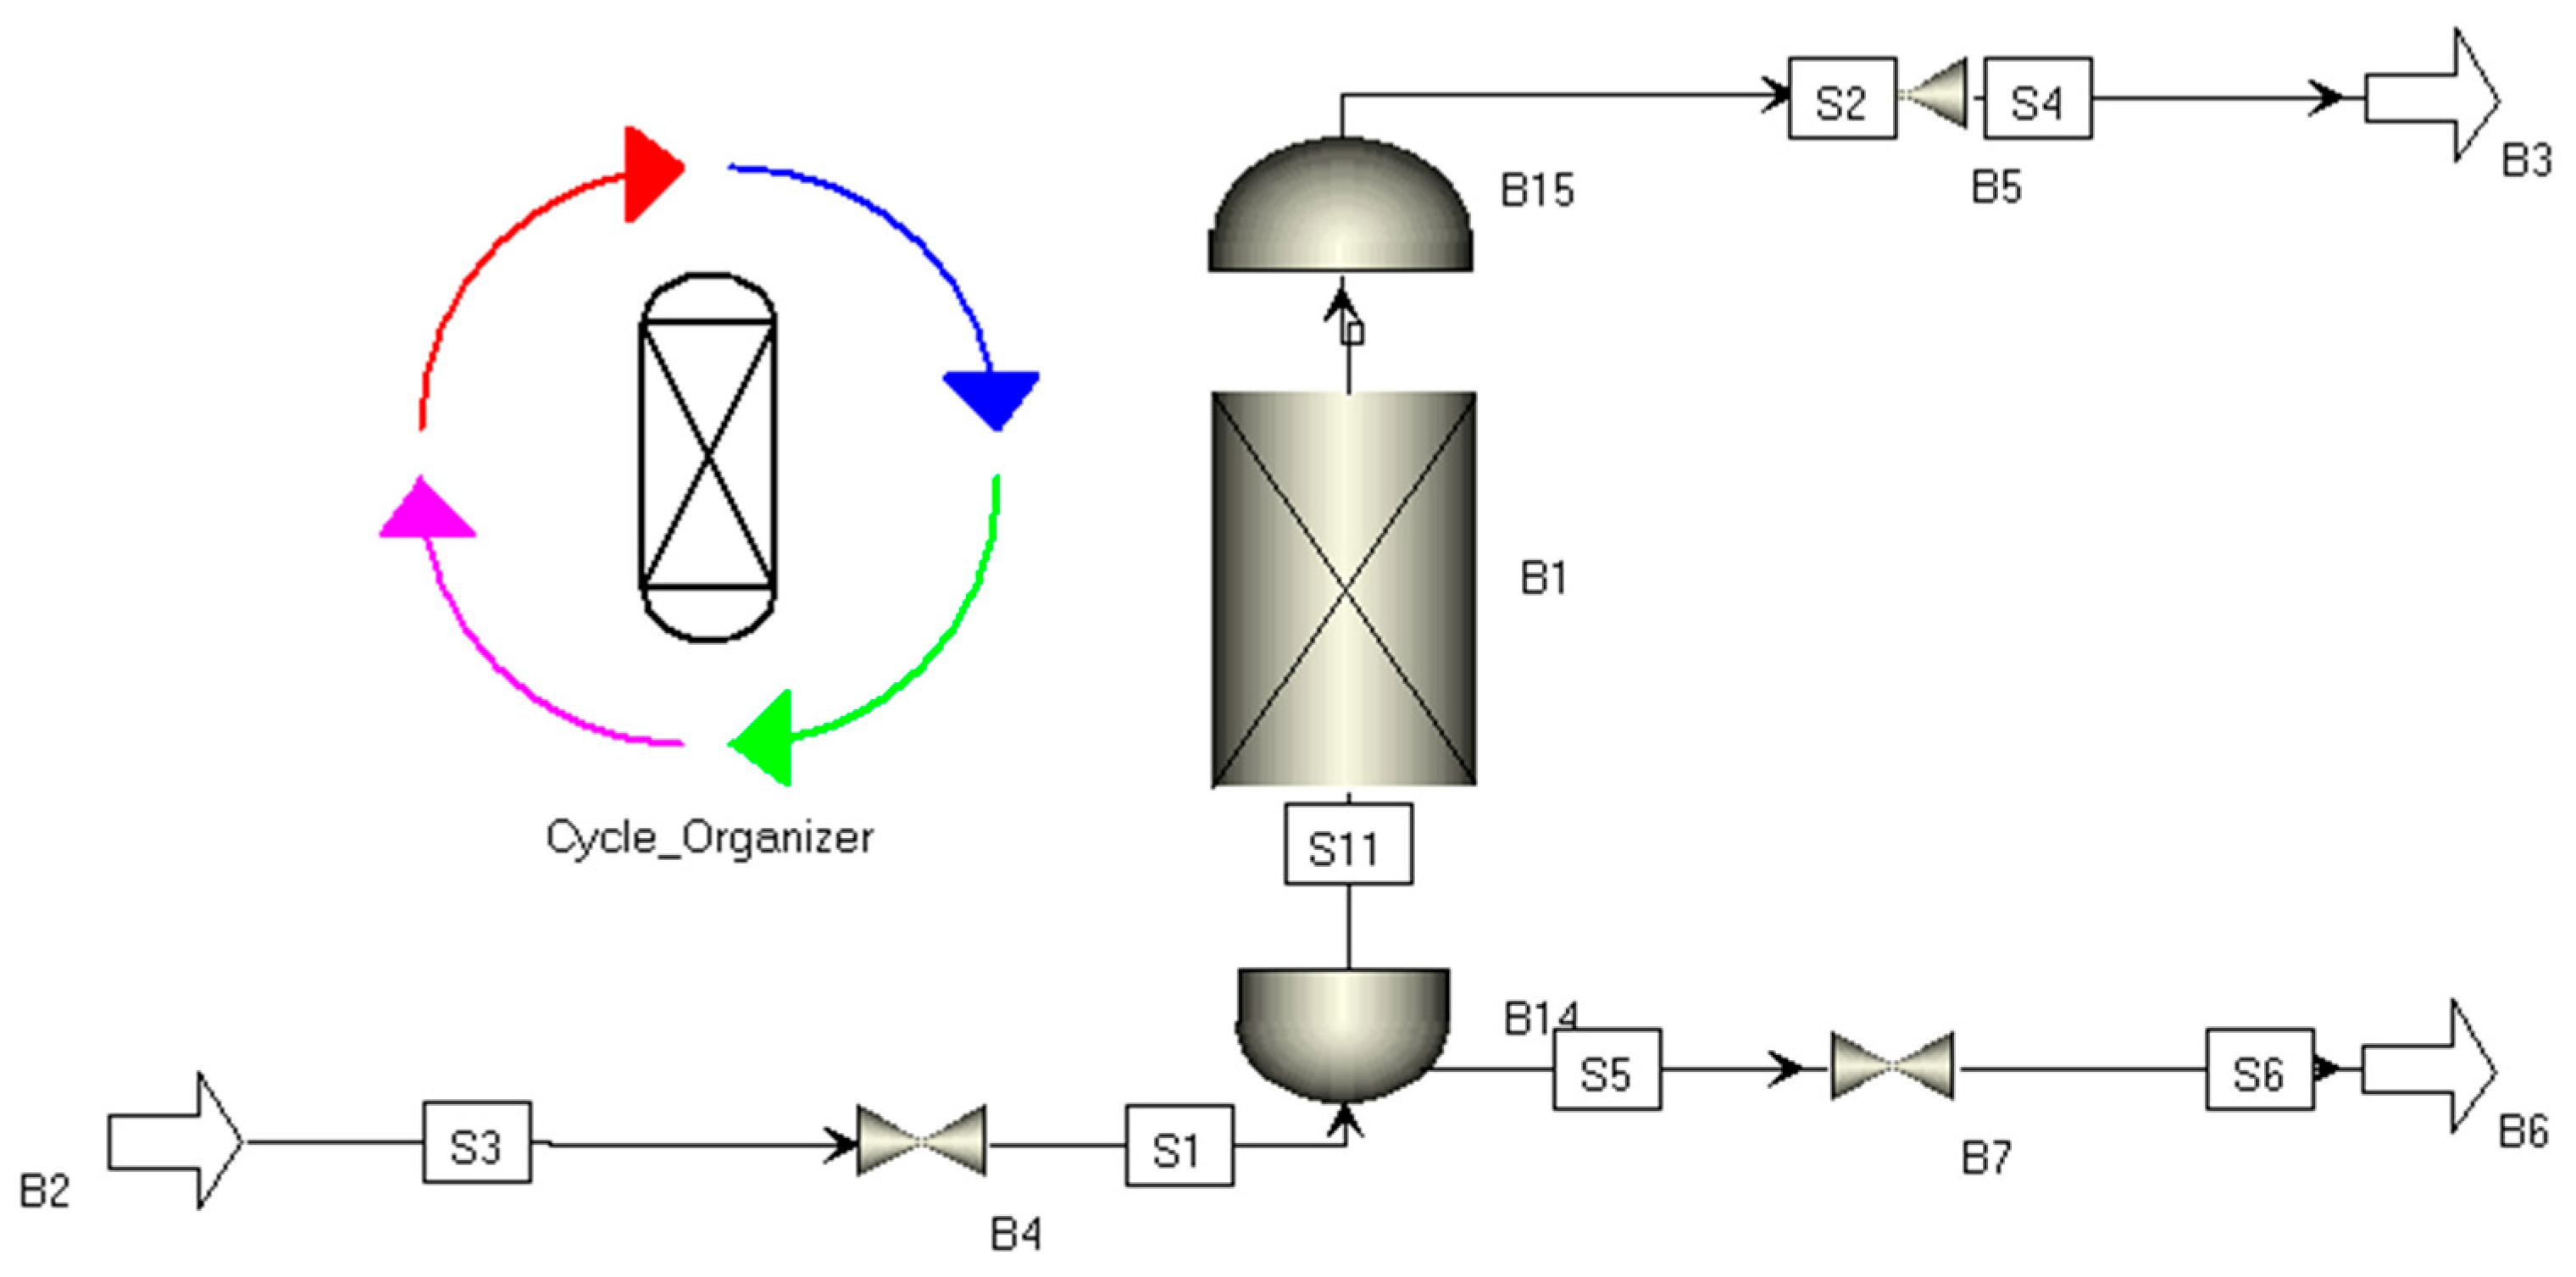
Table A3. The Aspen Adsorption layout is shown in
Figure 4 and the step schedules of both adsorption cycles in
Figure 5.
The 15 mol% CO2 check case at 6.52 bar adsorption and 0.11 bar evacuation gave 84% purity and 92% recovery, compared with published values of 88% and 96.9% (absolute deviations of 4.0 and 4.9 percentage points). For the 35 mol% feed, adsorption pressures of 3, 5, 6.52, 8 and 10 bar were tested at 0.11 bar evacuation, and evacuation pressures of 0.22 and 0.33 bar were evaluated at 6.52 bar feed. Compressor and vacuum-pump electricity was normalized to captured CO2.
In
Figure 4, B2–S3–B4–S1 is the feed connection to the lower block B14 and adsorbent bed B1. B15–S2–B5–S4–B3 is the upper outlet, which carries N
2-enriched gas during adsorption and residual gas during cocurrent blowdown. B14–S5–B7–S6–B6 is the lower product line: during evacuation, valve B7 opens and the CO
2-rich product is withdrawn countercurrently from the feed end to the vacuum/product boundary B6. S11 connects bed B1 to the lower block B14. B4, B5 and B7 are switching valves; Cycle_Organizer sets the four-step schedule. B-numbers label Aspen blocks or external boundaries and S-numbers label intermediate connections.
Figure 5.
Step schedules for TSA at 35 mol% CO2 and for the PSA/VPSA reference case.
Figure 5.
Step schedules for TSA at 35 mol% CO2 and for the PSA/VPSA reference case.
Model Parameters and Model Checks
The PSA/VPSA check results at 15 mol% CO
2 correspond to cyclic steady state (CSS): 84.0% purity and 92.0% recovery, versus literature values of 88.0% and 96.9%. The simulated first-cycle breakthrough near 100 s compares with a literature CSS reference near 70 s. Grid- and time-step-independence studies and a formal cycle-to-cycle CSS criterion were not part of this screening and are identified as next steps in
Section 4.3.
The temperature-dependent dual-site Langmuir (DSL) coefficients are listed in
Appendix A,
Table A1 [
22]. The TSA configuration and lumped-resistance mass-transfer formulation follow Chen et al. [
23], the Toth reference follows Liu et al. [
24], isotherm modeling follows Papadopoulos and Seferlis [
25], and the PSA/VPSA reference conditions follow Ko et al. [
26]. Mass transfer was described with a linear driving-force model, whereas the coefficient of 100 W m
−2 K
−1 refers to heat transfer in the internal heat exchanger.
2.5. Performance Indicators
Recovery is the ratio of CO
2 collected in the product to CO
2 admitted with the feed, and purity is the CO
2 fraction of the collected product. For cyclic operation, both are defined on component flows integrated over the feed and product-collection intervals of a complete cycle. SEC divides the delivered utility demand by the captured CO
2. TEI divides fractional recovery times fractional purity by ICC (kg CO
2-eq per kg captured) and therefore has units of kg captured CO
2 per kg CO
2-eq; because MDEA purity is on a wet basis and adsorption purity on a dry basis, TEI is used as a supporting indicator only. The capture-unit balance, 1 − ICC per functional unit, is an accounting quantity and not a measure of atmospheric removal; the cost per unit of positive balance is OPEX divided by this quantity. OpenLCA characterizes heat, electricity and materials through their respective background datasets, so thermal and electrical MJ are not added as equivalents.
Equations (1)–(5). Performance and accounting indicators; cyclic quantities refer to a complete cycle.
2.6. Life Cycle Assessment
The environmental analysis followed the ISO 14040 framework [
27] with a gate-to-gate boundary beginning with pretreated flue gas at the capture-unit inlet and ending with purified CO
2 at the outlet. It included operating heat and electricity, MDEA make-up and zeolite replacement; construction materials, civil works and downstream compression or conversion were excluded. The functional unit was the capture and purification of 1 kg CO
2 to more than 90% product purity. Environmental modeling used OpenLCA 2.5, the European Life Cycle Database (ELCD) 3.2 and the Environmental Footprint 3.0 impact method. Climate change over 100 years was the decision metric; fossil resource use and acidification were also recorded for the MDEA case.
The MDEA inventory is based on 274.36 kg h
−1 solvent circulation, 4.12 kg h
−1 make-up, 44 kg h
−1 CO
2 feed and 95% recovery. At 8150 h year
−1 over 10 years, the captured CO
2 totals 3,406,700 kg, giving a make-up inventory of 0.0985 kg per kg captured (approximately 1.50% of the circulation). A production factor of 1.56 kg CO
2-eq kg
−1 MDEA was applied [
22].
Zeolite replacement assumes a 5000-cycle life. Zeolite 13X production was represented by a clay-based synthesis proxy with a cumulative energy demand (CED) of 11.15 MJ kg−1, 96.1% of which is attributed to electricity. European medium-voltage electricity and natural-gas-derived steam were used as background processes.
Because the useful sorbent life is uncertain, a cost sensitivity was calculated with unchanged utility demand, retaining the initial charge and scaling only the replacement mass inversely with cycle life. For TSA at 420 K (25.63 kg initial charge, 303.83 kg replacement and 122,673.47 kg CO2 captured over the plant life), lives of 2500, 5000 and 10,000 cycles give utility-plus-zeolite costs of approximately €0.150, €0.147 and €0.145 kg−1 captured. For PSA/VPSA at 3 bar (0.32 kg initial charge, 83.98 kg replacement and 10,038.67 kg captured), the corresponding costs are approximately €0.110, €0.100 and €0.095 kg−1. The PSA/VPSA cost advantage is therefore robust to the assumed sorbent life.
Foreground utility and material inventories are listed in
Appendix B,
Table A2 [
22]. The PSA/VPSA energy demand is electricity for compression and evacuation; auxiliary electricity for MDEA and TSA is not itemized separately.
2.7. Economic Assessment
The economic comparison is an operating-cost screen covering utility supply and material replacement per kilogram of captured CO2. Capital expenditure (CAPEX), labor, maintenance, pretreatment, product compression and financing are excluded, so the results are comparative OPEX estimates within the modeled boundary rather than levelized capture costs. The cost per unit of positive capture-unit balance additionally reflects indirect climate emissions through its denominator.
Because CAPEX was not estimated, the OPEX differences are expressed as break-even allowances: at matched throughput and product specification, PSA/VPSA could bear approximately €0.131 kg
−1 of additional annualized capital cost relative to MDEA and €0.047 kg
−1 relative to TSA at 420 K, and TSA €0.084 kg
−1 relative to MDEA, before the total-cost ordering reverses. Published techno-economic work that includes capital costs for absorption and zeolite adsorption [
21] uses a different solvent, feed and product specification, so its ranking is not directly transferable.
3. Results
3.1. MDEA Absorption
The selected MDEA configuration reached 95% recovery and approximately 95% wet-product purity. Recovery increased steeply with reboiler load before approaching a plateau near the design target. The corresponding bottom temperature remained close to 109–110 °C. Lean-rich heat exchange recovered about 114.4 MJ h−1, but the imposed 10 °C minimum temperature approach required auxiliary heating to reach the stripper feed condition. Wet-product purity denotes the CO2 mole fraction before complete water removal; adsorption purity is reported for a dry CO2/N2 product. The figures are therefore not directly comparable on a common purity basis without the MDEA overhead composition after drying.
The regeneration heat demand was 3.96 MJ kg−1 captured. OpenLCA returned 0.712 kg CO2-eq kg−1 captured, 7.66 MJ of fossil resource use and 2.06 × 10⁻³ mol H+-eq of acidification, corresponding to a capture-unit balance of 0.288 kg CO2-eq per kilogram captured before downstream use. Regeneration heat and solvent make-up are the two contributors to this burden.
3.2. TSA Sensitivity
Increasing the feed concentration from 15 to 35 mol% improved TSA recovery from 58.0% to 80.5% and purity from 87.0% to about 91.0% at 383 K regeneration, because the higher CO2 partial pressure increased uptake and reduced the heat required per kilogram captured. At 15 mol%, neither the TSA case (58% recovery, 87% purity) nor the PSA/VPSA check case (92% recovery, 84% purity) meets the >90% purity requirement, and no matched 15 mol% MDEA case was simulated. The data therefore establish the feed-composition sensitivity of TSA but do not support a three-technology ranking at 15 mol%.
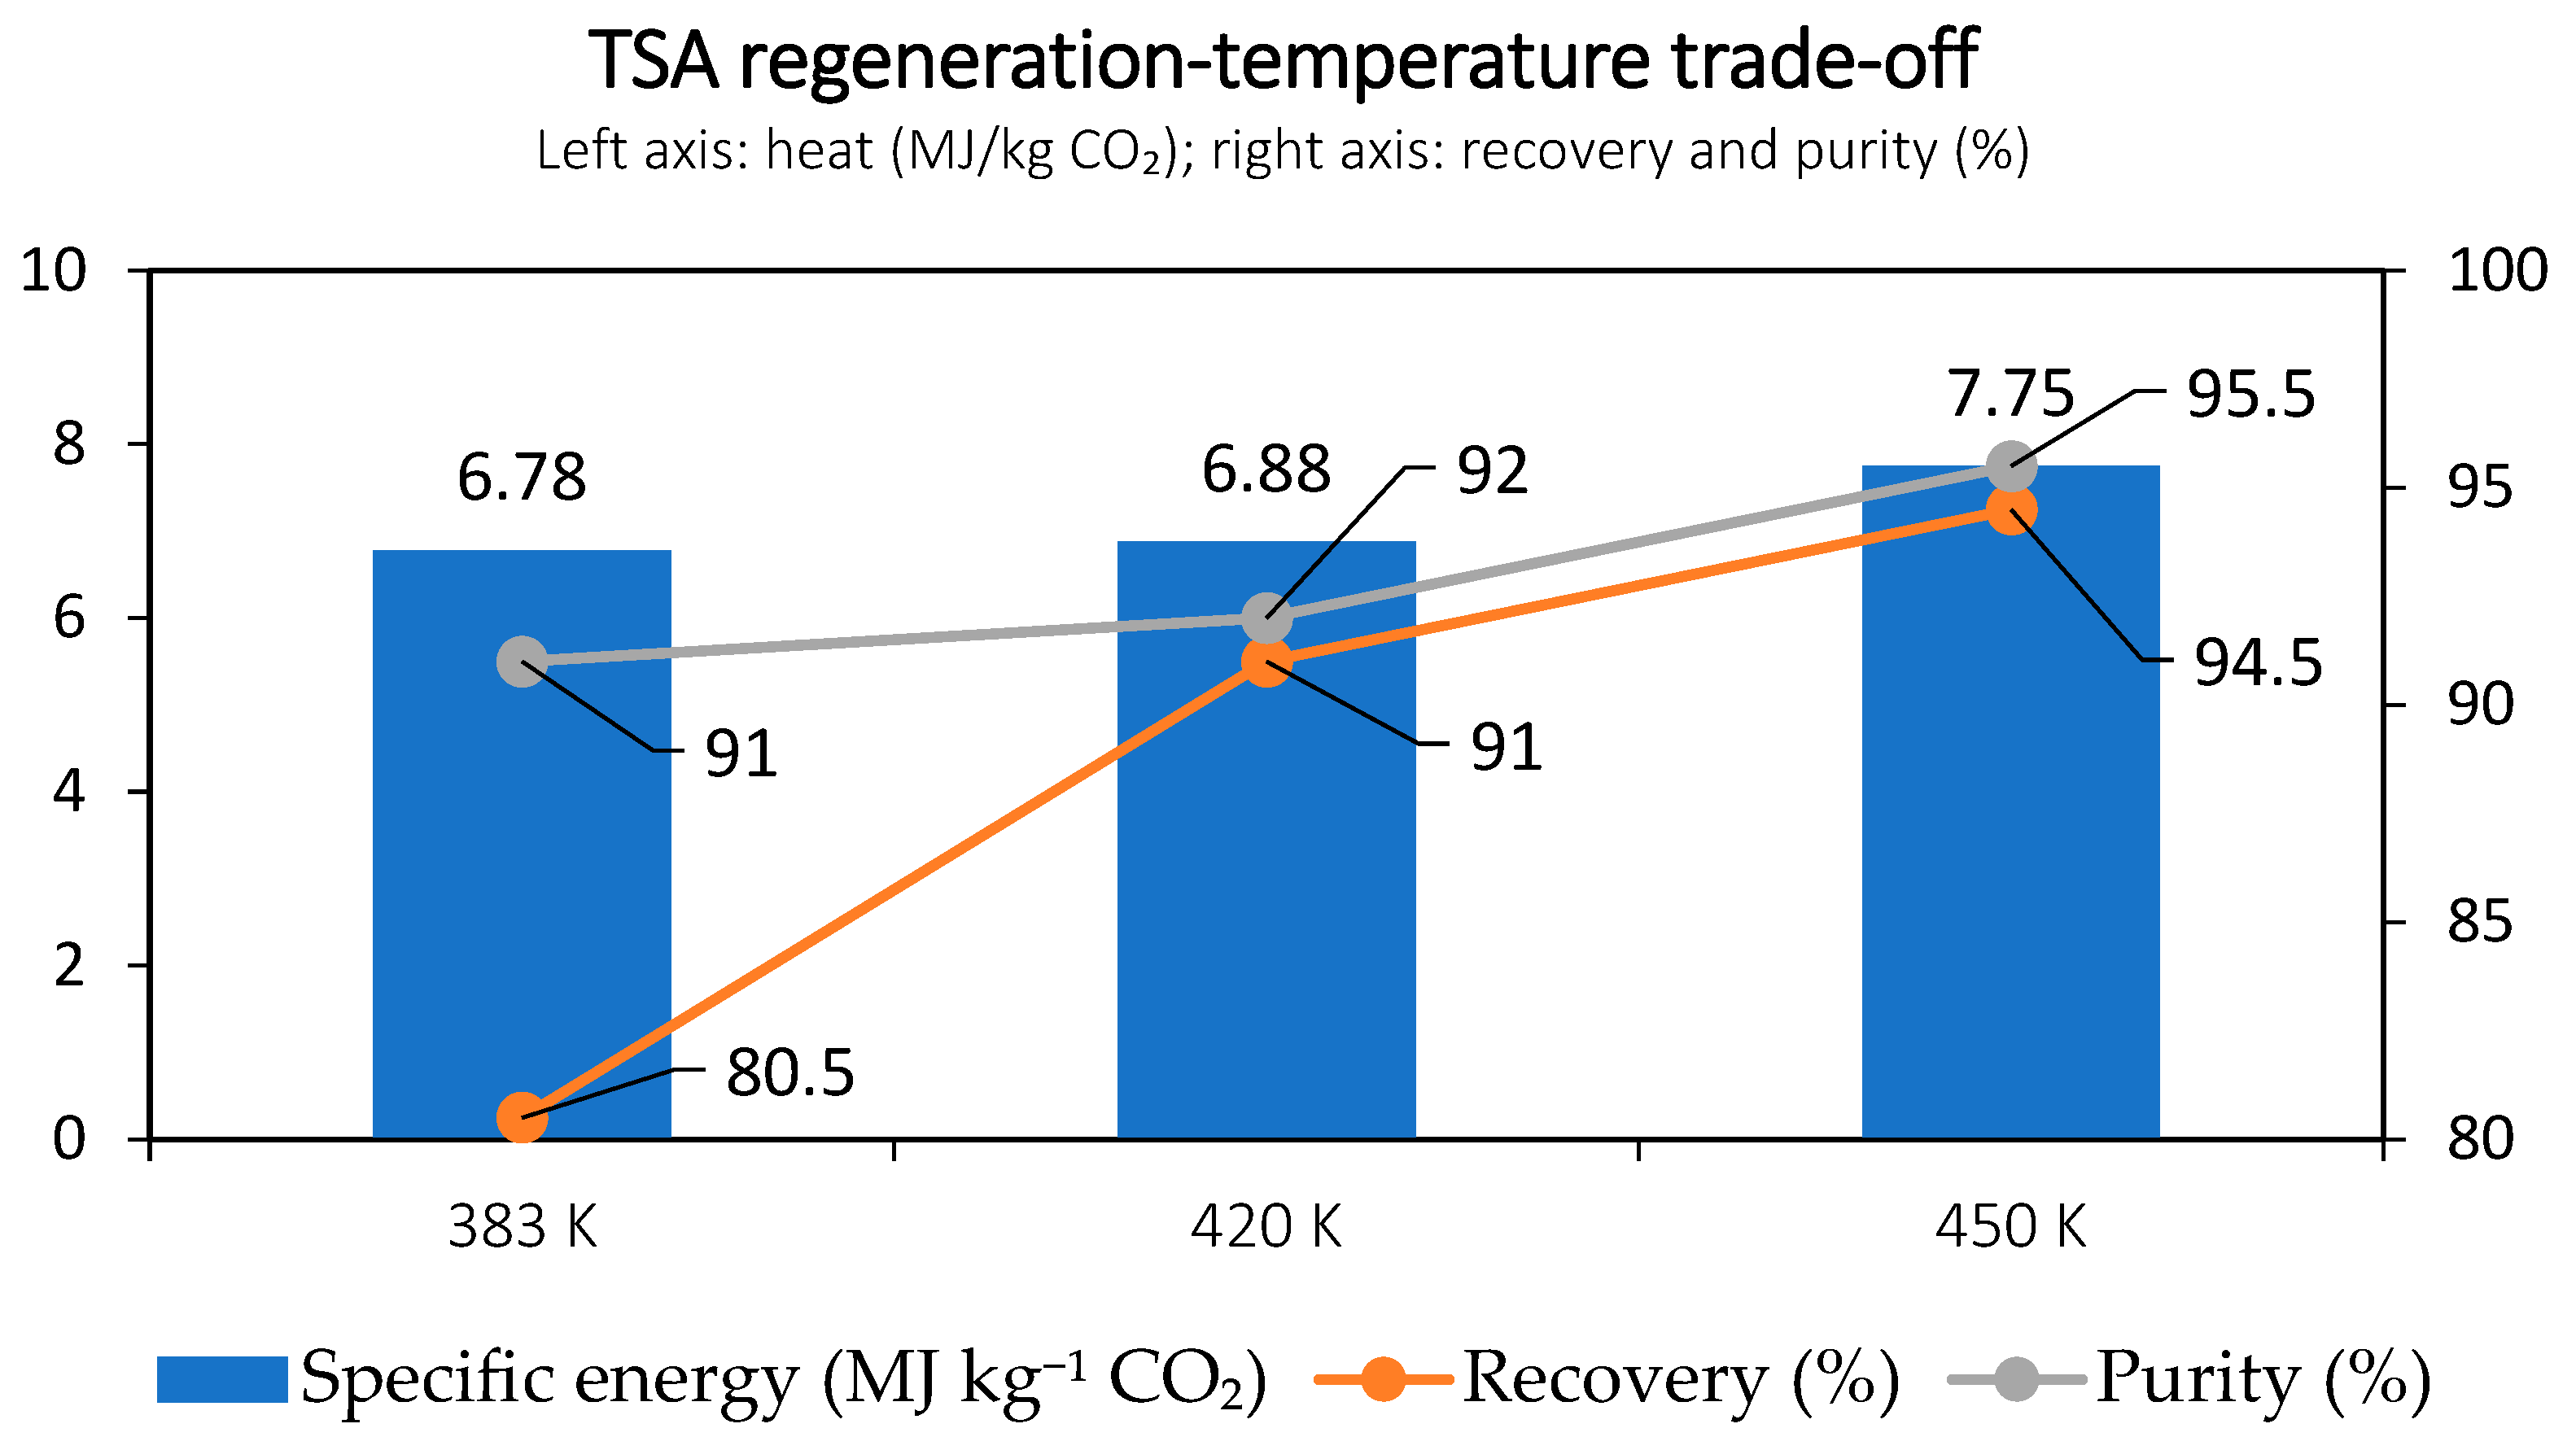
Regeneration temperature improved separation but raised heat demand and life-cycle emissions (
Figure 6). Recovery increased from 80.5% at 383 K to 94.5% at 450 K, while purity increased from 91.0% to 95.5%. Specific thermal demand rose from 6.78 to 7.75 MJ kg
−1 captured, and climate impact rose from 0.96 to 1.10 kg CO
2-eq kg
−1. At 450 K the modeled utility emissions exceeded one kilogram of CO
2-equivalent per kilogram captured, producing a negative capture-unit balance. Mechanistically, heating lowers the equilibrium affinity of 13X for CO
2 and releases more of the adsorbed inventory, improving cyclic working capacity. The bed and heat-exchanger mass, purge gas, and desorption enthalpy must also be heated; their sensible-heat contribution grows approximately with the regeneration temperature rise. When the incremental CO
2 recovered grows more slowly than heat input, thermal MJ per kilogram captured and steam-related emissions increase, as observed here.
Figure 6.
TSA recovery, product purity, and specific thermal demand as regeneration temperature increases for the 35 mol% CO2 feed. Functional unit: 1 kg captured CO2; gate-to-gate capture boundary with a dry 35 mol% CO2/N2 feed. Downstream conversion is excluded.
Figure 6.
TSA recovery, product purity, and specific thermal demand as regeneration temperature increases for the 35 mol% CO2 feed. Functional unit: 1 kg captured CO2; gate-to-gate capture boundary with a dry 35 mol% CO2/N2 feed. Downstream conversion is excluded.
3.3. PSA and VPSA Sensitivity
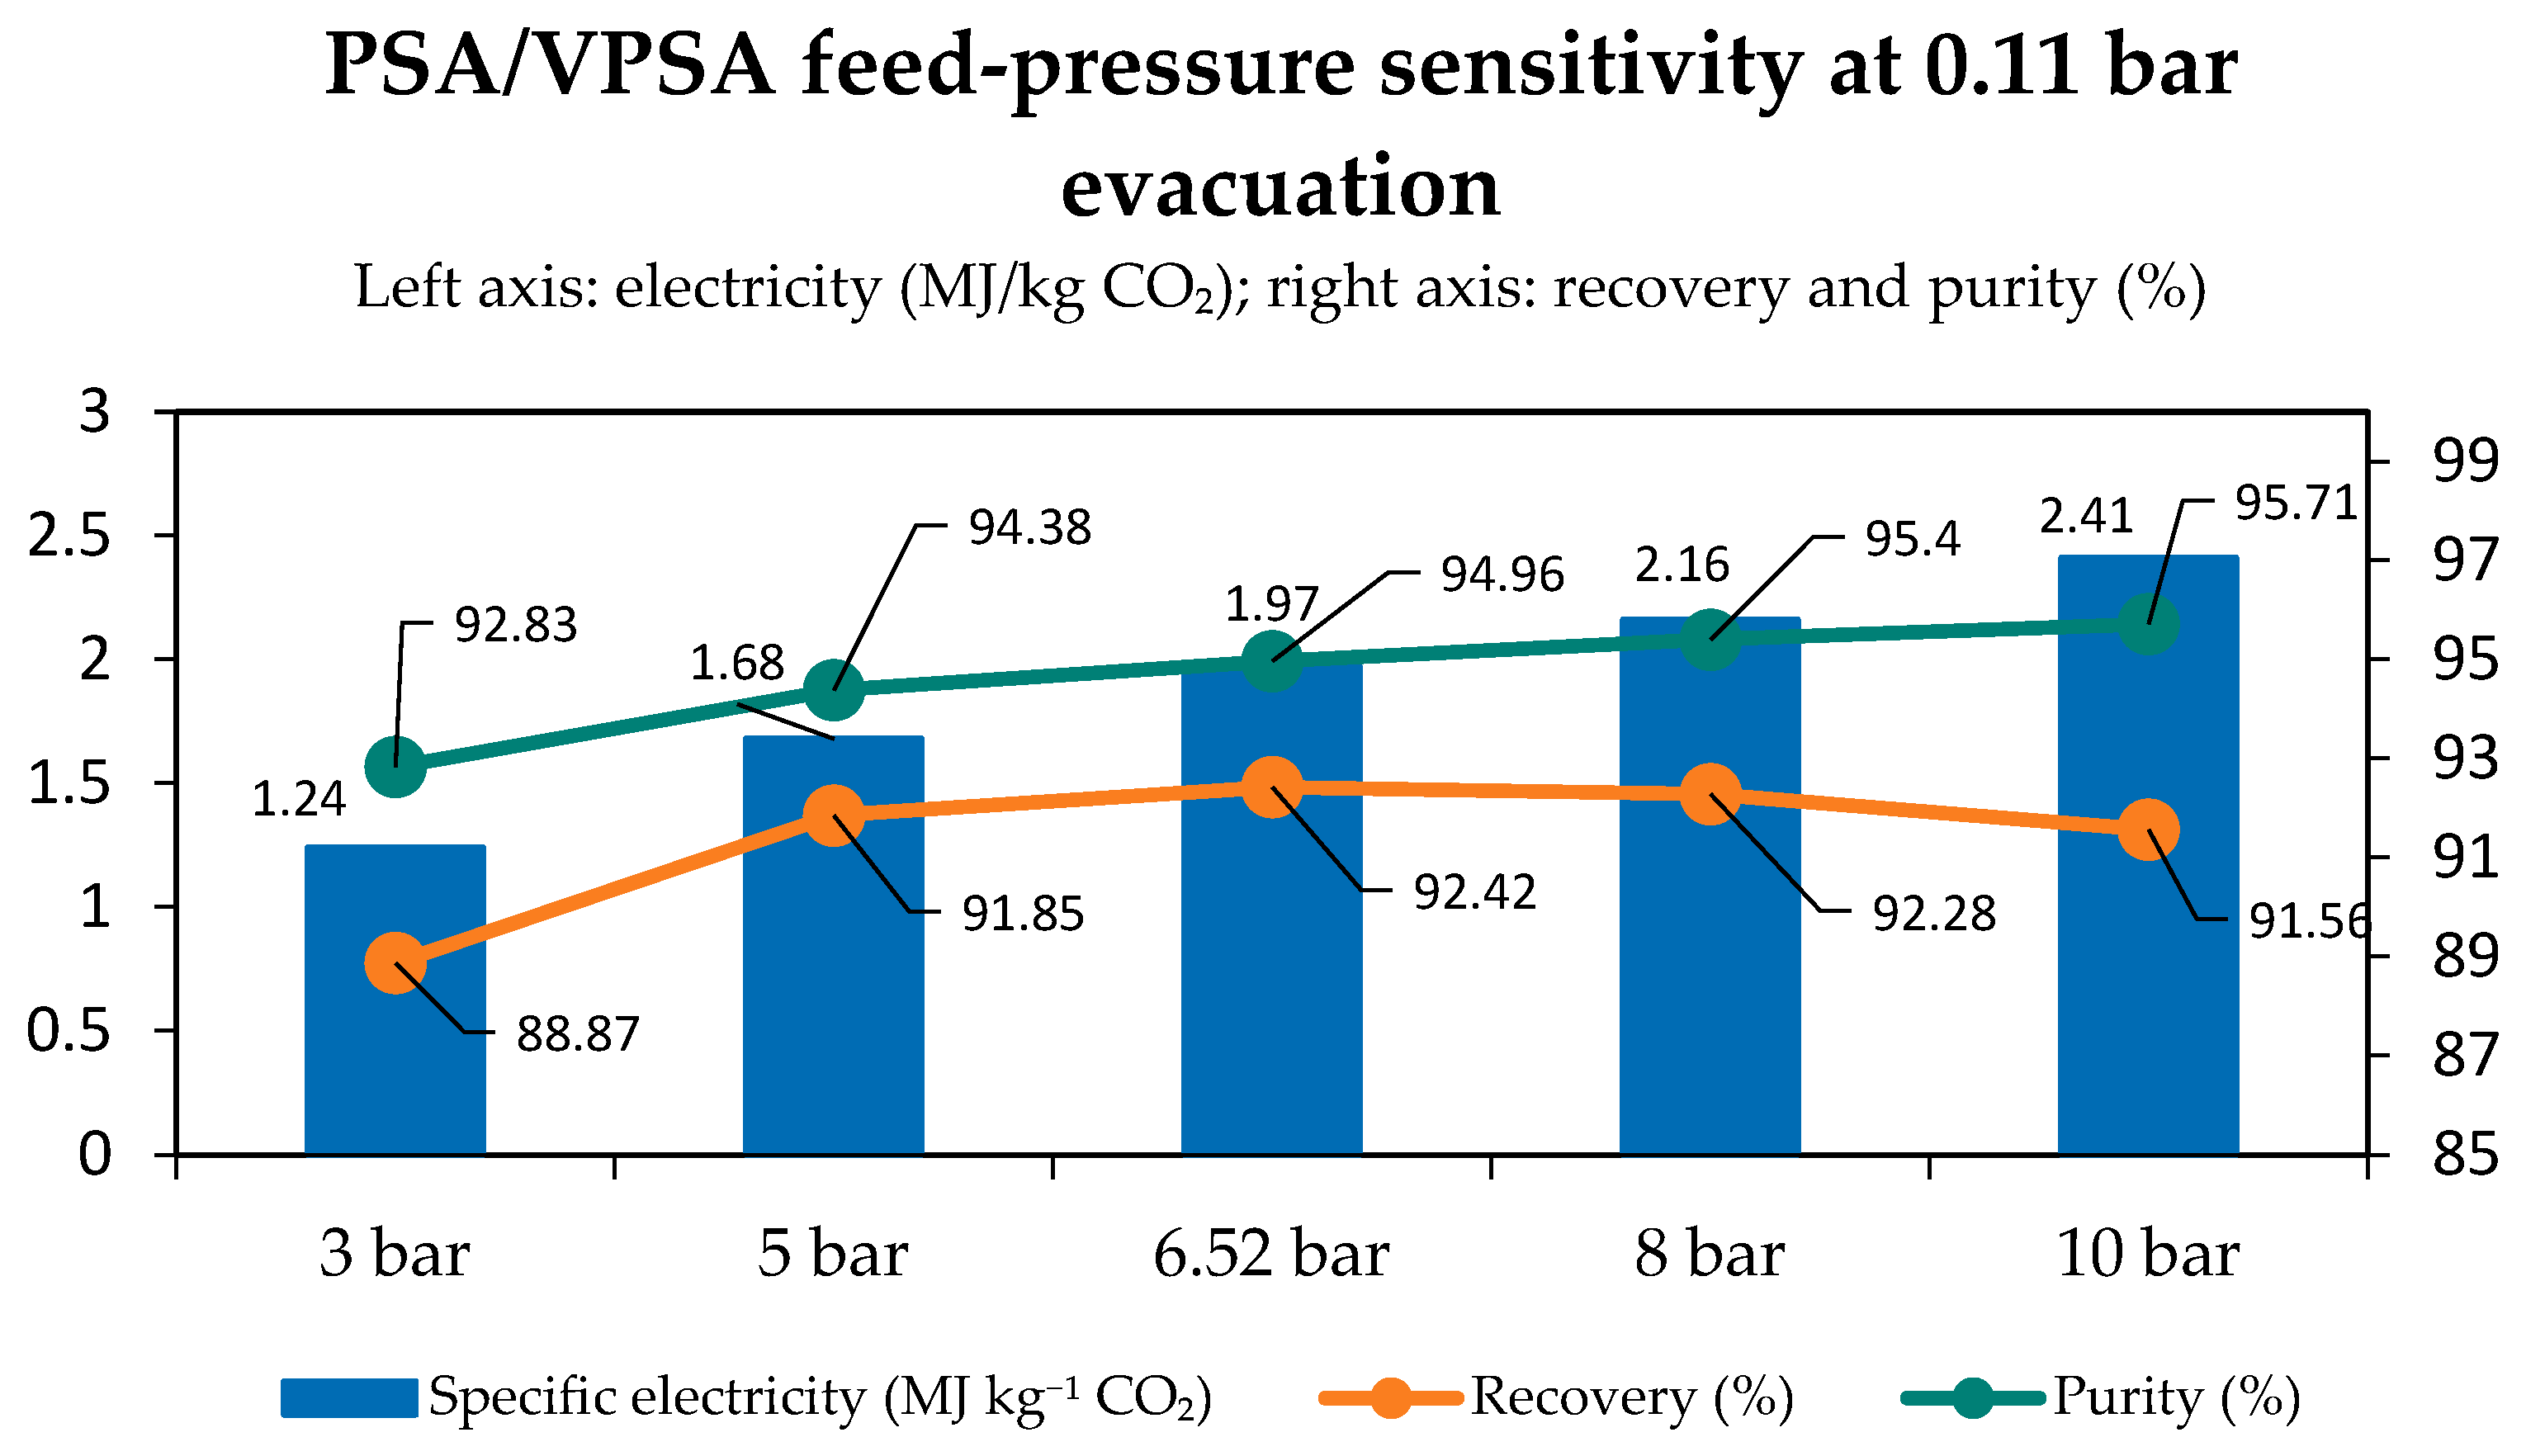
At 0.11 bar evacuation, increasing feed pressure from 3 to 10 bar produced only modest gains in purity and no sustained gain in recovery (
Figure 7). Purity rose from 92.83% to 95.71%, but recovery peaked at 92.42% near 6.52 bar and declined slightly at higher pressure. Electricity increased continuously from 1.24 to 2.41 MJ kg
−1 captured. The additional compression work therefore bought little separation improvement above moderate pressure. At rising CO
2 partial pressure, the dual-site Langmuir loading approaches site saturation, so the additional working capacity gained per bar diminishes. At the fixed 0.11 bar evacuation pressure, the marginal separation gain is therefore limited, while feed compression work keeps increasing. The plateau reflects the modeled 13X equilibrium and cycle and does not represent a global pressure optimum.
Evacuation depth strongly affected cyclic capacity. At 6.52 bar feed, raising the regeneration pressure from 0.11 to 0.22 and 0.33 bar reduced recovery from 92.42% to 76.00% and 60.74%, respectively. Purity declined less sharply, from 94.96% to 94.40% and 92.75%. Shallower evacuation left more CO2 on the adsorbent and reduced the amount captured in the next cycle. When normalized to captured mass, specific electricity rose to 2.07 and 2.59 MJ kg−1 for the two weaker-vacuum cases.
Figure 7.
PSA/VPSA sensitivity to feed pressure at 0.11 bar evacuation for the 35 mol% CO2 feed. Functional unit: 1 kg captured CO2; gate-to-gate capture boundary with a dry 35 mol% CO2/N2 feed. Downstream conversion is excluded.
Figure 7.
PSA/VPSA sensitivity to feed pressure at 0.11 bar evacuation for the 35 mol% CO2 feed. Functional unit: 1 kg captured CO2; gate-to-gate capture boundary with a dry 35 mol% CO2/N2 feed. Downstream conversion is excluded.
3.4. Integrated Technical and Environmental Comparison
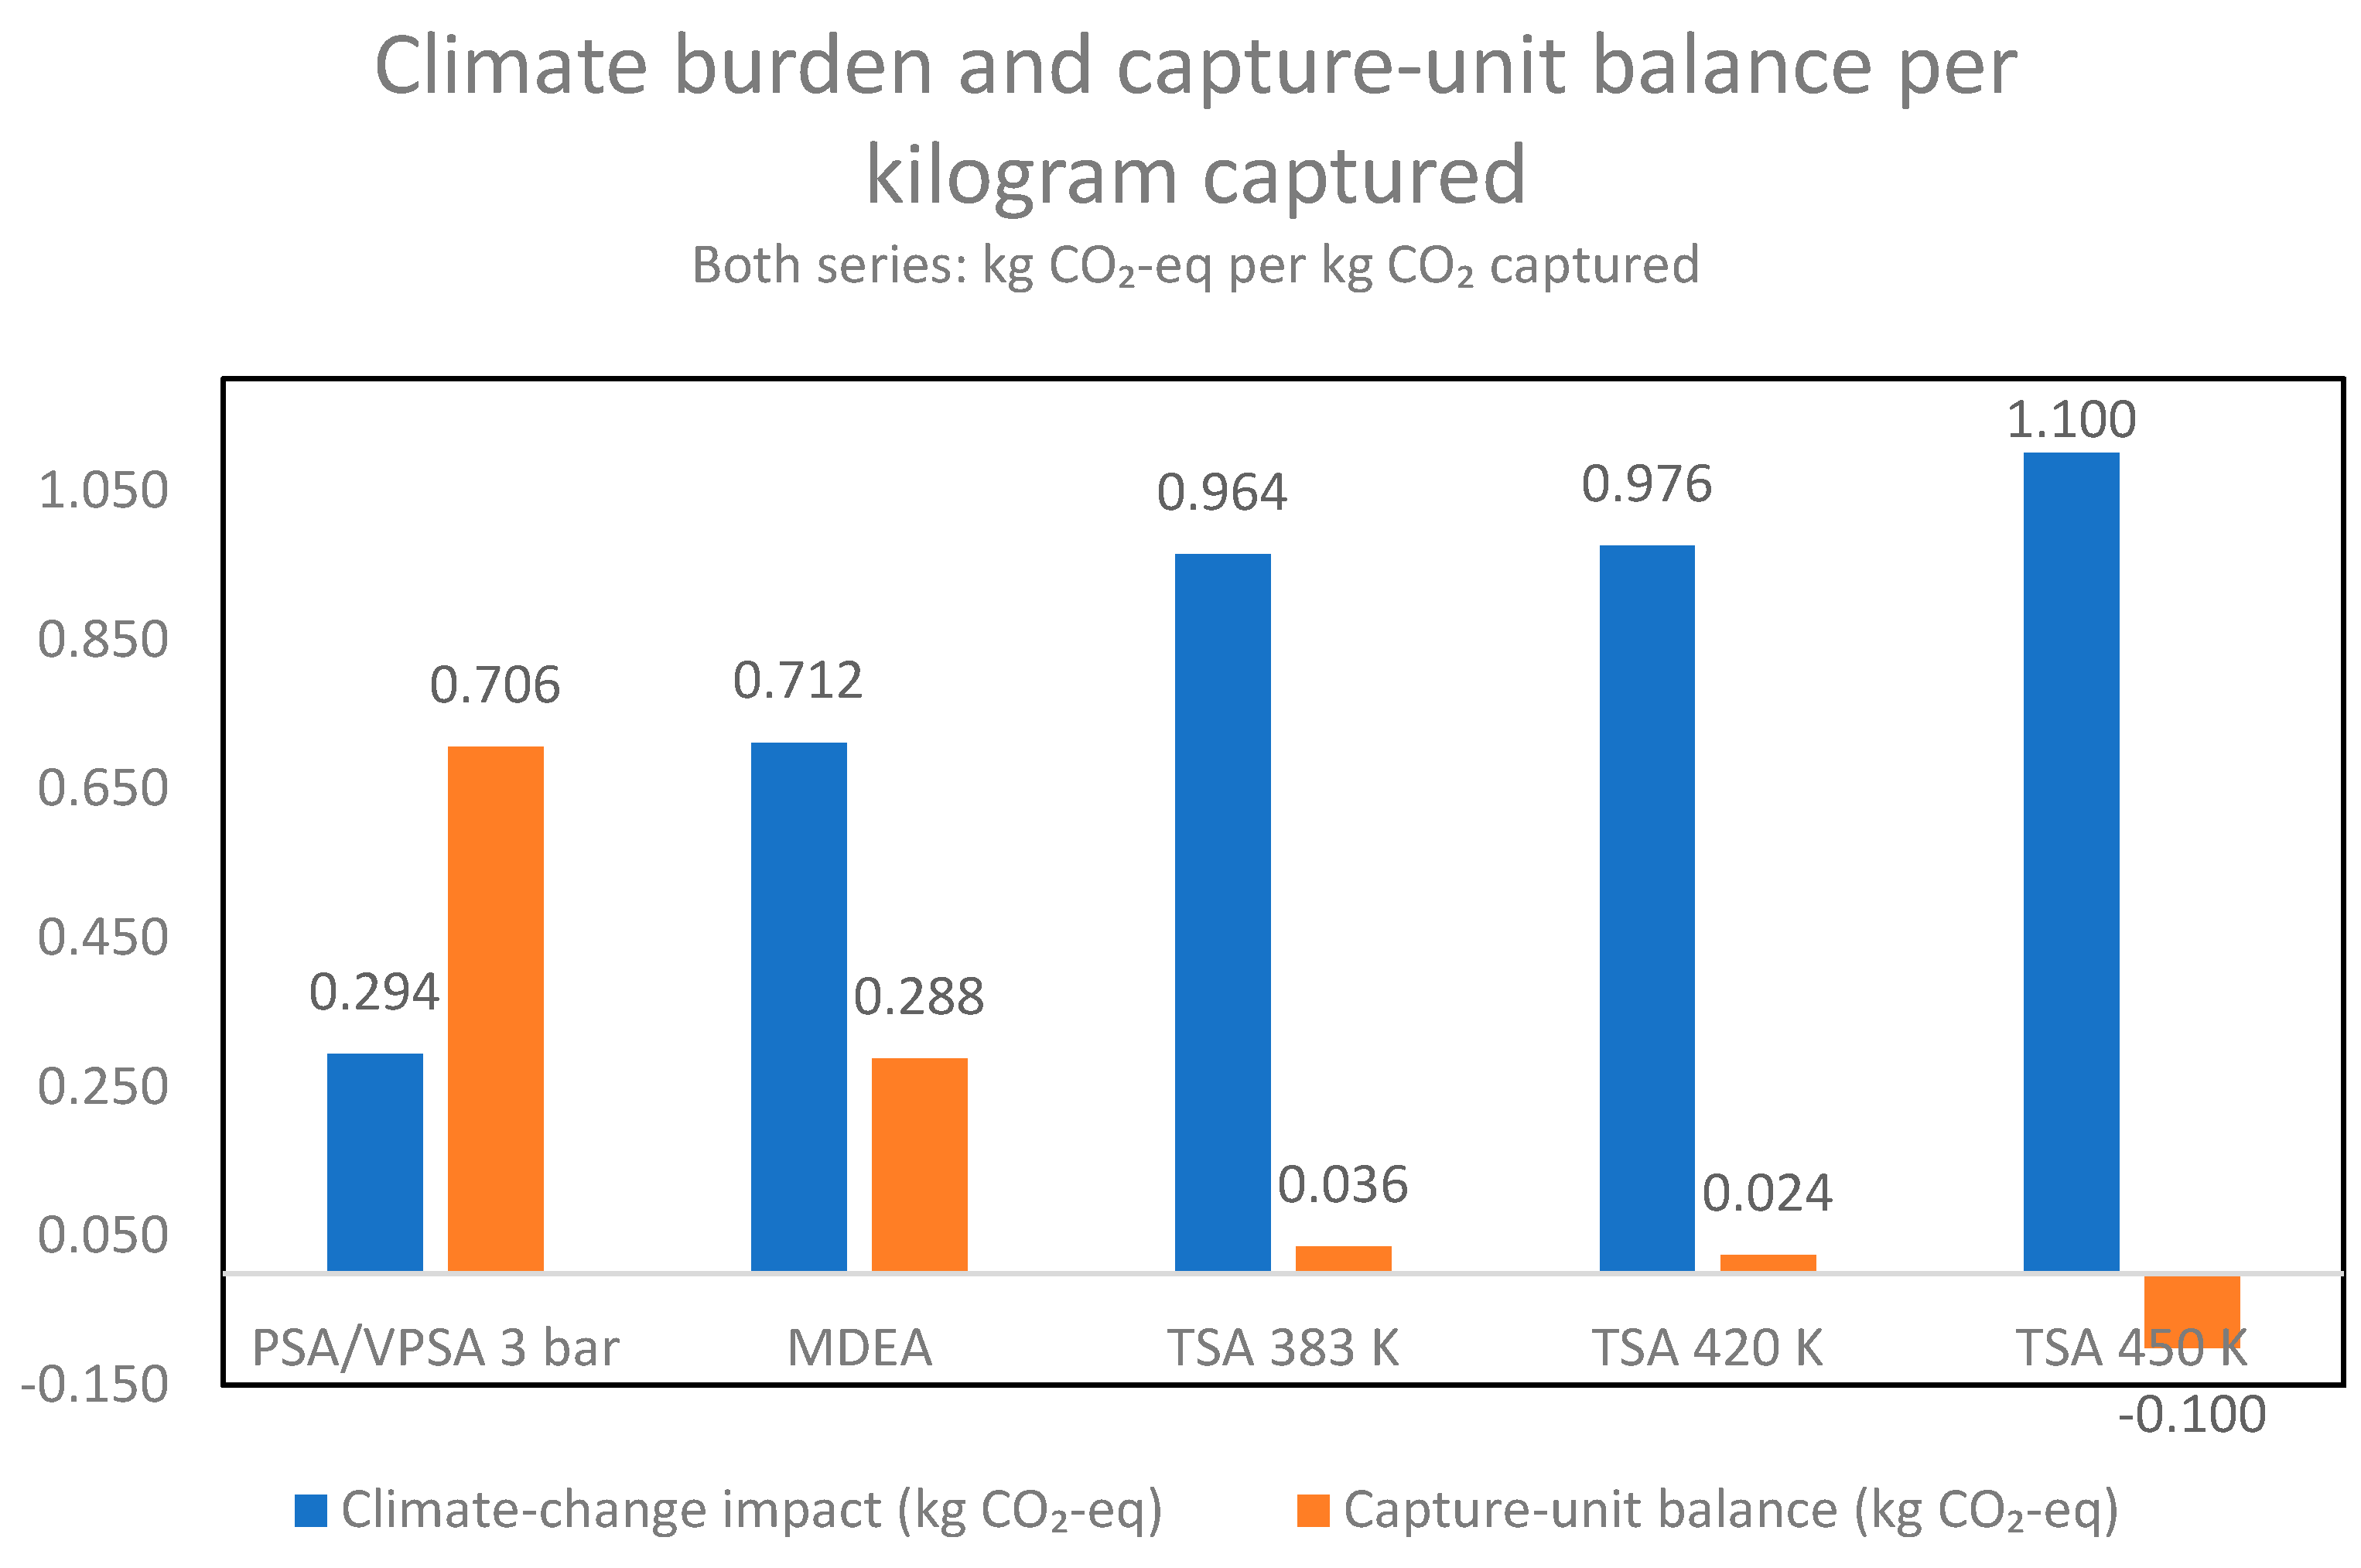
Table 3 summarizes the technical performance and climate impact of all configurations, and
Figure 8 compares representative cases. Among the configurations, PSA/VPSA at 3 bar has the lowest ICC and a capture-unit balance of 0.706 kg CO
2-eq per kilogram captured, compared with 0.288 for MDEA. TSA at 383 and 420 K retains only 0.036 and 0.024 kg, and TSA at 450 K has a balance of −0.100 kg. TEI gives the same ordering between technologies but is not used as an independent selection rule because of the different purity bases.
Figure 8.
Climate-change impact and capture-unit balance (1 kg captured minus ICC) for representative configurations. The balance is an accounting quantity, not atmospheric removal. Functional unit: 1 kg captured CO2; gate-to-gate capture boundary with a dry 35 mol% CO2/N2 feed; downstream conversion excluded.
Figure 8.
Climate-change impact and capture-unit balance (1 kg captured minus ICC) for representative configurations. The balance is an accounting quantity, not atmospheric removal. Functional unit: 1 kg captured CO2; gate-to-gate capture boundary with a dry 35 mol% CO2/N2 feed; downstream conversion excluded.
3.5. Operating Cost Screen
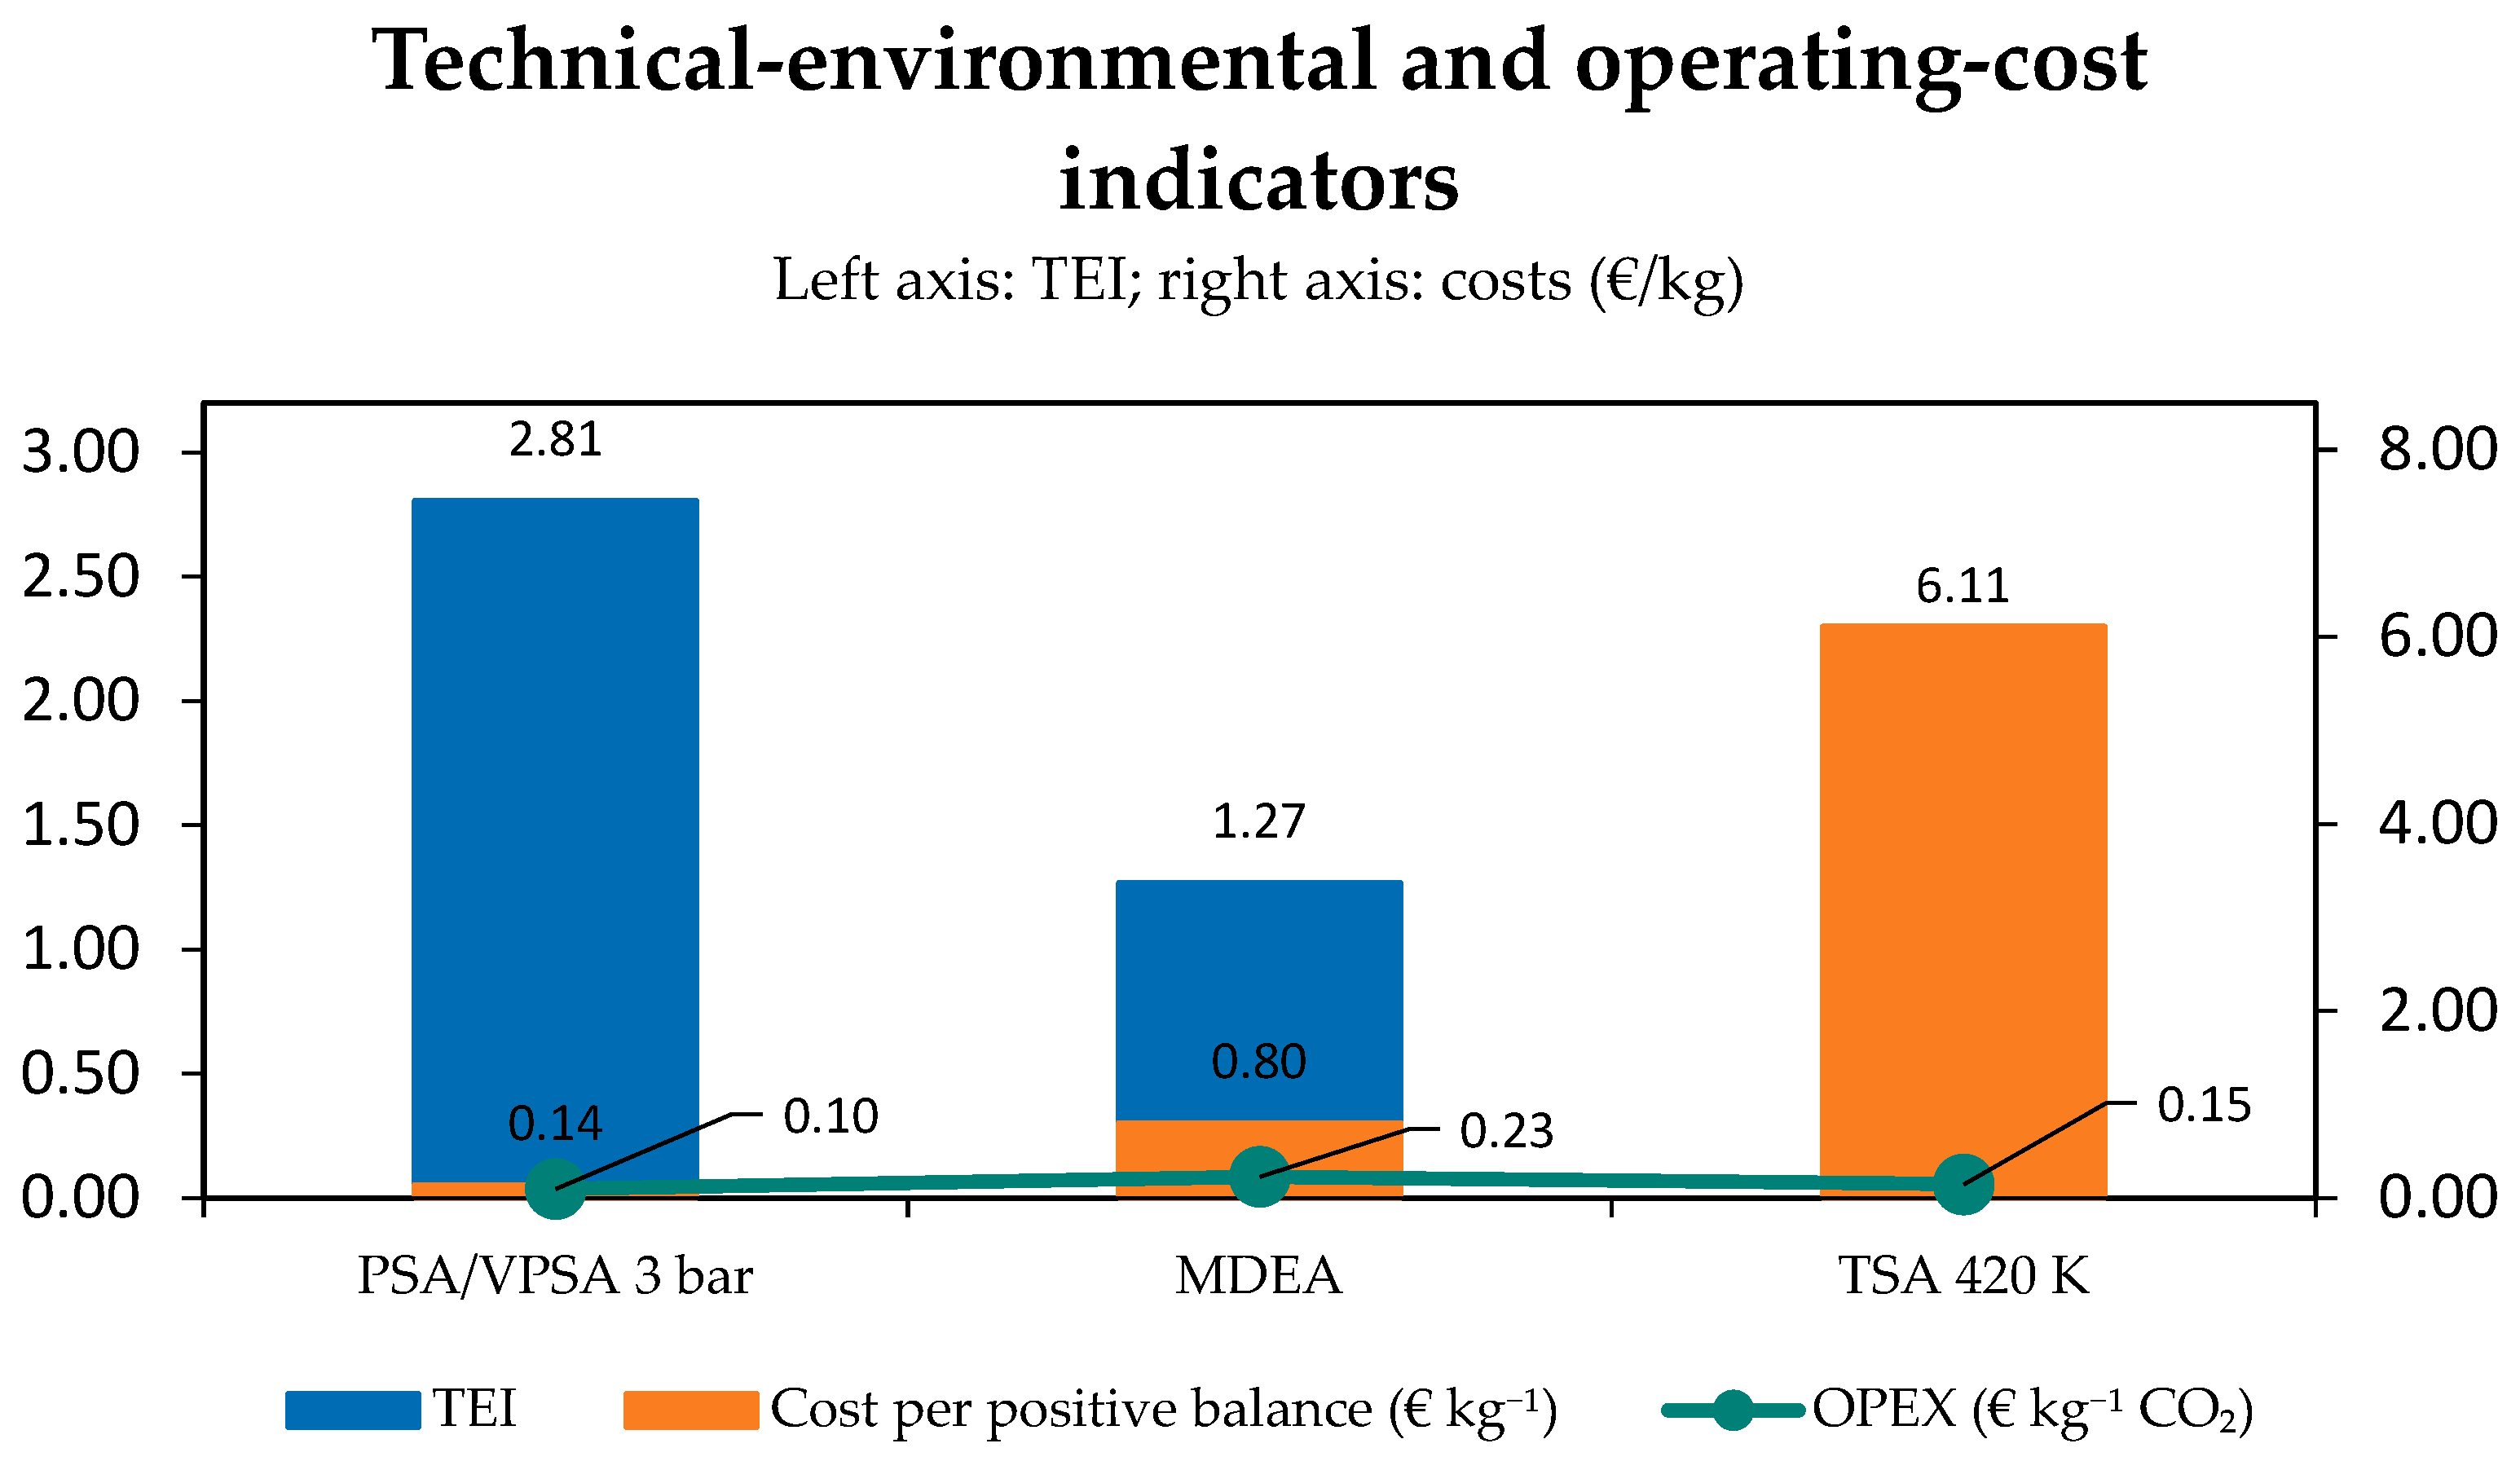
With the quantities in
Table A2 and the prices in
Table 2, OPEX is approximately €0.100 kg
−1 for PSA/VPSA at 3 bar, €0.230 kg
−1 for MDEA and €0.147 kg
−1 for TSA at 420 K (
Figure 9). Dividing by the positive capture-unit balances of 0.706, 0.288 and 0.024 kg CO
2-eq per kilogram captured gives approximately €0.14, €0.80 and €6.11 per kilogram of positive balance. The TSA value is highly sensitive to its small denominator: changing ICC from 0.976 to 0.966 or 0.986 at the same OPEX gives approximately €4.31 or €10.47 kg
−1. A positive balance requires ICC < 1 but does not by itself demonstrate a climate benefit after conversion, product use and carbon fate.
Figure 9.
TEI, OPEX and cost per unit of positive capture-unit balance. TSA at 450 K is omitted from the cost per positive balance because ICC = 1.100.
Figure 9.
TEI, OPEX and cost per unit of positive capture-unit balance. TSA at 450 K is omitted from the cost per positive balance because ICC = 1.100.
4. Discussion
4.1. Selection for Artificial Photosynthesis
Under the dry-feed and European utility assumptions, low-pressure PSA/VPSA has the lowest ICC and OPEX among the configurations meeting the purity threshold. The 3 bar case already exceeded 92% purity, while higher feed pressure added compression demand faster than it improved product quality. Published PSA work at 13.5 mol% CO
2 likewise identified feed pressure near 3.66 atm and deep vacuum as an effective compromise, with 89.2% purity, 88.2% recovery, and 1.17 GJ t
−1 CO
2 mechanical demand [
20]. The similar pressure trend provides qualitative context, although direct comparison is limited by feed composition, cycle structure, bed geometry, and adsorbent properties.
The product-purity requirement must be defined with the downstream reactor. A 92.83% CO2 stream may be adequate after polishing or recycle, but nitrogen dilution can affect compression, reactor volume, and single-pass conversion. The present comparison does not quantify those downstream penalties. If the conversion section requires a substantially purer feed without polishing, a comparison after equivalent product polishing is required before preferring MDEA or a higher-pressure/multistage adsorption process. As an illustrative 99% CO2 target at unchanged CO2 recovery, residual N2 per mole of CO2 would have to fall from 0.077 to 0.010 mol, an approximately 87% reduction. Polishing or recycle would require additional separation energy; its duty depends on the selected process, pressures, and recovery target and is excluded here.
4.2. Dependence on Energy Supply
With the LCIA results in
Table 3, TSA at 420 K has ICC = 0.976 and a capture-unit balance of 0.024 kg CO
2-eq kg
−1 captured. Holding the PSA/VPSA baseline at 0.294, TSA would require a total-impact reduction of 0.682 kg CO
2-eq kg
−1 (approximately 70%) to match it; MDEA would require 0.418 kg CO
2-eq kg
−1 (approximately 59%). These are break-even reductions in total impact, not simulated outcomes for alternative heat sources. Cleaner electricity would also affect PSA/VPSA; the bounds do not establish the ordering when both heat and electricity backgrounds change.
Decarbonized-electricity and external waste-heat scenarios were not simulated. The internal MDEA lean-rich exchanger already recovers approximately 114.4 MJ h
−1; this process integration is distinct from an external waste-heat supply.
Appendix B separates foreground heat, electricity, and material quantities. Site-specific recalculation must replace the relevant utility backgrounds, retain upstream material-production burdens, and include heat-recovery equipment and auxiliary demands within the chosen boundary. Waste heat must satisfy the TSA regeneration-temperature and heat-transfer requirements, with an explicit allocation basis for its environmental burden. Decarbonizing capture-unit electricity does not automatically decarbonize zeolite manufacture.
PSA/VPSA depends on electricity carbon intensity and vacuum efficiency. Electrification is not inherently low-carbon; the result reflects the European electricity dataset used here. The favorable 3 bar case benefits from moderate feed compression and effective evacuation. Compressor and vacuum-pump isentropic efficiencies, pressure losses, moisture removal, and product compression should be represented explicitly in a scale-up model.
4.3. Limitations and Scale-Up
The results are comparative simulation outputs rather than pilot-scale guarantees. The binary dry feed excludes water and trace contaminants; zeolite 13X is hydrophilic, and competitive water adsorption can lower CO
2 capacity and increase pretreatment demand [
3,
7,
20], while SO
x and NO
x may affect adsorbent and solvent stability. The 5000-cycle zeolite life and the MDEA make-up rate are therefore uncertain inputs, and long-duration cyclic tests with conditioned flue gas are required before industrial design.
On the modeling side, the adsorption models were checked against published performance data at one operating condition, and the MDEA columns were represented by equilibrium stages with an assumed Murphree efficiency. Before the results are used for equipment design, the following steps are needed: grid- and time-step-independence studies and a documented cycle-to-cycle CSS criterion for both adsorption models; a sensitivity analysis of the mass-transfer coefficients and DSL parameters; reconciliation of the reference step schedules (
Figure 5) with the inventory cycle counts (
Table A3), which differ by up to 6% for PSA/VPSA; and validation of the MDEA model against a rate-based column description.
The LCA is gate-to-gate and excludes plant construction, pretreatment, inlet conditioning, nitrogen-purge production, auxiliary electricity for MDEA and TSA, downstream product compression, transport, artificial-photosynthesis conversion and end use; the economic analysis excludes CAPEX. Some of these omissions affect the technologies asymmetrically and could change the ordering between closely spaced cases. The results therefore represent a screening at the specified conditions rather than a robust industrial ranking or a demonstration of whole-chain carbon negativity.
5. Conclusions
The simulations show a trade-off between separation performance, utility demand and operating cost. MDEA achieves 95% recovery and approximately 95% wet-product purity with 3.96 MJ kg−1 of regeneration heat and ICC = 0.712. TSA performance improves with regeneration temperature, reaching 94.5% recovery and 95.5% purity at 450 K, but ICC = 1.100 then gives a negative capture-unit balance under the assumed European heat supply. Neither value establishes a climate benefit for the complete conversion chain.
PSA/VPSA at 3 bar feed and 0.11 bar evacuation has the lowest ICC and OPEX among the cases meeting the >90% purity threshold: 88.87% recovery, 92.83% purity, 1.24 MJ kg−1 of electricity, ICC = 0.294, TEI = 2.81 and OPEX ≈ €0.100 kg−1. Its lower recovery is a trade-off rather than a universally superior result, and higher feed pressure gives only modest purity gains at a larger energy demand.
These conclusions are restricted to a pretreated dry 35 mol% CO2 feed and the capture-unit boundary. Numerical verification of the adsorption models, feed conditioning, common product specifications, CAPEX, alternative utility supplies and other absorption solvents are the next steps toward a robust technology ranking for artificial-photosynthesis feeds.
Author Contributions
Conceptualization, D.S. and A.C.; methodology, K.V. and A.C.; software, validation, formal analysis, investigation, data curation, and visualization, K.V.; writing—original draft, K.V.; writing—review and editing, R.G., F.T., A.C., and D.S.; supervision, D.S. and A.C. All authors have read and agreed to the published version of the manuscript.
Funding
This research received no external funding.
Data Availability Statement
The data supporting the reported results are included in the article and its appendices. The Aspen Plus, Aspen Adsorption and OpenLCA model files are available from the corresponding author upon reasonable request.
Conflicts of Interest
The authors declare no conflicts of interest.
Abbreviations
| ELECNRTL | Electrolyte non-random two-liquid model |
| LCA | Life-cycle assessment |
| LCIA | Life-cycle impact assessment |
| LDF | Linear driving force |
| MDEA | Methyldiethanolamine |
| OPEX | Operating expenditure |
| PSA | Pressure swing adsorption |
| TEI | Technical-environmental index |
| TSA | Temperature swing adsorption |
| VPSA | Vacuum pressure swing adsorption |
| CAPEX | Capital expenditure |
| CSS | Cyclic steady state |
| DSL | Dual-site Langmuir |
| ICC | Impact on climate change |
| LCI | Life-cycle inventory |
| SEC | Specific energy consumption |
Appendix A. Adsorption Equilibrium Parameters
For component i and site s, the temperature dependence and competitive two-site loading are given in Equations (A1)–(A3), with T in kelvin and partial pressures in Pa. The same coefficient set was used in the TSA and PSA/VPSA models [
22].
Table A1.
Dual-site Langmuir coefficients for zeolite 13X [
22].
Table A1.
Dual-site Langmuir coefficients for zeolite 13X [
22].
| Coefficient | Unit | CO2 Site 1 | CO2 Site 2 | N2 Site 1 | N2 Site 2 |
|---|
| k1 | mol/kg | 2.82 | 3.97 | 1.89 | 1.89 |
| k2 | mol/(kg K) | −3.50 × 10⁻⁴ | −4.95 × 10⁻³ | −2.25 × 10⁻⁴ | −2.25 × 10⁻⁴ |
| k3 | 1/Pa | 2.83 × 10⁻⁹ | 4.41 × 10⁻⁹ | 1.16 × 10⁻⁹ | 1.16 × 10⁻⁹ |
| k4 | K | 2598.20 | 3594.07 | 1944.61 | 1944.61 |
Appendix B. Separated Energy and Material Inventories
Foreground quantities below are normalized to one kilogram of captured CO
2 [
22]. Active-material entries allocate the initial charge and replacements over the service life; they do not include construction materials or equipment and are not characterized climate-change contributions.
Table A2.
Separated foreground energy and material inventories per kilogram of captured CO
2 [
22].
Table A2.
Separated foreground energy and material inventories per kilogram of captured CO
2 [
22].
| Configuration | Heat [MJ/kg CO2] | Electricity [MJ/kg CO2] | Material | Material [kg/kg CO2] |
|---|
| MDEA | 3.96 | Not itemized | MDEA | 0.0985 |
| TSA 383 K | 6.78 | Not itemized | Zeolite 13X | 0.00354 |
| TSA 420 K | 6.88 | Not itemized | Zeolite 13X | 0.00269 |
| TSA 450 K | 7.75 | Not itemized | Zeolite 13X | 0.00256 |
| PSA/VPSA 3 bar; 0.11 bar evacuation | No thermal regeneration modeled | 1.24 (0.344 kWh) | Zeolite 13X | 0.00840 |
For an alternative energy supply, ICC can be recalculated as heat demand × heat emission factor + electricity demand × electricity emission factor + Σ (material quantity × material production factor), with consistent units and a functional unit.
Table A3.
Annual cycle counts, corresponding cycle durations and bed numbers used in the inventory [
22].
Table A3.
Annual cycle counts, corresponding cycle durations and bed numbers used in the inventory [
22].
| Configuration | Cycles year−1 | Cycle Duration [s] | Beds |
|---|
| TSA 383 K | 5868.00 | 5000.0 | 13 |
| TSA 420 K | 5927.27 | 4950.0 | 11 |
| TSA 450 K | 5927.27 | 4950.0 | 11 |
| PSA/VPSA 3 bar | 130,400.00 | 225.0 | 7 |
| PSA/VPSA 5 bar | 124,851.06 | 235.0 | 7 |
| PSA/VPSA 6.52 bar | 122,250.00 | 240.0 | 7 |
| PSA/VPSA 8 bar | 119,755.10 | 245.0 | 7 |
| PSA/VPSA 10 bar | 117,360.00 | 250.0 | 8 |
References
- Boot-Handford, M.E.; Abanades, J.C.; Anthony, E.J.; Blunt, M.J.; Brandani, S.; Mac Dowell, N.; Fernández, J.R.; Ferrari, M.-C.; Gross, R.; Hallett, J.P.; et al. Carbon capture and storage update. Energy Environ. Sci. 2014, 7, 130–189. [Google Scholar] [CrossRef] [Scilit]
- Wang, J.; Huang, L.; Yang, R.; Zhang, Z.; Wu, J.; Gao, Y.; Wang, Q.; O’HAre, D.; Zhong, Z. Recent advances in solid sorbents for CO2 capture and new development trends. Energy Environ. Sci. 2014, 7, 3478–3518. [Google Scholar] [CrossRef] [Scilit]
- Yu, C.-H.; Huang, C.-H.; Tan, C.-S. A review of CO2 capture by absorption and adsorption. Aerosol Air Qual. Res. 2012, 12, 745–769. [Google Scholar] [CrossRef] [Scilit]
- Samanta, A.; Zhao, A.; Shimizu, G.K.H.; Sarkar, P.; Gupta, R. Post-combustion CO2 capture using solid sorbents: A review. Ind. Eng. Chem. Res. 2012, 51, 1438–1463. [Google Scholar] [CrossRef] [Scilit]
- Ntiamoah, A.; Ling, J.; Xiao, P.; Webley, P.A.; Zhai, Y. CO2 capture by temperature swing adsorption: Use of hot CO2-rich gas for regeneration. Ind. Eng. Chem. Res. 2016, 55, 703–713. [Google Scholar] [CrossRef] [Scilit]
- Alibolandi, M.; Sadrameli, S.M.; Rezaee, F.; Towfighi Darian, J. Separation of CO2/N2 mixture by vacuum pressure swing adsorption (VPSA) using zeolite 13X type and carbon molecular sieve adsorbents. Heat Mass Transf. 2020, 56, 1985–1994. [Google Scholar] [CrossRef] [Scilit]
- Islam, M.H.; Patlolla, S.R. A review on the state-of-the-art and commercial status of carbon capture technologies. Energies 2025, 18, 3937. [Google Scholar] [CrossRef] [Scilit]
- Cormos, A.-M.; Dragan, S.; Petrescu, L.; Sandu, V.; Cormos, C.-C. Techno-economic and environmental evaluations of decarbonized fossil-intensive industrial processes by reactive absorption and adsorption CO2 capture systems. Energies 2020, 13, 1268. [Google Scholar] [CrossRef] [Scilit]
- Rochelle, G.T. Amine scrubbing for CO2 capture. Science 2009, 325, 1652–1654. [Google Scholar] [CrossRef] [Scilit]
- Chakma, A. CO2 capture processes—Opportunities for improved energy efficiencies. Energy Convers. Manag. 1997, 38, S51–S56. [Google Scholar] [CrossRef] [Scilit]
- Notz, R.; Mangalapally, H.P.; Hasse, H. Post combustion CO2 capture by reactive absorption: Pilot plant description and results of systematic studies with MEA. Int. J. Greenh. Gas Control 2012, 6, 84–112. [Google Scholar] [CrossRef] [Scilit]
- Lawal, A.; Wang, M.; Stephenson, P.; Obi, O. Demonstrating full-scale post-combustion CO2 capture for coal-fired power plants through dynamic modelling and simulation. Fuel 2012, 101, 115–128. [Google Scholar] [CrossRef] [Scilit]
- Zhang, Y.; Chen, C.-C. Thermodynamic Modeling for CO2 Absorption in Aqueous MDEA Solution with Electrolyte NRTL Model. Ind. Eng. Chem. Res. 2011, 50, 163–175. [Google Scholar] [CrossRef] [Scilit]
- Girimonte, R.; Formisani, B.; Testa, F. Adsorption of CO2 on a confined fluidized bed of pelletized 13X zeolite. Powder Technol. 2017, 311, 9–17. [Google Scholar] [CrossRef] [Scilit]
- Caravella, A.; Prenesti, G.; De Luca, S.; Turano, M.; Testa, F.; Girimonte, R. Evaluation of CO2 Adsorption Parameters in Fluidised Zeolite 13X Beds Using Non-Linear Multivariate Optimisation. Separations 2023, 10, 558. [Google Scholar] [CrossRef] [Scilit]
- Morales-Ospino, R.; Santiago, R.G.; Siqueira, R.M.; de Azevedo, D.C.S.; Bastos-Neto, M. Assessment of CO2 desorption from 13X zeolite for a prospective TSA process. Adsorption 2020, 26, 813–824. [Google Scholar] [CrossRef] [Scilit]
- Wilkins, N.S.; Rajendran, A. Measurement of competitive CO2 and N2 adsorption on zeolite 13X for post-combustion CO2 capture. Adsorption 2019, 25, 115–133. [Google Scholar] [CrossRef] [Scilit]
- Nikolaidis, G.N.; Kikkinides, E.S.; Georgiadis, M.C. A model-based approach for the evaluation of new zeolite 13X-based adsorbents for the efficient post-combustion CO2 capture using P/VSA processes. Chem. Eng. Res. Des. 2018, 131, 362–374. [Google Scholar] [CrossRef] [Scilit]
- Haghpanah, R.; Nilam, R.; Rajendran, A.; Farooq, S.; Karimi, I.A. Cycle synthesis and optimization of a VSA process for post-combustion CO2 capture. AIChE J. 2013, 59, 4735–4748. [Google Scholar] [CrossRef] [Scilit]
- Cheng, C.-Y.; Kuo, C.-C.; Yang, M.-W.; Zhuang, Z.-Y.; Lin, P.-W.; Chen, Y.-F.; Yang, H.-S.; Chou, C.-T. CO2 capture from flue gas of a coal-fired power plant using three-bed PSA process. Energies 2021, 14, 3582. [Google Scholar] [CrossRef] [Scilit]
- Zanco, S.E.; Pérez-Calvo, J.-F.; Gasós, A.; Cordiano, B.; Becattini, V.; Mazzotti, M. Postcombustion CO2 Capture: A Comparative Techno-Economic Assessment of Three Technologies Using a Solvent, an Adsorbent, and a Membrane. ACS Eng. Au 2021, 1, 50–72. [Google Scholar] [CrossRef] [Scilit]
- Virdiglione, K. Simulazione di Processo e Analisi Energetica Dell’Assorbimento Chimico e Adsorbimento per la Separazione Della CO2 Post-Combustione nel Processo di Fotosintesi Artificiale. Master’s Thesis, University of Calabria, Rende, Italy, 2025. [Google Scholar]
- Chen, L.; Deng, S.; Zhao, R.; Zhu, Y.; Zhao, L.; Li, S. Temperature swing adsorption for CO2 capture: Thermal design and management on adsorption bed with single-tube/three-tube internal heat exchanger. Appl. Therm. Eng. 2021, 199, 117538. [Google Scholar] [CrossRef] [Scilit]
- Liu, B.; Lian, Y.; Li, S.; Deng, S.; Zhao, L.; Chen, B.; Wang, D. Experimental investigation on separation and energy-efficiency performance of temperature swing adsorption system for CO2 capture. Sep. Purif. Technol. 2019, 227, 115670. [Google Scholar] [CrossRef] [Scilit]
- Papadopoulos, A.I.; Seferlis, P. (Eds.) Process Systems and Materials for CO2 Capture: Modelling, Design, Control and Integration; John Wiley & Sons: Hoboken, NJ, USA, 2017. [Google Scholar] [CrossRef] [Scilit]
- Ko, D.; Siriwardane, R.; Biegler, L.T. Optimization of pressure swing adsorption and fractionated vacuum pressure swing adsorption processes for CO2 capture. Ind. Eng. Chem. Res. 2005, 44, 8084–8094. [Google Scholar] [CrossRef] [Scilit]
- ISO 14040:2006; Environmental Management—Life Cycle Assessment—Principles and Framework. International Organization for Standardization: Geneva, Switzerland, 2006.
| Disclaimer/Publisher’s Note: The statements, opinions and data contained in all publications are solely those of the individual author(s) and contributor(s) and not of MDPI and/or the editor(s). MDPI and/or the editor(s) disclaim responsibility for any injury to people or property resulting from any ideas, methods, instructions or products referred to in the content. |