Article

Modeling and Optimization of AI-Based Centralized Energy Management for a Community PV-Battery System Using PSO


by
Sree Lekshmi Reghunathan Pillai Sree Devi
1,*,
Chinmaya Krishnan
2,*,
Preetha Parakkat Kesava Panikkar
1 and
Jayesh Santhi Bhavan
3
1
Department of Electrical and Electronics Engineering, Amrita Vishwa Vidyapeetham, Amritapuri, Kollam 690525, India
2
Department of Mechanical Engineering, Amrita Vishwa Vidyapeetham, Amritapuri, Kollam 690525, India
3
School of Mechanical Engineering, Coventry University, Coventry CV1 5RW, UK
*
Authors to whom correspondence should be addressed.
Energies 2026, 19(2), 439; https://doi.org/10.3390/en19020439
Submission received: 29 November 2025 / Revised: 24 December 2025 / Accepted: 26 December 2025 / Published: 16 January 2026

Abstract

The rapid rise in energy demand, urban electrification, and the increasing prevalence of Electric Vehicles (EV) have intensified the need for reliable and decentralized energy management solutions. This study proposes an AI-driven centralized control architecture for a community-based photovoltaic–battery energy storage system (PV–BESS) to enhance energy efficiency and self-sufficiency. The framework integrates a central controller which utilizes the Particle Swarm Optimization (PSO) technique which receives the Long Short-Term Memory (LSTM) forecasting output to determine optimal photovoltaic generation, battery charging, and discharging schedules. The proposed system minimizes the grid dependence, reduces the operational costs and a stable power output is ensured under dynamic load conditions by coordinating the renewable resources in the community microgrid. This system highlights that the AI-based Particle Swarm Optimization will reduce the peak load import and it maximizes the energy utilization of the system compared to the conventional optimization techniques.

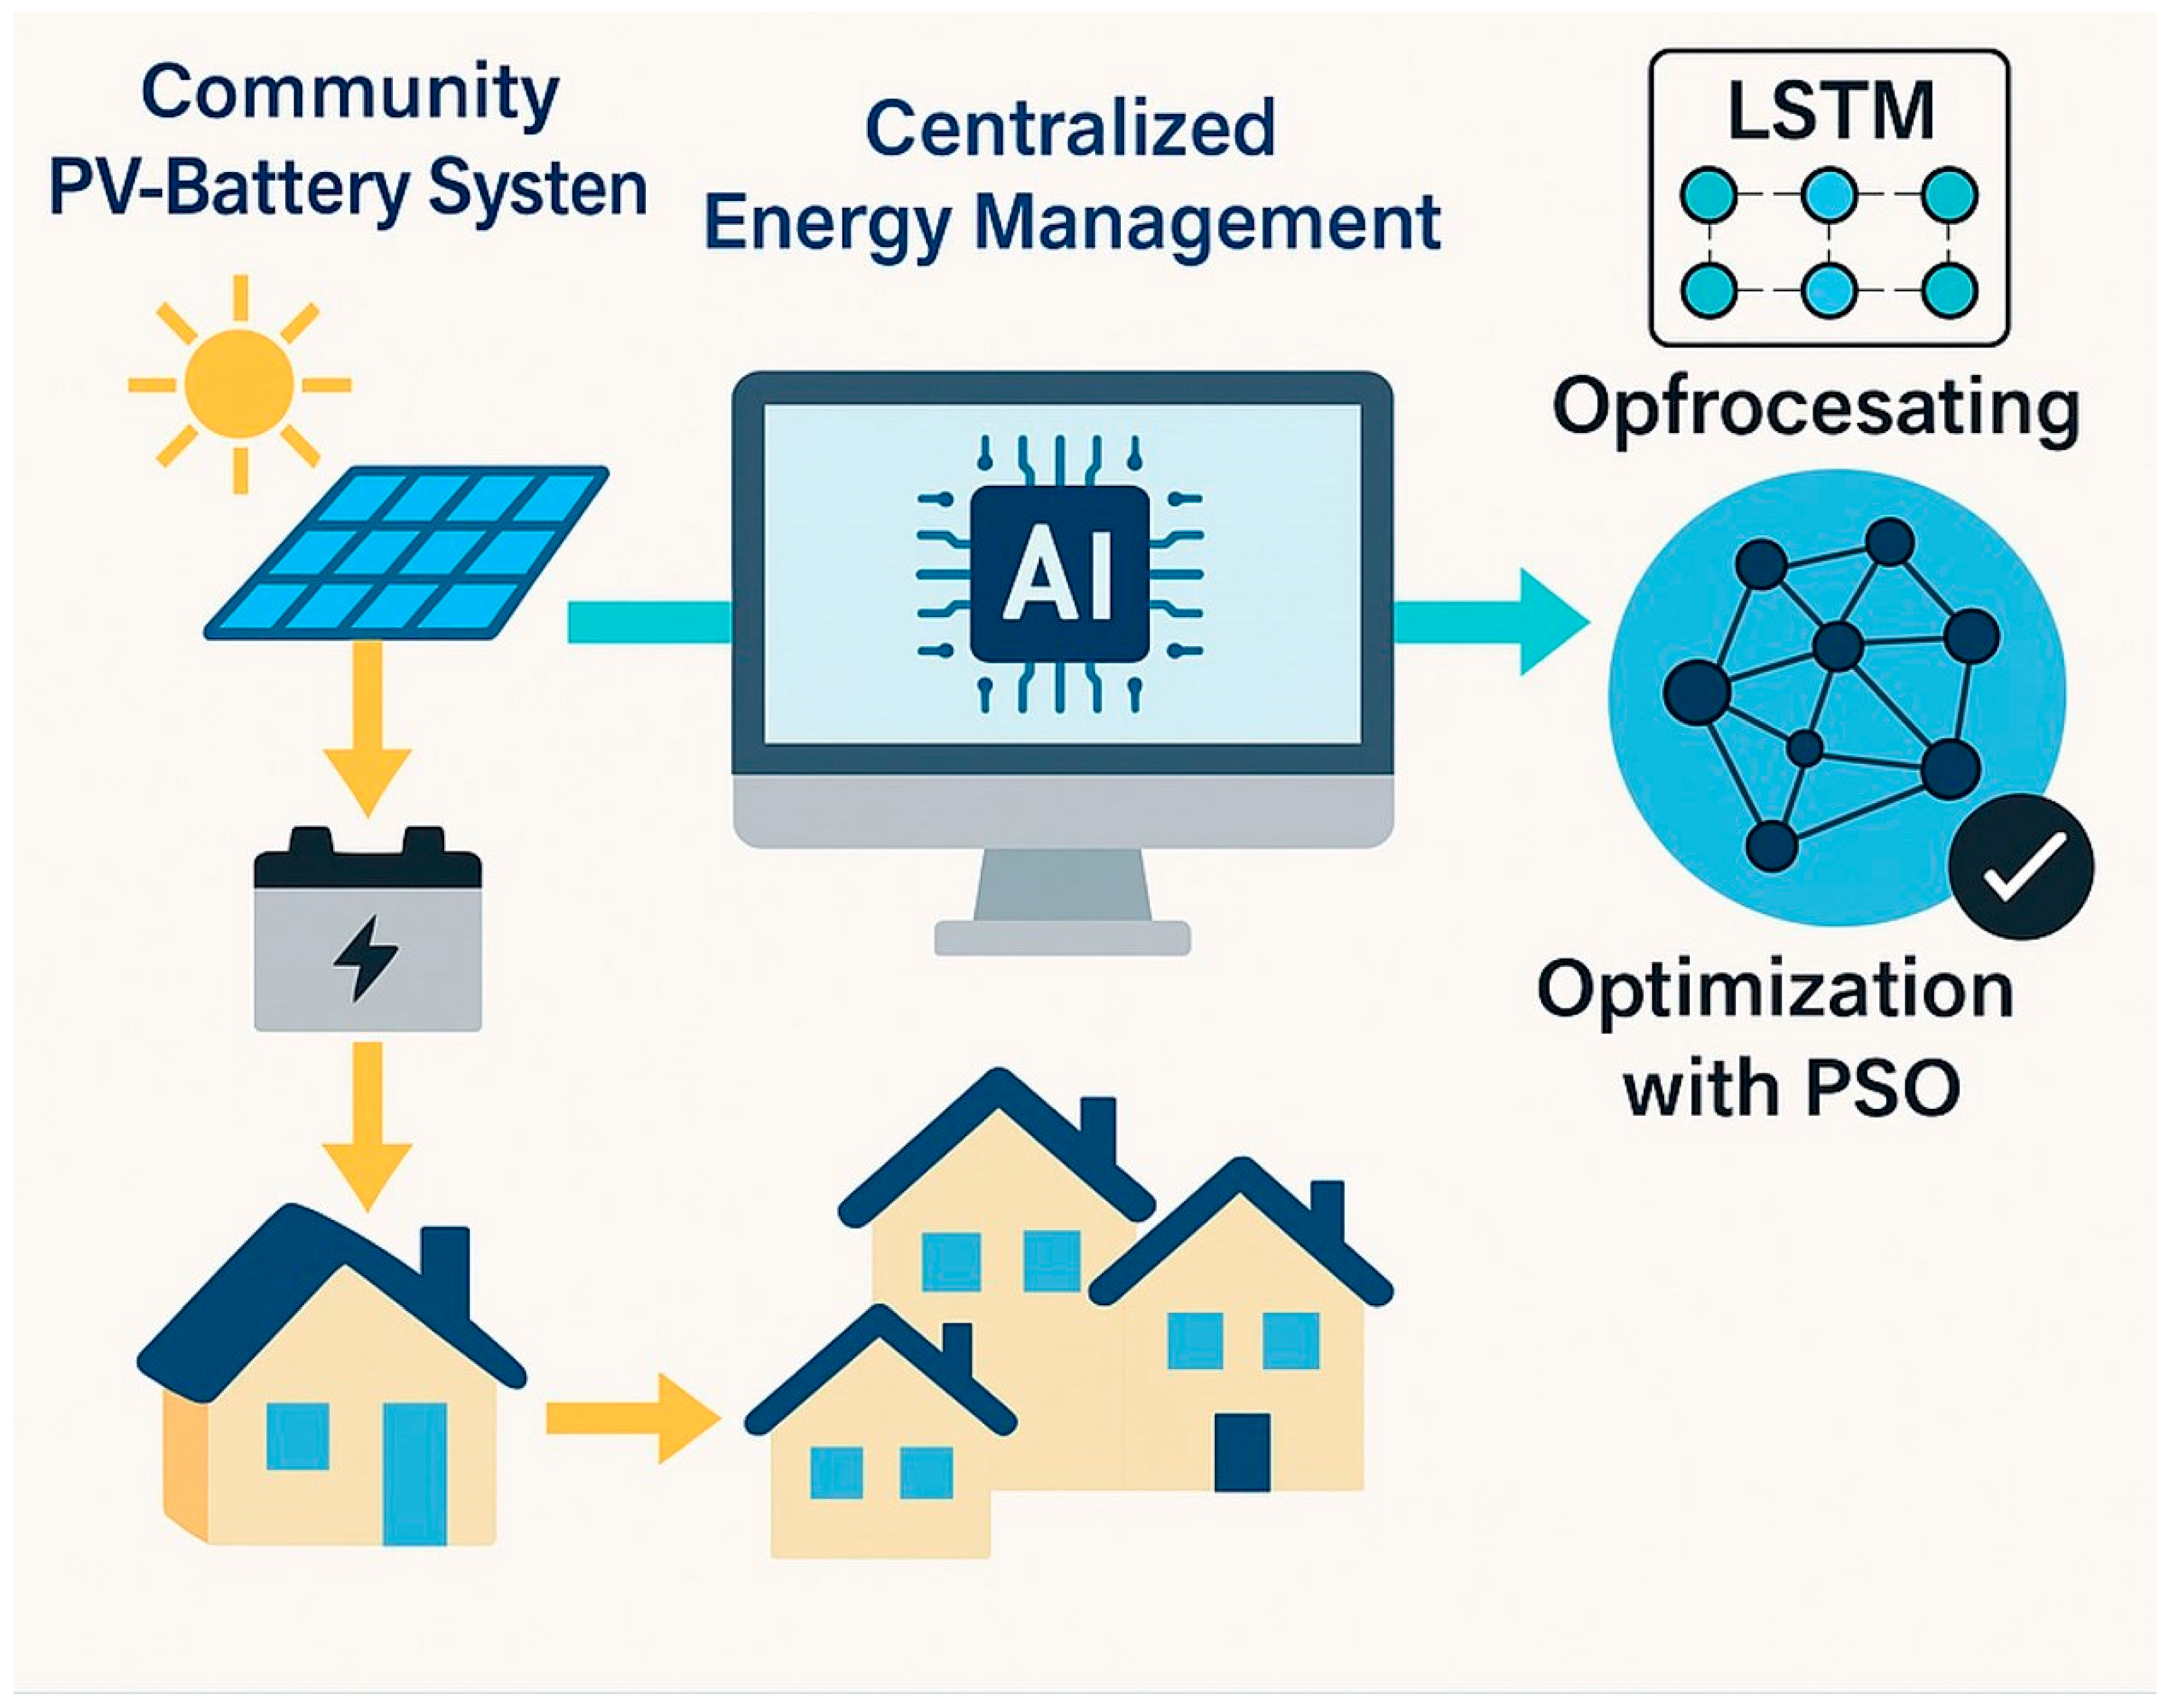
Graphical Abstract

1. Introduction

The tremendous increase in electricity demand along with the rising adoption of electric vehicles (EVs), has significantly altered the power consumption patterns of residential consumers. Changes in the lifestyle and elevated living standards have resulted in a rise in per capita power consumption. Recent studies indicate a rapid rise in domestic electricity demand [1,2]. Conventional unidirectional power grids, initially designed for centralized generation and passive consumption, are progressively insufficient for integrating distributed energy resources and enabling bidirectional power flows [3]. In this context, decentralized renewable energy generation, particularly solar photovoltaic (PV) systems enhance energy accessibility while minimizing environmental impact.
Community-based solar photovoltaic systems have emerged as an effective means to lower peak demand and lessen the reliance on traditional grids [4]. When integrated with Battery Energy Storage Systems (BESSs), grid connected PV-BESS configurations enhance residential energy independence, facilitate load balancing and stabilize voltage in residential areas. Standalone rooftop PV systems, on the other hand, encounter several operational challenges including excessive power generation during day time and insufficient power using peak demand periods [5]. Moreover, the substantial initial expenses and limited financing options prohibit low- and middle-income families from adopting PV-BESS systems. This makes it hard for them to become widely used. To overcome these limitations, community-based rooftop photovoltaic systems utilizing shared battery energy storage have gained significant attention due to their cost-effectiveness and enhanced utilization of energy [6,7].
Considering these advancements, a significant research gap persists in the coordinated and intelligent management of energy flows within community-based PV-BESS networks. Majority of existing research employ decentralized or rule-based control strategies. These approaches lack a comprehensive understanding of the entire system and usually fail to efficiently regulate the power flow among photovoltaic generating units, battery storage, and various residential appliances [8,9]. Many conventional optimization techniques utilized in these systems depend on overly simplified linear assumptions, failing to accurately capture the inherent non-linear, stochastic and time varying attributes of residential loads, renewable generation and electric vehicle charging demand under unpredictable circumstances [10].
Latest research demonstrates that the integration of Artificial Intelligence (AI) methodologies with bio-inspired optimization algorithms can effectively address these challenges by enabling adaptive, data-driven and scalable energy management techniques. Among these techniques, Particle Swarm Optimization (PSO) has gained prominence due to its simplicity, computational efficiency, adaptability and rapid convergence characteristics when dealing with complex, non-linear optimization problems [11,12]. Nevertheless, the integration of AI-driven load forecasting with PSO-based centralized energy management at the community level is inadequately investigated, particularly under realistic Indian residential operating conditions characterized by EV integration and diverse consumption trends.
In order to address these gaps, this work suggests a novel AI-based centralized control framework for managing residential energy at the community level which integrates rooftop solar PV systems and battery storage for energy. The key innovation of this study is the development of a PSO-optimized centralized controller that automatically controls the flow of energy between PV generation, BESS, EV charging demand and residential loads. The proposed controller works with system-wide visibility and makes operational decisions based on the forecast demand and storage constraints, which is different from traditional decentralized systems.
A Long Short-Term Memory (LSTM)-based forecasting model is employed to accurately capture the non-linear temporal dependencies in residential load behavior. The proposed framework allows for hourly level monitoring and control of load demand. Battery State of Charge (SoC), PV utilization and grid interaction by combining AI-based forecasting with PSO driven optimizer. This coordinated strategy enhances energy self-sufficiency, reduces peak grid dependency and minimize the expenses for energy procurement.
This study is driven by the rapidly increasing electricity consumption in India, where the adoption of electric vehicles (EVs) and higher living standards are drastically changing the patterns of residential demand profiles. The proposed methodology is a scalable and reproducible framework that can support future rural and urban community infrastructures. Subsequently this work addresses both technical and economic barriers to ingrate solar PV to a large scale.

1.1. Objectives of the Study

  • Enhancement of the photovoltaic system with a centralized controller;
  • A battery controller for managing the charging and discharging schedule of batteries;
  • Particle Swarm Optimization for effective management of the system;
  • Utilization of a centralized controller for the real-time control of the system.

1.2. Contributions of the Work

  • Development of an AI-driven energy management system for a community-scale PV-BESS system that integrates forecasting, optimization and real-time dispatch in one control architecture;
  • The integration of LSTM-based day-ahead load forecasting with residential demand that includes electric vehicles facilitates the modeling of novel community energy scenarios in India in a realistic way;
  • Utilizing PSO-based optimization for the sizing and scheduling of photovoltaic systems and batteries and implementing real time centralized dispatch;
  • Implementation of multi-level battery discharge strategies in order to assess flexibility, battery stress mitigation and evaluate grid dependence under various operational conditions;
  • A comprehensive assessment of three operational scenarios (Generation = Load, Generation > Load, Generation < Load) which is not often carried out earlier;
  • Validation of the proposed framework using Indian residential data, emphasizing its practical relevance for community energy planning.

2. Related Work

2.1. Use AI to Make Predictions in Smart Communities

For enhancing the efficacy of smart energy communities utilizing distributed energy resources and electric vehicle loads, accurate predictions are essential. Traditional forecasting methods such as ARIMA, exponential smoothing and linear regression are suitable for linear variations but found trouble in handling non-linear data which are common in modern smart grids [13,14]. The sudden demand rise due to the electric vehicle charging or variation in insolation patterns cannot be handled by these models. Artificial Neural Networks, Support Vector Regression, Random Forests and Gradient Boosted Trees are the AI-based models which handled the non-linear relationship in data on previous consumption, temperature and time [15,16]. For predicting the short-term residential load, ANN has found to be more accurate than ARIMA [15] and the SVR models are suitable for estimating the varying demand pattern of residential buildings.
But these AI models cannot handle the long-term temporal dependencies on data. Recurrent Neural Networks (RNN), especially the Long Short-Term Memory (LSTM) have become the best prediction method for time series data. LSTM models can remember things, which lets them learn patterns over several time steps. This makes them good for predicting community load that takes into account daily routines, changes in the weather, and EV charging cycles [17]. This comprehensive analysis [18] categorizes recent deep learning and hybrid forecasting techniques for energy management in smart grids. Despite its extensive scope, it demonstrates that the majority of research fail to link forecasting outcomes to real-time dispatch optimization. A model utilizing LSTM is proposed [19] for short-term load forecasting in smart solar microgrids. It surpasses typical statistical methods in accuracy. The study does not integrate the forecast into a closed-loop optimization or control system.
Studies in India, like ref. [20] have used LSTM to predict residential load with better results, especially when EV use causes irregular consumption patterns. Additionally, hybrid AI models that combine LSTM with attention mechanisms or clustering (like LSTM-K-means) improve the accuracy of forecasts even more and make it possible to segment community load [21]. Even with these improvements, Indian community systems still have trouble combining LSTM-based forecasting with real-time optimization.

2.2. Community-Based PV and Storage Systems (with a Focus on Case Studies from India)

Community-based PV and storage systems are a great alternative to standalone rooftop systems because they encourage shared ownership, better energy sharing, and more flexible energy access. The Brooklyn Microgrid (U.S.) and the Sonnen Community (Germany) are two examples of projects that have worked well with shared PV and battery assets, thanks to peer-to-peer trading and centralized control [4,5]. The Dharnai Solar Microgrid in Bihar was one of the first examples in India where a 100 kW solar PV system powered more than 450 homes [22]. Technically the project was successful, but the tariff structures, absence of real-time control mechanisms and the acceptance among the people has become the key problem. The coordinated battery scheduling has decreased 45% reliance on grid in Uttarakhand [23]. An AI-driven microgrid controller is presented in ref. [24] which employs fuzzy logic and battery control for enhancing the power distribution and quality. It lacks energy forecasting, long-term optimization of battery and community scale integration. A hybrid communication framework that integrates wired and wireless networks are presented in ref. [25] in order to enhance the cost effectiveness and reliability of the distribution grids. It enhances the communication efficiency and neglects to address its integration with real-time energy management, predictive control, and system-level optimization of distributed energy resources.
In India, the community-scale solar microgrid models exhibit operational sustainability; however, they are constrained by static scheduling and the absence of real-time PV–BESS logic [26]. Conversely, current installations of IoT-enabled Energy Management Systems demonstrate the synchronized deployment of photovoltaic systems, batteries, and electric vehicles, highlighting the technology disparity that many community systems are yet to overcome [27].

2.3. Strategies for Managing and Controlling Energy in a Centralized Way

Centralized Energy Management Systems (EMS) are made to keep an eye on distributed resources like PV systems, battery storage, and EVs in a microgrid or community setting. These systems gather real-time information (like SoC, load, irradiance, and tariffs) and send out optimized control commands for coordinated operation. Early EMS designs were based on rules and used static thresholds or time-of-use logic. They are not very flexible when things change, though [6]. Deterministic methods like MILP and dynamic programming make dispatch more accurate, but they are hard to scale and take a lot of computing power [9].
An energy management system utilizing an artificial neural network is developed in [28] for a photovoltaic-powered electric vehicle charging station. This system efficiently orchestrates grid power, battery storage, and vehicle-to-grid activities to reduce energy expenses and enhance system reliability. However, it is limited to station-level control and lacks long-term state of charge optimization, predictive community demand forecasting, and the capacity to expand into larger residential or community microgrids. Ref. [29] introduces a hybrid system with a charge–discharge controller (battery + supercapacitor) that operates in conjunction with a shunt active filter. This controller functions effectively in a grid-connected microgrid testbed, enhancing power quality and managing abrupt demand fluctuations. Its primary objective is short-term harmonic and reactive compensation, rather than long-term energy management, predictive scheduling of storage, or the coordination of numerous sources and loads at a community level.
The authors in ref. [30] developed a hybrid microgrid energy management system employing Particle Swarm Optimization (PSO) to optimize dispatch decisions, including electric vehicle (EV) and battery energy storage system (BESS) operations, informed by Long Short-Term Memory (LSTM) forecasts of total load, solar, and wind generation categorized by season. This strategy significantly improved peak load shifting and reduced total energy costs compared to scheduling without forecasts. However, one big problem is that AI cannot be used in real time, in centralized control loops. Most systems treat forecasting and optimization as separate parts, which makes them less responsive to changes in demand, especially in areas with a lot of electric vehicles.
Recent research indicates that intelligent energy management systems are becoming more important for optimizing the performance of hybrid renewable energy systems. Ref. [31] proposed an effective energy management system for a hydrogen-based energy facility that integrates energy from photovoltaic and battery. This framework shows that coordinated framework can enhance system efficiency and lower operating costs. Ref. [32] developed a fuzzy logic-based demand side energy management system for hybrid energy sources that mange load prioritization and energy consumption. This system depends on heuristic rule sets and lacks predictive forecasting capabilities. An artificial intelligence-based system for forecasting solar radiation to enhance the use of renewable energy in energy management system is developed in ref. [33]. This study considers forecasting as a discrete component and neglect the integration with real-time processes or optimization processes. A comprehensive review is performed in ref. [34] that summarizes recent advancements in standalone and grid connected hybrid renewable energy systems. The paper emphasizes on optimization and control strategies while underscoring the ongoing deficiency in integrated frameworks.

2.4. Optimization Techniques for Community-Based Systems

At the heart of EMS design is optimization. MILP and other deterministic methods are good at finding global optima, but they are limited by how long they take to run and the fact that they assume linearity. An energy management system was developed in ref. [35] for a grid-tied residential microgrid, with rooftop solar PV, an energy storage system, and LSTM-based load demand forecasting. It employs Mixed-Integer Linear Programming (MILP) to improve battery performance over a continuous 24-h timeframe. Implementing receding-horizon control in real-time reduced operational expenses by 3.3% vs. to offline solutions.
Genetic Algorithms (GA), Ant Colony Optimization (ACO), and Grey Wolf Optimization (GWO) are examples of metaheuristic algorithms that have become popular because they can solve nonlinear problems with many constraints without needing gradient information. GA is flexible, but it takes a lot of computing power because of mutation and crossover operations [36]. An Aquila-based metaheuristic optimizer enhances the performance of photovoltaic systems and the stability of DC microgrids by optimizing the dynamics of the converter [37]. Nonetheless, it functions effectively only in steady-state conditions and lacks scenario-based dispatch or community-level coordination.
According to ref. [38], ACO is better for routing or assigning discrete tasks than for optimizing energy use all the time. Ref. [11] created Particle Swarm Optimization (PSO), which is known for its quick convergence, simple implementation, and ability to optimize multiple objectives in real time. Ref. [39] says that the PSO has been used to improve battery dispatch, PV scheduling, and even EV-aware scheduling. PSO has been shown to lower energy costs and make PV systems work better by up to 25% compared to heuristic methods in Indian case studies. Hybrid PSO models like PSO-LSTM and PSO-FIS improve performance even more by combining the ability to make predictions and reason. This makes PSO the best choice for this study, especially since it needs to be able to adapt in real time, include forecasts, and coordinate at the community level.
The examined literature reveals numerous substantial gaps that persist in contemporary studies.
  • LSTM is rarely employed for community-scale load forecasting with EVs, notably in Indian microgrids;
  • Control Integration: No centralized controllers use AI-based forecasting and real-time optimization;
  • EV Consideration: Most EMS frameworks ignore EV charging behavior changes, resulting in incorrect scheduling and low storage needs;
  • Scalability: Most control solutions only work for small systems and not for communities over 50 dwellings.
  • Adaptation to India: Few models contain KSEB pricing structures, solar irradiance patterns, or two-month consumption data.
The literature that was looked at shows that there have been big improvements in community PV-BESS systems, AI forecasting, and optimization methods. But in the real world, Indian implementations often don’t have scalable, real-time, AI-integrated control frameworks that can handle PV, battery, and EV loads all at once. This study fills in this important gap by suggesting a centralized EMS architecture that uses LSTM for forecasting and PSO for optimization. Using this model on real KSEB consumption data from 50 households shows that it is possible to have scalable, cost-effective, and smart energy management that fits the energy needs of India.

3. System Architecture and Data

The proposed centralized AI-based system is developed for a community of 50 residential units, each equipped with solar photovoltaic panels and battery energy storage systems (BESSs). A centralized controller supervises PV generation, household electricity demand, battery state of charge (SoC), and EV charging activity in real time. All distributed components are interconnected through a local microgrid, enabling coordinated power exchange within the community.
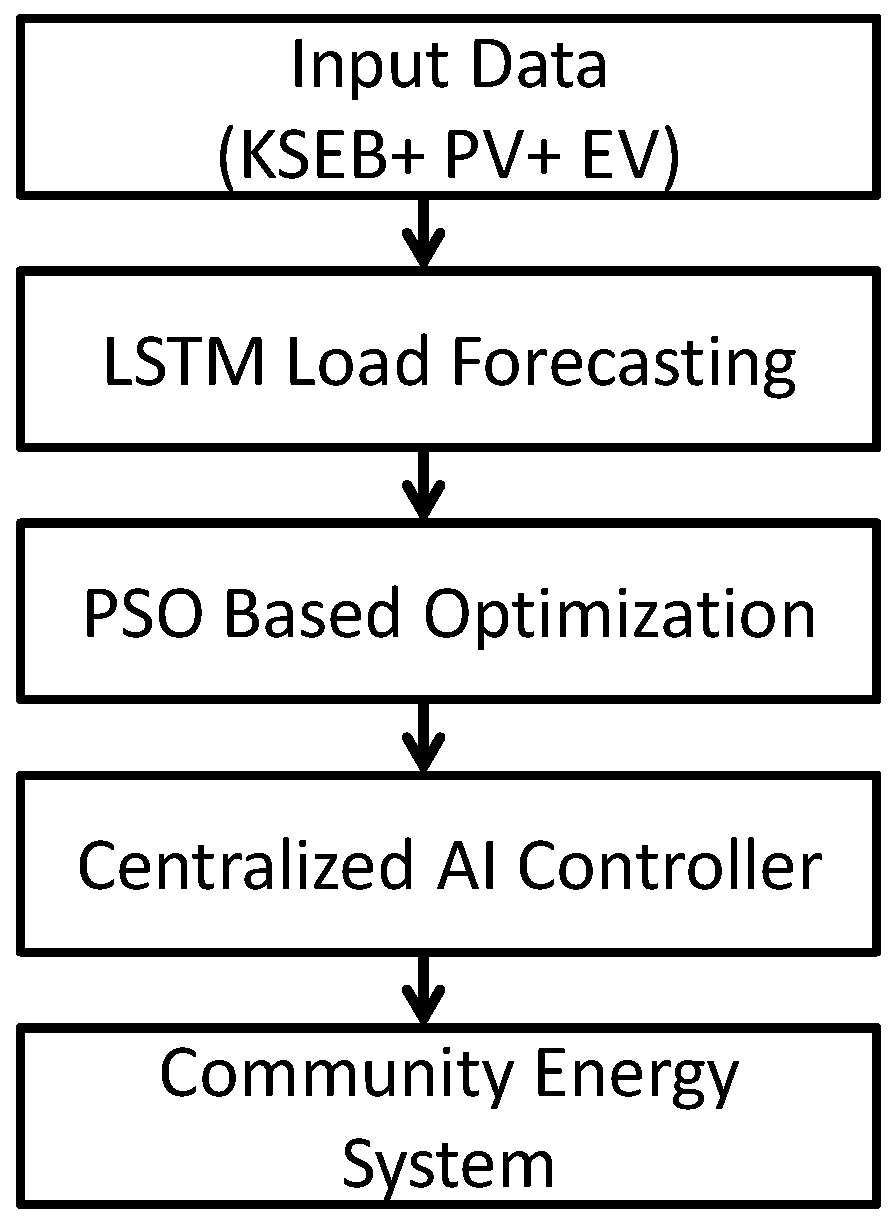
Figure 1 illustrates the overall design framework of the proposed community energy management system. The system encompasses load forecasting, optimization and real-time application, in order to generate a 24-h load forecast. An LSTM model first processes the historical residential load data, solar irradiance and electric vehicle charging data. This anticipated demand is utilized by the PSO-based optimization module to determine the optimal periods for charging and discharging batteries and solar panels while keeping the system standards. The centralized AI controller collects the optimal schedules and makes real-time decisions about the allocation of PV, battery, load and grid based on the present situations. This sequenced yet coordinated approach ensures the smooth integration of forecasting, optimization and control techniques. This makes the system’s accessibility and usability in real-world situations.
An LSTM-based forecasting model predicts the aggregated community load profile for the following 24-h, including stochastic EV charging behavior. Subsequently, a Particle Swarm Optimization (PSO) algorithm determines the optimal battery charging/discharging schedule and grid interaction strategy to minimize cost and grid dependency. The EMS operates under three distinct scenarios:
  • PV generation equals demand, maintaining energy balance;
  • PV generation exceeds demand, allowing surplus energy to charge the batteries; and
  • PV generation is insufficient, prompting battery discharge or limited power import from the grid.
Input data is sourced from bi-monthly consumption records of residential households maintained by the Kerala State Electricity Board (KSEB). These datasets were converted into hourly loads by probabilistic disaggregation method. Solar irradiance data of Kerala is obtained from NASA/SSE database. The dataset was used to train the LSTM model for the sizing of PV and BESS components. Thus, the model captures the load consumption behavior, and solar trends in order to maximize the PV utilization, reducing the dependence on traditional grids and thereby enhancing technical resilience.
The electric vehicle charging demand per household is estimated to be 7.5–10 kWh/day [40] and is represented as an additional load for houses. This study characterizes EV charging as a constant average daily energy requirement of 7.5 kWh per household to ensure a uniform assessment of the proposed centralized energy management framework.

3.1. Assumptions in Modeling

The sumptions and parameter specifications for the system modelling is illustrated in Table 1. We took 50 households for the work and average power usage per house and other details are furnished in Table 1. Also the parameter specification is shown in the table. The proposed work assumes the Power Dispatch Hierarchy that, the PV self consumption will have the first priority, the second priority is for battery charging and the final priority is for grid.

3.2. Collection of Load and Solar Data

The primary data is derived from the bimonthly electricity bills of residential consumers supplied by Kerala State Electricity Board. The consumption data are transformed into hourly load profiles and the solar irradiance profile is obtained from publicly accessible meteorological records for Kerala. Electric Vehicle loads are also considered for each household. This input is used to train the LSTM forecasting model, which forecasts the day ahead load demand. This forecast data is used by the photovoltaic and battery systems in order to ensure that the developed model aligns with the consumption patterns and solar potentials in Indian communities.

Bimonthly-to-Hourly Load Disaggregation

The residential consumption data obtained from Kerala State Electricity Bill are in the form of bimonthly bills. For load forecasting, optimization and central controller high resolution hourly data is needed. A probabilistic load disaggregation approach is needed to convert the bimonthly consumption data into hourly load profiles by preserving total energy consistency.
Let Eb denote the total bimonthly energy consumption of a residential consumer in kWh and Nd represents the number of billing days. The average daily consumption is calculated as
E d a y = E b N b
A reference hourly residential profile Lref(t) is obtained from the report on energy studies by TERI. This reference profiles capture typical morning and evening peaks. The reference profile is normalized in order to obtain the hourly shape factor.
L n o r m ( t ) = L r e f ( t ) t = 1 24 L r e f ( t )
The normalized load profile should satisfy the condition t = 1 24 L n o r m t = 1 .
The hourly demand can be calculated as Phour(t) = Lnorm(t) × Eday.
Thus t = 1 24 P h o u r t = E d a y .

3.3. Energy Flow Model

The developed community-based system with the centralized control framework coordinates the solar PV, Battery Energy Storage System and the grid. The photovoltaic system acts as the principal energy source during day time. It supplies the residential loads and concurrently charges the battery. The energy demand system optimizes the utilization of photovoltaic energy. During inadequate PV generation or demand peaks, the grid acts as a contingency to balance the load. The surplus photovoltaic energy is allocated to charge the battery after satisfying the load demand.
During the peak load time, the system encounters a substantial rise in the energy demand. The battery charged during the daytime empties to accommodate the evening demand. This diminishes the community’s reliance on the grids and improves self-sufficiency. In instances of insufficient photovoltaic power or incomplete battery charge resulting from the fluctuations in load or weather, the unmet load is addressed by utilizing the grid, thus ensuring the continuity of supply without violating the discharge constraints of the battery.
During off-peak hours, the load predominantly compromises necessary services such as fans, lights and refrigeration. During that point, the battery is partially or completely depleted following the peak hour utilization. To avoid the deep discharging of the battery and to increase the life of battery, the grid provides power under these conditions. This guarantees continuous power flow, emphasizes renewable energy use and safeguard battery integrity. The central controller orchestrates the operation of the photovoltaic system, battery, and grid sources according to real-time availability and load demands, adhering to a hierarchical priority: PV → Battery → Grid.

4. Methodology and Optimization Using PSO

4.1. LSTM Architecture

The LSTM networks is used for the forecasting method for this case because of its ability to handle the sequential dependencies. The suggested architecture consists of a sequential input layer, two stacked LSTM layers, each containing 100 hidden units. For balanced regularization, the LSTM’s input and recurrent connections have a dropout rate of 0.2. This means that they do not get turned on or have their weights changed. The output goes through a regression layer and a fully connected layer to get an accurate load prediction.
Min–max scaling is utilized for data pre-processing. It is defined by
X n o r m = X X m i n X m a x X m i n
where X denotes the initial value of the feature, Xmin denotes the minimum value of the feature whereas Xmax signifies the highest value of the feature.
The dataset is then divided into an 80% of training set and 20% of dataset. Then, 24-h data are encompassed in the input sample and the forecasting is done for the next day.
In order to evaluate the performance of LSTM model, two evaluation metrices are employed.
  • Mean Absolute Percentage Error (MAPE):
MAPE = 100 n t = 1 n | y a c t u a l y p r e d i c t e d y a c t u a l |
2.
Root Mean Square Error (RMSE):
RMSE = 1 n t = 1 n ( y a c t u a l y p r e d i c t e d ) 2
where yactual and ypredicted represent the actual and predicted loads at time t, and n is the number of test samples.
The research employed an LSTM-based forecasting model to predict the electricity demand of households for the next day. The network has a single LSTM layer preceded by a fully connected regression layer. LSTM layer employs hyperbolic tangent activation function to update the cell state and the sigmoid activation function to regulate the input and output. The Adam optimizer train the network with a learning rate of 0.001. A mini-batch size of 32 is employed and the model is trained for an epoch of 100 to avoid overfitting. The input data is normalized prior to the training. The model is trained using historical hourly residential load profiles from KSEB billing data. The LSTM model gives day ahead load forecasting and are transmitted to PSO-based optimization module. This ensures that the forecasting and energy management are in synchronization.

4.2. PV Sizing and Assumptions

Owing to the widespread use in Indian residential PV sector, polycrystalline silicon PV modules are selected for this project. The low capital cost and the high energy conversion efficiency compared to monocrystalline silicon modules make this panel more attractive. These crystals also provide improved thermal performance under high ambient temperatures. These factors render these modules. These attributes render polycrystalline modules a cost-effective and reliable choice for semi-urban communities, balancing economic viability and operational performance, as reported by ref. [44,49]. The calculation of energy generation in Kerala, based on solar potential availability, is defined by an average Global Horizontal Irradiance (GHI) of 5.2 kW/m2/day, as assessed by the MNRE. [50]. The PV Performance Ratio (PR) ranges from 0.75–0.85, accounting for derating of PV systems owing to temperature impacts, inverter efficiency and shading effects.

4.3. Design Goals

The design objectives of the system are as follows: 1. The photovoltaic system must power the entire system during the daytime (6.00 AM–6.30 PM), in accordance with the regulations of KSEB [44,51]. The surplus power generated during daytime after fulfilling the load demands should be stored in the battery. This stored energy can be utilized during the peak hours, from (6.00 PM–10.30 PM), thereby alleviating the peak grid demand. This improves the energy autonomy and it significantly aligns with India’s objectives for renewable energy integration [44].

4.4. Requirements of Load and Energy Generation

Data from the Kerala State Electricity Board [47] and the International Renewable Energy Agency [45] indicate that the average power consumption for a residential home and the electric car charging demand is 7.5 kWh/day for each. Therefore, the overall energy requirement for a home user per day can be considered as 15 kWh/day. The data present a consolidated residential and mobility load profile that is advantageous for intelligent community energy planning in India.

4.5. Assessment of Photovoltaic Capacity

The following was utilized about the aforementioned parameters and simulated outcomes:
Panel efficiency [43,44]—16%.
Global Horizontal Irradiance [42]—5.2 kWh/m2/day.
Performance Ratio [42,43]—0.8.
Energy output per square meter of panel = GHI × Performance Ratio × panel efficiency
=5.2 × 0.8 × 16 = 0.6656 kWh/m2/day
PV area required (m2) = Energy demand per day (kWh)/Energy output per m2 of panel(kWh/m2/day)
=15/0.6656 = 22.54 m2
Taking into account design tolerances and real rooftop constraints, the area is prudently approximated to ~24 m2 per family. The photovoltaic sizing was determined using 0.66 kW rated polycrystalline modules, in accordance with MNRE requirements [50].

5. PSO-Based Optimization Strategy

5.1. Mathematical Formulation of the Problem

A constrained multi-objective problem is designed to minimize the grid dependency, enhance the utilization of photovoltaic energy and to ensure safe battery optimization. The proposed model includes realistic power balance relationships, battery State of Charge dynamics and operational constraints relevant to the system. A PSO-based paradigm for improving the allocation of photovoltaic systems and batteries. Particle Swarm Optimization (PSO) is employed to determine the flow of optimized power across the photovoltaic system and the batteries. The primary objective is to diminish the disparity between the demand and supply during peak operational hours, along with reducing dependence on grid electricity. We established the optimum issue as a framework for cost minimization with numerous objectives. The cost function seeks to achieve equilibrium among three critical objectives: minimizing the disparity between load and photovoltaic generation throughout the day, reducing the gap between load and battery discharge during peak hours, and decreasing the overall energy consumption of the grid throughout a 24-h timeframe. The objective function is mathematically defined as
min [ α t ϵ t d ( P L o a d t P P V ( t ) ) 2 + β t ϵ t d P l o a d t P b a t t t 2 + γ t = 1 T P g r i d t 2 ]
Constraints:
  • PV is prioritized to charge battery during 6 am–6.00 pm;
  • State of Charge constraints: 0 ≤ SoC ≤ SoCmax;
  • Battery discharge is permitted during 6.00 pm–10.30 pm.
The objective function of the proposed model is a weighted sum of various performance indices, with weighing coefficients α, β and γ which is a standard approach in multi-objective energy management [11,52]. The weighing coefficient α is chosen to minimize the disparity between the energy required and the energy generated by the photovoltaic systems. Thus promotes the utilization of photovoltaic energy to the fullest extend during the daytime. The term emphasizes the significance of utilizing locally generated renewable energy and reducing the photovoltaic curtailment at the community scale. The term β promotes optimal battery scheduling. It schedules the battery charging and discharging pattern to support the peak loads. γ is the weighing factor which minimizes the grid dependence and thereby promotes self-sufficiency.
The weighing factors used are α = 0.4, β = 0.4 and γ = 0.2. This indicates that PV self-consumption and battery based peak load support are prioritized equally. The grid involvement is seen less significant. This choice effectively balances the utilization of solar energy, battery operation and grid dependence aligning with other community energy management studies [11,52].
A brief parametric analysis showed that minor alterations in the weighing parameters should not significantly impact the overall optimization trends or decisions regarding operation and proves the robustness of the proposed objective function.
The PSO algorithm seeks the optimal set of decision factors, encompassing the PV dispatch details over 24-h and the battery discharge values during specific peak hours. The technical constraints such as the availability of photovoltaic power, the State of Charge limitations and the restrictions on the charging and discharging of the batteries impose boundaries on these variables. The power output of the photovoltaic system at any moment is constrained by the available sunlight, the panel dimensions and the PV system efficiency. The battery’s discharge power is constrained by the rated output capacity and the State of Charge range.
A swarm-based search technique is used for optimization. A random collection of candidate solutions, or particles is generated. Every particle incorporates the output from the photovoltaic system and the battery. The objective function assesses the fitness of each particle. The particles alter their locations and velocities by utilizing their personal best and the swarm’s global best positions. The classical PSO equations govern the alterations in velocity:
vi (k + 1) = w vi (k) + c1 r1(pbesti − xi (k)) + c2 r2 (gbest −xi(k))
xi(k + 1) = xi(k) + vi(k + 1)
w represents the inertia weight, c1 and c2 represent the cognitive and social coefficients, and r1 and r2 are the random variables within the interval (0, 1).
These equations by [11,52] maintain balance among the exploration and exploitation in the process. The optimization continues either the predetermined number of iterations is achieved or the fitness value resides in the specific range. The optimal solution from the swarm is utilized to determine the effective photovoltaic and battery dispatch schedules for the 24-h operational cycle.
The energy dispatch among the residences is effectively coordinated by the centralized optimization framework. It considers various factors such as changes in the generation pattern, storage capacities and fluctuating load demands. The proposed work enhances the self-sufficiency of the community and reduces the grid dependence by prioritizing the local generation of renewable energy [53] and strategic battery utilization [54].

5.2. Centralized Controller

The central controller is designed to manage the power distribution among the photovoltaic system, batteries, loads, and, if necessary, the grid. To improve self-sufficiency and guarantee load reliability, various scenarios are assessed. The primary goal of the controller is to optimize the use of renewable energy and enhance self-sufficiency. The controller minimizes the grid import and losses. The central controller enhances the energy resilience and autonomy.

5.3. Design of Power Allocation Logic

The central controller is designed to regulate the power flow among the solar photovoltaic system, batteries, loads and grid, if necessary. In order to ensure the reliability and to improve the self-sufficiency various scenarios are assessed. The controller periodically observes the photovoltaic power and the load power, leading to the subsequent scenarios.
Scenario 1: Pgen = Pload: in this case, the generated power is equal to the demand. Consequently, the energy generated by photovoltaic systems can be immediately transmitted to the loads.
Scenario 2: Pgen > Pload: under this circumstance, the generated power surpasses the demand. Thus, the excess power may be assigned to the battery.
Scenario 3: Pgen < Pload: in this circumstance, the generated power is inadequate to satisfy the power demand. The battery can be employed to satisfy the excess demand. Power may be obtained from the grid if required.
The controller manages power distribution throughout the community by supervising the energy flow through photovoltaic systems, batteries, and loads. The input data is derived from the LSTM network, which does predict for the subsequent day. Additionally, it obtains power generation data from photovoltaic systems and state of charge information from the connected batteries. Using these data, the system will determine the situation. Consequently, based on energy requirements and availability, the system relays control signals to the photovoltaic (PV) system, battery, and grid interface about power import and export.

5.4. MATLAB Implementation

The proposed system is modeled using MATLAB 2024a. Algorithmic control and PSO optimization is implemented using script-based modelling. The system performance is assessed for three cases in order to evaluate the effects of PSO optimization and central controller in the proposed system. In case 1, the base case is evaluated. In this case, no optimization technique or any central controller is used. The entire system works on rule-based logic. Case 2 is known as optimized case. In this case, PSO optimization is used in addition to PV and battery. The central controller is absent in this system. Case 3 also called as the fully controlled case implements a central controller in addition to the PSO optimization. This system controls the power flow in accordance with the forecast load and power generation from PV.

5.5. Simulation Setup

The simulation was conducted on a fictitious community of 50 residences designed to emulate the energy usage patterns of individuals in Kerala’s semi-urban regions. We obtained hourly load profiles by analyzing bimonthly electricity bills from the Kerala State Electricity Board (KSEB). To account for emerging mobility patterns, it was presumed that each family possessed an electric vehicle (EV) with typical daily energy requirements and charging durations.
All simulations were conducted in MATLAB R2024a with a purely script-driven approach (excluding Simulink) using the Particle Swarm Optimization (PSO) algorithm from the Optimization Toolbox. The community’s photovoltaic (PV) system was established with an efficiency of 18%, an average global solar irradiation of 5.2 kWh/m2/day, and a performance ratio (PR) of 0.80. The factors influence the power generation in accordance with the climatic conditions of Kerala. A battery storage system was capable of charging and discharging at a rate of 2 kW, with an initial State of Charge of 60%. The SoC limits were 20% to 90%.
It was expected that the electric vehicle would consume a daily load of 7.5 kWh and would be charged during a period of minimal solar utilization. The PSO algorithm utilized a swarm size of 30 particles, a maximum of 100 iterations and an inertia of 0.7 and acceleration coefficients of 1.5. The simulation endured for 24-h with a resolution of 1 h. This indicated that there were 1200 load data points for all households.
To assess the system’s performance, the following evaluation metrics are examined.
  • Grid Energy Consumption refers to the quantity of energy procured from the grid.
  • Peak Grid Demand refers to the maximum electricity consumption from the grid within a 24-h period.
  • Battery utilization is the ratio of the actual discharge value of the battery to its overall capacity. It is articulated as a percentage.
  • Energy self-sufficiency is quantified as a percentage. It denotes the power demand that may be satisfied without reliance on grid imports.

6. Results

6.1. Forecasting Using LSTM

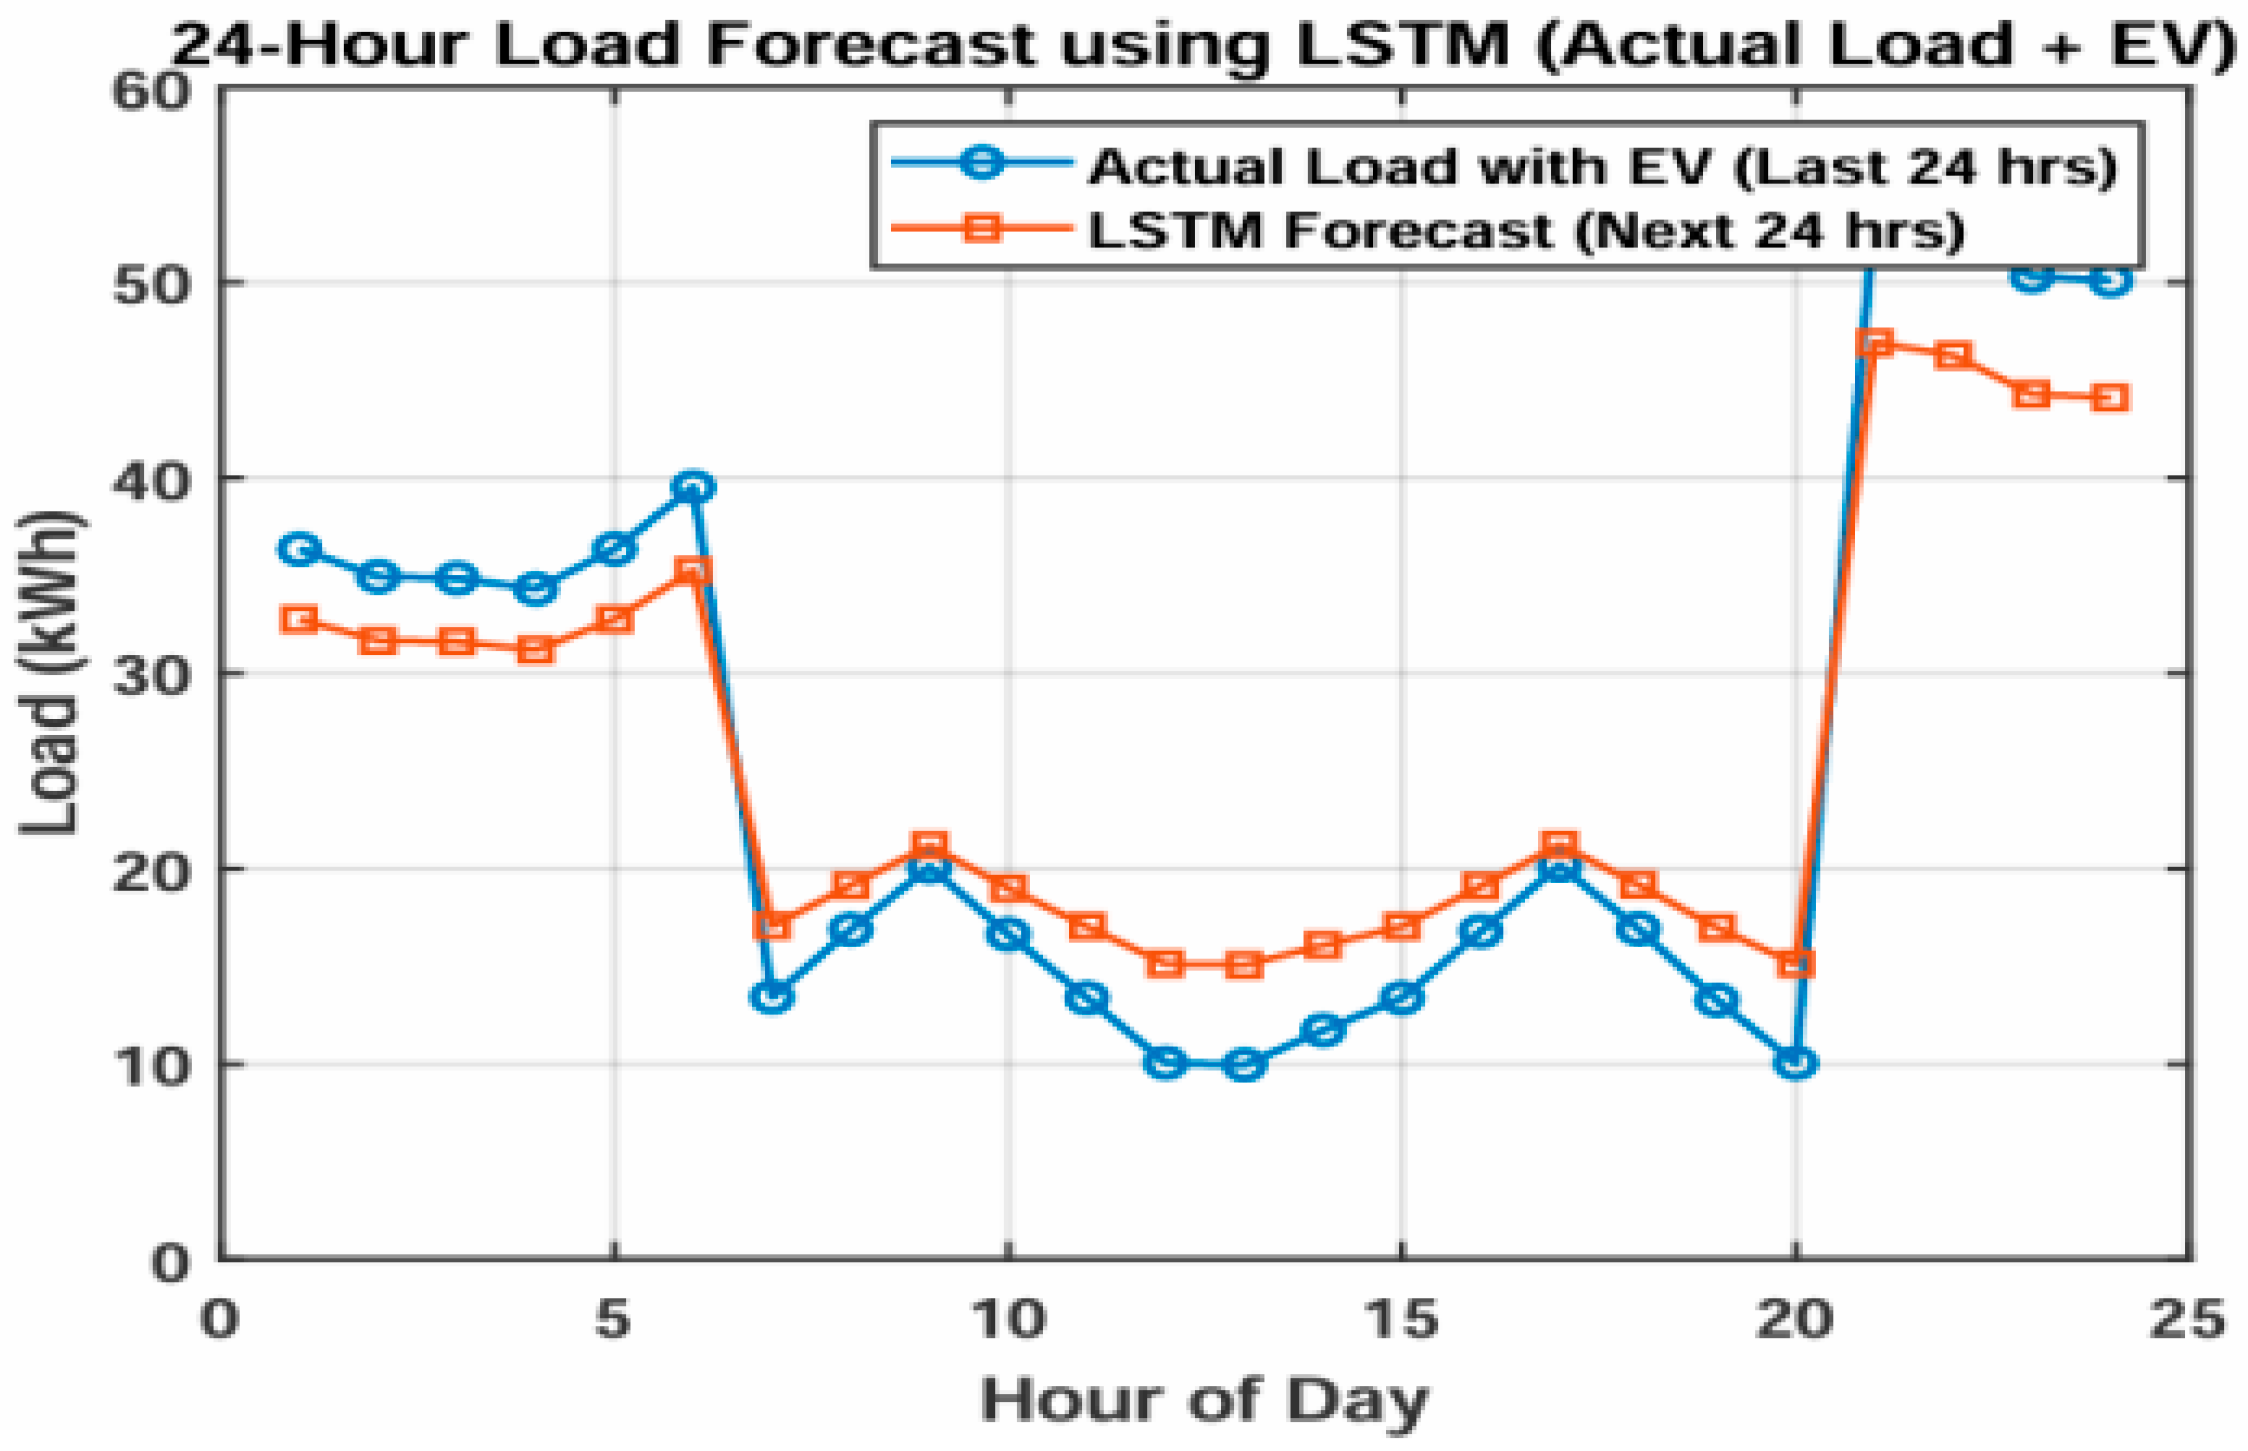
The accuracy of the proposed LSTM model considering residential and EV load is demonstrated in Figure 2.
The graph illustrates the actual load and the LSTM-predicted load of a community during a 24-h period. The actual load is represented by the blue curve, while the anticipated load generated by LSTM is depicted in orange. Distinct peaks occur in the early morning (about 6:00 AM) and evening (after 8:00 PM) due to electric vehicle charging and residential electricity use patterns. The orange line illustrates the LSTM prediction for the upcoming 24-h. It closely adheres to actual consumption data exhibiting minimal smoothing at peak transitions.
The forecast model effectively captures the daily consumption pattern, encompassing the morning and evening peaks and the mid-day decline with a significant degree of temporal correlation. For PV-battery energy management accurate projections are crucial. The inaccuracies in the projections may result in insufficient utilization of battery and an increase in the grid dependence. The proximity of the forecast curves show the robustness of the LSTM model. The validation of the model revealed a Mean Absolute Percentage Error (MAPE) below 5% and a Root Mean Square Error (RMSE) of 0.47 kWh that confirms the reliability of the LSTM model.
Table 2 indicates that the proposed LSTM-based forecasting model is better than the old statistical and machine learning models like ARIMA, SVR and ANN. It was found that the LSTM model has the lowest RMSE, MAE and MAPE values which show that it is better in capturing the non-linear consumption patterns and temporal dependencies of residential loads with the integration of electric vehicles. This improved accuracy in predictions makes the better operation of PSO-based optimization strategy.

6.2. Graphical Examination of Energy Dynamics and Performance Across Cases

The comparative performance of the system across three configurations is illustrated in this section. Case 1 (Base), Case 2 (Optimized using PSO), and Case 3 (PSO + AI-Based Central Coordination and Control). It accomplishes this using output graphs that illustrate grid energy use, surplus photovoltaic energy directed to the battery, and the battery’s state of charge (SoC). There are three load levels (100%, 75%, and 40%) and three generation levels (Generation = Load, Generation > Load, and Generation < Load).
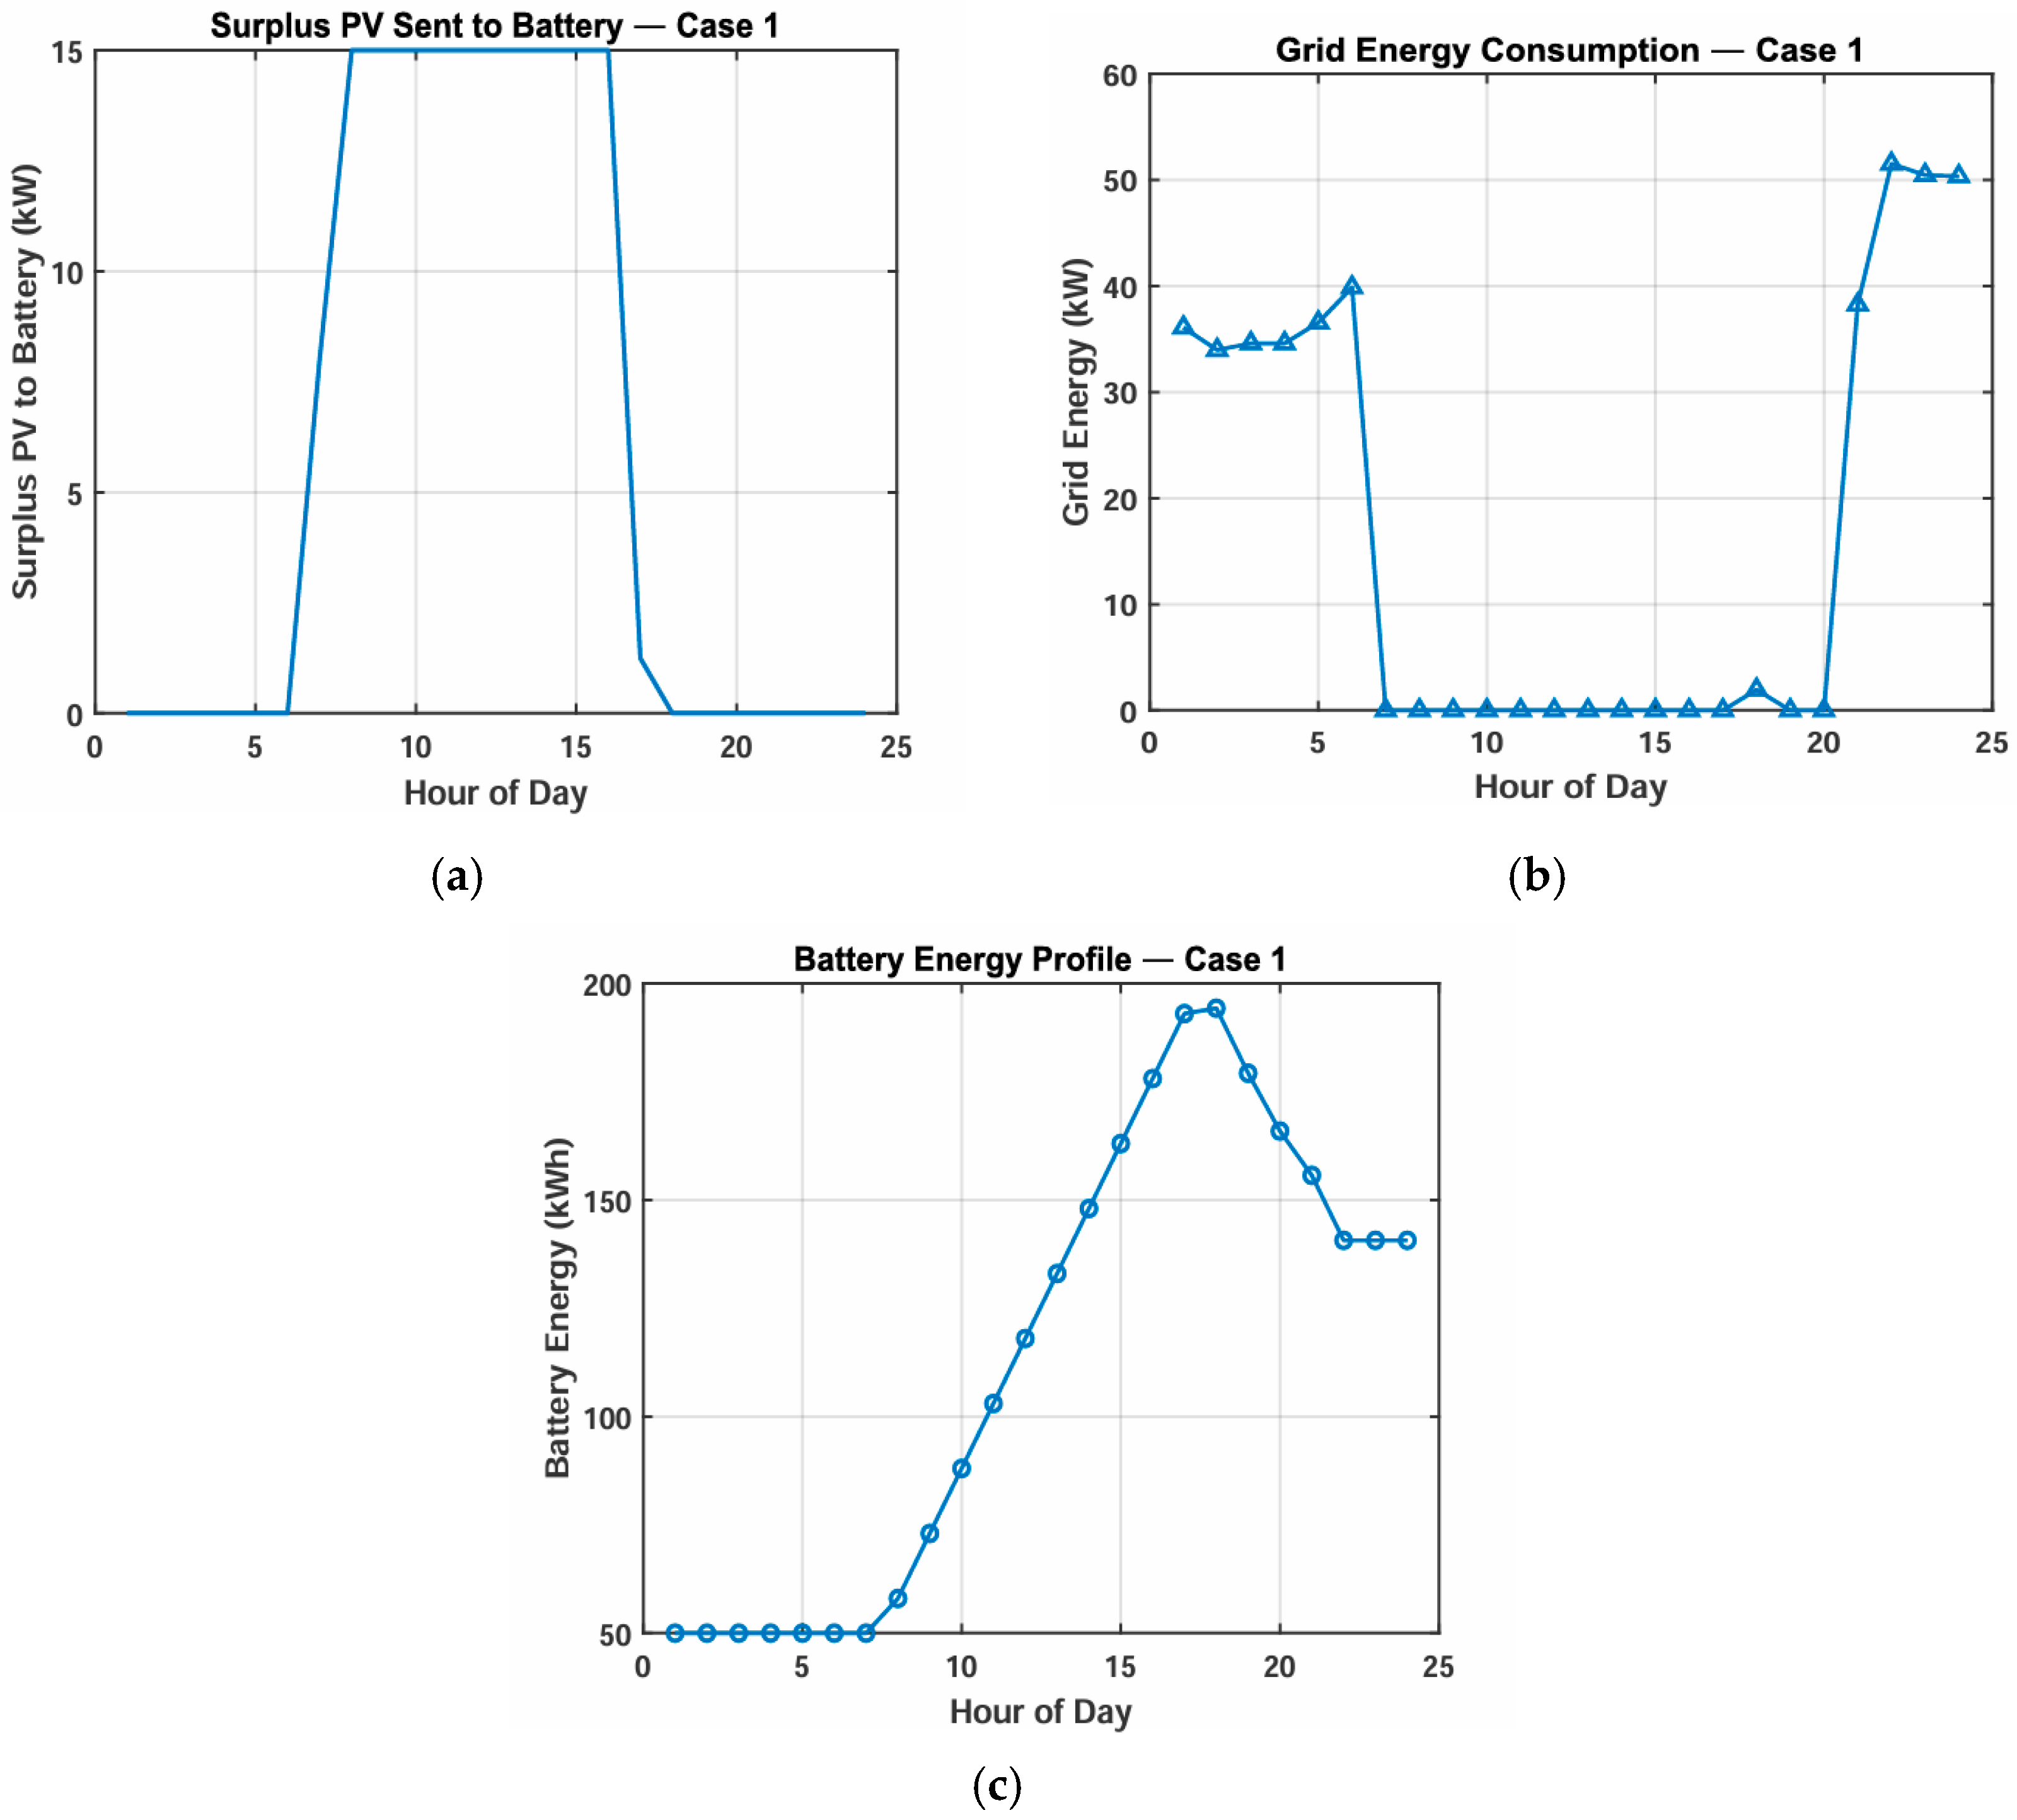
The performance of the photovoltaic–battery system without optimization or centralized control is illustrated in Figure 3.
Figure 3 illustrate the operation of the baseline PV-battery configuration on an hourly basis, employing rule-based logic devoid of optimization or centralized control. Figure 3a illustrates that the battery State of Charge (SoC) undergoes a typical daily cycle: it empties during the night and early morning, has a rapid increase with the commencement of photovoltaic (PV) generation, and attains full capacity about noon. As solar production diminishes, the state of charge decreases once more as the battery provides power for the nighttime need. Figure 3b illustrates the grid–energy import graph, which exhibits two distinct peaks: one preceding sunrise and another following dusk. This indicates that when both photovoltaic and battery power are insufficient, there is a significant dependence on the utility grid. Figure 3c compares the energy output of photovoltaic systems with the energy consumption of the community. It indicates an excess of energy during the day and a deficiency at night. These trends illustrate the issues associated with the suboptimal operations like underutilized surplus photovoltaic during mid-day, unregulated battery cycling and more reliance on the grid. Particle Swarm Optimization and AI driven centralized control can be integrated in the system for enhanced energy management.
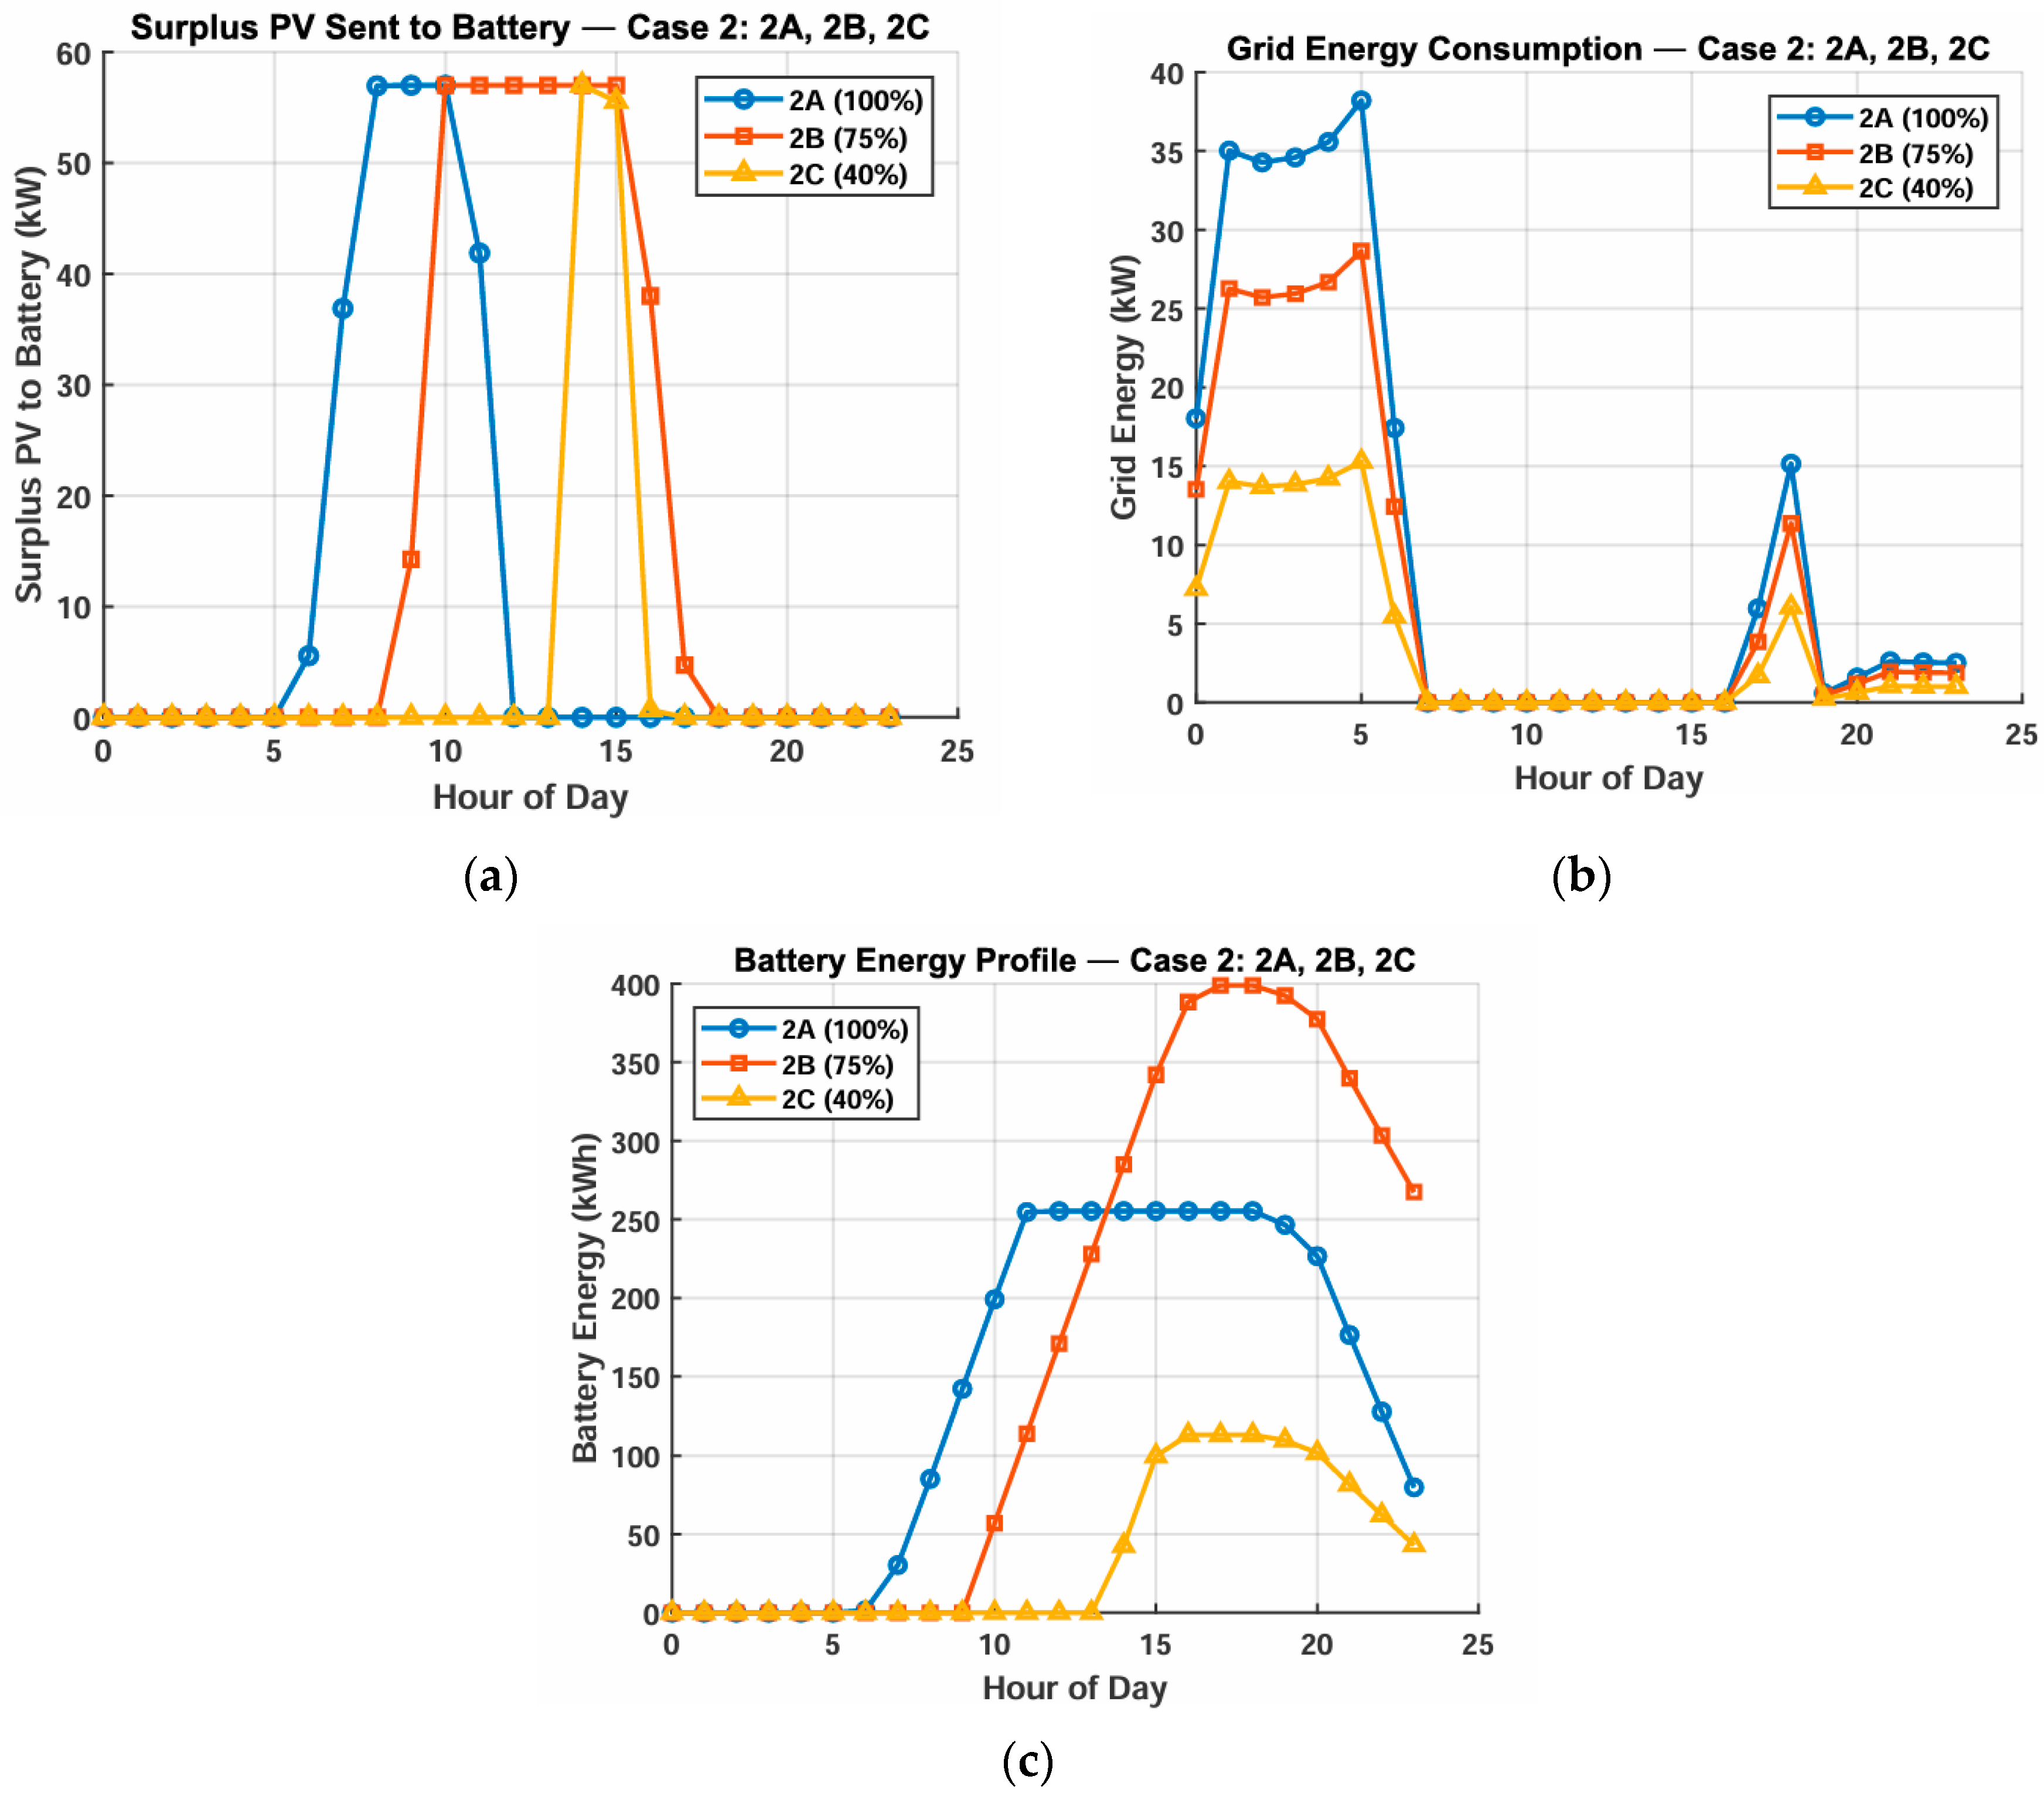
The performance of the photovoltaic–battery system with PSO-based optimization is illustrated in Figure 4.
The comparative analysis of Figure 4a–c enhances that the PSO-based optimization framework effectively enhances the coordination of photovoltaic system, battery and the grid. The system effectively accommodates the different community load levels at 100%, at 75% and at 40% by adjusting the charging and discharging cycles of the battery within the permissible limits. Battery utilization is maximized in Case 2A where frequent cycling is needed to support continuous load in order to minimize grid imports. In cases 2B and 2C, the demand diminishes and the State of Charge profiles stabilize indicating that the batteries are either partially or entirely not discharging, as the midday solar photovoltaic generation satisfies the load requirements of the community. The grid energy consumption (Figure 4b) decreases from case 2A to 2C, which indicates an increase in self-sufficiency and reduction in grid dependence. Figure 4c indicates that the photovoltaic-to-storage conversion is being done effectively particularly during day time where the demand is low. These results indicate that the proposed technique diminishes the power discrepancies, enhances the energy flow between PV and battery and establishes a balanced operation suitable for community-level solar integrated battery systems.
For a fair and unbiased comparison, Particle Swarm Optimizer (PSO), Genetic Algorithm (GA) and Grey Wolf optimizer (GWO) are executed with same objective functions, operational constraints, PV-Battery constraints, population criteria and termination parameters.
Table 3 illustrates the comparative performance of PSO, GA and GWO in Case 2 performance under the same conditions. The findings demonstrate that all the three optimizers converge to nearly identical solutions regarding grid energy import and battery utilization across all load levels. The largest discrepancy in grid import among the optimizers is less than 0.5%. It shows that the objective function has a stable optimum and the choice of heuristic algorithm does not affect the optimization result. Even though GA and GWO get similar optimal values, PSO is chosen for this study because of its user-friendliness, reduced number of control parameters and effectiveness in addressing non-linear PV-BESS scheduling problems. The comparison indicates that the observed enhancements in subsequent cases result from the central controller technique rather than bias in the optimizer.
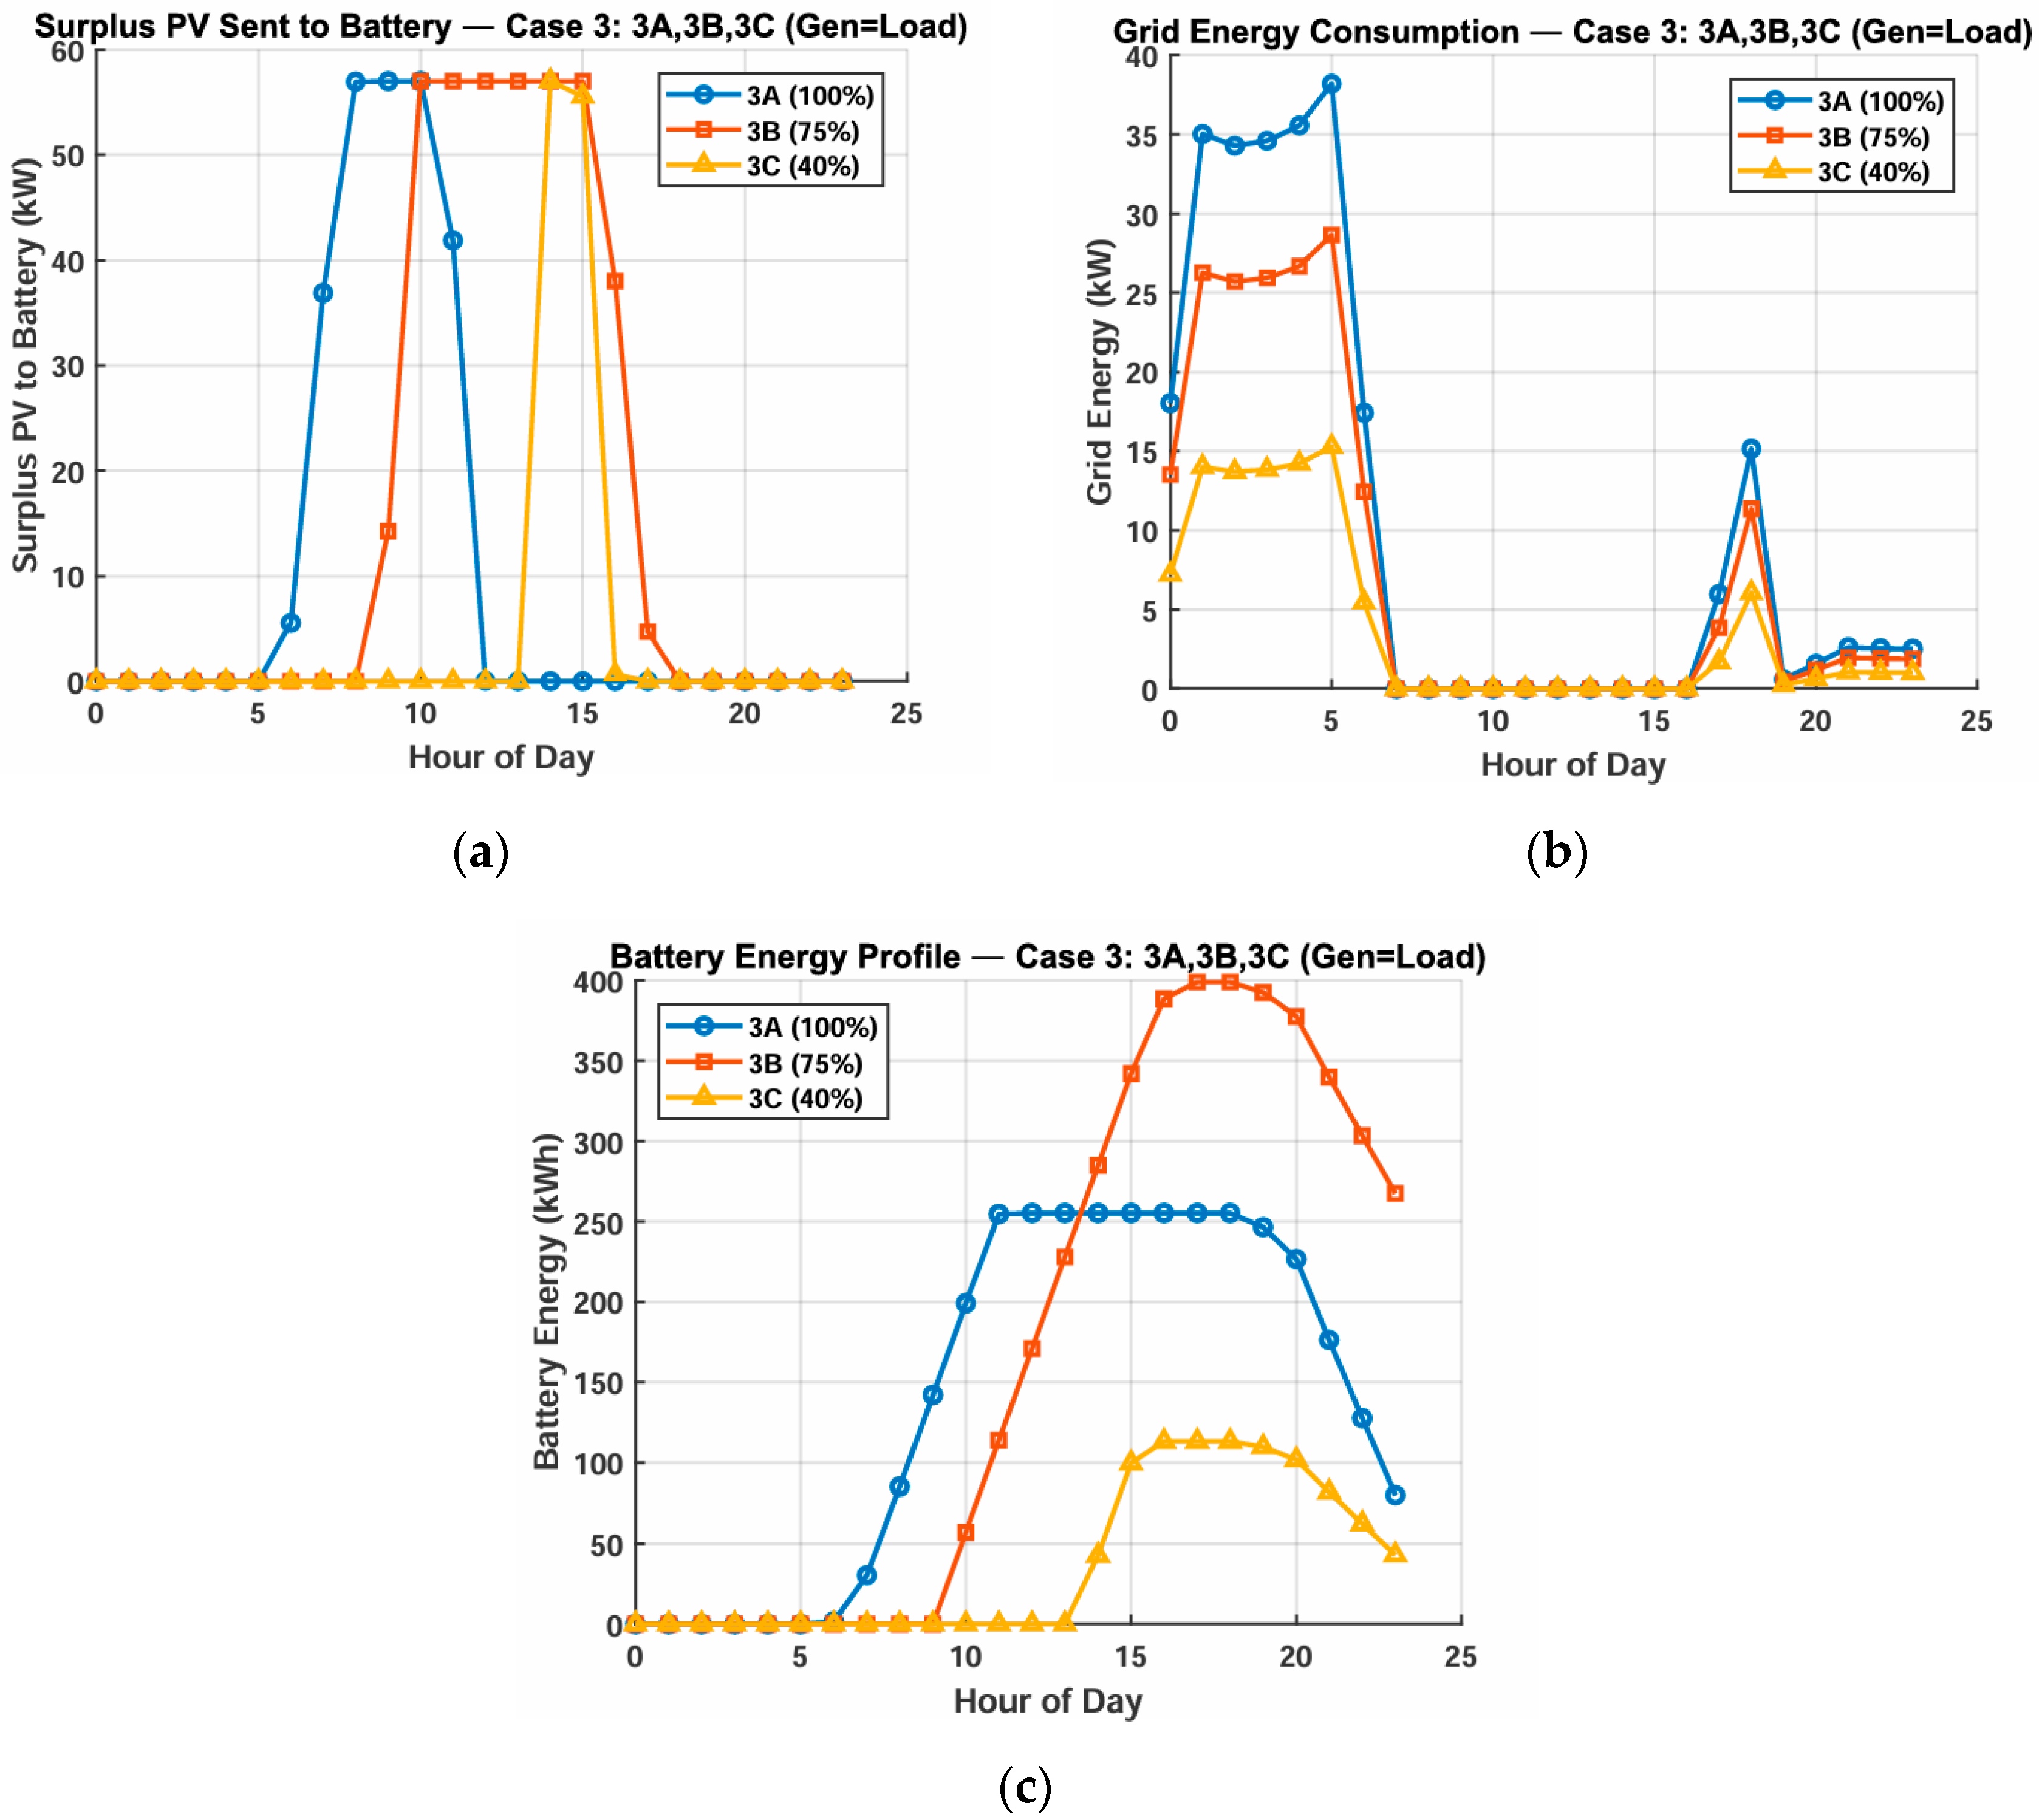
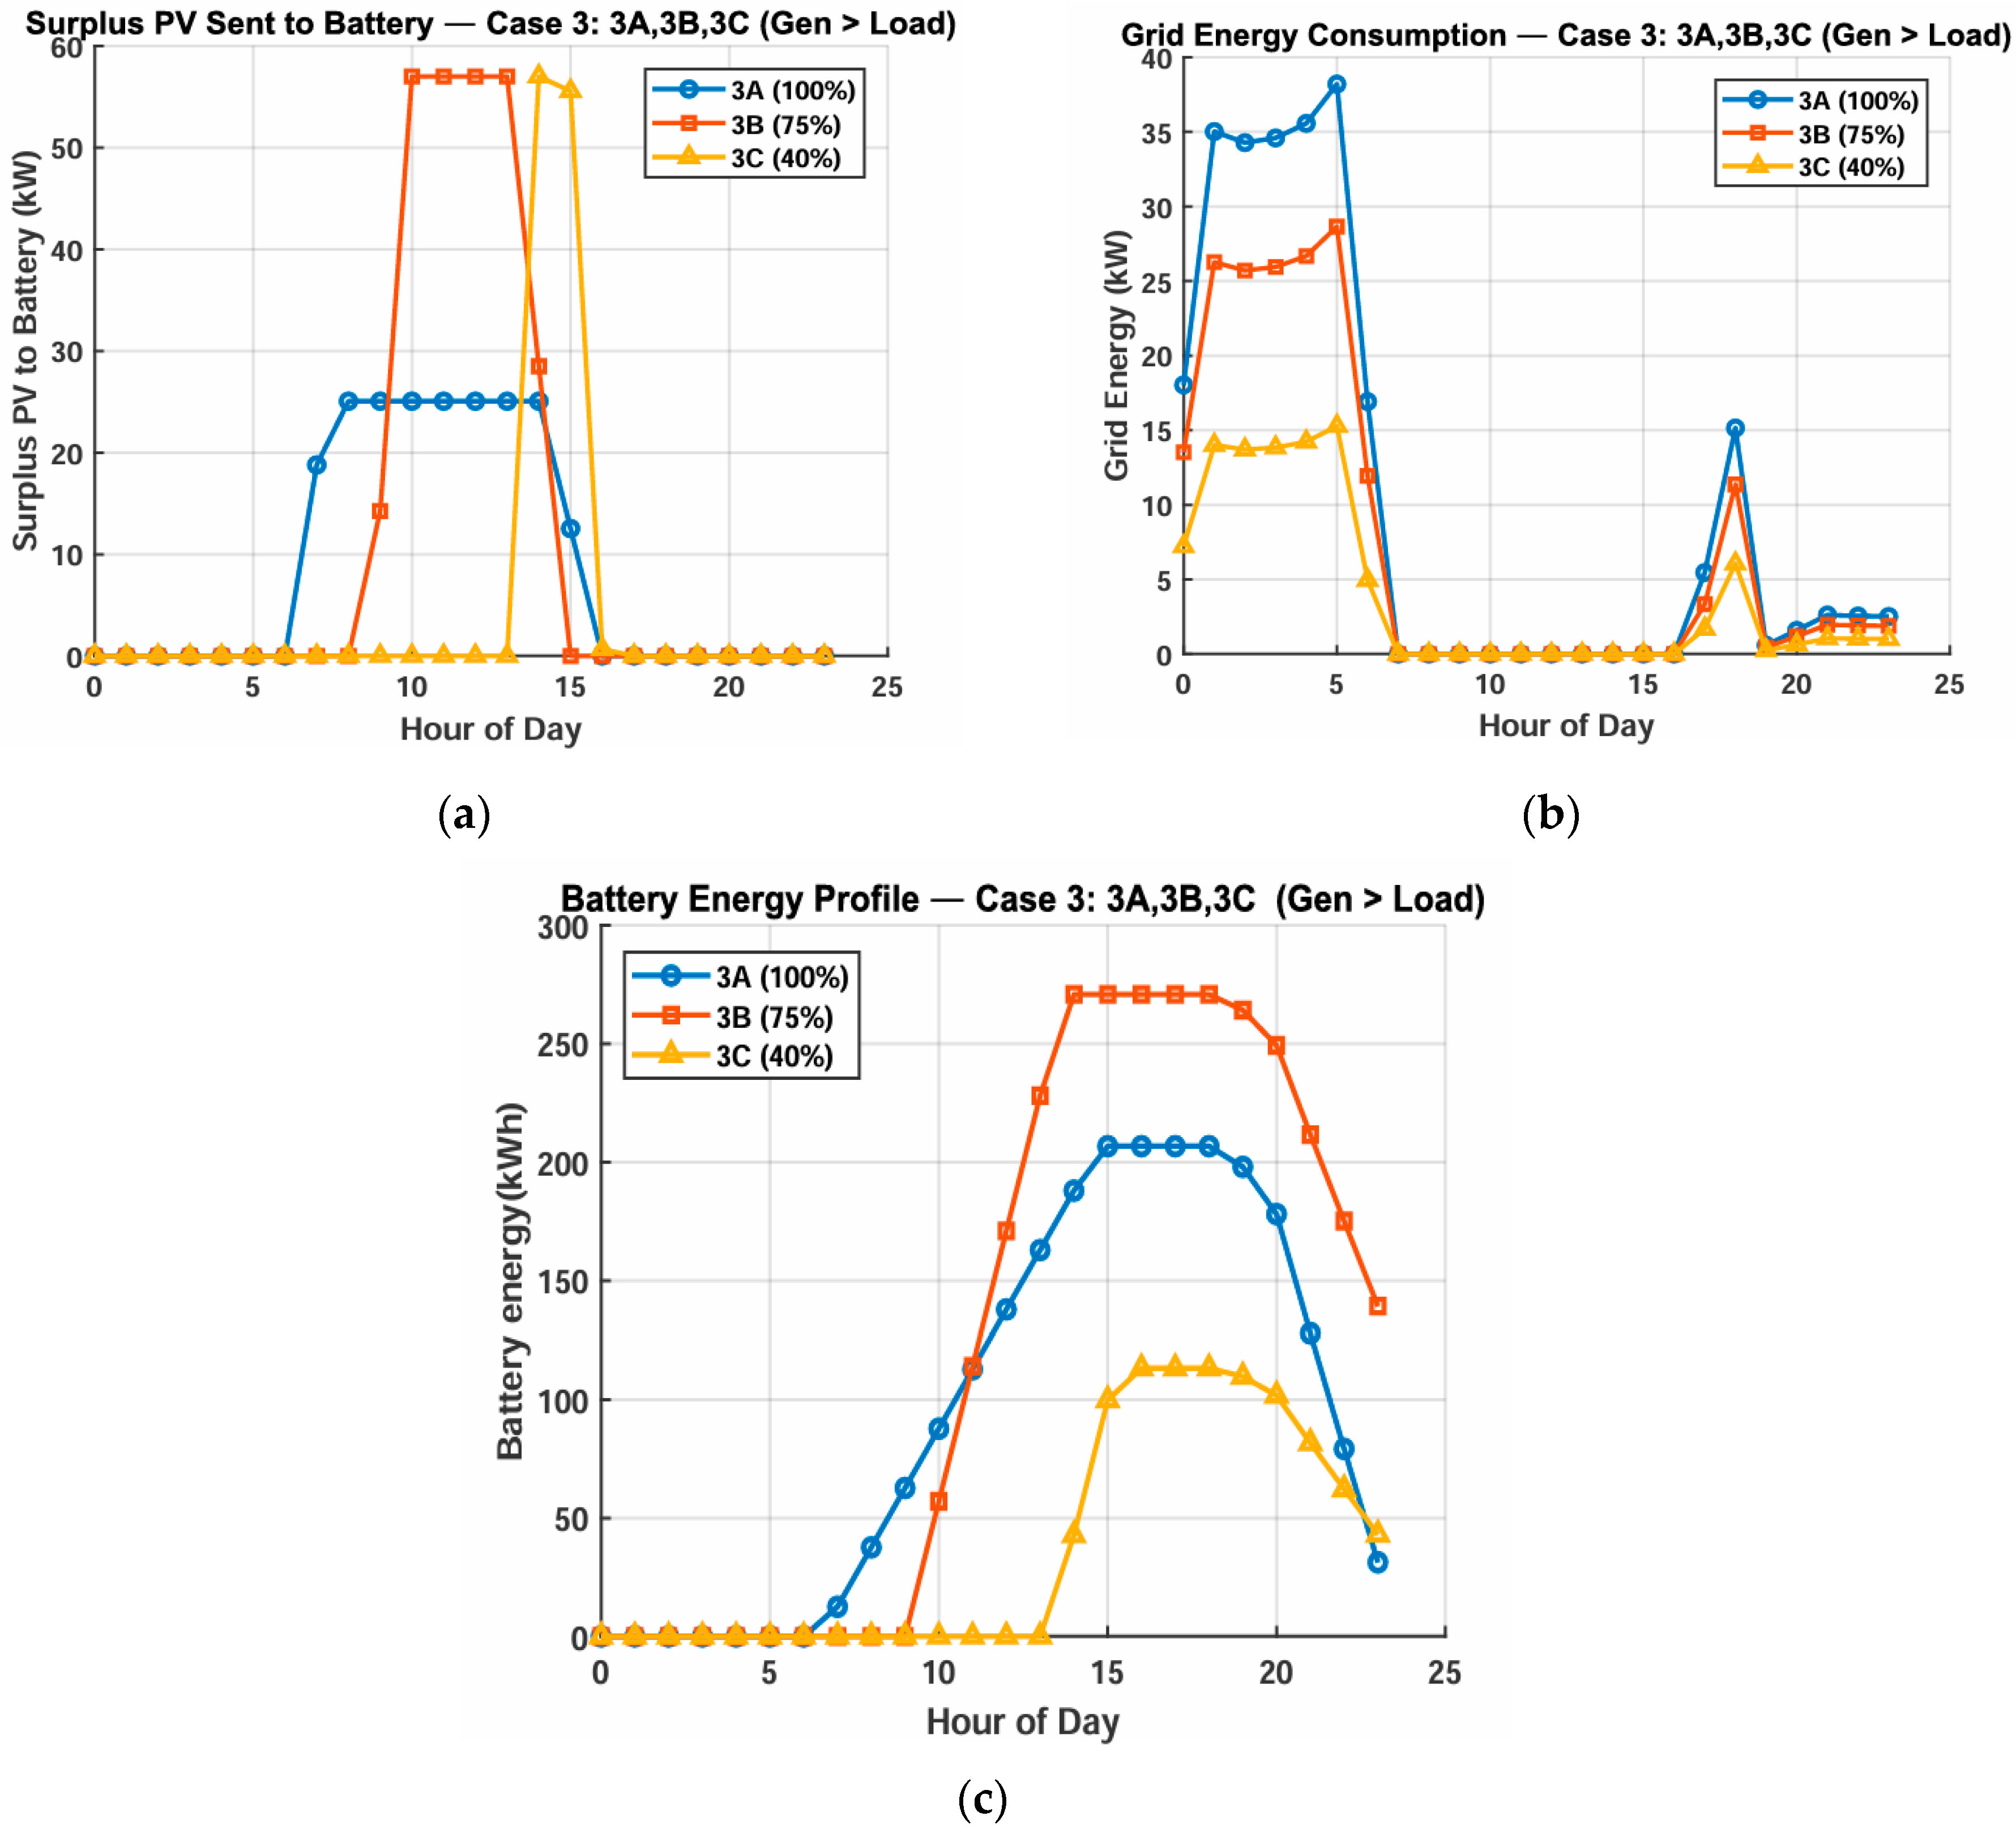
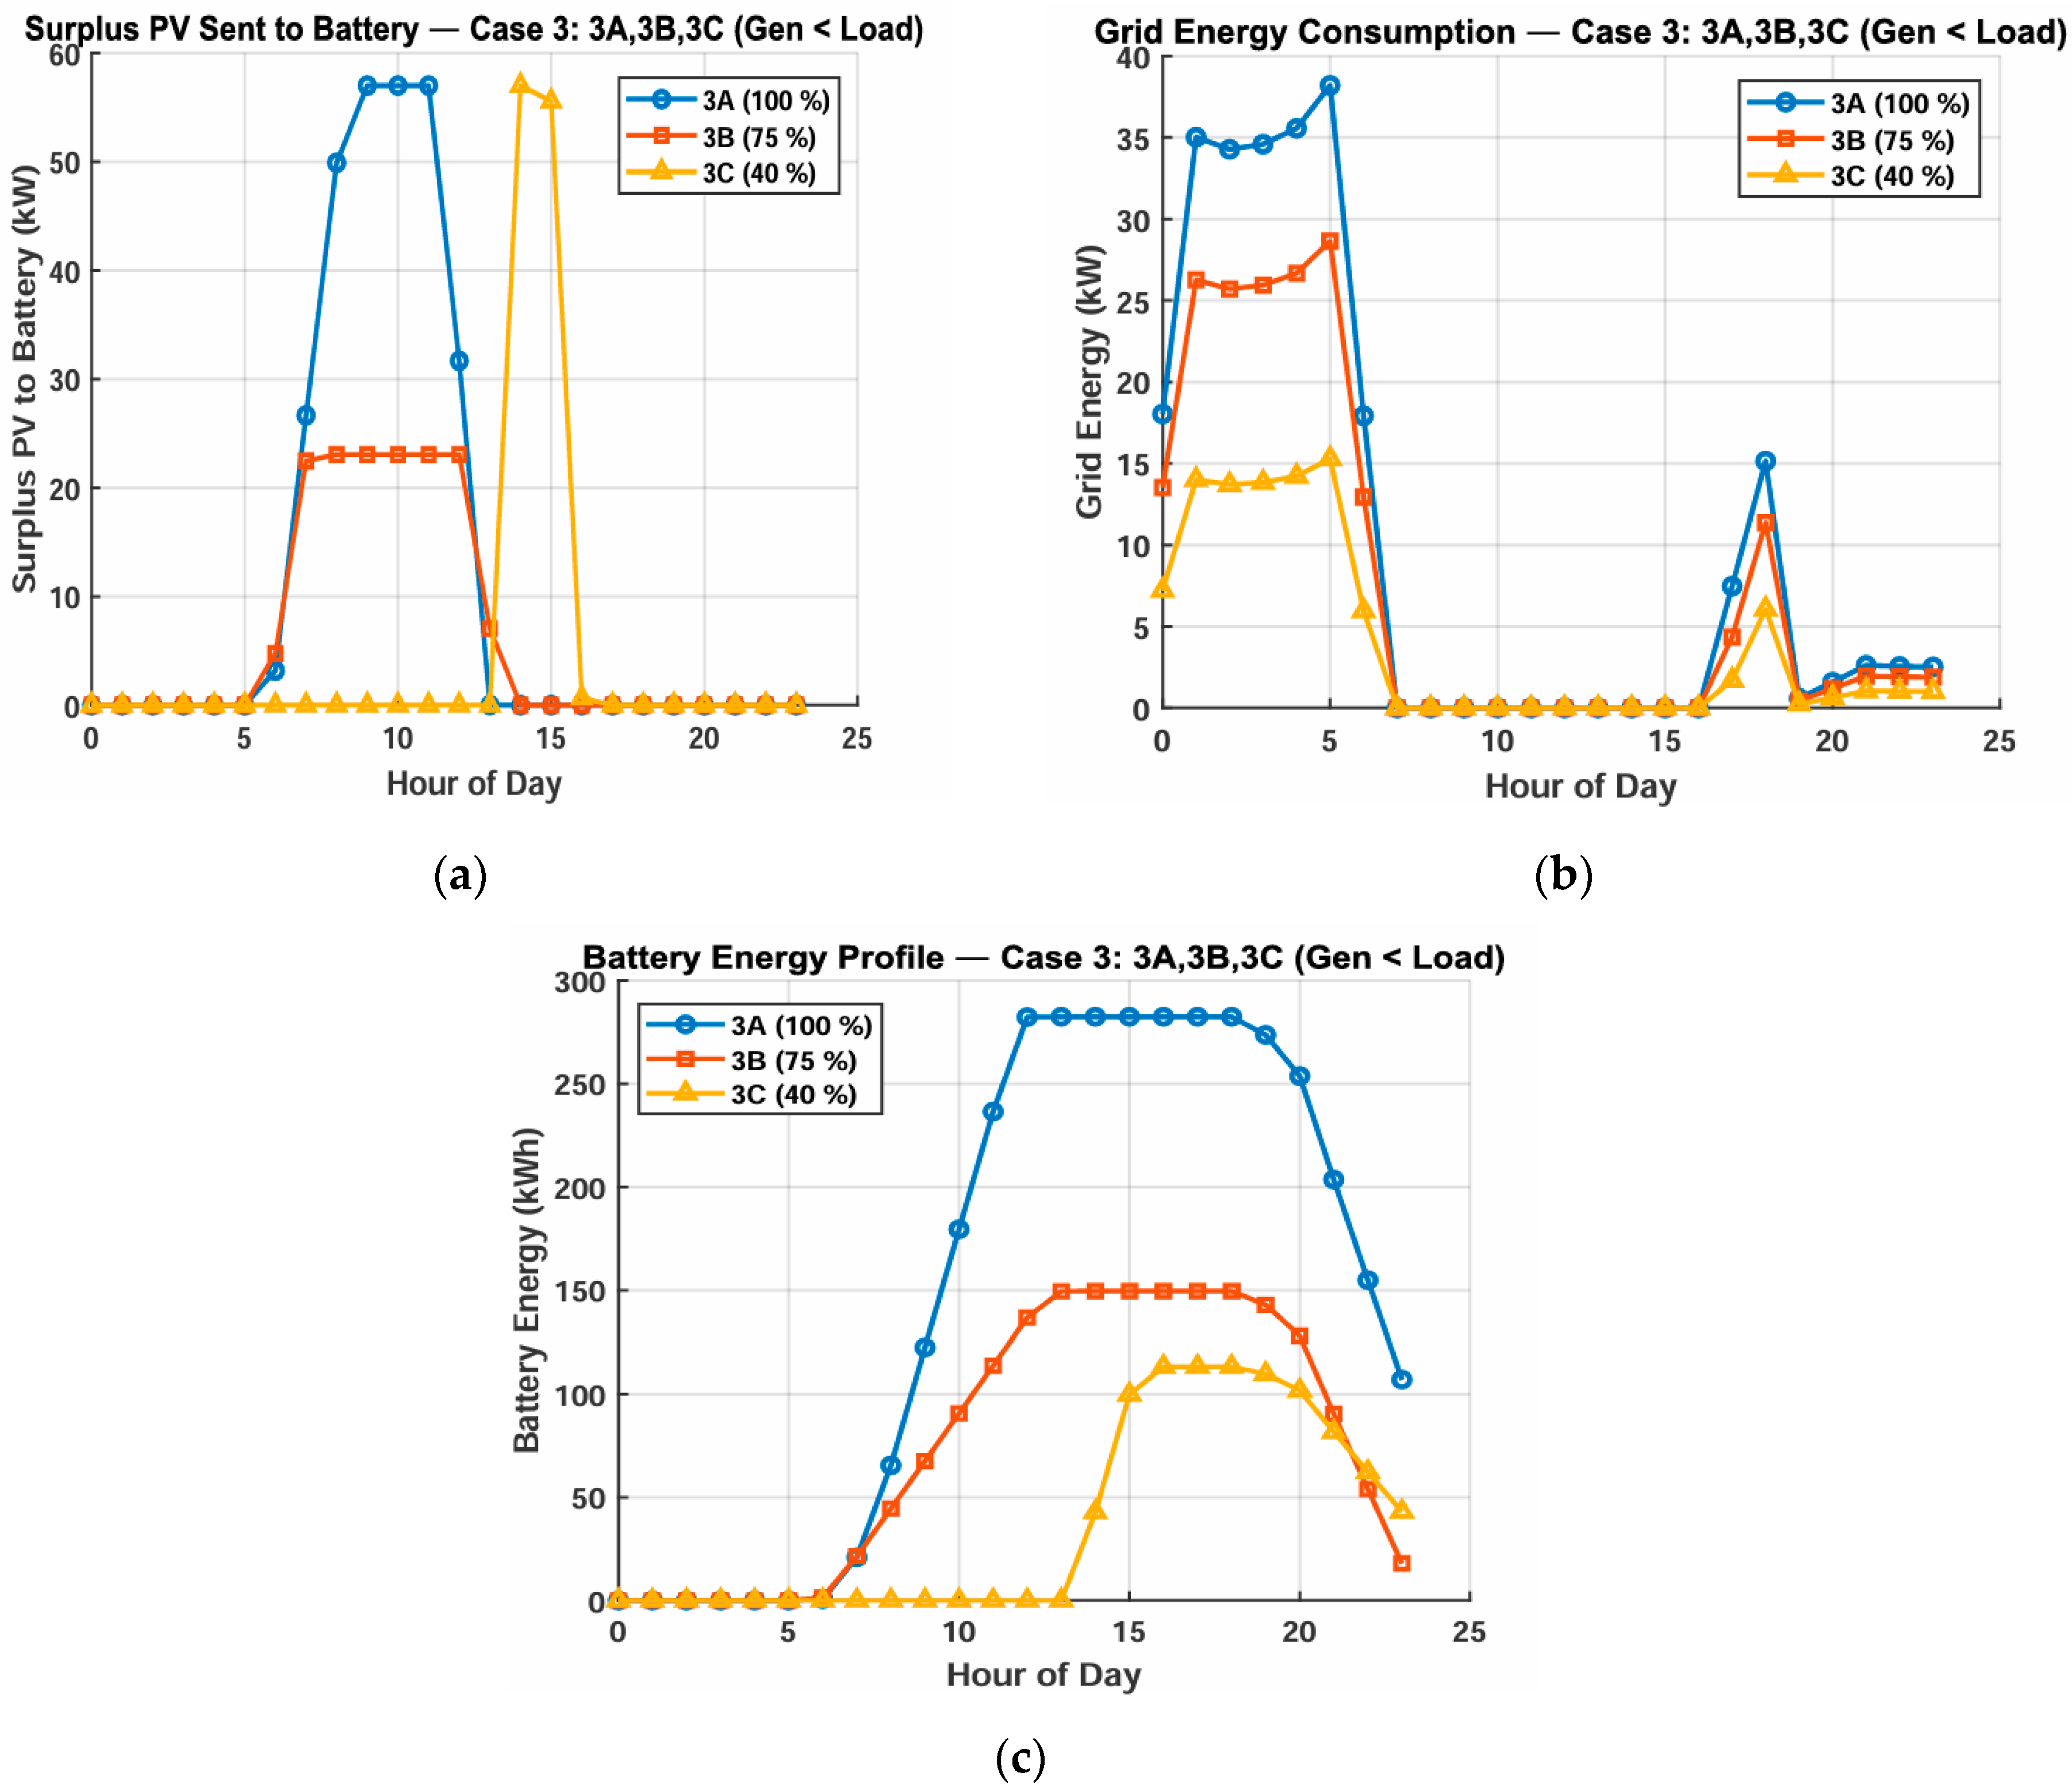
The Figure 5, Figure 6 and Figure 7 show the operation of an AI controlled photovoltaic–battery system integrated in a community with Particle Swarm Optimization data. The controller oversees the transfer of power among the photovoltaic system, grid and the charging and discharging of the battery. A sophisticated supervisory control is employed to ensure the seamless operation in the three scenarios:
  • Generation equals load;
  • Generation exceeds load, and
  • Generation less than load.
Figure 5. Case 3: A PSO-optimized system featuring AI-driven centralized energy management (Generation = Load). (a) Surplus PV power sent to battery vs. hour for cases 3A, 3B and 3C; (b) grid energy consumption vs. hour for cases 3A, 3B and 3C; (c) variation in battery energy vs. hour for cases 3A, 3B and 3C.
Energies 19 00439 g005
Figure 6. Case 3: A PSO-optimized system featuring AI-driven centralized energy management (Generation > Load). (a) Surplus PV power sent to battery vs. hour for cases 3A, 3B and 3C; (b) grid energy consumption vs. hour for cases 3A, 3B and 3C; (c) variation in battery energy vs. hour for cases 3A, 3B and 3C.
Energies 19 00439 g006
Figure 7. Case 3: A PSO-optimized system featuring AI-driven centralized energy management (Generation < Load). (a) Surplus PV power sent to battery vs. hour for cases 3A, 3B and 3C; (b) grid energy consumption vs. hour for cases 3A, 3B and 3C; (c) variation in battery energy vs. hour for cases 3A, 3B and 3C.
Energies 19 00439 g007
The controller accepts the optimized data form PSO and acquires knowledge on dispatch behavior. This mitigates grid reliance, reduces battery strain and optimizes the usage of photovoltaic system.
The performance of the photovoltaic-battery system with PSO-based optimization and centralized control for Generation = Load is illustrated in Figure 5.
Figure 5a–c demonstrates that the centralized controller utilizing the Particle Swarm Optimization maintains the generation–load equilibrium by controlling the energy flow between the PV system, battery and the grid. The SoC curve is stable and the power imported from grid approaches zero and an additional PV charging occurs during the sunny hours. By this method the PV curtailment and the reliance on the grid can be minimized. The system stability is improved by utilizing the AI based controller along with the PV system.
The performance of the photovoltaic-battery system with PSO-based optimization and centralized control for Generation > Load is illustrated in Figure 6.
Figure 6a–c illustrates the AI-based controllers’ power flow regulation for surplus generation. The system charges the battery until the State of Charge is reached in addition to meeting the load demands. The State of Charge curves indicates that the improved cycling prevents the battery degradation and extends the battery life. This scenario illustrates maximum utilization of photovoltaic energy, grid independence and intelligent distribution of power between PV systems, battery and grid. This is the optimal degree of operational efficiency across all the examined scenarios.
The performance of the photovoltaic-battery system with PSO-based optimization and centralized control for Generation < Load is illustrated in Figure 7.
Figure 7a–c illustrates the controller operation when there is a deficit in power generation by PV. The generated power will be insufficient to meet the load demands of the community. The AI-based controller manages the power flow between the PV and the battery system, and the battery is managed without excessive depletion. The curves demonstrate that the grid imports are minimized during peak hours. The controller accumulates photovoltaic surplus for charging the batteries thereby enhancing self-consumption and increases system stability even at the times of power deficit. This demonstrates how the controller maintains the equilibrium under deficit power conditions by maintaining the battery health.
The AI-based centralized framework along with Particle Swarm Optimization illustrates the integration of PV system along with the storage system in all the three scenarios. The controller adjusts the power flow by maintaining the State of Charge of battery and finds the optimum equilibrium between the self-consumption and grid import. On the other hand, Case 3 gets (i) smoother SoC transitions, (ii) less reliance on the grid, (iii) better management of surpluses and deficits, and (iv) better use of PV resources, with efficiency rates of 95–98%. This shows that the AI-based intelligent controller maintains the sustainability and grid stability in community-based PV and battery storage system.
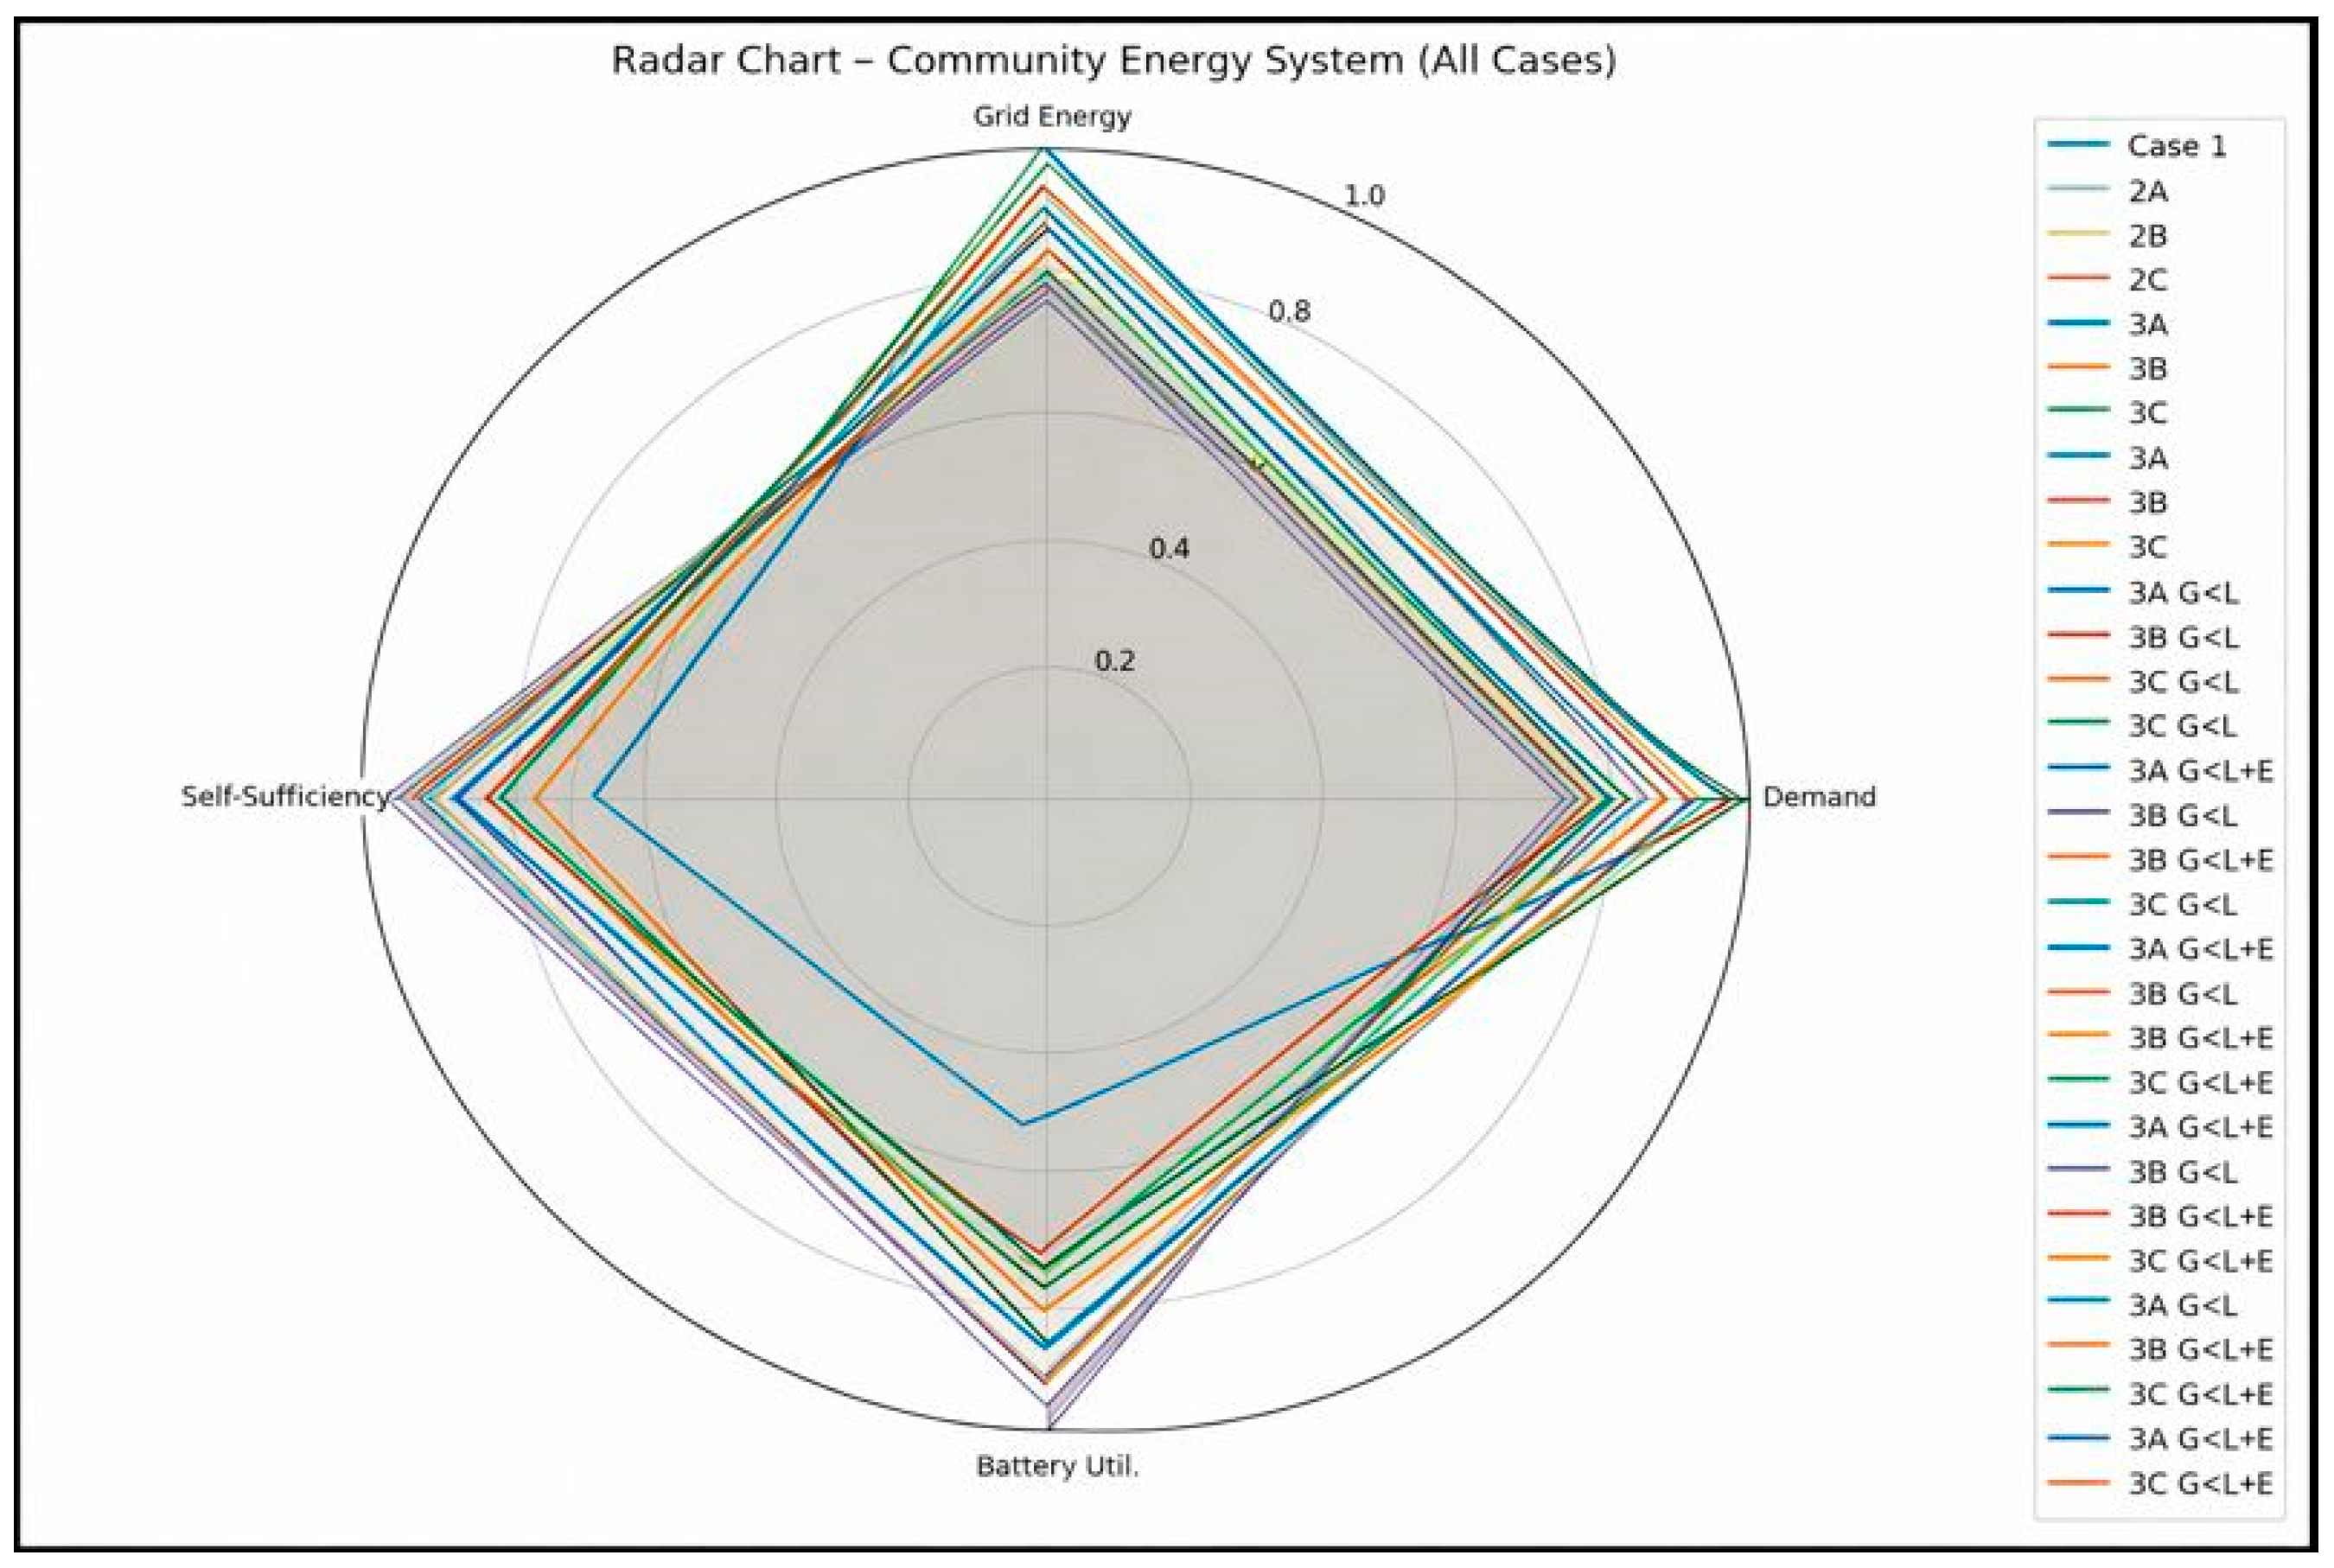
A comparison of grid energy consumption, peak demand, battery utilization, energy self-sufficiency for the 13 scenarios is shown as a radar graph in Figure 8.
Figure 8 represents a radar chart that compares the performance of the above-mentioned scenarios. The various cases such as Case 1 (baseline model) Case 2 (PSO optimized model) and Case 3 (PSO optimization along with AI controller) under three operating conditions: Generation = Load, Generation > Load and Generation < Load. The various performance metrices are
  • Grid Energy Consumption (kWh);
  • Peak Grid Demand;
  • Utilization of Battery (%), and,
  • Energy Autonomy of the system (%).
Each metric is standardized according to the maximum value observed across all cases in order to facilitate comparison across varying scales and units.
The radar map indicates that the Cases 3A and 3B exhibit higher energy self-sufficiency and enhanced utilization of battery. This indicates that these two cases when Generation = Load and Generation > Load, efficiently manages the battery utilization of the photovoltaic energy. Case 1 restricted the battery utilization and depends more on the grid. This illustrates the need of a centralized optimization and control in the system.
During the cases 2A–2C where the Particle Swarm Optimization is employed, the cases 2B and 2C requires less power and thus enhances the system efficiency and results in reduced battery utilization. In Centralized control scenario, this trade-off is mitigated due to load-matching methods and controls based on the scenarios which enhances the overall system efficiency. In situations where the generation is less than the load, the centralized system maintains the system balance by proper battery utilization and the electricity brought in from the grid.
The radar chart exhibits the progressive enhancements of the developed system under different scenarios, from the baseline model where no optimization or centralized coordination is used to case where PSO optimization is used and finally to the case where an AI-based centralized control is used in addition to the PSO based optimization technique. This shows the efficacy of the suggested energy management framework.

6.3. Comparison of Cases

Table 4 represents a quantitative accuracy of forecasting accuracy and energy management performance for Case1, Case 2 and Case 3. The lower RMSE, MAE and MAPE figures indicate that the LSTM-based forecasting framework is valid for downstream optimization. This shows that from Case 1 to Case 3 the forecasting performance is improved. From the energy management perspective, the incorporation of PSO in Case 2 reduces the grid import by 25% and peak load demand by 20%. This is mostly because of better utilization of PV and enhanced battery management. The centralized AI controller in Case 3 facilitates real-time coordinated dispatch of PV and battery. The most significant grid reduction is shown in Generation > Load scenario (42%) and peak load (35%) along with the optimal utilization of PV (91%). The centralized control technique enhances battery operation with lower State of Charge deviation. The results quantitatively demonstrate that the incorporation of centralized AI-based control yields superior performance compared to standalone and baseline conditions.

7. Model Validation

To ensure that the developed model is robust and generalizable, a model validation was done using the Tamil Nadu Electricity Board (TNEB) dataset [55]. The dataset provides household consumption profile. The validation on this dataset proves that the model is adaptable and it has real-word applicability along Indian states. The baseline, PSO optimization and the AI-based central controller models are validated and the results are tabulated in Table 5.
The validation confirms that the model performs well in the dataset obtained from TNEB. The implementation of PSO optimization technique has significantly reduced the grid import reductions from 33–75% and the battery utilization and self-sufficiency enhancement is improved by the AI controller. These results demonstrate that the implementations of AI controller improve the PV utilization, smoothen the SoC transitions, reduce the peak dependency and improve the system autonomy.
The validation results demonstrate the following:
  • The grid import reduction is improved considerably by applying Particle Swarm Optimization;
  • The centralized AI controller enhances resilience under varying scenarios considered particularly for generation = load and generation < load scenarios;
  • The proposed framework performs well with the TNEB load demands, confirming its applicability under Indian conditions.
Thus, it can be found that the proposed model is generalizable, scalable and suitable for deployment in diverse Indian communities with varying demand patterns and irradiance.

Evaluation of Statistical Reliance and Uncertainty

The validation outcomes derived from representative load profiles of the TNEB dataset is presented in Table 4. In order to evaluate the framework’s robustness, the various key performance indicators are examined across diverse operational conditions. The evaluation of the model is carried out at three demand levels (100%, 75% and 40%) and three scenarios. The resulting performance spread serves as an implicit indicator of statistical robustness. The observed fluctuation in grid energy input across scenarios remains within ±5–7%. The fluctuation for battery utilization and energy self-sufficiency remains within ±3–5%. These limited changes indicates that the proposed AI-based centralized controller maintains consistent performance despite load intensity and generation availability change. The study precisely captures the seasonal and behavioral demand typically seen in Indian residential communities.

8. Conclusions and Future Scope

A comprehensive and analytically supported framework is developed for a community based solar Photovoltaic-Battery Energy Storage Systems. The proposed system employed LSTM forecasting method for day-ahead forecasting and Particle Swarm Optimization is employed to determine the optimal scheduling of the photovoltaic systems and the batteries. The centralized AI controller manages the real time power flow in three scenarios–Generation = Load, Generation > Load and Generation < Load–among the photovoltaic system, batteries and the utility grid.
The proposed model is validated using household data of Tamil Nadu Electricity Board. The result demonstrates improved battery utilization, reduction in grid imports by maximizing the self-sufficiency across all the operating scenarios. The model has successfully adapted and it confirms that the proposed model is reliable, scalable and suitable for Indian conditions.
Future work will focus on (i) incorporating multi-objective PSO variants considering cost, emissions, and lifecycle parameters; (ii) integrating real-time IoT-enabled monitoring; and (iii) validating the proposed algorithm using field-level datasets from community microgrids in India.

Author Contributions

Conceptualization, C.K.; methodology, C.K.; software, P.P.K.P.; validation, P.P.K.P. and C.K.; formal analysis, S.L.R.P.S.D.; investigation, S.L.R.P.S.D.; resources, C.K.; data curation, S.L.R.P.S.D.; writing—original draft preparation, S.L.R.P.S.D.; writing—review and editing, C.K.; visualization, S.L.R.P.S.D.; supervision, P.P.K.P. and J.S.B.; project administration, C.K. and P.P.K.P.; funding acquisition, Not Applicable. All authors have read and agreed to the published version of the manuscript.

Funding

This research received no external funding.

Data Availability Statement

Data are contained within the article.

Conflicts of Interest

The authors declare no conflict of interest.

References

  1. Central Electricity Authority (CEA). Growth of Electricity Sector in India from 1947–2021; Government of India: New Delhi, India, 2021.
  2. NITI Aayog. Report on India’s Renewable Electricity Roadmap 2030: Towards Accelerated Renewable Electricity Deployment, Govt. of India. Available online: https://niti.gov.in/sites/default/files/2025-07/Report-on-India-Renewable-Electricity-Roadmap-2030.pdf (accessed on 25 November 2025).
  3. Jia, L.; Tong, L. Renewables and storage in distribution systems: Centralized vs. decentralized integration. IEEE J. Sel. Areas Commun. 2016, 34, 665–674. [Google Scholar] [CrossRef] [Scilit]
  4. Gui, E.M.; Diesendorf, M.; MacGill, I. Distributed energy infrastructure paradigm: Community microgrids in a new institutional economics context. Renew. Sustain. Energy Rev. 2017, 72, 1355–1365. [Google Scholar] [CrossRef] [Scilit]
  5. Soshinskaya, M.; Crijns-Graus, W.H.; Guerrero, J.M.; Vasquez, J.C. Microgrids: Experiences, barriers and success factors. Renew. Sustain. Energy Rev. 2014, 40, 659–672. [Google Scholar] [CrossRef] [Scilit]
  6. Luthander, R.; Widén, J.; Nilsson, D.; Palm, J. Photovoltaic self-consumption in buildings: A review. Appl. Energy 2015, 142, 80–94. [Google Scholar] [CrossRef] [Scilit]
  7. Deakin, M.; Crozier, C.; Apostolopoulou, D.; Morstyn, T.; McCulloch, M. Stochastic hosting capacity in LV distribution networks. In Proceedings of the 2019 IEEE Power & Energy Society General Meeting (PESGM), Atlanta, GA, USA, 4–8 August 2019; pp. 1–5. [Google Scholar]
  8. Morstyn, T.; Hredzak, B.; Aguilera, R.P.; Agelidis, V.G. Model predictive control for distributed microgrid battery energy storage systems. IEEE Trans. Control. Syst. Technol. 2017, 26, 1107–1114. [Google Scholar] [CrossRef] [Scilit]
  9. Merei, G.; Müller, D.; Sauer, D.U. Optimization of self-consumption and techno-economic analysis of PV-battery systems in commercial applications. Appl. Energy 2016, 99, 213–226. [Google Scholar] [CrossRef] [Scilit]
  10. Gamarra, C.; Guerrero, J.M. Computational optimization techniques applied to microgrids planning: A review. Renew. Sustain. Energy Rev. 2015, 48, 413–424. [Google Scholar] [CrossRef] [Scilit]
  11. Kennedy, J.; Eberhart, R. Particle Swarm Optimization. In Proceedings of the ICNN’95—International Conference on Neural Networks, Perth, Australia, 27 November–1 December 1995; Volume 4, pp. 1942–1948. [Google Scholar] [CrossRef] [Scilit]
  12. Ali, A.; Li, W.; Hussain, R.; He, X.; Williams, B.W.; Memon, A.H. Overview of current microgrid policies, incentives and barriers in the European Union, United States and China. Sustainability 2017, 9, 1146. [Google Scholar] [CrossRef] [Scilit]
  13. Taylor, J.W. Short-term electricity demand forecasting using double seasonal exponential smoothing. J. Oper. Res. Soc. 2003, 54, 799–805. Available online: http://www.jstor.org/stable/4101650 (accessed on 25 November 2025). [CrossRef] [Scilit]
  14. Hyndman, R.J.; Fan, S. Density forecasting for long-term peak electricity demand. IEEE Trans. Power Syst. 2009, 25, 1142–1153. [Google Scholar] [CrossRef] [Scilit]
  15. Ahmad, T.; Zhang, H.; Yan, B. A review on renewable energy and electricity requirement forecasting models for smart grid and buildings. Sustain. Cities Soc. 2020, 55, 102052. [Google Scholar] [CrossRef] [Scilit]
  16. Wang, Y.; Chen, Q.; Sun, M.; Kang, C.; Xia, Q. An ensemble forecasting method for the aggregated load with subprofiles. IEEE Trans. Smart Grid 2018, 9, 3906–3908. [Google Scholar] [CrossRef] [Scilit]
  17. Hochreiter, S.; Schmidhuber, J. Long short-term memory. Neural Comput. 1997, 9, 1735–1780. [Google Scholar] [CrossRef] [Scilit] [PubMed]
  18. Devi, S.L.R.P.S.; Krishna, C. Forecasting the future: LSTM-based load prediction for smart solar microgrids. AIP Conf. Proc. 2025, 3280, 030004. [Google Scholar] [CrossRef] [Scilit]
  19. Devi, S.L.R.P.S.; Krishna, C. Towards sustainable energy management: Load forecasting techniques in smart grids. AIP Conf. Proc. 2025, 3280, 030005. [Google Scholar] [CrossRef] [Scilit]
  20. Nilakanta Singh, K.; Robindro Singh, K. A review on deep learning models for short-term load forecasting. In Applications of Artificial Intelligence and Machine Learning, Lecture Notes in Electrical Engineering; Choudhary, A., Agrawal, A.P., Logeswaran, R., Unhelkar, B., Eds.; Springer: Singapore, 2021; Volume 778, pp. 705–721. [Google Scholar] [CrossRef] [Scilit]
  21. Dong, X.; Liu, J.; Xu, Y.; Wang, H.; Li, Z. Effective LSTM with K-means clustering algorithm for electricity load forecasting. In Proceedings of the SenSys: ACM International Conference Embedded Networked Sensor Systems, New York, NY, USA, 10–13 November 2019. [Google Scholar] [CrossRef] [Scilit]
  22. Mathai, M.V. Lessons from Dharnai, ‘India’s First Fully Solar Powered Village’: A Case Study; Working Paper No. 24. Azim Premji University: Karnataka, India, 2022. Available online: https://cdn.azimpremjiuniversity.edu.in/media/publications/downloads/Working-Paper-Series-_Issue-24_Pdf.pdf (accessed on 25 November 2025).
  23. Singh, S.; Negi, M. Sustainable energy in Himalayas: A case study on solar power development in Uttarakhand. J. Fundam. Renew. Energy Appl. 2024, 14, 1–5. [Google Scholar]
  24. Nair, D.R.; Nair, M.G.; Thakur, T. A smart microgrid system with artificial intelligence for power-sharing and power quality improvement. Energies 2022, 15, 5409. [Google Scholar] [CrossRef] [Scilit]
  25. Devidas, A.R.; Ramesh, M.V. Cost optimal hybrid communication model for smart distribution grid. IEEE Trans. Smart Grid 2022, 13, 4931–4942. [Google Scholar] [CrossRef] [Scilit]
  26. Lawrence Berkeley National Laboratory and Dalberg. Microgrids for Rural Electrification: Community Governance and Operating Models in India; Technical Report, LBNL-1005795; Lawrence Berkeley National Laboratory and Dalberg: Berkeley, CA, USA, 2014. Available online: https://rael.berkeley.edu/wp-content/uploads/2015/04/MicrogridsReportEDS.pdf (accessed on 25 November 2025).
  27. Etemesi, A.B.R.; Megahed, T.F.; Kanaya, H.; Mansour, D.E.A. IoT based energy management of smart microgrid considering electric vehicle integration. Energy 2025, 329, 136405. [Google Scholar] [CrossRef] [Scilit]
  28. Sathyan, S.; Pandi, V.R.; Antony, A.; Salkuti, S.R.; Sreekumar, P. ANN-based energy management system for PV-powered EV charging station with battery backup and vehicle-to-grid support. Int. J. Green Energy 2023, 21, 1279–1294. [Google Scholar] [CrossRef] [Scilit]
  29. Nair, M.G.; Solanki, S.K.; Thakur, T. Development of hybrid energy storage system testbed with instantaneous discharge controller for shunt active filter application. Sustainability 2023, 15, 11247. [Google Scholar] [CrossRef] [Scilit]
  30. Chinnadurrai, L.; Ravindran, S. Energy management of a microgrid based on LSTM deep learning prediction model. In Proceedings of the 2021 Smart Technologies, Communication & Robotics (STCR), Sathyamangalam, India, 9–10 October 2021; pp. 1–5. [Google Scholar] [CrossRef] [Scilit]
  31. Abomazid, A.M.; El-Taweel, N.A.; Farag, H.E.Z. Optimal energy management of hydrogen energy facility using integrated battery energy storage and solar photovoltaic systems. IEEE Trans. Sustain. Energy 2022, 13, 1457–1468. [Google Scholar] [CrossRef] [Scilit]
  32. Ibrahim, O.; Bakare, M.S.; Amosa, T.I.; Otuoze, A.O.; Owonikoko, W.O.; Ali, E.M.; Adesina, L.M.; Ogunbiyi, O. Development of fuzzy logic-based demand-side energy management system for hybrid energy sources. Energy Convers. Manag. X 2023, 18, 100354. [Google Scholar] [CrossRef] [Scilit]
  33. Alassery, F.; Alzahrani, A.; Khan, A.I.; Irshad, K.; Islam, S. An artificial intelligence-based solar radiation prophesy model for green energy utilization in energy management system. Sustain. Energy Technol. Assess. 2022, 52, 102060. [Google Scholar] [CrossRef] [Scilit]
  34. Basnet, S.; Deschinkel, K.; Le Moyne, L.; Péra, M.-C. A review on recent standalone and grid-integrated hybrid renewable energy systems: System optimization and energy management strategies. Renew. Energy Focus 2023, 46, 103–125. [Google Scholar] [CrossRef] [Scilit]
  35. Sigalo, M.B.; Pillai, A.C. An energy management system for the control of battery storage in a grid-connected microgrid using mixed integer linear programming. Energies 2021, 14, 6212. [Google Scholar] [CrossRef] [Scilit]
  36. Suresh, M.; Meenakumari, R. An improved genetic algorithm-based optimal sizing of solar photovoltaic/wind turbine generator/diesel generator/battery connected hybrid energy systems for standalone applications. Int. J. Ambient Energy 2021, 42, 1136–1143. [Google Scholar] [CrossRef] [Scilit]
  37. Sree Lekshmi, R.S.; Krishna, C.; Bhavan, J.S. Towards sustainable energy management: Enhancing PV performance in DC microgrids with the Aquila approach. Int. J. Intell. Eng. Syst. 2025, 18, 198–210. [Google Scholar] [CrossRef] [Scilit]
  38. Dorigo, M.; Stützle, T. Ant Colony Optimization; MIT Press: Cambridge, MA, USA, 2004. [Google Scholar] [CrossRef] [Scilit]
  39. Zheng, M.T.Z.; Yang, S. Particle swarm optimisation for scheduling electric vehicles with microgrids. In Proceedings of the IEEE Congress on Evolutionary Computation (CEC), Glasgow, UK, 19–24 July 2020; pp. 1–7. [Google Scholar] [CrossRef] [Scilit]
  40. Yan, Q.; Zhang, B.; Kezunović, M. Optimized operational cost reduction for an EV charging station integrated with battery energy storage and PV generation. IEEE Trans. Smart Grid 2019, 10, 2096–2106. [Google Scholar] [CrossRef] [Scilit]
  41. Meena, K.; Kumar, A.; Singh, R.; Swarnkar, A.; Gupta, N.; Niazi, R.; Kumar, P.; Bansal, C. Optimal planning of hybrid energy conversion systems for annual energy cost minimization in Indian residential buildings. Energy Procedia 2019, 158, 2979–2985. [Google Scholar] [CrossRef] [Scilit]
  42. Chaurey, A.; Kandpal, T.C. Assessment and evaluation of PV-based decentralized rural electrification: An overview. Renew. Sustain. Energy Rev. 2010, 14, 2266–2278. [Google Scholar] [CrossRef] [Scilit]
  43. Nema, S.; Nema, K.; Agnihotri, G. Matlab/Simulink based study of photovoltaic cells/modules/array and their experimental verification. Int. J. Energy Environ. 2010, 1, 487–500. [Google Scholar]
  44. International Renewable Energy Agency (IRENA). Renewable Power Generation Costs in 2020, Abu Dhabi, United Arab Emirates: IRENA, June 2021. Available online: https://www.irena.org/publications/2021/Jun/Renewable-Power-Costs-in-2020 (accessed on 25 November 2025).
  45. Akhil, A.A.; Huff, G.; Currier, A.; Kaun, B.; Rastler, D.; Chen, S.; Cotter, A.L.; Bradshaw, D.T.; Gauntlett, W.D. DOE/EPRI Electricity Storage Handbook in Collaboration with NRECA; SAND2013-5131; Sandia National Lab.: Albuquerque, NM, USA, 2013. Available online: https://www.sandia.gov/ess-ssl/publications/SAND2013-5131.pdf (accessed on 25 November 2025).
  46. Hesse, H.C.; Schimpe, M.; Kucevic, D.; Jossen, A. Lithium-Ion Battery Storage for the Grid—A Review of Stationary Battery Storage System Design Tailored for Applications in Modern Power Grids. Energies 2017, 10, 2107. [Google Scholar] [CrossRef] [Scilit]
  47. Xia, H.; Das, M.; Redondo-Iglesias, E. Lifetime expectancy of Li-Ion batteries used for residential solar storage. Energies 2020, 13, 568. [Google Scholar] [CrossRef] [Scilit]
  48. Li, T.; Wang, B.; Zhou, M.; Watada, J. Short-term load forecasting using optimized LSTM networks based on EMD. arXiv 2018, arXiv:1809.10108. [Google Scholar] [CrossRef] [Scilit]
  49. Jäger-Waldau, A. Photovoltaics and renewable energies in Europe. Renew. Sustain. Energy Rev. 2007, 11, 1414–1437. [Google Scholar] [CrossRef] [Scilit]
  50. Ministry of New and Renewable Energy (MNRE). National Solar Radiation Resource Assessment (SRRA) Programme. Government of India, Report on Solar Monitoring Stations Across INDIA, 2011–2022. Available online: https://research.mnre.gov.in (accessed on 25 November 2025).
  51. Kerala State Electricity Board (KSEB). Regulations for Solar Net Metering in Kerala. Available online: https://kseb.in (accessed on 25 November 2025).
  52. Poli, R.; Kennedy, J.; Blackwell, T. Particle swarm optimization: An overview. Swarm Intell. 2007, 1, 33–57. [Google Scholar] [CrossRef] [Scilit]
  53. Akinyele, O.; Rayudu, K. Review of energy storage technologies for sustainable power networks. Sustain. Energy Technol. Assess. 2014, 8, 74–91. [Google Scholar] [CrossRef] [Scilit]
  54. Yang, Y.; Wang, W.; Zhang, X.; Liu, H.; Li, H. Modelling and optimal energy management for battery energy storage systems in renewable energy systems: A review. Renew. Sustain. Energy Rev. 2022, 167, 112671. [Google Scholar] [CrossRef] [Scilit]
  55. Kalyani, K.K. Tamil Nadu Electricity Board Hourly Readings. In UCI Machine Learning Repository; University of California: Irvine, CA, USA, 2013. [Google Scholar] [CrossRef]
Figure 1. Overall framework of the proposed system.
Energies 19 00439 g001
Figure 2. Comparison of actual and forecast 24-h community load prediction utilizing LSTM, integrating actual residential and electric vehicle demand profiles. The blue curve denotes the actual load with electric vehicle usage over the preceding 24-h, whereas the orange curve illustrates the LSTM-based prediction for the subsequent 24-h interval.
Energies 19 00439 g002
Figure 3. Case 1: Photovoltaic system and battery without optimization or centralized control. (a) Surplus PV power sent to battery vs. hour; (b) grid energy consumption vs. hour; (c) variation in battery energy vs. hour.
Energies 19 00439 g003
Figure 4. Case 2: Optimizing photovoltaic systems and batteries using Particle Swarm Optimization. (a) Surplus PV power sent to battery vs. hour for cases 2A, 2B and 2C; (b) grid energy consumption vs. hour for cases 2A, 2B and 2C; (c) variation in battery energy vs. hour for cases 2A, 2B and 2C.
Energies 19 00439 g004
Figure 8. A radar graph that compares the grid energy, peak demand, battery utilization, and energy self-sufficiency across all 13 examined scenarios.
Energies 19 00439 g008
Table 1. Assumptions and parameter specifications.
Sl. No.Modeling AssumptionDetailsReference(s)
1Number of Households50 residential households with PV, BESS, and EV charging infrastructure[41]
2Average Daily Power Usage per Household6.5–8.5 kWh/dayKSEB Billing Data, [42]
3EV Charging Demand per Household7.5–10 kWh/day[40]
4PV Module Type and EfficiencyPolycrystalline;
16–18% efficiency
[43,44]
5Solar IrradiationAverage GHI: 5–5.5 kWh/m2/day (Kerala-specific)[42]
6BESS Operation WindowNight peak: 6 PM–10:30 PMAssumption for proposed work
7BESS Round-trip Efficiency85–90%[45]
8Depth of Discharge (DoD)80%[46]
9State of Charge (SoC) Limits20–100%[47]
10Power Dispatch Hierarchy1. PV self-consumption → 2. Battery charging → 3. Grid import (last priority)Assumption for proposed work
11Forecasting MethodLSTM neural networks; 24-h prediction horizon[48]
12Optimization TechniqueParticle Swarm Optimization (PSO) for battery and grid dispatch[11]
Table 2. Comparison of various forecasting methods.
Forecasting ModelRMSE (kWh)MAE (kWh)MAPE (%)
ARIMA1.050.829.6
SVR0.940.718.2
ANN0.880.667.8
LSTM (Proposed)0.470.354.9
Table 3. Comparative performance of PSO, GA and GWO in Case 2.
CaseOptimizerGrid Import (kWh)ESS (%)
2A (100%)PSO239.0661.70
2A (100%)GA239.0661.70
2A (100%)GWO239.5261.63
2B (75%)PSO178.0661.97
2B (75%)GA178.0661.97
2B (75%)GWO178.9361.78
2C (40%)PSO94.6162.11
2C (40%)GA94.6162.11
Table 4. Comparison of different cases such as baseline, PSO and PSO with AI.
CaseRMSE (kWh) MAE (kWh) MAPE (%) SoC Deviation (%) Grid Import Reduction (%) PV Utiization. (%)Peak Load Reduction (%)
Case 1–Baseline0.800.617.4±3.0 - 72 -
Case 2A–PSO 0.59 0.43 6.1 ±2.0 24 80 20
Case 3A–PSO + AI (Gen = Load)0.47 0.35 4.9 ±1.5 38 87 33
Case 3A–PSO + AI (Gen > Load) 0.52 0.38 5.6 ±1.8 42 91 35
Case 3A–PSO + AI (Gen < Load)0.58 0.44 6.4 ±2.2 27 79 28
Table 5. Validation of the proposed model under the TNEB dataset.
Case/ScenarioTotal Load (kWh)PV Generation (kWh)Grid Import (kWh)Battery Utilization (%)Energy Self-Sufficiency (%)
Case 1–Baseline624.22624.22284.4530.0054.43
Case 2A–PSO (100%)610.941122.25188.9692.8969.03
Case 2B–PSO (75%)458.201122.25138.5225.7769.78
Case 2C–PSO (40%)244.371122.2571.6337.9970.64
Case 3A–PSO + AI (Gen = Load00%)610.941122.25149.4761.2475.53
Case 3B–PSO + AI (Gen = Load-75%)458.201122.25110.6941.7075.84
Case 3C–PSO + AI (Gen = Load-40%)244.371122.2547.3187.2780.64
Case 3A–PSO + AI (Gen > Load-100%)610.941346.70186.0434.7969.55
Case 3B–PSO + AI (Gen >Load-75%)458.201346.70137.3024.5870.03
Case 3C–PSO + AI (Gen > Load-40%)244.371266.1271.3131.5370.82
Case 3A–PSO + AI (Gen < Load-100%)610.94897.80192.9592.8968.42
Case 3B–PSO + AI (Gen < Load-75%)458.20897.80140.9725.7769.23
Case 3C–PSO + AI (Gen < Load-40%)244.37897.8072.4337.9970.36
Disclaimer/Publisher’s Note: The statements, opinions and data contained in all publications are solely those of the individual author(s) and contributor(s) and not of MDPI and/or the editor(s). MDPI and/or the editor(s) disclaim responsibility for any injury to people or property resulting from any ideas, methods, instructions or products referred to in the content.