1. Introduction
In recent years, the increasing frequency of extreme weather events—such as hurricanes, ice storms, and heavy rainfall—has posed severe threats to the secure and stable operation of power distribution networks. Large-scale blackouts triggered by such events have resulted in substantial economic losses and significant disruptions to societal functions. For instance, the 2021 Texas winter storm caused nearly 5 million customers to lose power, while the 2022 extreme heat wave in Sichuan Province, China, led to province-wide power outages lasting six days. These incidents highlight the urgent need to enhance the resilience of distribution systems, i.e., their ability to withstand, adapt to, and rapidly recover from extreme disruptions.
Existing approaches to distribution system resilience enhancement can be broadly categorized into infrastructure hardening and smart operational strategies. Infrastructure hardening measures, such as undergrounding overhead lines and reinforcing vulnerable poles and towers, reduce the physical susceptibility of the network to damage. Smart operational strategies, on the other hand, focus on rapid post-event recovery by leveraging flexible resources such as remote-controlled switches, distributed generators, mobile emergency resources, and repair or switch operation crews. Among these, the coordinated scheduling of multiple restoration resources has drawn considerable research attention in recent years.
Recent research on distribution-system resilience has explored planning, fault identification, and post-event recovery from different perspectives. Ref. [
1] considered infrastructure reinforcement together with backup distributed generation and automated switching devices in a two-stage stochastic planning framework. Ref. [
2] addressed fault localization by transforming electrical measurements into image-like representations for convolutional neural network processing. Flexible energy resources have also been investigated for resilience enhancement. Ref. [
3] coordinated pumped-hydro storage with HVDC transmission under renewable-generation uncertainty, while Ref. [
4] examined the use of electric vehicles for post-disaster power support. Emergency-resource scheduling under extreme weather conditions was studied in Ref. [
5], whereas Ref. [
6] focused on seismic resilience using a particle-swarm-optimization-based method. Ref. [
7] further combined multi-microgrids and mobile energy storage for resilience assessment and enhancement.
Another important line of research focuses on the coordination of field crews and network reconfiguration during post-event restoration. Ref. [
8] combined repair-crew scheduling with sequential topology adjustment to improve load restoration. Ref. [
9] jointly optimized maintenance and restoration crews together with network reconfiguration. Spatial and temporal coupling between crew routing and topology changes was further considered in Ref. [
10]. Ref. [
11] integrated repair sequencing, adaptive reconfiguration, and distributed energy resource management within a coordinated restoration framework. Closely related to the present study, Ref. [
12] considered RCSs, distributed generators, manual switches, and crew-assisted switching in a resilience-oriented FLISR framework.
Beyond conventional repair-based restoration strategies, recent studies have increasingly investigated the coordinated use of mobile emergency resources and switching resources. Reference [
13] developed a two-stage framework for the pre-positioning and post-event routing and scheduling of mobile power sources, including electric vehicle fleets, mobile energy storage systems, and mobile emergency generators, while considering the coupling between distribution and transportation networks. Reference [
14] proposed a critical-load restoration framework that coordinates mobile power sources and repair crews traveling through the transportation network under dynamic traffic conditions. Reference [
15] developed a two-stage stochastic scheduling model for distribution network resilience enhancement against ice storms by coordinating mobile deicing equipment routing and distributed energy resource dispatch under uncertainties in line failures and renewable generation. Reference [
16] proposed risk-averse pre-disaster allocation and post-disaster dispatch strategies for power emergency resources and repair crews, using distributionally robust optimization to account for uncertainties in system damage and emergency-resource demand. Reference [
17] developed a stochastic mixed-integer linear programming model that coordinates pre-event network reconfiguration using RCSs, manual switches, and distributed generation, together with crew and mobile emergency generator pre-positioning and post-event restoration operations. Preventive islanding supported by distributed generation has also been investigated as a means of sustaining critical loads during utility outages. Reference [
18] showed that a properly planned transition to islanded operation can provide support to critical loads during utility outages, which further motivates the pre-event topology preparation considered in this study. To further clarify the positioning of the present study,
Table 1 compares the proposed method with representative restoration studies in terms of RCSs, manual operation, crew involvement, pre-event actions, and RCS faults.
Despite the substantial progress in distribution system restoration, an important operational issue remains insufficiently addressed. Existing studies have considered remotely controlled switches, inherently manual switches, network reconfiguration, and field crews in different combinations. However, a different restoration condition arises when a device that is originally remotely controllable loses its remote operability following an extreme event while remaining manually operable. Under this condition, the switching state of the affected RCS must remain unchanged until a field crew reaches the corresponding location and completes the required on-site operation. This creates a temporal coupling among RCS availability, crew dispatch, and network reconfiguration. Furthermore, this coupling should be considered across the successive processes of fault propagation, remote fault isolation, and crew-assisted service restoration.
Accordingly, the central research question of this study is how the loss of remote operability in RCSs affects distribution system restoration and how coordinated remote switching and crew-assisted field operations can mitigate the resulting load shedding. To address these limitations, this paper proposes a multi-stage resilience enhancement method for distribution networks that coordinates remote-controlled switches and switch operation crews under RCS fault conditions. The main contributions of this work are as follows: (1) A four-stage restoration framework encompassing pre-event prevention, degradation, fault isolation, and service restoration is established, in which the operational status of RCSs is explicitly differentiated into normal and faulty states. Normal RCSs can be remotely operated during the fault isolation stage, while faulty RCSs can change their switching states only through on-site crew intervention during the service restoration stage. (2) A coupled constraint formulation is developed to model the crew-assisted switching logic of faulty RCSs, linking the movement and arrival of switch operation crews at faulty RCS nodes with the restoration of switch operability. (3) A scenario-based stochastic programming model is formulated to minimize the expected weighted load shedding across all stages, and the effectiveness of the proposed approach is validated through comparative case studies on the modified IEEE 33-bus distribution system.
The remainder of this paper is organized as follows.
Section 2 describes the multi-stage restoration problem and the modeling framework.
Section 3 presents the mathematical formulation of the proposed model.
Section 4 provides case study results and comparative analyses.
Section 5 concludes the paper with key findings and directions for future work.
2. Problem Description
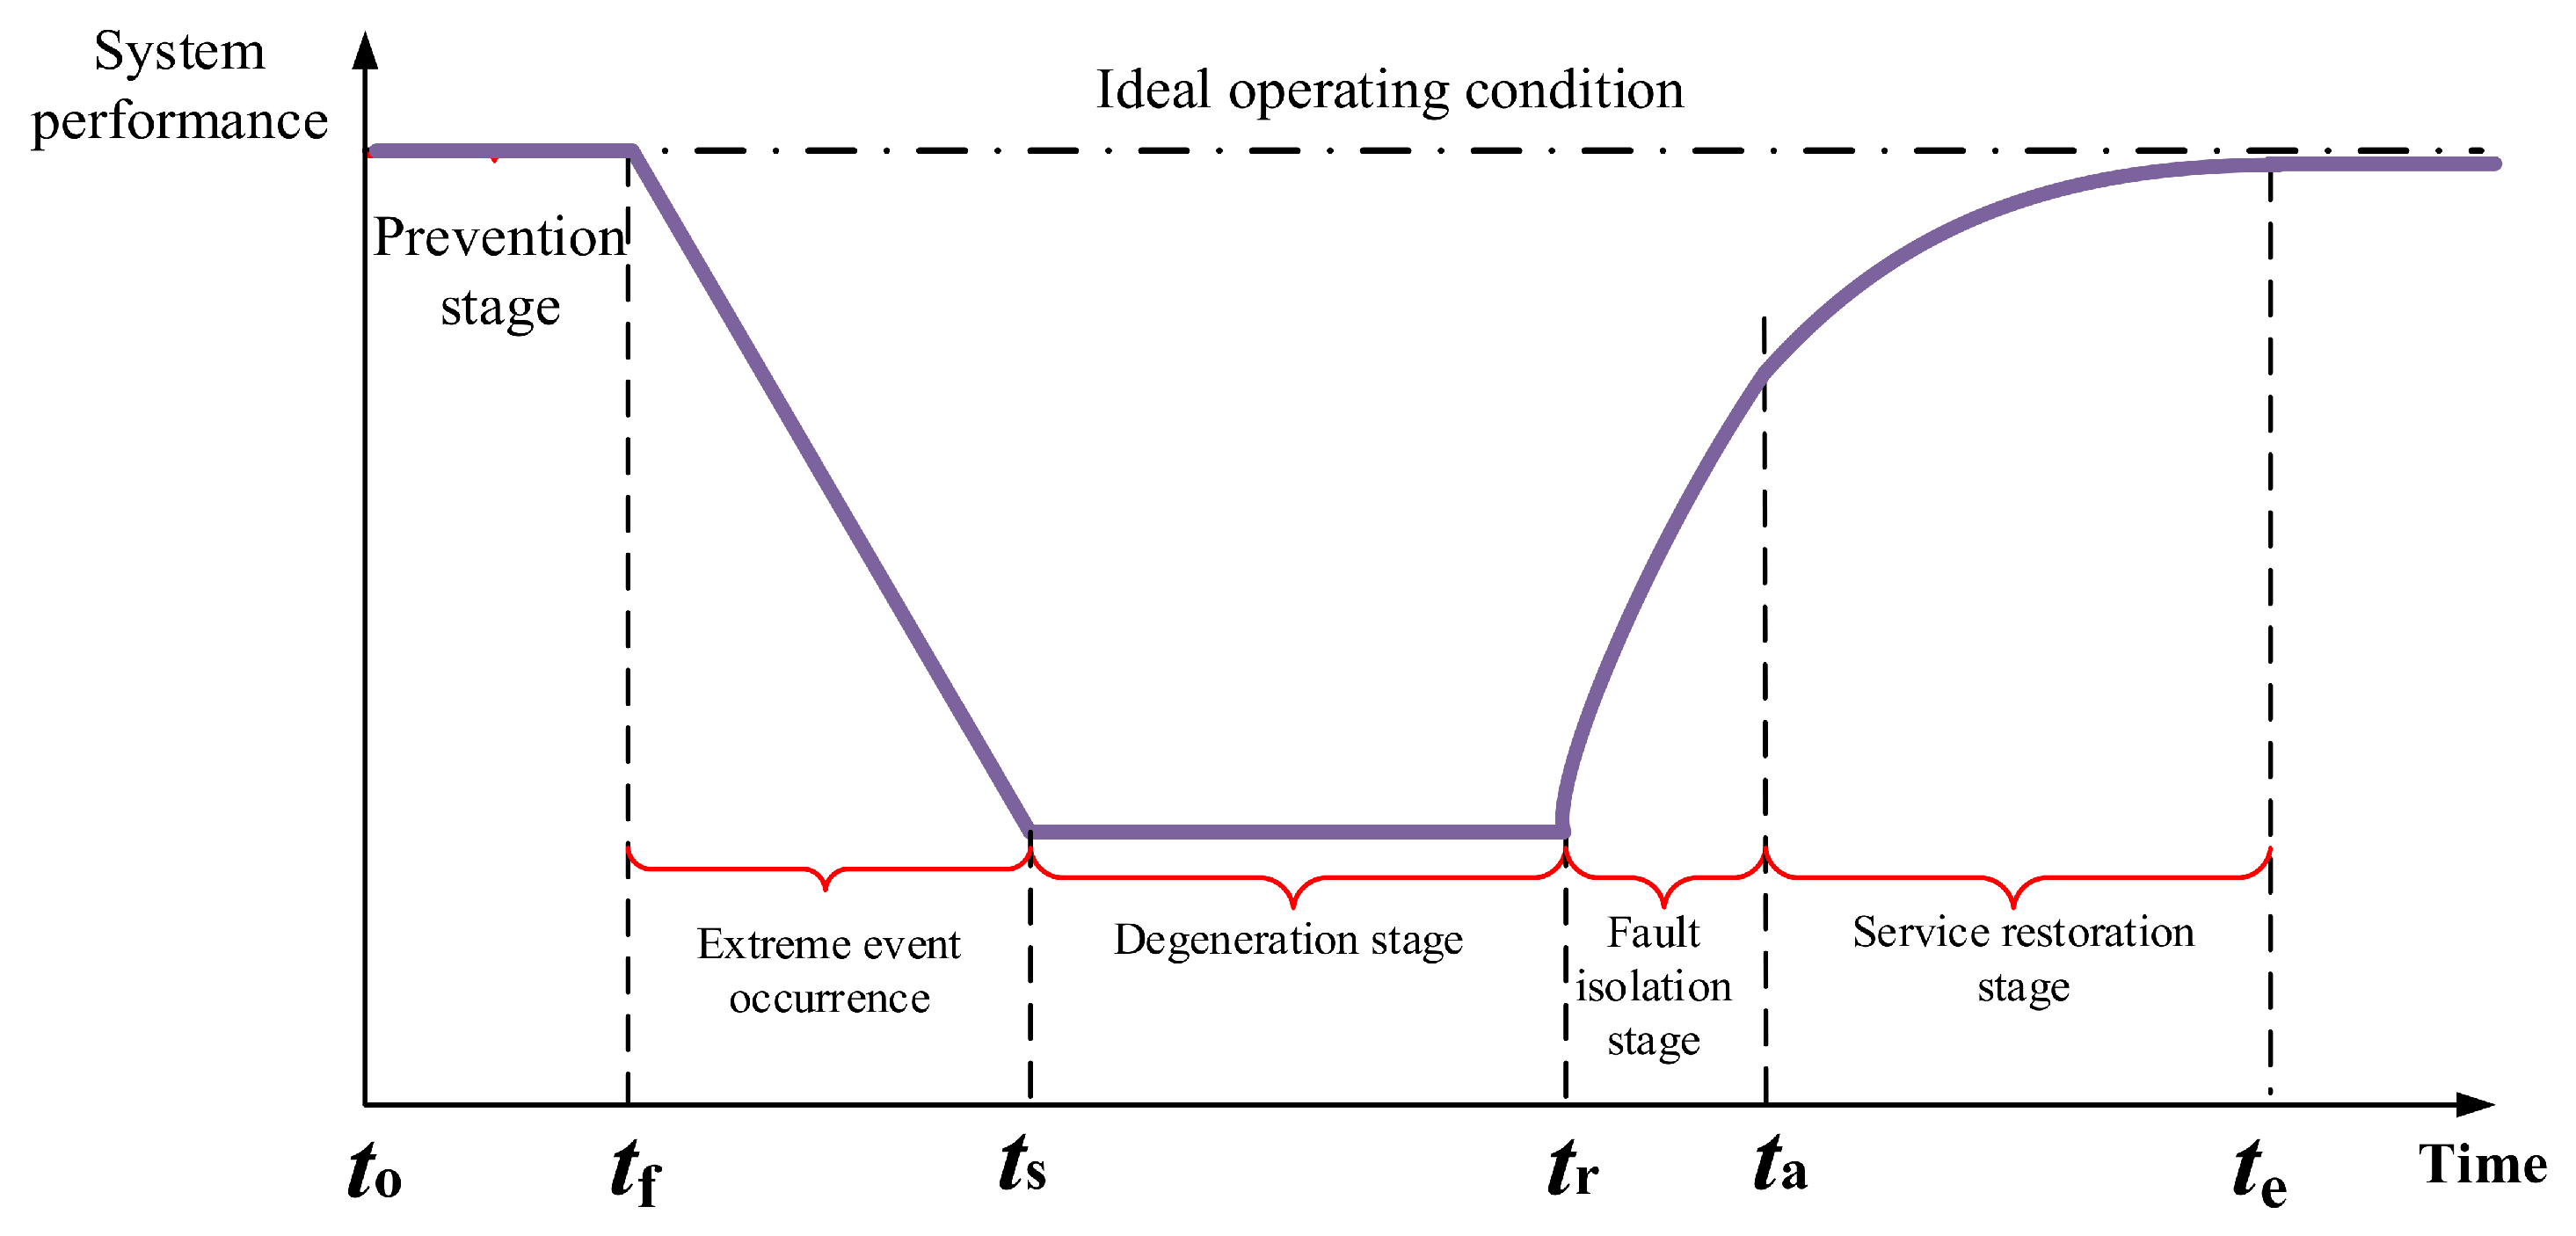
The response of a distribution system to an extreme event can be characterized by the resilience curve shown in
Figure 1. The entire process is divided into four stages: pre-event, degradation, fault isolation, and service restoration. In the pre-event stage, the system operator can reconfigure the network to form preventive islands, which helps limit the propagation of faults once the event occurs. When the extreme event strikes, several lines suffer permanent faults, and the system enters the degradation stage. During this stage, no switching operations are performed, and faults propagate along closed branches, causing a large portion of the network to lose power. The degradation stage also accounts for the time required for fault detection and localization after the extreme event. During this period, no corrective switching operation is performed. In the present model, the duration of this stage is predefined, and the fault locations are assumed to be correctly identified when the system enters the subsequent fault-isolation stage. Uncertainty in fault localization and the detailed communication-assisted diagnosis process are beyond the scope of this study.
Once fault locations are identified, the fault isolation stage begins. At this stage, functional RCSs can be remotely opened to separate the faulted zones from the healthy parts of the network. In this study, an RCS fault refers specifically to the loss of remote operability while manual on-site operation remains feasible. The binary RCS-fault indicator therefore represents an operational availability state rather than a specific physical failure mechanism. Communication failures, remote-control failures, or certain actuation failures can be represented by this state when they prevent remote operation but still permit manual operation. Complete mechanical switch failures that prevent both remote and manual operation are outside the scope of the present formulation. Under this definition, a faulty RCS cannot respond to remote commands and remains frozen until the required crew intervention is completed.
After the faulted zone has been reduced as much as possible through remote operations, the service restoration stage begins. During this stage, switch operation crews are dispatched to the locations of faulty RCSs. After traveling to the corresponding buses and spending the required on-site operation time, the crews perform the required on-site switching operations, enabling further fault isolation and network reconfiguration to restore the remaining de-energized loads.
The multi-stage restoration process described above involves two distinct time scales. The remote operation of normal RCSs is nearly instantaneous, whereas crew travel and on-site operation require multiple time intervals. The presence of faulty RCSs therefore couples the crew scheduling with the network reconfiguration: the ability to change the state of a faulty RCS is conditional on the arrival of a crew at the corresponding bus. This dependency, together with the dynamic propagation of faults across the network, constitutes the core problem addressed in this paper. The objective is to minimize the expected load shedding across all stages by jointly optimizing the pre-event topology, the remote switching operations, and the dispatch of switch operation crews.
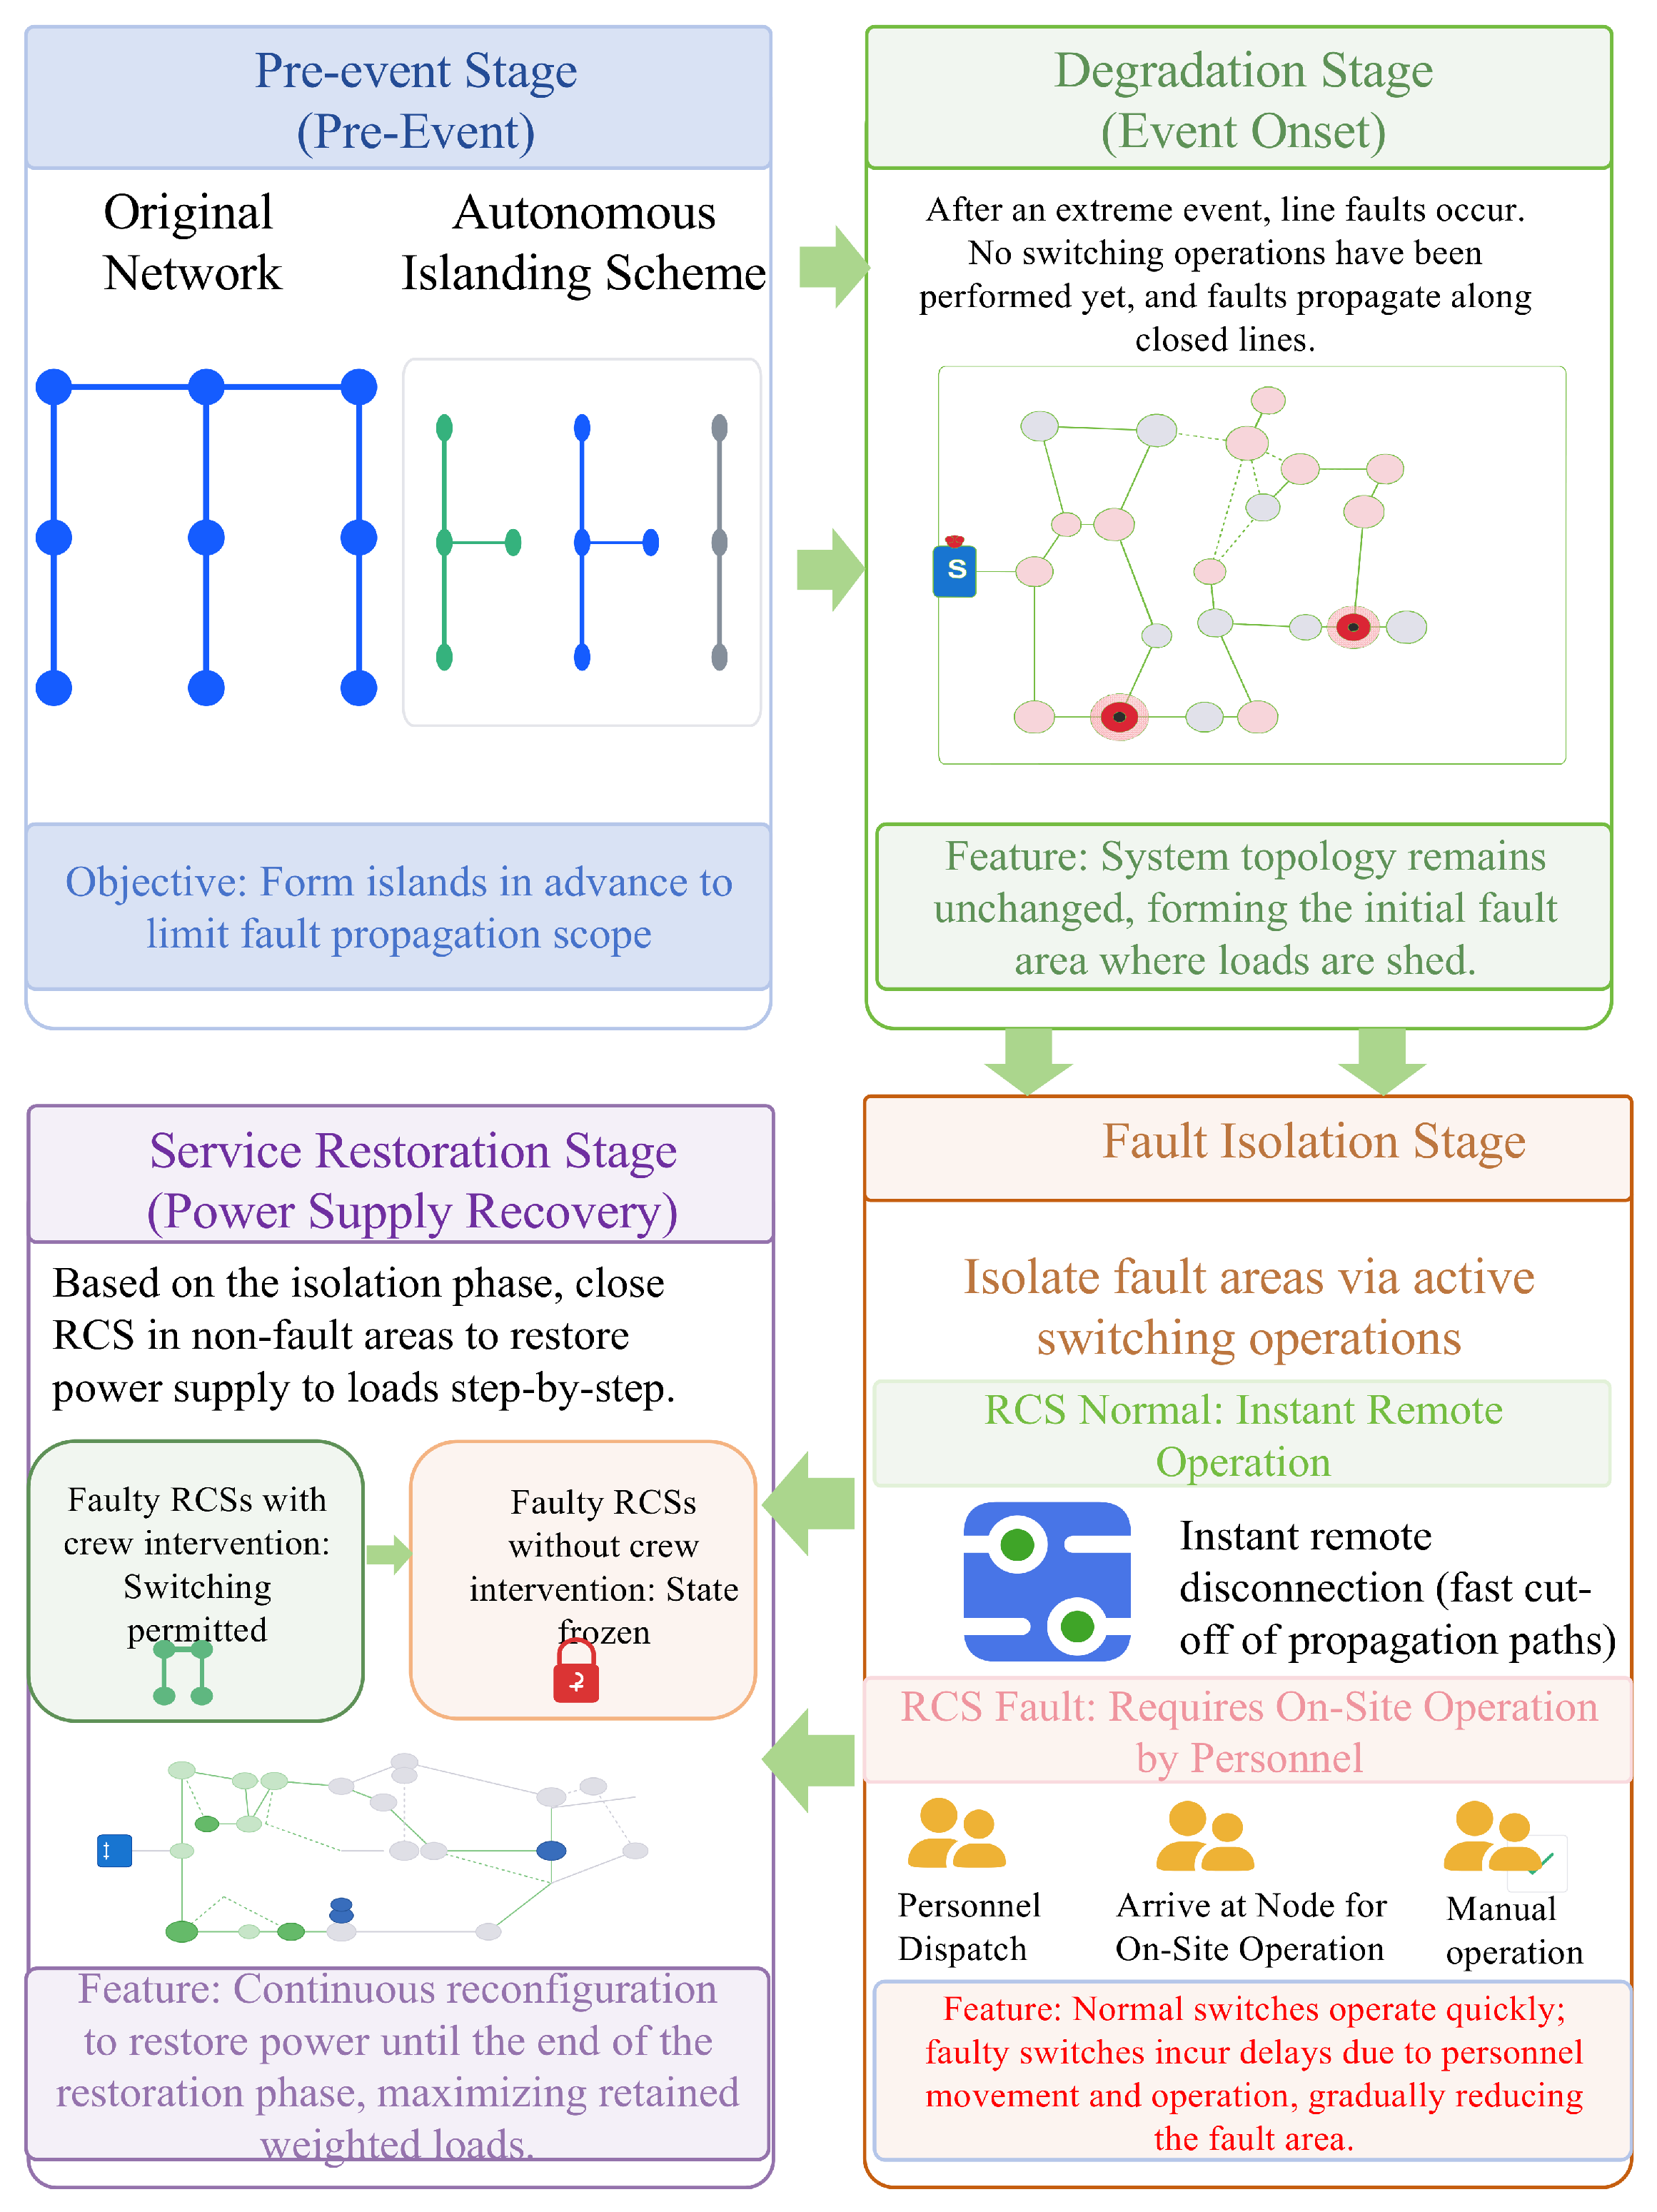
Figure 2 illustrates the overall framework of the proposed multi-stage resilience enhancement method. The entire response process is divided into four sequential stages. In the pre-event stage, autonomous islands are formed to pre-emptively limit the fault propagation scope. The degradation stage records the initial outage area immediately after fault occurrence. During the fault isolation stage, normal RCSs are remotely opened to rapidly shrink the faulted zone, while faulty RCSs remain frozen. In the service restoration stage, switch operation crews manually operate faulty RCSs on site and cooperate with network reconfiguration to progressively restore loads. The four stages proceed in a coordinated manner, with switch statuses and crew dispatch interacting throughout the entire process.
4. Case Study
4.1. System Configuration and Scenario Design
The proposed method is validated on the modified IEEE 33-bus distribution system. Three controllable distributed generators (DGs) are connected at buses 18, 21, and 24, with a total capacity of 1.6 MW. Five tie lines are located at branches 33 to 37. All 37 branches are equipped with remote-controlled switches (RCSs). The time horizon consists of four consecutive stages: a pre-event stage (t = 1–3), a degradation stage (t = 4–5), a fault isolation stage (t = 6–10), and a service restoration stage (t = 11–24). Two switch operation crews are initially stationed at bus 1. Their moving speed is set to one distance unit per time interval, and the on-site operation time for manually operating a faulty RCS is one interval. Critical loads (buses 3, 5, 11, 15, 19, 21, 26, 28, and 29) are assigned a weight of 3, and all other loads are assigned a weight of 1.
To comprehensively evaluate the proposed method under different degrees of RCS unavailability, four scenarios are designed as listed in
Table 2. It should be noted that the RCS-fault indicator is defined independently of the line-fault indicator and is not restricted to RCSs located on faulted lines. Scenario 4 represents an extreme case in which all installed RCSs lose remote operability.
To quantitatively evaluate the restoration performance, the weighted load restoration rate is defined as the ratio of the restored weighted load to the total weighted load. Critical loads are assigned a weight of 3, while all other loads have a weight of 1, consistent with the objective function. The cumulative weighted load shedding over all post-event stages is also used as an overall performance indicator. Each time interval is taken as 1 h in the case study. The optimization model was implemented in MATLAB 2021a using YALMIP R20230622 and solved using Gurobi 10.0.1. The recorded wall-clock time for the four-scenario optimization run was 7128.35 s.
4.2. Representative Case Analysis
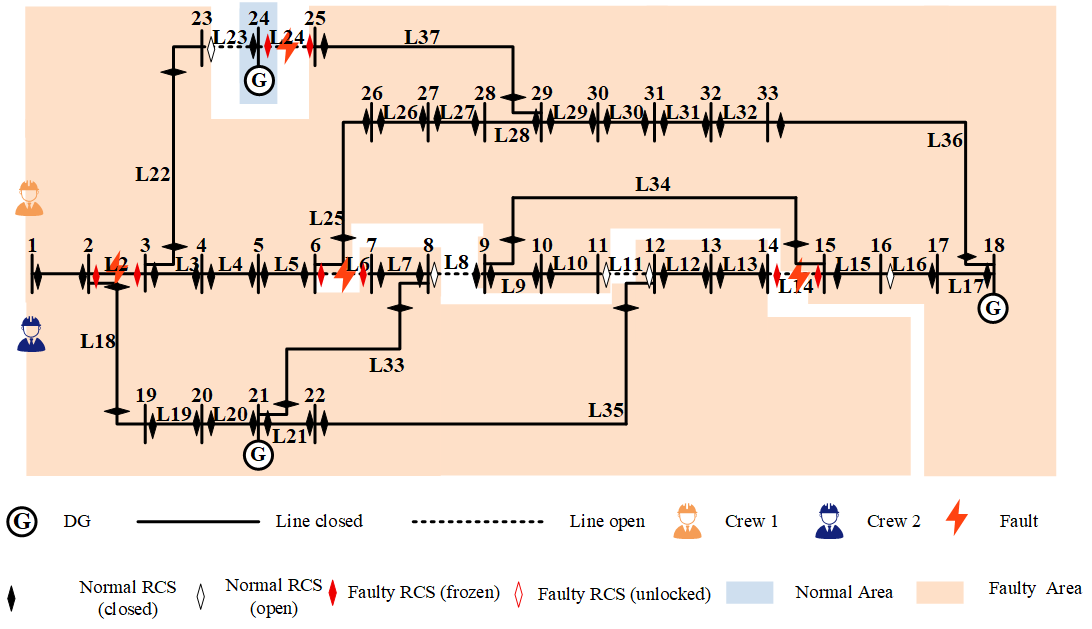
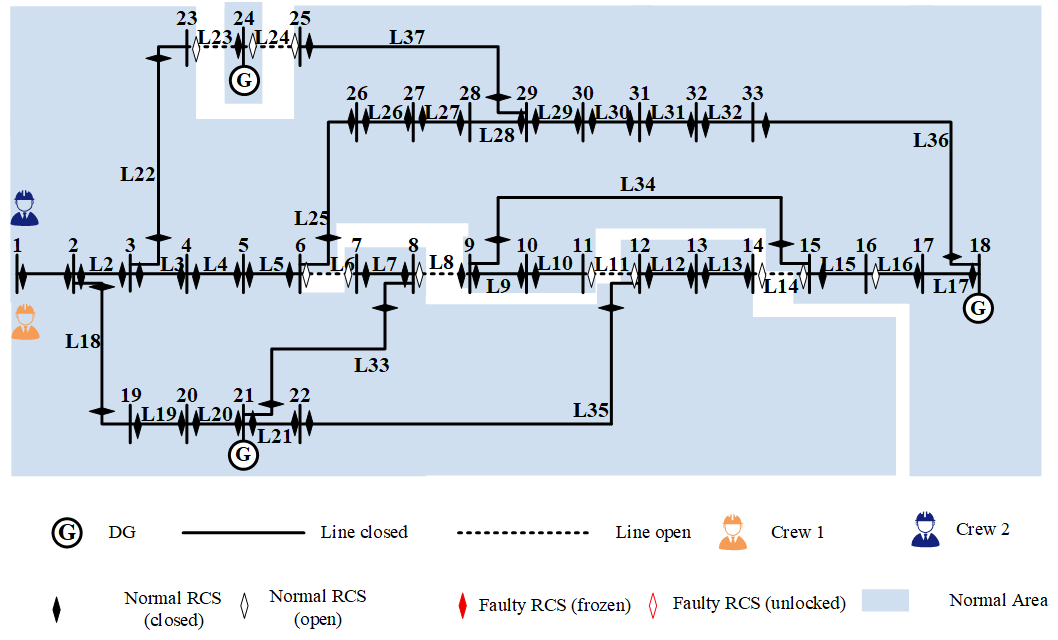
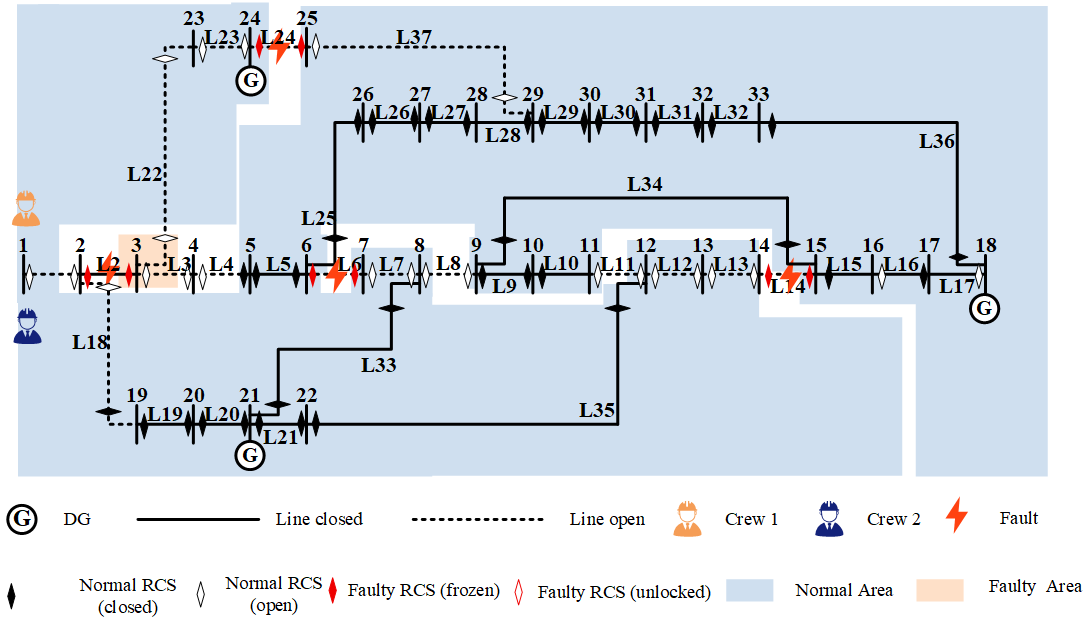
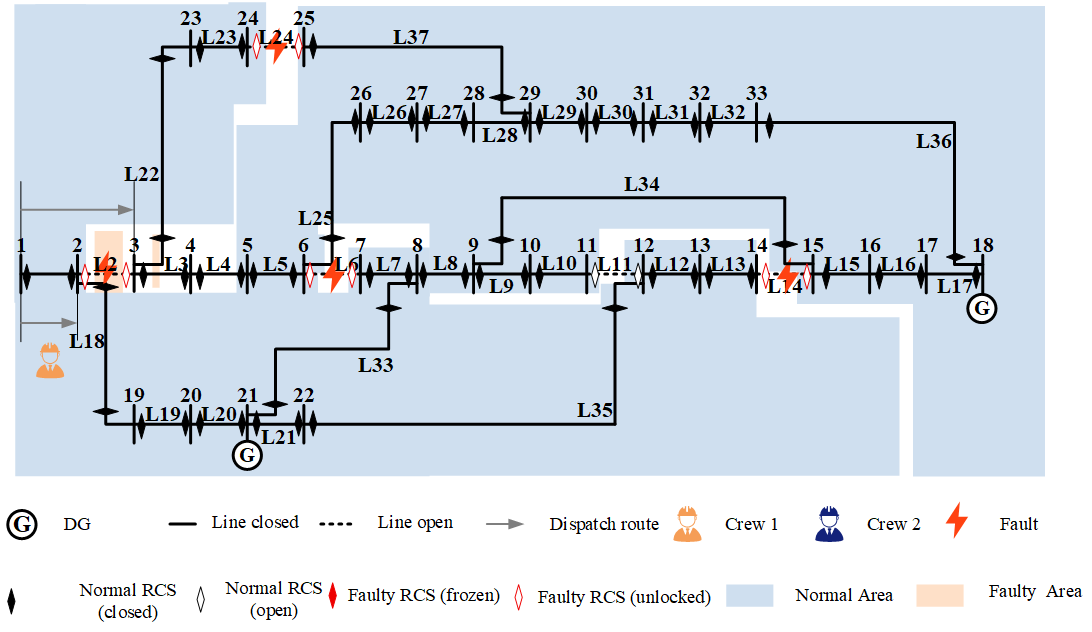
Scenario 2, in which the RCSs on the four faulted lines lose remote operability while all other RCSs remain functional, is selected as a representative case to illustrate the proposed multi-stage restoration process in detail. The system state at each stage is depicted in
Figure 3,
Figure 4,
Figure 5 and
Figure 6.
Figure 3 shows the pre-event network topology. In the original normal operating configuration, all non-tie-line branches are closed and the five tie lines are open. After the preventive islanding optimization, several branches, including L6, L14, and L24, are opened, forming two small self-supplied islands.
Once the extreme event occurs, the four lines L2, L6, L14, and L24 suffer permanent faults, as shown in
Figure 4. Since L6, L14, and L24 were already open, the faults mainly propagate through L2, causing a widespread outage across the network. The switch of L2 remains closed because its RCS is faulty and cannot be remotely operated.
During the fault isolation stage (
Figure 5), a large number of normal RCSs are remotely opened between t = 6 and t = 7, which drastically shrinks the faulted zone from almost the entire network to only a few buses. The load shedding is significantly reduced as a result. However, the RCS on L2 is frozen throughout this stage, preventing the remaining faulted buses from being cleared. The system therefore enters a plateau period during which the load shedding stays nearly constant.
The service restoration stage (
Figure 6) demonstrates the essential role of the switch operation crews. At t = 11, both crews depart from bus 1. At t = 12, they arrive at the two ends of L2 and perform the required on-site switching operation. At t = 13, after the on-site operation time, the switch of L2 is opened, and all faulted buses are immediately cleared. Meanwhile, the normal RCSs that were opened during the isolation stage are reclosed, and all five tie lines are brought into operation to reconstruct the network. All the system-modeled loads are restored at t = 13 and remain in normal operation throughout the rest of the restoration stage. The whole restoration process exhibits two sequential phases—a fast remote fault isolation performed by normal RCSs and a subsequent crew-assisted field operation that clears the residual faulted area.
4.3. Impact of RCS Unavailability on Restoration Performance
Scenario 1 is regarded as the all-RCS-available baseline. Scenarios 1 and 2 have exactly the same line-fault configuration (L2, L6, L14, and L24), but differ in the remote operability of the corresponding RCSs. Their comparison therefore provides a controlled assessment of the impact of RCS remote unavailability on restoration performance. Scenario 4 further represents an extreme stress case in which all RCSs lose remote operability.
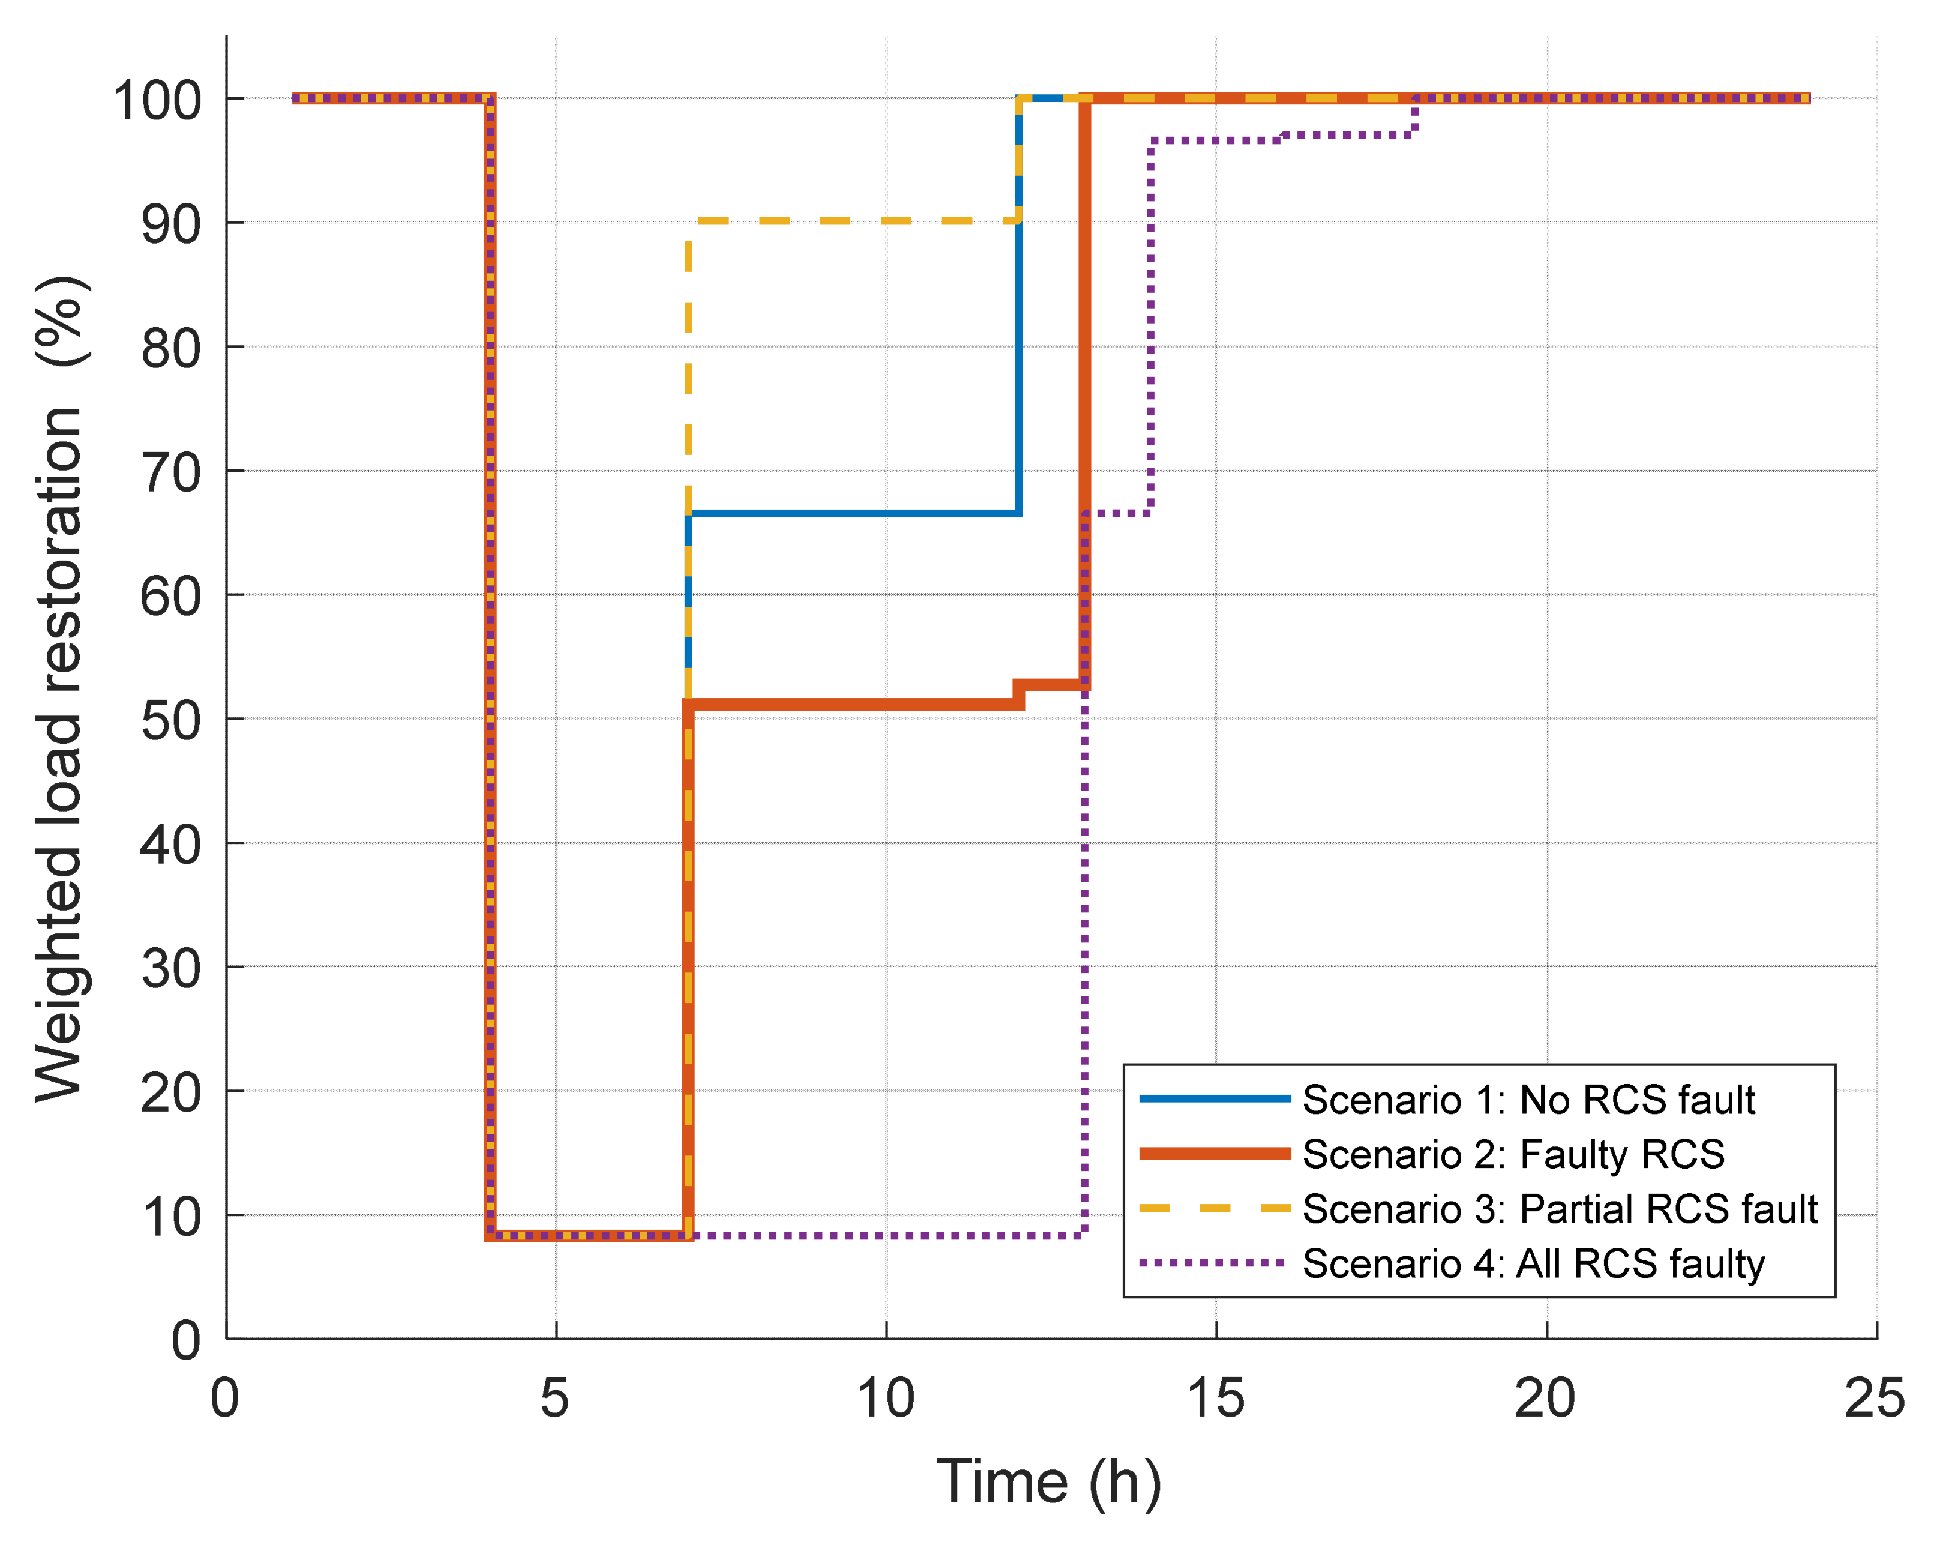
Figure 7 compares the weighted load restoration curves of the four scenarios, while
Table 3 summarizes the corresponding quantitative performance indicators.
With a 1 h time interval, the corresponding energy-not-served (ENS) values for Scenarios 1–4 are 18.360, 23.575, 12.385, and 31.996 MWh, respectively.
Scenario 1, with no RCS faults, represents the ideal baseline. Normal RCSs are remotely opened at the beginning of the isolation stage, completely clearing the faulted zone within one time interval. The system then rapidly recovers through simple network reconfiguration during the restoration stage.
Scenario 3, in which only L6 has a faulty RCS, exhibits a behavior similar to that of Scenario 1. Because the other faulted lines are equipped with functional RCSs, the remote isolation is sufficient to eliminate the faulted zone, and the crews are not strictly required.
The situation is more complex in Scenario 2 and Scenario 4, where the proportion of faulty RCSs is higher. In Scenario 2, the faulted zone is partially reduced by normal RCSs during the isolation stage, but a small residual set of faulted buses remains due to the frozen RCS on L2. The crews subsequently perform the required on-site operation at L2 and restore the remaining loads, with all modeled loads restored one time interval later than in Scenario 1.
For the controlled comparison between Scenarios 1 and 2, the cumulative weighted load shedding increases from 22.410 to 28.705 when the affected RCSs lose remote operability, corresponding to an increase of 28.09%. Meanwhile, the weighted load restoration rate at the end of the isolation stage decreases from 66.54% to 51.14%, and 100% weighted load restoration is delayed from t = 12 to t = 13.
Scenario 4, with all RCSs faulty, represents the most extreme situation. The isolation stage is completely ineffective, and the faulted zone remains unchanged for the entire five-interval duration. The restoration process entirely relies on the crews, who must travel to the corresponding faulty-RCS locations and perform the required on-site switching operations sequentially. The load recovery therefore exhibits a gradual, stepwise improvement, eventually reaching 100% load restoration several intervals later than in the other scenarios.
The results indicate a clear pattern: the higher the proportion of faulty RCSs, the less effective the isolation stage becomes, and the greater the reliance on crew dispatching during the restoration stage. Nevertheless, in all four scenarios, the system eventually returns to normal operation, demonstrating that the coordinated scheduling of normal RCSs and switch operation crews can provide a robust restoration capability across a wide range of RCS failure severities.
4.4. Summary
The case study validates the proposed resilience enhancement method through a comparative analysis of four representative scenarios. Normal RCSs contribute to fast fault isolation once the fault locations become available, while switch operation crews support subsequent restoration when some RCSs lose remote operability. The two mechanisms are complementary in both function and time scale, ensuring an effective load recovery even under severe RCS failure conditions.