Article

Infrastructure-Oriented Assessment of Energy Efficiency and Estimated CO2 Emissions at the Combustion Stage of a Diesel–LNG Dual-Fuel Mining Dump Truck Based on Field Telemetry Data


by
Assem Yerzhankyzy Utegenova
1,*,
Aman Tulegenovich Shakenov
1,
Ivan Nikitovich Stolpovskikh
1,
Ainura Berikbolovna Orumbassarova
1,
Boris V. Malozyomov
2 and
Nikita V. Martyushev
3,*
1
Institute of Energy and Mechanical Engineering Named After A. Burkitbayev, Department of Technological Machines and Gas Turbine Installations, Satbayev University, Almaty 050013, Kazakhstan
2
Department of Electrotechnical Complexes, Novosibirsk State Technical University, 20, Karla Marksa Ave., Novosibirsk 630073, Russia
3
Department of Information Technologies, Tomsk Polytechnic University, Tomsk 634050, Russia
*
Authors to whom correspondence should be addressed.
Energies 2026, 19(18), 4394; https://doi.org/10.3390/en19184394
Submission received: 13 August 2026 / Revised: 7 September 2026 / Accepted: 15 September 2026 / Published: 16 September 2026
(This article belongs to the Section B: Energy and Environment)

Abstract

Haul-road condition can affect traction demand and diesel-to-LNG substitution in mining trucks. We evaluated a 140-t truck at the Ekibastuz coal mine using 180 registered cycles (88 diesel-only [DOM], 92 dual-fuel [DGB]), 24 road segments, 36 defect events and 30 matched fuel-mode pairs. Mean ECM-reported substitution was 30.61% across DGB cycles. In matched pairs, diesel use declined from 34.00 to 23.76 L/cycle, a mean saving of 10.24 L/cycle (95% CI 9.53–10.95); calculated combustion-stage CO2 declined by 7.10%. Total fuel energy, specific fuel-energy consumption and cycle time did not differ significantly (p > 0.30). Across Good-to-Poor road classes, engine load increased from 66.11% to 74.40% and substitution from 28.97% to 32.31%, while specific fuel-energy consumption increased from 5.91 to 6.72 MJ/(t·km). The load association persisted after temperature and wind adjustment and shift-clustered inference. Reference-state haul-road energy penalty was associated with rolling resistance and roughness, but remains dependent on a supplied reference input. The results distinguish diesel displacement from improved transport energy performance and are conditional on the cycle register. They do not establish causal road effects or a life-cycle climate benefit.

1. Introduction

Open-pit mining refers to energy-intensive industrial systems in which the transportation of rock mass forms a significant share of direct fuel consumption and associated emissions. For mining and primary processing operations, a close relationship has been established between the structure of energy consumption, productivity and carbon footprint [1,2,3]. The transport circuit is especially sensitive to the spatial configuration of the quarry, the depth of mining operations, the profile of the tracks and the technical condition of the rolling stock [4]. Therefore, improving energy and environmental efficiency requires a systematic consideration of the energy source, traffic mode and transport infrastructure.
From the standpoint of industrial energy, a mining dump truck is a mobile energy converter operating in a cyclic mode with a sharply non-stationary need for traction power. At the enterprise level, changes in the structure of loading, the length of the transport leg and the condition of the road can change both the specific energy consumption and the actual efficiency of measures to reduce emissions [5]. Modern reviews show a shift in mining energy research towards digitalization, alternative fuels, smart management and low-carbon transport systems [6,7].
For mining trucks, basic energy efficiency is primarily determined by the duty cycle. Modeling studies of electric mining machines also show that the energy result is sensitive to a specific driving cycle and load profile [8]. For diesel mining dump trucks, methods have been developed for energy comparison [9], neural network forecasting of fuel consumption [10] and identification of key operational factors, including idling, load and driving conditions [11].
The development of telemetry analysis has made it possible to move from simple specific indicators to models that relate mass, speed and total drag to movement with fuel consumption [12]. Payload variability is shown to have a nonlinear effect on diesel fuel consumption and emissions [13], and modern ensemble methods, including XGBoost, reveal multidimensional dependencies in operational data [14]. Field studies confirm the importance of the longitudinal slope, the duration of work, the distance of transportation and the mode of use of the machine [15]. However, high predictive accuracy in itself does not provide a physical interpretation of infrastructural energy losses, which is also noted in systematic reviews of fuel consumption forecasting [16].
The long-term trajectory of low-carbon quarry transport is electrification. Modern comparative assessments of diesel and electric mining dump trucks show a high potential for reducing direct emissions in the presence of appropriate energy infrastructure [17]. At the level of electric vehicles, related studies of integrated charging solutions show that electrification increases the requirements for power electronics, charging strategies and the matching of converter equipment with traction storage [18]. Technical, ecological, and economic comparisons of low- and zero-emission heavy trucks additionally confirm the technological heterogeneity of the transition period [19,20]. For mining enterprises, this is especially significant due to the remoteness of facilities, the high unit power of machines and the limitations of the network infrastructure.
At the system level, the decarbonization of heavy transport must take into account not only the type of traction source, but also the sustainability of the energy infrastructure. Comparative assessments of fuel-based transition pathways and electrification show that the result depends on the energy mix and operating scenario [21]. For the electric transport infrastructure, the reliability of the power network and protection systems becomes an independent system limitation, especially with an increase in the power of the connected load [22]. Therefore, for the existing diesel fleet, transitional solutions that do not require an immediate complete restructuring of the energy infrastructure remain practical.
One such solution is the use of natural gas and LNG in heavy engines. The accumulated experience confirms the technological feasibility of natural gas as a motor fuel [23], and the analysis of the European freight sector reveals the economic and infrastructural limitations of LNG [24]. The spread of LNG depends on the cost of fuel, the availability of refueling infrastructure and the stability of supply [25], while the energy benefits are determined by a combination of calorific value, propulsion efficiency and emissions along the full fuel chain [26].
For mining dump trucks, it is fundamentally important that the potential benefit of Diesel–LNG is realized only in that part of the cycle where the load and thermodynamic conditions allow a stable replacement of diesel fuel with methane. Therefore, the same DGB hardware configuration can exhibit different integral values on different routes. The working hypothesis is formulated as a testable association chain: the deterioration of the road condition is associated with an increase in resistance to motion and a change in the speed profile; this increases the required engine load and, within the DGB algorithm, may be accompanied by an increase in the measured S R . Because field design is not randomized, such a chain is seen as a physically motivated hypothesis about associations, rather than as a predetermined causal mechanism.
Beyond prediction, transportation optimization commonly targets dispatching, speed-profile planning, routing, and energy-aware scheduling. Open-pit applications include energy-efficient truck scheduling [27] and dispatching with dynamic ore-blending decisions [28]. These fleet- and planning-level approaches are complementary to the present segment-scale analysis of how road condition is associated with the energy state and DGB response of an individual truck.
The aim of the work is to quantify the relationship between the dynamic state of the intra-pit technological road, energy indicators and estimated CO2 emissions at the combustion stage of a 140-t mining dump truck in DOM and DGB modes under the conditions of the Ekibastuz coal mine (Kazakhstan), based on the joint processing of full-scale ECM telemetry and digital infrastructure monitoring. Unlike approaches in which the road is defined by a single constant drag coefficient, here the infrastructure parameters are analyzed together with engine operating conditions, the measured ECM substitution ratio and the fuel-energy equivalent. The independent contribution of the work consists of four elements: (i) field linking of the road condition with the realized DGB substitution; (ii) an independent comparison of the measured ECM substitution factor and the actual diesel displacement in DOM–DGB matched pairs; (iii) joint evaluation of S E C E and H E P with independent control of rolling resistance and roughness; (iv) statistical verification of the load-mediated hypothesis, with an explicit distinction between measured, estimated and calculated values. Thus, the work is focused not on the demonstration of the maximum S R , but on the systematic energy interpretation of the DGB in an infrastructurally heterogeneous open-pit haulage cycle.

2. Scientific Context and Research Gap

Studies of LNG for heavy trucks confirm that switching from pure diesel to gas–diesel can reduce direct diesel consumption, but the resulting climate effect depends on the power plant architecture, load and methane emissions [29]. A fundamental review of gas–diesel combustion systematized the main mechanisms of changes in efficiency, NOx, CO, HC and methane slip depending on the gas fraction and engine mode [30].
The physical basis of DGB is the pilot ignition of a small amount of diesel fuel followed by the combustion of a gas–air mixture. For compression ignition gas–diesel engines, the stability of the process depends on temperature, pressure, excess air coefficient and the amount of pilot fuel [31]. Experiments on natural gas–diesel engines have shown a pronounced load dependence of combustion and emissions [32], which is fundamental for a quarry cycle with alternating traction and low-load phases.
Subsequent experimental studies have confirmed that the dual-fuel mode is most effective under increased load, while low-load states are more complex due to incomplete methane oxidation and reduced combustion stability [33]. The effect of the type of premixed fuel and ignition conditions on efficiency and emissions is shown in Ref. [34], and changes in swirl and engine load significantly change gas–diesel combustion [35]. Consequently, the average shift efficiency of a mining machine cannot be correctly assessed only by the high power mode.
Related studies of traction equipment emphasize the need to assess the energy balance of the machine at the level of the operating cycle, and not only by the nominal parameters of the drive [36]. For DGB, this means that the practical value of a gas system is not determined by the maximum instantaneous substitution factor, but by the integral distribution of operating states. Field measurements of heavy dual-fuel vehicles show that a decrease in CO2 may be accompanied by an increase in certain toxic components and methane slip [37].
In addition to the effect directly on the exhaust, the climatic interpretation of LNG requires taking into account methane emissions at the previous stages of the fuel chain. Comparative estimates of heavy vehicles running on natural gas show that with an unfavorable combination of efficiency and methane leaks, the expected advantage can be significantly reduced [38]. Therefore, in this work, CO2 is evaluated only for the combustion stage, and the full life cycle is considered as a separate task.
In the literature, there is a methodological gap between the studies of road infrastructure, fuel consumption of mining dump trucks and gas–diesel combustion. The works of the first group usually do not contain DGB measurements, the second group often aggregates road resistance into one coefficient, and the third group mainly uses bench or general road cycles that do not reproduce intra-pit infrastructure heterogeneity. As a result, it is the joint field relationship between the local state of the road, the engine load, the actual gas substitution and the full energy result of Diesel–LNG that has not been sufficiently studied. This gap is methodologically important: growth of S R with increasing load does not in itself mean an increase in system energy efficiency.
A comparison of the key areas of literature with the objectives of this study is given in Table 1. It shows that road monitoring, fuel telemetry, dual-fuel technologies, and emissions reduction are well represented in isolation, while their simultaneous integration in field energy analysis remains limited.
It follows from Table 1 that the scientific novelty is not limited to the very fact of using LNG or monitoring the quarry road. It is determined by combining these components in one field analytical framework, where infrastructure is considered as a measurable factor related to the realization of the energy potential of the DGB, and gas substitution is evaluated together with the total chemical energy of the fuel and the reference infrastructure index. Such a construction separates this work from both road diagnostics and classical studies of gas–diesel combustion and reduces the risk of interpreting a high S R as an independent criterion.

3. Materials and Methods

3.1. Object of Research and Experimental Platform

The experimental platform was a rigid-frame mining dump truck with a nominal payload capacity of 140 t, a turbocharged V16 diesel engine with compression ignition and a rated power of 1200 kW. A full-scale experiment was carried out at the operating Ekibastuz coal mine in Kazakhstan. The identifier of a specific mining truck in the working data set is anonymized for industrial confidentiality requirements. The basic diesel engine was equipped with a Diesel–LNG conversion system of the DGB-v2 type, which provides metered LNG supply while maintaining diesel pilot ignition. Further, the diesel-only mode is designated DOM (diesel-only mode), and the dual-fuel mode is DGB (dynamic gas blending).
Field monitoring covered 1–30 August 2025 and 30 production shifts. The cycle register contains 180 complete transport cycles (88 DOM and 92 DGB), 30 matched fuel-mode pairs, and 180 cycle-linked covariate records. The telemetry subset contains 5000 records assigned to eight cycles, with 625 records per cycle. Instrument metadata specify a nominal rate of 0.5 Hz for the main channels and 0.2 Hz for payload. Declared channel missingness is 0.049–1.186% (mean 0.54%).
The telemetry records cover CYC-0007, CYC-0008, CYC-0031, CYC-0032, CYC-0035, CYC-0036, CYC-0051 and CYC-0052. Their first-to-last timestamp spans agree with the corresponding recorded cycle durations. These records are retained for diagnostic inspection only and are not treated as independent experimental replicates or used to recompute the cycle-level fuel endpoints.
Ambient temperature was available for all 180 cycles: mean 14.54 °C, standard deviation 5.54 °C, and range 2.00–27.78 °C. Mean wind speed was 4.05 m/s (range 0.24–8.38 m/s). Road-surface records comprised 124 Dry, 23 Damp and 33 Wet observations, and 12 anonymized operators were represented. Relative humidity was not available. Precipitation and tire-pressure fields lacked explicit units and were not interpreted quantitatively or replaced by weather-station estimates.
The controlled technological route of the Ekibastuz coal mine had a length of 1.5 km between the loading and unloading zones. The elevation difference was about 102 m, the maximum absolute longitudinal grade reached 12% (i.e., the largest magnitude of positive or negative grade). For segment analysis, the route was divided into 24 fixed sections of 62.5 m. For each segment, the longitudinal gradient, the road condition class, the roughness index, the rolling resistance assessment, local defects, the average speed, the engine load, the measured S R , actual and reference energy, and H E P . 36 RACK/BIAS/PITCH events with synchronized dynamic and force responses are logged in a separate log.
Summary characteristics of the experimental platform and the actual volume of monitored data are presented in Table 2. Subsequent statistical analysis was performed separately at the level of complete transport cycles, matched DOM–DGB pairs, fixed road segments, and synchronized intra-cycle time series.
As can be seen from Table 2, the experimental scheme is based on the synchronous use of energy and infrastructure channels. This allows for an analytical comparison of the traction payload with additional changes in the driving mode associated with drag and dynamic disturbances of the road infrastructure, without attributing a causal status to the observed differences without additional experimental confirmation.
Engine load refers to the ECM-reported engine-load channel expressed as a percentage, whereas payload refers to the transported cargo mass expressed in tonnes. These are distinct variables in the analysis.
The instrumentation register identifies engine load as CH04, with a stated accuracy of ±1.0 percentage point. Accordingly, the ECM percentage is retained on its recorded scale and is not converted into percent rated shaft power, a torque fraction, or cargo utilization.

3.2. Quarry Road Monitoring and Spatial Synchronization

The rolling resistance of heavy quarry vehicles is sensitive to the structure of the pavement and the condition of the road profile. Field studies have linked the condition of the pavement to rolling resistance and energy losses [39], and analysis of the roughness effect shows additional energy dissipation in the tires and suspension [40]. The effect of longitudinal slope on the fuel consumption of mining dump trucks has also been confirmed experimentally [41].
In this study, the route was divided into spatial segments, for which road signs, speed, and ECM parameters were synchronized. Rolling resistance was evaluated by an independent channel based on a coast-down/tractive-effort estimator with a frequency of 0.5 Hz, a claimed accuracy of ±0.20 percentage points, and a resolution of 0.01%; roughness/road condition was recorded by the vehicle response algorithm channel with a frequency of 0.5 Hz and an accuracy of ±5 per cent. Elevation and longitudinal slope were determined jointly by GNSS and route survey (±0.20 m in elevation and ±0.15 percentage point in grade). In the array used, the road condition index was in the ranges of 0.798–0.954 for Good, 0.647–0.775 for Fair, and 0.453–0.611 for Poor. These classes were used as the initial categorical characteristic of monitoring, and were not formed after the fact based on energy results. This approach is consistent with the classification of roads focused on fuel efficiency [42]. Previously developed methods for digital monitoring of quarry roads provided the basis for recording geometry and defects [43], but in this work, road data are used as input features of DGB analysis, and not as an independent final result.
The numerical intervals above are the observed index ranges within the recorded Good, Fair, and Poor classes, not a complete specification of classification thresholds. Table 3 separately reports route geometry and observed irregularities. We retain the supplied classes as categorical observations and report their observed numerical ranges, without deriving new thresholds from energy outcomes. Road geometry in Table 3 describes this site; it does not constitute a transferable pavement-design or classification protocol.
Temporal link synchronization was performed using GNSS PPS and ECM clock alignment, after which the records were spatially mapped by route coordinate and transport cycle ID. Each entry referred to one of the operational conditions: loaded traffic, empty movement, low-speed maneuver/standby, or idle. Algorithmic procedures were used for classification and quality control, but did not replace measurement channels; This principle is consistent with studies of the logical controllability of mining equipment [44].

3.3. Energy Indicators and Design Dependencies

A set of interrelated indicators was used to unify energy analysis. Formulas (1)–(13) are given in a single international symbolism; Each parameter introduced for the first time has its physical meaning and dimension are revealed immediately after the corresponding equation. The measured, estimated, and reference values are further explicitly distinguished to avoid confusion of telemetry channels with derived indicators.
P e = 2 π n T 60 × 10 3
where P e is the effective engine power, kW; n —crankshaft speed, rpm; T is the effective torque of the engine, N·m. A numerical multiplier of 103 ensures the conversion of power from W to kW. Equation (1) is used to check the consistency of the speed and torque ECM channels.
Q ˙ D = m ˙ D L H V D
where Q ˙ D is the chemical power of the diesel fuel flow, MJ/h; m ˙ D —mass consumption of diesel fuel, kg/h; L H V D —low calorific value of diesel fuel, MJ/kg. Thus, Equation (2) converts the mass consumption of diesel fuel into an energy equivalent.
Q ˙ D F = m ˙ D L H V D + m ˙ G L H V G
where Q ˙ D F is the total chemical capacity of the fuel flow in the dual-fuel mode, MJ/h; m ˙ D and m ˙ G are the mass flow rates of diesel fuel and LNG, respectively, kg/h; L H V D and L H V G are their lower calorific values, MJ/kg. The G index further denotes the gas component of LNG in the energy balance.
S R D = 1 V D , D G B V D , D O M × 100 %
where S R D is the observed degree of displacement of diesel fuel in the matched pair, %; V D , D G B —volume of diesel fuel per DGB cycle, L/cycle; V D , D O M is the volume of diesel fuel for the matched DOM cycle, L/cycle. The indicator is calculated only for pre-formed agreed pairs and characterizes the actual reduction in the volume consumption of diesel fuel.
S R E = m ˙ G L H V G m ˙ D L H V D + m ˙ G L H V G × 100 %
where S R E is the energy share of the gas component in the total chemical energy of the fuel flow, %; m ˙ G and m ˙ D are the mass flow rates of LNG and diesel fuel, kg/h; L H V G and L H V D are the corresponding lower calorific values, MJ/kg. The energy form eliminates the incorrectness of direct comparison of the volumes of two fuels with different density and calorific value.
Further, the term “measured S R ” refers to the directly recorded ECM channel substitution ratio and is used to analyze the load-dependent behavior of the DGB. The independent metric S R D is calculated using Equation (4) from the matched DOM–DGB loops. These indicators are physically related, but not statistically identical: the first reflects the telemetry indicator of the DGB algorithm, the second reflects the actually observed decrease in diesel fuel consumption in the matched pair.
S E C E = E c y c l e m p L h
where S E C E is the specific chemical energy of the fuel, MJ/(t·km); E c y c l e —total chemical energy of diesel fuel and LNG for the full transport cycle, MJ; m p is the weight of the transported cargo, t; L h is the length of the loaded arm, km. The numerator refers to the full cycle of loaded + empty traffic, whereas the denominator represents productive transport work in tonne-km.
The reduction to the energy equivalent is particularly important for the DGB, because comparing the volume consumption of diesel and LNG without taking LHV into account creates a systematic bias. For individual road segments, longitudinal mechanics were additionally taken into account. The methodological principles of geoinformation linking of infrastructure and production parameters correspond to the approaches developed for geotechnological complexes [45].
F t r = m a + m g s i n θ + C r r c o s θ + 1 2 ρ C d A v 2
where F t r is the required longitudinal tractive force, N; m —gross vehicle weight, kg; a —longitudinal acceleration, m/s2; g —acceleration due to gravity, m/s2; θ —longitudinal slope angle; C r r —dimensionless rolling resistance coefficient; ρ —air density, kg/m3; C d —dimensionless coefficient of aerodynamic drag; A —frontal area, m2; v is the speed of the vehicle, m/s. In Equations (7) and (8), C r r is used as a dimensionless quantity; the experimental channel values specified as a percentage are divided by 100.
P r r = C r r m g v c o s θ
where P r r is the power expended to overcome rolling resistance, W; C r r —rolling resistance coefficient; m —gross vehicle weight, kg; g —acceleration due to gravity, m/s2; v —speed, m/s; θ is the angle of the longitudinal slope. Equation (8) is used as a mechanical interpretation of the effect of road resistance and is not a substitute for the independent evaluation channel C r r .
P g r a d e = m g v s i n θ
where P g r a d e is the power associated with overcoming the longitudinal slope, W; m —gross vehicle weight, kg; g —acceleration due to gravity, m/s2; v —speed, m/s; θ is the angle of the longitudinal slope. The sign of P g r a d e is determined by the direction of movement and the adopted system of signs for θ .
The reliability and energy efficiency of the quarry transport circuit depend on the operating conditions, which is confirmed by the modeling of quarry transport systems [46] and the analysis of the impact of the production environment on the fuel consumption of heavy equipment [47]. For the current task, these provisions have been supplemented by a standardized indicator of the infrastructure energy penalty.
H E P = E a c t u a l E r e f E r e f × 100 %
where H E P is the energy penalty relative to the reference state, %; E a c t u a l is the supplied cycle- or segment-level fuel-energy value, MJ; E r e f is the reference energy fixed before calculation of H E P from the experimental analytical data set (field Reference_energy_MJ), MJ. Since E r e f is not the result of a separate calorimetric measurement of an identical trip on a physically “ideal” road, H E P is used only as a secondary object-dependent comparative index. It is not interpreted as a direct measurement of the mechanical losses of the roadway. Descriptive associations of H E P are examined against rolling resistance, roughness and dynamic response; these associations do not validate the reference-generation algorithm; transferring the technique to a new object requires an invariable procedure for formation of E r e f and separate object calibration. HEP is not used as a single or primary endpoint: the conclusions about the fuel-energy effect of the DOM–DGB are based on directly measured fuel flows, total chemical energy of the fuel and specific energy intensity, while infrastructure associations are examined using rolling resistance, roughness, speed and dynamic response. Therefore, the uncertainty of the reference energy generation procedure does not determine the sign of the main DOM–DGB pairs.
To quantify dependence on this input, a post hoc sensitivity analysis multiplied every reference value by 0.95 and 1.05, keeping observed fuel energy fixed. These analyst-selected perturbations assess sensitivity; they are not estimates of reference uncertainty or evidence validating its construction. Primary DOM–DGB fuel comparisons do not contain E r e f .
The possibility of mode-dependent optimization of the energy infrastructure of quarry transport has been shown, in particular, for adaptive load control of charging stations of mining dump trucks [48]. In this paper, this principle is considered only as a methodological guideline for the future coordinated management of the DGB mode and road condition. Experimental conclusions do not depend on the optimization model.

3.4. Environmental Assessment, Uncertainty and Limits of Interpretation

M C O 2 = m D E F D + m G E F G
where M C O 2 is the estimated CO2 emissions at the combustion stage, kg; m D and m G are the masses of diesel fuel and LNG burned, respectively, kg; E F D and E F G are the corresponding mass emission factors of CO2, kg CO2/kg fuel. Equation (11) excludes emissions from fuel extraction, liquefaction and transportation, as well as methane slippage.
Δ M C O 2 = M C O 2 , D O M M C O 2 , D G B
where Δ M C O 2 is the reduction in the calculated CO2 emissions at the combustion stage in the matched pair, kg; M C O 2 , D O M is the estimated emissions for the DOM cycle, kg; M C O 2 , D G B is the estimated emissions for the matched DGB cycle, kg. The positive value of Δ M C O 2 corresponds to the reduction in the estimated emissions when switching from DOM to DGB in this pair.
For energy calculations and CO2 estimation, the fuel parameters recorded in the experimental data set were used: diesel fuel density of 0.835 kg/L, L H V D = 42.7 MJ/kg, L H V G = 49.8 MJ/kg, E F D = 3.16 kg CO2/kg fuel and E F G = 2.75 kg CO2/kg fuel. The molar fraction of methane in LNG was 94.6% and the density of LNG was 0.451 kg/L. Thus, the designations G in Equations (3), (5) and (11) refer to the LNG component. Emission factors are used only for the calculation of the combustion stage and are not a substitute for direct exhaust measurement.
u c y = i = 1 N f x i u x i 2 1 / 2
where u c y is the combined standard uncertainty of the derived quantity y = f x i ; x i is the i-th input value; u x i —its standard uncertainty; f x i is the coefficient of sensitivity of the function to x i ; i —index of the input value; N is the number of inputs taken into account. Equation (13) is used under the assumption of negligible covariance of inputs; for correlated channels, the uncertainty budget must be supplemented by covariance terms. For 16 key channels, the experimental book recorded the measurement source, sample rate, accuracy, resolution, calibration date, and time synchronization method. The accuracy of the diesel fuel flow channel was ±1.5%, the LNG Coriolis flow meter was ±1.0%, the cargo mass channel was ±1.5%, the engine load was ±1.0 percentage points, the combined GNSS/ECM speed channel was ±0.3 km/h, and the estimated rolling resistance channel was ±0.20 percentage points. Therefore, metrological evaluation of derived parameters was supplemented by statistical 95% confidence intervals and sensitivity analysis.
A separate deterministic sensitivity check used the stated diesel-flow (±1.5%) and LNG-flow (±1.0%) accuracy limits as adverse multiplicative biases, while holding density, heating values and combustion factors fixed. Opposite biases were applied to DOM and DGB totals to test the sign of the paired mean effect. These bounds are distinct from sampling confidence intervals and do not include uncertainty in fuel properties, methane slip, or unresolved telemetry scaling.
Complete cycles, matched pairs and road segments were the units of statistical analysis. Records from one vehicle or shift may remain dependent, so sample size alone does not establish physical independence. The 5000 telemetry records were excluded from inferential sample counts. A post hoc shift-cluster sensitivity analysis was added for the DGB regression to assess within-shift dependence.

3.5. Statistical Processing and Quality Control of Data

For the paired DOM–DGB analysis, 30 intra-shift pairs belonging to the same calendar date/shift, one fixed route of 1.5 km, and one road condition class were used. The comparison minimized the differences in the transport task: the average absolute difference in the weight of the cargo was 0.665%, the maximum was 2.237%; the mean absolute difference in the average cycle speed after the formation of pairs was 0.81 km/h, and the average longitudinal slope of the loaded movement was 0.70 percentage points. For paired differences, mean difference, 95% confidence interval, and paired t-test were calculated; the stability of the conclusions on diesel fuel economy and design CO2 reduction was additionally checked by the Wilcoxon test for related samples. To compare the Good/Fair/Poor classes in 92 DGB cycles, the Kruskal–Wallis test was applied. The associations of H E P with rolling resistance and roughness were evaluated by linear regression with HC3-robust standard errors and Spearman’s coefficient. The level of significance was taken as α = 0.05. The statistical unit in all outputs was a cycle, a matched pair, or a road segment, but not a single high-frequency sample. Because the DOM/DGB sequence was not a randomized crossover protocol, the estimates are interpreted as controlled field comparisons rather than as unconditional causal effects of fuel mode.
All 30 pairs shared an operator identifier, date, shift and road-condition class. Surface-state labels matched in 27 pairs and tire-condition labels in 17 pairs, so neither was assumed perfectly controlled. The mean paired temperature difference (DGB minus DOM) was 0.109 °C (standard deviation 0.413 °C; maximum absolute difference 0.927 °C). The pre-existing pair table was retained as the source for paired estimates; minor payload rounding differences from the cycle register were not used to redefine pairs.
To explain the variability of DGB substitution, a multivariate OLS model was built at the level of 92 DGB cycles with HC3-robust standard errors. The dependent variable was the measured S R , and the predictors were the average engine load, idle rate, road condition index, load weight and average longitudinal slope of loaded traffic. The model evaluates conditional statistical associations and checks whether the independent relationship between the road condition index and S R after taking into account the engine load is maintained. Such an analysis is consistent with the load-mediated physical hypothesis, but is not a formal analysis of causal mediation and is not used for causal attribution of the road effect.
For a post hoc robustness check, ambient temperature and wind speed were added to the original five-predictor DGB model. OLS coefficients were evaluated using both HC3 standard errors and shift-clustered standard errors with the finite-sample correction and t inference over 30 shifts (29 degrees of freedom). The full coefficient tables and the recorded covariate checks are supplied in the accompanying calculation workbook. This extension tests sensitivity to available covariates and does not establish causal mediation. An additional post hoc specification omitted the supplied road-condition index and retained engine load, idle share, payload, loaded grade, ambient temperature and wind speed. All 92 DGB cycles were retained; no telemetry records or reference-energy values entered this model. The same HC3 and finite-sample-corrected shift-cluster inference procedures were applied; coefficients are reported in worksheet 19_Index_Free_Model.
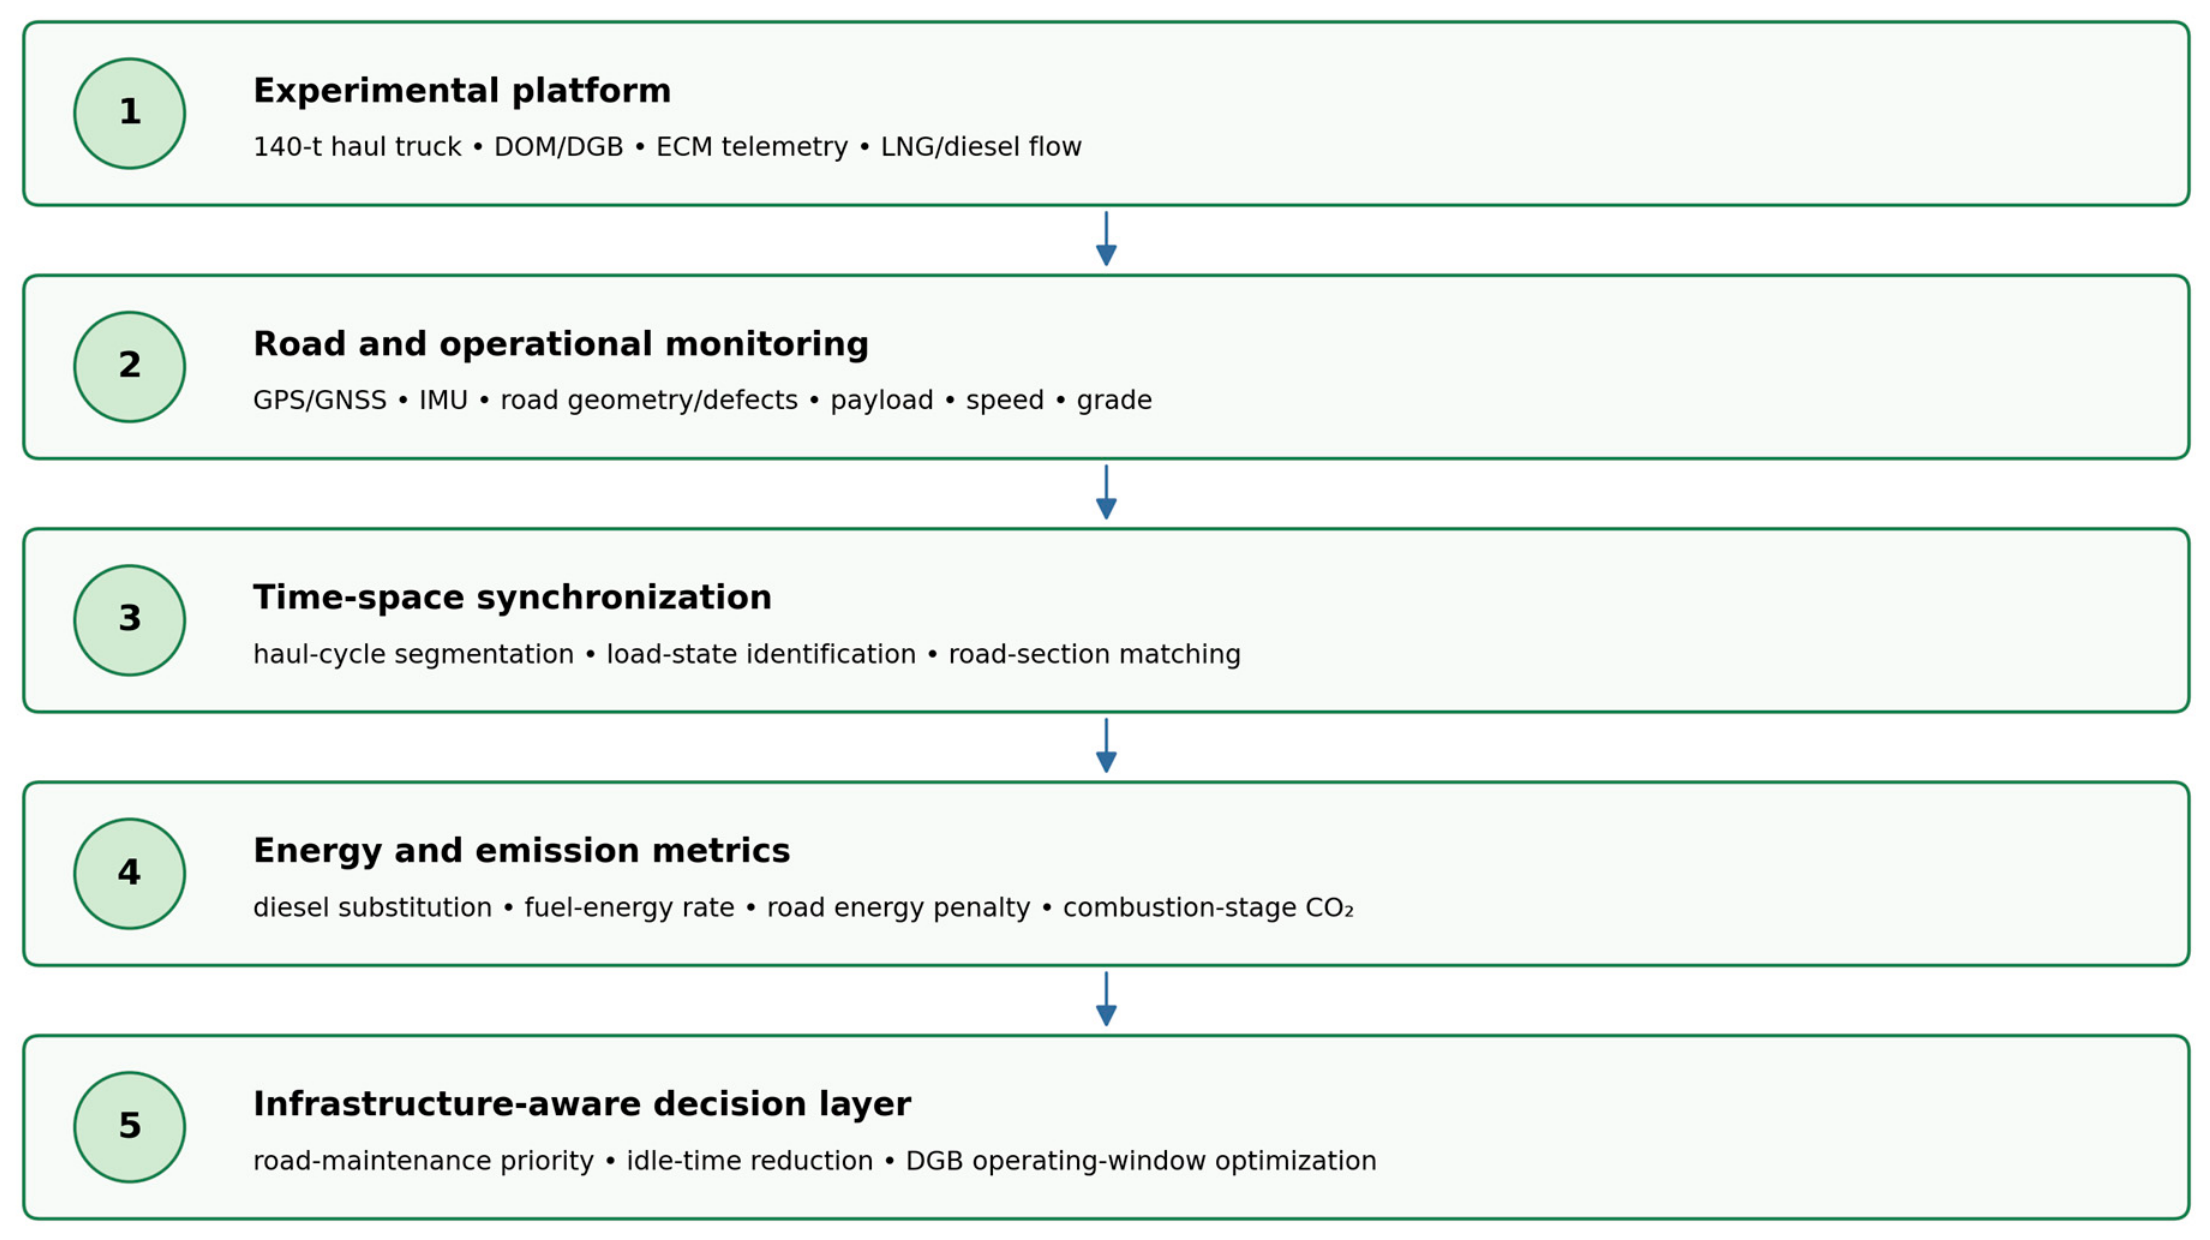
A diagram of the relationship between measuring channels, design indicators and management decisions is presented in Figure 1. In it, the infrastructure block is included directly in the analytical chain of the energy result formation, and is not used only as a post-factum descriptive characteristic.
Figure 1 shows five consecutive levels. Block 1 defines the fuel and engine platform; Block 2, road condition and operating conditions; Block 3, spatio-temporal synchronization; Block 4, indicators of fuel substitution, energy and estimated CO2 emissions at the combustion stage; Block 5, solutions for road maintenance and mode management. The fundamental difference from the assessment limited only to the engine is the explicit inclusion of transport infrastructure in the energy analytical circuit.

4. Results

4.1. Route, Road Conditions and Responsiveness

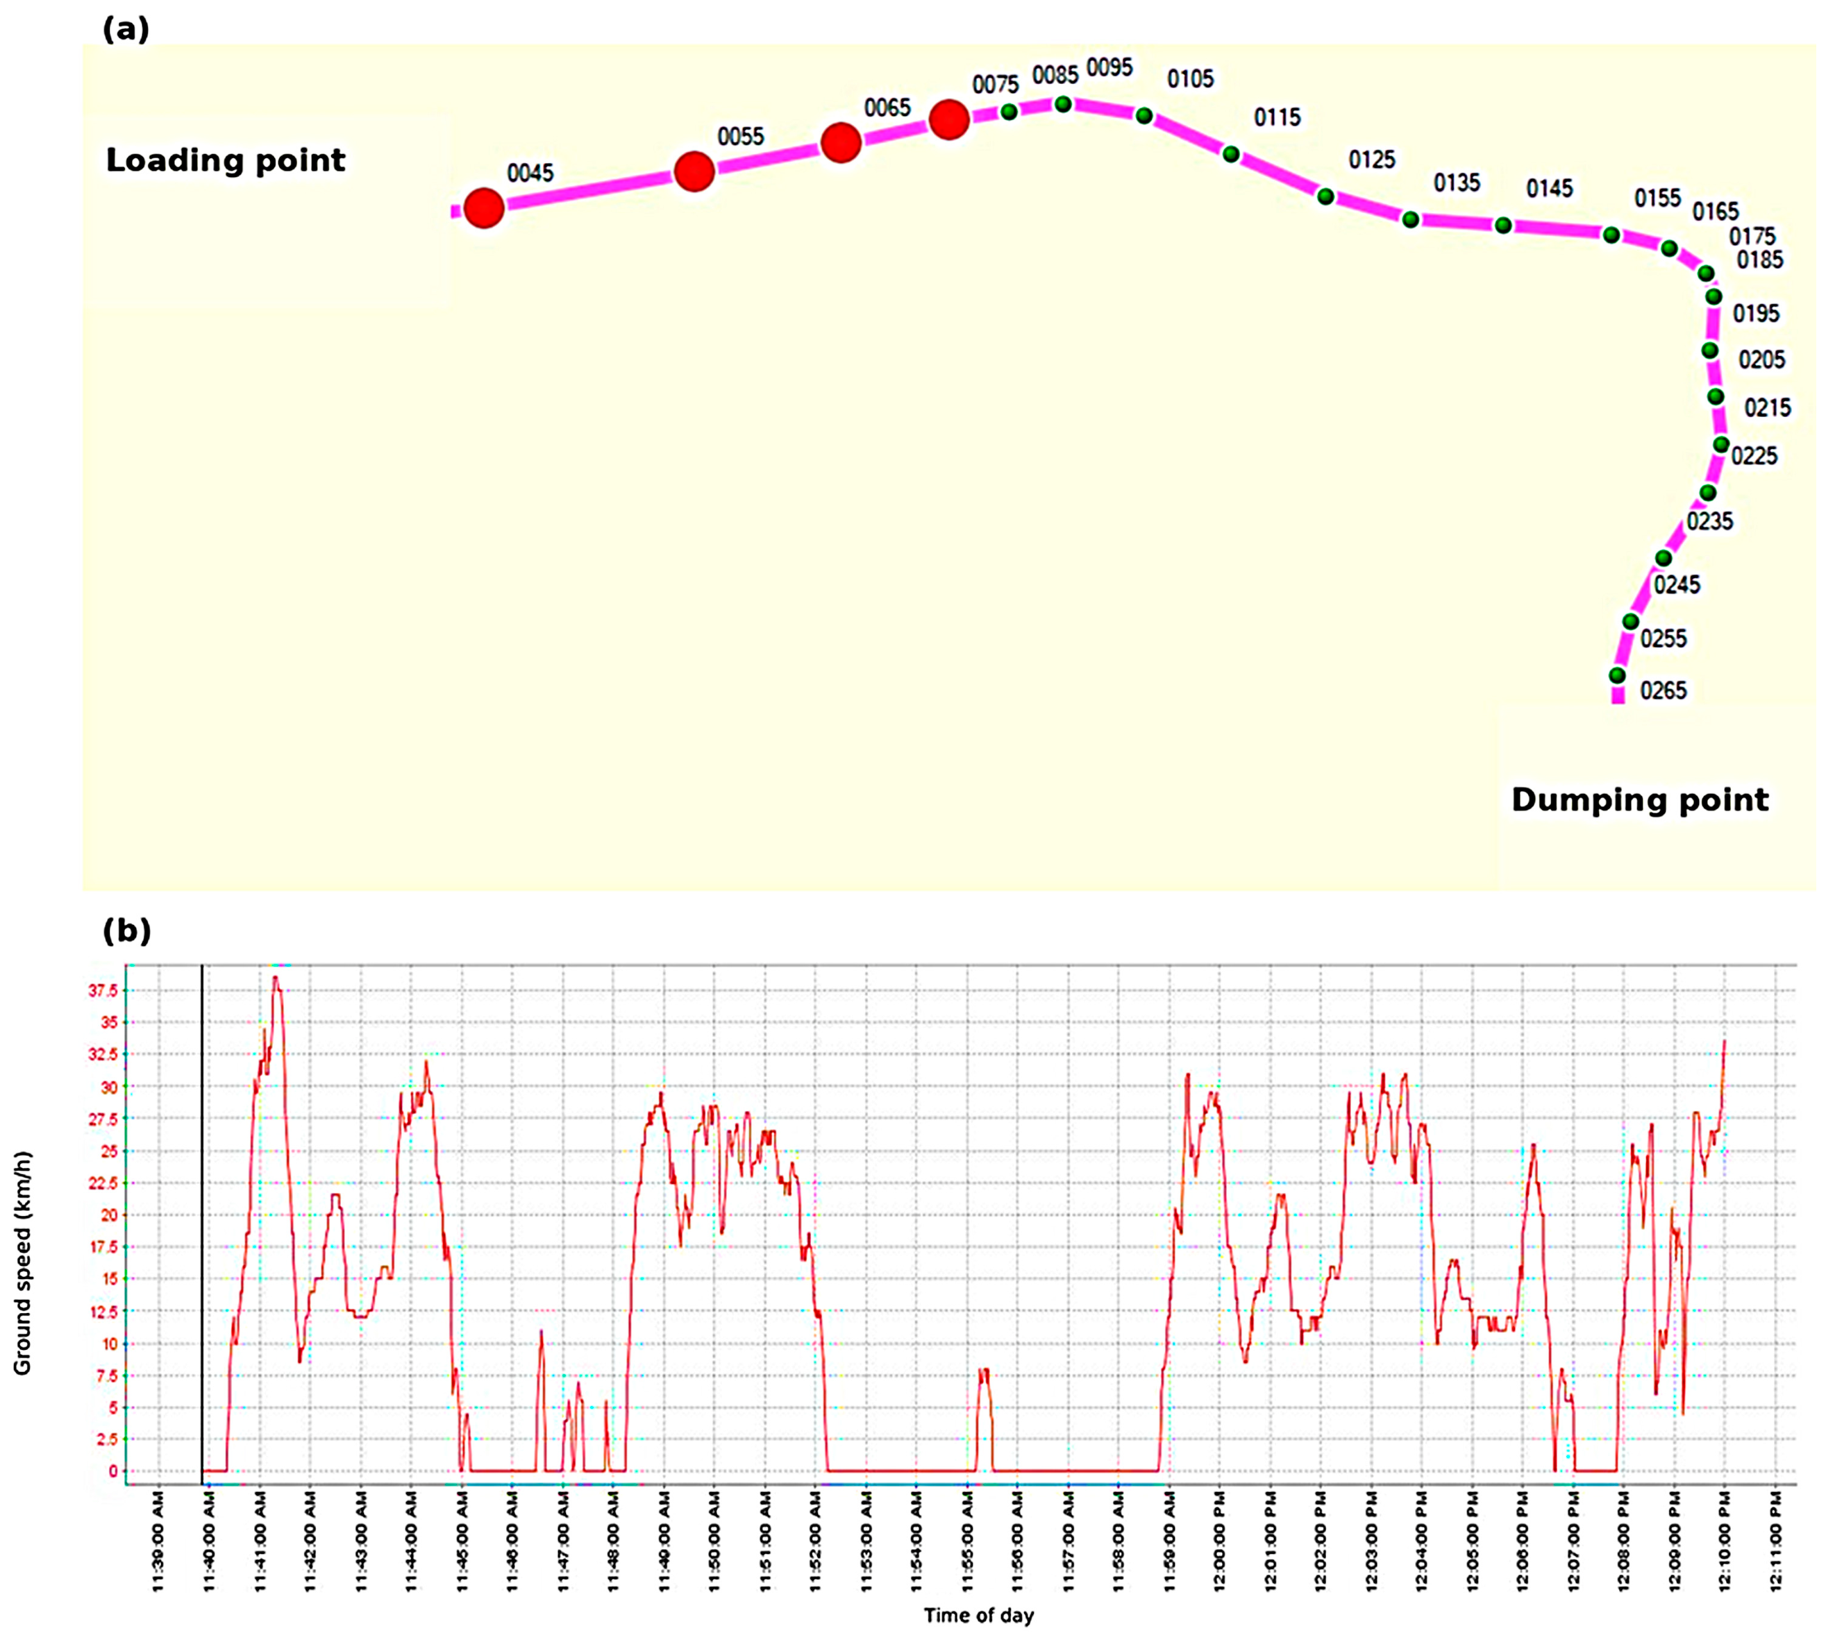
The monitored route and a representative measured speed interval are shown in Figure 2. Figure 2a characterizes the spatial route and control/defect zones. Figure 2b plots ground speed (km/h) against time of day; it is an illustrative interval rather than the campaign-wide speed distribution.
Figure 2a shows the pronounced curvature and heterogeneity of the route; large markers denote key control and defect zones in the original scheme. Figure 2b shows ground speed varying mainly between approximately 20 and 35 km/h, with short and extended reductions to near zero. These reductions were not automatically attributed to road defects because some correspond to technological stops and maneuvers. Energy analysis was therefore performed only after segmentation by position, payload state, and operating mode.
Geometric and operational characteristics of the monitored section are shown in Table 3. It includes only parameters confirmed by the field program that are directly necessary for energy interpretation.
As follows from Table 3, one constant coefficient C r r is not enough to describe the route under study. With the same average trip length, local irregularities, curves and longitudinal gradient redistribute traction power over time. For DGB, this is fundamental, since load distribution determines the intervals in which gas supply can be implemented most fully.

4.2. Time Variability of DGB at the Level of Transport Cycles

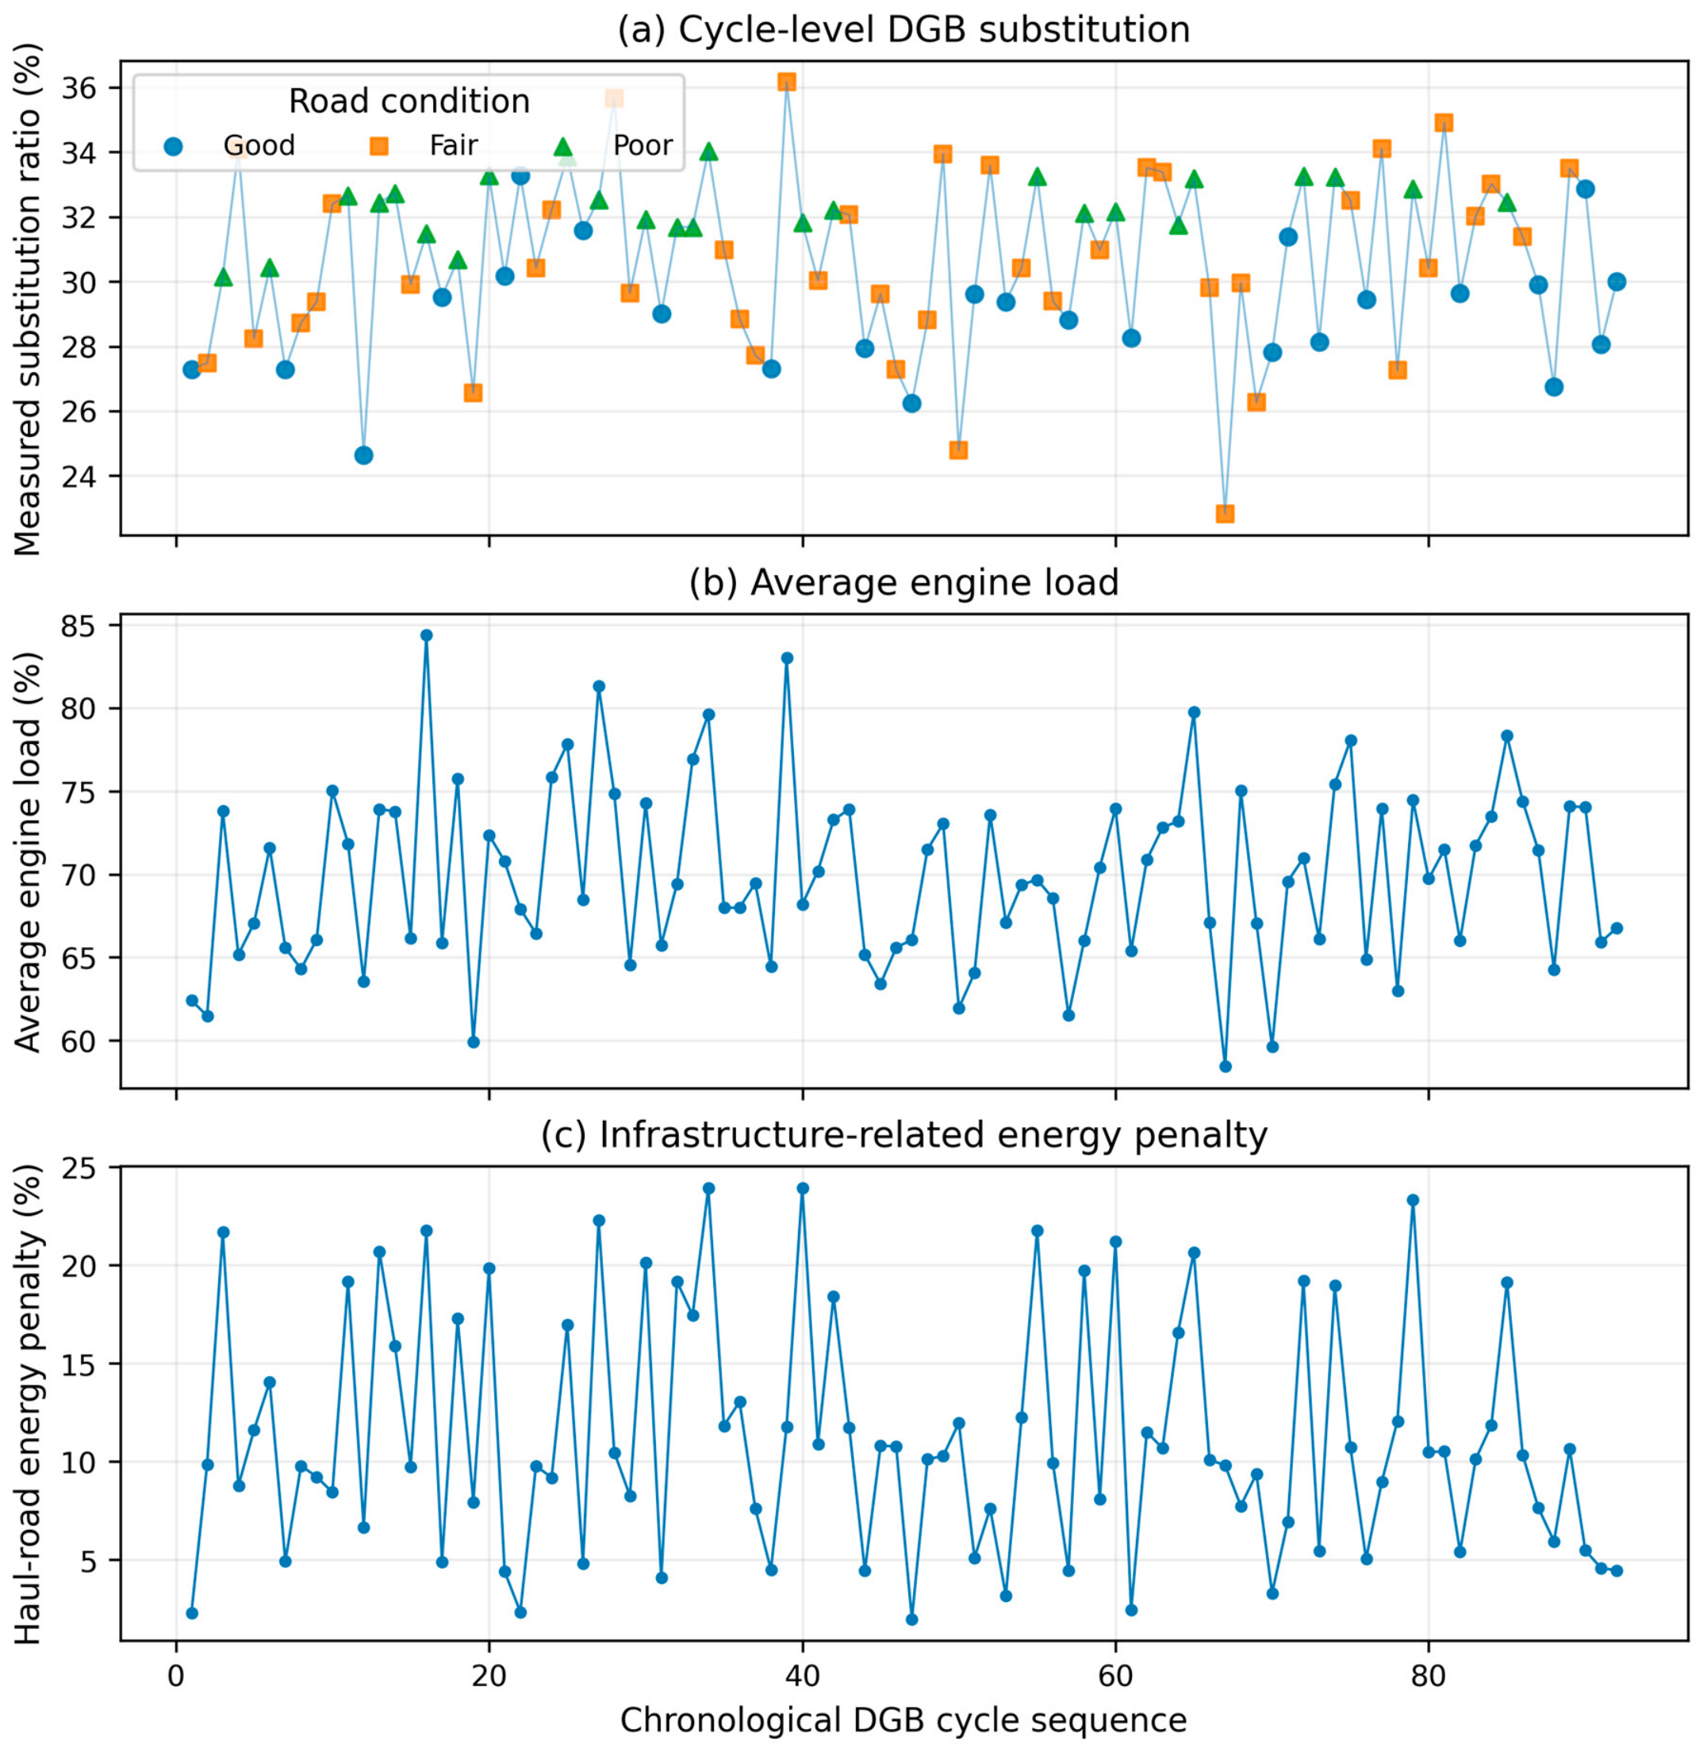
After selecting the DGB mode, 92 complete transport cycles were included in the analysis. The average measured S R was 30.61%, the median was 30.56%, and the range at the full-cycle level was 22.83–36.15%. The average engine load for DGB cycles was 69.90%; the average H E P was 11.24%. The chronological variability of these indicators during 30 shifts is presented in Figure 3.
Figure 3a shows that DGB substitution at the full cycle level is not a constant characteristic of the installation and changes with the duty cycle and road conditions. A comparison of Figure 3a,b shows the combined increase in S R and engine load, while Figure 3c shows that high-load cycles are often characterized by a concomitantly elevated H E P relative to the reference state. This co-variability represents field association and is not a substitute for causal experiment; it substantiates the need to assess gas substitution together with the full energy of the transport cycle.
This result is consistent with studies of operational scenarios of quarry transport, where power distribution and fuel consumption change significantly along with the production cycle [49]. A similar conclusion follows from the works on the optimization of the speed profile: the redistribution of traction work in time changes the final energy result even with the same transport task [27]. For open-pit coal mines, which are one of the key contexts for the use of quarry vehicles, this conclusion is especially significant due to the repeated high-load cycles and the pronounced dependence of energy consumption on the condition of technological roads.

4.3. Integrated Interaction of Engine Load and Road Infrastructure

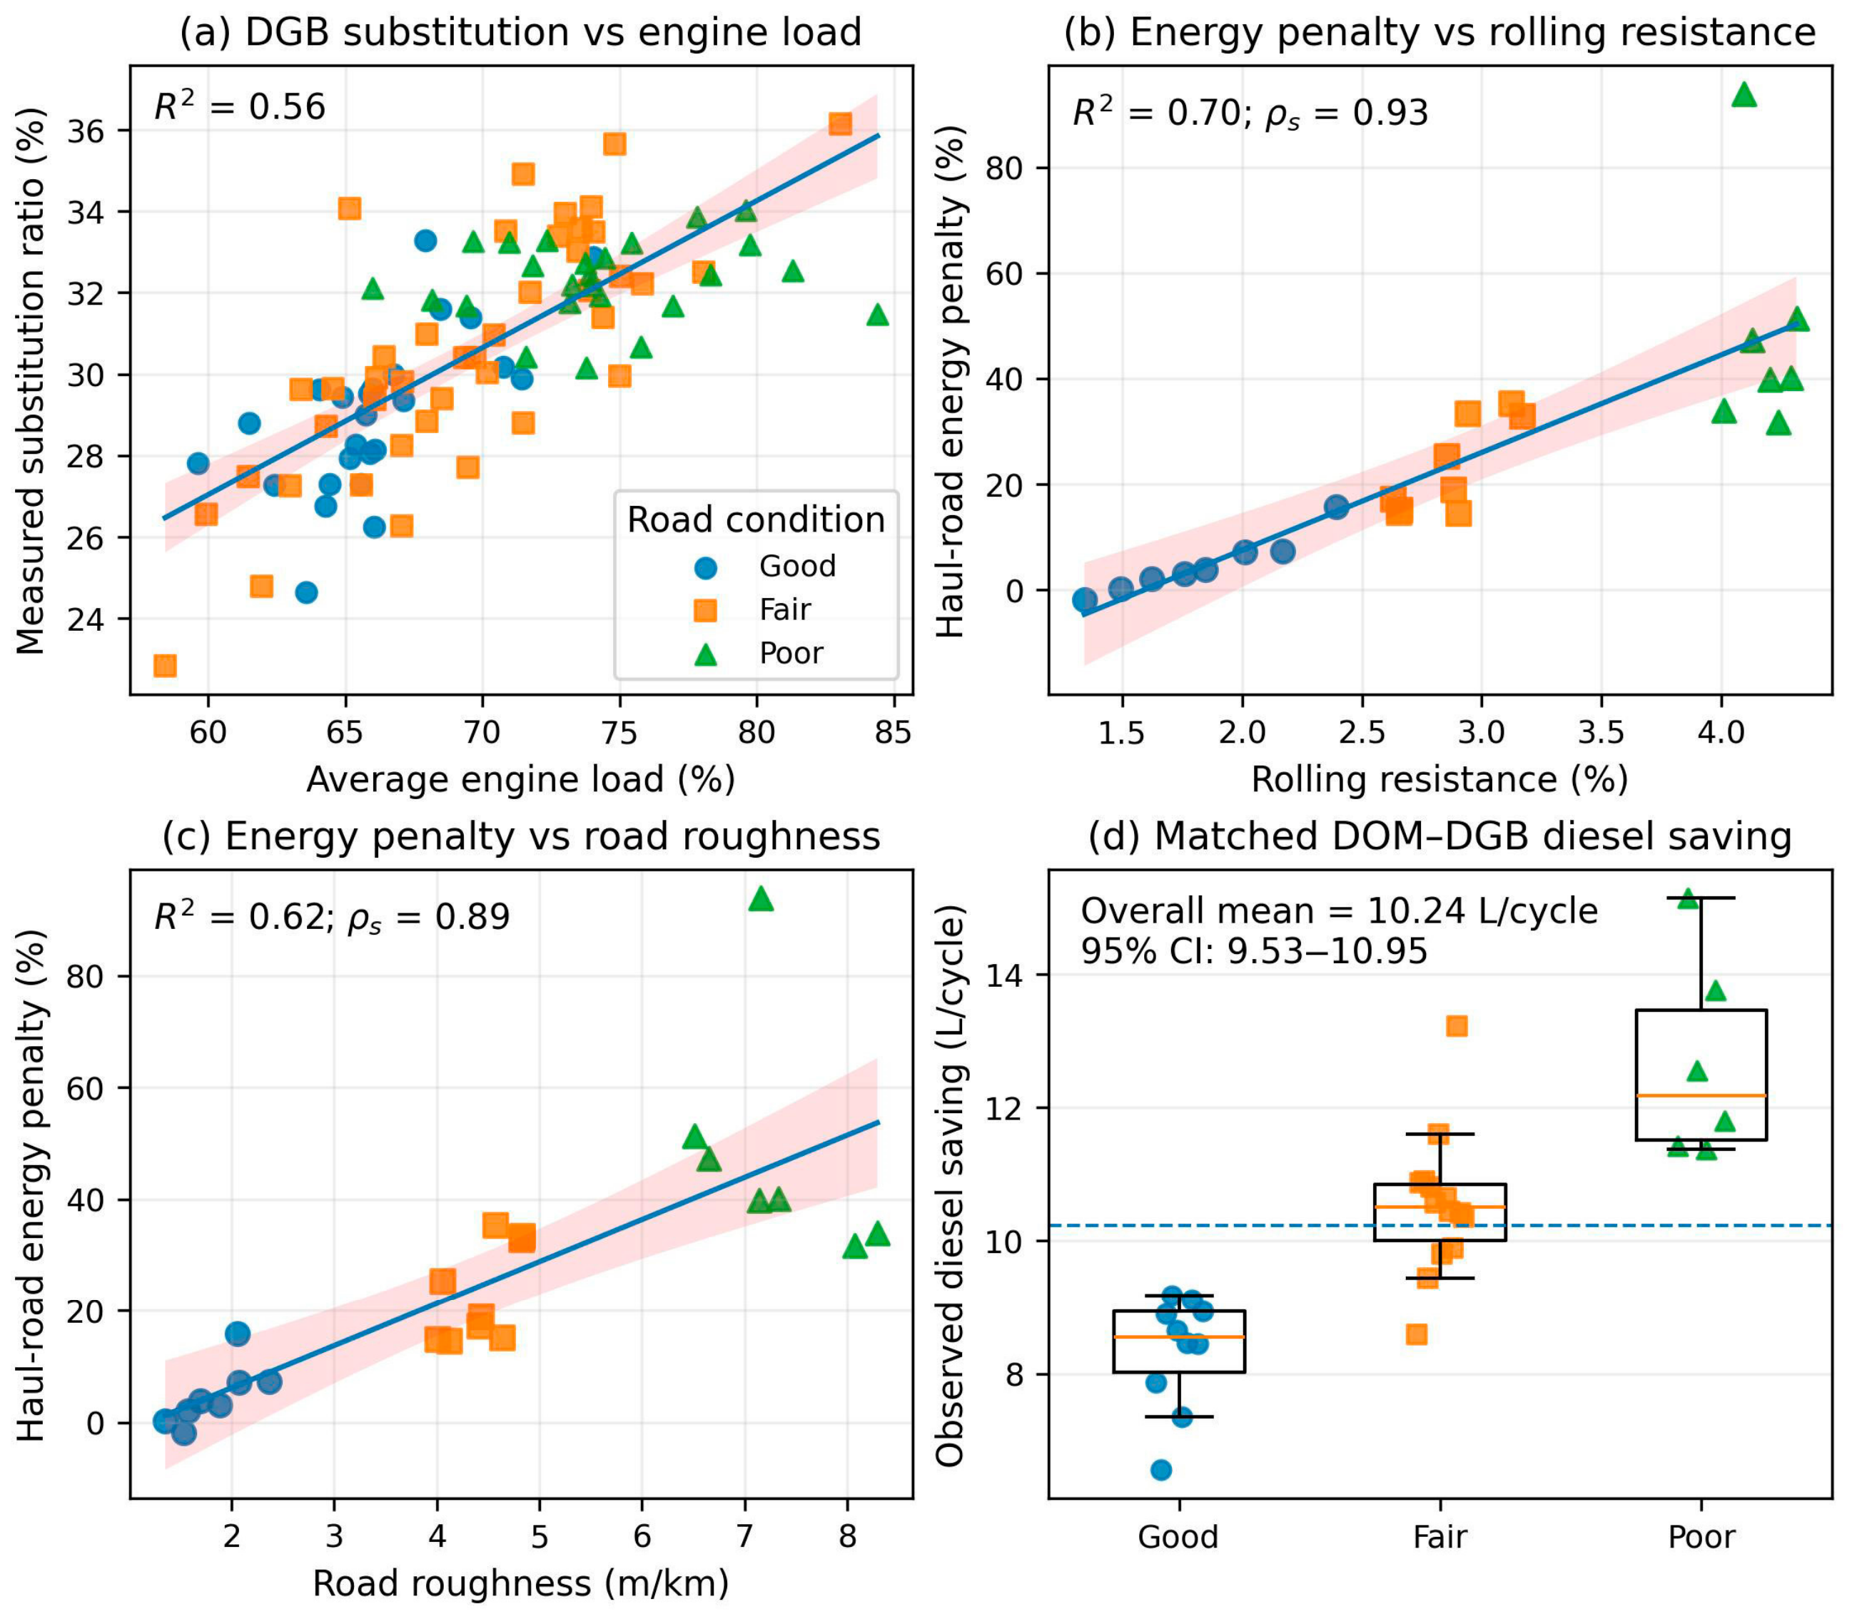
To test the central hypothesis, the data are summarized in four interrelated experimental representations (Figure 4): the dependence of the measured S R on the engine load, H E P on rolling resistance, H E P on the roughness of the coating and the observed economy of diesel fuel in the matched DOM–DGB pairs. Such a representation transfers the concept of integrated indicators from an illustrative to a statistically verifiable form.
In Figure 4a, there is a pronounced association of the measured S R with the average load of the engine: a simple regression at the cycle level explains about 56% of the variance of S R . Figure 4b shows a strong relationship of H E P with independently estimated rolling resistance ( R 2 = 0.70; Spearman ρ = 0.93), and in Figure 4c—with the roughness of the coating ( R 2 = 0.62; ρ = 0.89). The independence of the sources of these indicators supports a descriptive association for H E P as a comparative energy indicator, but does not turn it into a direct measurement of mechanical losses. In Figure 4d, the average diesel fuel economy increases from 8.35 L/cycle for Good to 10.54 L/cycle for Fair and 12.67 L/cycle for Poor; this result should be interpreted in conjunction with the increase in engine load and S E C E , and not as an independent increase in overall energy efficiency.
Multidimensional monitoring systems for open-pit mining confirm the advantage of joint analysis of road and production channels [50]. In field models of fuel consumption, the longitudinal slope, distance, weight of the load and the mode of use of the machine are regularly distinguished [51]. The result clarifies this picture: the deterioration of infrastructure may be accompanied by an increase in the share of gas substitution due to a higher load and a deterioration in system energy efficiency through the growth of H E P and S E C E .
The quantitative division of this dual effect into three classes of road condition is shown in Table 4.
Table 4 shows the sequential change in Good → Fair → Poor over 92 DGB cycles: the average load increases to 66.11 → 69.48 → 74.40%, and the measured S R increases to 28.97 → 30.57 → 32.31%. At the same time, H E P increases to 4.59 → 10.16 → 19.73%, S E C E to 5.91 → 6.18 → 6.72 MJ/(t·km), cycle time to 21.77 → 23.50 → 25.69 min, and the average loaded speed decreases to 14.69 → 13.36 → 11.69 km/h. For all six indicators, the Kruskal–Wallis test yields p < 0.001. Consequently, a higher S R in the worse condition of the road cannot be interpreted as an independent energy advantage.

4.4. Matched DOM–DGB Pairs: Fuel, Energy, Performance, and CO2

To mitigate the impact of traffic problem differences, 30 matched DOM–DGB pairs were formed within the same shift, route, and road condition class. The average weight of the load was 131.59 t in DOM and 131.51 t in DGB (paired p = 0.719). The average absolute pairing difference was 0.665% and did not exceed 2.237%. This confirms the high comparability for the main transport load, although the production design remains non-randomized. The results of the paired analysis are shown in Table 5.
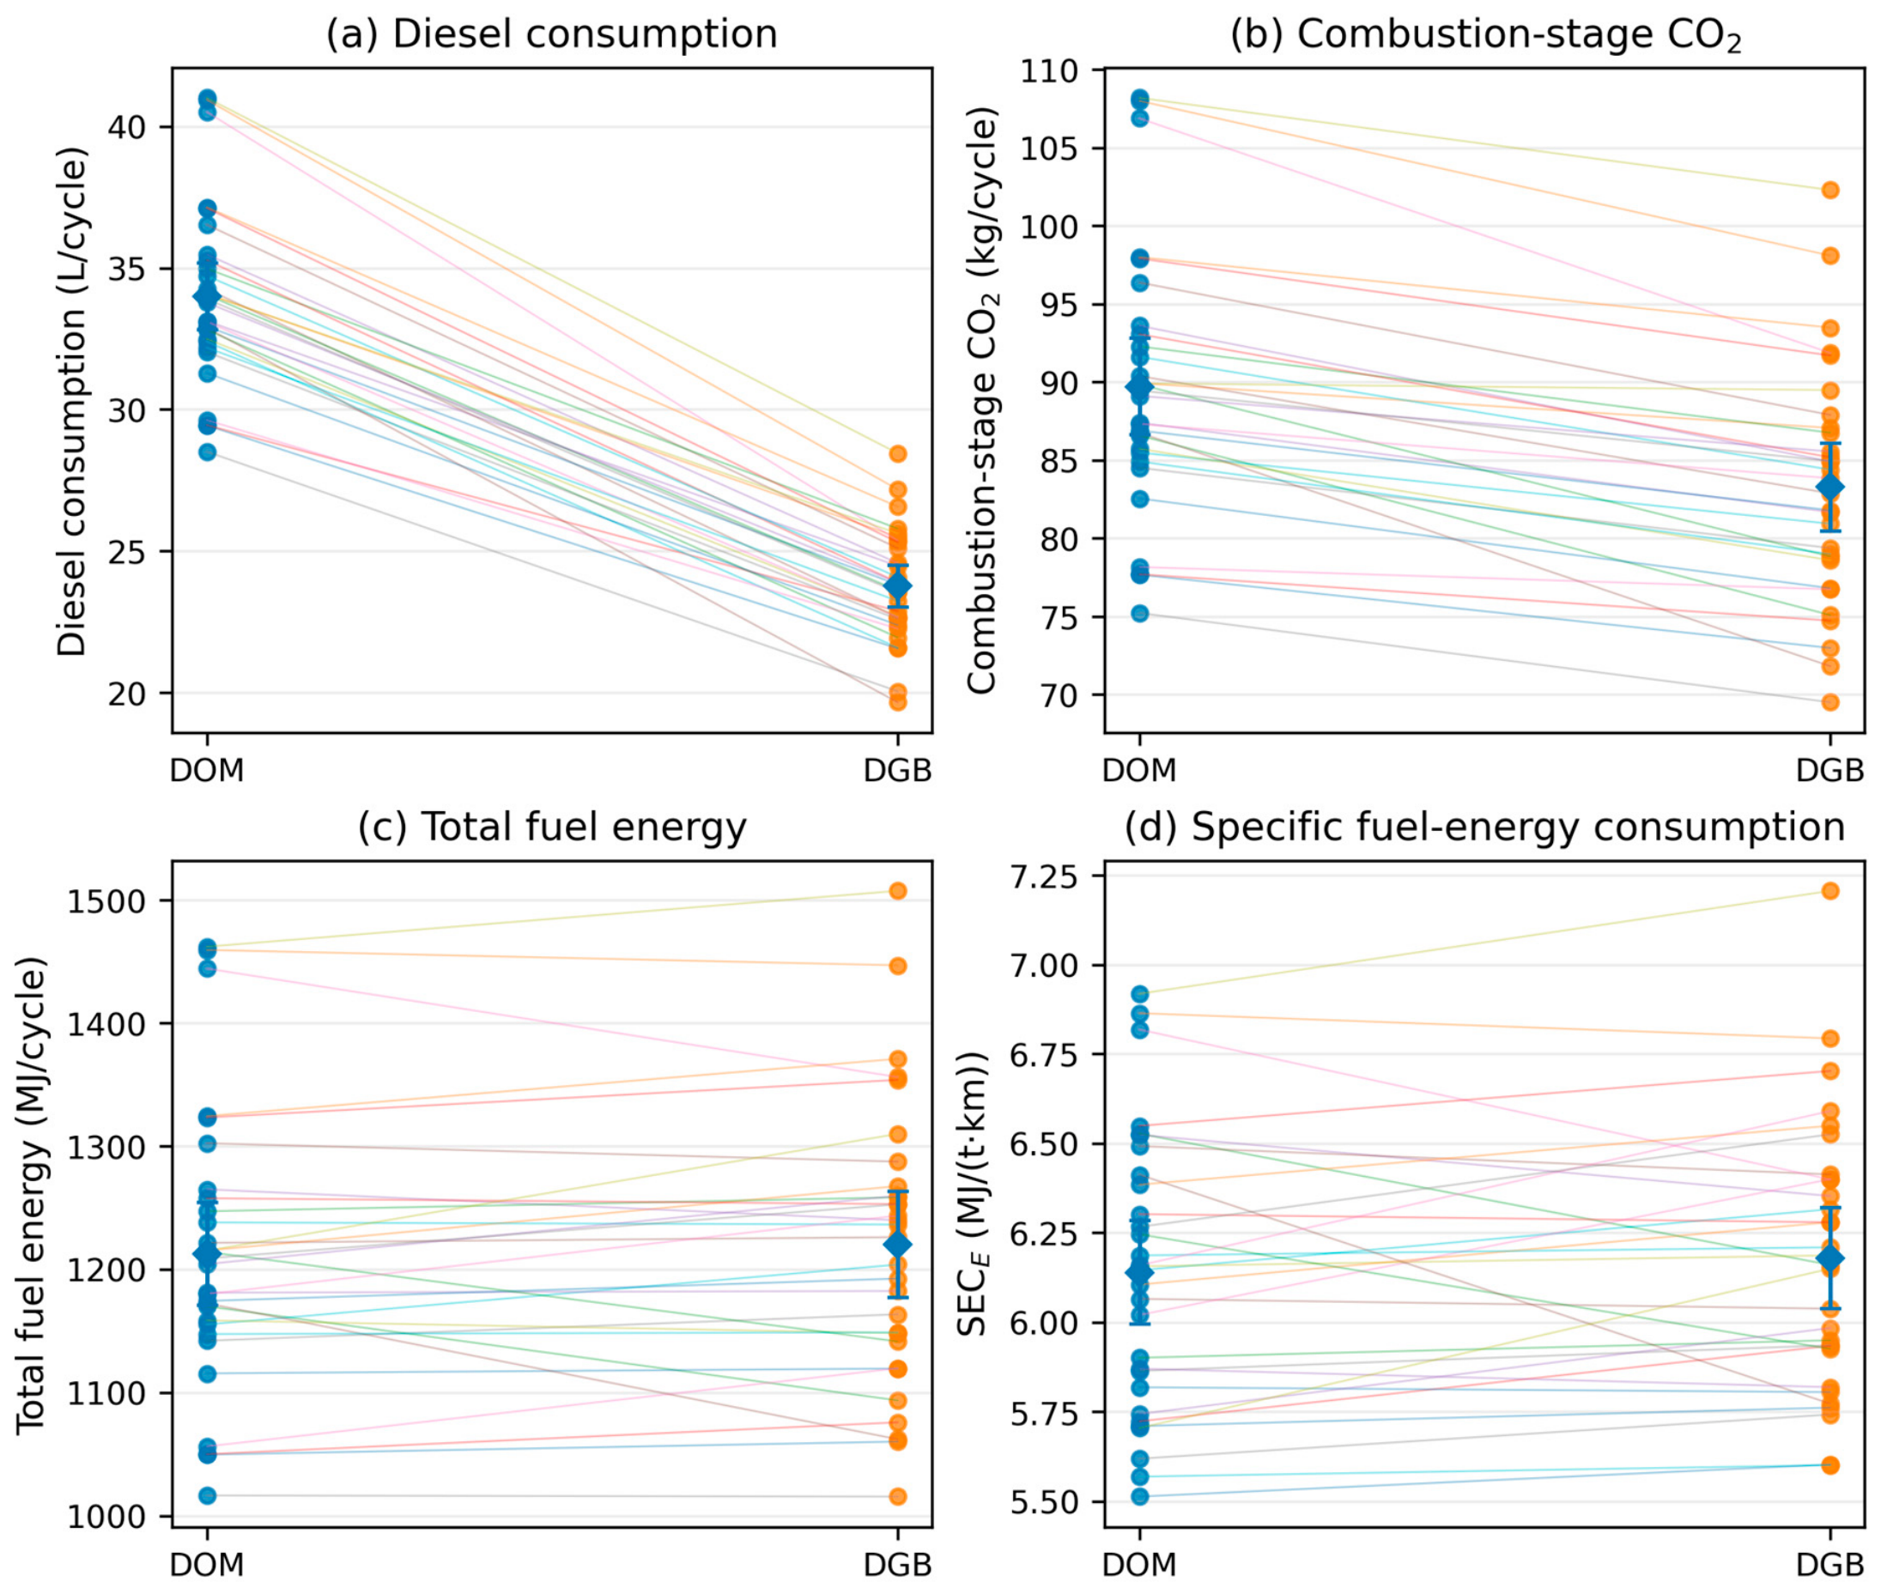
As can be seen from Table 5, in the matched DGB cycles, the average diesel fuel consumption was lower by 10.24 L/cycle (95% CI 9.53–10.95), which corresponds to an average diesel displacement of 29.96% (95% CI 28.55–31.37). The estimated CO2 emissions at the combustion stage were lower by 6.44 kg/cycle, or 7.10% compared to the matched DOM. At the same time, the total chemical energy of the fuel, S E C E , cycle time and average engine load did not differ statistically significantly. Therefore, within this mapped field design, the main observed effect of DGB is a change in fuel structure and design CO2 without detecting a systematic change in total energy or transport cycle duration.
Under the adverse flow-accuracy scenario, the mean diesel saving remains 9.37 L/cycle and the mean calculated combustion-stage CO2 saving remains 3.95 kg/cycle. In contrast, the mean fuel-energy difference ranges from −27.11 to +42.13 MJ/cycle across opposite bias scenarios. Thus, the sign of diesel displacement is more robust than a claim of total fuel-energy improvement. These results apply to the recorded cycle totals and do not resolve the independent telemetry inconsistencies.
The individual structure of all 30 matched pairs is shown in Figure 5. In contrast to comparing only group means, paired lines allow you to estimate the inter-cycle variability and direction of change in each agreed observation.
In Figure 5a,b, almost all pairs show unidirectional reductions in diesel consumption and estimated CO2 emissions during combustion. In Figure 5c,d, the individual changes in the total chemical energy of the fuel and S E C E are multidirectional, and the 95% confidence intervals of the paired differences include zero. Consequently, a significant displacement of diesel fuel cannot automatically be described as an equal reduction in the total chemical energy of the fuel.
The principle of comparing transport cycles is consistent with the tasks of dispatching, where energy assessment depends on the comparability of operating states [28]. For hybrid and multi-component propulsion systems of mining machines, it is also necessary to take into account the required power and duty cycle, and not only the type of energy source [52].

4.5. Statistical Assessment of the Load–Substitution Association

To test the load-mediated hypothesis, a multivariate model was built at the level of 92 DGB cycles. Its task is to separate the simple connection between the state of the road and S R from the conditional association that persists after taking into account the load of the engine and the main operating covariates. The main coefficients are shown in Table 6.
Table 6 shows that mean engine load is the dominant predictor of measured S R : a 1 percentage point increase in load corresponds to an average increase of S R by 0.361 percentage points (95% CI 0.263–0.460; p < 0.001). Before adjustment for engine load, the road condition index was associated with S R , but in the full model, its independent coefficient becomes statistically insignificant (p = 0.524). This is not formal evidence of causal mediation, but is consistent with the physically motivated chain of “road condition → required traction/load → DGB substitution”. At the same time, H E P maintains a strong association with independently evaluated rolling resistance and road roughness.
After adding temperature and wind, the engine-load coefficient was 0.355 percentage points of S R per percentage point of engine load (HC3 95% CI 0.253–0.456; p < 0.001; model R2 = 0.594). The road-index coefficient remained non-significant (−1.752; 95% CI −5.333 to 1.829; p = 0.338). With shift-clustered inference, the load coefficient retained a 95% CI of 0.265–0.445, while the road-index p-value was 0.269. The load association is therefore stable under these specific checks, without demonstrating a causal pathway. When the road-condition index was omitted, the engine-load coefficient remained positive at 0.378 percentage points of substitution per percentage point of recorded load (HC3 95% CI 0.297–0.459; shift-clustered 95% CI 0.299–0.458; both p < 0.001). The model explained 59.0% of the observed substitution variance. Thus, the positive conditional load association did not require the supplied road-index values in this sensitivity specification; this result does not validate the original road-index construction.
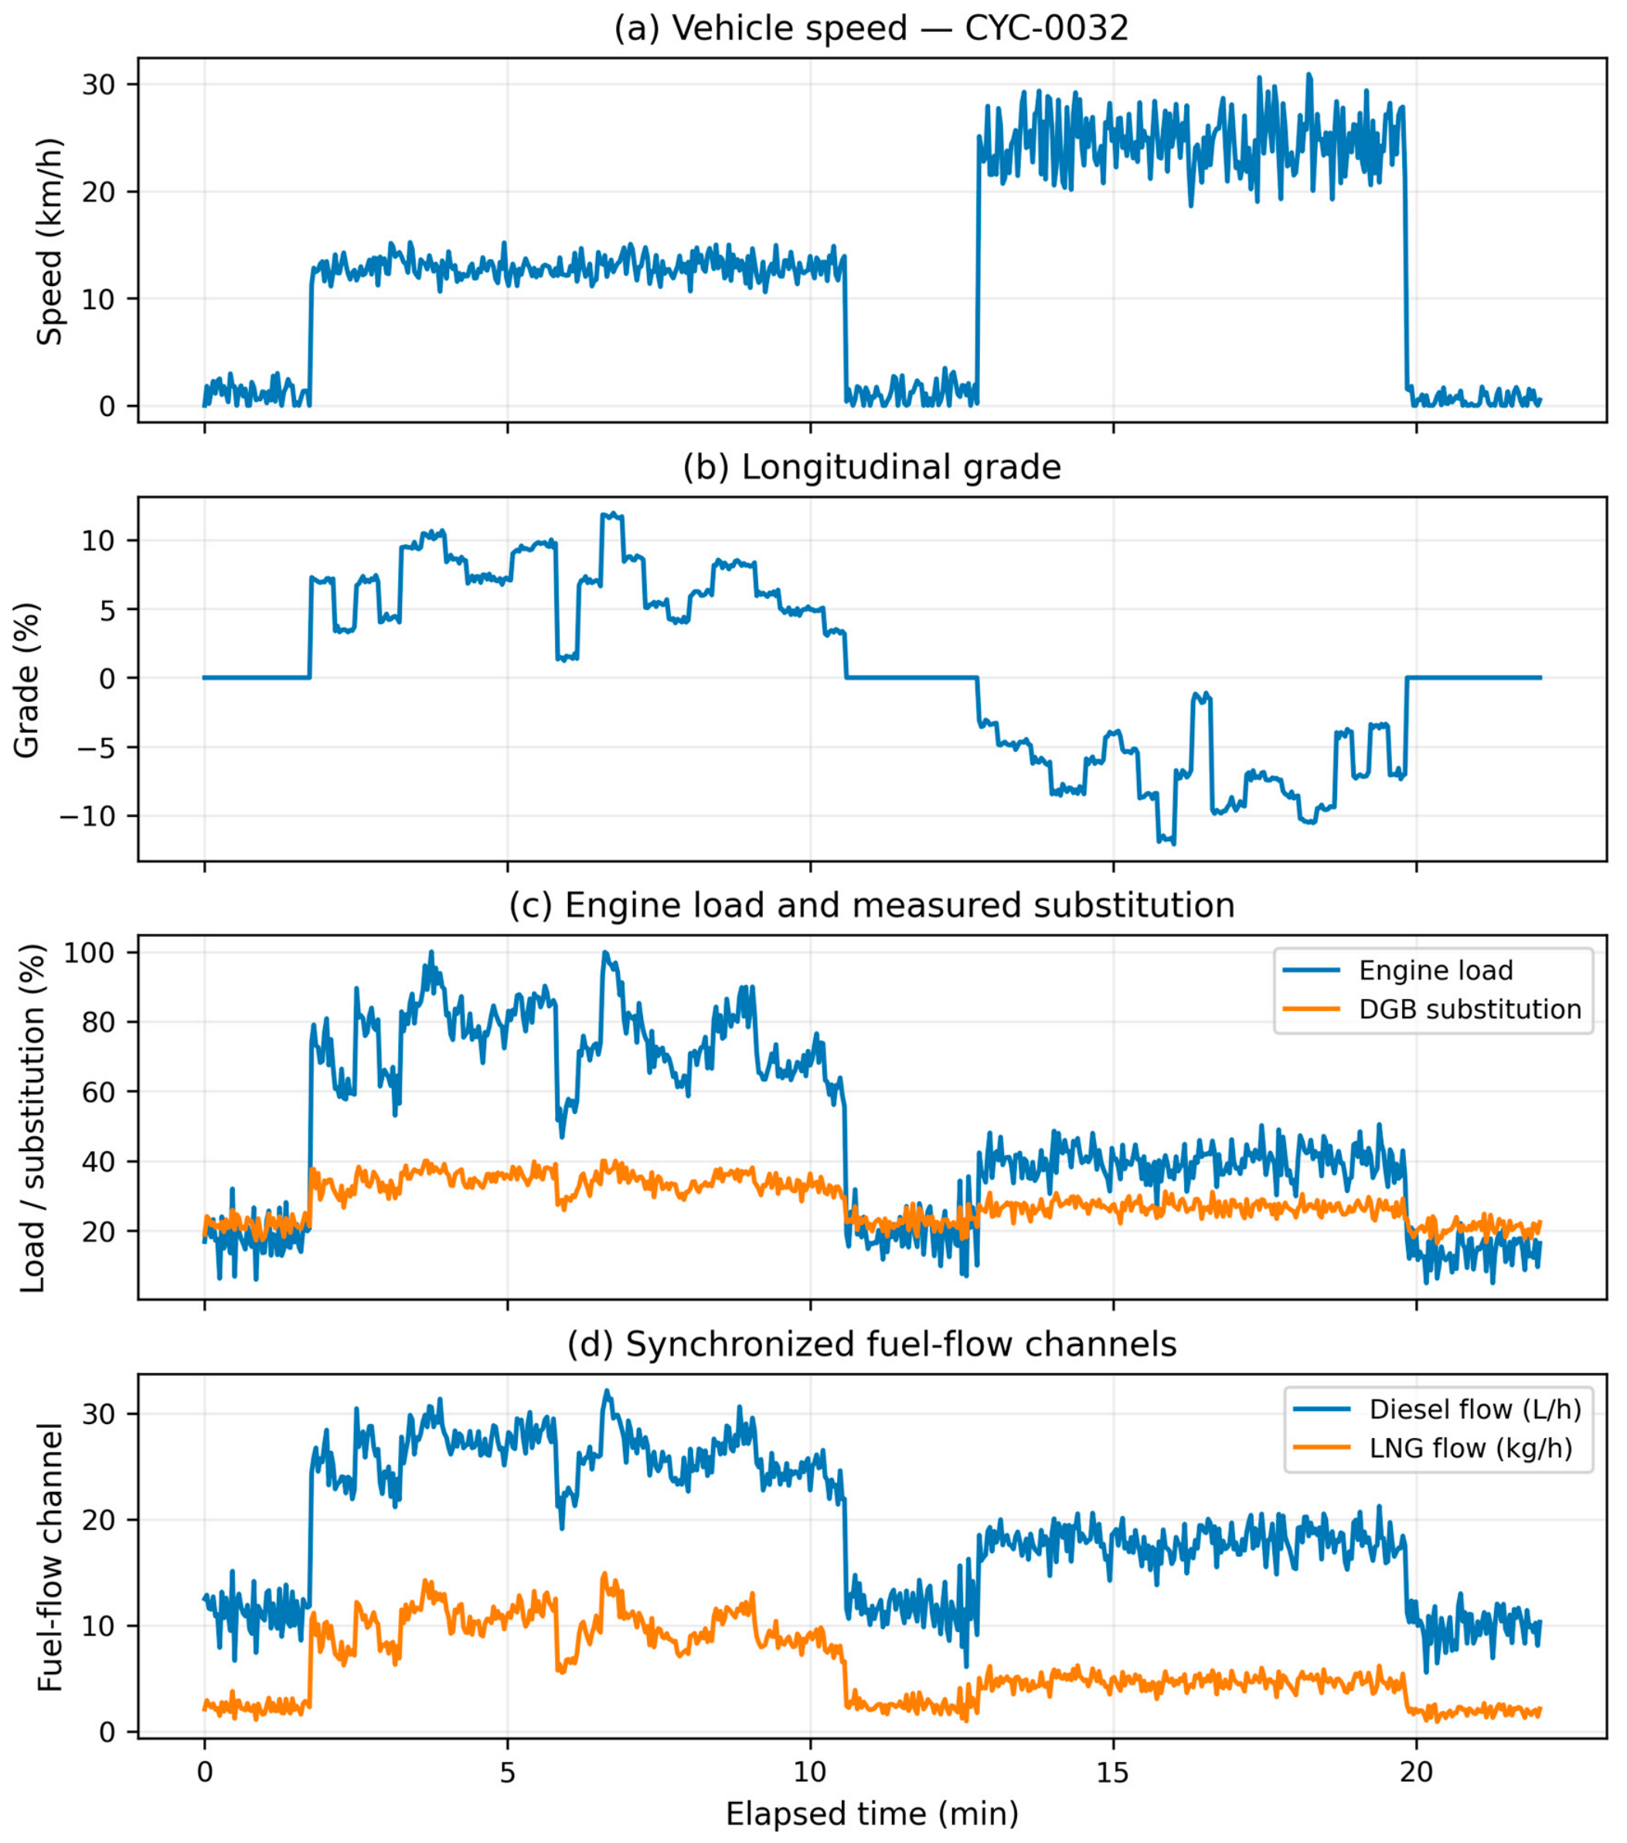
Figure 6 displays the supplied CYC-0032 record on a common time axis for diagnostic inspection. Its 625 points span 22.0418 min. Reconciliation against the cycle register is reported explicitly below because this export does not provide a quantitatively validated reconstruction of the complete transport cycle.

4.6. Local Road Defects and Recorded Vehicle Responses

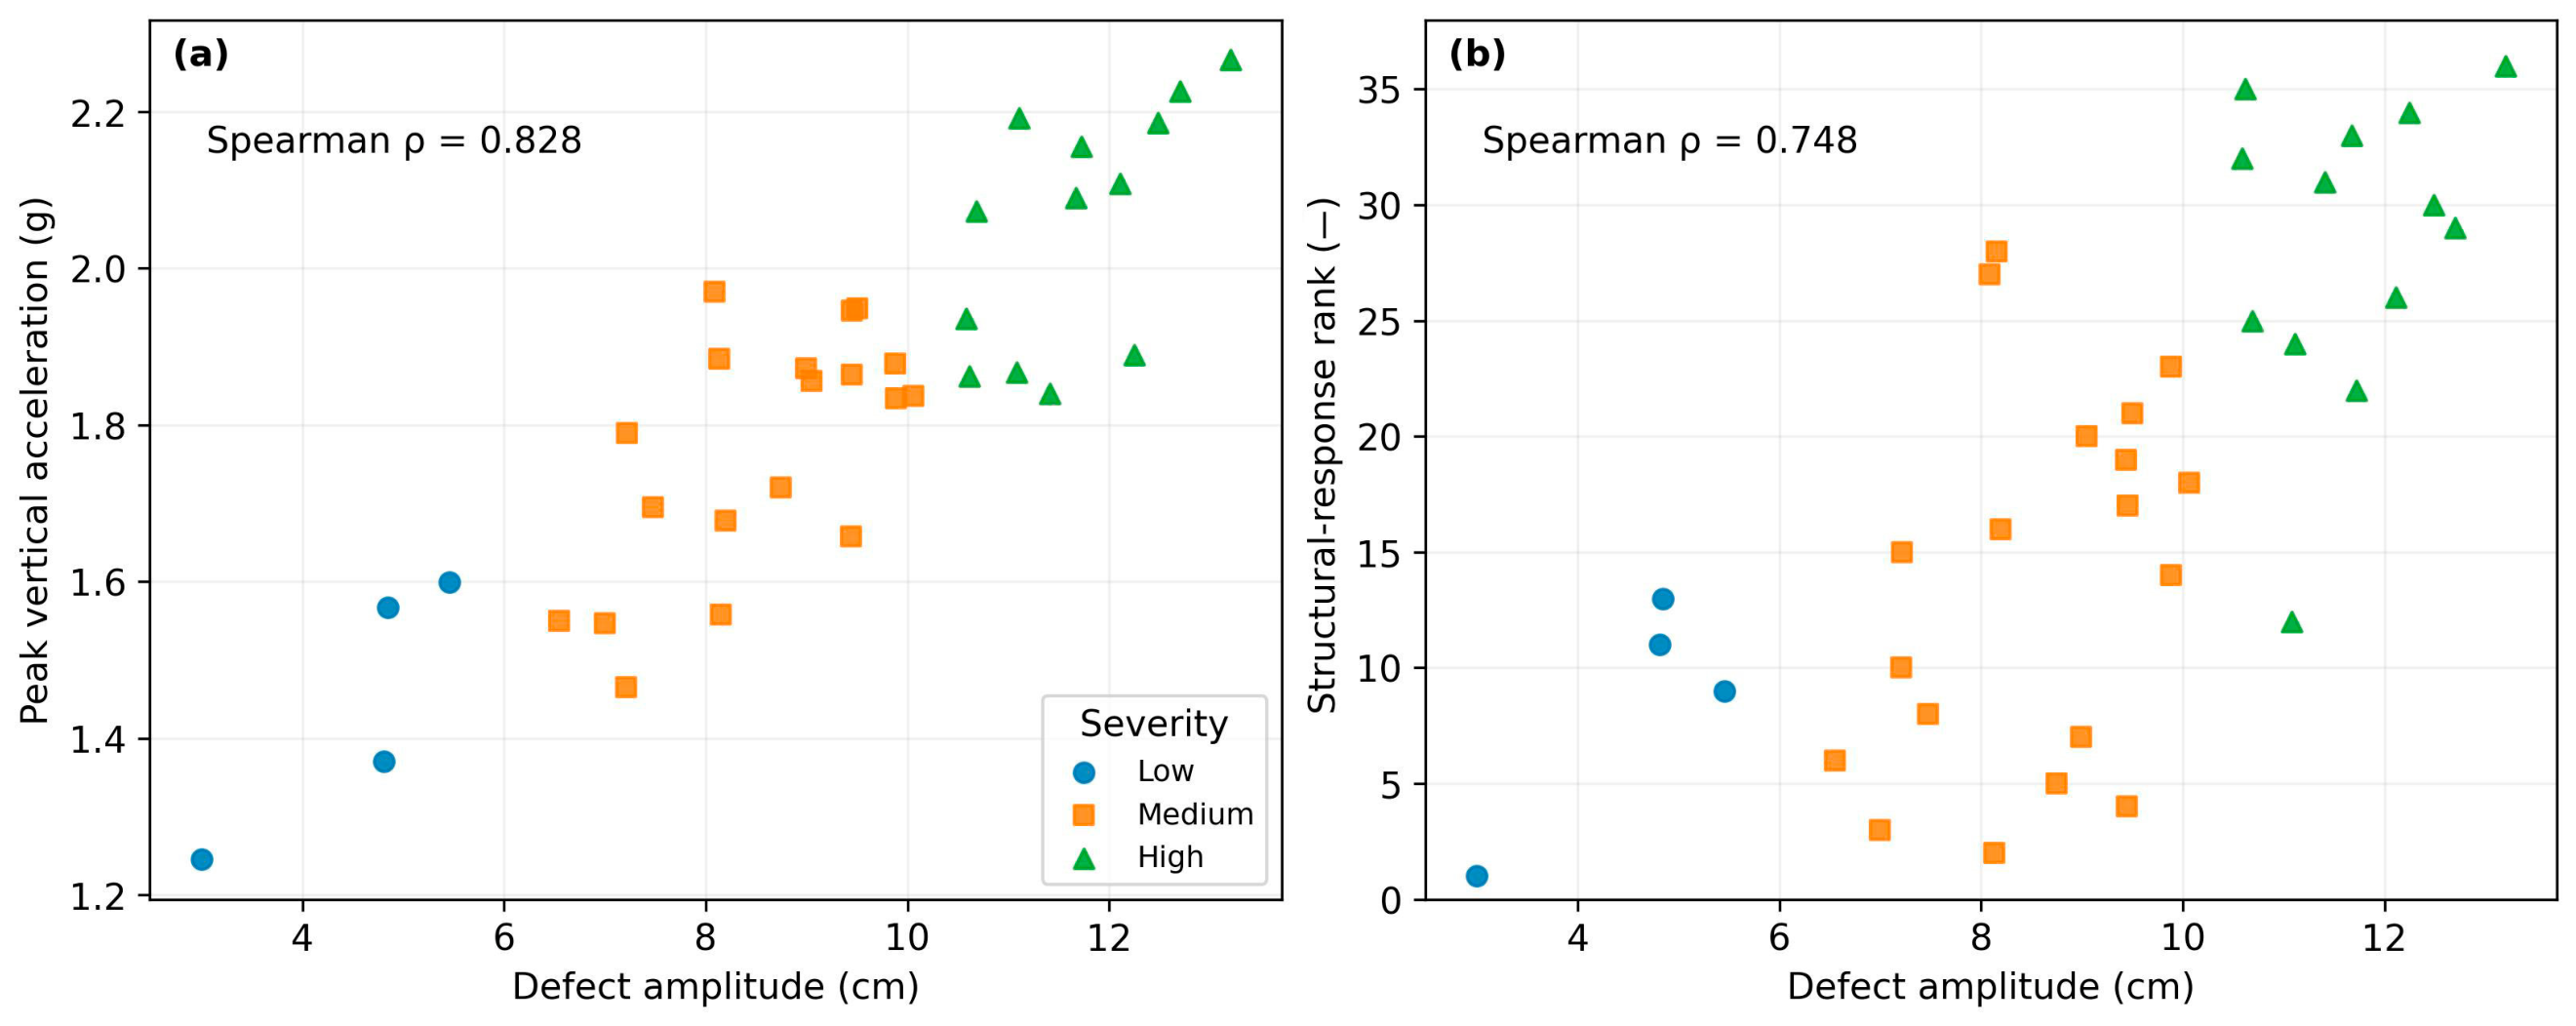
The 36 recorded RACK/BIAS/PITCH events were analyzed for associations between defect amplitude and vehicle response. Figure 7 retains vertical acceleration in the documented unit g; the structural–response channel is shown as within-sample ranks because its physical unit is unspecified.
Defect amplitude was monotonically associated with peak vertical acceleration (Spearman ρ = 0.828; p < 0.001) and with the recorded structural–response rank (ρ = 0.748; p < 0.001).
The authors’ related study [53] was devoted to segmental multisensor diagnostics of degradation of quarry roads, and the quasi-experimental work [54] was devoted to the effect of road repair in terms of fuel consumption, cycle time, and mechanical load. In this paper, the same classes of infrastructure measurements are included in another dependent task—the analysis of the DGB mode, the actual displacement of diesel fuel and the energy and environmental results of dual-fuel operation. Study [53] defines its surface-condition index using normalized roughness, waviness, rutting and defect-density components, with weights summing to unity and grade represented separately. This provides a documented methodological precedent. The underlying data of [53] are available from its corresponding authors on request.

5. Discussion

5.1. Why the Road Condition Changes the DGB Effect

The main physical result is the identified dual DGB infrastructure pattern. The deterioration of the road condition is accompanied by a higher required traction load and a higher measured S R ; at the same time, H E P , S E C E and cycle time also increase. Such joint dynamics are consistent with the load-mediated interpretation, in which increased S R on a bad road is observed in a heavier energy regime and therefore is not an independent sign of an increase in the efficiency of the transport system.
Between the Good and Poor classes, the average engine load increases by about 8.29 percentage points, measured S R by 3.34 percentage points, while H E P increases more than fourfold (4.59 → 19.73%), S E C E by about 13.8%, and the loaded speed decreases by about 20.4%. Therefore, for a given object, DGB optimization should be carried out in conjunction with an estimate of energy intensity and infrastructure, rather than by isolating the gas share.
H E P is sensitive to the reference scale. Increasing all reference energies by 5% changes the Good/Fair/Poor means to −0.39%, 4.91% and 14.03%; reducing them by 5% gives 10.09%, 15.95% and 26.03%. Class ordering is preserved under this common perturbation, but the Good-class mean crosses zero. A uniform reference rescaling also preserves rank correlations algebraically, so this stability must not be mistaken for empirical validation of the reference model. Class-specific reference errors remain untested.
Once the average engine load is included in the multivariate model, the independent coefficient of the road condition index for the measured S R becomes statistically insignificant. This observation is compatible with the load-mediated chain “road condition → required traction/load → DGB substitution”, but does not in itself prove causal mediation. At the same time, the deterioration of road conditions maintains a pronounced energy association through H E P , S E C E , rolling resistance and roughness. In practice, this means that S R only needs to be interpreted in conjunction with the total energy indicators and the independent characteristics of the infrastructure.

5.2. Scientific Novelty and Difference from Previous Research

Previous work [53] tested multisensor monitoring at the same industrial site, focusing on segment-level road morphology, dynamic response, and a fuel-use proxy; DGB substitution was not its primary endpoint. Study [54] evaluated road-maintenance effects on fuel use, cycle time, and mechanical load. The present study instead analyzes dual-fuel operation through 180 DOM/DGB cycles, 30 matched fuel-mode pairs, ECM-reported substitution, estimated combustion-stage CO2, and reference-state HEP. These publications provide the infrastructure and methodological context. The present analytical contribution is the joint interpretation of gas substitution, paired diesel displacement, and total fuel energy under heterogeneous road conditions.
Studies [53,54] were published in 2026. Publication year must be distinguished from the observation period: study [54] reports a 2024 cycle register, whereas the current workbook covers August 2025. These dates distinguish the reported observation periods but do not establish data set independence.
The contribution is the joint cycle-level interpretation of three distinct endpoints: ECM-reported substitution, matched diesel displacement and total fuel chemical energy. The 180-cycle register and 30 matched pairs allow these endpoints to be compared with road-condition indicators. The revised analysis also tests weather adjustment, within-shift dependence, declared flow-accuracy bounds and reference-energy sensitivity. The unreconciled telemetry export is excluded from quantitative validation; the inferential conclusions are conditional on the supplied cycle and pair registers.

5.3. Comparison with the Literature and Limits of Interpretation of Calculated CO2 Emissions

Sütheö and Háry [55] reported approximately 11% lower CO2 emissions for LNG heavy-duty trucks under controlled test-track conditions. The present 7.10% mean paired reduction is directionally consistent but is not a direct replication: this study examines a diesel–LNG retrofit on a mine haul cycle and estimates combustion CO2 from recorded fuel totals. Powertrain technology, duty cycle and emission-estimation methods differ. Baráth et al. [56] further motivate matching the payload and operating task when comparing diesel and LNG vehicles.
For natural gas-powered road vehicles, field measurements show that the estimate of CO2 alone is insufficient, as NOx, CO, HC, and methane slip change simultaneously [57]. LNG life cycle analysis additionally includes the extraction, production, liquefaction and transportation of fuel [58].
Systematic estimates of the complete fuel chain show a wide range of results for natural gas in heavy transport [59]. With an increased methane slip or an unfavorable structure of emissions at the previous stages of the fuel chain, the climatic advantage can be significantly reduced or disappear [60]. Therefore, the average reduction of 7.10% established in this paper refers exclusively to the calculated CO2 emissions at the combustion stage and should not be interpreted as a 7.10% reduction in the total life-cycle climate impact.
Stettler et al. [37] evaluated two heavy-goods-vehicle platforms with five aftermarket dual-fuel configurations, explicitly measuring greenhouse-gas and noxious emissions. Their experimental boundary is broader than the fuel-based CO2 calculation used here. Together, these studies show why a numerical reduction in calculated CO2 should be reported alongside duty-cycle definitions and unmeasured methane emissions, rather than presented as a transferable net climate benefit.
In the long term, electric mining trucks change the energy balance due to recuperation and a different architecture of the power plant [61]. Hybrid battery-supercapacitor systems additionally make it possible to match the available energy buffer with the operating cycle [62]. These technologies do not cancel the infrastructural conclusion of this work: the energy penalty of an unsatisfactory road remains regardless of the primary energy source. Since the full-scale experimental base of this work was formed directly at the Ekibastuz open-pit coal mine, this conclusion has a direct applied value for open-pit coal mines: quality management of technological roads acts as a technologically neutral reserve of energy efficiency for both transitional diesel–LNG and future electrified transport systems.
A separate risk of dual-fuel operation remains methane slip. Modern injection and combustion control strategies can significantly reduce it [63]. Field studies of LNG trucks also confirm the need to expand the environmental set beyond CO2 alone [64].
At the level of transport policy, the transition to zero-emission heavy transport is limited by cost, infrastructure and operational requirements [65]. Regional estimates of LNG trucks similarly show the dependence of benefits on the local fuel system and operating cycle [66].
For further development of the approach, reproducible protocols for direct measurement of heavy-engine emissions are especially important [67]. Such extensions should be built around physically interpretable indicators, S E C E , measured S R and independent road channels. H E P should retain the status of a secondary object-dependent comparative indicator until the procedure for forming the reference energy is independently reproduced across several objects.

5.4. Practical Architecture of Infrastructure-Oriented Management

For industrial implementation, it is advisable to use the results on two time scales. In a short-term loop, ECM and GPS/GNSS can map areas where high power requirements, elevated H E P , and unstable speeds are observed at the same time. In the medium-term contour, such sections become candidates for repairs, changes in traffic organization or adjustment of the speed profile.
In this study, maintenance priority is treated as a screening decision rather than a validated optimization score. A segment is a stronger candidate for engineering inspection when elevated HEP recurs together with increased rolling resistance or roughness and with speed loss or dynamic-response peaks. No universal weights, thresholds, or composite maintenance score were calibrated; final repair decisions require engineering inspection together with safety and cost criteria.
At the DGB controller level, the target state should not be the maximum S R per se, but the steady state of the motor at acceptable S E C E , cycle times and infrastructure loads. Mode-dependent algorithms for optimizing the energy infrastructure of quarry transport [48] show the possibility of adaptive control according to the current state of the system. For DGB, a similar future contour can use the prediction of slope and road condition along with the current engine load; such a regulator has not been implemented in this study and is not used to obtain experimental results.
For the full electrification strategy, the infrastructural takeaway remains: improving the condition of the road reduces the traction energy required regardless of the energy source. The electric fleet, however, transfers additional requirements to the charging and network infrastructure and its protection [18,22]. Quality management of quarry roads is therefore a technology-neutral measure, potentially increasing the efficiency of both transitional Diesel–LNG and future electric transport systems.

5.5. Limitations and Transferability of Results

The study concerns one 140-t truck at one industrial site over one August campaign; numerical coefficients should not be generalized without external validation. Statistical replication is based on cycles, matched pairs and segments; the additional shift-cluster analysis addresses one dependence structure but not all temporal or operator effects.
Methane, NOx, CO, HC and upstream emissions were not directly measured, so the environmental result is limited to estimated combustion-stage CO2. Temperature and wind were recorded and included in a post hoc sensitivity analysis; relative humidity was unavailable. Operators matched within all 30 fuel-mode pairs, but surface-state and tire-condition labels did not match in every pair, and tire-pressure units were unspecified. These restrictions preclude claims of complete weather, tire or driver control, year-round performance, or randomized fuel-mode effects.
The fifth limitation relates to infrastructure indicators. Rolling resistance was determined by a coast-down/tractive-effort evaluation algorithm rather than independent traction dynamometering; H E P uses a fixed reference energy field of the analytical loop. Therefore, H E P is an object-dependent secondary comparative index, and not a direct measurement of the mechanical losses of the roadway. Future verification should include multiple machines and seasons, direct CH4/NOx measurements, an independent instrumental assessment of rolling resistance, a pre-specified and published shaping algorithm for E r e f , and a multi-level cycle–machine–segment–operator model. A promising continuation is a prospective road repair intervention with a pre-specified matched or crossover protocol, allowing the transition from an observational load-mediated interpretation to a more rigorous causal assessment.

6. Conclusions

Based on a full-scale experiment at the Ekibastuz coal mine, an infrastructure-oriented scheme for evaluating a dual-fuel mining dump truck was developed and implemented, combining 180 complete DOM/DGB cycles, 24 fixed road segments, 5000 synchronized telemetry samples, 36 local defective events and 30 matched DOM–DGB pairs. This design allows the road condition to be considered as a measurable element of the energy loop, while separating the directly measured ECM and fuel flow parameters from the estimated rolling resistance and the secondary H E P relative to the reference state.
For 92 DGB cycles, the average measured S R was 30.61%. In the 30 DOM–DGB pairs matched, the average diesel consumption decreased from 34.00 to 23.76 L/cycle; the observed savings were 10.24 L/cycle (95% CI 9.53–10.95) and diesel displacement was 29.96% (95% CI 28.55–31.37). The estimated CO2 emissions at the combustion stage decreased by an average of 7.10%.
In the matched field comparison, switching to DGB was not associated with a statistically significant difference in cycle time, total fuel chemical energy, SECE, or average engine load (p = 0.449, 0.391, 0.377, and 0.914, respectively). Thus, the observed reductions in diesel use and estimated combustion-stage CO2 occurred without a detectable systematic energy or time penalty in the 30 matched pairs. This observational result should be confirmed in a randomized or prospective crossover design.
The principal finding is that greater gas substitution and better transport energy performance are distinct outcomes. Across Good-to-Poor road classes, mean engine load increased from 66.11% to 74.40% and measured S R from 28.97% to 32.31%, while S E C E increased from 5.91 to 6.72 MJ/(t·km) and loaded speed fell from 14.69 to 11.69 km/h. The load–substitution association persisted after temperature and wind adjustment and shift-clustered inference. These findings support evaluating substitution together with total fuel energy and transport performance. H E P remains a secondary reference-dependent descriptor, and the unreconciled telemetry is not used as confirmatory evidence.
Operationally, road-maintenance screening should combine repeated segment-level HEP with independent rolling-resistance, roughness, speed-loss, and dynamic-response measurements; no validated composite maintenance score or intervention threshold was derived in this study. Accordingly, these indicators identify candidate segments for engineering inspection rather than prescribing repair. DGB control should likewise be evaluated against SECE and cycle time, not substitution ratio alone. A full climate assessment requires direct measurement of methane slip and inclusion of upstream LNG-chain emissions; without these, the environmental result remains limited to estimated combustion-stage CO2.

Author Contributions

Conceptualization, A.Y.U. and A.T.S.; methodology, A.Y.U., A.T.S., I.N.S., B.V.M. and N.V.M.; investigation, A.Y.U., A.T.S., I.N.S. and A.B.O.; data curation, A.Y.U. and I.N.S.; formal analysis, A.Y.U., A.T.S. and N.V.M.; validation, A.B.O., B.V.M. and N.V.M.; visualization, A.Y.U.; writing—original draft preparation, A.Y.U., A.T.S., B.V.M. and N.V.M.; writing—review and editing, all authors. All authors have read and agreed to the published version of the manuscript.

Funding

This research was funded by the Science Committee of the Ministry of Science and Higher Education of the Republic of Kazakhstan, Project IRN AP23489685, “Development of a digital method for monitoring defects and characteristics of intra-quarry technological roads during open-pit mining of mineral deposits”.

Data Availability Statement

De-identified cycle-level, road-segment and matched-pair data supporting the reported statistics are available from the corresponding author upon reasonable request and subject to permission from the operator of the Ekibastuz open-pit coal mine. Raw high-frequency production telemetry is not publicly available because it contains operationally sensitive mine information.

Acknowledgments

The authors thank the operational support teams, dispatch personnel and maintenance specialists responsible for extracting and maintaining the ECM and haul-road monitoring datasets used in this field study.

Conflicts of Interest

The authors declare no conflicts of interest.

Abbreviations

DGB, dynamic gas blending; DOM, diesel-only mode; ECM, engine control module; GPS/GNSS, Global Positioning System/Global Navigation Satellite System; H E P , reference-state haul-road energy penalty; IMU, inertial measurement unit; LNG, liquefied natural gas; LHV, lower heating value; S E C E , specific fuel-energy consumption; S R , substitution ratio.

References

  1. Norgate, T.; Haque, N. Energy and greenhouse gas impacts of mining and mineral processing operations. J. Clean. Prod. 2010, 18, 266–274. [Google Scholar] [CrossRef] [Scilit]
  2. Levesque, M.; Millar, D.; Paraszczak, J. Energy and mining—The home truths. J. Clean. Prod. 2014, 84, 233–255. [Google Scholar] [CrossRef] [Scilit]
  3. Jeswiet, J.; Archibald, J.; Thorley, U.; De Souza, E. Energy Use in Premanufacture (Mining). Procedia CIRP 2015, 29, 816–821. [Google Scholar] [CrossRef] [Scilit]
  4. Jeswiet, J.; Szekeres, A. Energy Consumption in Mining Comminution. Procedia CIRP 2016, 48, 140–145. [Google Scholar] [CrossRef] [Scilit]
  5. Katta, A.K.; Davis, M.; Kumar, A. Development of disaggregated energy use and greenhouse gas emission footprints in Canada’s iron, gold, and potash mining sectors. Resour. Conserv. Recycl. 2020, 152, 104485. [Google Scholar] [CrossRef] [Scilit]
  6. Amegboleza, A.A.; Ülkü, M.A. Sustainable Energy Transition for the Mining Industry: A Bibliometric Analysis of Trends and Emerging Research Pathways. Sustainability 2025, 17, 2292. [Google Scholar] [CrossRef] [Scilit]
  7. Mesa, J.A.; Hincapie-Florez, D.; Bobadilla-Vasquez, M.; Corredor, L.; Pupo-Roncallo, O.; Gonzalez-Quiroga, A. Assessing technological trends in mining fleet energy management toward sustainable mineral extraction. Resour. Policy 2025, 109, 105714. [Google Scholar] [CrossRef] [Scilit]
  8. Pryalukhin, A.F.; Malozyomov, B.V.; Martyushev, N.V.; Daus, Y.V.; Konyukhov, V.Y.; Oparina, T.A.; Dubrovin, R.G. Simulation Modeling of Energy Efficiency of Electric Dump Truck Use Depending on the Operating Cycle. World Electr. Veh. J. 2025, 16, 217. [Google Scholar] [CrossRef] [Scilit]
  9. Sahoo, L.K.; Bandyopadhyay, S.; Banerjee, R. Benchmarking energy consumption for dump trucks in mines. Appl. Energy 2014, 113, 1382–1396. [Google Scholar] [CrossRef] [Scilit]
  10. Siami-Irdemoosa, E.; Dindarloo, S.R. Prediction of fuel consumption of mining dump trucks: A neural networks approach. Appl. Energy 2015, 151, 77–84. [Google Scholar] [CrossRef] [Scilit]
  11. Dindarloo, S.R.; Siami-Irdemoosa, E. Determinants of fuel consumption in mining trucks. Energy 2016, 112, 232–240. [Google Scholar] [CrossRef] [Scilit]
  12. Soofastaei, A.; Aminossadati, S.M.; Arefi, M.M.; Kizil, M.S. Development of a multi-layer perceptron artificial neural network model to determine haul trucks energy consumption. Int. J. Min. Sci. Technol. 2016, 26, 285–293. [Google Scholar] [CrossRef] [Scilit]
  13. Soofastaei, A.; Aminossadati, S.M.; Kizil, M.S.; Knights, P. A comprehensive investigation of loading variance influence on fuel consumption and gas emissions in mine haulage operation. Int. J. Min. Sci. Technol. 2016, 26, 995–1001. [Google Scholar] [CrossRef] [Scilit]
  14. Wang, Q.; Zhang, R.; Lv, S.; Wang, Y. Open-pit mine truck fuel consumption pattern and application based on multi-dimensional features and XGBoost. Sustain. Energy Technol. Assess. 2021, 43, 100977. [Google Scholar] [CrossRef] [Scilit]
  15. Alamdari, S.; Basiri, M.H.; Mousavi, A.; Soofastaei, A. Application of Machine Learning Techniques to Predict Haul Truck Fuel Consumption in Open-Pit Mines. J. Min. Environ. 2022, 13, 69–85. [Google Scholar] [CrossRef]
  16. Tadubana, G.K.; Sigweni, B.; Ayoung, D.A. Systematic Review on Prediction of Haulage Truck Fuel Consumption in Open-Pit Mines. Int. J. Min. Reclam. Environ. 2024, 38, 833–850. [Google Scholar] [CrossRef] [Scilit]
  17. Tokac, B.; Zhang, Q.; Sari, Y.A. Environmental and economic comparison of diesel and electric trucks in open-pit mining operations. J. Clean. Prod. 2025, 507, 145540. [Google Scholar] [CrossRef] [Scilit]
  18. Khekert, E.V.; Malozyomov, B.V.; Klyuev, R.V.; Martyushev, N.V.; Konyukhov, V.Y.; Kukartsev, V.V.; Antamoshkin, O.A.; Remezov, I.S. Battery Charging Simulation of a Passenger Electric Vehicle from a Traction Voltage Inverter with an Integrated Charger. World Electr. Veh. J. 2025, 16, 391. [Google Scholar] [CrossRef] [Scilit]
  19. Gunawan, T.A.; Monaghan, R.F.D. Techno-econo-environmental comparisons of zero- and low-emission heavy-duty trucks. Appl. Energy 2022, 308, 118327. [Google Scholar] [CrossRef] [Scilit]
  20. Aryanpur, V.; Rogan, F. Decarbonising road freight transport: The role of zero-emission trucks and intangible costs. Sci. Rep. 2024, 14, 2113. [Google Scholar] [CrossRef] [Scilit] [PubMed]
  21. Prussi, M.; Laveneziana, L.; Testa, L.; Chiaramonti, D. Comparing e-Fuels and Electrification for Decarbonization of Heavy-Duty Transports. Energies 2022, 15, 8075. [Google Scholar] [CrossRef] [Scilit]
  22. Malozyomov, B.V.; Khekert, E.V.; Martyushev, N.V.; Konyukhov, V.Y.; Chetverikova, V.V.; Golik, V.I.; Tynchenko, V.S. Improving the Reliability of the Protection of Electric Transport Networks. World Electr. Veh. J. 2025, 16, 477. [Google Scholar] [CrossRef] [Scilit]
  23. Engerer, H.; Horn, M. Natural gas vehicles: An option for Europe. Energy Policy 2010, 38, 1017–1029. [Google Scholar] [CrossRef] [Scilit]
  24. Osorio-Tejada, J.L.; Llera-Sastresa, E.; Scarpellini, S. Liquefied natural gas: Could it be a reliable option for road freight transport in the EU? Renew. Sustain. Energy Rev. 2017, 71, 785–795. [Google Scholar] [CrossRef] [Scilit]
  25. Pfoser, S.; Schauer, O.; Costa, Y. Acceptance of LNG as an alternative fuel: Determinants and policy implications. Energy Policy 2018, 120, 259–267. [Google Scholar] [CrossRef] [Scilit]
  26. Kumar, S.; Kwon, H.-T.; Choi, K.-H.; Lim, W.; Cho, J.H.; Tak, K.; Moon, I. LNG: An eco-friendly cryogenic fuel for sustainable development. Appl. Energy 2011, 88, 4264–4273. [Google Scholar] [CrossRef] [Scilit]
  27. Patterson, S.R.; Kozan, E.; Hyland, P. Energy efficient scheduling of open-pit coal mine trucks. Eur. J. Oper. Res. 2017, 262, 759–770. [Google Scholar] [CrossRef] [Scilit]
  28. Yao, J.; Wang, Z.; Chen, H.; Hou, W.; Zhang, X.; Li, X.; Yuan, W. Open-Pit Mine Truck Dispatching System Based on Dynamic Ore Blending Decisions. Sustainability 2023, 15, 3399. [Google Scholar] [CrossRef] [Scilit]
  29. Smajla, I.; Karasalihović Sedlar, D.; Drljača, B.; Jukić, L. Fuel Switch to LNG in Heavy Truck Traffic. Energies 2019, 12, 515. [Google Scholar] [CrossRef] [Scilit]
  30. Wei, L.; Geng, P. A review on natural gas/diesel dual fuel combustion, emissions and performance. Fuel Process. Technol. 2016, 142, 264–278. [Google Scholar] [CrossRef] [Scilit]
  31. Karim, G.A. Combustion in Gas Fueled Compression Ignition Engines of the Dual Fuel Type. J. Eng. Gas Turbines Power 2003, 125, 827–836. [Google Scholar] [CrossRef] [Scilit]
  32. Papagiannakis, R.G.; Hountalas, D.T. Combustion and exhaust emission characteristics of a dual fuel compression ignition engine operated with pilot diesel fuel and natural gas. Energy Convers. Manag. 2004, 45, 2971–2987. [Google Scholar] [CrossRef] [Scilit]
  33. Lounici, M.S.; Loubar, K.; Tarabet, L.; Balistrou, M.; Niculescu, D.-C.; Tazerout, M. Towards Improvement of Natural Gas–Diesel Dual Fuel Mode: An Experimental Investigation on Performance and Exhaust Emissions. Energy 2014, 64, 200–211. [Google Scholar] [CrossRef] [Scilit]
  34. Yousefi, A.; Birouk, M.; Lawler, B.; Gharehghani, A. Performance and emissions of a dual-fuel pilot diesel ignition engine operating on various premixed fuels. Energy Convers. Manag. 2015, 106, 322–336. [Google Scholar] [CrossRef] [Scilit]
  35. Yousefi, A.; Guo, H.; Birouk, M. Effect of swirl ratio on NG/diesel dual-fuel combustion at low to high engine load conditions. Appl. Energy 2018, 229, 375–388. [Google Scholar] [CrossRef] [Scilit]
  36. Malozyomov, B.V.; Martyushev, N.V.; Sorokova, S.N.; Efremenkov, E.A.; Valuev, D.V.; Qi, M. Mathematical Modelling of Traction Equipment Parameters of Electric Cargo Trucks. Mathematics 2024, 12, 577. [Google Scholar] [CrossRef] [Scilit]
  37. Stettler, M.E.J.; Midgley, W.J.B.; Swanson, J.J.; Cebon, D.; Boies, A.M. Greenhouse Gas and Noxious Emissions from Dual Fuel Diesel and Natural Gas Heavy Goods Vehicles. Environ. Sci. Technol. 2016, 50, 2018–2026. [Google Scholar] [CrossRef] [Scilit] [PubMed]
  38. Camuzeaux, J.R.; Alvarez, R.A.; Brooks, S.A.; Browne, J.B.; Sterner, T. Influence of Methane Emissions and Vehicle Efficiency on the Climate Implications of Heavy-Duty Natural Gas Trucks. Environ. Sci. Technol. 2015, 49, 6402–6410. [Google Scholar] [CrossRef] [Scilit] [PubMed]
  39. Coffey, J.; Nikraz, H.; Leek, C. Haul road rolling resistance and pavement condition. Aust. J. Civ. Eng. 2018, 16, 12–22. [Google Scholar] [CrossRef] [Scilit]
  40. Richardson, S.; McIver, J. Improving Mine Haul Road Roughness to Reduce Haul Truck Fuel Consumption; SAE Technical Paper 2015-01-0050; SAE International: Warrendale, PA, USA, 2015. [Google Scholar] [CrossRef] [Scilit]
  41. Hasan, H.; Octariando, R. The Effect of Road Grade on Dump Truck Fuel Consumption; SAE Technical Paper 2022-01-5030; SAE International: Warrendale, PA, USA, 2022. [Google Scholar] [CrossRef] [Scilit]
  42. Luan, B.; Zhou, W.; Ao, Z.; Han, Z.; Xiao, Y. Fuel-Efficient Road Classification Methodology for Sustainable Open Pit Mining. Appl. Sci. 2025, 15, 6309. [Google Scholar] [CrossRef] [Scilit]
  43. Utegenova, A.; Sładkowski, A.; Shakenov, A.; Stolpovskih, I. Methods and applications of digital monitoring for mine haul road assessment. Geomech. Geophys. Geo-Energy Geo-Resour. 2026, 12, 108. [Google Scholar] [CrossRef] [Scilit]
  44. Shishkin, P.V.; Malozyomov, B.V.; Martyushev, N.V.; Sorokova, S.N.; Efremenkov, E.A.; Valuev, D.V.; Qi, M. Mathematical Logic Model for Analysing the Controllability of Mining Equipment. Mathematics 2024, 12, 1660. [Google Scholar] [CrossRef] [Scilit]
  45. Galiyev, S.; Galiyev, D.; Uteshov, Y.; Shabelnikov, Y.; Makhonin, V.; Maldynova, A.; Tekenova, A.; Axanaliyev, N. Enhancing Energy and Operational Efficiency of Geotechnological Complexes Using Geoinformation Technologies. Emerg. Sci. J. 2025, 9, 1372–1387. [Google Scholar] [CrossRef] [Scilit]
  46. Bodziony, P.; Krysa, Z.; Patyk, M. Operational Environment Effects on Energy Consumption and Reliability in Mine Truck Haulage. Energies 2025, 18, 3022. [Google Scholar] [CrossRef] [Scilit]
  47. Bodziony, P.; Patyk, M. The Influence of the Mining Operation Environment on the Energy Consumption and Technical Availability of Truck Haulage Operations in Surface Mines. Energies 2024, 17, 2654. [Google Scholar] [CrossRef] [Scilit]
  48. Martyushev, N.V.; Malozyomov, B.V.; Gladkikh, V.A.; Demin, A.Y.; Pogrebnoy, A.V.; Kuleshova, E.E.; Karlina, Y.I. Adaptive Iterative Algorithm for Optimizing the Load Profile of Charging Stations with Restrictions on the State of Charge of the Battery of Mining Dump Trucks. Mathematics 2025, 13, 3964. [Google Scholar] [CrossRef] [Scilit]
  49. Vera-Burau, A.; Álvarez-Ramírez, D.; Sanmiquel, L.; Bascompta, M. A Comparison of the Fuel Consumption and Truck Models in Different Production Scenarios. Appl. Sci. 2023, 13, 5769. [Google Scholar] [CrossRef] [Scilit]
  50. Lv, S.; Zhang, R.; Wang, Y.; Tao, Y.; Li, J. Intelligent fuel consumption monitoring and optimization of open-pit dump trucks: A case study of Pingshuo East open-pit mine. Energy Sustain. Dev. 2026, 92, 101965. [Google Scholar] [CrossRef] [Scilit]
  51. Cotrina-Teatino, M.A.; Marquina-Araujo, J.J.; Arango-Retamozo, S.M.; Rios-LLaure, L.A.; Mamani-Quispe, J.N.; Ortiz-Quintanilla, S. Sustainable Optimization of Fuel Consumption and CO2 Emissions in Mining Haul Trucks using Machine Learning: A Case Study in a Gold Mine in La Libertad, Peru. J. Min. Environ. 2026, 17, 105–126. [Google Scholar] [CrossRef]
  52. Yan, Q.; Chen, X.; Jian, H.; Wei, W.; Wang, W.; Wang, H. Design of a deep inference framework for required power forecasting and predictive control on a hybrid electric mining truck. Energy 2022, 238, 121960. [Google Scholar] [CrossRef] [Scilit]
  53. Shakenov, A.T.; Utegenova, A.Y.; Stolpovskikh, I.N.; Orumbassarova, A.B.; Malozyomov, B.V.; Martyushev, N.V. Field-Validated Multisensor Assessment of Haul-Road Degradation and Its Association with Fuel-Use Proxy Burden, Dynamic Response, and Transport-Cycle Stability in Open-Pit Mining. Mining 2026, 6, 49. [Google Scholar] [CrossRef] [Scilit]
  54. Shakenov, A.T.; Utegenova, A.Y.; Stolpovskikh, I.N.; Orumbassarova, A.B.; Malozyomov, B.V.; Martyushev, N.V. Quasi-Experimental Field Assessment of Haul-Road Maintenance Effects on Fuel Consumption, Cycle Time and Mechanical Loading of Open-Pit Dump Trucks. Appl. Sci. 2026, 16, 7773. [Google Scholar] [CrossRef] [Scilit]
  55. Sütheö, G.; Háry, A. Comparison of Carbon-Dioxide Emissions of Diesel and LNG Heavy-Duty Trucks in Test Track Environment. Clean Technol. 2024, 6, 1465–1479. [Google Scholar] [CrossRef] [Scilit]
  56. Baráth, B.; Jagicza, M.; Sütheö, G.; Tóth, G.L. Examination of the Load’s Effect on Fuel Consumption and CO2 Emissions, in the Case of a Diesel and LNG Powered Tractor. Eng. Proc. 2024, 79, 17. [Google Scholar] [CrossRef] [Scilit]
  57. Quiros, D.C.; Smith, J.; Thiruvengadam, A.; Huai, T.; Hu, S. Greenhouse gas emissions from heavy-duty natural gas, hybrid, and conventional diesel on-road trucks during freight transport. Atmos. Environ. 2017, 168, 36–45. [Google Scholar] [CrossRef] [Scilit]
  58. Arteconi, A.; Brandoni, C.; Evangelista, D.; Polonara, F. Life-cycle greenhouse gas analysis of LNG as a heavy vehicle fuel in Europe. Appl. Energy 2010, 87, 2005–2013. [Google Scholar] [CrossRef] [Scilit]
  59. Speirs, J.; Balcombe, P.; Blomerus, P.; Stettler, M.; Achurra-Gonzalez, P.; Woo, M.; Ainalis, D.; Cooper, J.; Sharafian, A.; Merida, W.; et al. Natural Gas Fuel and Greenhouse Gas Emissions in Trucks and Ships. Prog. Energy 2020, 2, 012002. [Google Scholar] [CrossRef] [Scilit]
  60. Howarth, R.W. The greenhouse gas footprint of liquefied natural gas (LNG) exported from the United States. Energy Sci. Eng. 2024, 12, 4843–4859. [Google Scholar] [CrossRef] [Scilit]
  61. Shishkin, P.V.; Malozyomov, B.V.; Martyushev, N.V.; Kondratiev, V.V.; Dorofeev, E.M.; Kononenko, R.V.; Vit’kina, G.Y. Optimization of Energy Balance and Powertrain for Electric Mining Dump Trucks in Coal Mine Reclamation Operations. World Electr. Veh. J. 2025, 16, 601. [Google Scholar] [CrossRef] [Scilit]
  62. Martyushev, N.V.; Malozyomov, B.V.; Kukartsev, V.V.; Govorkov, A.S.; Stupina, A.A.; Kononenko, R.V.; Tynchenko, Y.A.; Kozenkova, G.L. Duty Cycle-Based Optimization of the Usable Energy Buffer Ratio in a Battery–Supercapacitor HESS for Mining Electric Dump Trucks. World Electr. Veh. J. 2026, 17, 355. [Google Scholar] [CrossRef] [Scilit]
  63. Zarrinkolah, M.T.; Hosseini, V. Methane Slip Reduction of Conventional Dual-Fuel Natural Gas Diesel Engine Using Direct Fuel Injection Management and Alternative Combustion Modes. Fuel 2023, 331, 125775. [Google Scholar] [CrossRef] [Scilit]
  64. Gnap, J.; Dočkalik, M. Impact of the Operation of LNG Trucks on the Environment. Open Eng. 2021, 11, 937–947. [Google Scholar] [CrossRef] [Scilit]
  65. Giuliano, G.; Dessouky, M.; Dexter, S.; Fang, J.; Hu, S.; Miller, M. Heavy-duty trucks: The challenge of getting to zero. Transp. Res. Part D Transp. Environ. 2021, 93, 102742. [Google Scholar] [CrossRef] [Scilit]
  66. Zhao, Q.; Huang, W.; Hu, M.; Xu, X.; Wu, W. Characterizing the Economic and Environmental Benefits of LNG Heavy-Duty Trucks: A Case Study in Shenzhen, China. Sustainability 2021, 13, 13522. [Google Scholar] [CrossRef] [Scilit]
  67. Giechaskiel, B.; Lähde, T.; Schwelberger, M.; Kleinbach, T.; Roske, H.; Teti, E.; van den Bos, T.; Neils, P.; Delacroix, C.; Jakobsson, T.; et al. Particle Number Measurements Directly from the Tailpipe for Type Approval of Heavy-Duty Engines. Appl. Sci. 2019, 9, 4418. [Google Scholar] [CrossRef] [Scilit]
Figure 1. Integrated infrastructure-aware assessment framework for field evaluation of a 140-t Diesel–LNG haul truck.
Energies 19 04394 g001
Figure 2. Field route and measured vehicle response: (a) schematic representation of the monitored haul-road route from the loading point to the dumping point, where the magenta line indicates the vehicle trajectory, the large red dots denote the initial loading-area route points, and the small green dots indicate the subsequent recorded route points; the numerical labels identify the corresponding measurement points; (b) measured ground speed (km/h) versus time of day during a representative operating interval. Panel (b) illustrates a single operating interval and does not represent the speed distribution over the entire monitoring campaign.
Energies 19 04394 g002
Figure 3. Cycle-level temporal variability of DGB operation during the field campaign: (a) measured diesel-to-LNG substitution ratio; (b) average engine load; and (c) reference-state haul-road energy penalty (HEP). Points in panel (a) are classified by road condition.
Energies 19 04394 g003
Figure 4. Integrated experimental performance indicators linking dual-fuel operation with haul-road infrastructure conditions: (a) measured DGB substitution ratio versus average engine load; (b) reference-state HEP versus independently estimated rolling resistance; (c) reference-state HEP versus road roughness; and (d) observed diesel saving in matched DOM–DGB haul cycles stratified by road condition.
Energies 19 04394 g004
Figure 5. Matched DOM–DGB comparison for 30 field pairs: (a) diesel consumption; (b) combustion-stage CO2; (c) total fuel energy; and (d) specific fuel-energy consumption. Thin lines connect matched observations; summary markers show means with 95% confidence intervals.
Energies 19 04394 g005
Figure 6. Diagnostic telemetry record CYC-0032: (a) reported vehicle speed; (b) longitudinal grade; (c) engine load and ECM-reported substitution; and (d) diesel and LNG flow channels in their supplied units.
Energies 19 04394 g006
Figure 7. Associations in 36 recorded haul-road defect events: (a) peak vertical acceleration, in g, versus defect amplitude; and (b) dimensionless rank of the recorded structural–response peak versus defect amplitude. Ranks increase from 1 to 36; tied values receive average ranks. Symbols identify the supplied severity classes. The rank transformation preserves the Spearman correlation and does not imply calibrated stress or strain measurements.
Energies 19 04394 g007
Table 1. Positioning of this study in relation to the main areas of literature.
DirectionTypical Measurements/ModelsMain Constraint for the Current TaskWhat Has Been Added in This Work
Mining Dump Truck EnergyDiesel consumption, cargo weight, speed, slopeUsually one type of fuel is consideredActual DGB Substitution by Operating Mode
Monitoring of quarry roadsGeometry, roughness, rolling resistanceAs a rule, there is no connection with LNG substitutionSpatial Linking of Road Condition and ECM
Dual-fuel Diesel-NG/LNG systemsCombustion, emissions, load mapsOften bench or general road testsIndustrial Quarry Work Cycle
Low-carbon transportCO2/LCA, electrification, alternative fuelsLack of detail in road infrastructure H E P relative to the reference state + calculated CO2 emissions at the combustion stage
Table 2. Experimental platform and composition of controlled data.
BlockParametersPurpose in the Analysis
Dump truckCarrying capacity 140 t; DOM/DGB modesComparison of fuel modes
ECMDiesel/LNG consumption, engine load, rpm, torque, temperature, boost pressureDGB Power Mode and Response
NavigationGPS/GNSS, speed, position on the routeSynchronization with road segments
Inertial channelIMU, acceleration, slope responseDynamic Response
Career roadProfile, slope, local defects/irregularitiesInfrastructural energy load
Program and data volume30 shifts; 180 full cycles (88 DOM, 92 DGB); 24 segments; 5000 synchronized points; 36 defectsStatistical and spatio-temporal evidence base
Paired design30 DOM-DGB pairs; Mean absolute difference in cargo weight < 1%Paired comparison of fuel, energy, cycle time and CO2
Metrology16 channels; typical frequency 0.5 Hz; Documented accuracy and resolutionUncertainty and measurement quality control
Table 3. Geometric and operational features of the monitored section of the quarry road.
ParameterExperimental Significance/ObservationEnergy Value
Length of the plot1.5 kmDefines integral transport work
Elevation difference≈102 mForms a significant component of power associated with slope
Maximum Longitudinal Slope12%High traction requirement on loaded lifts
Zones of geometric disturbances10Local Dynamic and Energy Disturbances
Significant irregularities7; Amplitude 5–15 cmIncrease in dynamic losses and rolling resistance
Width Constraint≈95% of the routeLimiting the optimal speed profile
Insufficiently widened curves4 plotsAdditional speed reduction and maneuvering
Fixed segmentation24 segments × 62.5 mRegression Analysis of H E P , Rolling Resistance and Roughness
Table 4. Experimental indicators of 92 DGB cycles at different classes of the condition of the quarry road.
Road Condition n Engine Load, % Measured   S R , % H E P , % S E C E , MJ/(t·km)Cycle Time, minLoaded Speed, km/h
Good2566.1128.974.595.91121.7714.69
Fair4269.4830.5710.166.17723.5013.36
Poor2574.4032.3119.736.72425.6911.69
Kruskal–Wallis p<0.001<0.001<0.001<0.001<0.001<0.001
Table 5. Comparison of DOM and DGB operation across 30 matched field pairs.
IndicatorMean DOMMean DGBDGB−DOM95% CI DifferencePaired p
Payload, t131.59131.51−0.07[−0.49; 0.34]0.719
Cycle time, min23.1722.88−0.29[−1.08; 0.49]0.449
Diesel, L/cycle34.0023.76−10.24[−10.95; −9.53]<0.001
Total chemical energy of the fuel, MJ/cycle1212.331219.83+7.51[−10.11; 25.13]0.391
S E C E , MJ/(t·km)6.1396.179+0.040[−0.051; 0.132]0.377
Estimated CO2 emissions during combustion, kg/cycle89.7283.28−6.44[−7.72; −5.16]<0.001
Average engine load, %69.8469.75−0.10[−1.95; 1.76]0.914
Note: p-values are calculated by a paired t-test; The stability of the effect sign for diesel fuel savings and CO2 reduction is further confirmed by the Wilcoxon test for linked samples (p < 0.001).
Table 6. Robust regression models of DGB substitution ratio and infrastructure energy penalty.
Dependent VariablePredictorCoefficient95% CIp Model   R 2
Measured S R , %Average engine load, %0.361[0.263; 0.460]<0.0010.586
Measured S R , %Payload, t−0.047[−0.091; −0.003]0.0350.586
Measured S R , %Road Condition Index−1.057[−4.304; 2.191]0.5240.586
H E P , %Rolling resistance, %18.47[11.96; 24.98]<0.0010.702
H E P , %Road roughness, m/km7.55[4.14; 10.97]<0.0010.625
Note: Cycle-level S R model additionally includes the idle rate and the average longitudinal slope of the loaded movement; standard errors are HC3-robust. Separate H E P segment models are given so as not to combine closely related rolling resistance and roughness in one small sample.
Disclaimer/Publisher’s Note: The statements, opinions and data contained in all publications are solely those of the individual author(s) and contributor(s) and not of MDPI and/or the editor(s). MDPI and/or the editor(s) disclaim responsibility for any injury to people or property resulting from any ideas, methods, instructions or products referred to in the content.