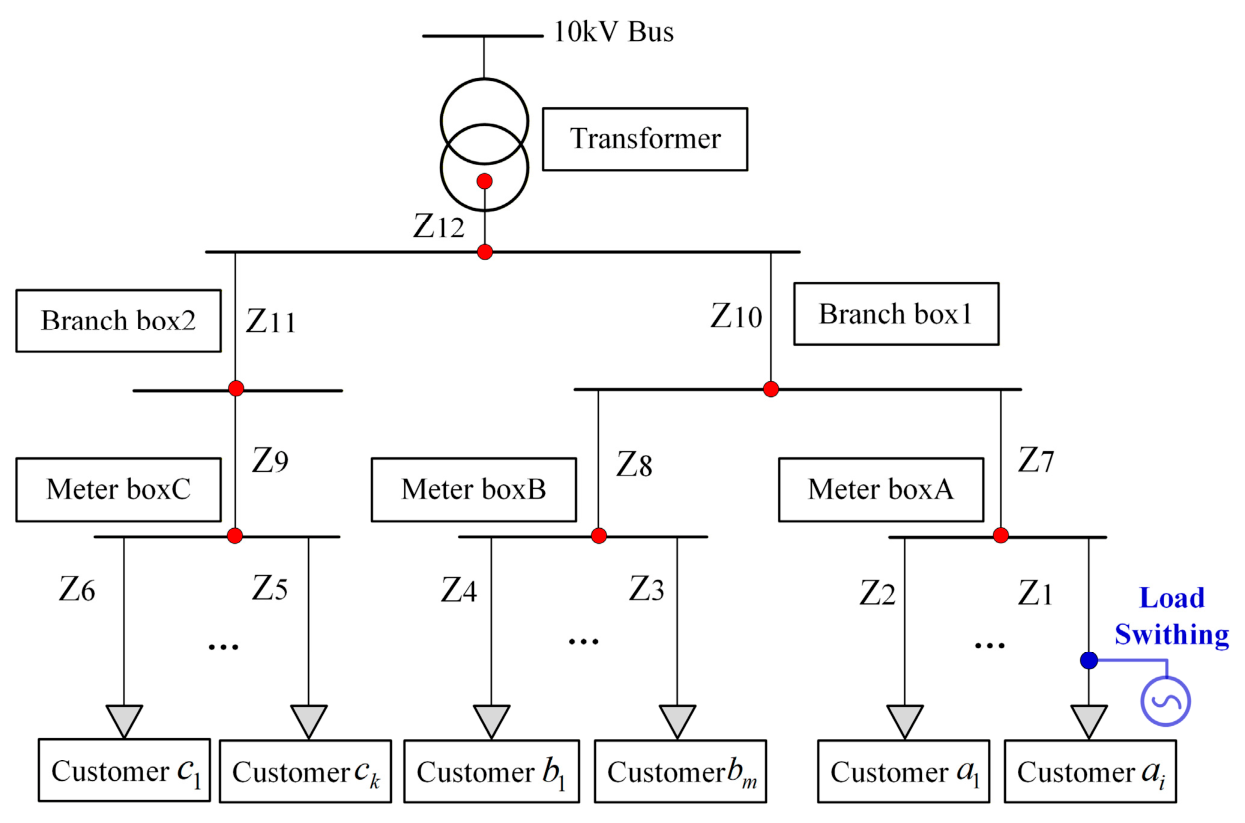
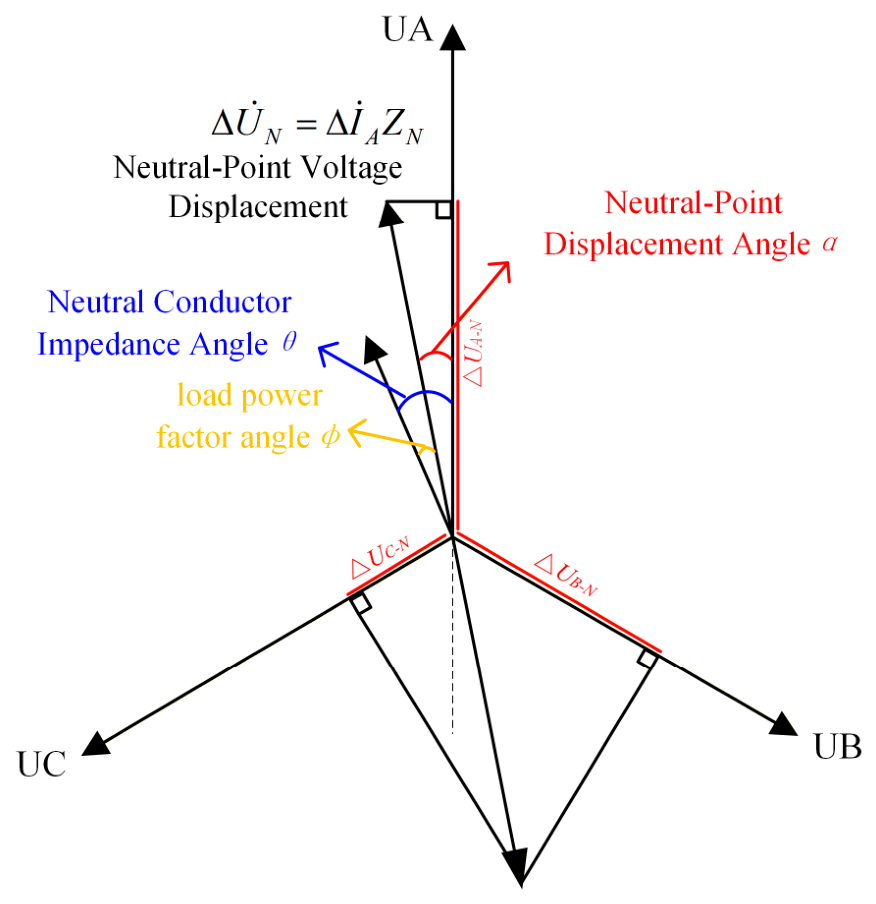
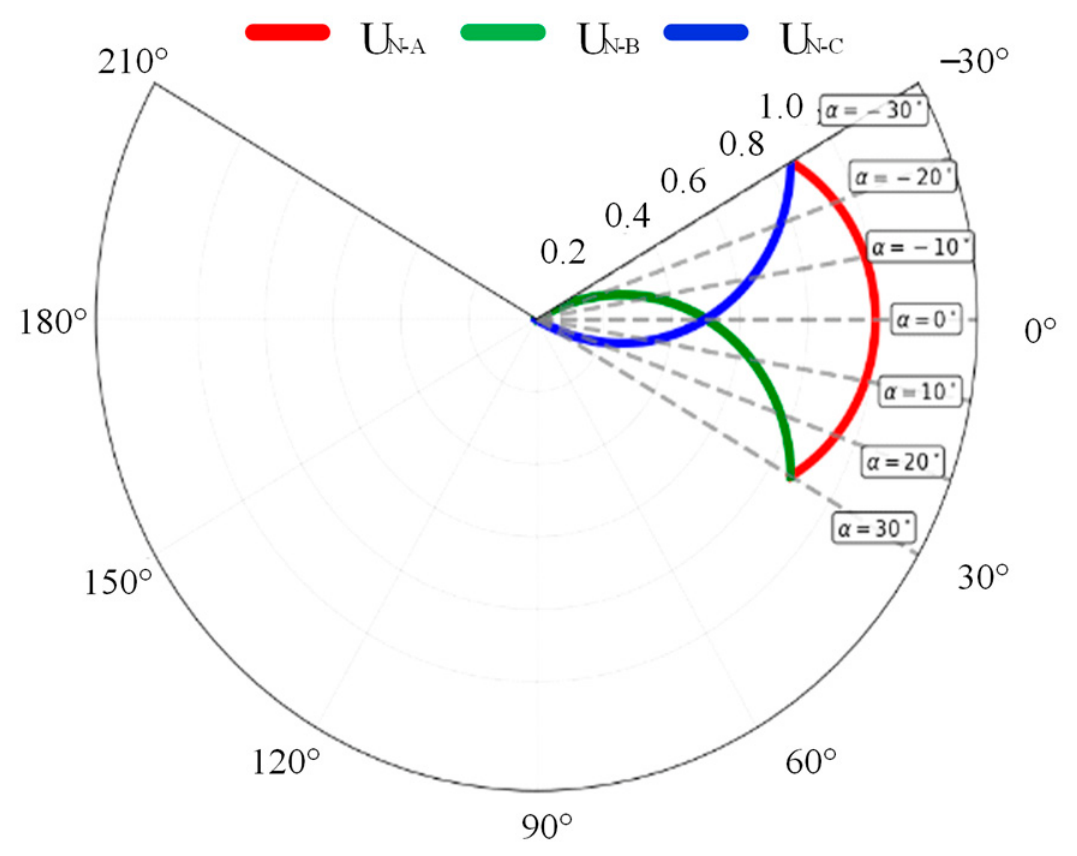
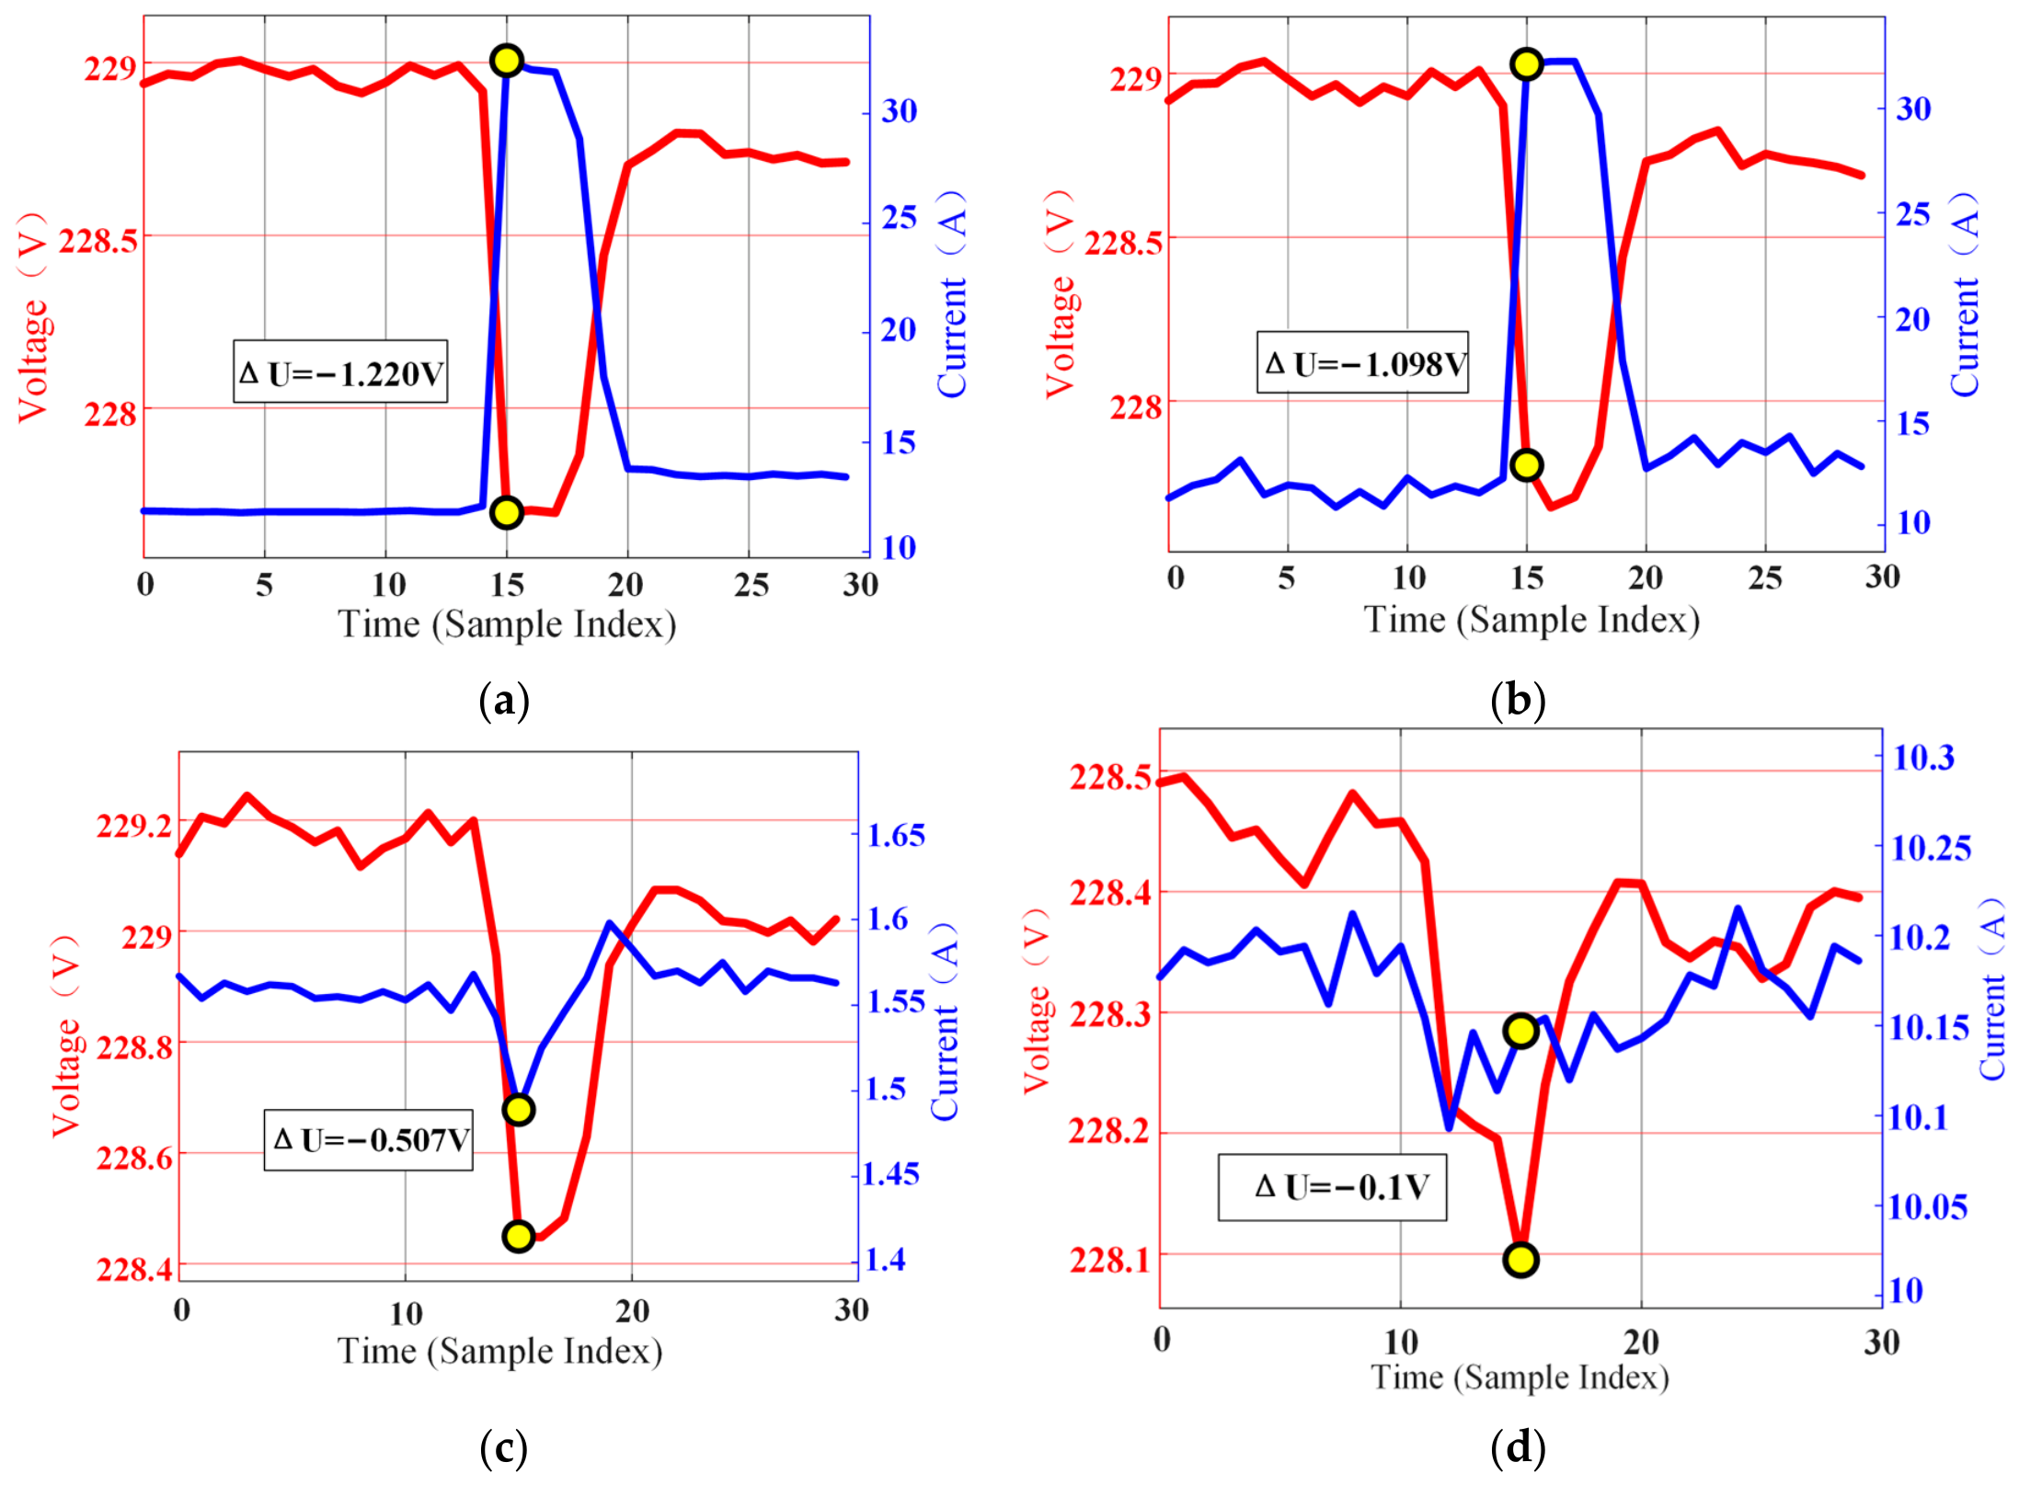
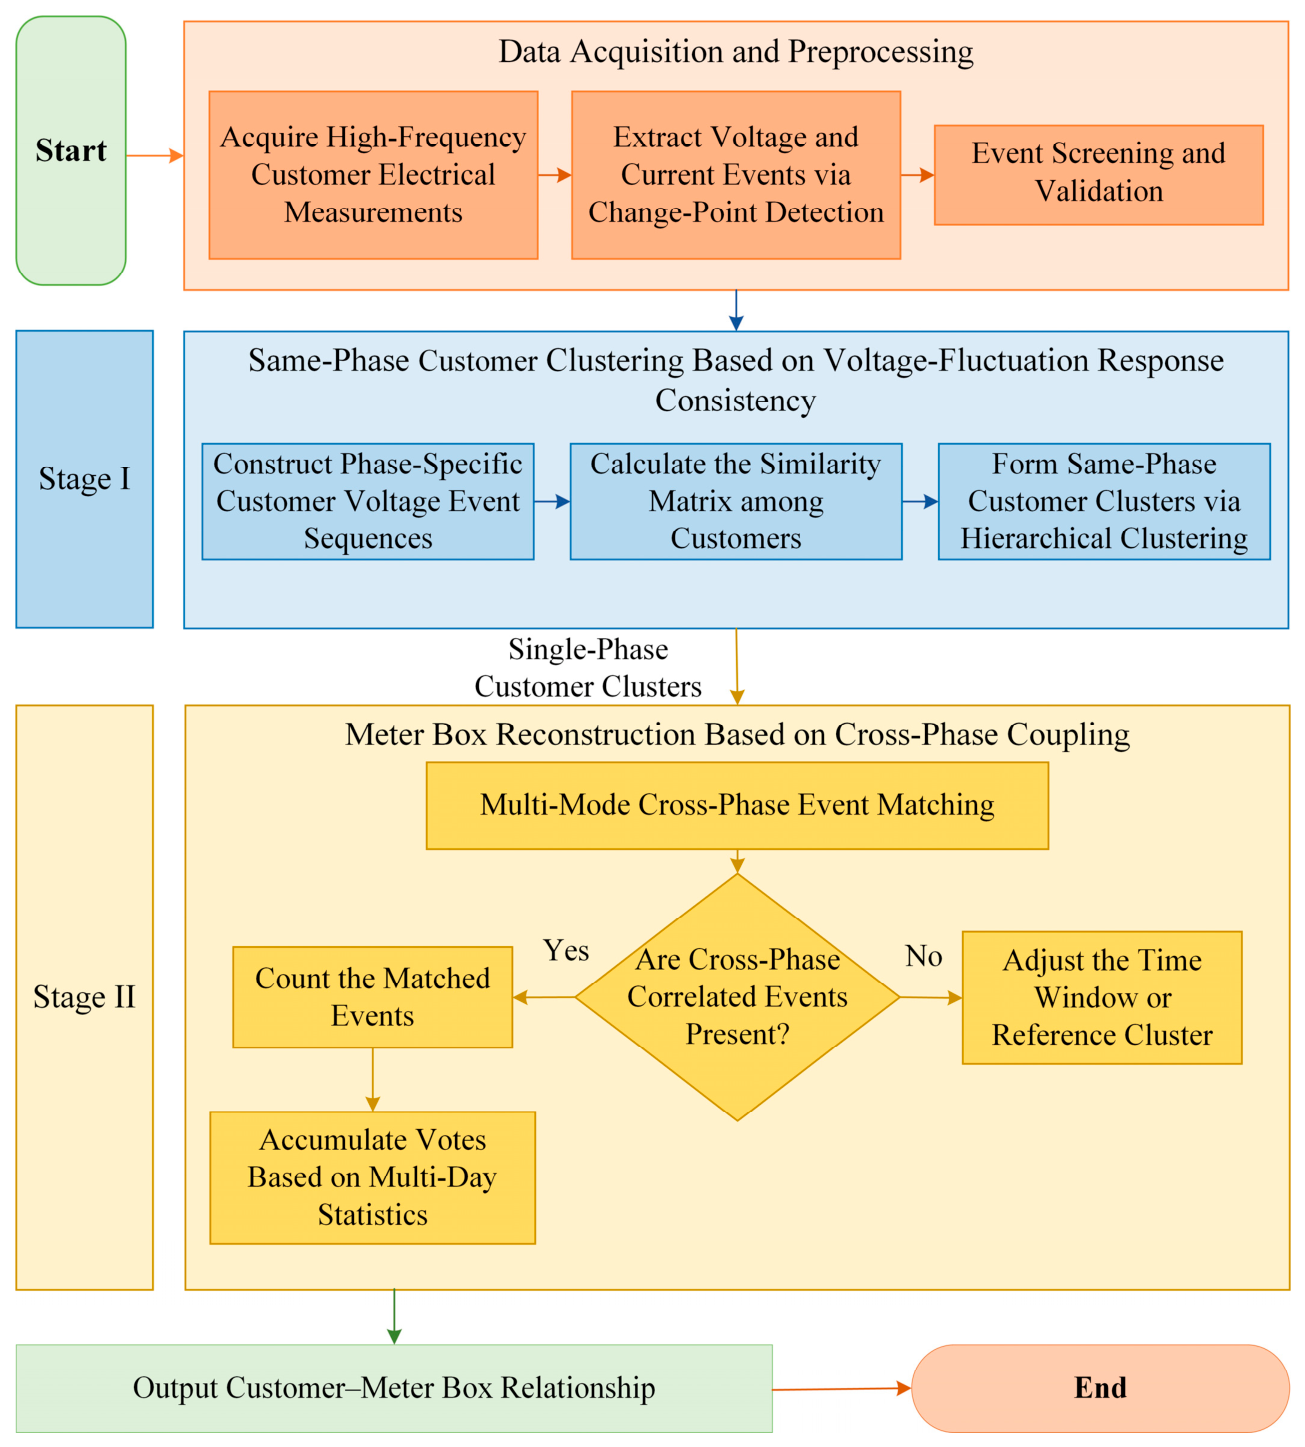
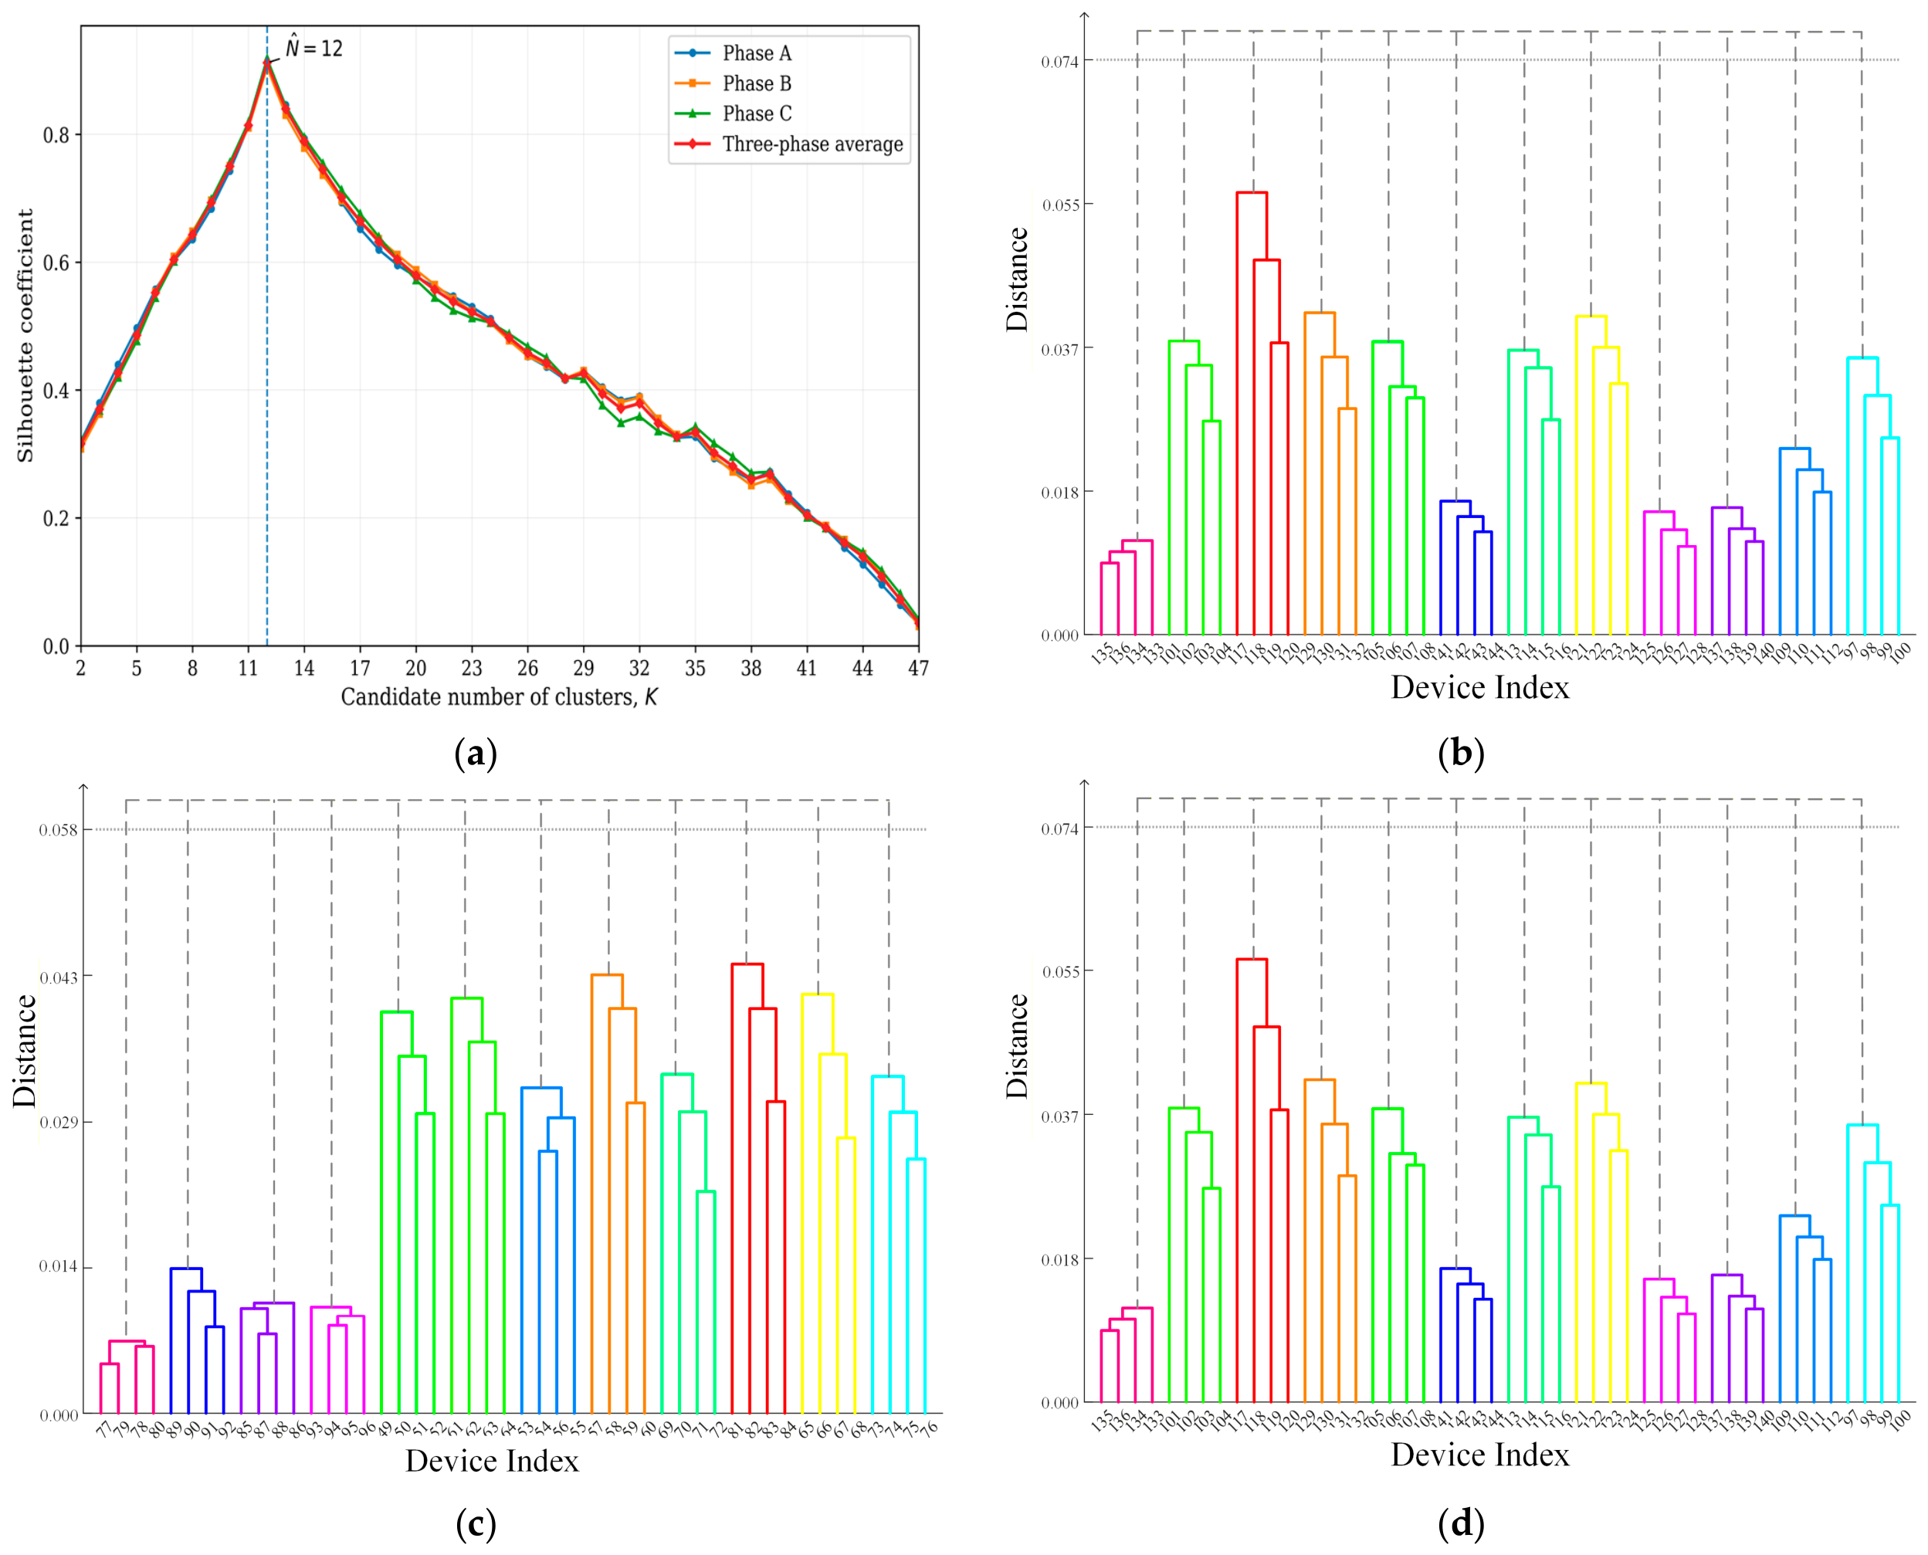
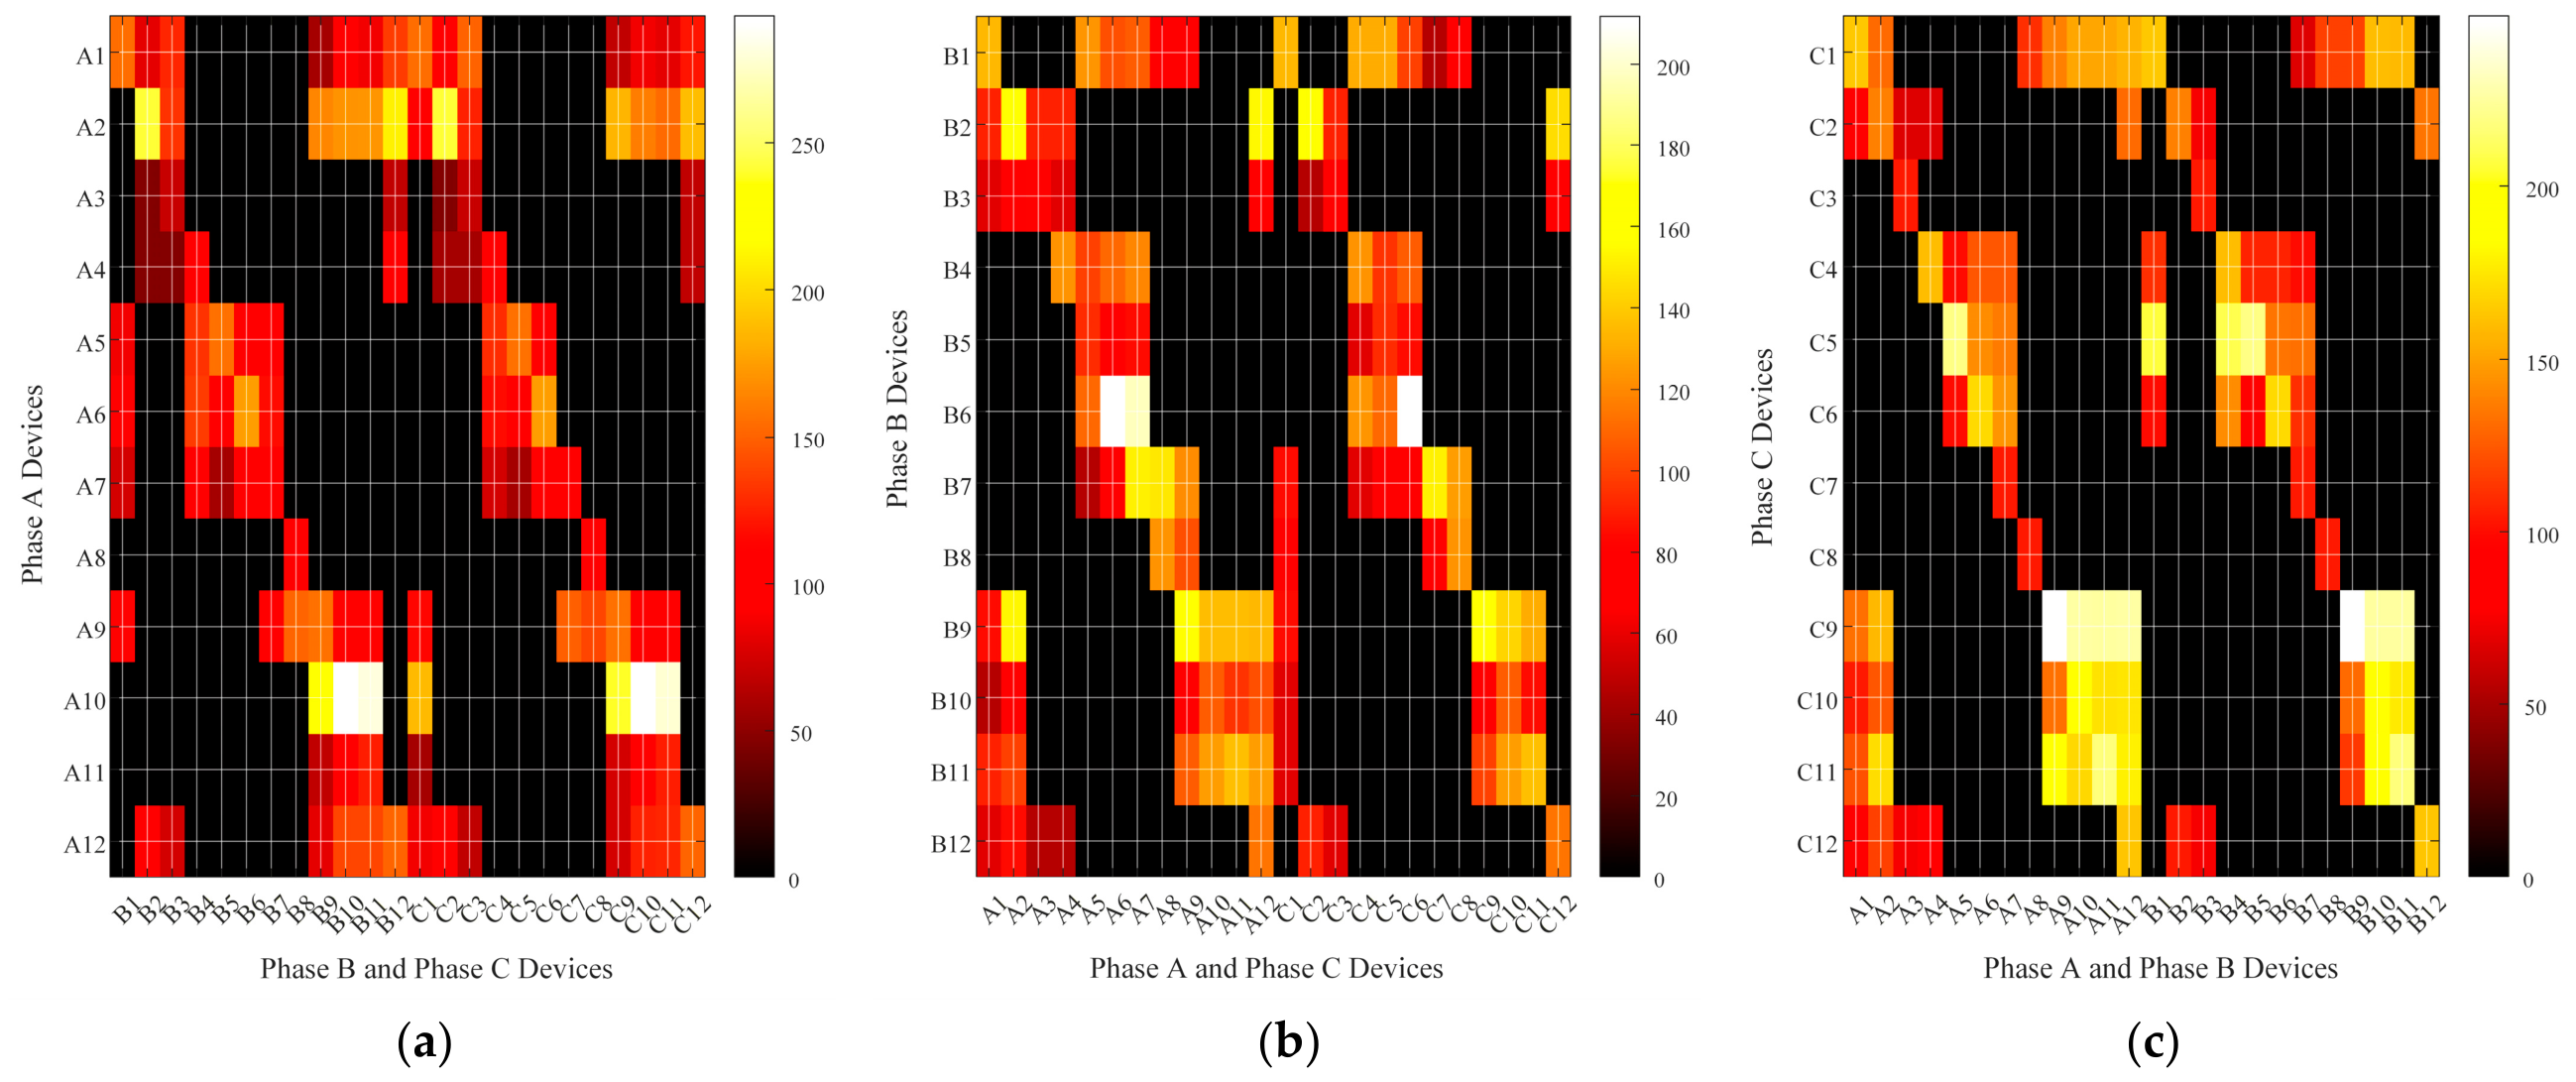
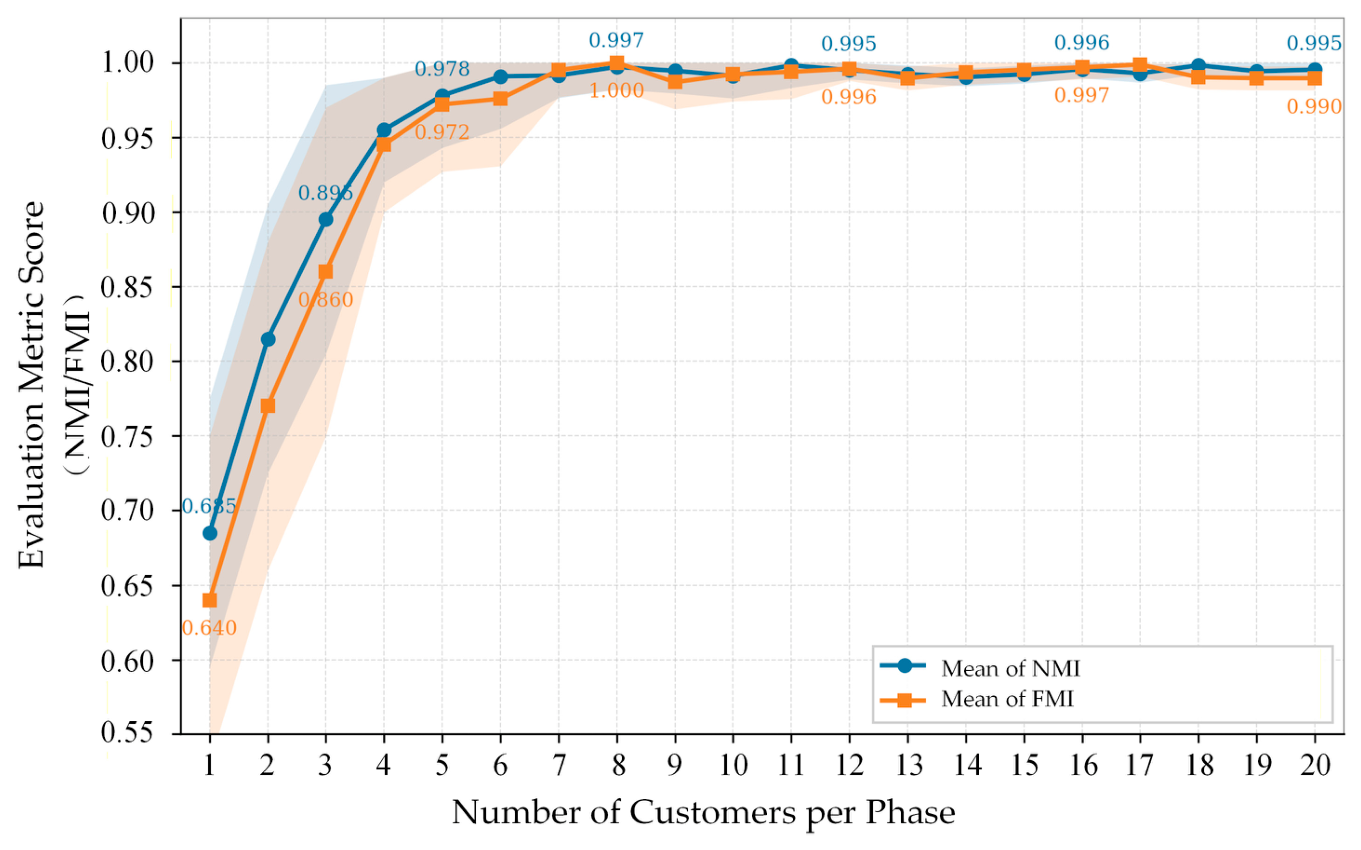
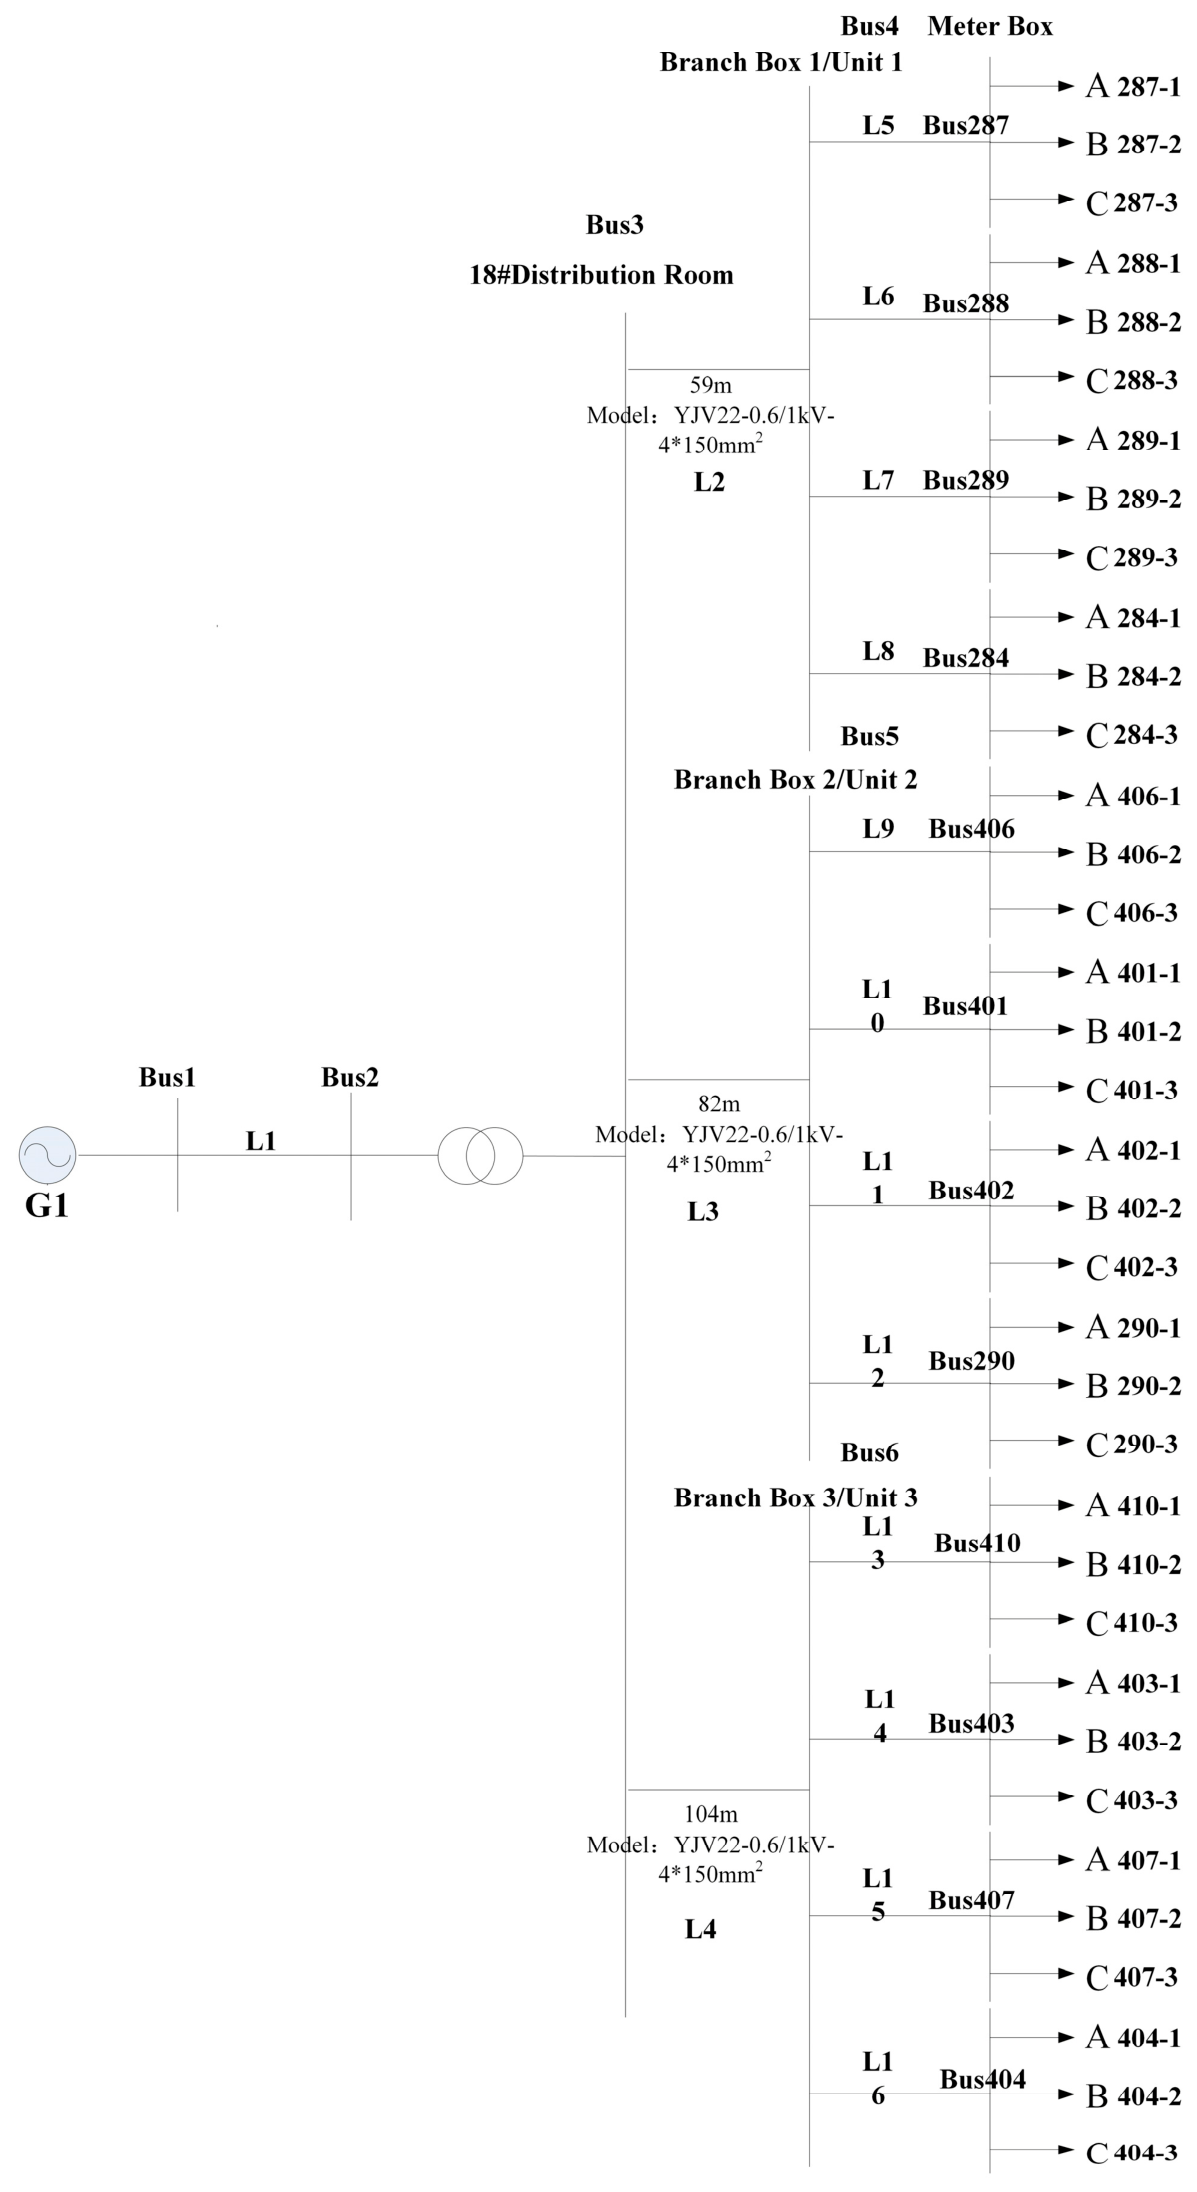
After same-phase customer clustering is completed, the second stage further combines the single-phase clusters into complete three-phase meter box clusters. When a significant current switching event occurs within a driving-phase cluster, the response clusters on the other phases within the same meter box show strong coupling through the shared neutral-conductor impedance. Therefore, significant voltage responses can be observed simultaneously. In contrast, cross-phase response clusters in different meter boxes have shorter common impedance paths, and their voltage responses are smaller than those within the same meter box. These response magnitudes are below the event detection threshold and therefore cannot be detected. Therefore, by counting the number of current–voltage event pairs that satisfy the time synchronization constraint, the strength within a cluster correlation can be quantified.
3.2.1. Synchronization Matching Based on Cross-Phase Events
A matching count function is defined to count the total number of successfully matched event pairs between the driving current sequence and the response voltage sequence. It then maximizes the number of matched events by searching for the optimal time shift .
Here, refers to the set of current events of the -th customer cluster on phase , and each event is characterized by its occurrence time and current change magnitude . refers to the set of voltage events recorded by the -th customer cluster on phase , and each event is characterized by its occurrence time and current change magnitude .
The calculation process is shown in Algorithm 1:
| Algorithm 1: Counting matched events between cross-phase clusters. |
|
The algorithm addresses the time synchronization constraint by setting a matching time window to accommodate second-scale deviations in event timestamps and determining the optimal time shift to correct possible clock desynchronization between different devices. This sequence-level correction is introduced to compensate for possible clock desynchronization between different metering devices.
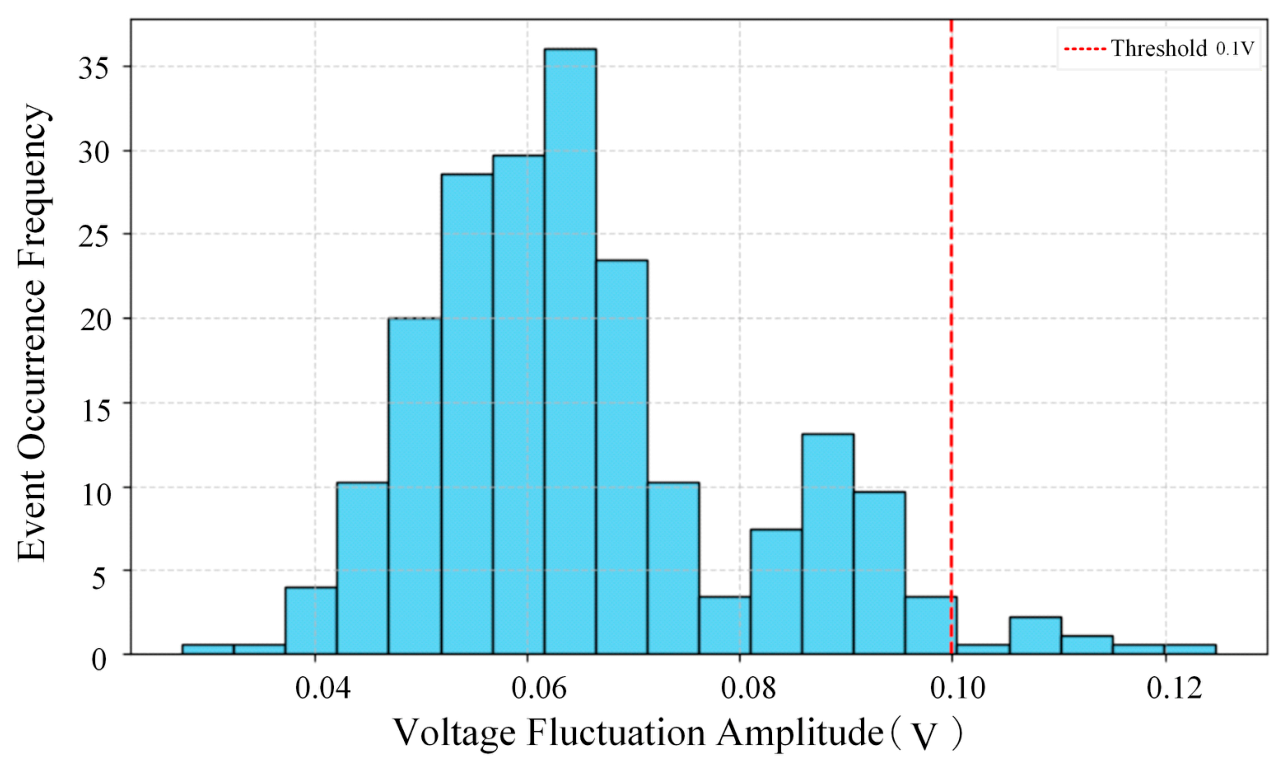
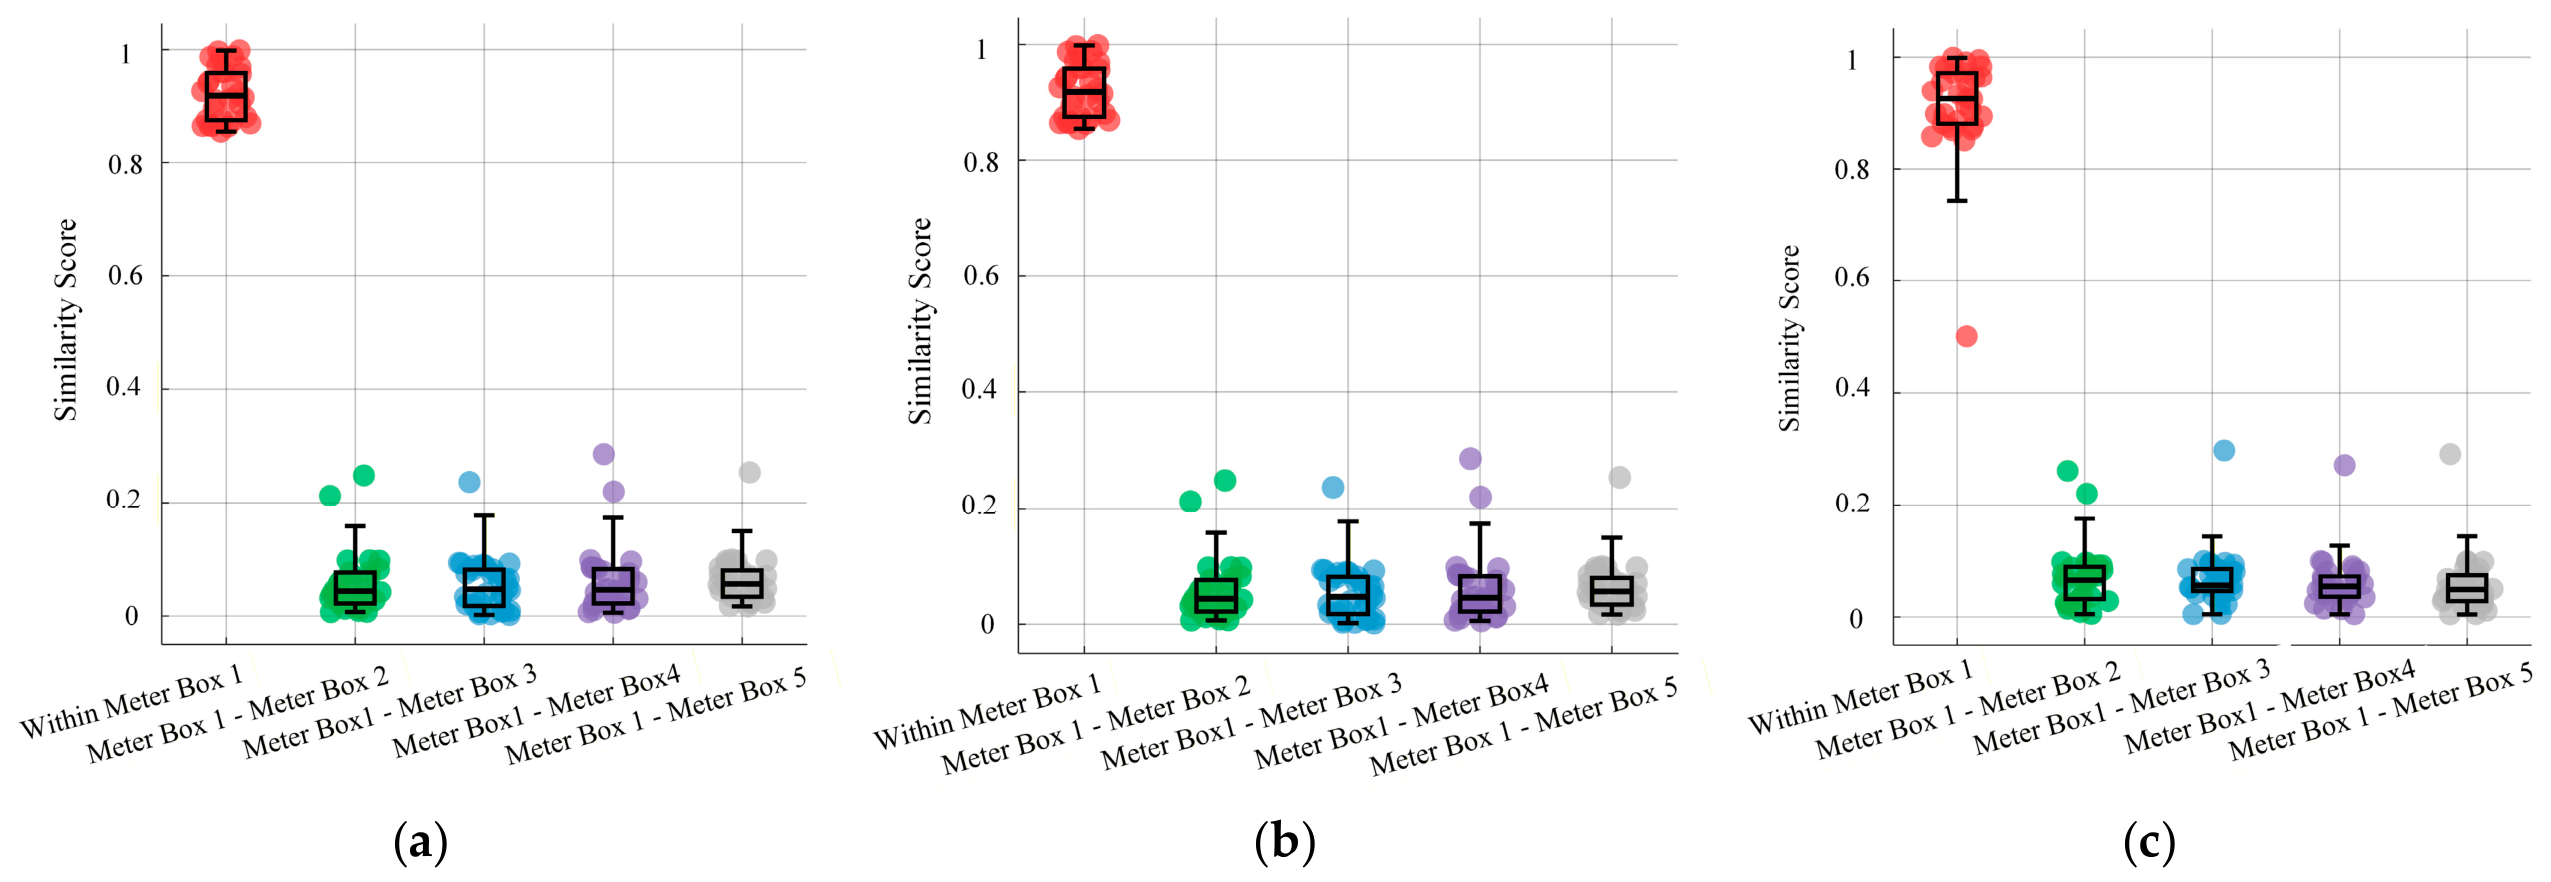
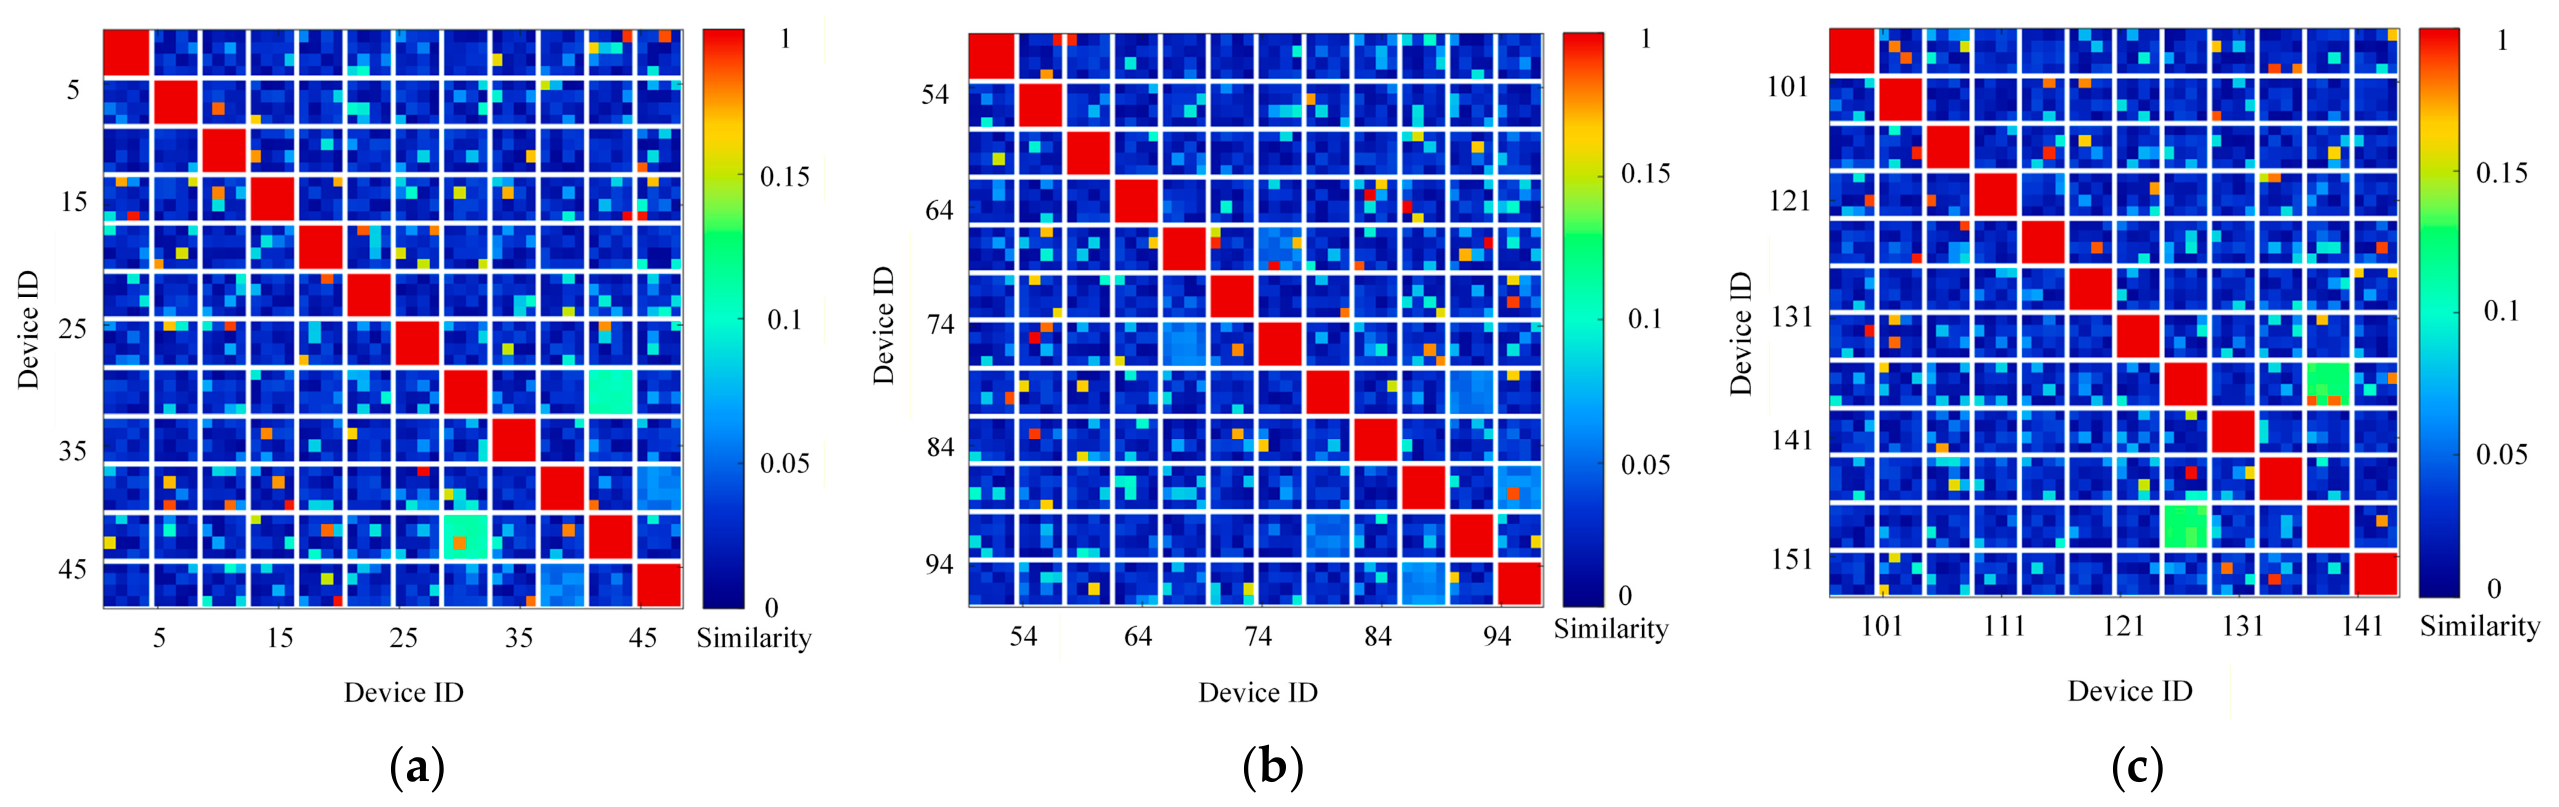
The “maxMatchCount” returned by the algorithm represents the number of matched events between two clusters. For customer clusters within the same meter box, the response voltage magnitudes are usually significantly higher than the threshold and are highly aligned within the time window. Therefore, the number of matched events increases significantly. In contrast, response voltage magnitudes of clusters in different meter boxes are weak and are often below the extraction threshold of , or they are not temporally synchronized, resulting in a low number of matched events. This difference ensures that the number of matched events between clusters within the same meter box is the largest.
3.2.2. Meter Box Topology Modeling Based on Multiple Verification Mechanisms
To ensure robustness and accuracy under complex operating conditions, this section proposes a meter box topology reconstruction method that combines multi-mode cross-validation, voting quantification, and a greedy heuristic algorithm. An uncertainty-aware confidence screen is further introduced so that weak or nearly tied assignments can remain unresolved instead of being forced into the reconstructed topology.
To avoid incorrect associations caused by poor single-phase data quality or sparse events, a set of verification mode is defined, which represents the matching process that use the current events of phase A, phase B, and phase C as the driving events, respectively, and the voltage events of the other two phases as the responses.
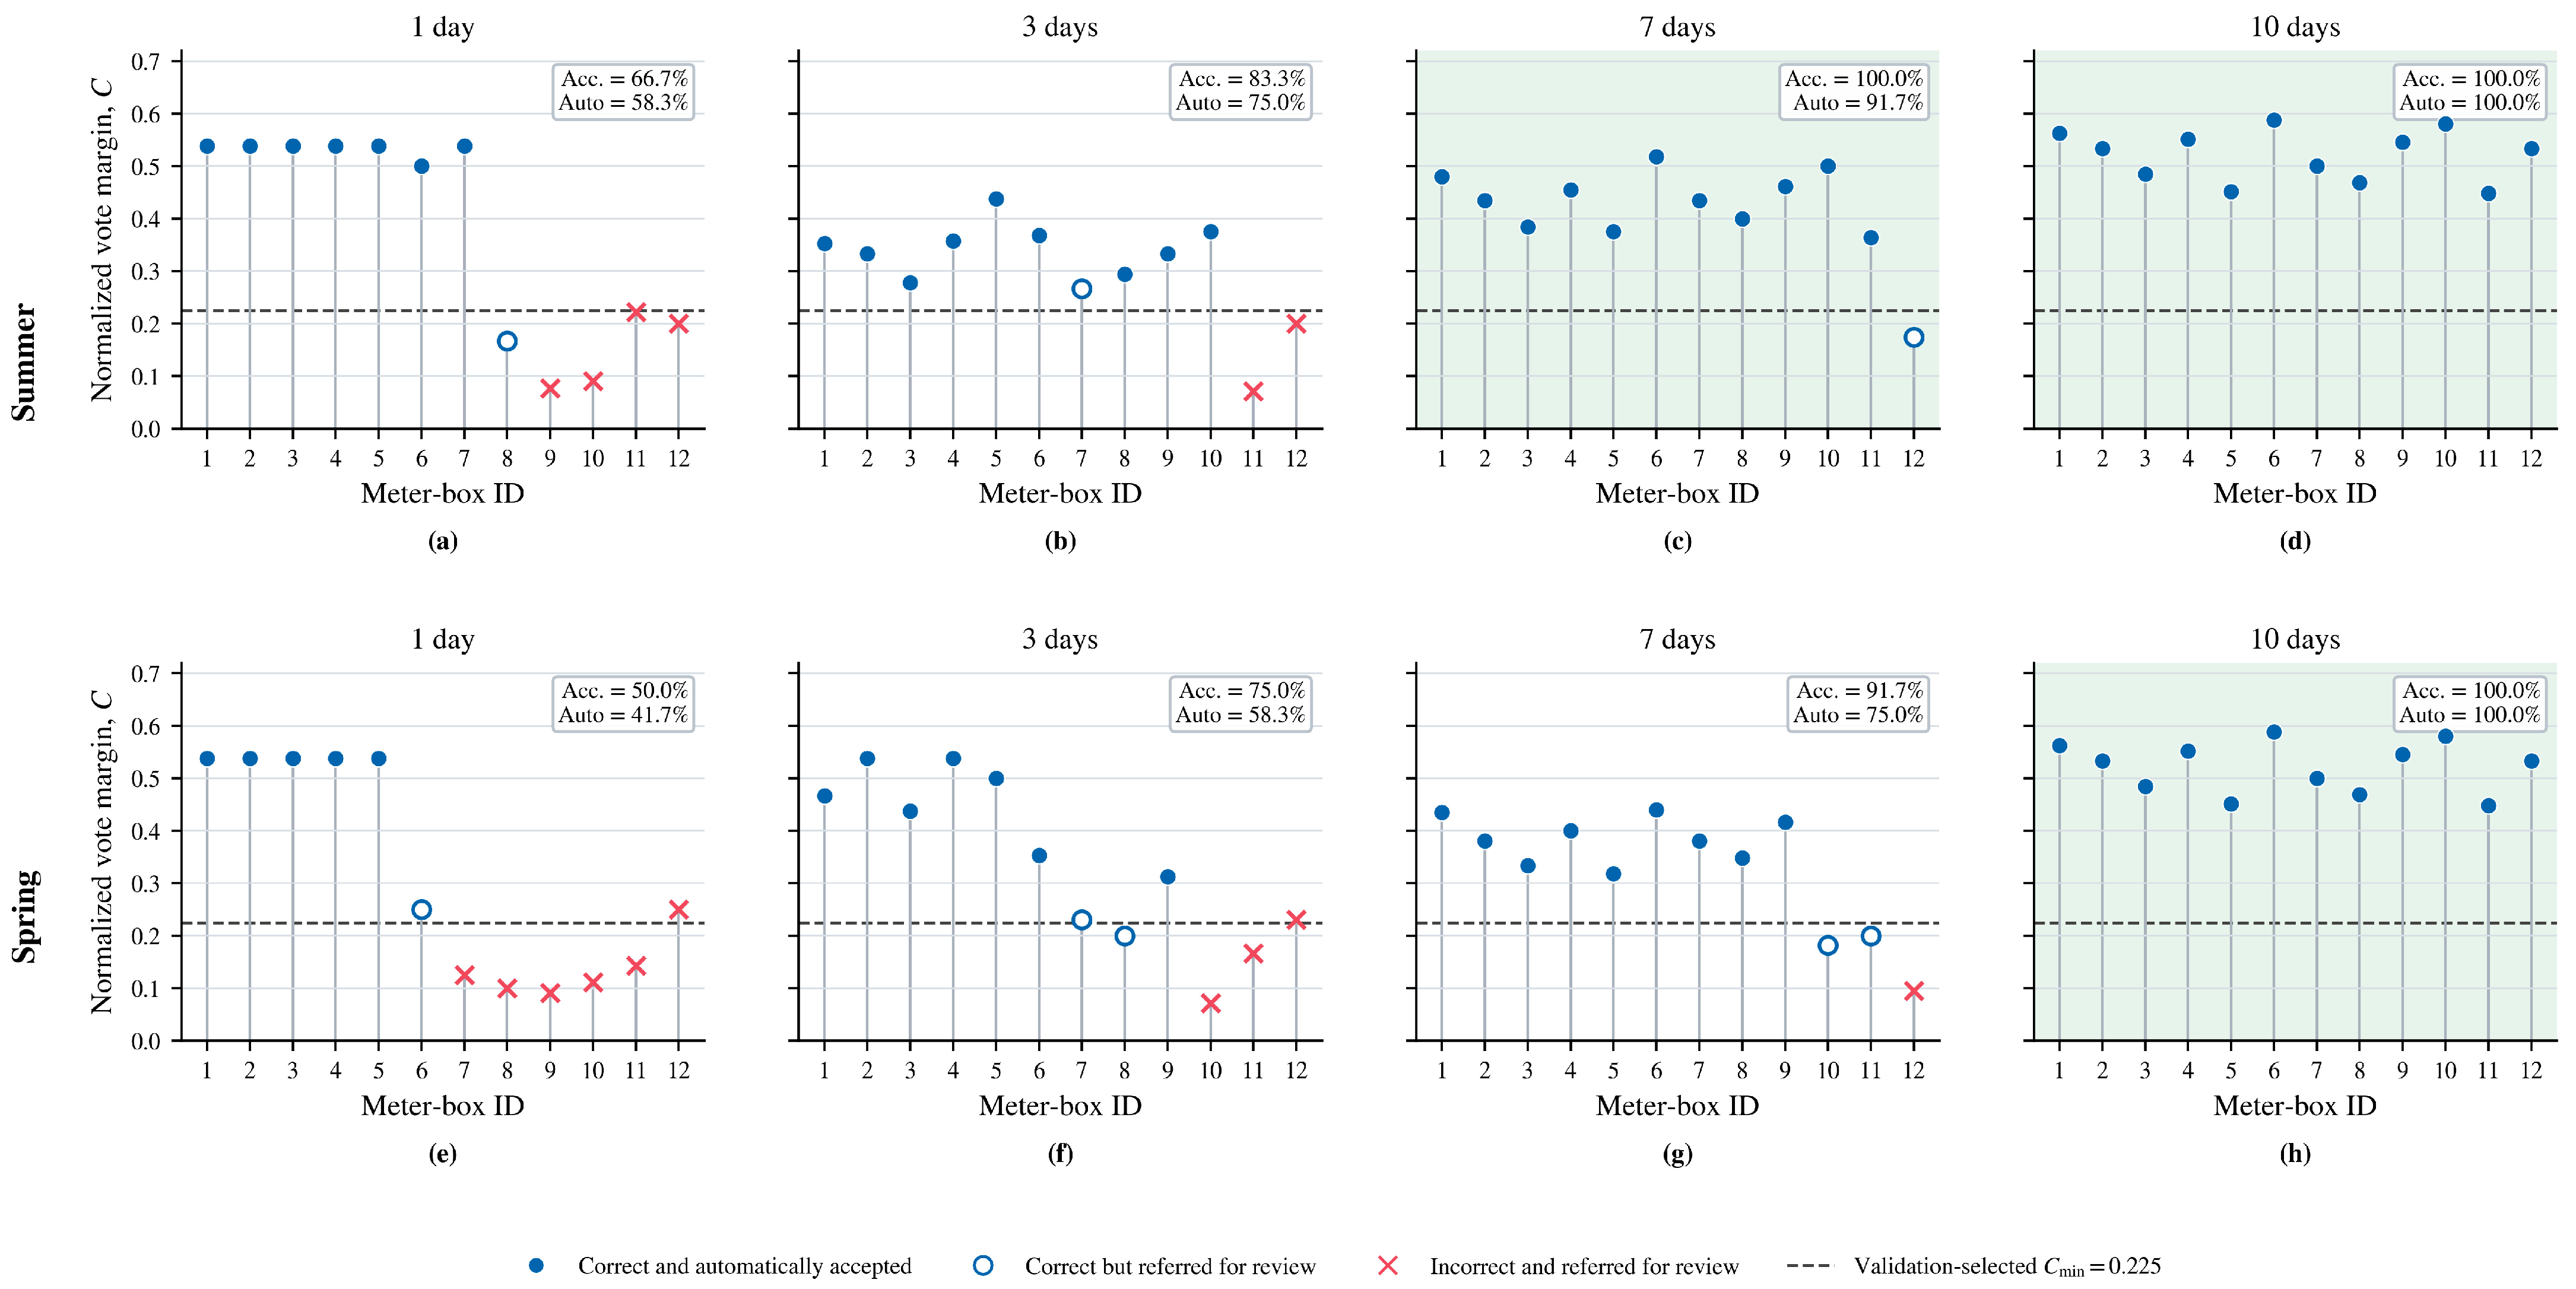
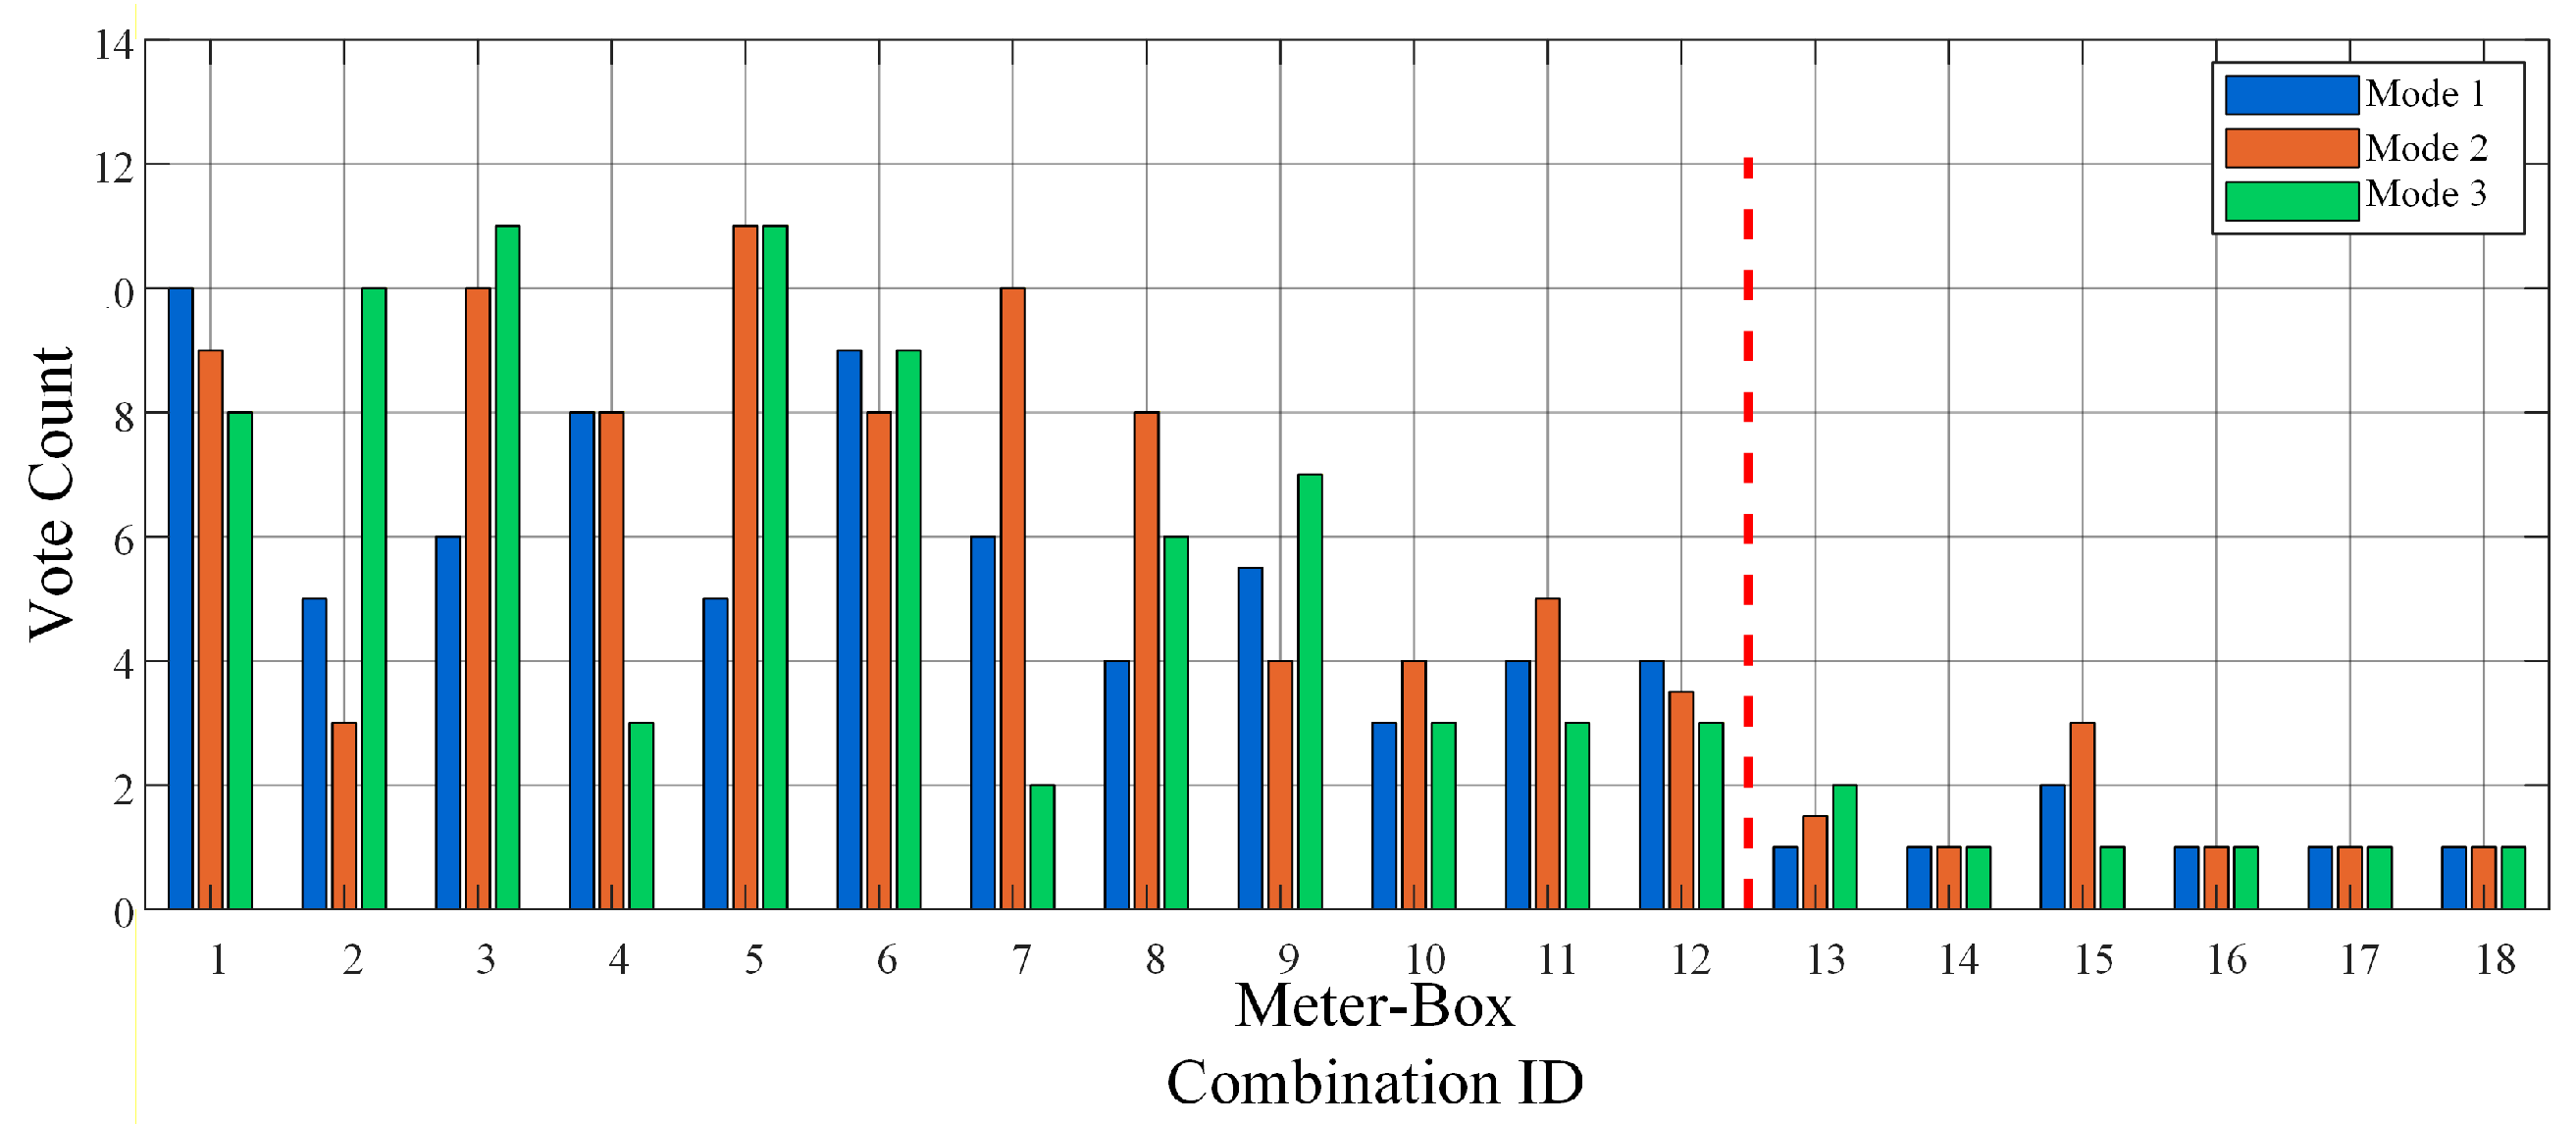
A voting mechanism is introduced to eliminate the interference of random noise. The voting horizon is set to
days. For any possible cross-phase cluster combination
(where
represents the
-th customer cluster of phase A, and so on), define the cumulative matching votes
as
where represents the total number of successfully matched current–voltage event pairs within the three-phase cluster combination on the
-th day and in the
-th verification mode.
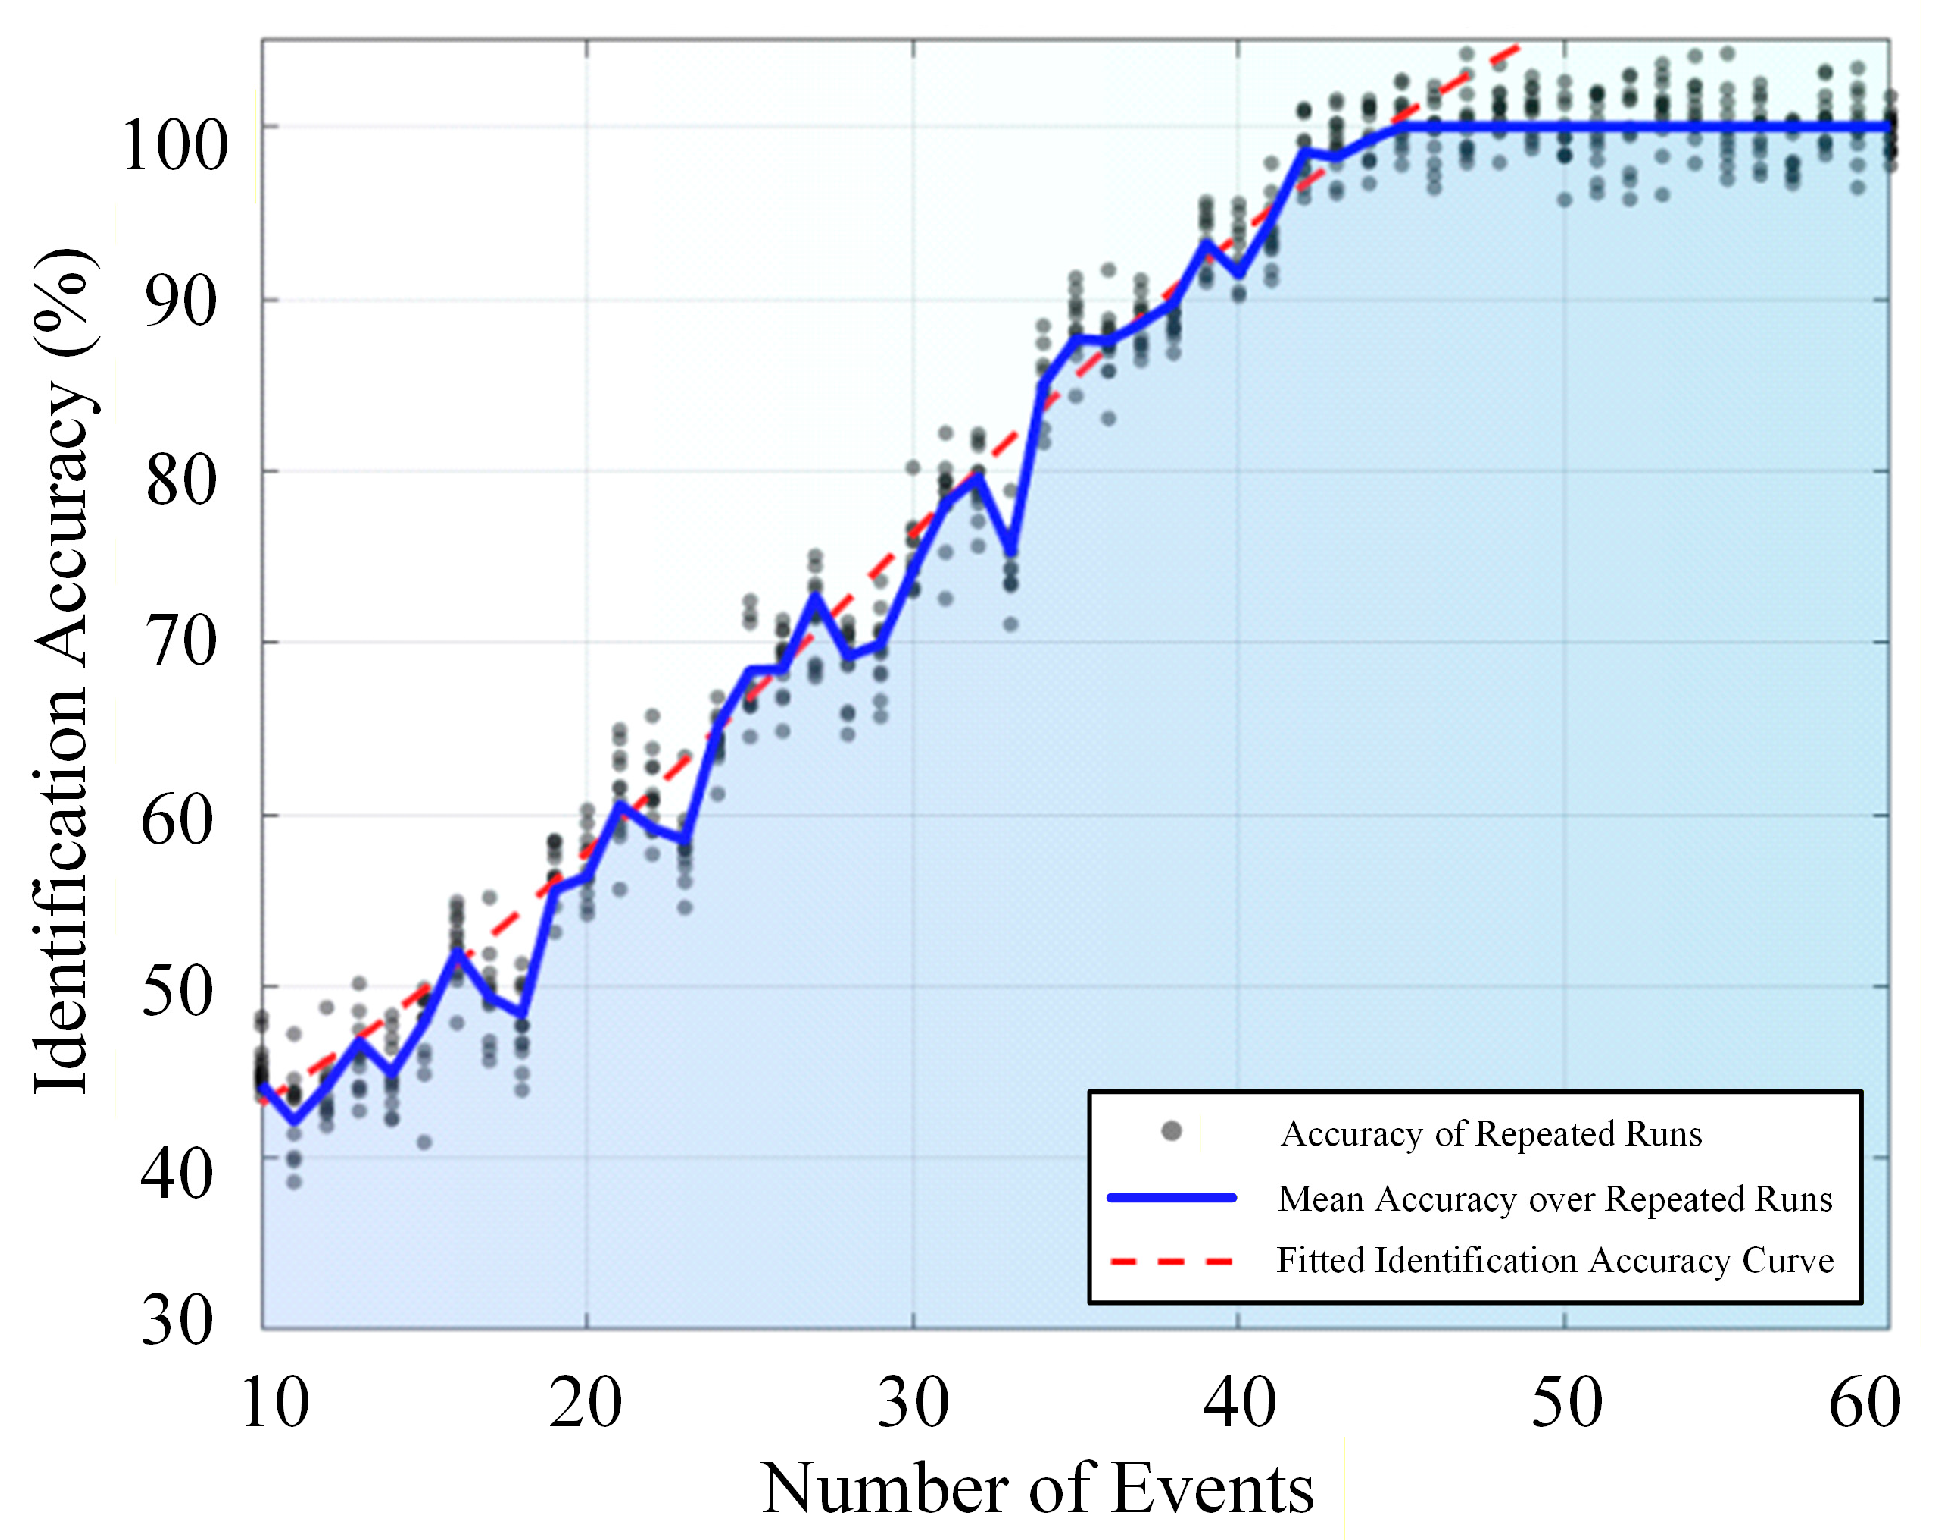
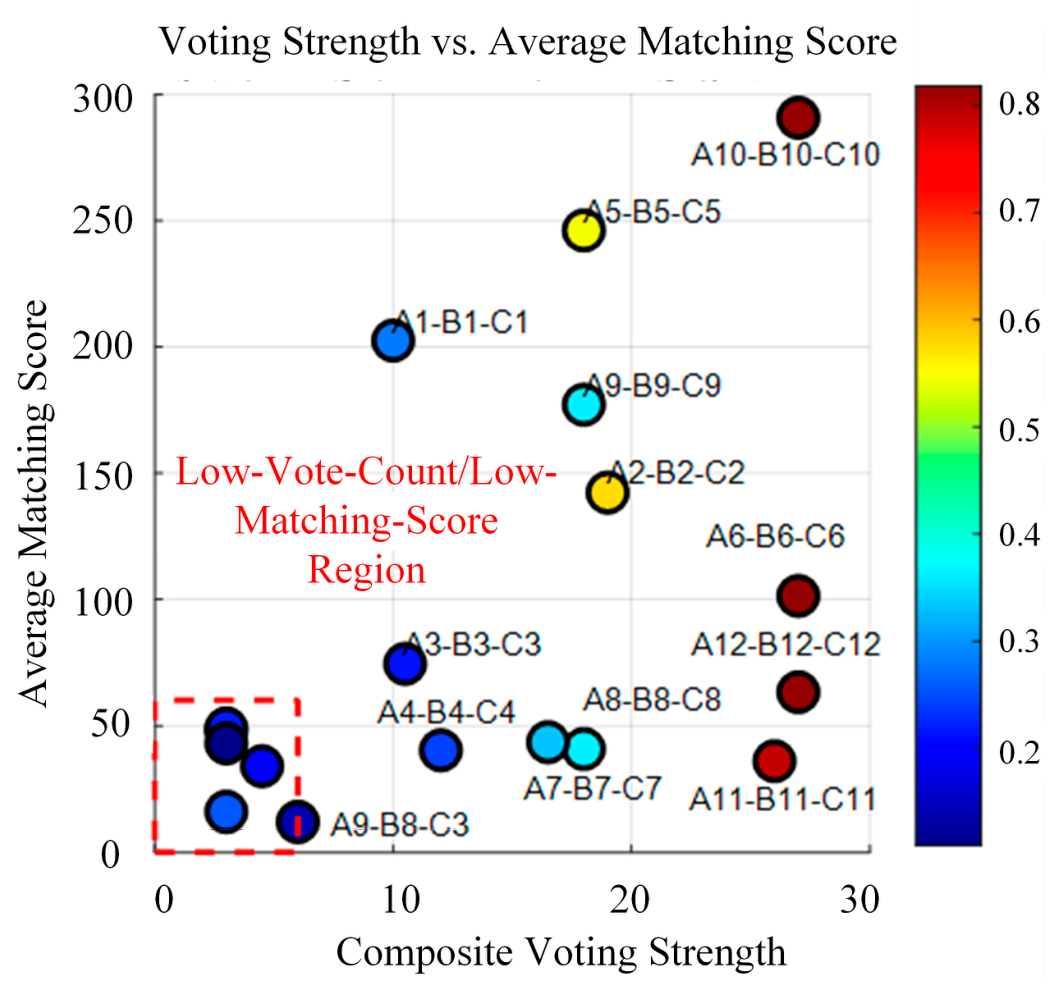
The correct meter box relationships continuously accumulate a high number of votes during the observation period, while false associations caused by occasional noise are smoothed and filtered out.
- 2.
Greedy Heuristic Algorithm Based on Vote Priority
To meet the timeliness requirements of engineering applications, this paper develops a greedy heuristic algorithm based on vote priority (GH-VP). The core idea of GH-VP is to sequentially select meter box combinations in descending order of their vote counts while ensuring that each single-phase cluster is assigned only once. The detailed procedure is presented in Algorithm 2. First, the accepted-combination set
and the accepted-index sets
are initially empty. The manual-review set
and the review-reserved index sets
are also initialized as empty sets. The algorithm then enumerates all
possible three-phase cluster combinations
, calculates the cumulative vote count
for each combination, and sorts all candidate combinations in descending order of their vote counts to form an ordered candidate list.
| Algorithm 2: Greedy heuristic algorithm based on vote priority. |
|
During the greedy selection stage, the candidates in the ordered list L are examined in descending order of their cumulative vote scores. A candidate that combines the -th phase A cluster, the -th phase B cluster, and the -th phase C cluster is considered only if is not contained in either the accepted phase A index set or the review-reserved phase A index set, is not contained in either corresponding phase B set, and is not contained in either corresponding phase C set. Thus, none of the candidate"s three clusters may have been accepted or reserved for manual review previously. A candidate that violates this condition conflicts with an earlier decision and is skipped without changing any set. An eligible candidate is not accepted merely because it is currently the highest-ranked candidate. It must also satisfy the minimum-support, absolute-margin, and normalized-margin criteria. If all three criteria are satisfied, the candidate is added to the accepted-combination set , and its three cluster indices are added to the corresponding accepted-index sets. If any criterion fails, the candidate is added to the manual-review set , and its three cluster indices are added to the review-reserved sets. The procedure terminates when combinations have been accepted or when all candidates in have been examined. Consequently, the selective GH-VP procedure always produces a conflict-free set of automatic assignments but may accept fewer than meter-box combinations when the available evidence is insufficient.
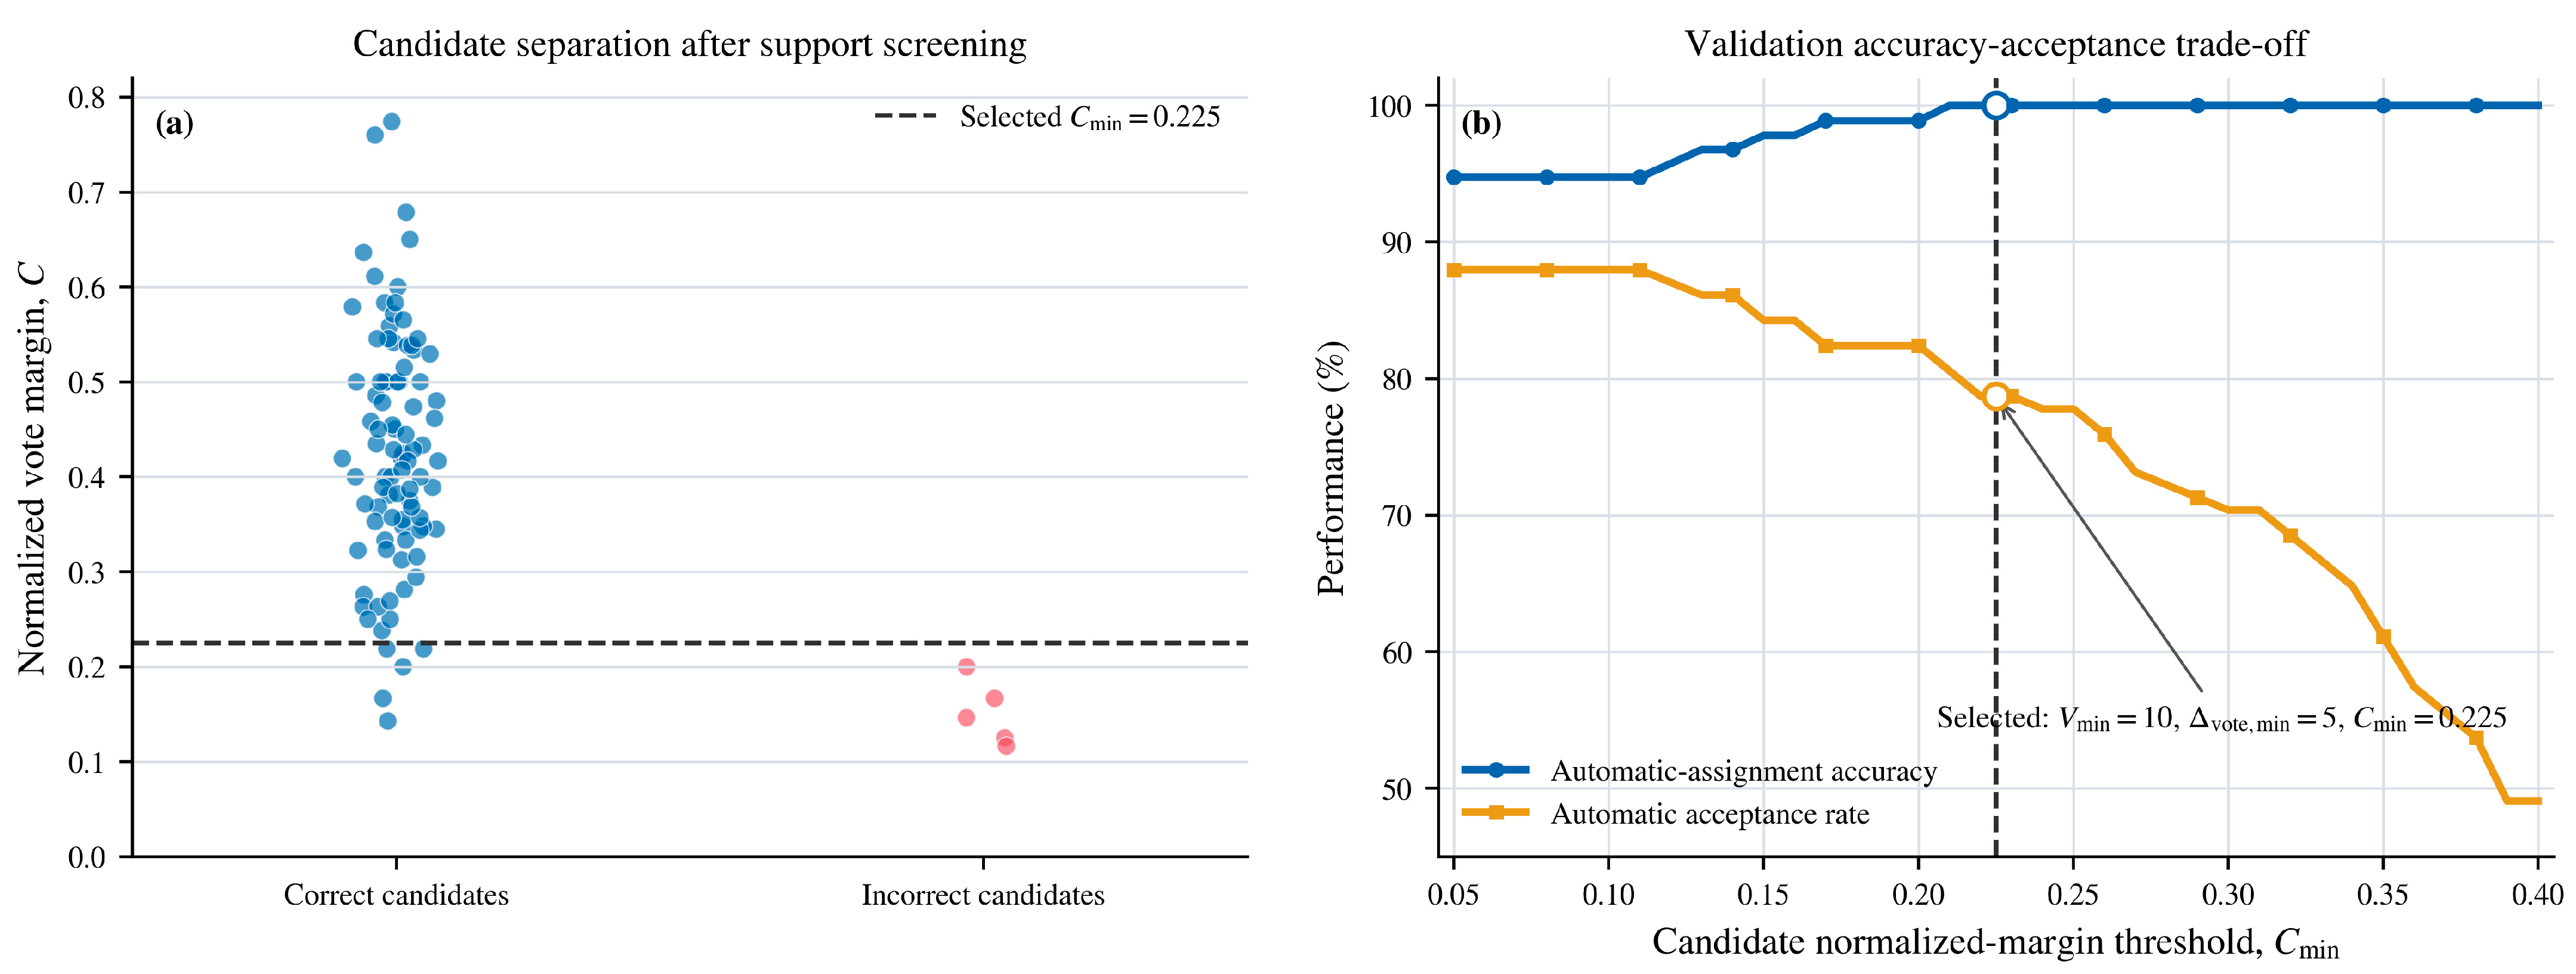
The one-to-one assignment constraint prevents a single-phase cluster from being used in more than one accepted combination, but it does not quantify the ambiguity of an assignment. Consider an eligible three-phase candidate, and let denote its cumulative vote score over the prescribed voting horizon. Its competing set contains every other candidate in that shares at least one constituent cluster with the current candidate; that is, . Let be the largest cumulative vote score among the candidates in . If is empty, is set to zero. The absolute vote margin is defined as , and the normalized vote margin is defined as .
A normalized vote margin close to zero indicates a near tie, whereas a larger value indicates clearer separation from the strongest conflicting candidate. Because the normalized margin alone does not measure the amount of supporting evidence, automatic acceptance requires and simultaneously. If all three inequalities hold, the candidate is accepted, and its three indices are locked in the accepted-index sets. Otherwise, the candidate, its decision statistics , and the failed criterion or criteria are recorded in . Its three indices are then placed in the review-reserved sets, ensuring that no later candidate containing any of those clusters can be assigned automatically. The thresholds , and are jointly selected using an independent validation set. For each threshold combination, the complete sequential assignment procedure is executed, and both the exact-triplet accuracy among automatically accepted candidates and the automatic acceptance rate are evaluated.