1. Introduction
The aviation industry faces mounting pressure to significantly reduce carbon emissions while maintaining performance, safety, and economic viability. Conventional hydrocarbon fuels remain dominant due to their high volumetric energy density and established infrastructure, yet their carbon intensity is incompatible with long-term decarbonization goals. Hydrogen has emerged as a promising zero-carbon alternative; however, its low volumetric energy density and challenging storage requirements introduce substantial integration difficulties for aircraft applications. As a result, alternative carbon-free fuels that offer improved storage characteristics while maintaining acceptable combustion performance are under active investigation. Among these candidates, ammonia has gained increasing attention. The work presented in this paper is an extended version of our paper published with the AIAA SciTech 2026 conference [
1].
Ammonia is particularly attractive as an aviation fuel due to its high hydrogen content and comparatively favorable storage properties relative to pure hydrogen. With a volumetric energy density of 14.3 MJ/L compared to hydrogen at 10.7 MJ/L [
2], ammonia enables smaller tank volumes for equivalent stored energy. Furthermore, liquid ammonia has considerably less stringent storage complexities and costs compared to liquid hydrogen storage [
3], further emphasizing ammonia’s promising candidacy as the standard carbon-free aviation fuel.
Despite these advantages, ammonia presents substantial combustion-related challenges that must be addressed before practical implementation in aircraft propulsion systems can be realized. A primary concern is the formation of nitrogen oxides (NO
x), which arise readily due to the nitrogen atom inherent in the ammonia molecule. NO
x emissions contribute to smog formation, acid rain, ozone layer degradation, and greenhouse effects [
4]. Ammonia combustion is able to produce excessive NO
x emissions due to the fuel-NO
x pathway. For instance, intermediate reactions such as
are shown to be an important step in the production of N
2O [
5,
6], a potent greenhouse gas, where the species NH is a radical that spawns directly from ammonia during oxidation. In stationary and marine ammonia-fueled systems, selective catalytic reduction (SCR) units are frequently employed to reduce NO
x emissions [
7]; however, such systems are generally unsuitable for aircraft due to their added weight, mechanical complexity, and potential disruption of exhaust flow momentum, which may reduce thrust.
Ammonia also exhibits comparatively poor flammability characteristics. Its laminar flame speed is approximately 7 cm/s, significantly lower than typical hydrocarbon fuels (40–50 cm/s) and far below hydrogen, which can reach flame speeds near 300 cm/s [
8]. In addition, ammonia has a narrow flammability range, increasing susceptibility to flame instability and blowout unless mixture ratios are tightly controlled. These properties result in weaker, less stable combustion compared to conventional aviation fuels, representing a major barrier to direct ammonia utilization in gas turbine engines.
Several strategies have been proposed to mitigate ammonia’s combustion limitations. High-swirl combustors are often employed to promote strong internal recirculation of hot combustion products toward the incoming reactants, thereby enhancing flame stabilization and sustaining ignition [
9]. Another widely explored approach is dual-fuel combustion, in which ammonia is co-fired with a more reactive secondary fuel to improve flame speed and stability. Under appropriate operating conditions, dual-fuel systems have demonstrated the potential to reduce NO
x emissions relative to single-fuel operation, as observed in configurations involving downstream ammonia injection in pulverized coal burners [
8].
However, conventional dual-fuel approaches introduce new limitations for aerospace applications. When hydrocarbons are used as the secondary fuel, carbon emissions are reintroduced, undermining the objective of achieving a carbon-free propulsion system. Hydrogen offers a carbon-free and highly reactive alternative; yet, dual-fuel configurations generally require separate onboard storage tanks and fuel delivery systems, increasing system mass, volume, and cost. Notably, this requirement is inherently redundant in the case of ammonia, as ammonia itself contains a substantial hydrogen mole fraction, with three hydrogen atoms per molecule.
Through catalytic cracking, ammonia can be decomposed into hydrogen and nitrogen prior to combustion, enabling the formation of ammonia–hydrogen fuel blends that enhance reactivity while maintaining a single primary fuel storage system. By internally generating hydrogen from ammonia, it becomes possible to implement an integrated dual-fuel strategy without the mass and complexity penalties associated with independent fuel storage. In this manner, ammonia possesses the intrinsic capability to address its own flammability limitations while preserving its storage and infrastructure advantages.
Accordingly, this study examines the combustion and emissions characteristics of cracked-ammonia fuel blends through detailed computational fluid dynamics (CFD) simulations. It has been found, when reviewing previously published literature, that analysis of cracked ammonia combustion typically focuses only on a small selection of ammonia fuel cracking percentages [
10,
11,
12] or places much more emphasis on NH
3/H
2 fuel blends instead of blends that include the nitrogen produced from the cracking.
It has been reported that cracking ammonia fuel to moderate levels, or below 50% cracking, leads to a considerable increase in flame temperatures, flame speeds, and NO
x emissions [
10,
11,
12]. However, these articles often do not go into deeper discussion about the implications that the full-range trends in NO
x emissions can have on power systems that are designed to utilize cracked ammonia fuel for combustion. The aim of this work is to conduct a more comprehensive assessment of the effects of ammonia cracking on NO
x emissions from 0% to 100% cracking while including nitrogen because power systems that would incorporate ammonia fuel and cracking will most likely not include N
2 separation systems to minimize system complexity and costs.
To conduct this assessment of ammonia cracking on NO
x emissions, several in-depth parametric sweeps were performed across varying equivalence ratios and ammonia cracking fractions to quantify their impact on NO
x formation and flame stability. Particular attention is given to identifying whether high levels of ammonia cracking can simultaneously enhance combustibility and mitigate the elevated NO
x emissions traditionally associated with ammonia combustion. While thermoacoustic effects are also a known concern for the operability of gas turbine combustors and the flame behavior within them [
13], such effects will not be considered in this work. By systematically evaluating these tradeoffs, this work aims to clarify the role of fuel preprocessing in enabling ammonia as a viable carbon-free aviation fuel.
2. Methodology
The aim of this work is to evaluate the effect of ammonia cracking on NOx emissions and to determine if the operation of an ammonia combustor would benefit from burning cracked ammonia fuel instead of pure ammonia fuel. To evaluate the effects of ammonia cracking on NOx formation, detailed CFD simulations were performed using a 2D axisymmetric combustor model. Simulations considered varying ammonia cracking fractions and equivalence ratios to systematically examine the tradeoffs between flame stability, fuel reactivity, and emissions. This section details the fuel compositions, combustion modeling approach, computational domain, and simulation setup employed in this study.
2.1. Parametric Simulation Sweeps
Four parametric sweeps were simulated in Ansys Fluent to examine the effect of ammonia cracking on NOx emissions while using a constant air mass flow rate. The first sweep burns pure ammonia over equivalence ratios ranging from 0.5 to 1.5 with a constant air mass flow rate, leaving only the fuel mass flow rate to be governed by the equivalence ratio. The NOx emissions results of this sweep serve as the point of reference for assessing the effect of cracking on ammonia combustion.
The second sweep burns ammonia from 0% to 100% cracking at a constant equivalence ratio. The equivalence ratio that will be chosen for this second sweep will be the one that produced the most NO
x emissions, or the worst-case scenario, in the first sweep. The compositions of the fuel blend for each cracking percentage are provided in
Table 1. The results of this sweep can inform if cracking ammonia fuel before combustion is beneficial or detrimental for controlling NO
x emissions from a combustor.
The third sweep burns fully cracked ammonia (FCA) over the same equivalence ratio range as the first sweep. It was hypothesized prior to conducting this work that burning FCA would result in lower NO
x emissions due to the lack of ammonia in the fuel blend, cutting off the fuel-NO
x pathway. This would leave only the thermal-NO
x production pathway through the Zeldovich mechanism [
14], which requires high temperatures to meaningfully produce NO
x molecules.
The fourth and final sweep is similar to the second sweep in that ammonia is burned from 0% to 100% cracking. The difference here is that the fuel flow rate at the highest NO
x-producing condition will be adjusted at each cracking percentage to maintain a constant heat release rate (HRR), governed by Equation (1):
This sweep is important as power systems often have heat generation from combustion as a design parameter. Because of the often wildly varying chemical characteristics between fuels and fuel blends, their HHRs can therefore vary wildly on an equivalence ratio basis. This means that their respective flow rates must be adjusted accordingly with the help of Equation (1) to maintain the desired HRR for a power system. Furthermore, as a consequence of the variable chemical interactions of different fuels, the emissions profiles between fuels may be drastically different as well on an equal HRR basis. For cracked ammonia blends, this latter subject will be important to assess, as there could be implications for NOx emissions control.
2.2. Fuel Composition and Ammonia Cracking
Ammonia can be decomposed, or cracked, into hydrogen and nitrogen according to the reaction shown in Equation (2):
When the reaction is triggered after sufficient heating, each mole of NH
3 produces 1.5 moles of H
2 and 0.5 moles of N
2, which is a doubling of the total number of moles once the reaction is complete. This increase in the number of moles will in turn increase the volumetric flow rate of the fuel, although the mass flow rate remains constant. The reaction is endothermic, with a standard heat of reaction of 46 kJ/mol. Consequently, the lower heating value of the fuel blend gradually increases from approximately 18 MJ/kg for pure ammonia to about 21 MJ/kg for fully cracked ammonia consisting of 75% H
2 and 25% N
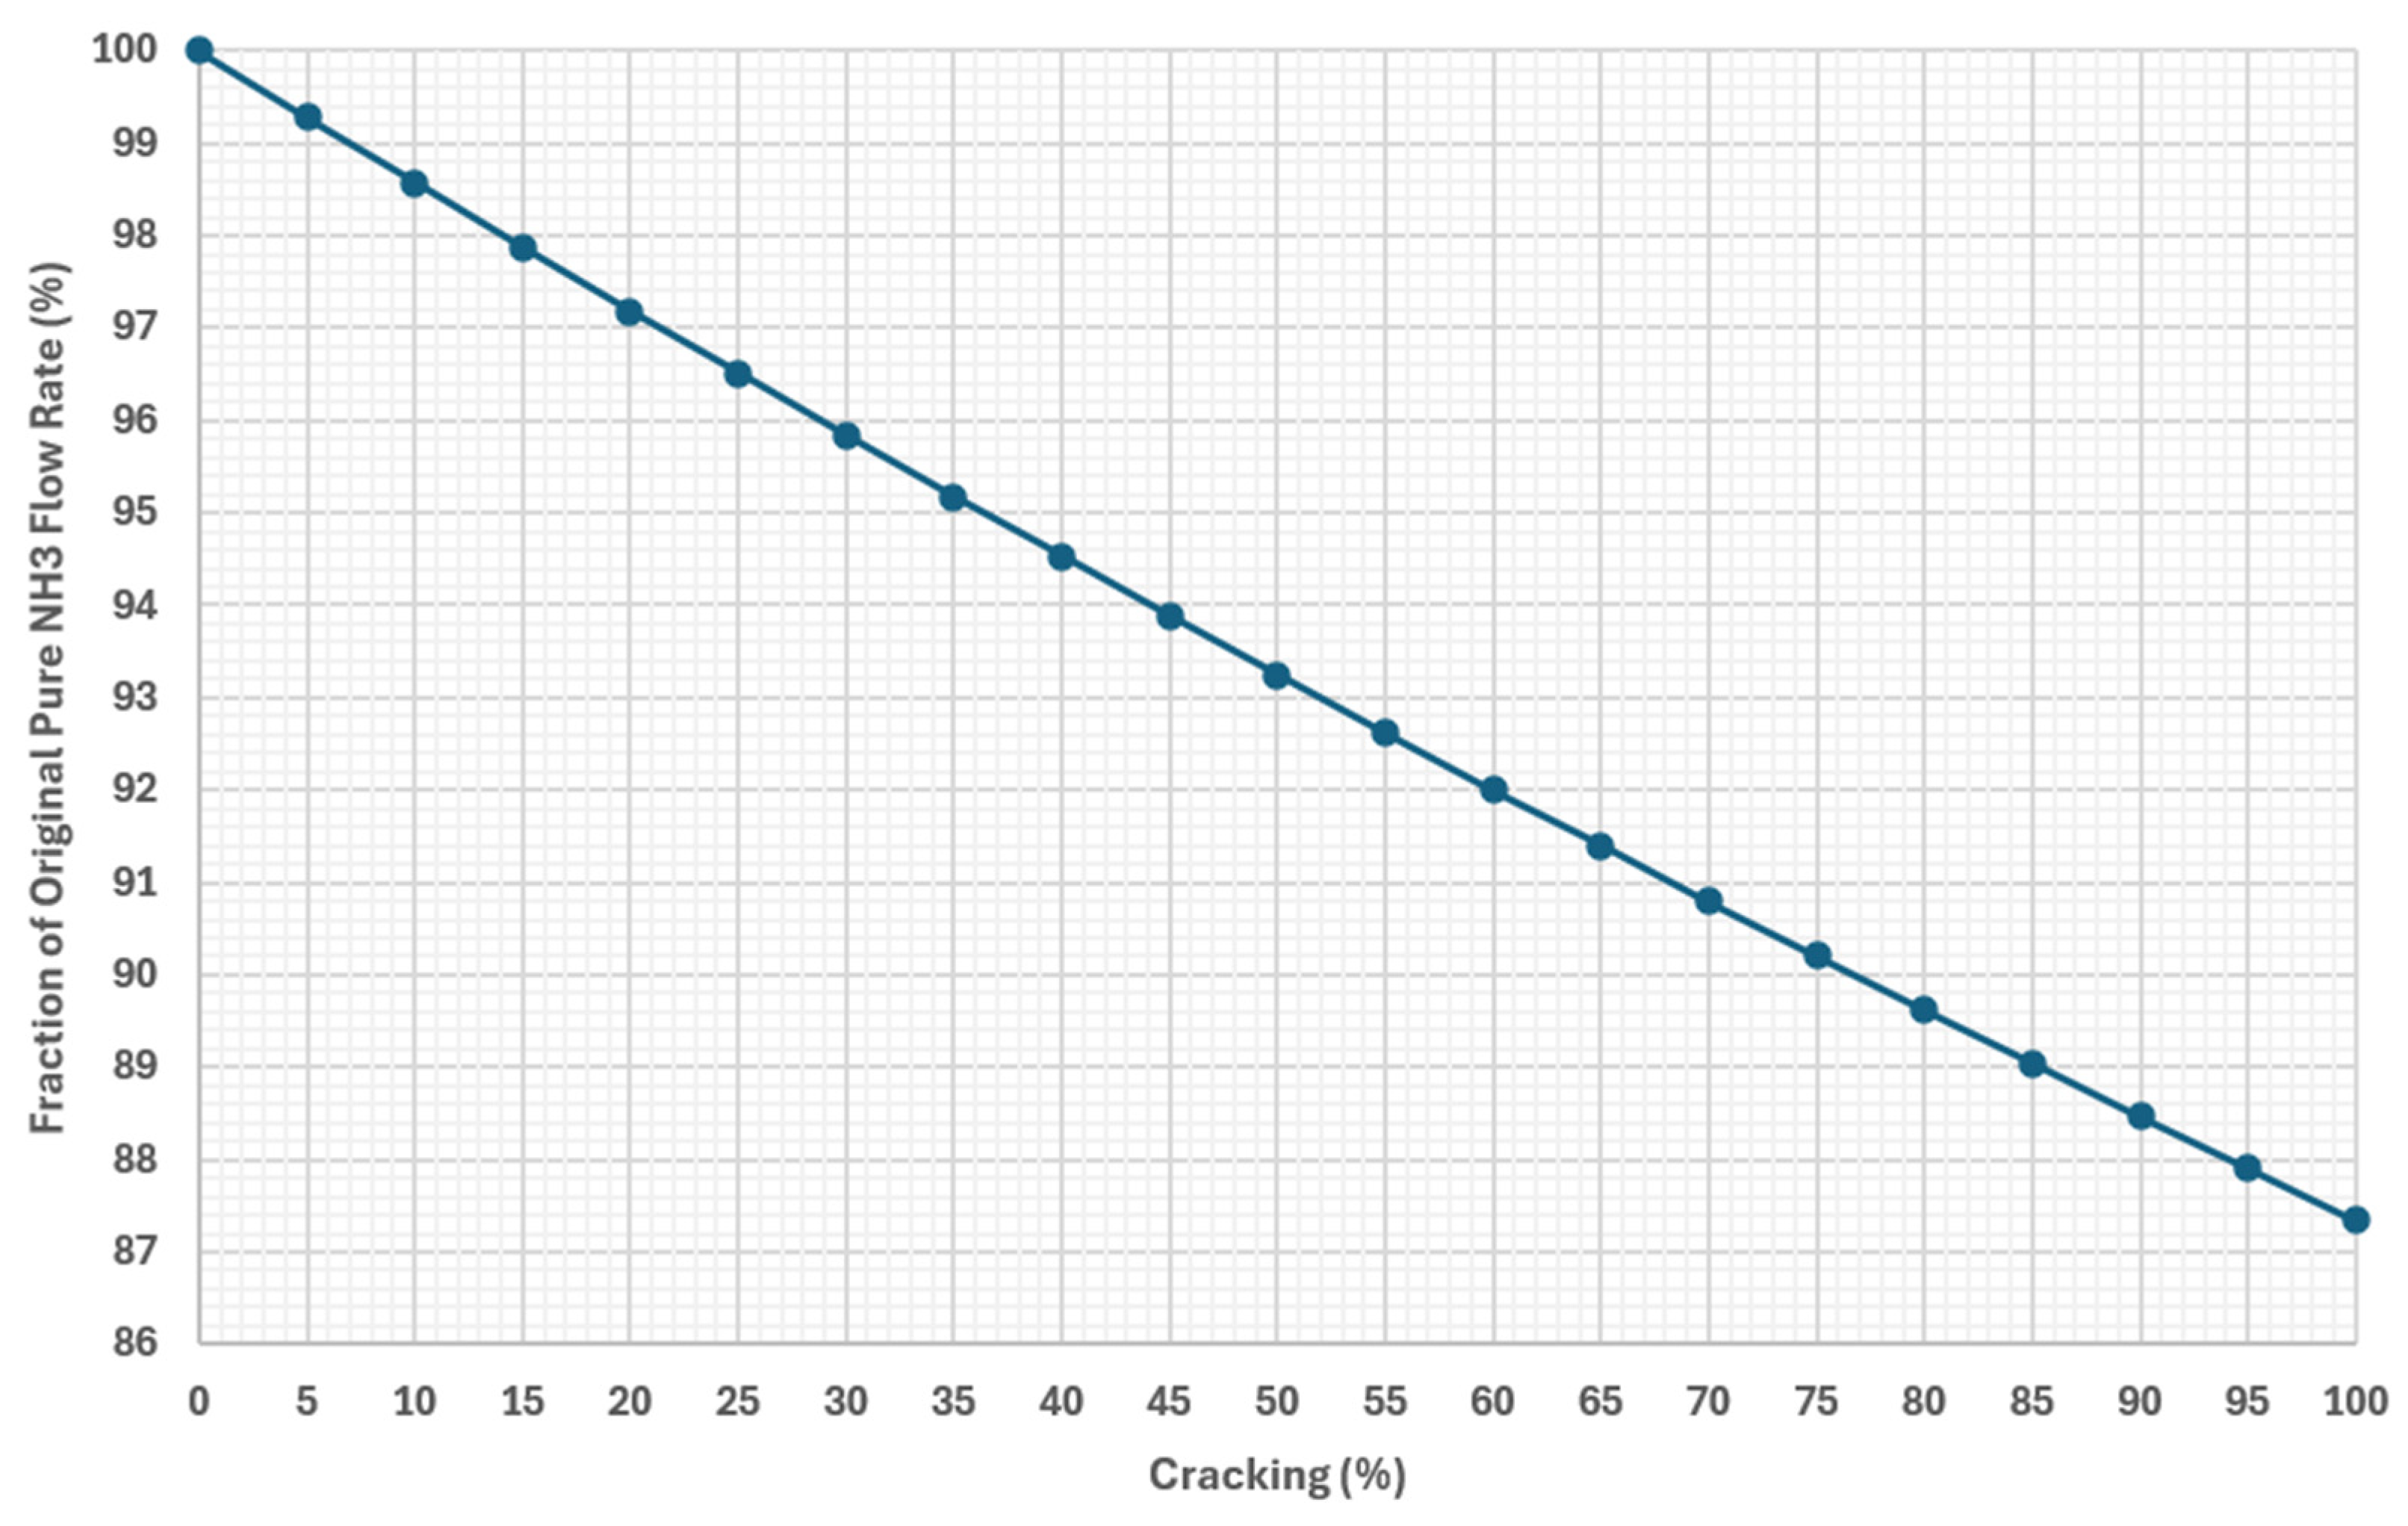
2 by volume. This corresponds to an approximate 14.5% increase in LHV from pure ammonia. For a given rate of heat release, this increase in LHV allows the fuel mass flow rate to be reduced as the cracking percentage increases. The relationship between fuel cracking percentage and the reduction in the cracked ammonia fuel flow rate needed to achieve a heat release equal to the pure ammonia flow is shown in
Figure 1.
The cracking percentage is defined as the fraction of the initial moles of ammonia fuel that are to be converted into H
2 and N
2, as shown in Equation (3):
The term
is the moles of ammonia that are then used to calculate the produced H
2 and N
2. The mole and mass fractions and the lower heating values, calculated from standard state enthalpies of formation [
15], of the NH
3/H
2/N
2 fuel blends are tabulated with cracking percentages in
Table 1.
In this work, the ammonia cracking itself is not modeled in the CFD simulations for the sake of simplicity and to save on computational expense. Instead, the species fractions corresponding to a desired cracking percentage are directly set in the CFD boundary conditions for the fuel flow.
2.3. CFD Domain and Geometry
The experimental scenario presented in Ref. [
9] by Okafor et al., which used a non-premixed rich-lean ammonia combustor to determine the optimal primary zone equivalence ratio that would produce the minimum NO
x emissions, was used as the benchmark for the NO
x emissions assessment in this work due to the brevity of the information it provides on flow conditions and combustor geometry, allowing for easy recreation and validation. The combustion chamber used in the lab testing and large eddy simulations (LES) in Ref. [
9] had a vertical orientation with an overall diameter of 72 mm and a height of 150 mm. The chamber outlet had a diameter of 36 mm. An axial air swirler had hub and blade tip diameters of 14 mm and 24 mm, respectively. The fuel axial swirler had hub and tip diameters of 8 mm and 13 mm. Axial and tangential inlet velocity components are utilized in the large eddy simulations conducted in Ref. [
9] to impose a swirl on the two flows to avoid having to mesh the swirler geometry, which for a 45° blade angle swirler would be a value of 1 for each component.
Due to constraints on computational resources, the NO
x assessment conducted in this work will run on steady-state simulations with a two-dimensional domain instead of the three-dimensional domain that was used in Ref. [
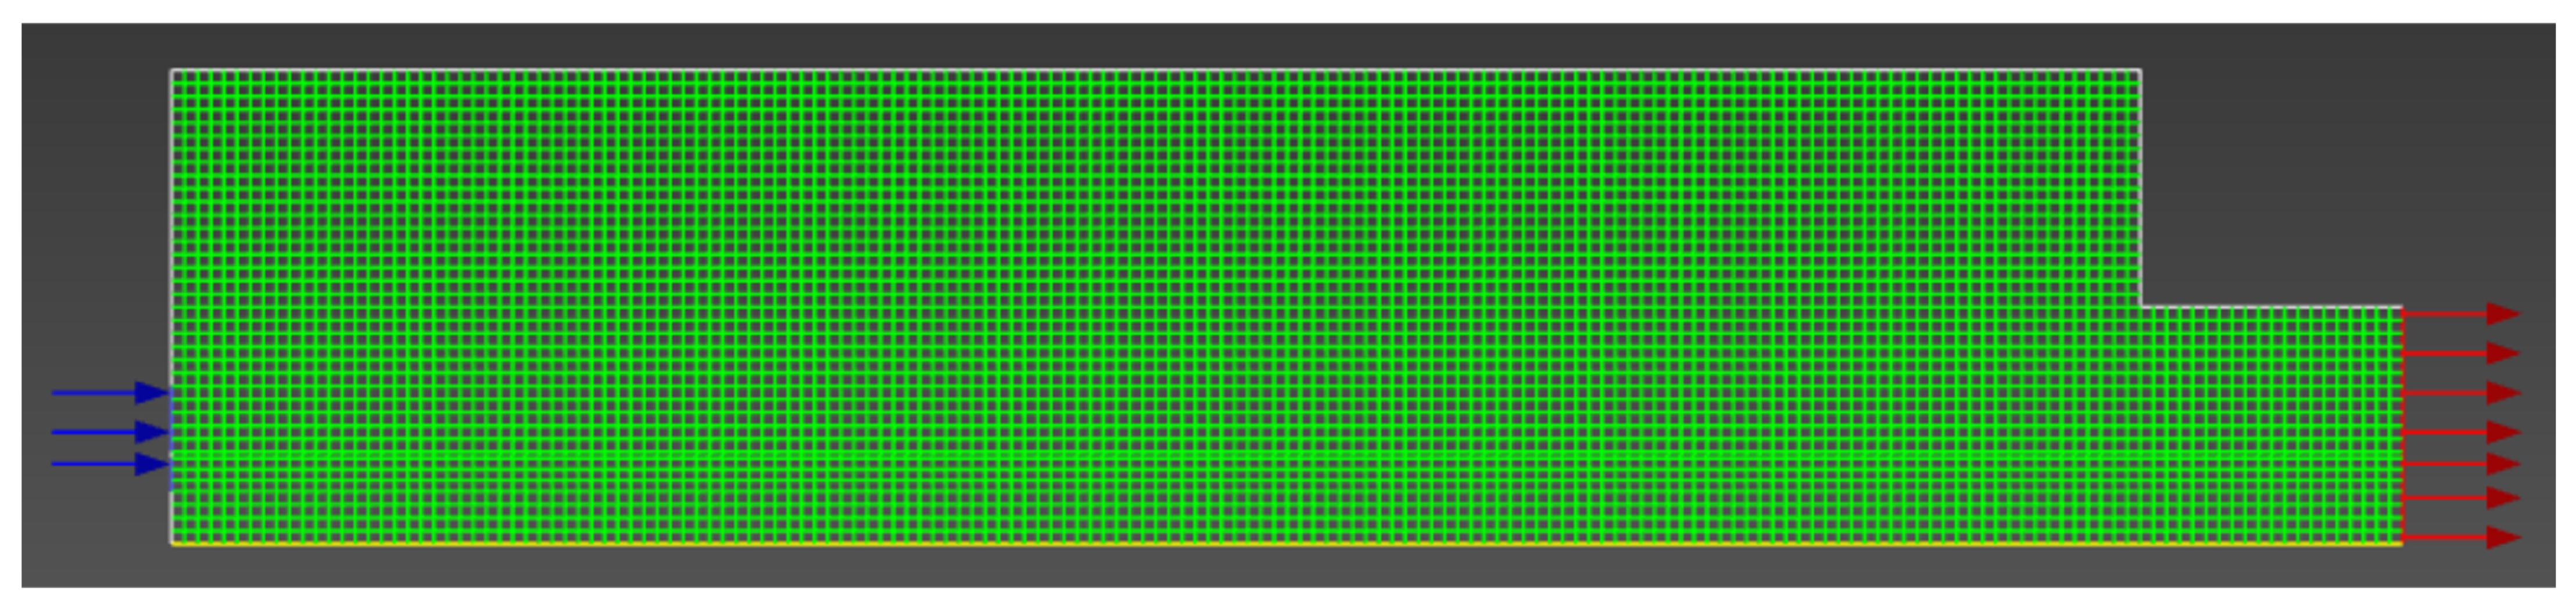
9] for LESs. The 2D domain is shown in
Figure 2.
Because of the high computational cost of detailed combustion CFD simulations and the long completion time of the parametric sweep, an in-depth mesh independency analysis was not conducted in this work. Instead, automatic mesh refinement (AMR) on a coarse base mesh was used to optimize cell size and fidelity. Using three refinement levels on a 1 mm base mesh allows for minimum cell sizes of roughly 0.125 mm. This size is desirable due to ammonia–air flames typically being around 1 mm [
16] in thickness, with some variations in that value depending on the conditions of the gas mixture. The minimum refined cell size allows for about 10 cells to span the thickness of the flame without excessive refinement, enabling smoother temperature and species gradients from the unburned to burnt region. This flame refinement is facilitated by the preset combustion AMR criteria available in Ansys Fluent. Also, another AMR criteria set was enabled that ensures a Y+ value of 1 on every wall in the domain to coincide with the choice of the k-ω SST turbulence model for the simulation sweeps.
2.4. Combustion Modeling
Solving the ordinary differential equation (ODE) system that describes a chemical reaction mechanism is often the most computationally intensive aspect of CFD simulations that incorporate detailed combustion modeling. Reduced-order flamelet methods are often used to significantly speed up simulation times by solving for the flame chemistry before the CFD simulation and then parametrizing the resulting thermochemistry data into a multidimensional lookup table using one or more control variables, such as the mixture fraction [
17]. These control variables are given transport equations in the CFD solver, replacing the in situ ODE calculations so that the computer can spend more computational resources on solving the fluid flow equations. Unfortunately, these reduced-order methods sacrifice some chemical accuracy for the sake of speed, and this tends to disproportionally affect the formation accuracy of ppm-level species like NO
x over the bulk product species like H
2O. To keep things simple, the parametric sweeps conducted in this work will use a detailed chemistry model to more accurately capture the NO
x formation from the CFD simulations with minimal user input, forgoing the speed granted by flamelet models.
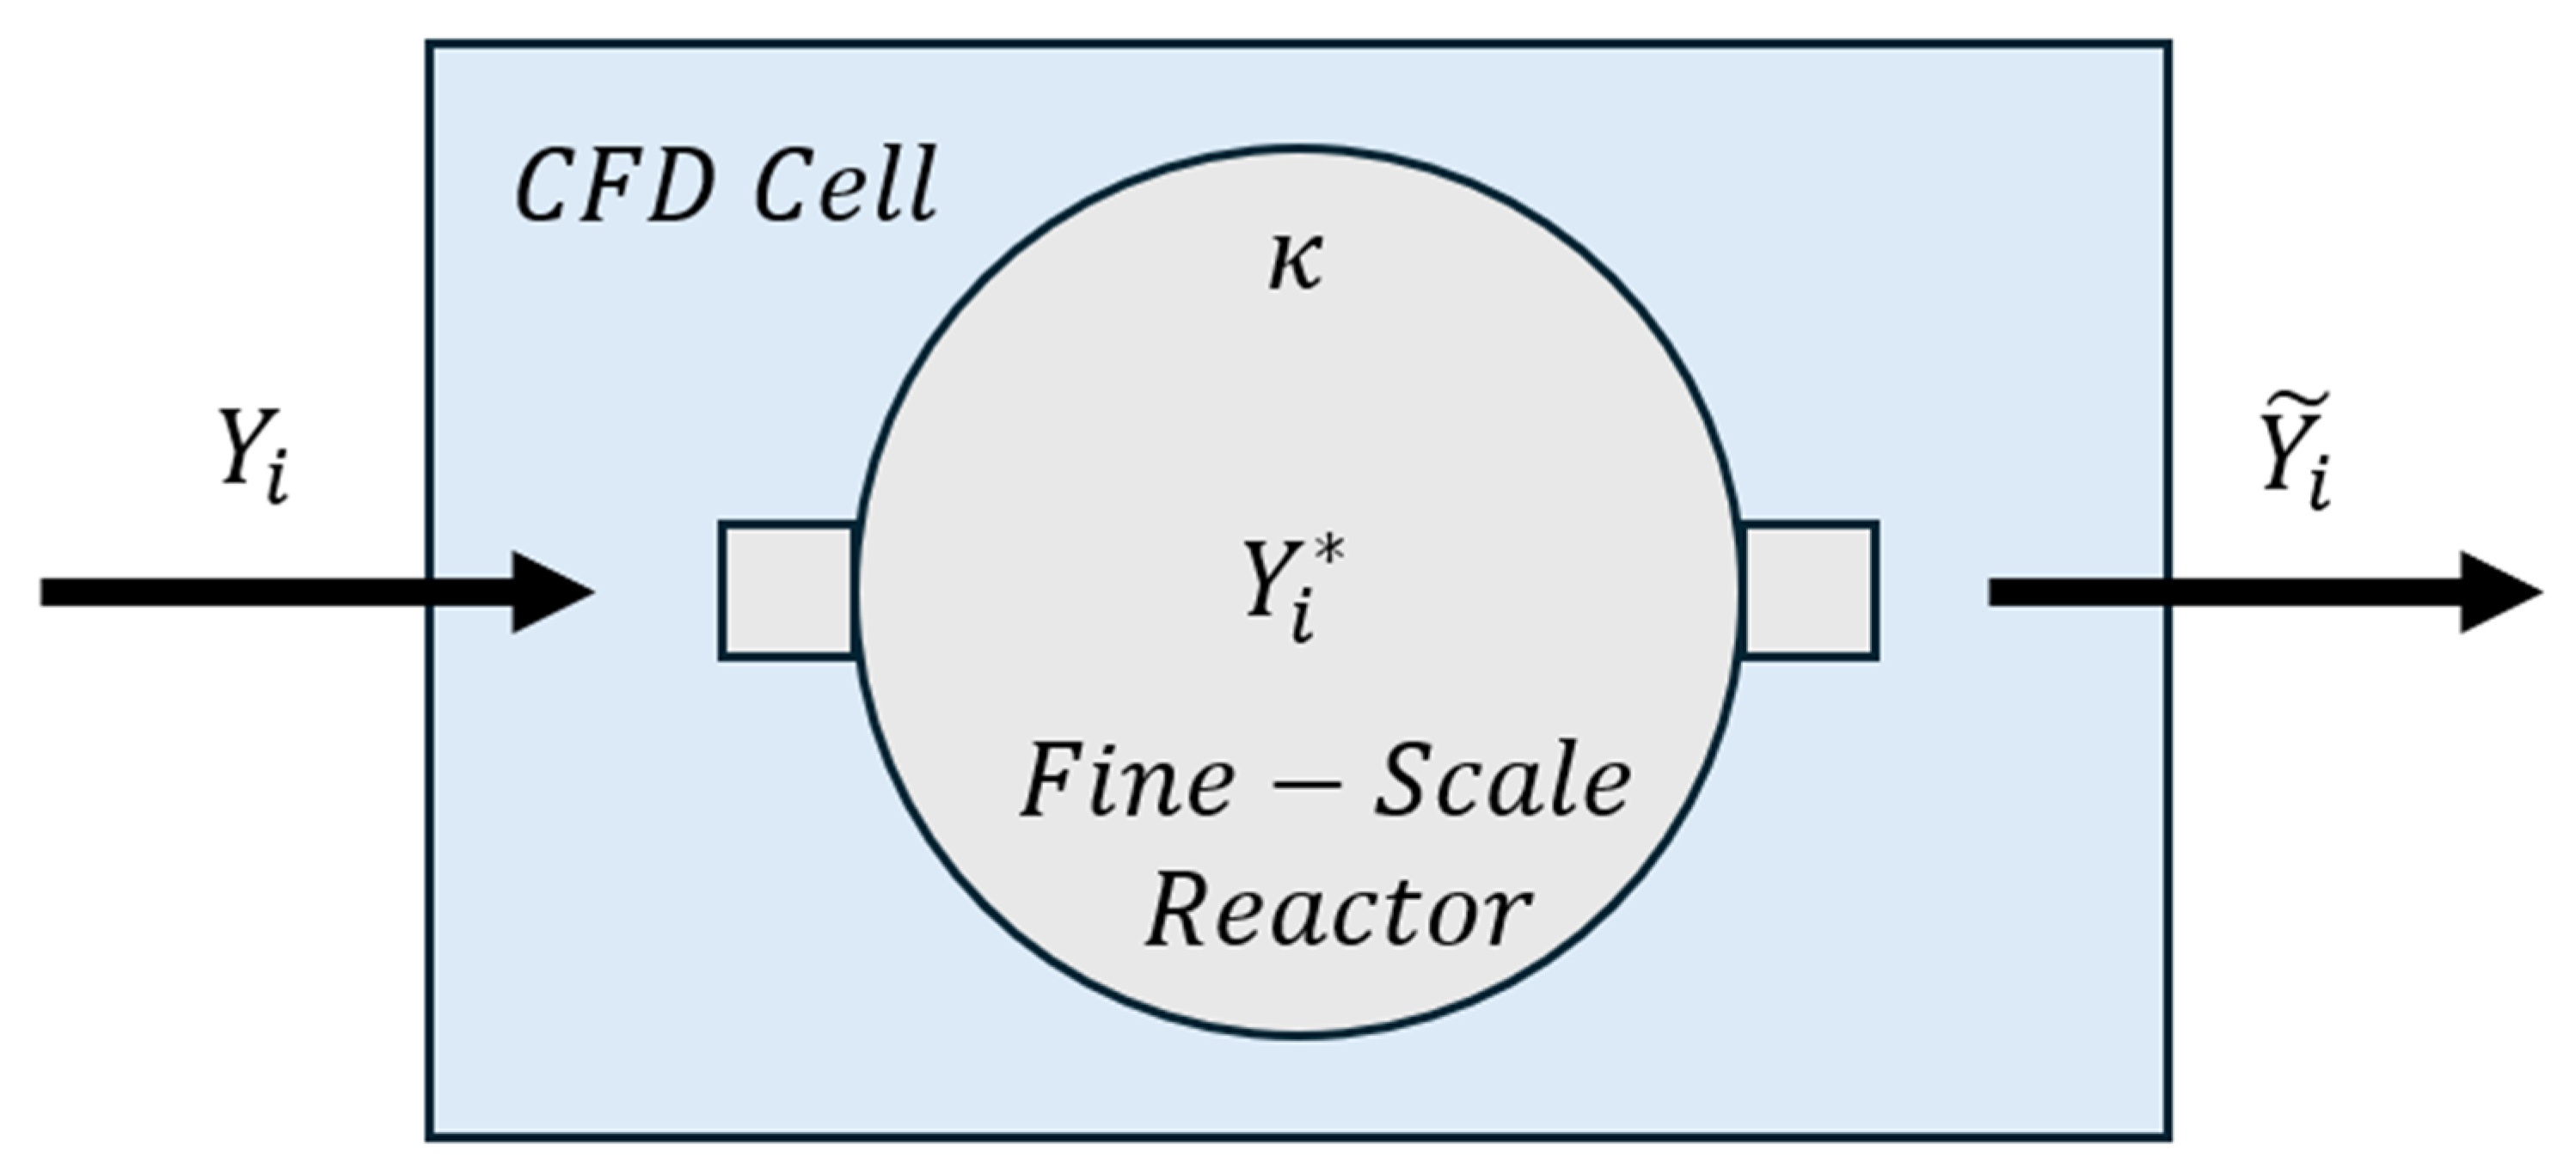
The simulations in the parametric sweeps employ the Eddy Dissipation Concept–Partially Stirred Reactor (EDC-PaSR) model available in Ansys Fluent. This model accounts for the effect of turbulence on combustion by assuming that chemical reactions occur within small turbulent structures, or fine scales, where reactants are thoroughly mixed [
18]. Within each computational cell, the fine-scale volume fraction κ is calculated according to Equation (4):
where
tc,
tmix, and
Da are the chemical time scale, mixing time scale, and Damköhler number, respectively. Reactions within these fine scales are treated as occurring in a constant-pressure reactor. The inflow to the surrounding cell provides the initial conditions, and the resulting species composition is returned to the bulk flow, forming the basis of the partially stirred reactor approach. A schematic depicting a domain cell within the EDC-PaSR model is shown in
Figure 3 [
19].
The chemical time scale is computed from Equation (5) [
20]:
where
Yi and
ωi are the mass fraction and reaction rate of species CH
4, H
2, O
2, CO, or CO
2. These species are selected because they often participate in the slowest, or rate-limiting, reactions [
20]. The mixing time scale is calculated using Equations (6) through (8) [
18] based on the integral time scale of large turbulent structures and the fractal dimension D, which relates to the range of turbulent scales resolved [
19]. Fluent uses a default D value of 4, which provides results consistent with experimental data [
21].
Cµ is the empirical constant used in the turbulence model and
is the turbulent Reynolds number.
The smaller of the chemical and mixing time scales is used to integrate the chemical kinetics within the fine-scale reactor with Equation (9):
The net source term for species i in the bulk computational cell is given by Equation (10):
where
ρ is the bulk mixture density,
Yi* is the species mass fraction after reaction in the fine-scale reactor, and
Yi is the species mass fraction in the bulk cell. This source term
Ri incorporates the combined effects of turbulence and chemistry, providing greater accuracy than finite-rate chemistry alone.
2.5. Simulation Inputs and Setup
In the Ref. [
9] experimental setup and CFD simulations, it was stated that a velocity magnitude of 4.5 m/s was used for the inlet air that was preheated to 500 K at 1 bar, or about 1 atm. Using the ideal gas law, the air temperature, and the chamber operating pressure, the air density can be calculated and then used with the axial component of the swirling velocity magnitude to calculate the mass flow rate. Using a mass flow rate inlet for the air allows for the quick calculation of the mass flow rate of the fuel corresponding to a given equivalence ratio. Using an air temperature of 500 K, a chamber operating pressure of 1 atm, the axial swirler geometry provided earlier in the present article, and an air velocity magnitude of 4.5 m/s, the air mass flow rate is easily calculated to be about 0.668 g/s. The pure ammonia fuel used in the reference experiments and CFD simulations was injected at a temperature of 300 K.
Table 2 tabulates the base CFD boundary conditions that are to be used for the simulation sweeps.
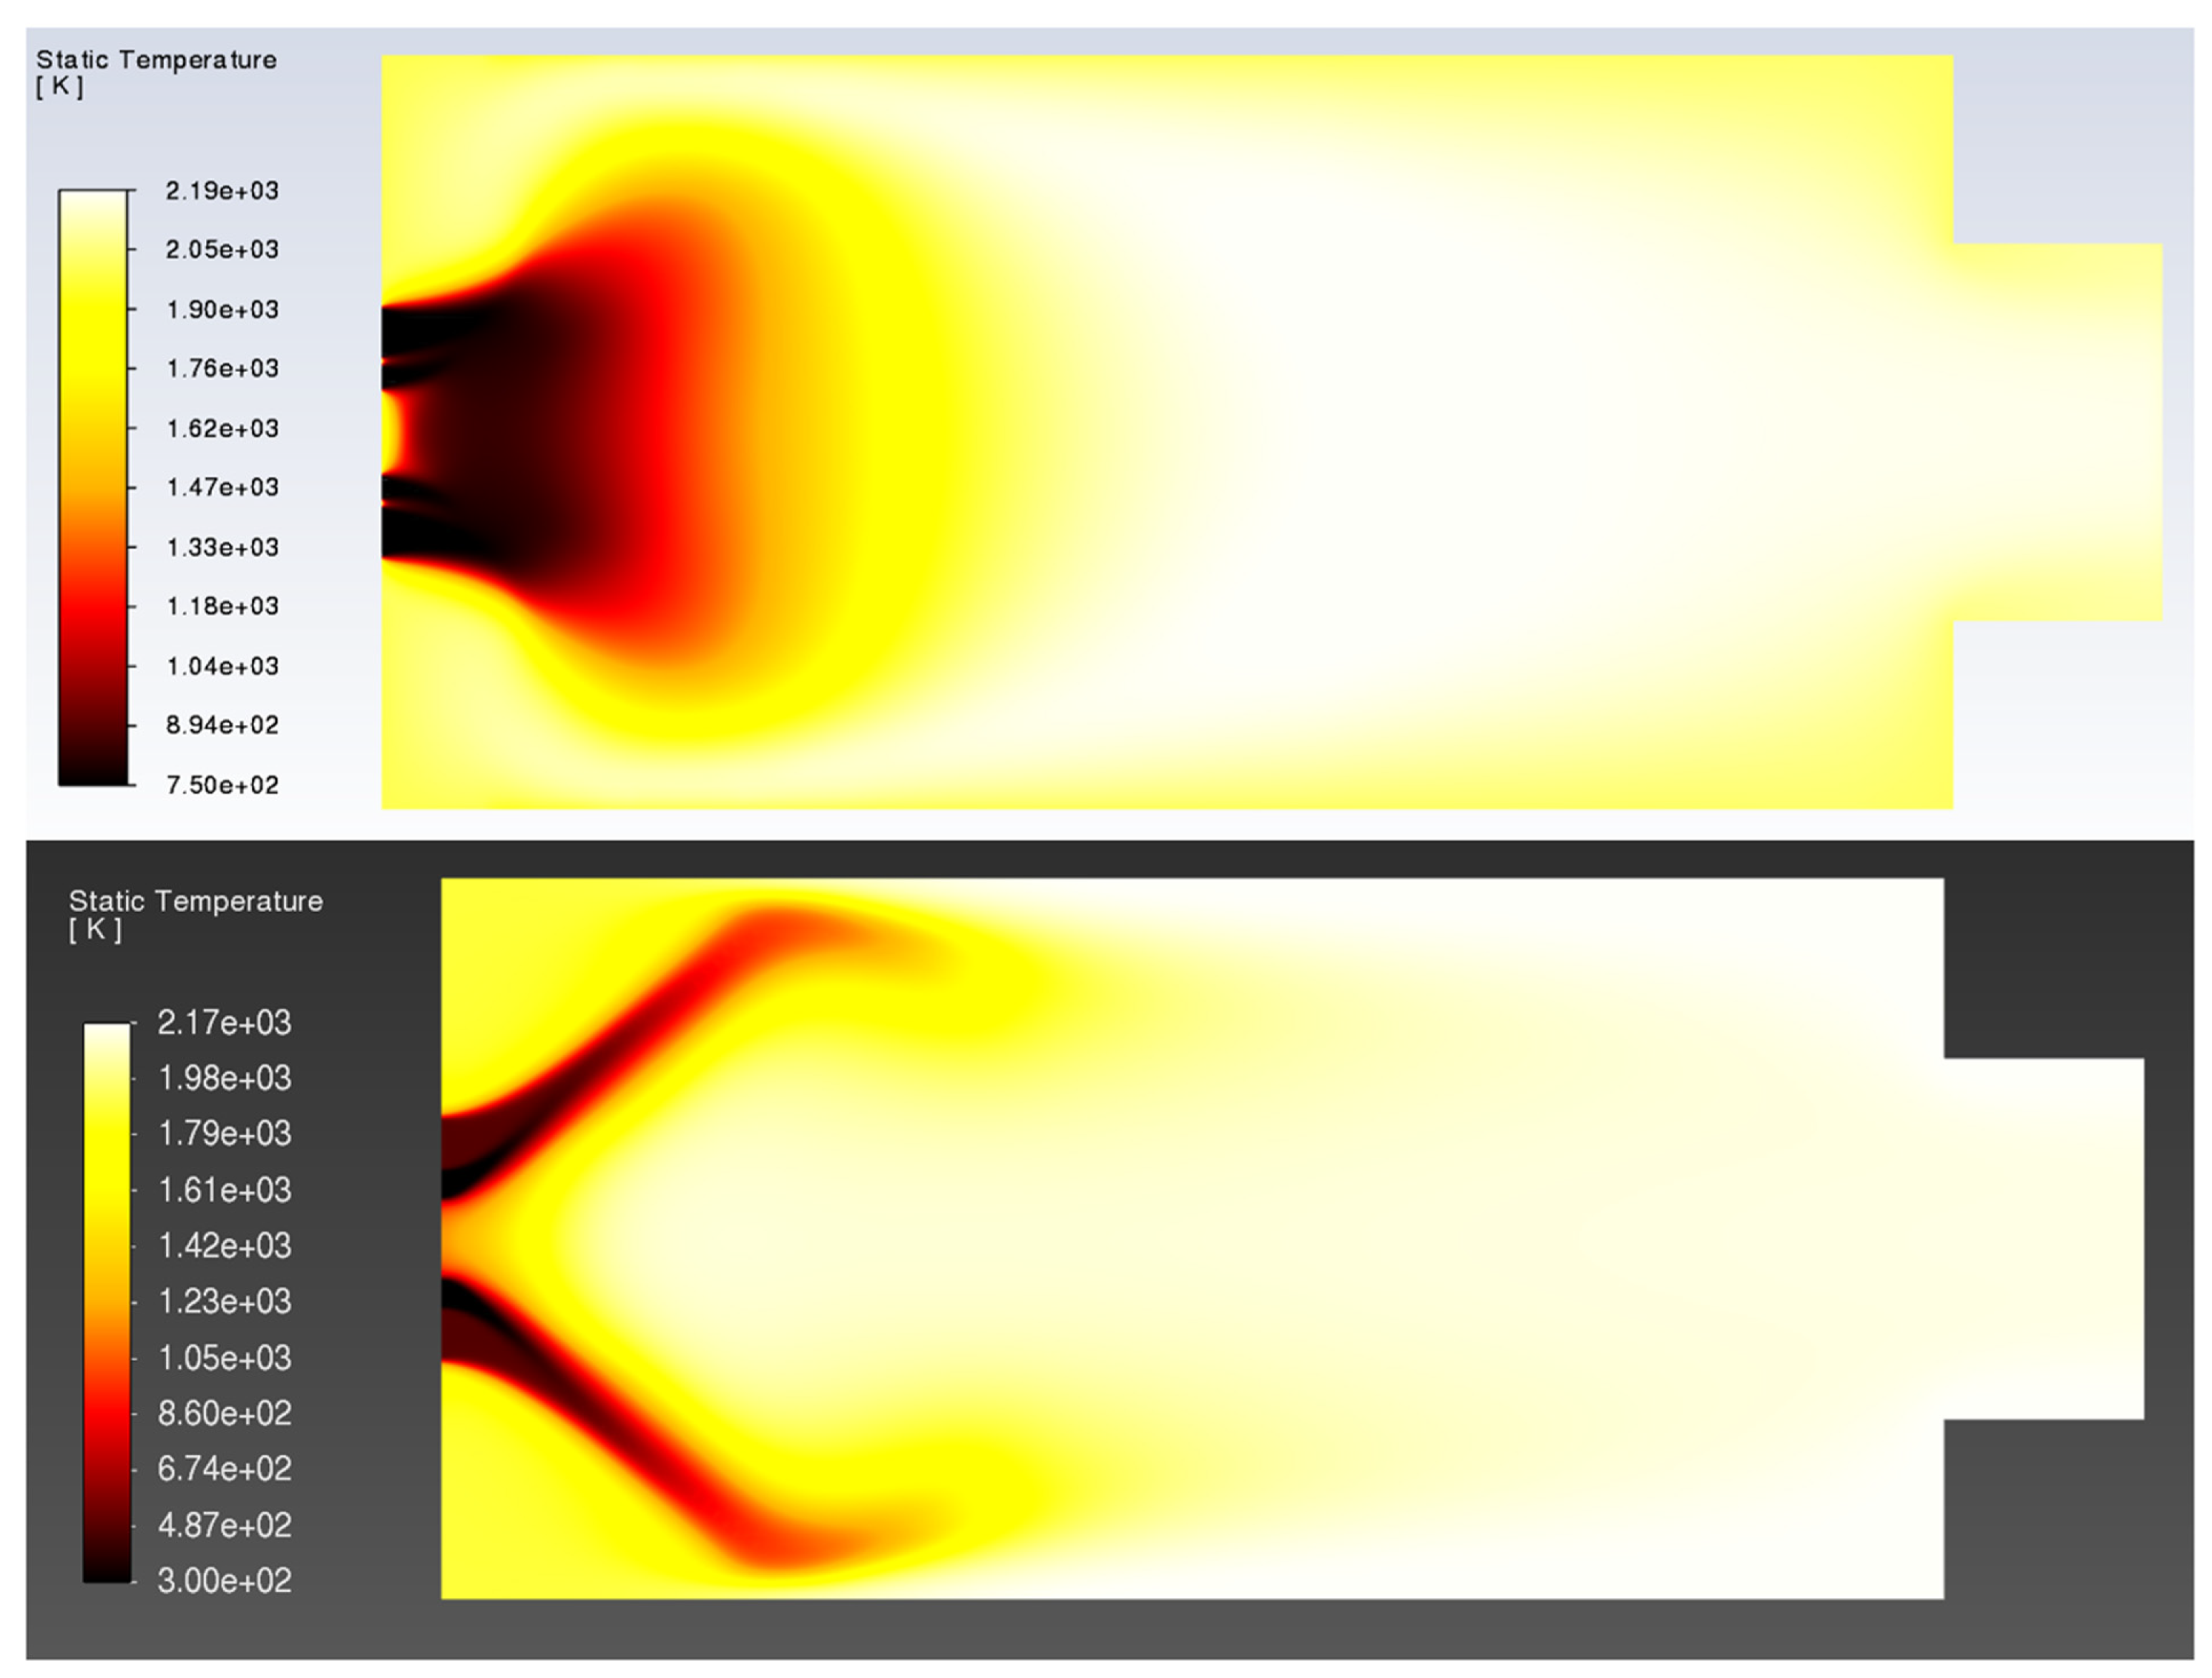
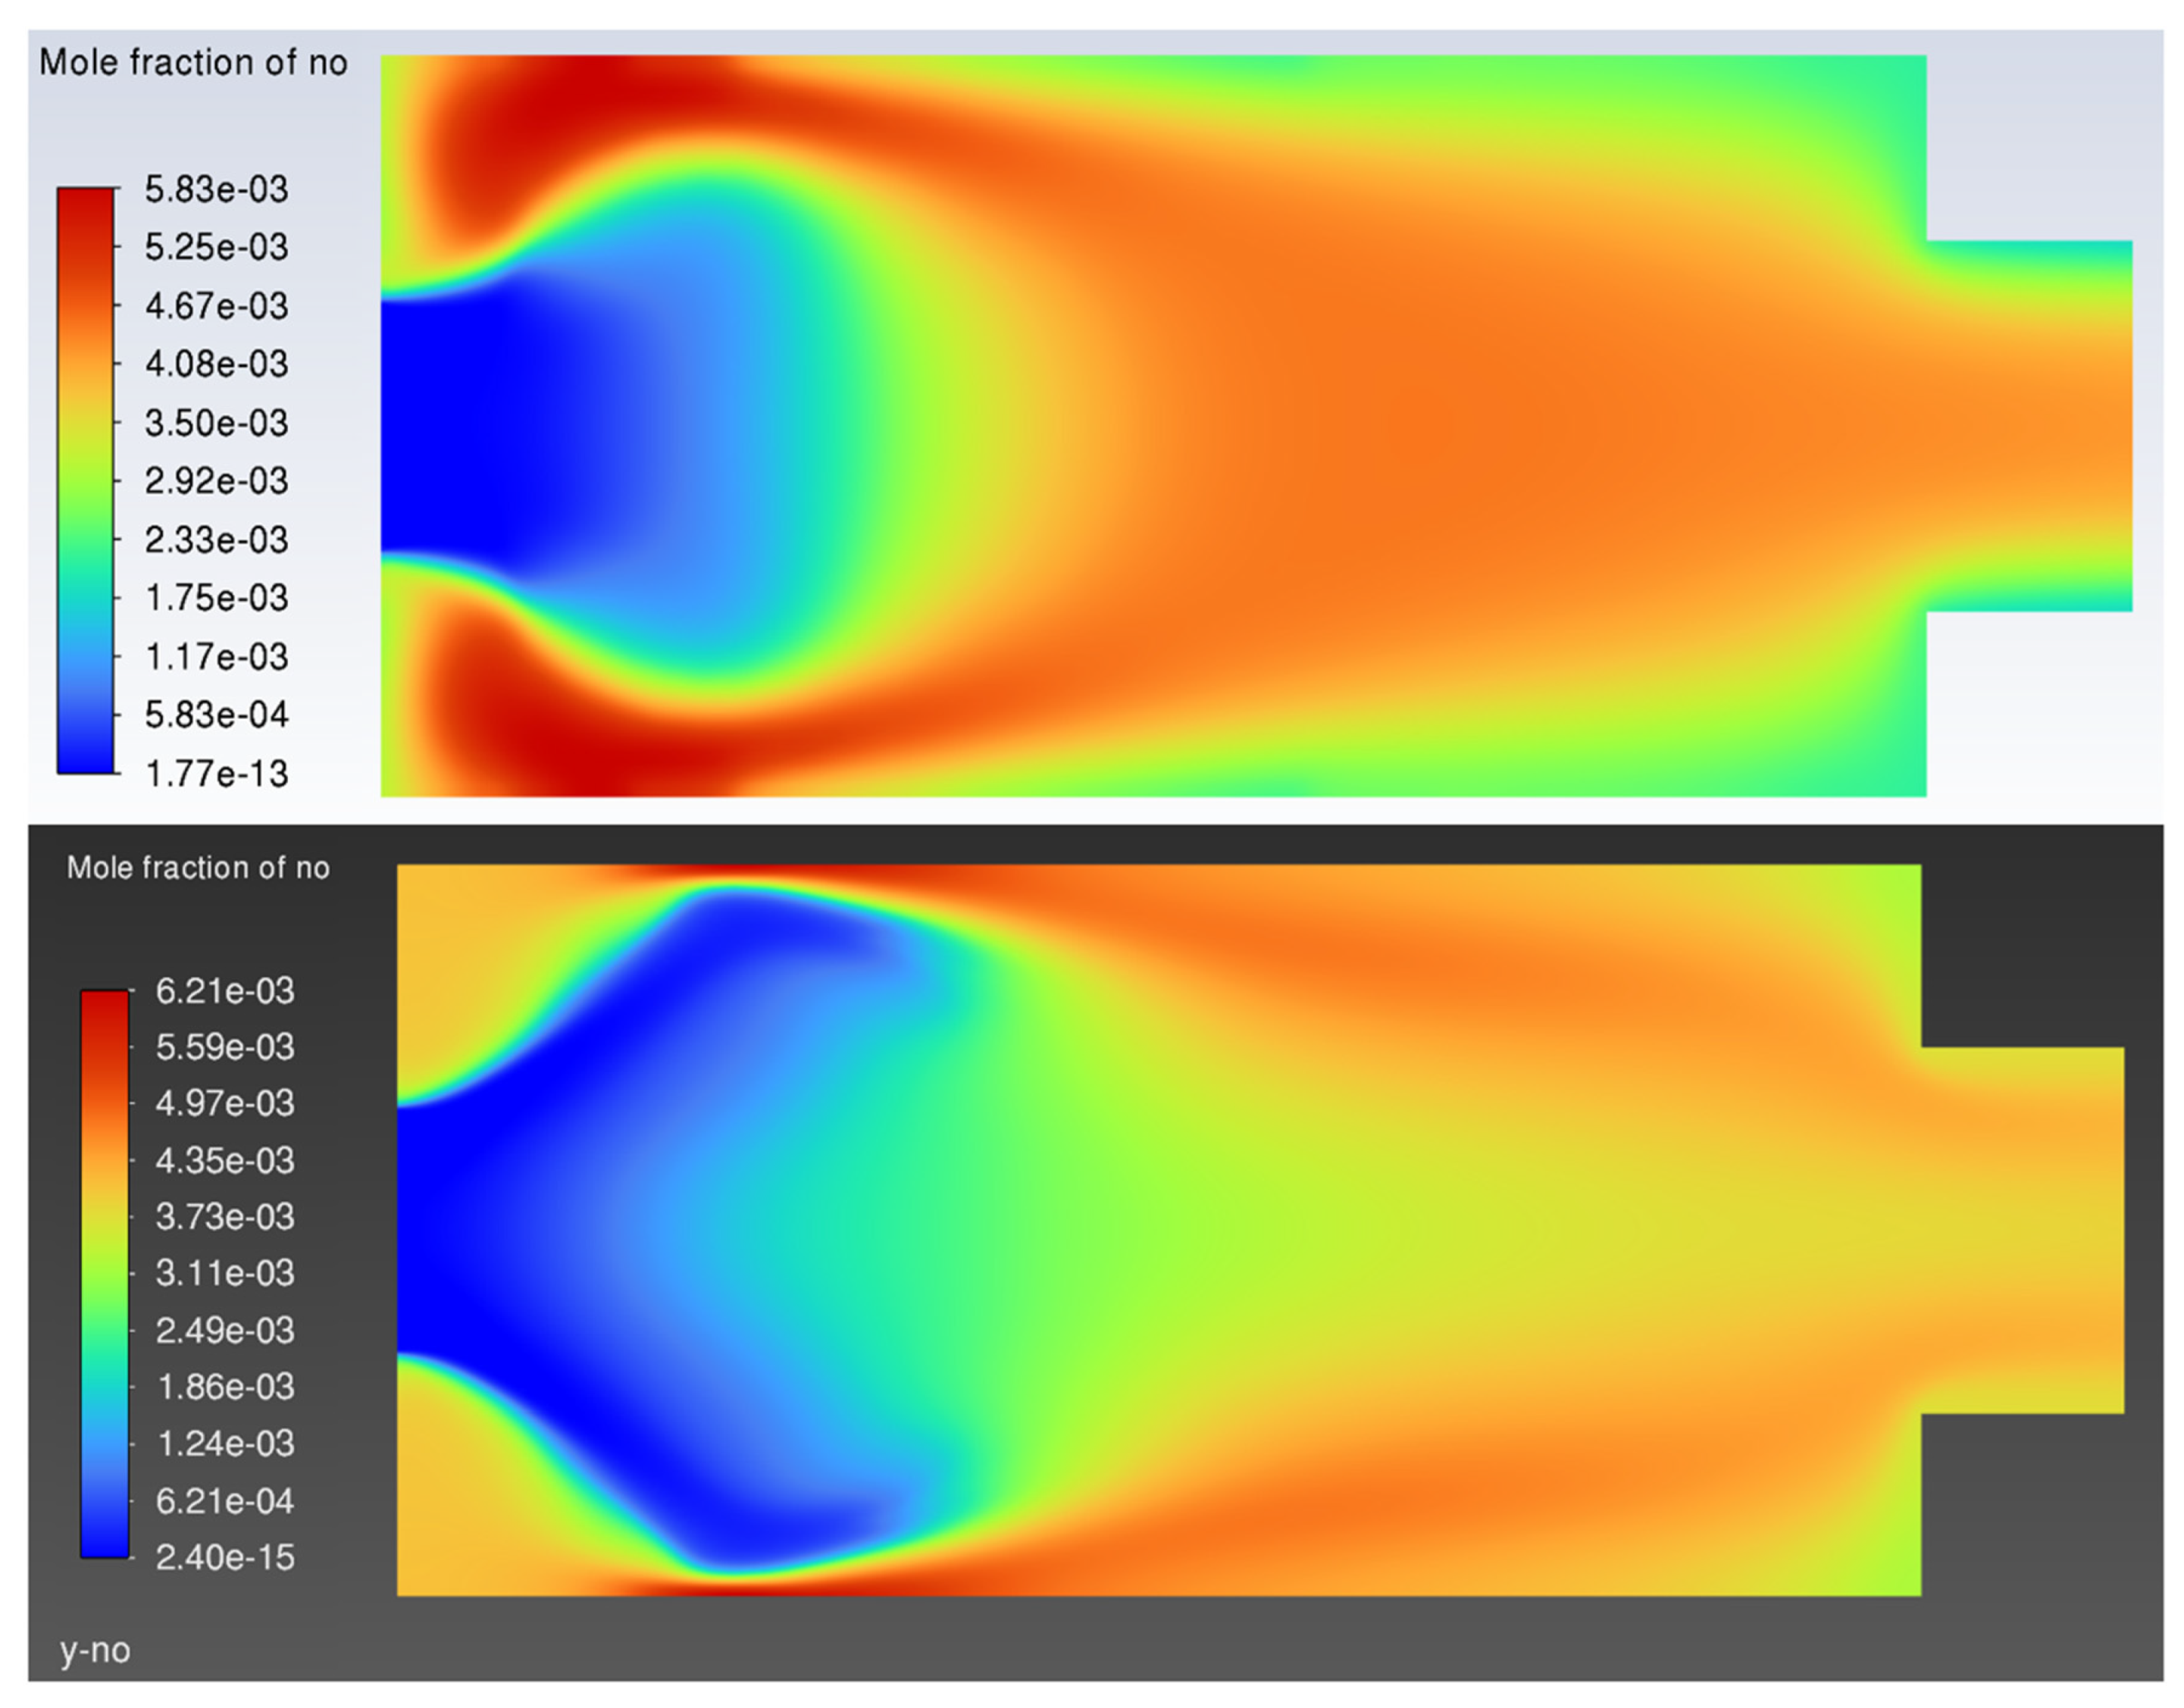
It has been found in preliminary simulations utilizing the Realizable k-ε turbulence models that the ammonia flame consistently blows out under inlet conditions that Ref. [
9] reports as producing a stable flame during experiments and LESs. Ignition could only be achieved by preheating the fuel and air above what the article used. It has been illustrated in the literature that the choice of turbulence models in swirling flow can produce fundamentally different structures of the inner recirculation zone (IRZ). According to Ref. [
22], which conducted experiments and CFD simulations on a cylindrical NH
3/H
2 combustor, the k-ε models tend to produce one recirculating structure within the bulk swirling flow, which disagrees with the experiments in the article and is most likely the cause of the discrepancy in the flame behavior in the Realizable k-ε simulations in this work’s preliminary simulations. The experiments in the article showed that there are two distinct IRZs that form in the swirling flow, and the k-ε models failed to match this behavior. The k-ω SST, Reynolds Stress with Quadratic Pressure-Strain (RSM-QPS), and Large Eddy Simulation (LES) turbulence models produced the two IRZs in agreement with the Ref. [
22] experiments. For this work, the k-ω SST model was used in a test simulation using the inlet conditions from Ref. [
9], and ignition was achieved along with a flame structure that visually resembles the LES simulations in Ref. [
9] more closely than the simulations using a k-ε model. Because of this, the k-ω SST turbulence model was used for the parametric sweeps in this work due to it being the computationally cheapest alternative.
Figure 4 and
Figure 5 illustrate the change in behavior of the flames using the two turbulence models.
The Stagni 2023 mechanism [
6] was used for the chemical kinetics modeling due to its demonstrated accuracy for ammonia combustion at low and intermediate temperatures and contains 31 species and 203 reactions [
23]. The ideal gas model was applied to capture variable density. The CHEMKIN-CFD solver was used along with In situ Adaptive Tabulation (ISAT) acceleration to model to handle the chemistry calculations. The Dynamic Cell Clustering (DCC) acceleration tool was not enabled as it can add a considerable amount of simulation instability when coupled with ISAT.
The simulations for the combustion sweep were run in steady-state for a maximum of 799 iterations to allow for three AMR triggers to occur, once every 200 iterations. The pseudo-transient Coupled solver was chosen for the pressure-velocity coupling, with a Time Scale Factor of 0.1, so that every cell in the domain uses the same chemical integration time step. The turbulence model, as stated earlier, is chosen to be the k-ω SST due to the produced flame behavior being more in-line with the CFD results in Ref. [
9]. The gradient method was Green-Gauss Node Based, and all discretizations used second-order upwind schemes.
The convergence criteria for these simulations were maintained at the default values that Ansys Fluent provides. This means that the criteria for continuity, turbulence parameters, and all species equations all had a value of 0.001. The energy equation uses a value of 1 × 10⁻⁶. It was found from preliminary simulations that the continuity and turbulence equations would consistently have residuals that fell below their default criteria. However, many of the 31 species equations that exist as part of the Stagni 2023 mechanism would never fully converge when using the CHEMKIN-CFD solver, with those that do meet their criteria being the bulk species, such as O2, N2, and H2O. However, it would be the trace species that exist at sub-ppm level, such as NNH, N, and N2H4, that would have difficulty meeting or never meet their default convergence criteria over the course of 799 iterations or beyond. The Stiff Chemistry solver is much better at forcing the trace species to converge down, but the tendency of Stiff Chemistry solver to be considerably more unstable than the CHEMKIN-CFD solver makes it an undesirable choice for this simulation sweep. Given these challenges with convergence, report definitions for outlet and maximum temperatures, NO, N2O, and other bulk species were monitored for monitoring solution convergence instead of relying solely on the residuals. Running each condition for 799 iterations was enough to ensure that the slope of these monitors was flat or had small-amplitude oscillations around a particular value, indicating good convergence.
The methodology outlined above enables a systematic assessment of ammonia cracking on combustion performance and NOx emissions. By combining fuel blend characterization, appropriate turbulence/chemistry modeling, and carefully designed parametric sweeps, the simulations provide insight into the feasibility of pre-combustion ammonia processing as a strategy for carbon-free aviation propulsion.
3. Results
This section presents the CFD results obtained from the four parametric sweeps described in the Methodology Section. The simulations examine how equivalence ratio and ammonia cracking fraction influence combustion temperature and NOx emissions. The results are first presented for pure ammonia combustion to establish a baseline for comparison. Subsequent analyses then evaluate how incremental ammonia cracking alters emissions at the peak NOx condition and finally compare these results with fully cracked ammonia combustion.
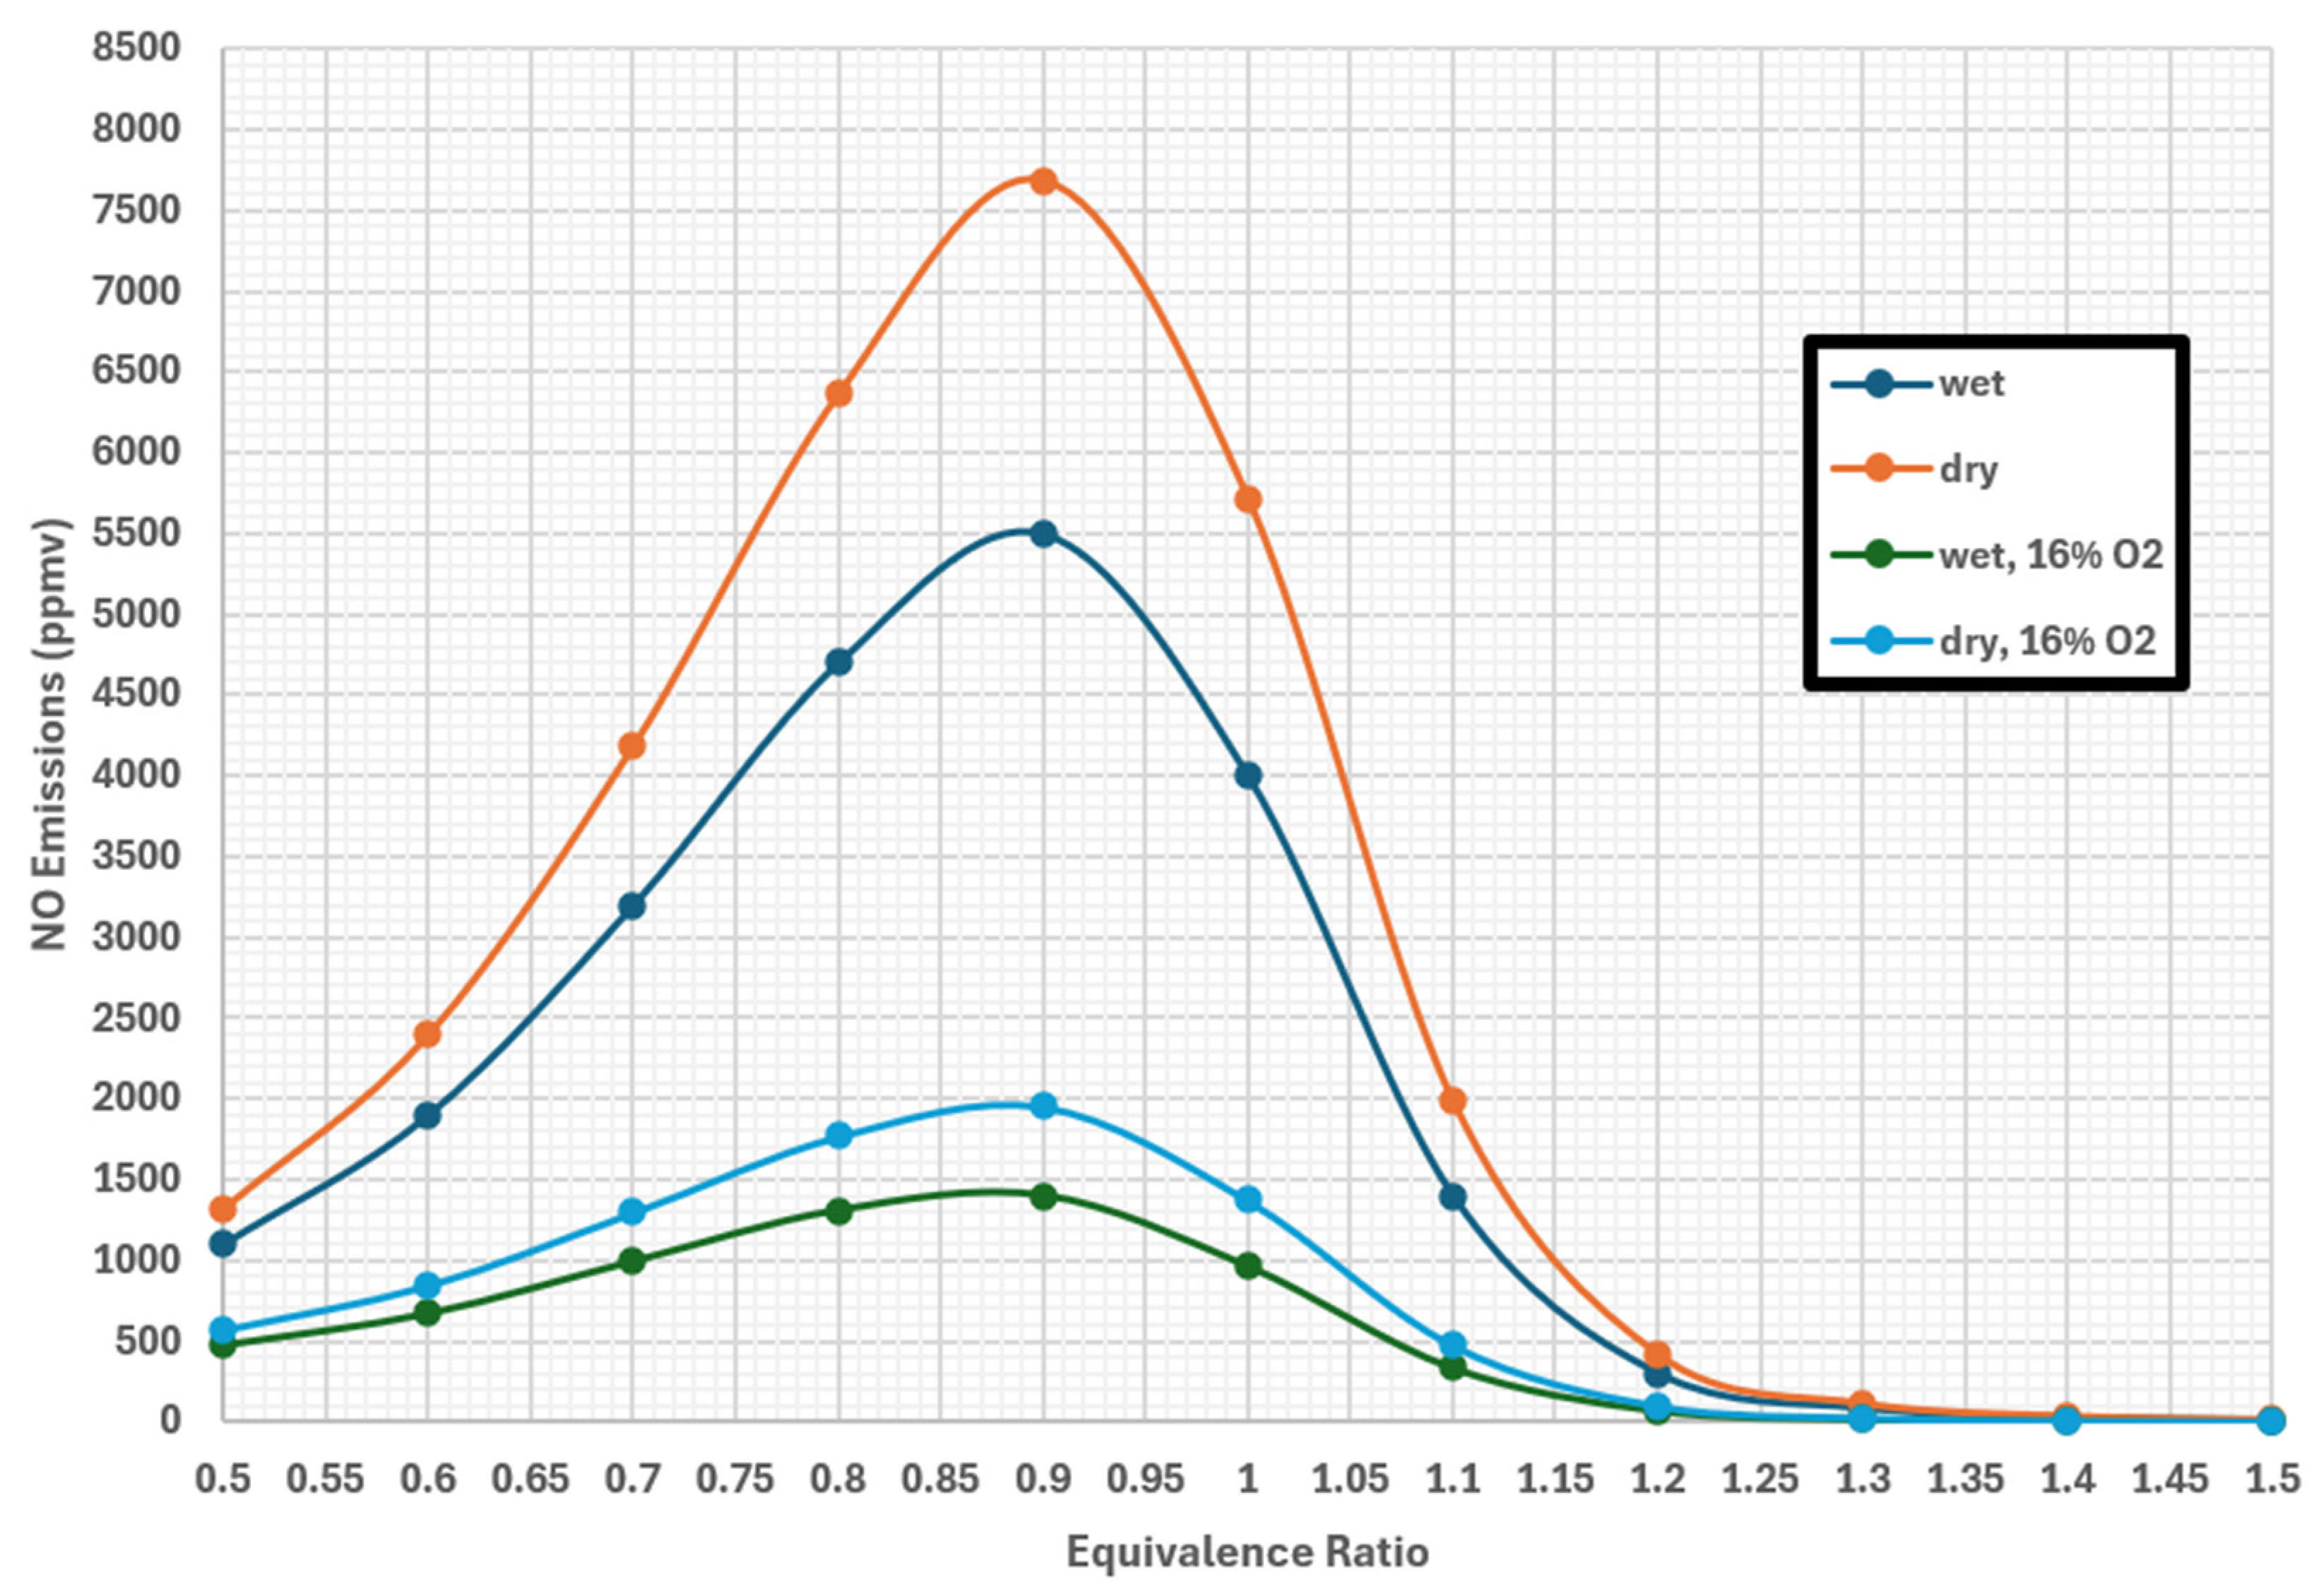
In the figures presented throughout this section, emissions are reported as parts per million by volume (ppmv). Some plots include both wet and dry concentrations, since many types of equipment that measure the composition of a gaseous mixture require that any moisture that is present first be condensed out of the machine. Dry values exclude water vapor from the exhaust composition, while wet values include it. In addition, several datasets are normalized to a reference oxygen concentration of 16% O2. This normalization is commonly used in combustion emissions reporting for industrial applications to allow for comparisons between systems operating at different excess-air conditions. The discussion that follows primarily focuses on the dry values, although other series are shown for completeness.
3.1. Sweep 1: Pure Ammonia Combustion: Equivalence Ratio Sweep
Before assessing the effects of ammonia cracking on emissions, it is necessary to establish the NO
x behavior of pure ammonia combustion.
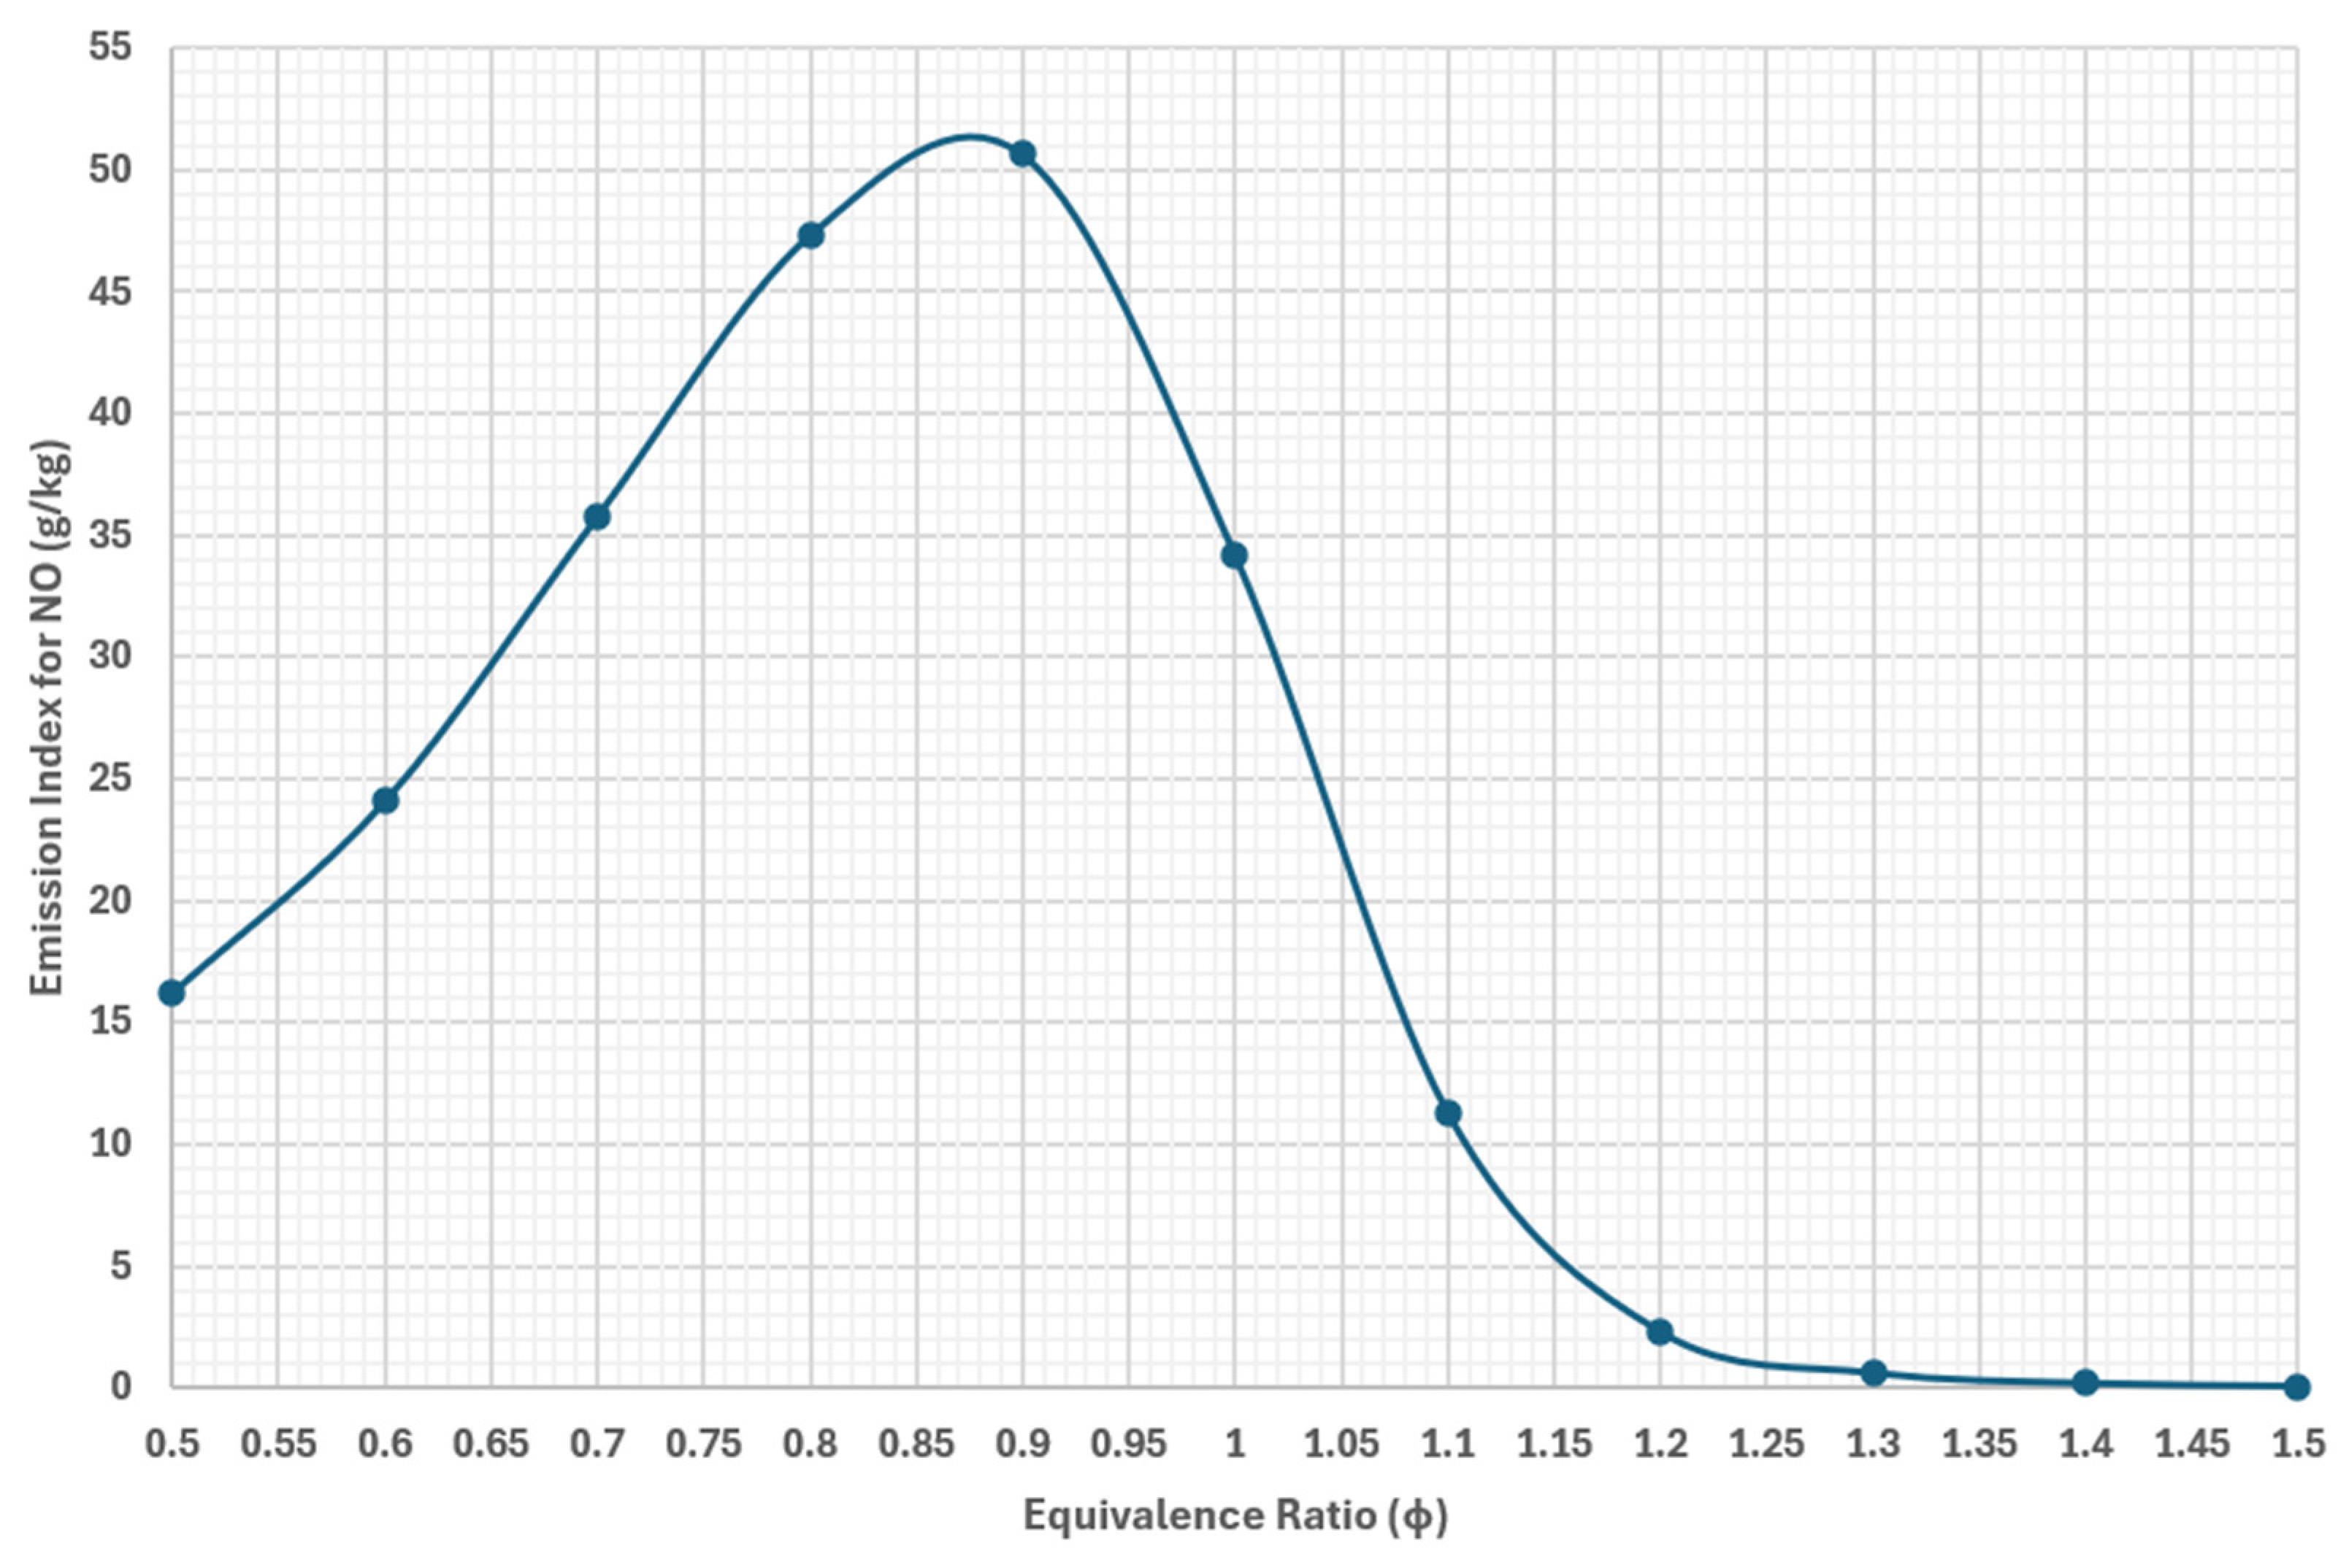
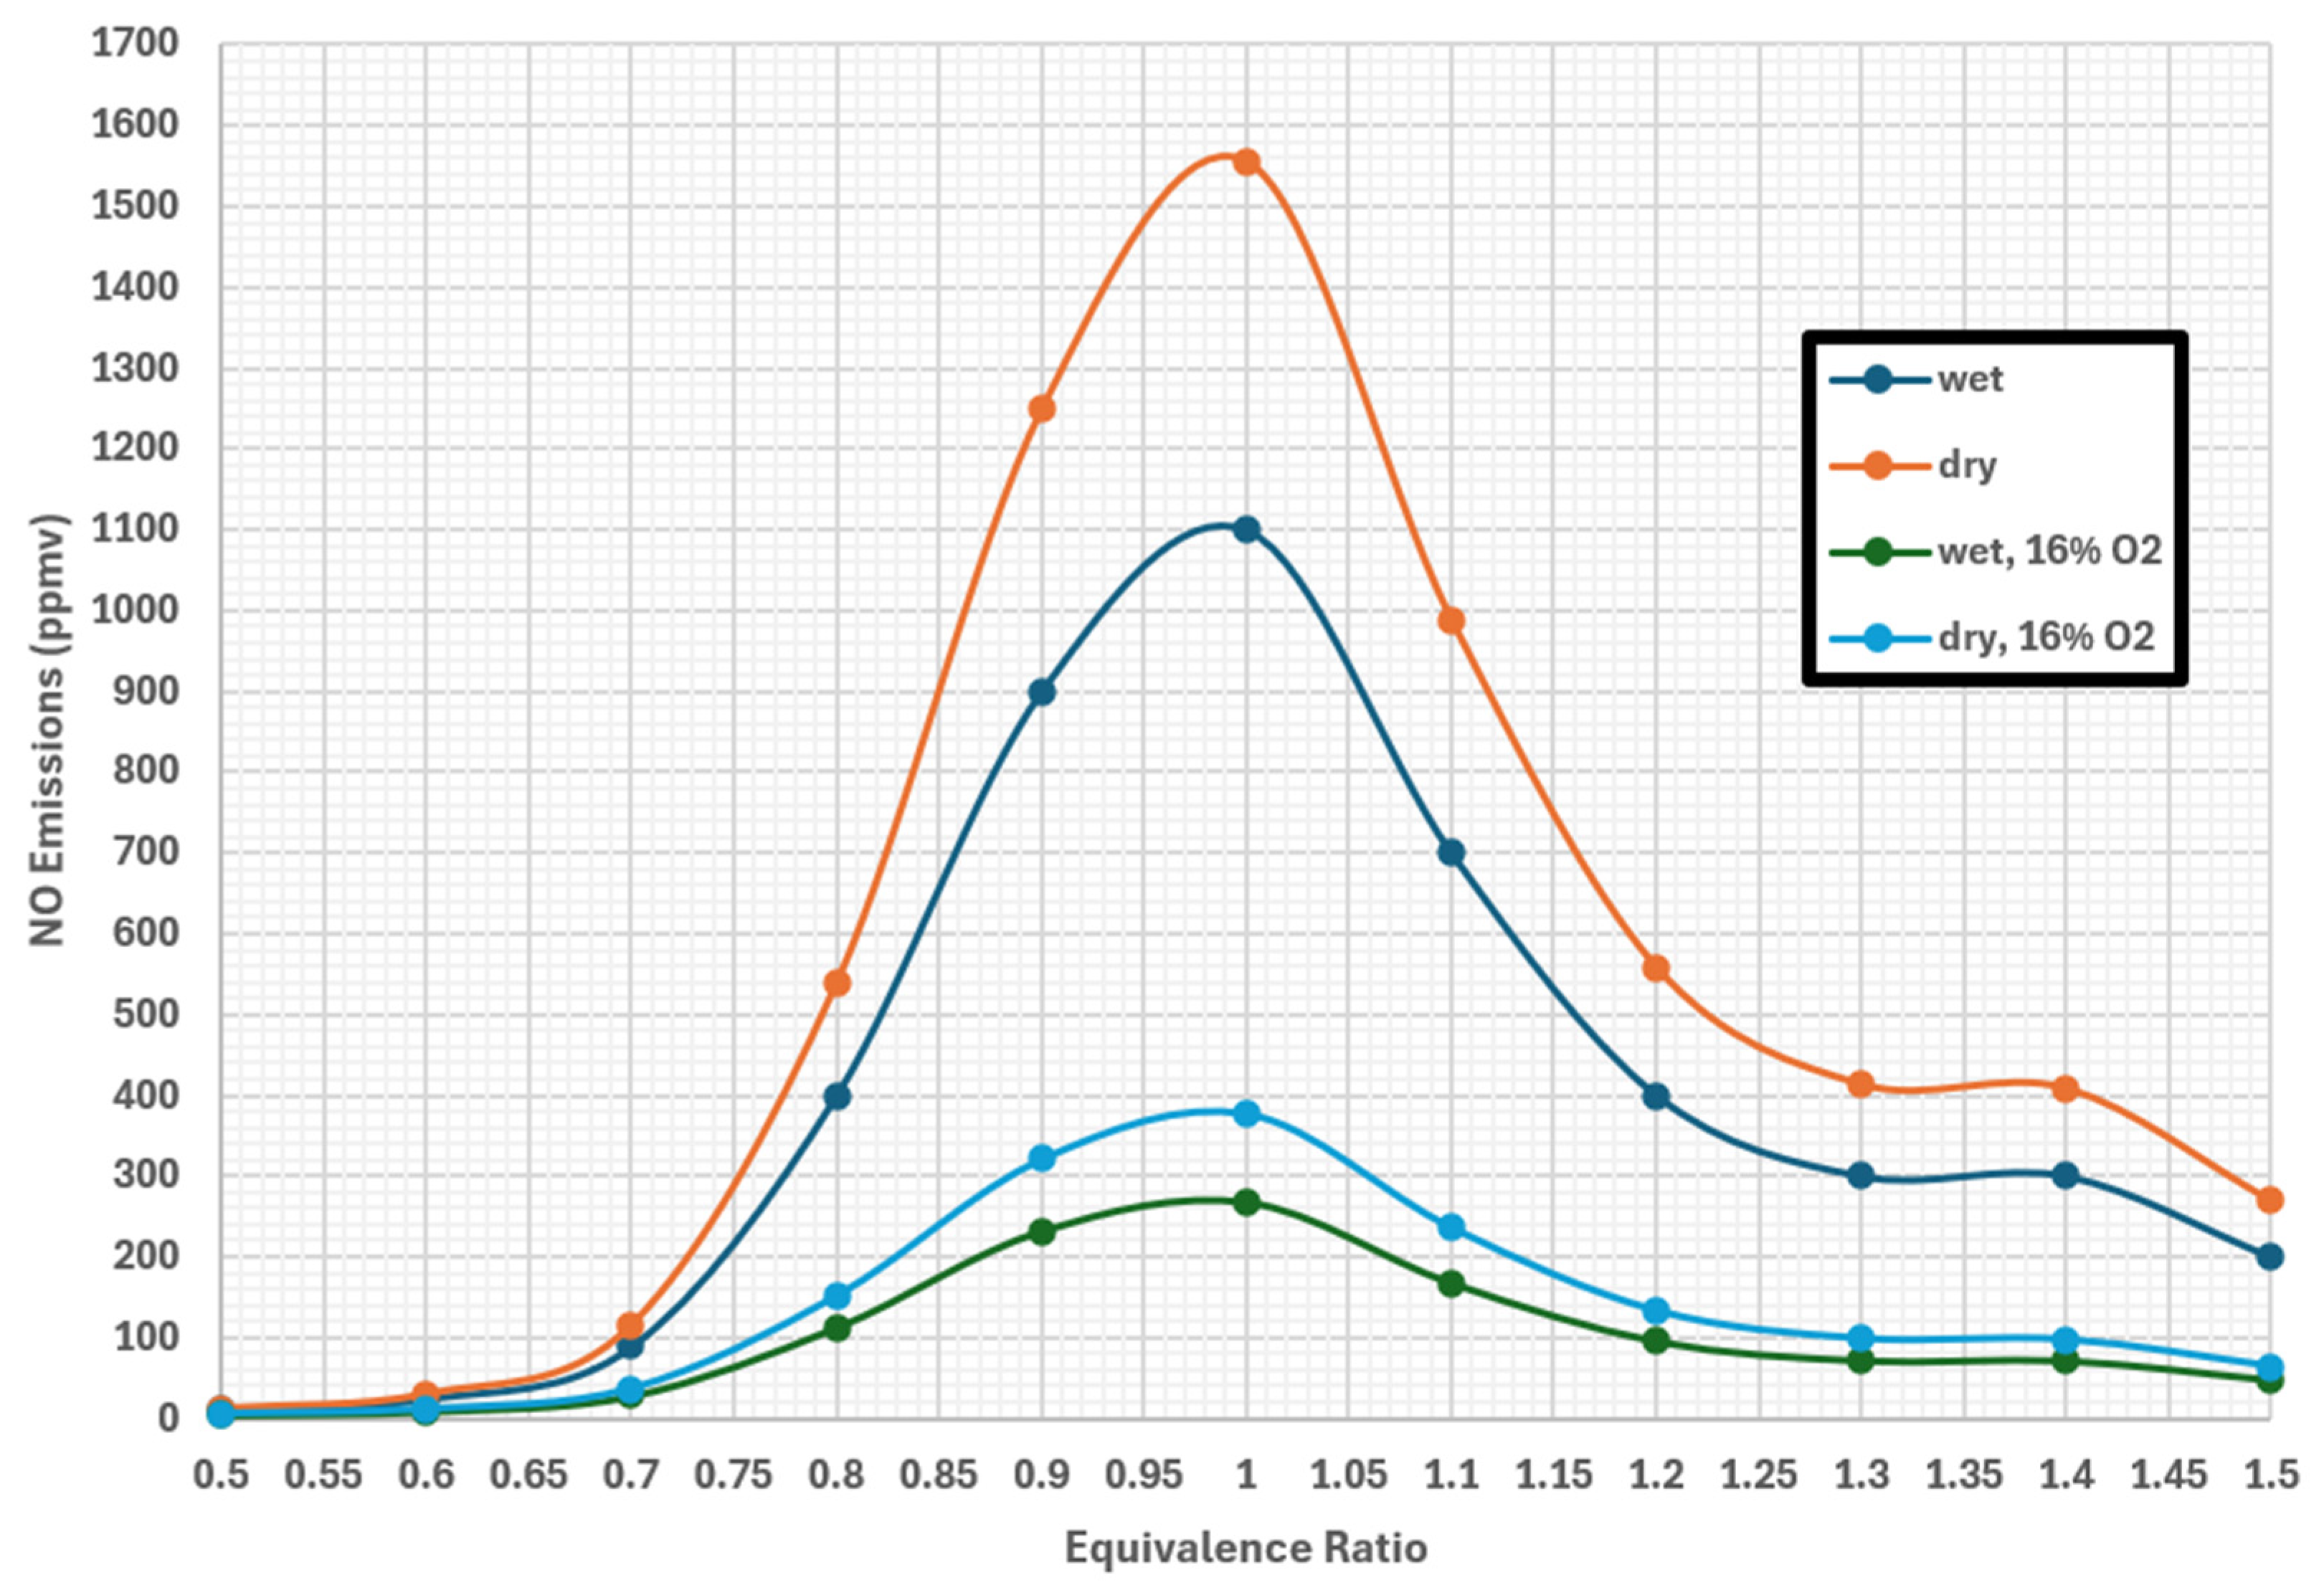
Figure 6 and
Figure 7 present the NO
x emissions obtained from the equivalence ratio sweep for preheated ammonia fuel.
Figure 6 and
Figure 7 show that pure ammonia combustion produces very high NO
x emissions in the lean-to-stoichiometric regime. NO
x emissions reach a peak value of a little over 7500 ppmv on a dry basis near an equivalence ratio of 0.9 and then follow a steep decline as the equivalence ratio progresses into the rich regime, which is a trend that generally agrees with experimental and kinetic modeling done in Refs. [
5,
8,
9,
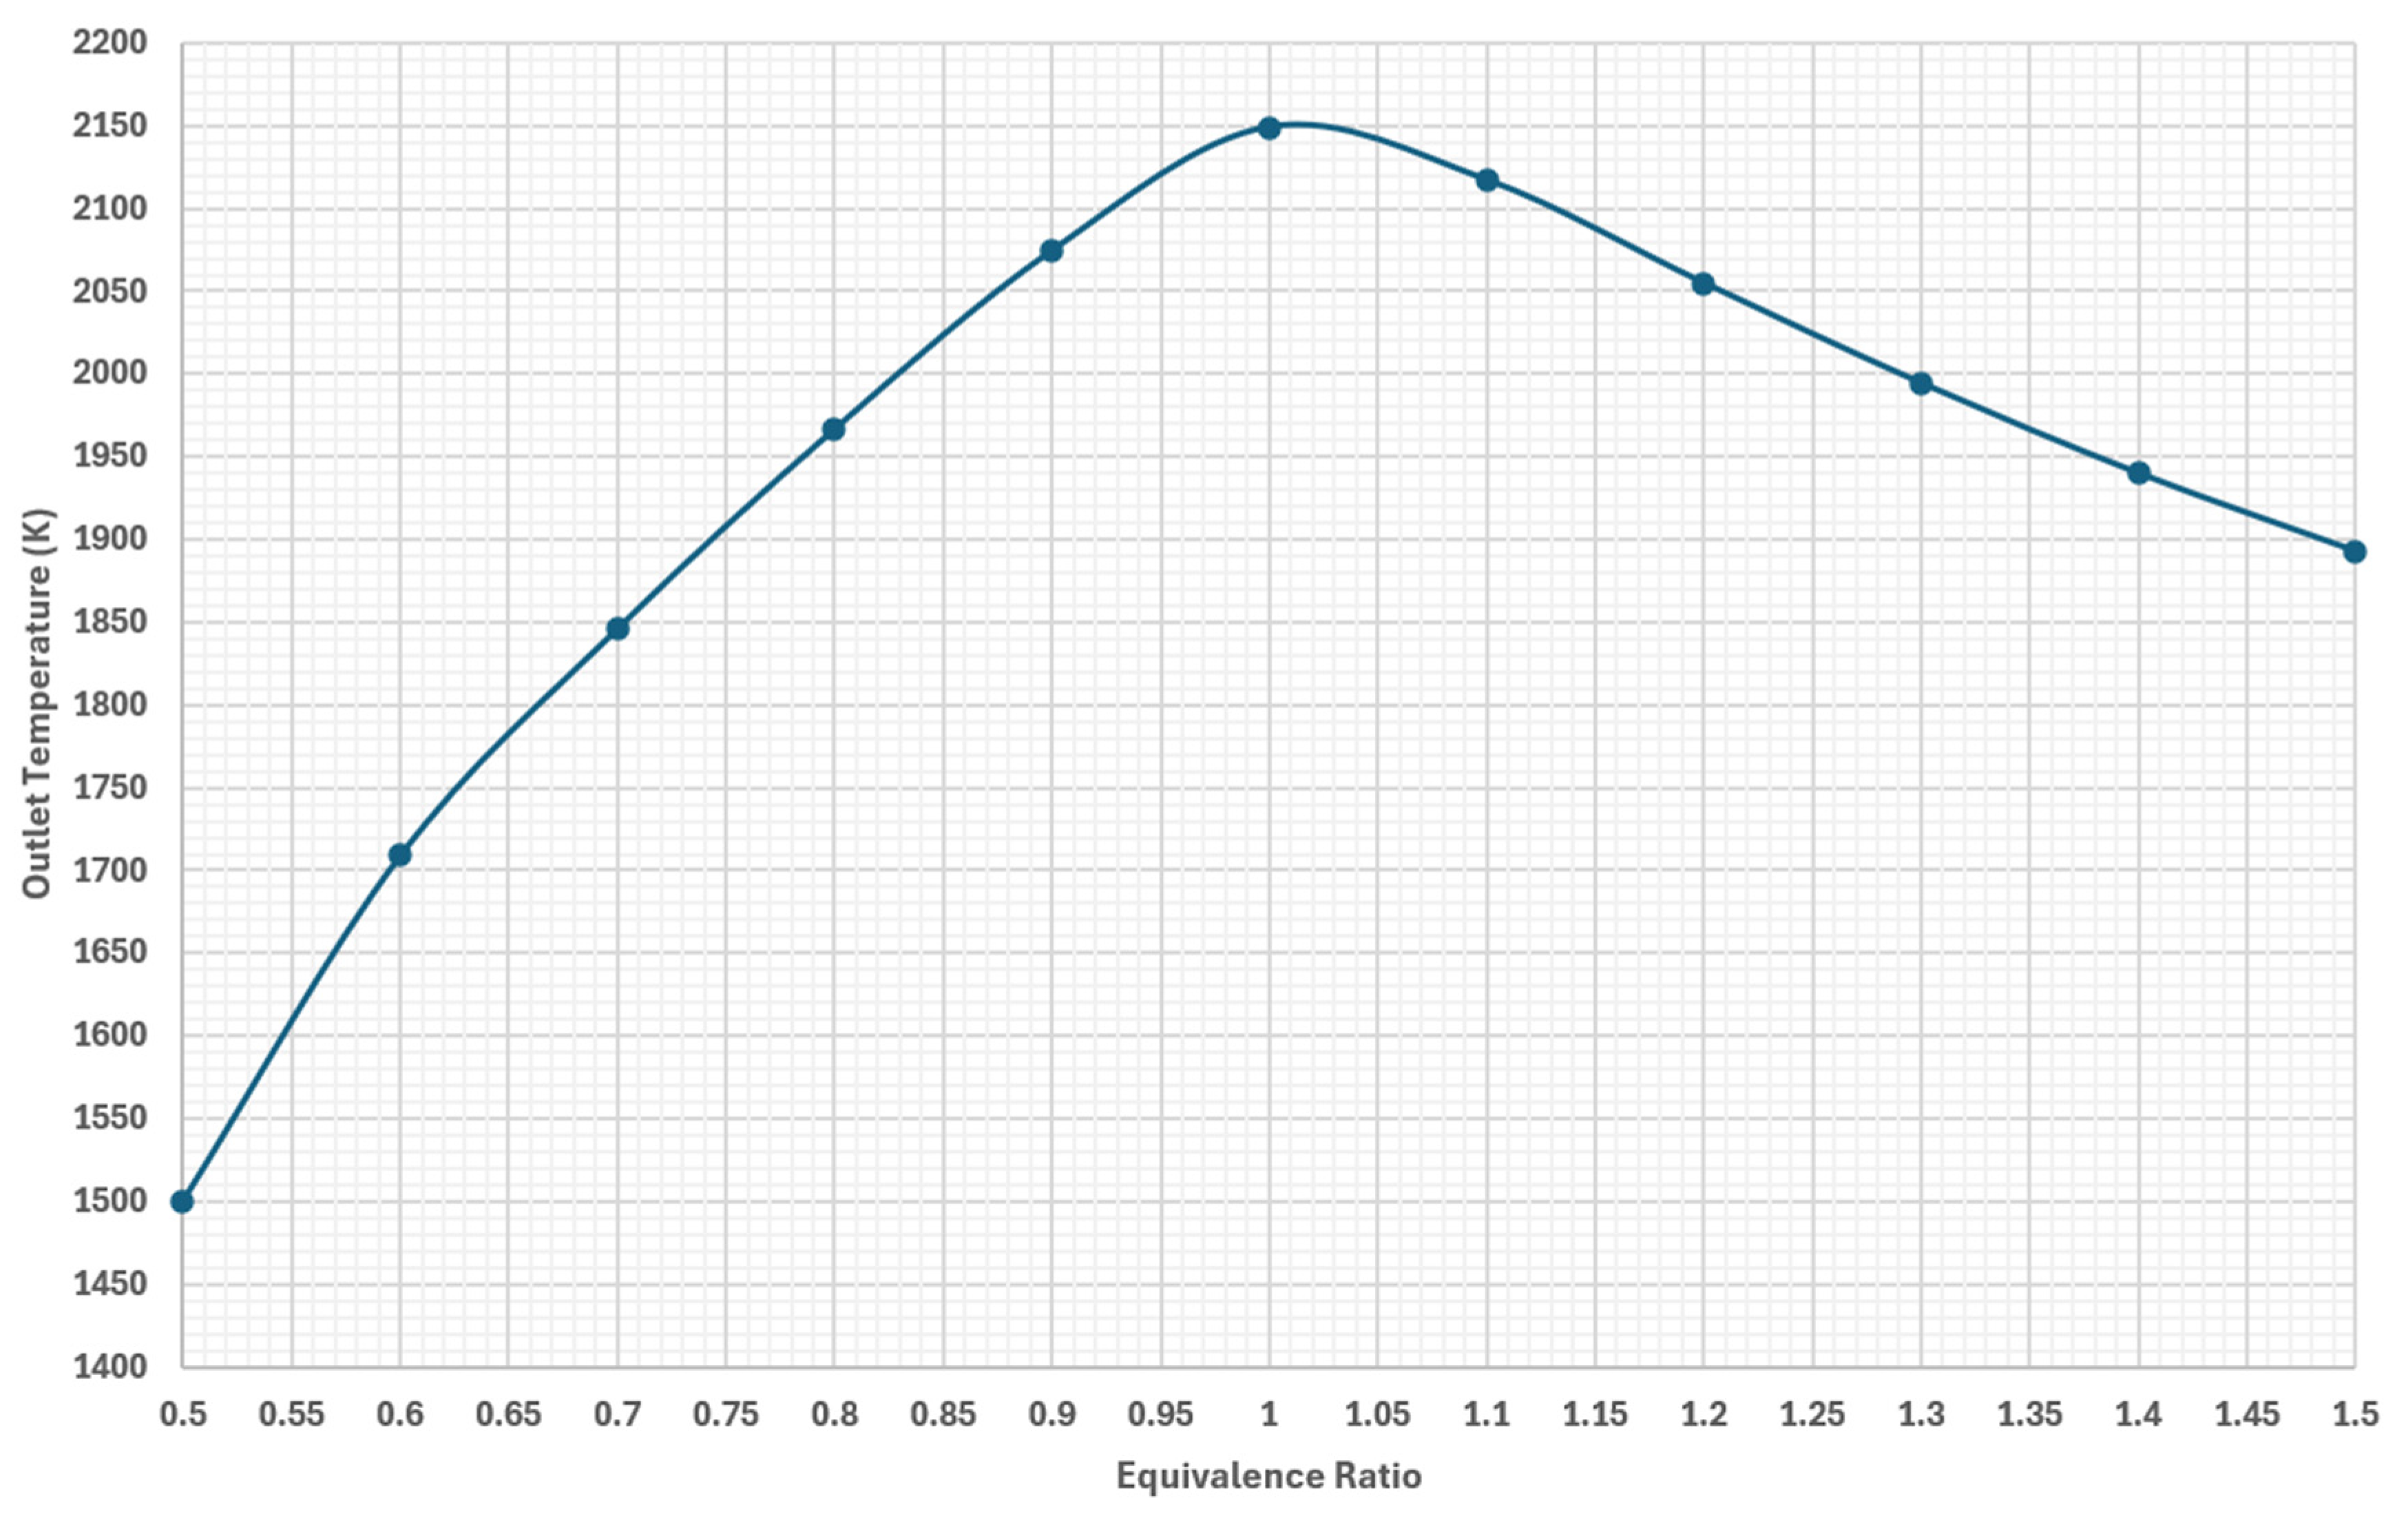
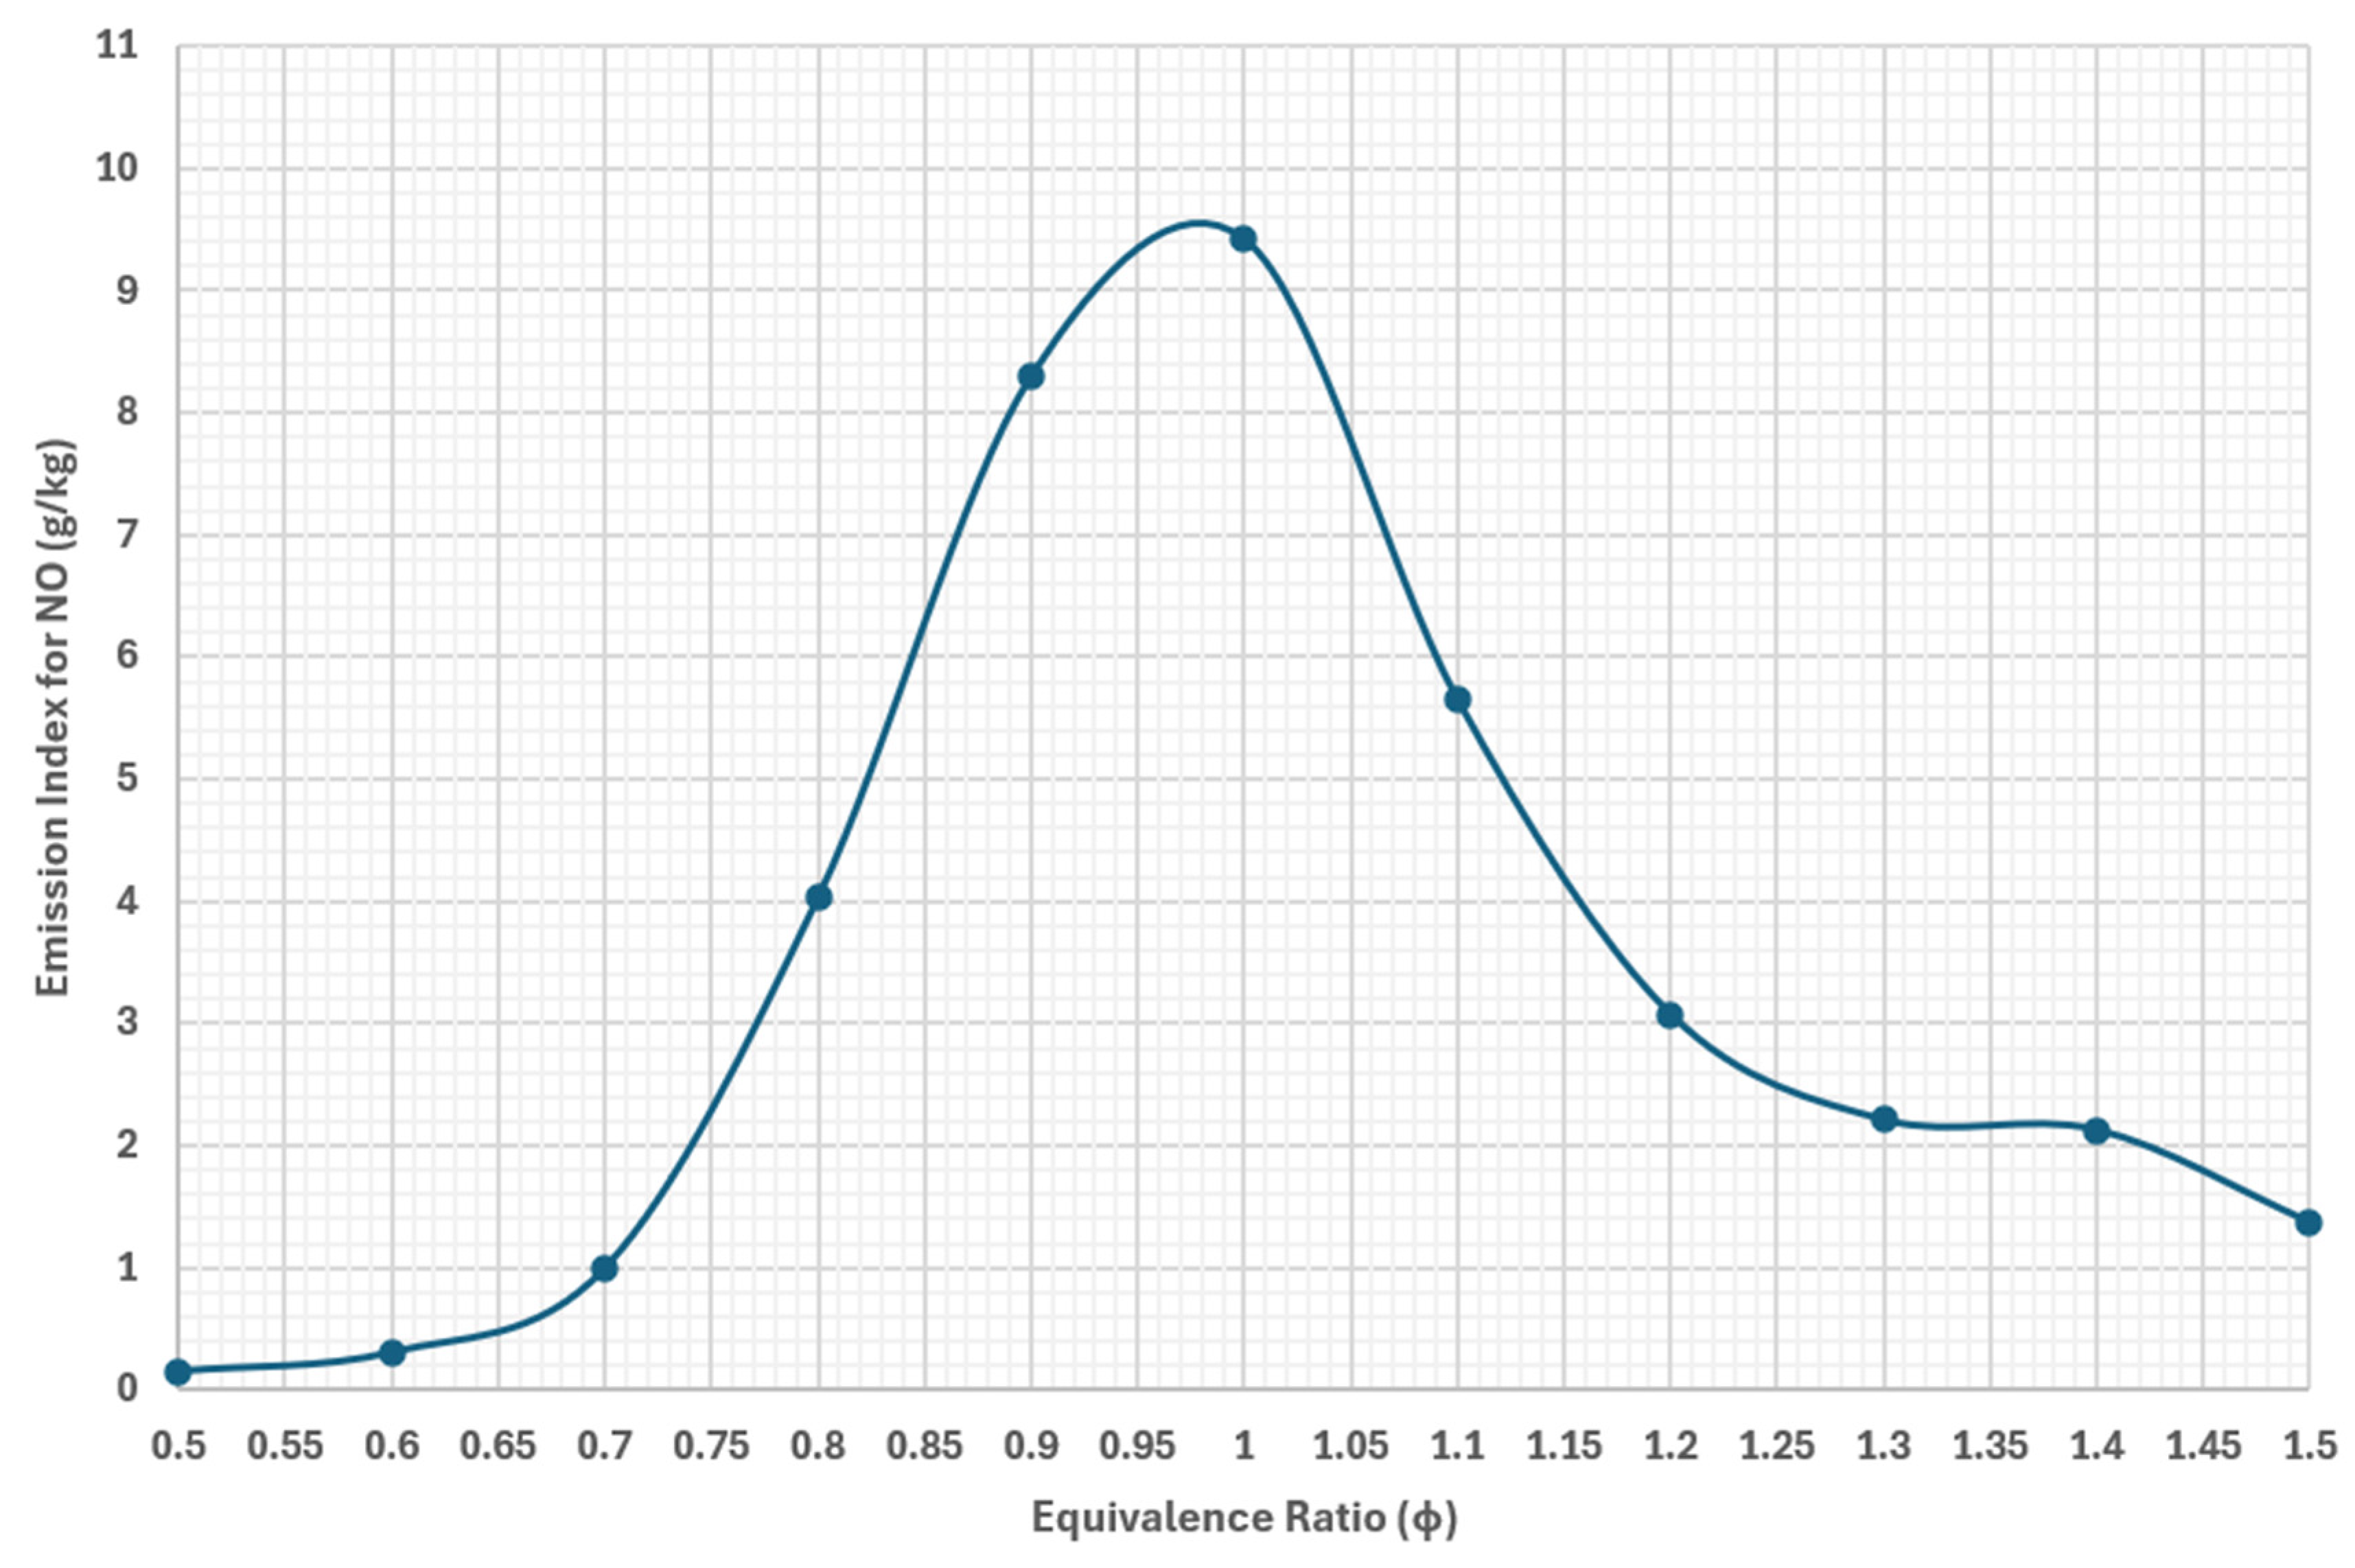
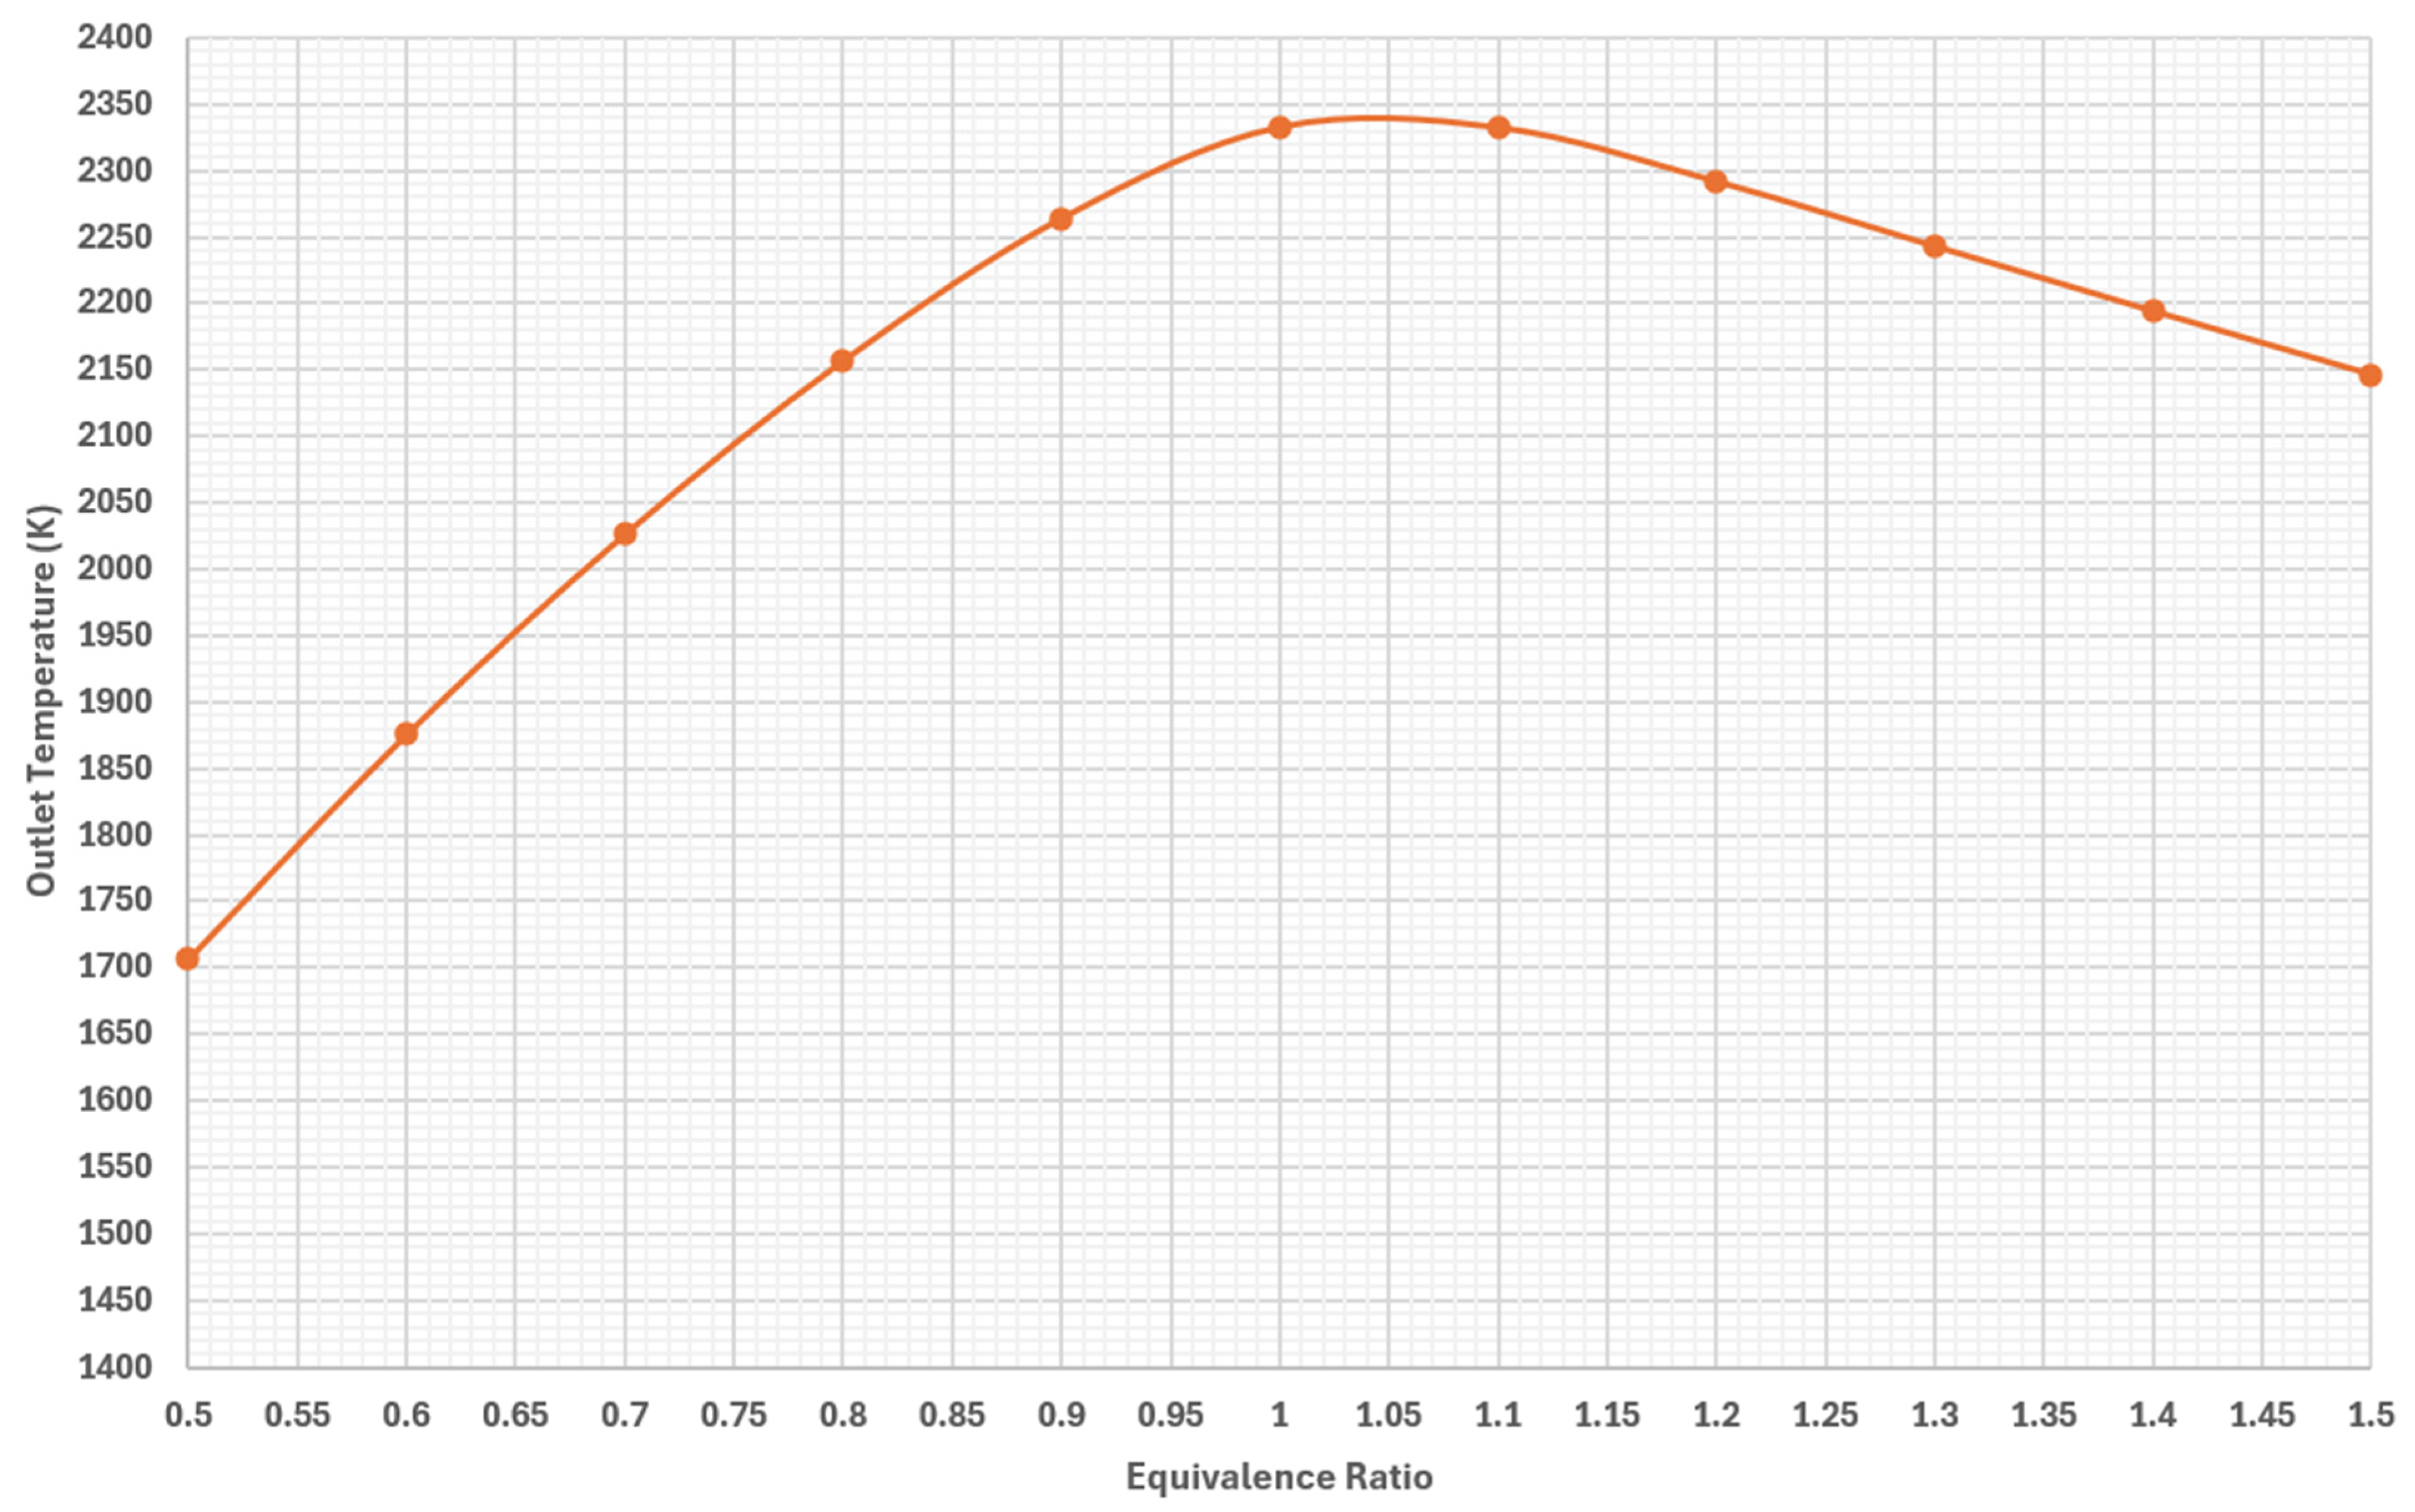
12]. These levels greatly exceed typical environmental regulations for combustion systems. This behavior highlights one of the primary challenges associated with ammonia as a fuel. Stationary and marine ammonia systems frequently incorporate selective catalytic reduction (SCR) units to mitigate these emissions, but incorporation of this method in aerospace applications remains very challenging and possibly infeasible at the current stage of this technology’s development. At stoichiometric conditions, ammonia produces peak flame temperatures of over 2100 K according to
Figure 8. It should be noted that the equivalence ratio corresponding to the peak in temperature does not line up with the peak NO
x emissions. This is because at stoichiometric conditions, the bulk of the oxygen molecules are entirely consumed by the flame and reduce the concentrations available to form NO
x. Slightly more fuel-lean conditions allow leftover oxygen to more readily form NO
x in the high-temperature environment.
Beyond stoichiometric conditions, the NO
x concentrations decrease substantially as the mixture becomes fuel rich. This reduction is associated with the thermal deNO
x behavior of ammonia [
6]. In fuel-rich environments, ammonia and its intermediate radicals react with NO
x species and convert them into molecular nitrogen at high temperatures. This chemical mechanism is similar to the process utilized in selective non-catalytic reduction (SNCR) systems.
It is important to note that the relatively high emission levels observed in these simulations are also influenced by the elevated inlet temperatures used in the study to promote stable flame formation. Although this approach improves flame stability, higher reactant temperatures can also exacerbate NOx formation rates.
3.2. Sweep 2: Effects of Ammonia Cracking at Peak NOx Conditions
The second parametric sweep investigates how partial ammonia cracking affects NO
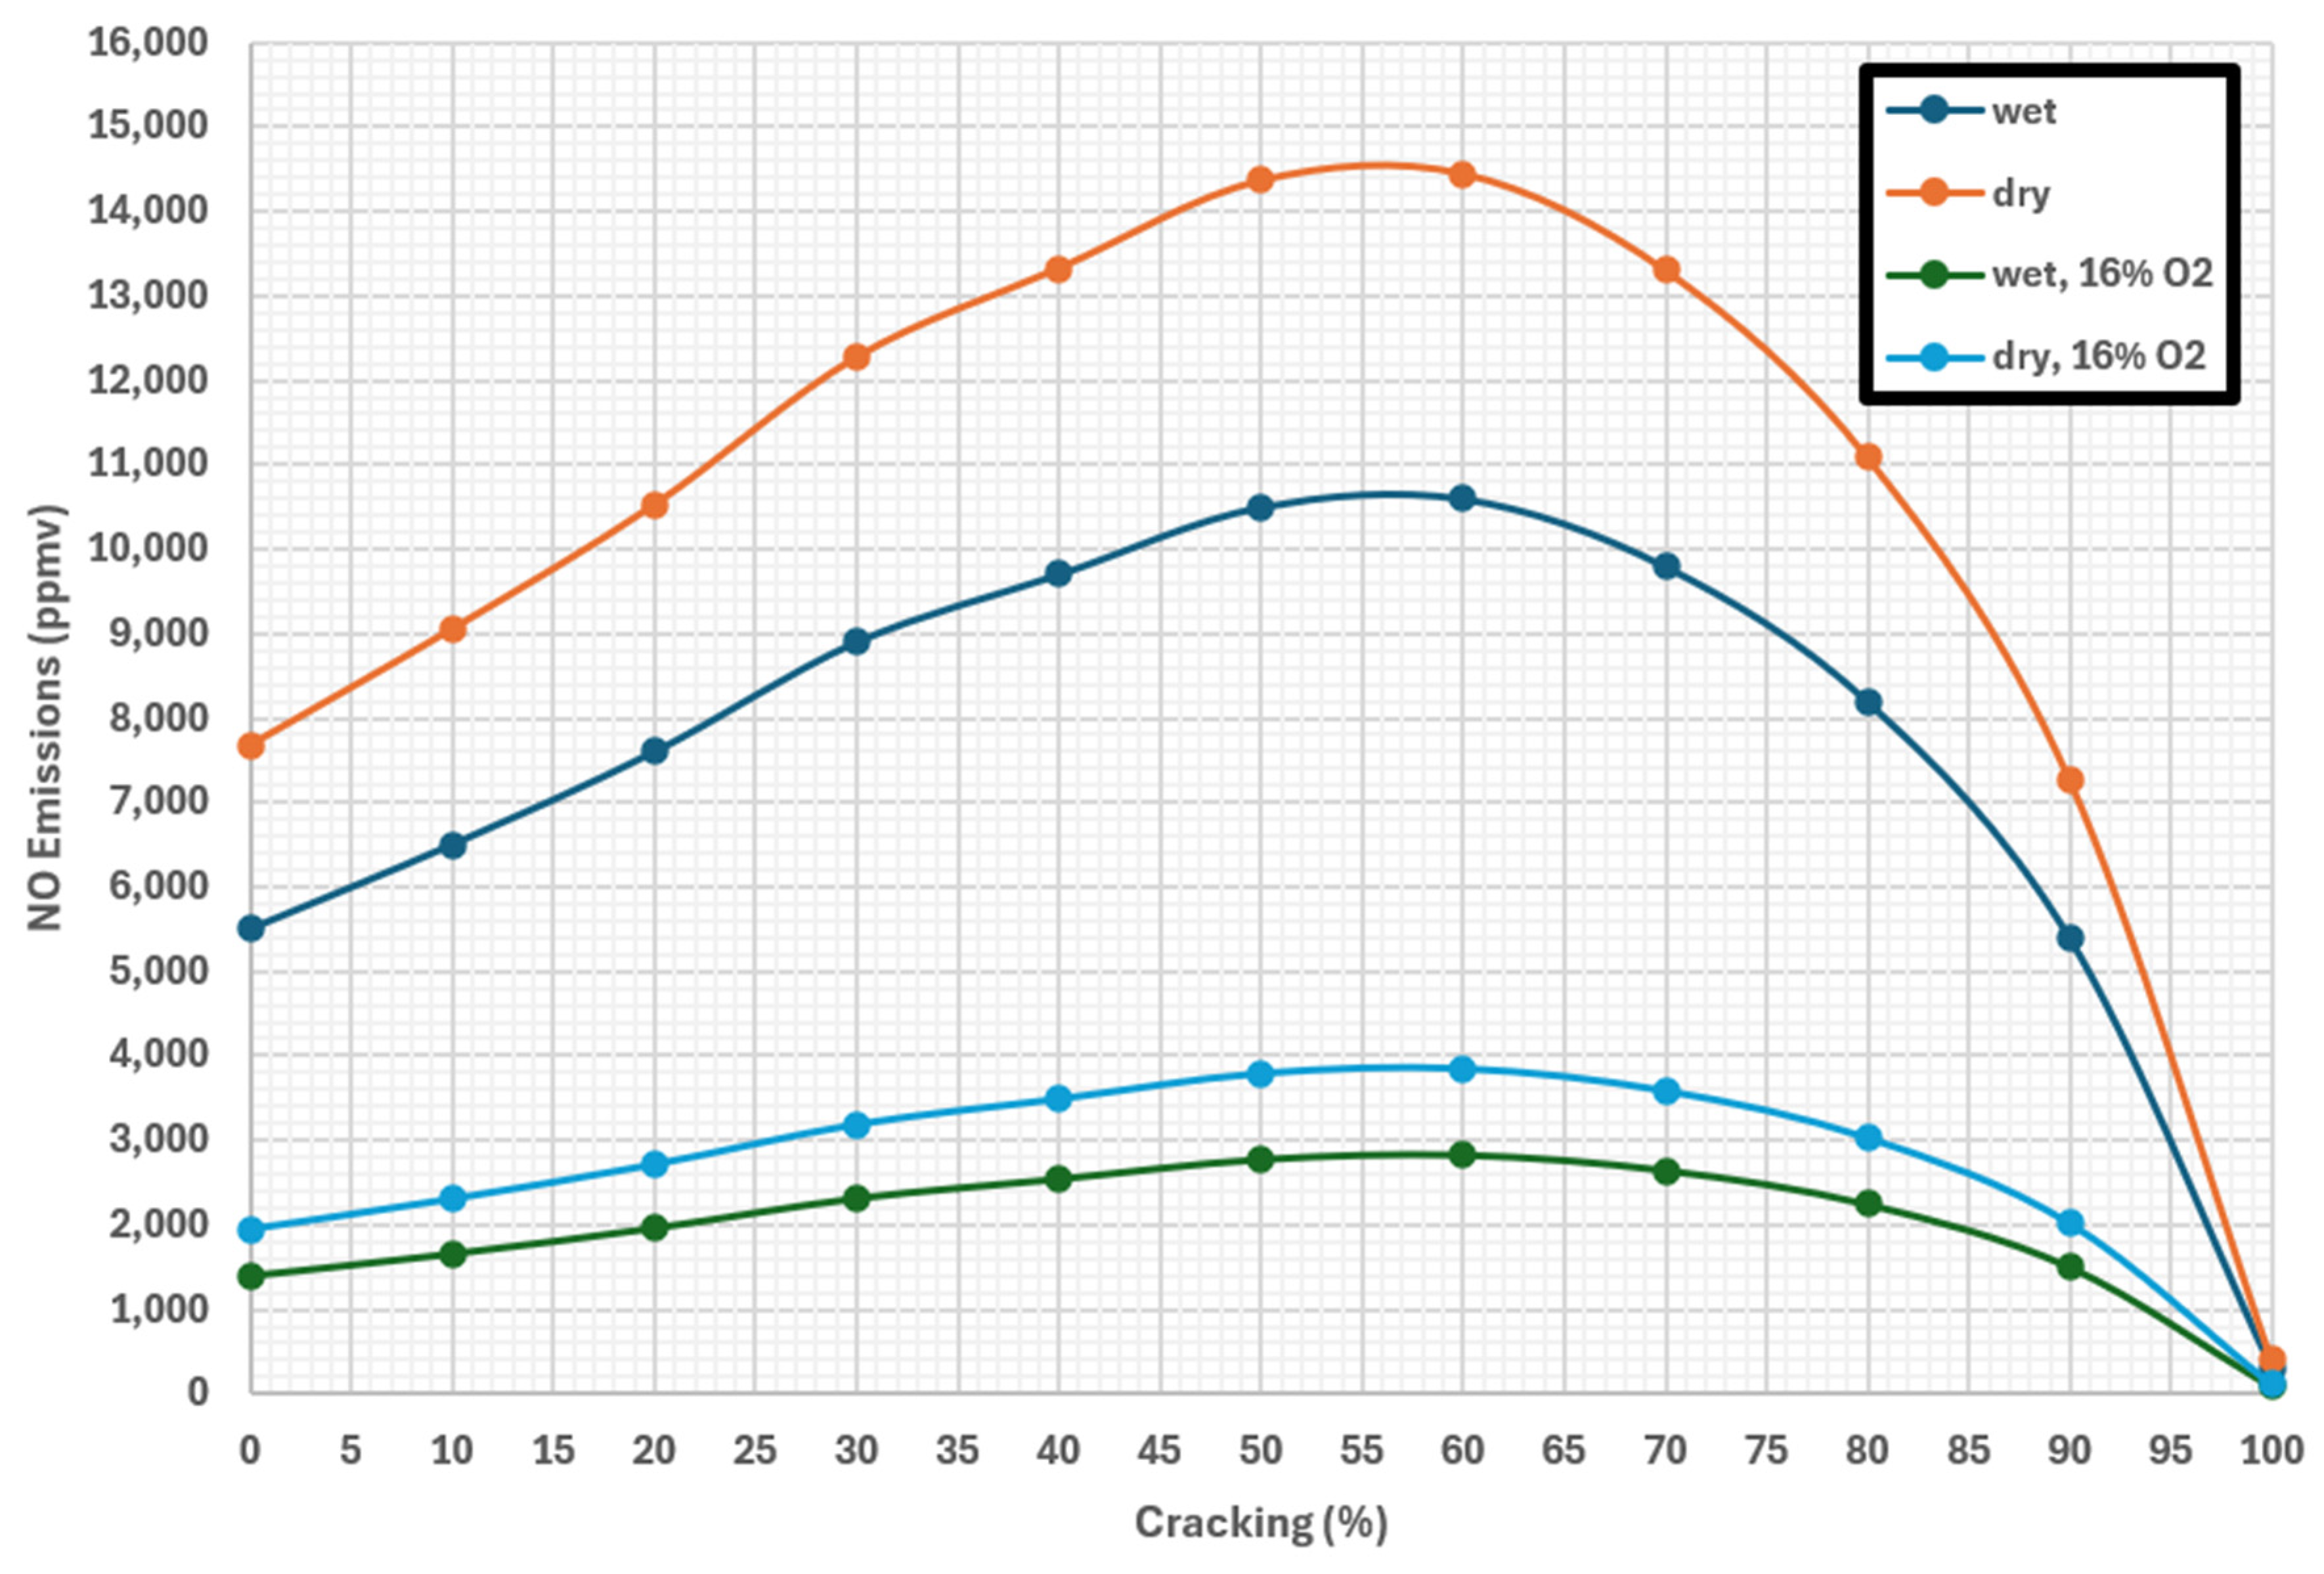
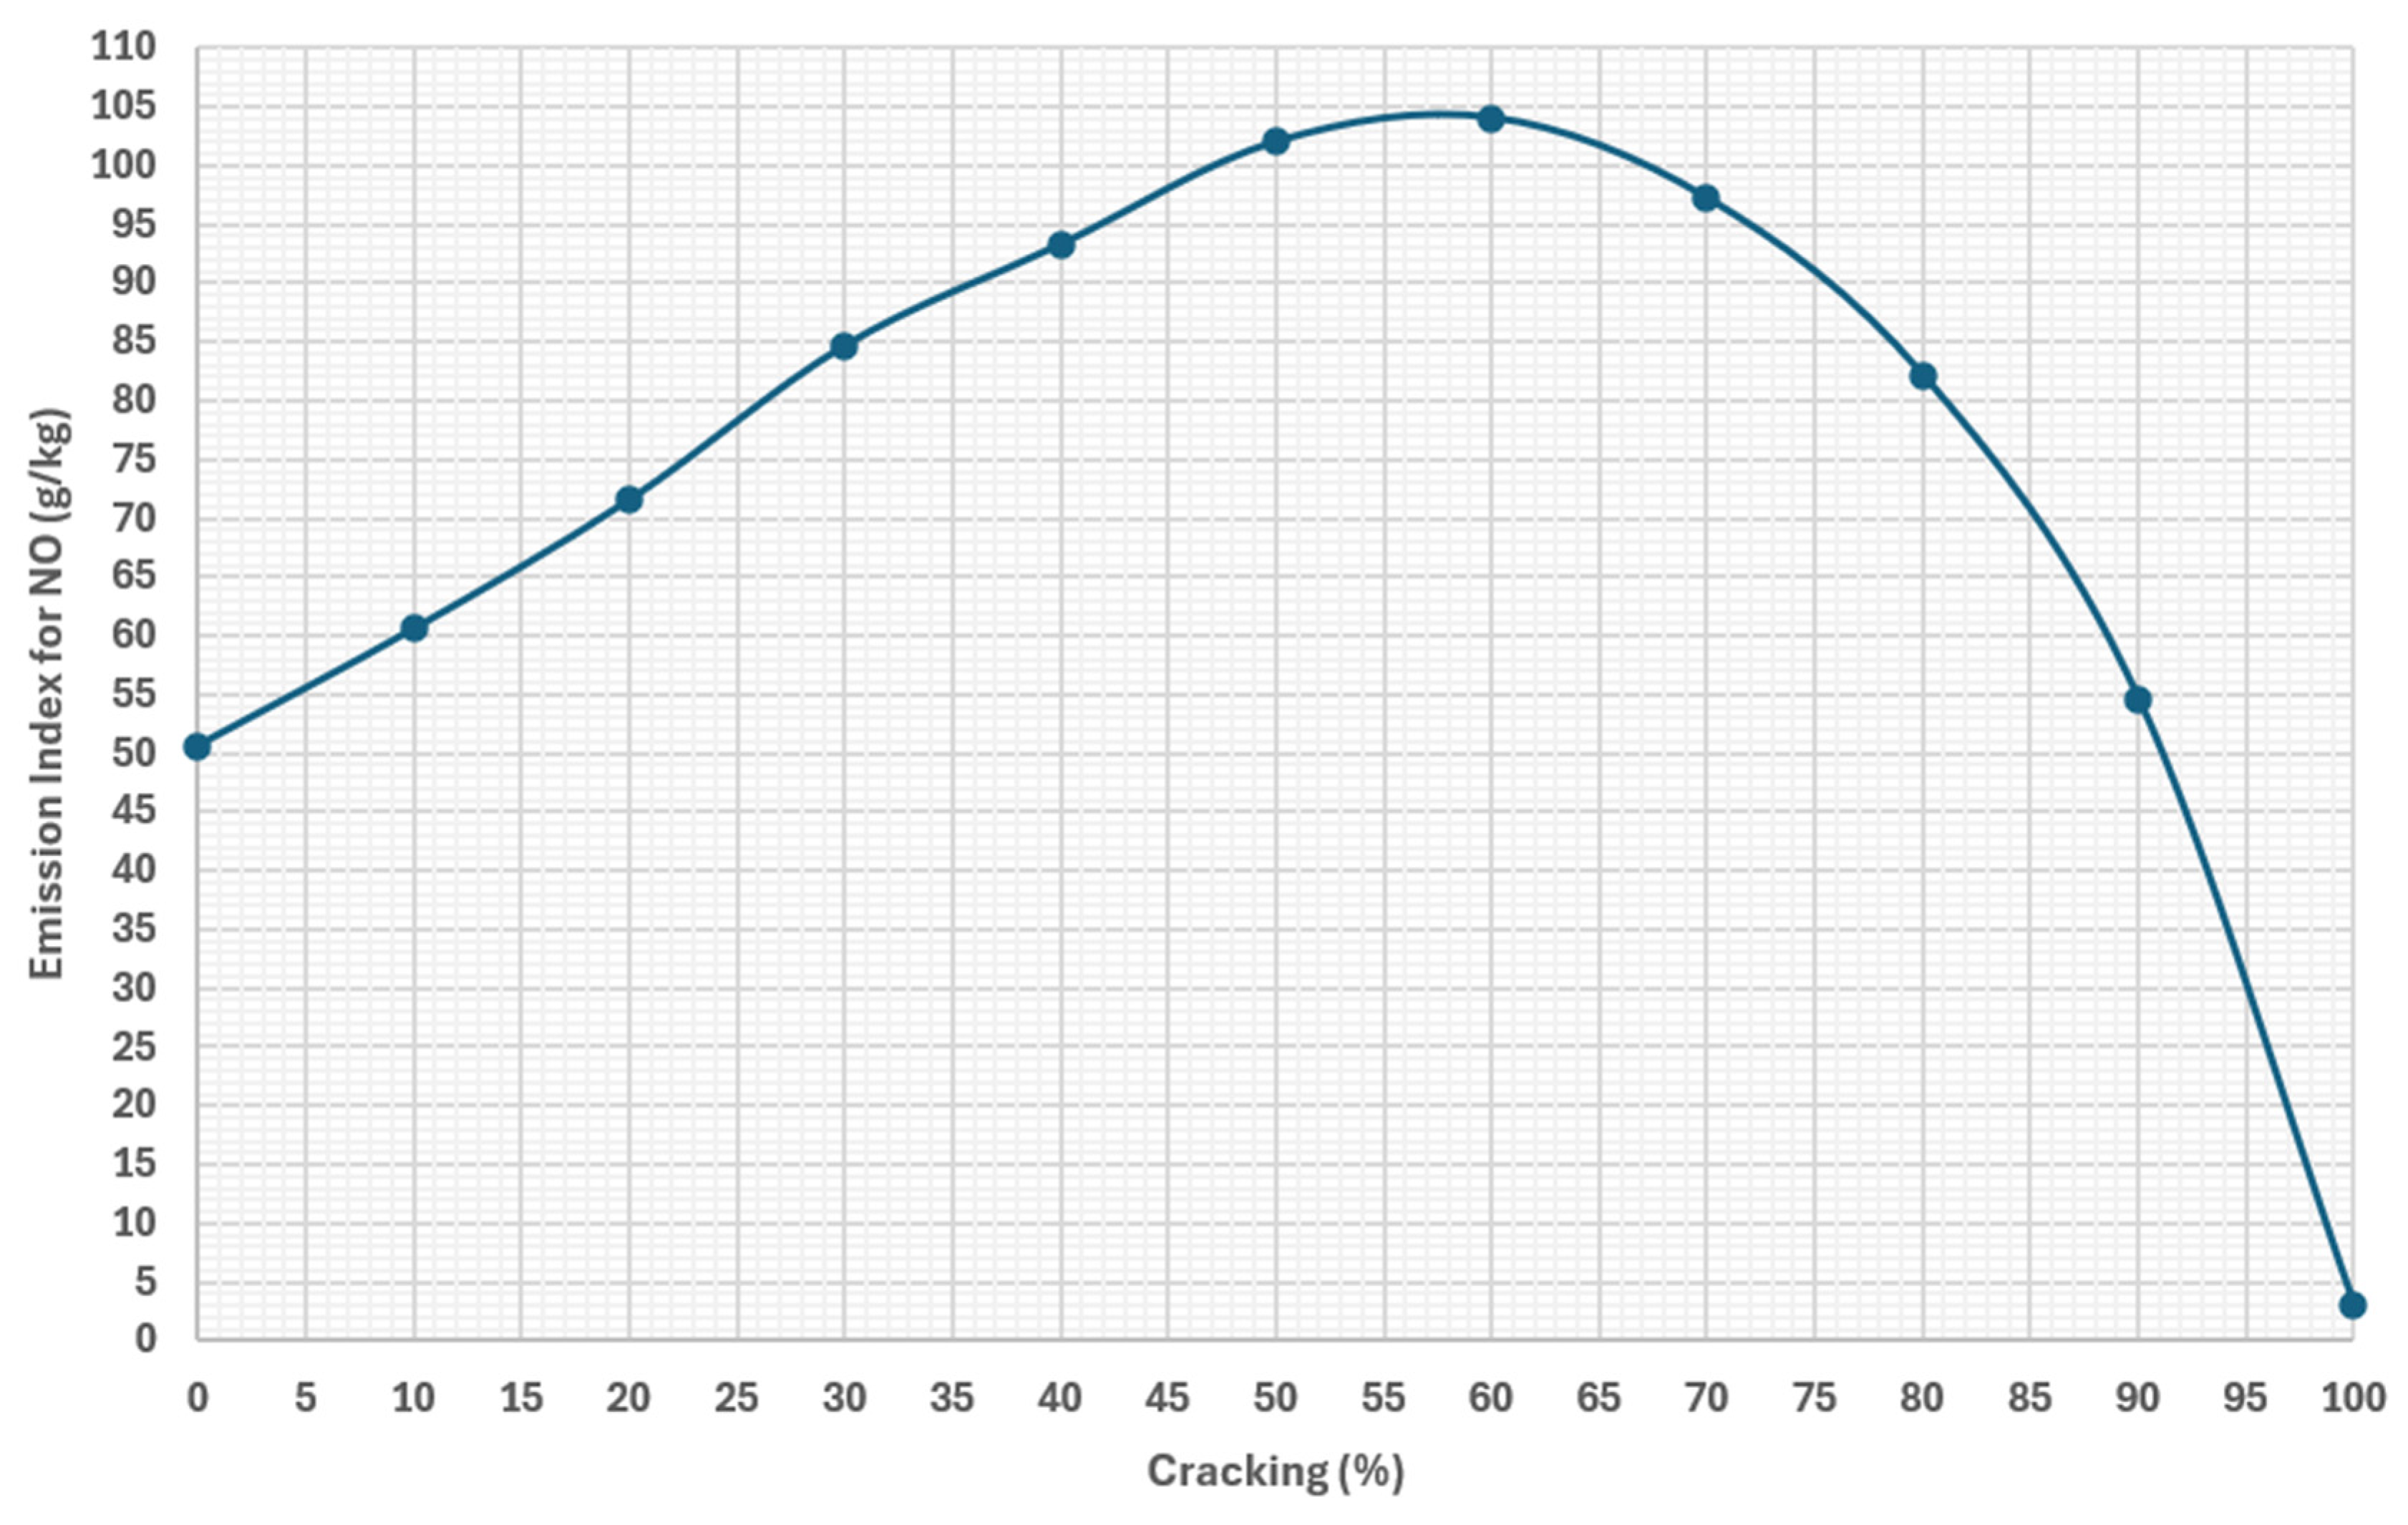
x emissions at the equivalence ratio corresponding to peak emissions for pure ammonia combustion. Based on the results from the previous sweep, an equivalence ratio of 0.8 was selected for this analysis.
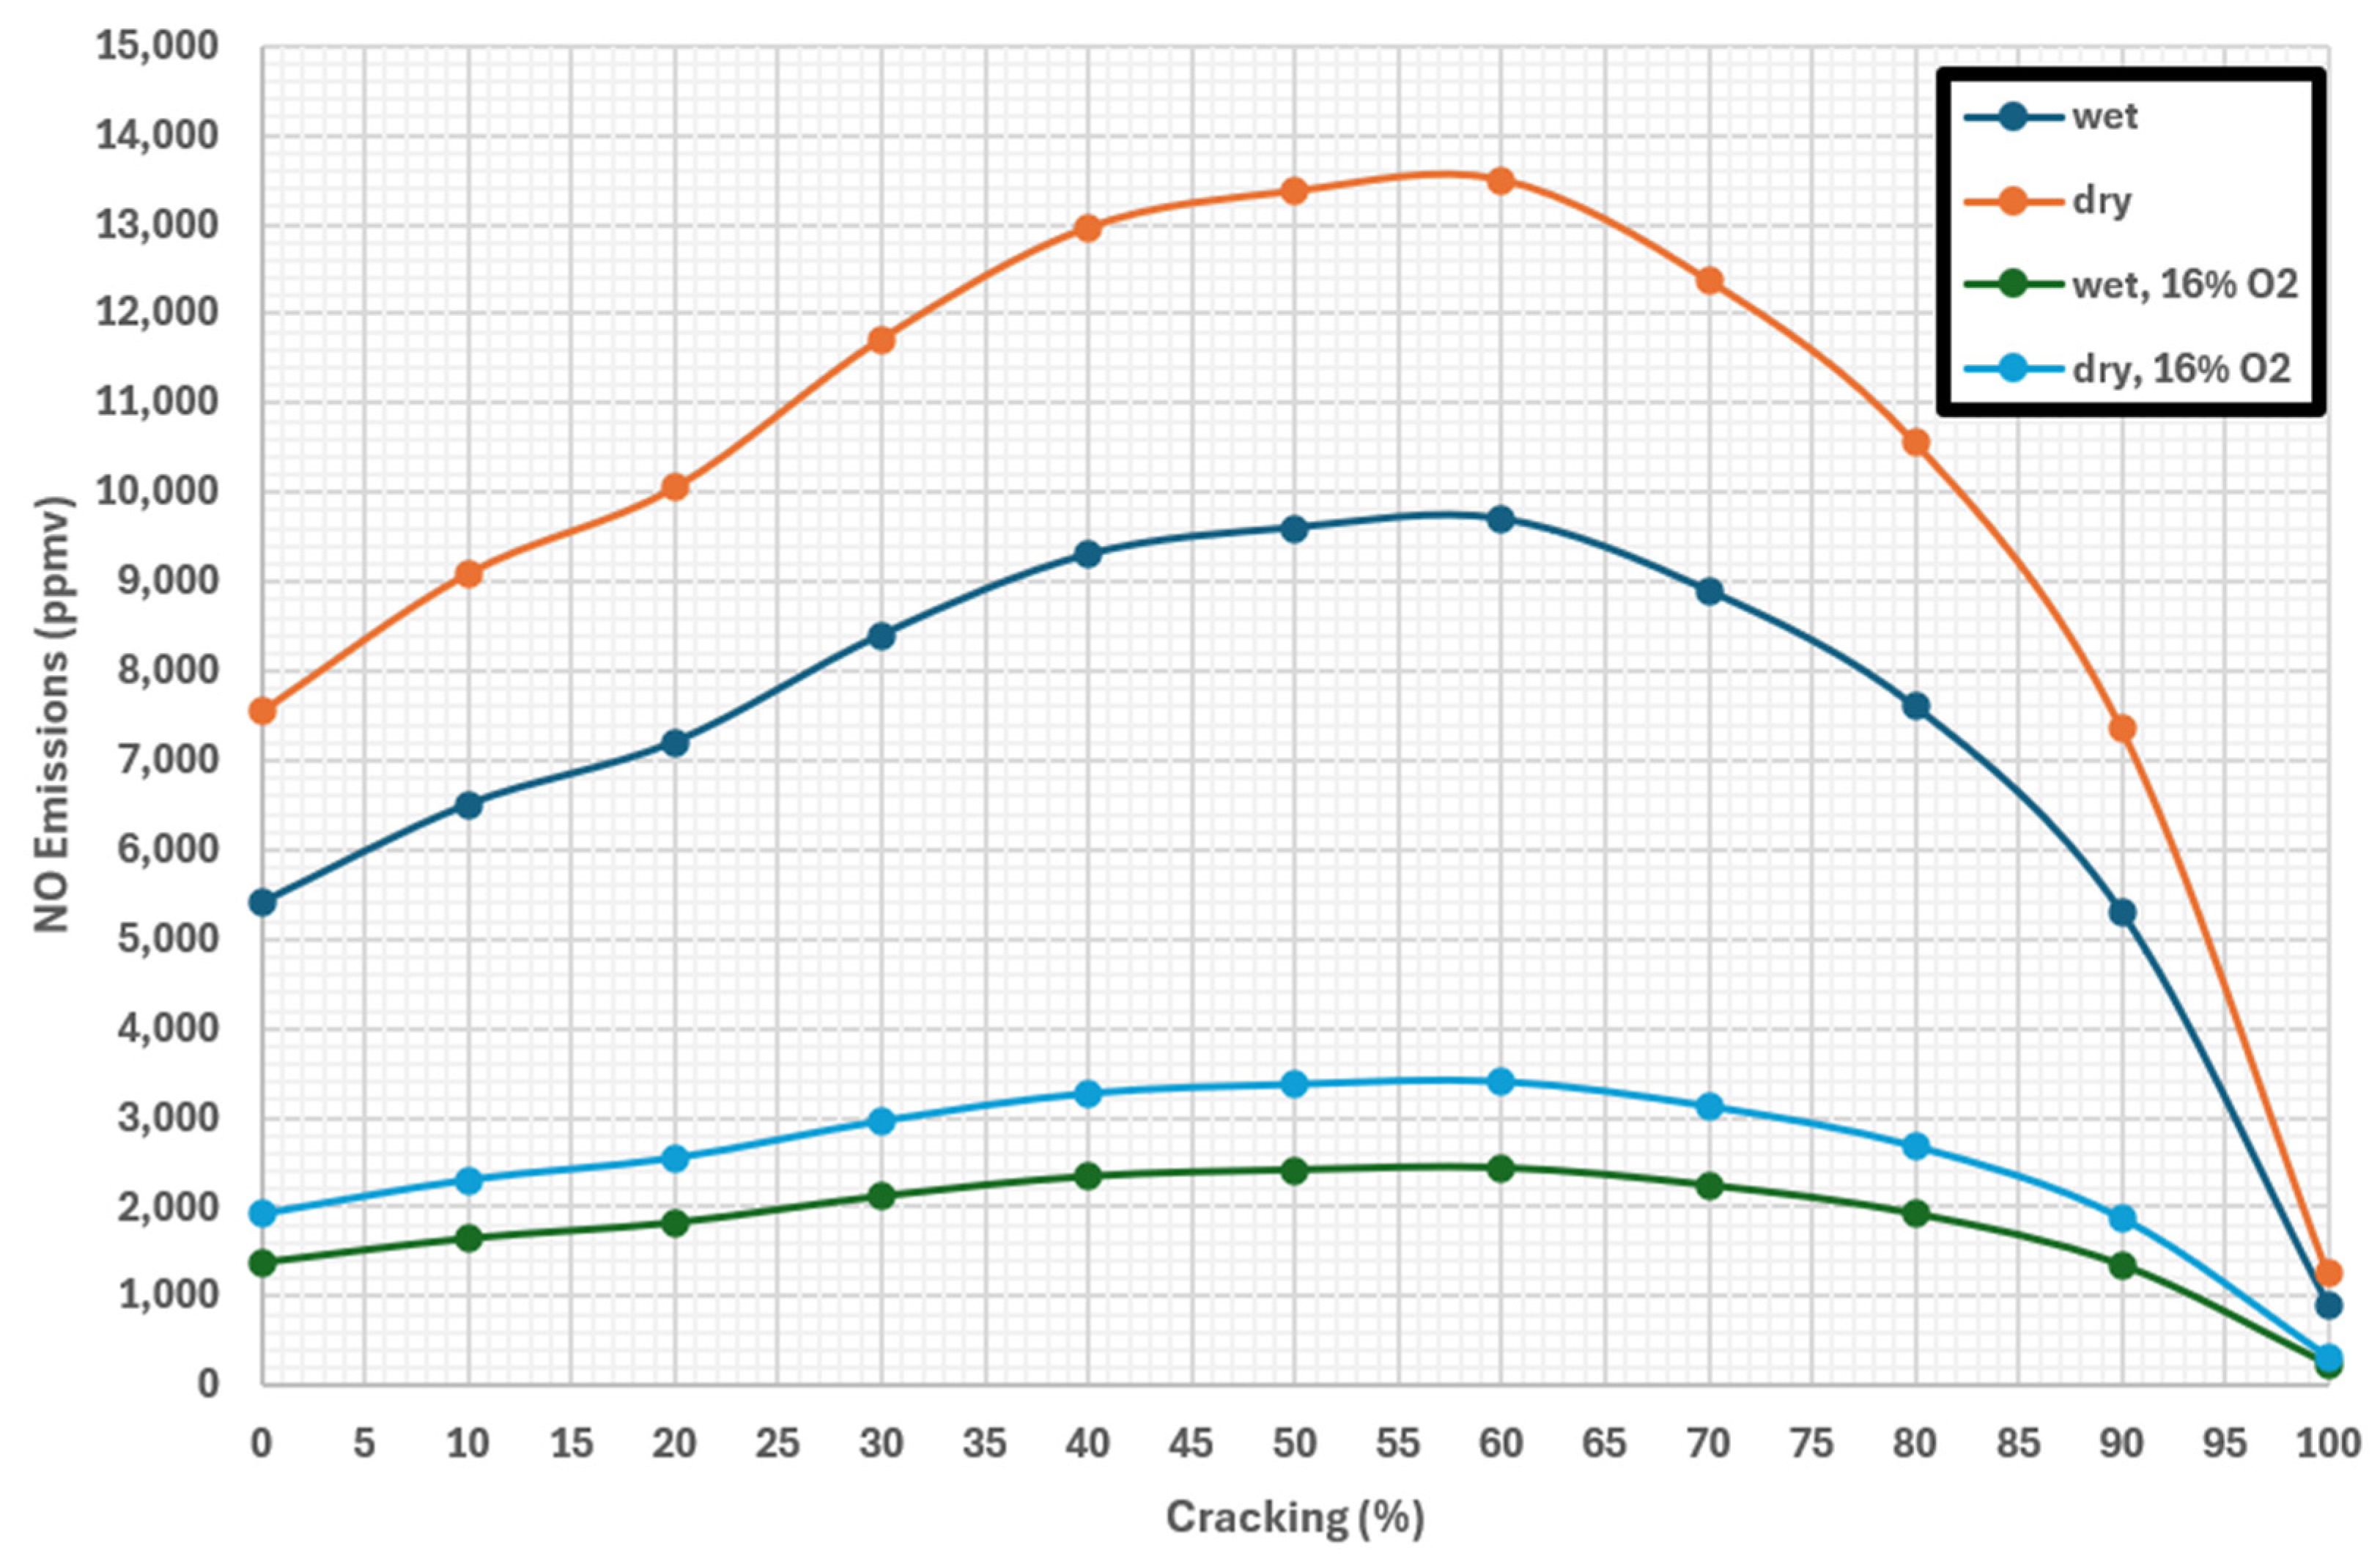
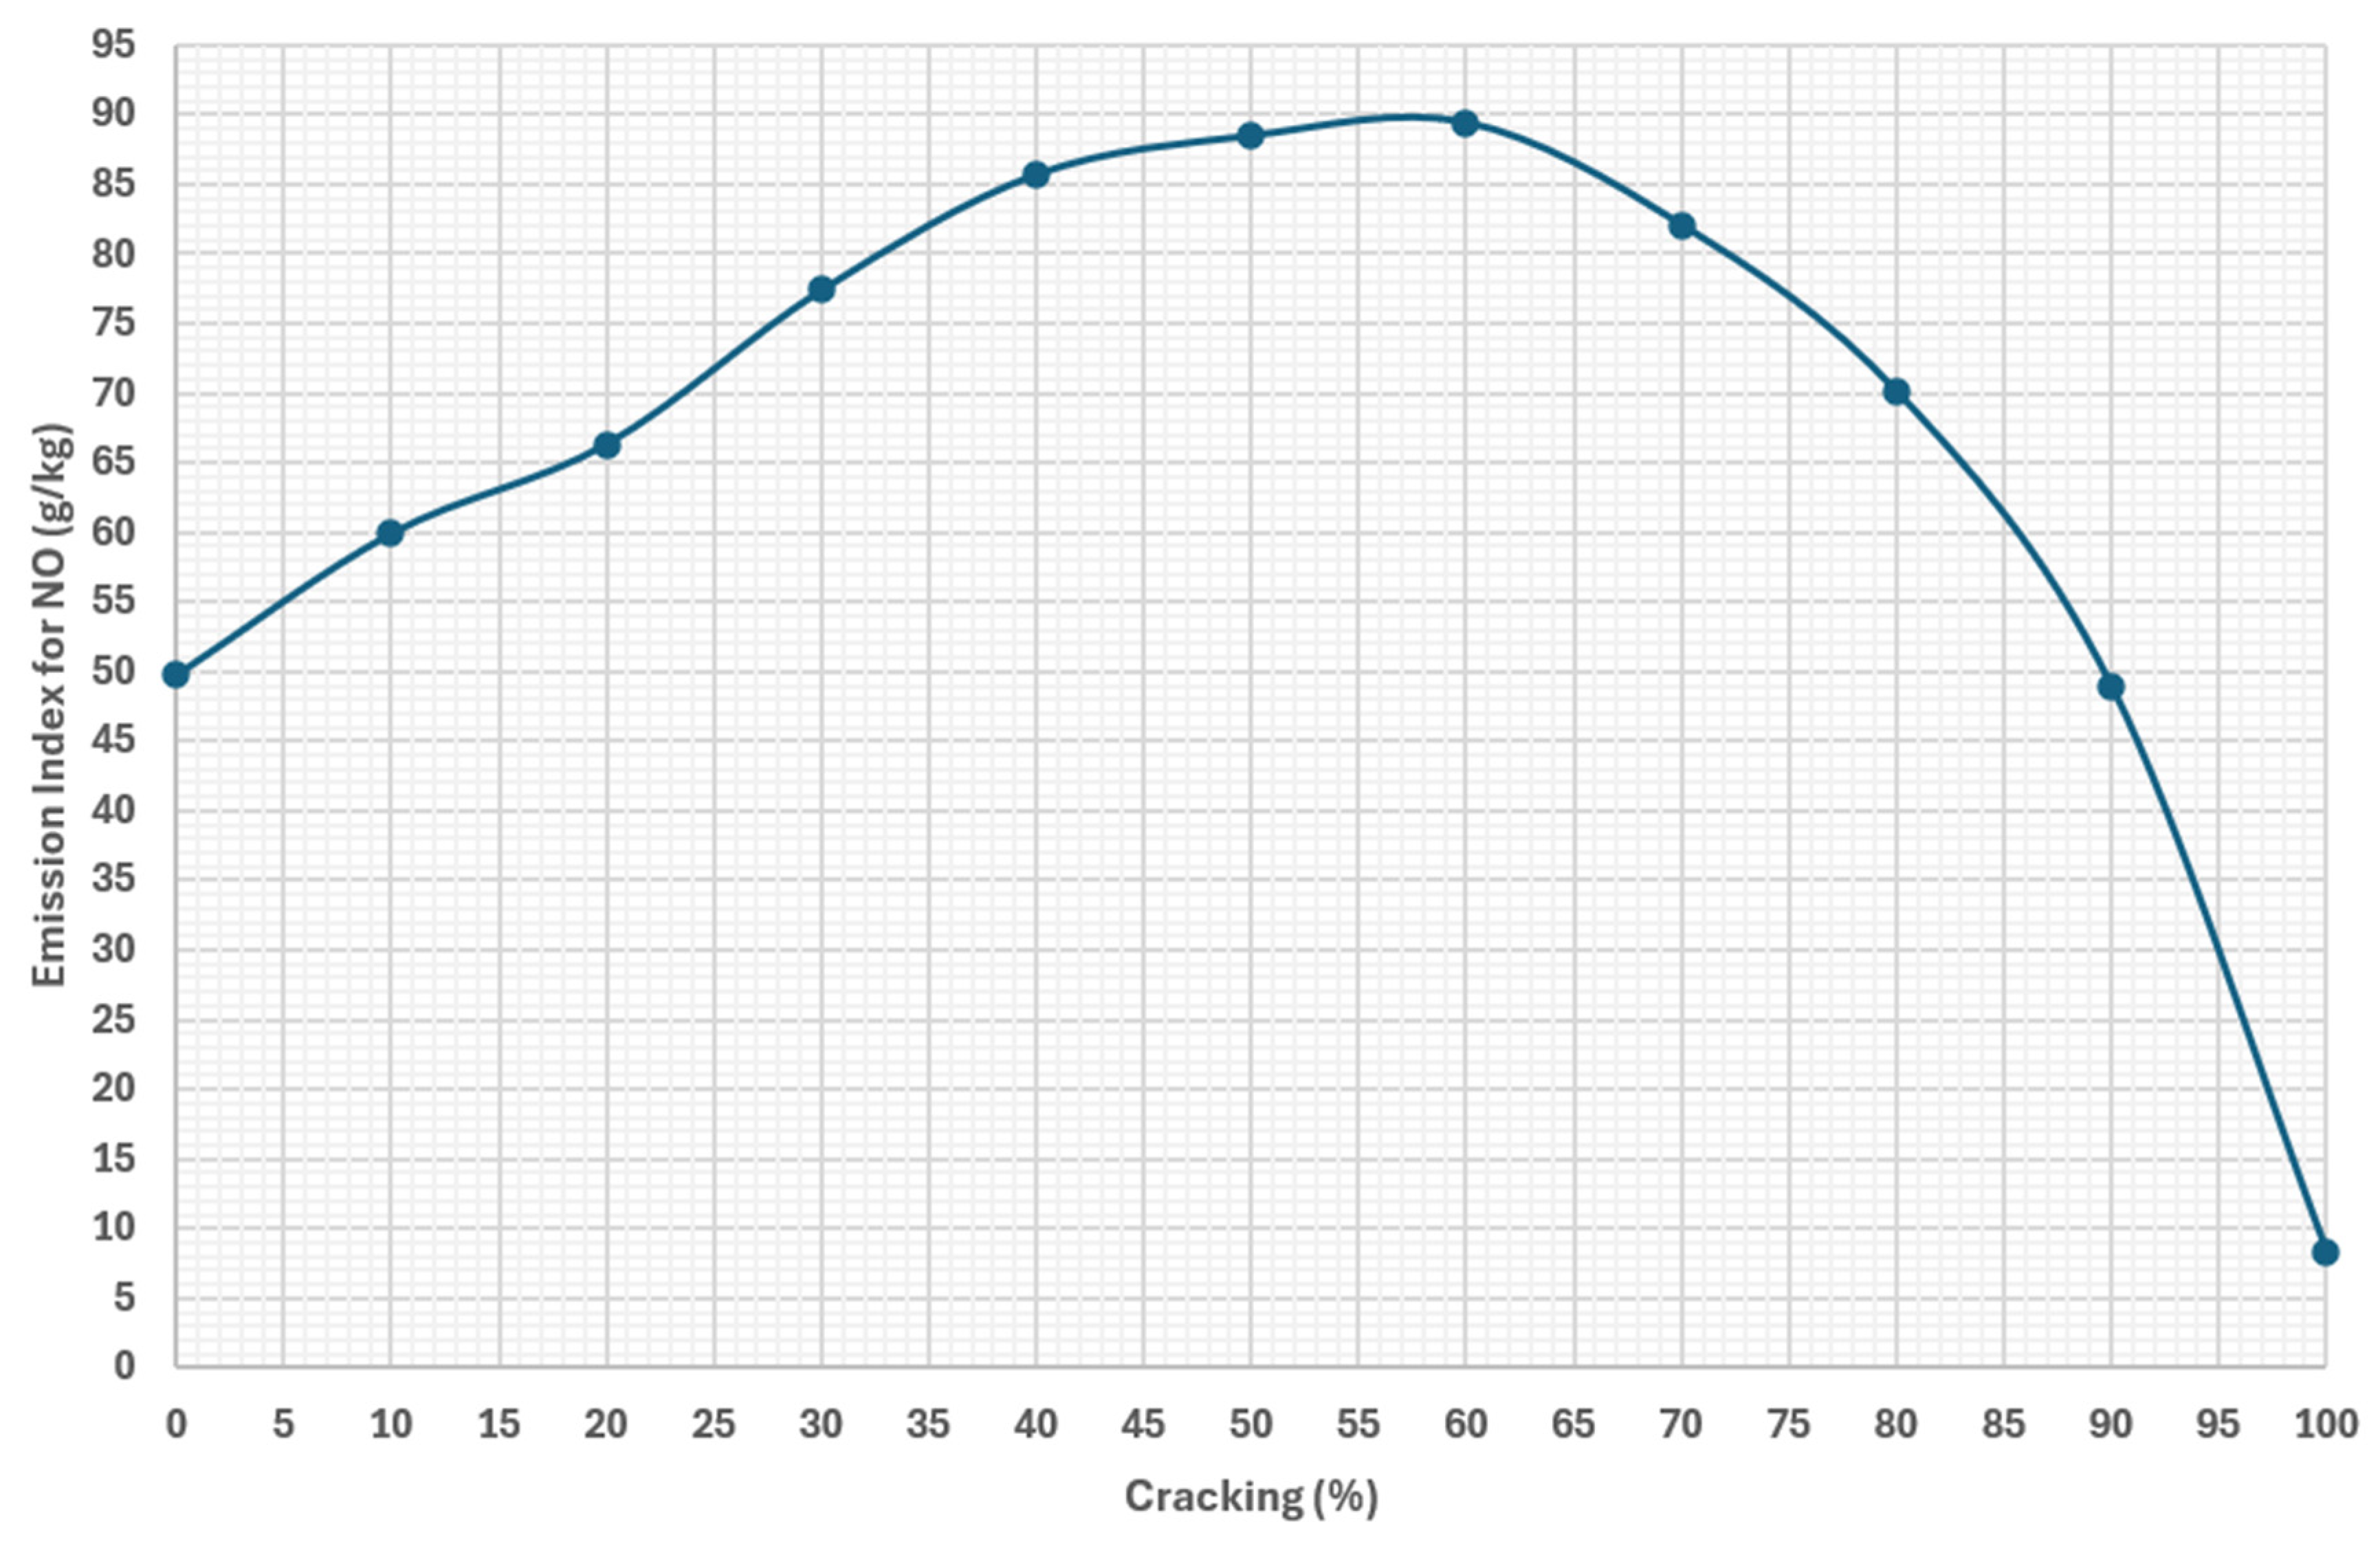
Figure 9 and
Figure 10 present the resulting NO
x emissions as a function of cracking percentage, while
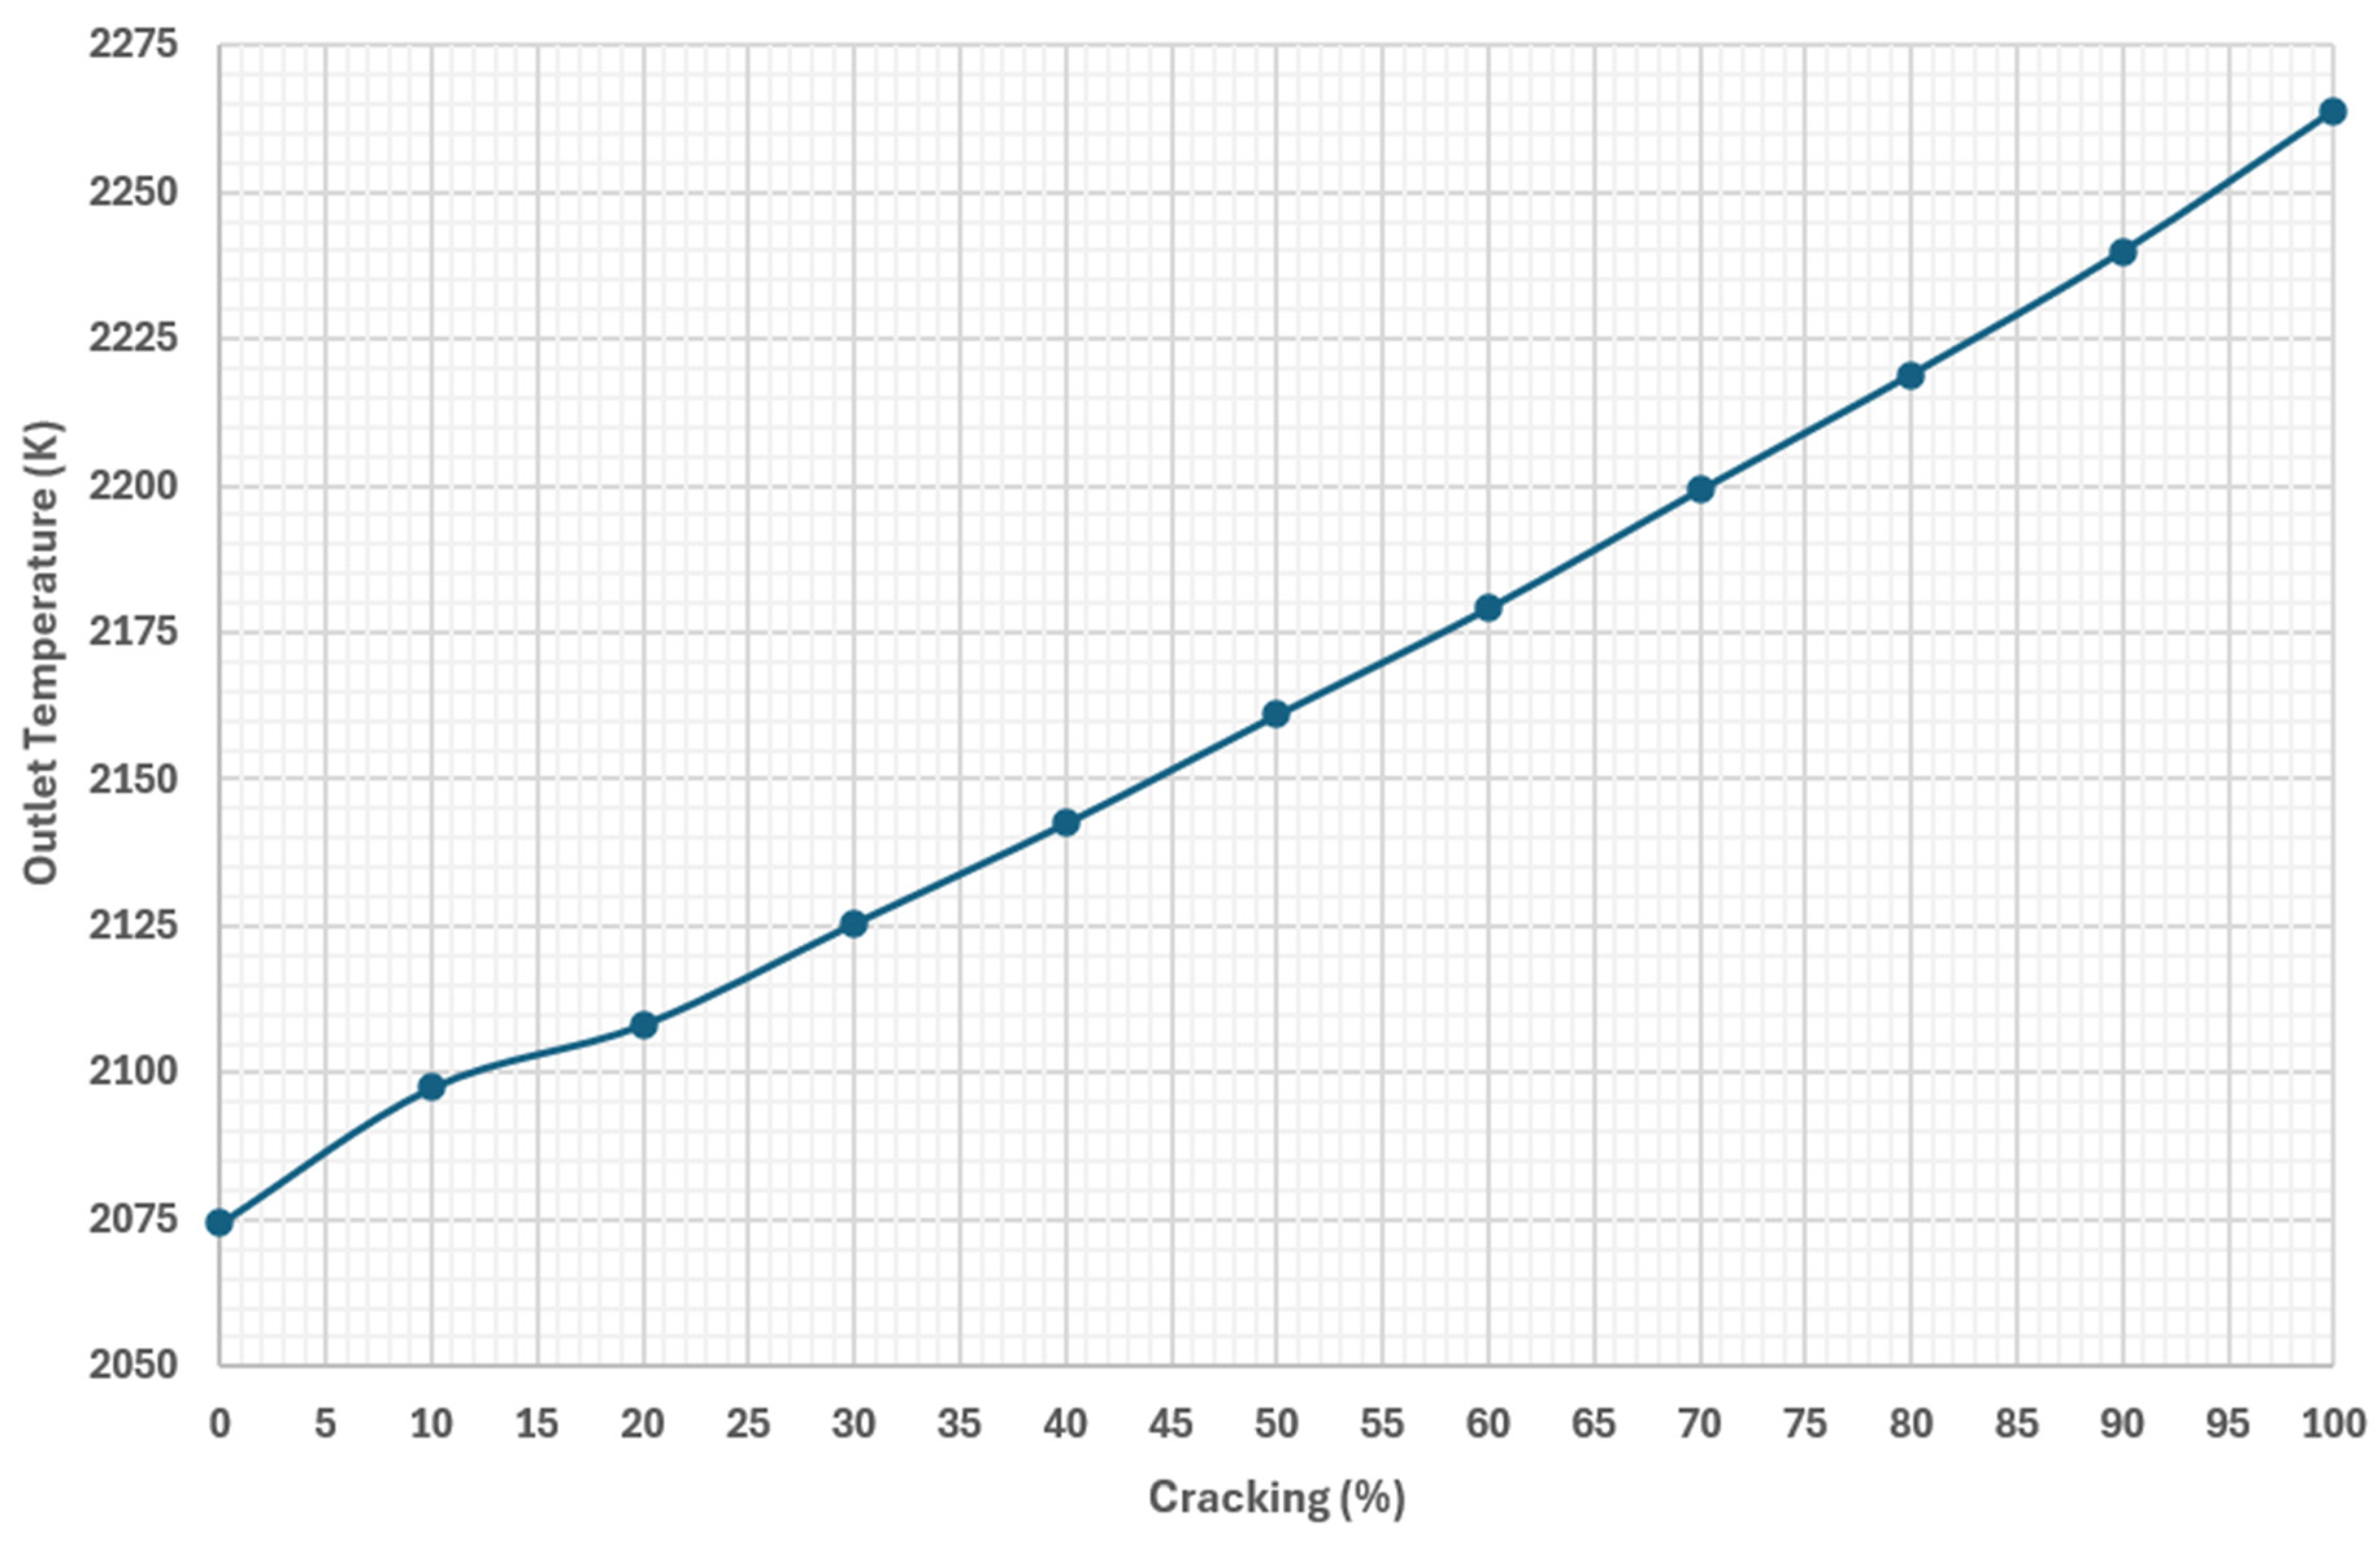
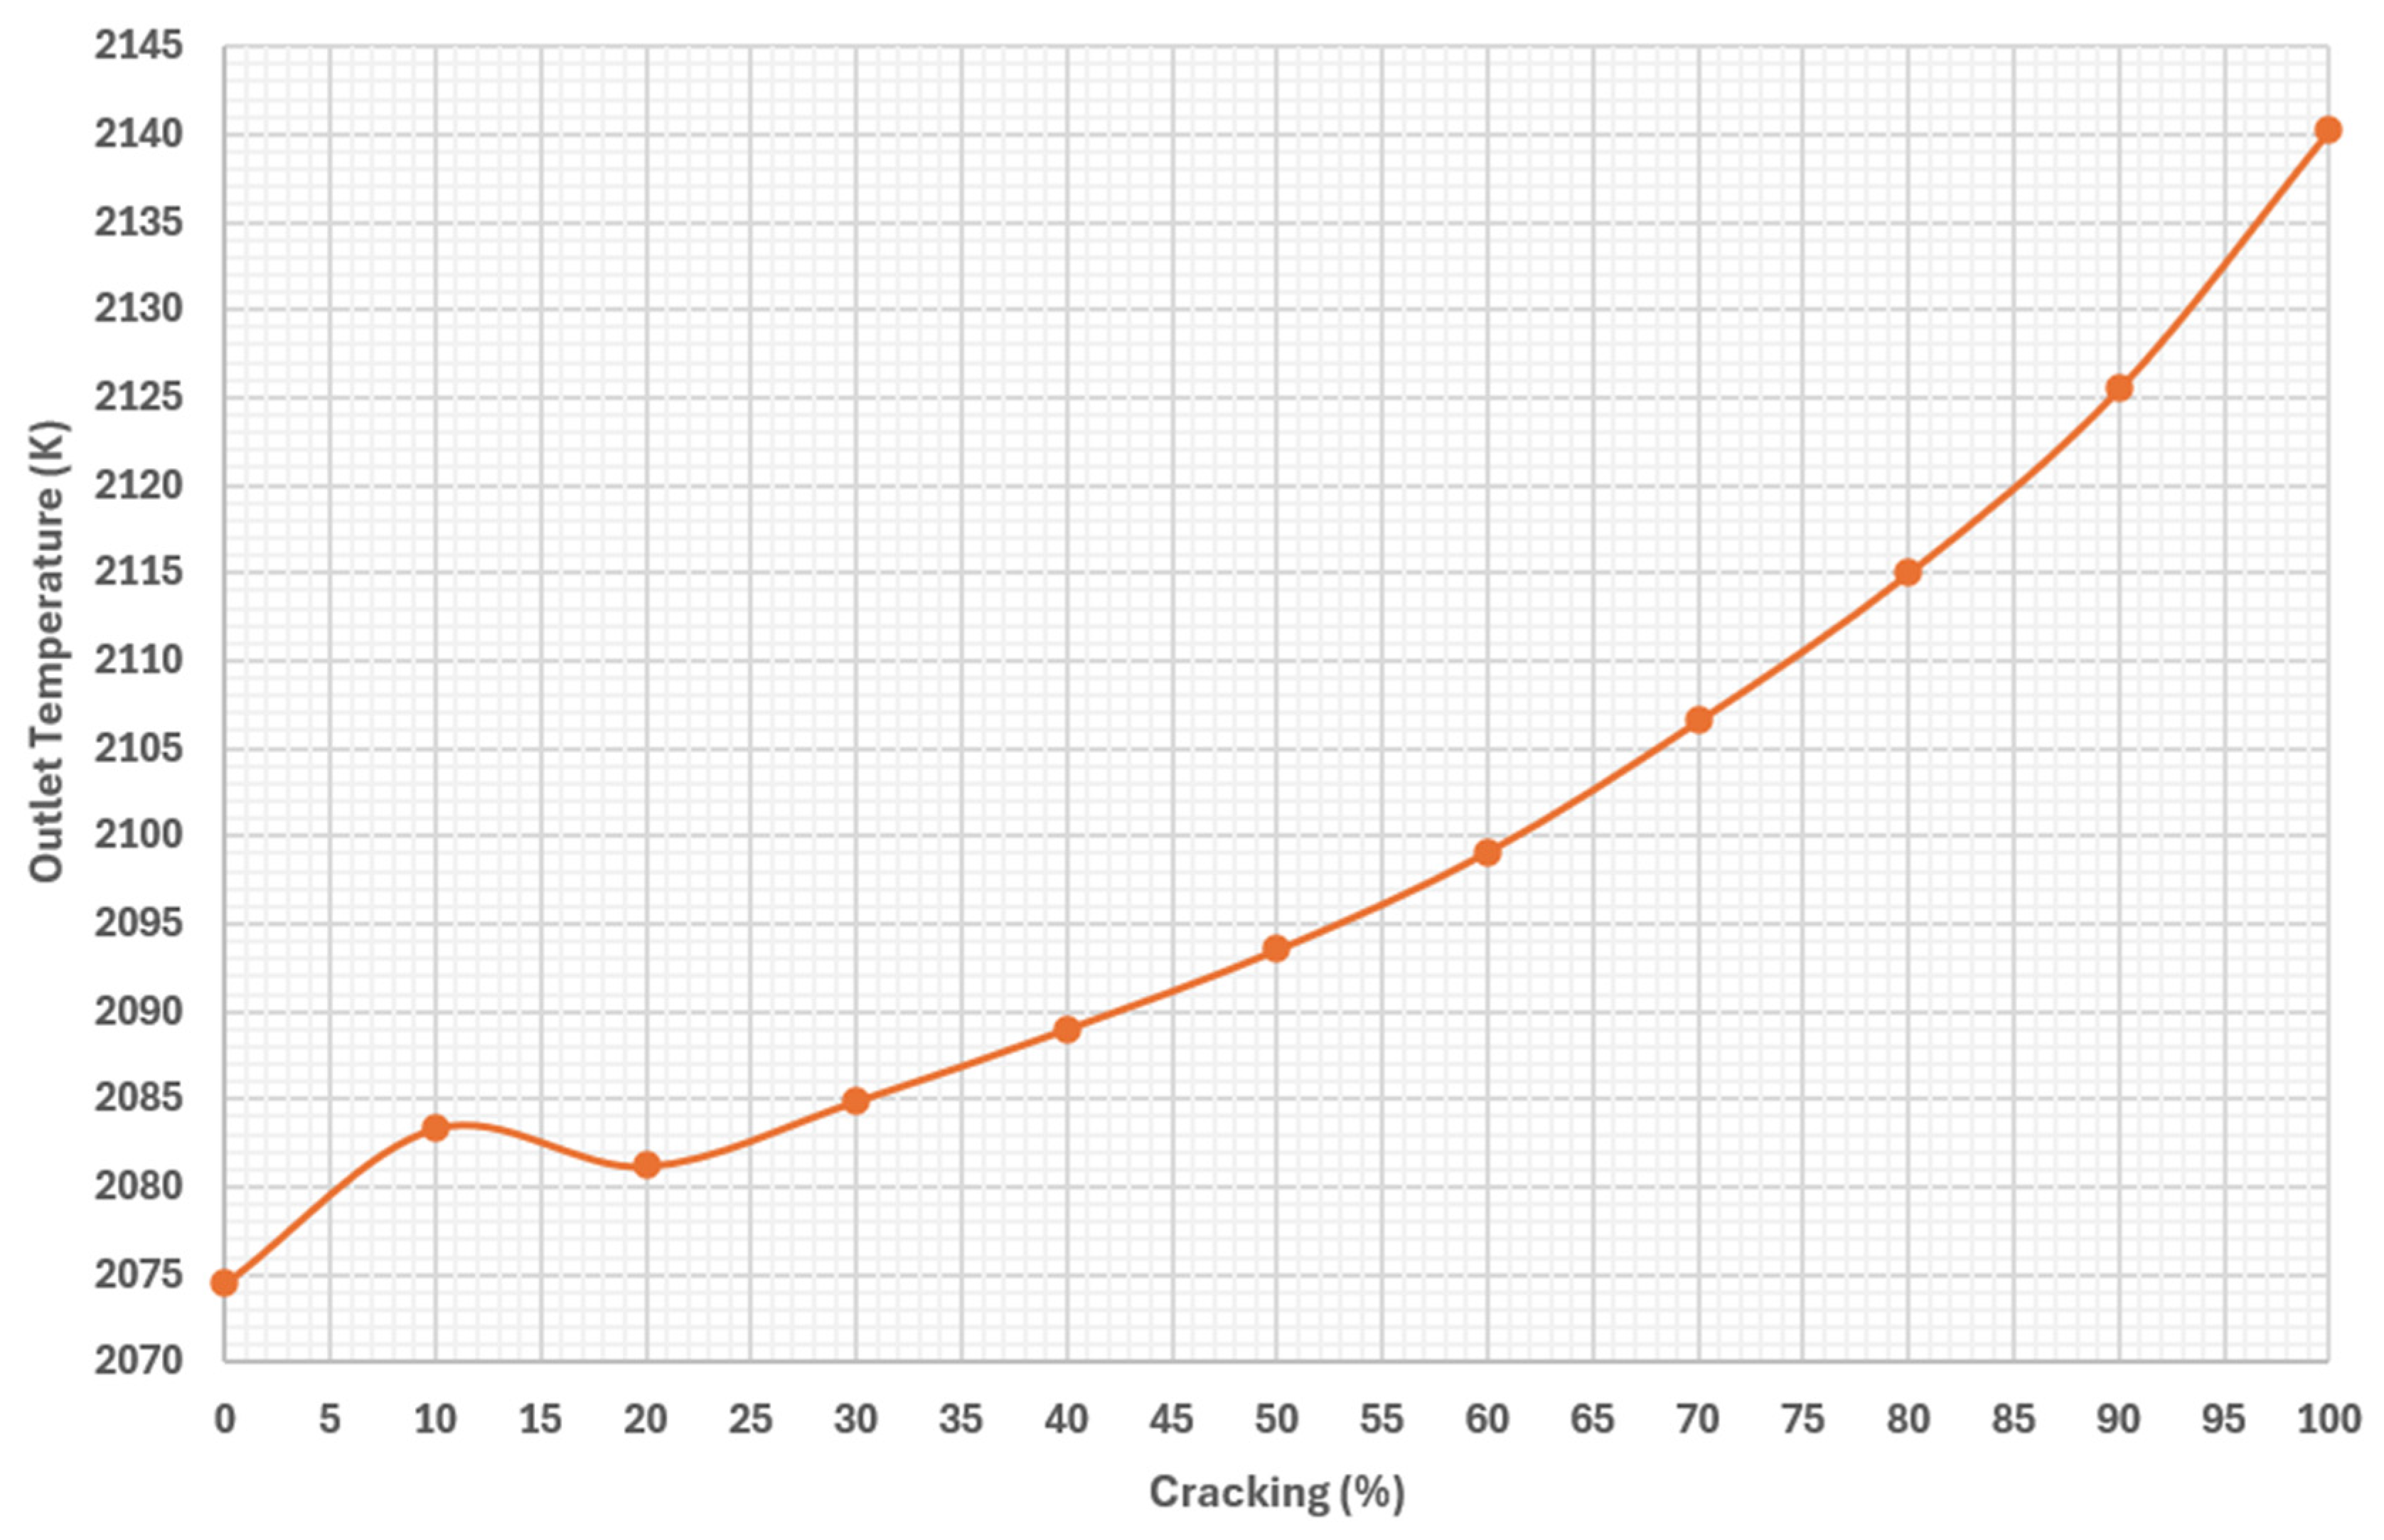
Figure 11 shows the corresponding combustion temperatures.
The results indicate that NO
x emissions initially increase as the ammonia cracking fraction rises. Between 0% and approximately 60% cracking, the NO
x concentration roughly doubles relative to the pure ammonia condition. The increase in NO
x emissions as cracking increases from 0% to 60% generally agrees with experimental and kinetic modeling in Refs. [
10,
11]. This trend can be attributed to two simultaneous effects that occur as cracking increases. Ref. [
24] simulated the same 0% to 100% cracking sweep at stoichiometric conditions that produced a plot of NO
x versus cracking that had a very similar curvature to
Figure 9, with the main difference being that the peak in their NO
x emissions occurring at closer to 70% cracking.
The trend in NO
x emissions shown in
Figure 9 and
Figure 10 can be attributed to two phenomena. First, the composition of the fuel blend gradually shifts from ammonia toward hydrogen and nitrogen. Although the ammonia fraction decreases, the remaining ammonia can still supply sufficient nitrogen atoms during combustion to participate in NO
x formation pathways. Second, the increasing hydrogen content raises the lower heating value of the fuel blend. This leads to increasing flame temperatures, as shown in
Figure 11, which enhances the thermal NO
x formation mechanism.
Together, these effects produce a peak in NOx emissions near a cracking fraction of approximately 60%. Beyond this point, however, the ammonia concentration in the fuel blend becomes increasingly diluted. As the amount of ammonia decreases, the availability of reactive nitrogen species that contribute to NOx formation is reduced. As a result, NOx emissions begin to decline rapidly at higher cracking fractions. By approximately 90% cracking, the emissions have fallen to levels similar to those observed for pure ammonia combustion. At complete cracking, the emissions decrease even further and reach values roughly an order of magnitude lower than the pure ammonia case.
These results highlight an important tradeoff associated with ammonia cracking. Increasing the cracking fraction improves fuel reactivity and flame stability due to the growing hydrogen content. However, moderate levels of cracking can significantly increase NOx emissions because higher temperatures promote thermal NOx formation while sufficient ammonia remains to supply reactive nitrogen species. For aerospace propulsion applications, where after-treatment systems such as SCR may be impractical due to weight and volume constraints, these results suggest that near complete cracking fractions may be necessary to avoid increased NOx emissions.
3.3. Sweep 3: Fully Cracked Ammonia Combustion
The third parametric sweep examines the NOx emissions of FCA. In this case, the fuel blend consists entirely of the decomposition products of ammonia, containing 75% hydrogen and 25% nitrogen by volume with no remaining ammonia. It should be noted that the present study does not address the specific mechanisms required to achieve ammonia cracking in a practical propulsion system. Instead, the analysis focuses on the combustion behavior of the resulting hydrogen–nitrogen fuel mixture.
Figure 12 and
Figure 13 present the NO
x emissions produced during FCA combustion over the same equivalence ratio range considered in the pure ammonia sweep.
A direct comparison between
Figure 12 and
Figure 13 and the pure ammonia results in
Figure 6 and
Figure 7 show that FCA combustion produces substantially lower NO
x emissions across the entire equivalence ratio range. The peak NO
x emission for FCA combustion is approximately 80% less than the peak value observed for pure ammonia and shifts to occurring at the stoichiometric condition, lining up with the peak in flame temperatures shown in
Figure 14. This comparison shows the potential for the development of power systems that produce ultra-low NO
x emissions, facilitated by burning fully cracked ammonia fuel. This cracking sweep should be investigated at other equivalence ratios in ammonia’s flammability range to verify if this potential holds true in general.
The reduction in NOx is primarily attributed to the absence of ammonia in the fuel mixture. Without ammonia, there is no direct source of nitrogen that can readily participate in NOx formation reactions through the fuel-NOx pathway. Instead, the fuel mixture contains only diatomic nitrogen, which is significantly more stable and far less reactive under combustion conditions. This means that the only remaining path for NOx formation is the thermal-NOx pathway that requires high temperatures to meaningfully produce NOx. The excess diatomic nitrogen within a combustor burning fully cracked ammonia fuel also acts as a heat sink, suppressing flame temperatures and in-turn reducing NOx formation.
3.4. Sweep 4: Effect of Ammonia Cracking and Constant Heat Release Rates at Peak NOx Conditions
The final sweep covers the full cracking range while adjusting the fuel flow rate to maintain a constant HRR, starting with the flow rate corresponding to an equivalence ratio of 0.9. Because the fuel flow rate is changing while the air flow rate is held constant, the equivalence ratio for each cracking percentage is therefore not constant. Since the fuel flow rate has to be reduced as the LHV of the fuel increases with cracking to maintain a constant HRR, the equivalence ratio of the combustor will become more fuel-lean.
The trends in the plots in
Figure 15 and
Figure 16 are very similar to those from Sweep 2 where the equivalence ratio was held at 0.9 while the cracking progressed from 0% to 100%. For this fourth sweep, where a constant HRR is maintained, the peak NO
x emissions are slightly higher than those from the constant equivalence ratio case. This was unexpected, as the reduction in fuel flow rate to maintain a constant HRR at each cracking percentage, which in-turn reduces the equivalence ratio, should produce smaller variations in temperature than the constant equivalence ratio case. This more fuel-lean and lower temperature environment was assumed to promote lower NO
x production. Instead, there appears to be a slight increase.
This behavior could be due to a combination of factors, such as fundamental changes in the chemical kinetics within the flame as the blend is cracked, coupled with the possibility of a shift in the peak NO
x emissions with equivalence ratio as the blend changes. There is evidence of this from the third sweep where FCA was burned over an equivalence ratio range, as the peak in NO
x emissions moved from an equivalence ratio of about 0.8 for pure NH
3 combustion to about stoichiometric for FCA combustion. For better certainty, the first sweep in this work should be repeated for each cracking percentage to assess the shift in the trends of NO
x emissions and determine if starting from an equivalence ratio of 0.9 follows an incline. This could be the subject of future work. An analysis of the temperature rise in
Figure 17 will be discussed in the next section and compared to the temperature rise in Sweep 2.
4. Results Discussion
With the parametric sweeps completed, it is important to quantitatively assess how cracking affects the operation of an ammonia-fueled combustor. This section analyzes the results of Sweeps 2, 3, and 4 to directly observe the changes that cracking the ammonia fuel has on combustion temperatures and NOx emissions while using the results of Sweep 1, the pure ammonia sweep, as the reference point.
4.1. Sweep 1 and Sweep 3 Analysis
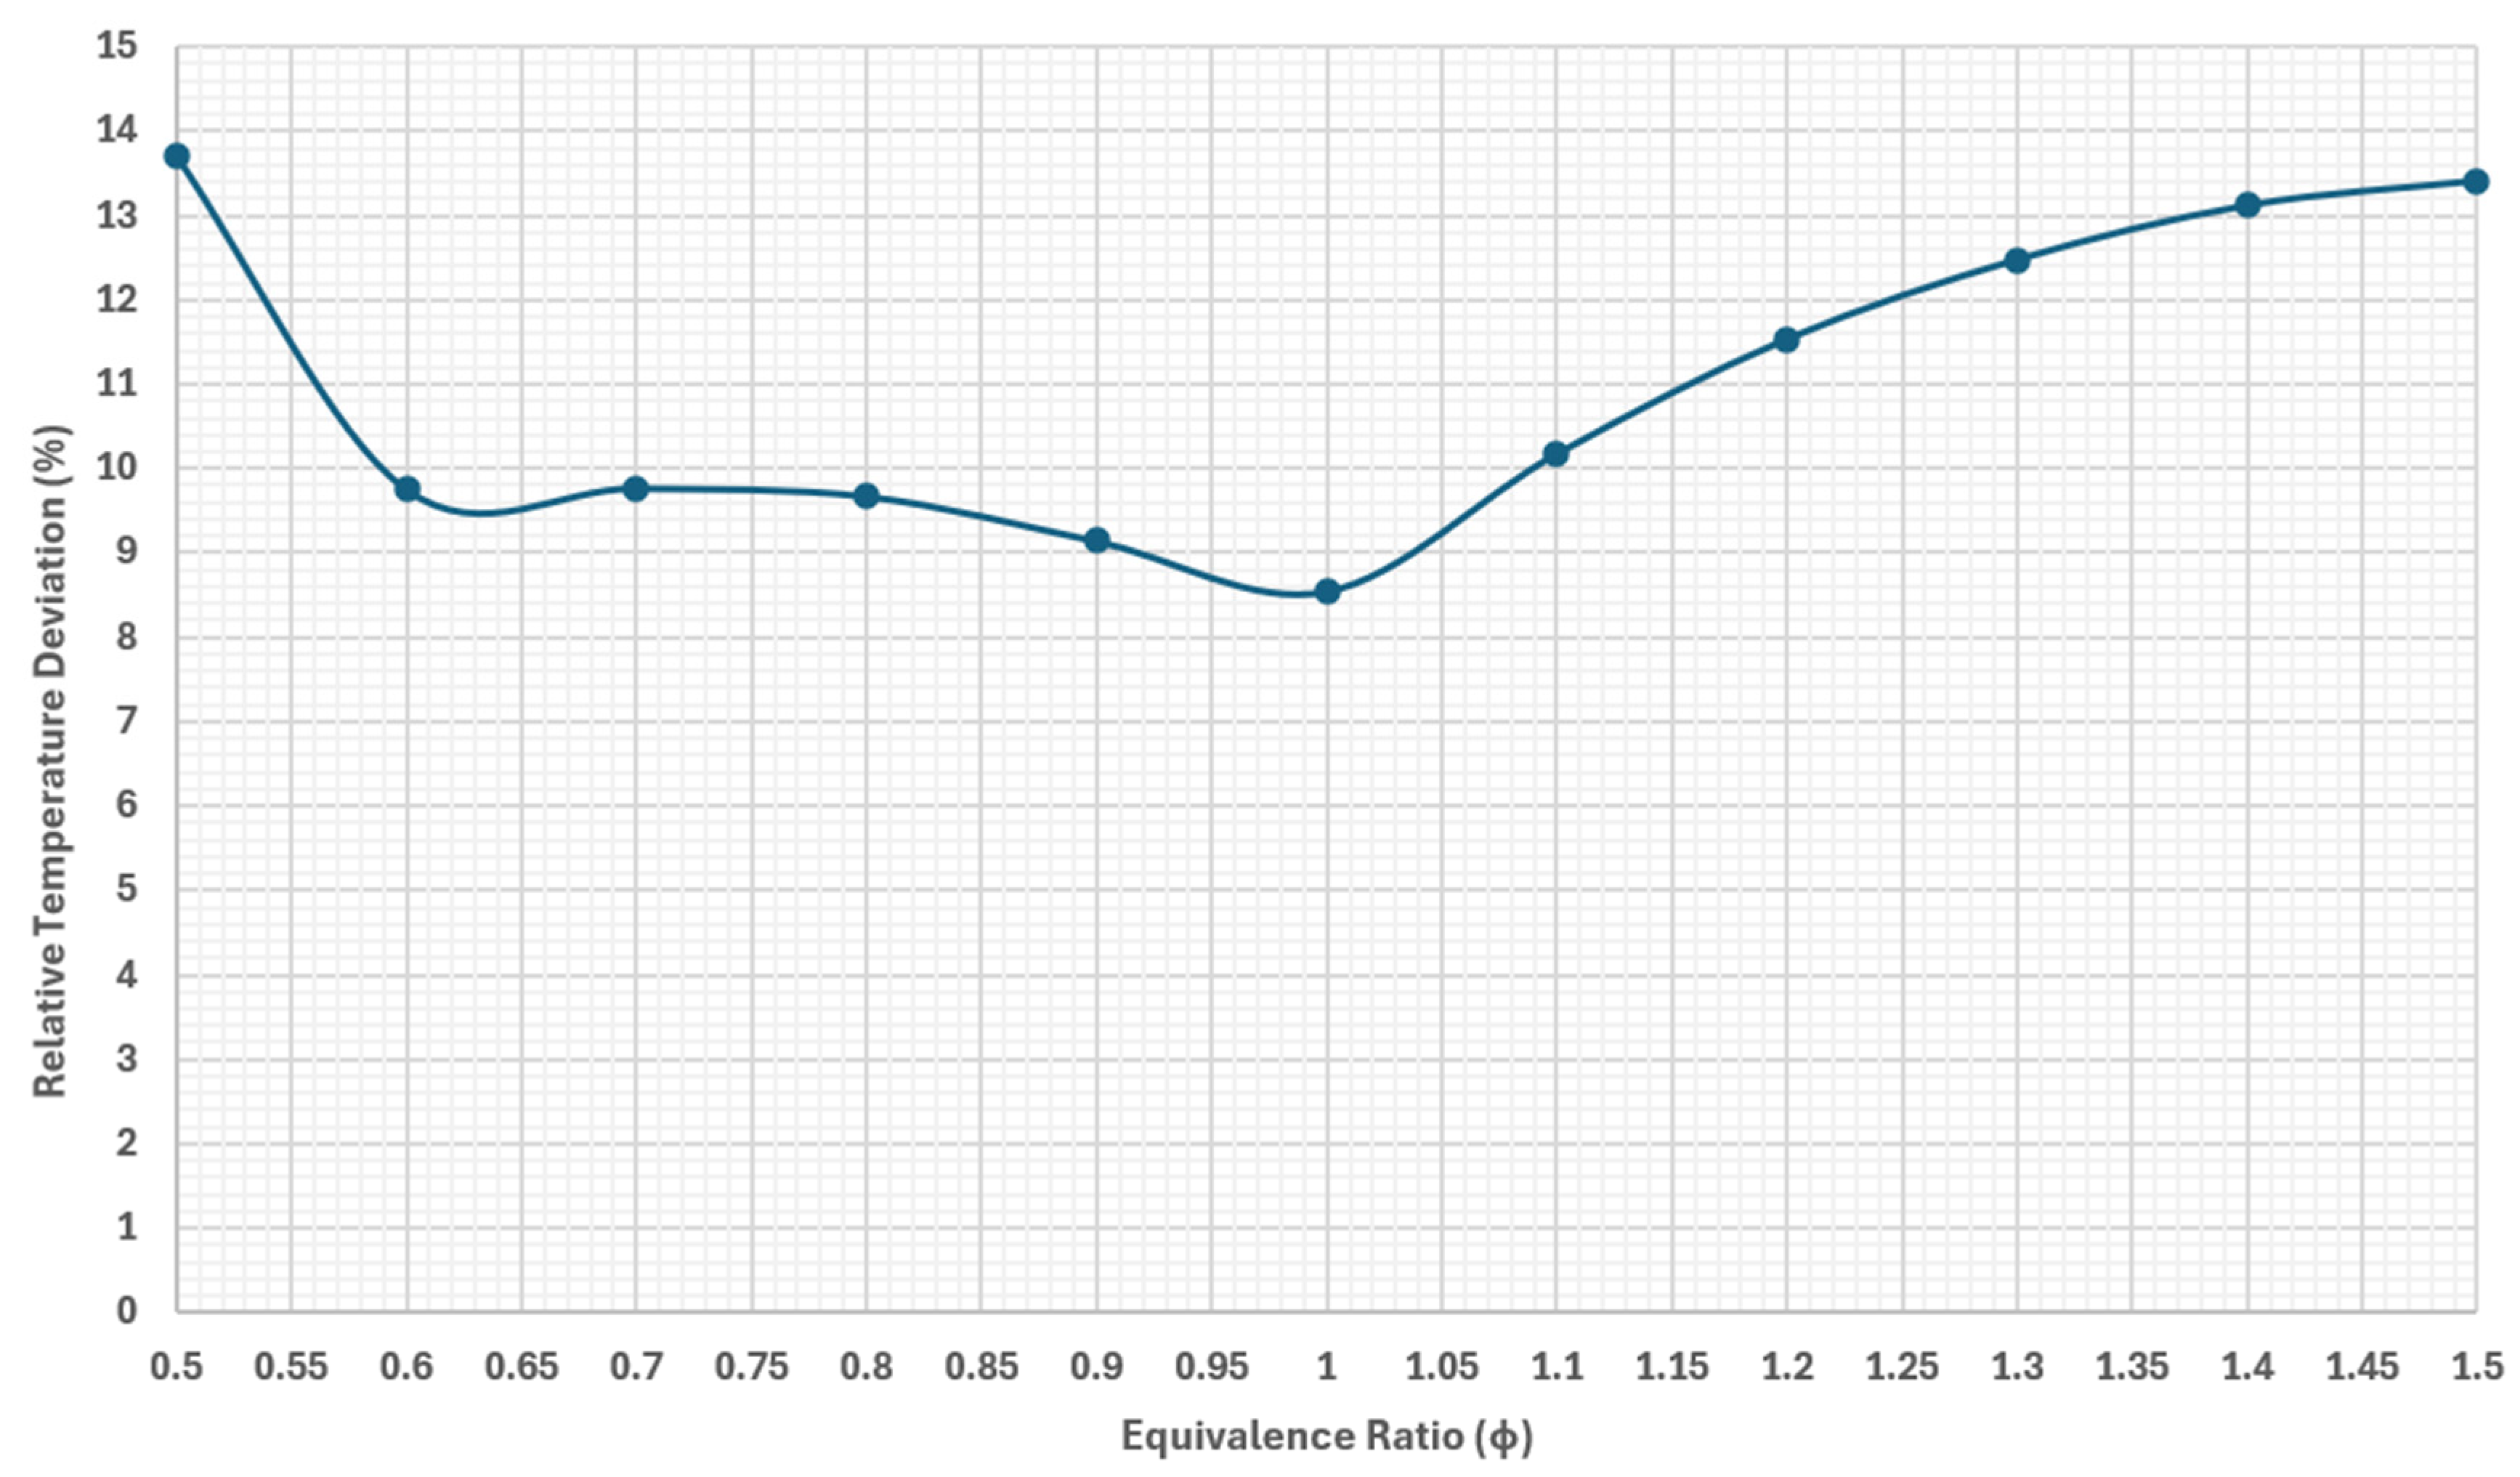
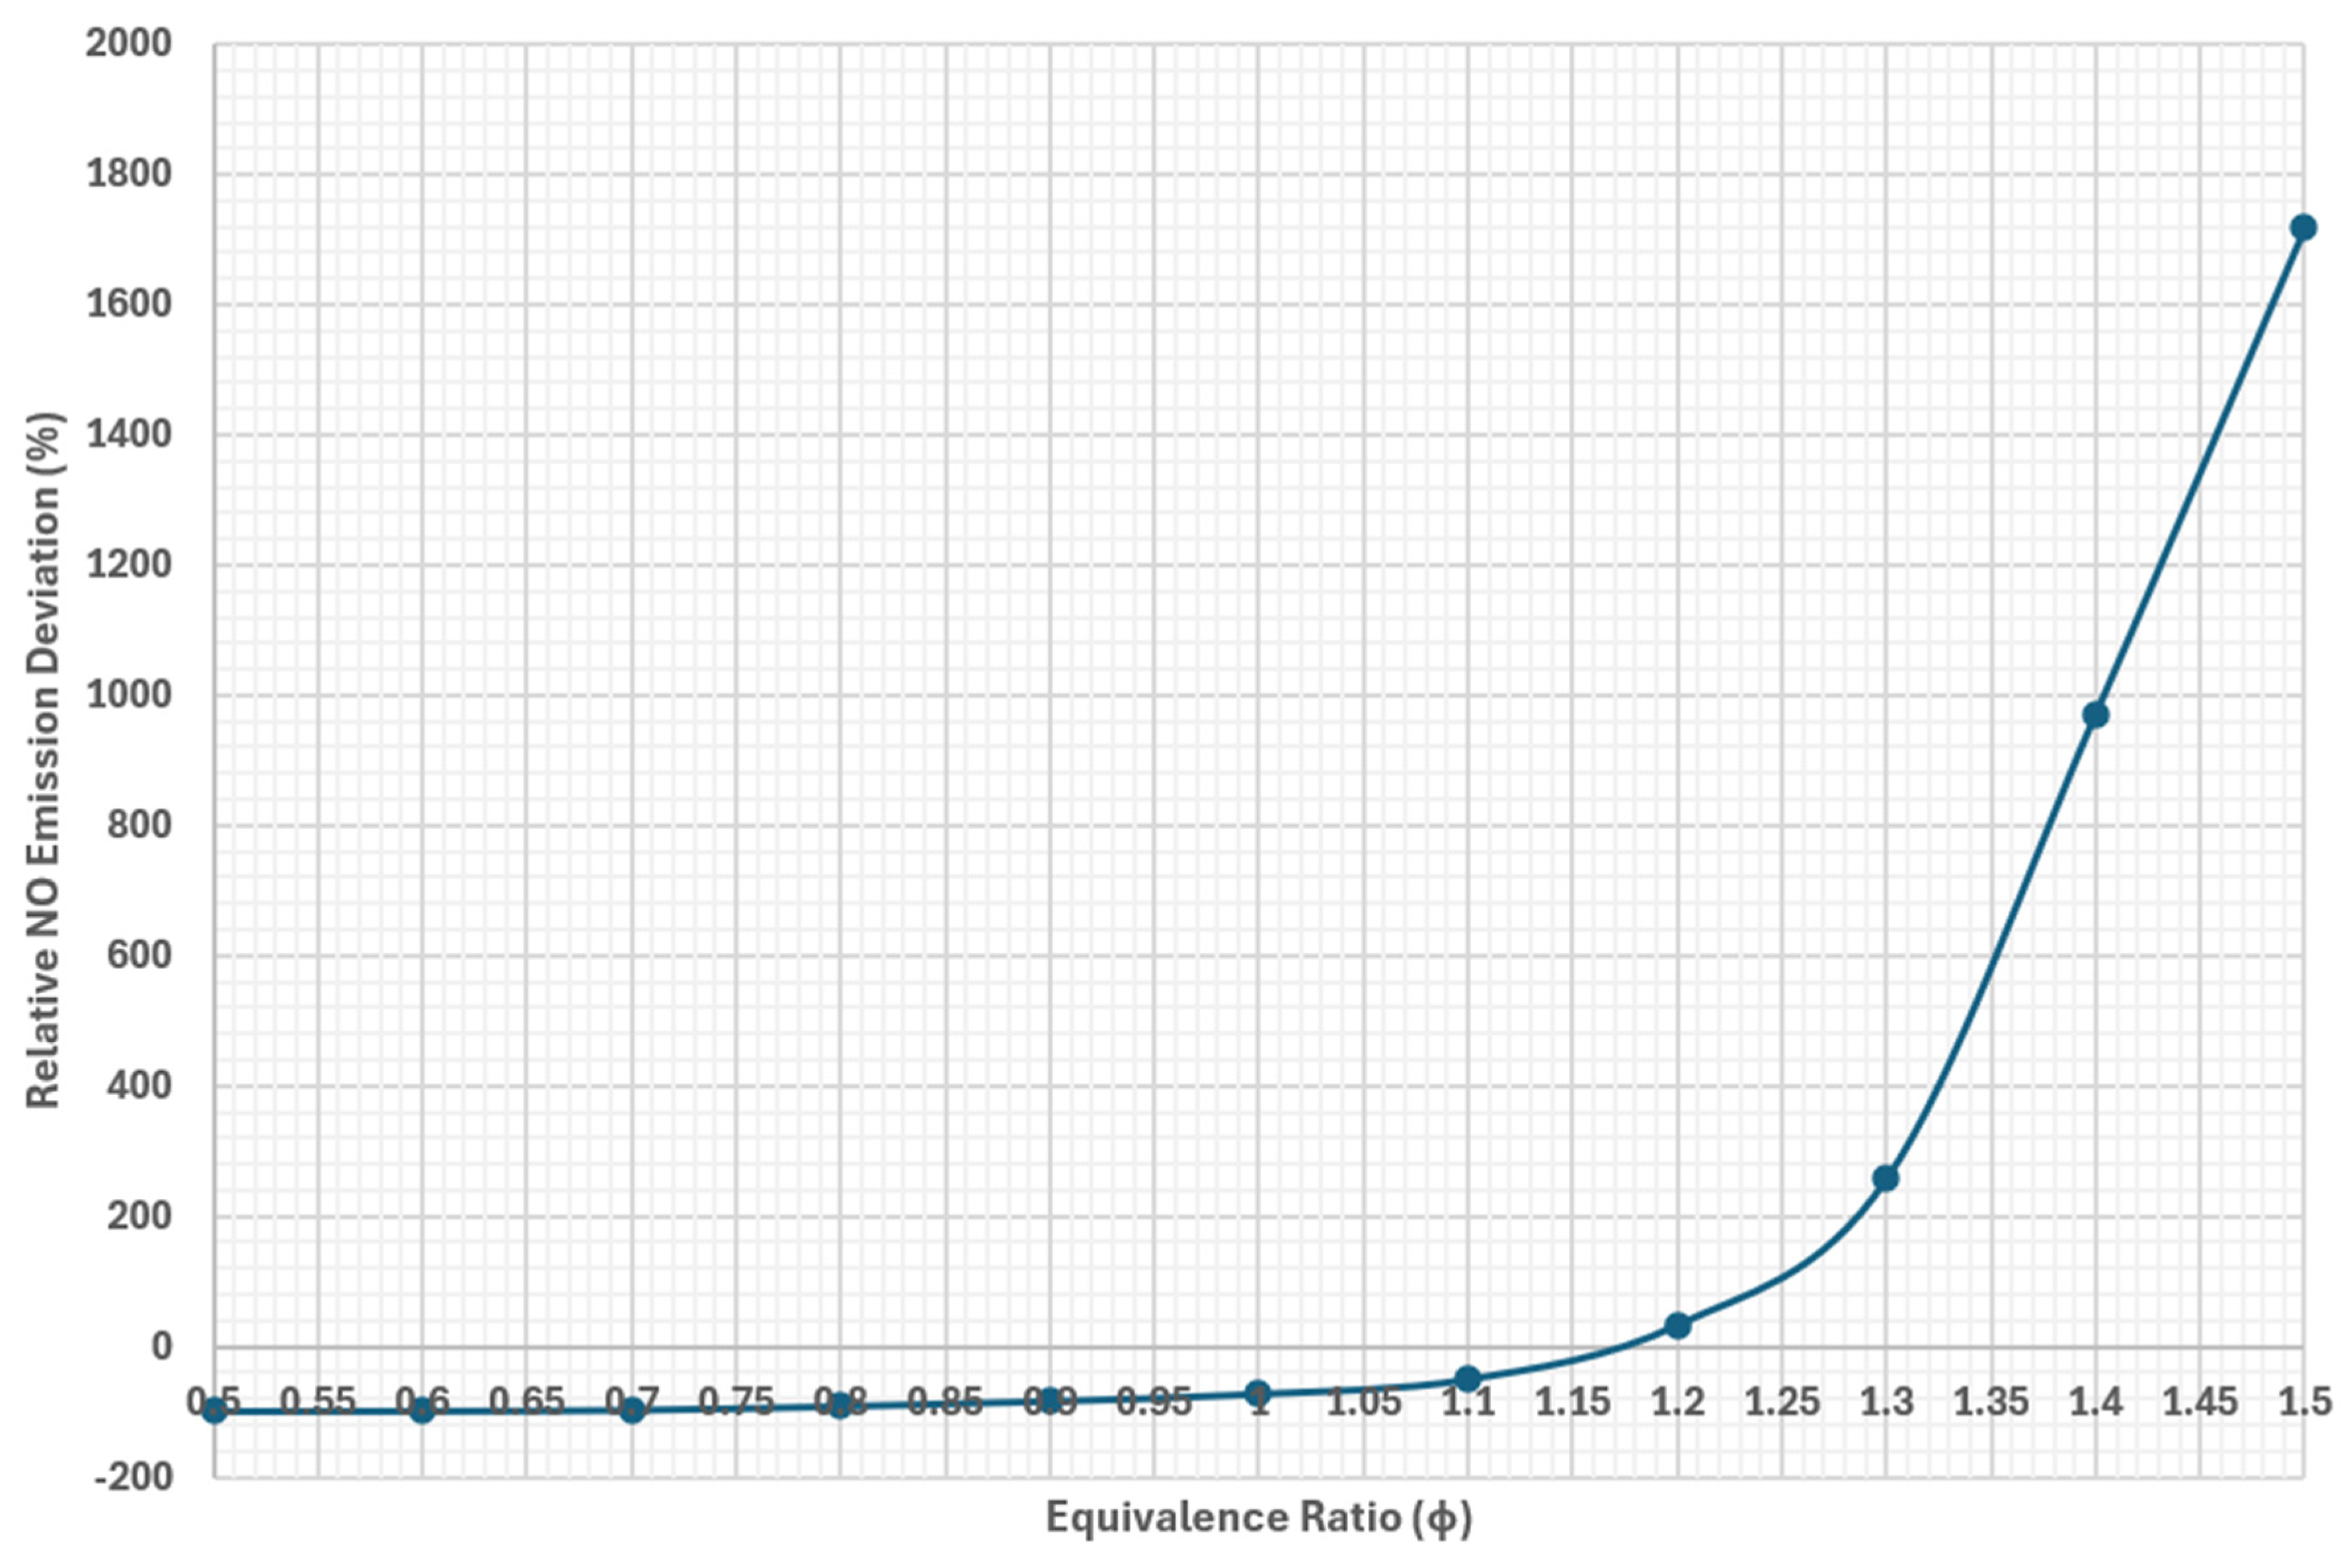
For the first comparison, Equations (11) and (12) can be used at each equivalence ratio with the pure-ammonia data as the reference point to assess the effects that fully pre-cracking the ammonia fuel has on combustor temperatures and NO
x emissions:
where
and
are the wet mole fractions of NO from FCA and pure ammonia combustion, respectively.
Figure 18 shows that FCA combustion produces consistently higher flame temperatures than pure ammonia combustion as a consequence of the increased lower heating value of the cracked fuel blend. The plot indicates that the increase in temperatures is higher at very lean or very rich equivalence ratios. Hydrogen’s much wider flammability range than ammonia [
8] could explain this trend, as a considerable fraction of ammonia molecules are capable of surviving fuel-lean flames at the edges or beyond ammonia’s flammability limits, preventing the complete utilization of the fuel injected into a combustor. This would lead to lower ammonia combustion temperatures than what would have been possible had the fuel been completely burned. Since hydrogen’s flammability range extends much further than ammonia, its lean flame would inherently burn at higher temperatures as more of the hydrogen would be consumed.
Under rich conditions, the leftover ammonia’s endothermic decomposition into hydrogen and nitrogen in this hot environment would cool down the flame by some amount. The decomposition essentially acts as a heat sink within the flame. Since FCA has no ammonia to facilitate this endothermic decomposition, the rich flame would burn at considerably higher temperatures due to the lack of this heat sink.
Figure 19 shows that lean and slightly rich FCA combustion produces lower NO
x emissions than pure ammonia combustion. However, between equivalence ratios of 1.1 and 1.2, FCA combustion overtakes pure ammonia combustion to produce higher NO
x emissions, with a massive increase as the combustor environment becomes more fuel-rich. This is most likely due to the thermal deNO
x trait of ammonia being absent from FCA combustion. As stated previously, ammonia can break down NO
x molecules in hot environments; hence its application as a reducing agent in certain exhaust aftertreatment systems, so fuel-rich ammonia combustion can produce ultra-low NO
x emissions by supplying its own heat source to feed the necessary NOx-consuming reactions. If the ammonia is cracked to absolute completion before burning, however, there is no ammonia for these reducing reactions in fuel-rich environments. This allows more NO
x molecules to survive and be ejected from the combustor.
The results indicate that fully cracked ammonia can simultaneously provide higher heat release rates and substantially lower NOx emissions compared with direct ammonia combustion in systems that require fuel-lean operation. Since high combustion temperatures can be achieved with lower flow rates when using FCA, the specific fuel consumption of a power system would decrease considerably. Furthermore, the reduction in NOx emissions when using FCA would allow a novel power system that stores ammonia as its fuel to be more compliant with environmental regulations than systems fueled by hydrocarbons due to the carbon-free and potentially lower NOx emissions.
4.2. Sweep 2 and Sweep 4 Analysis
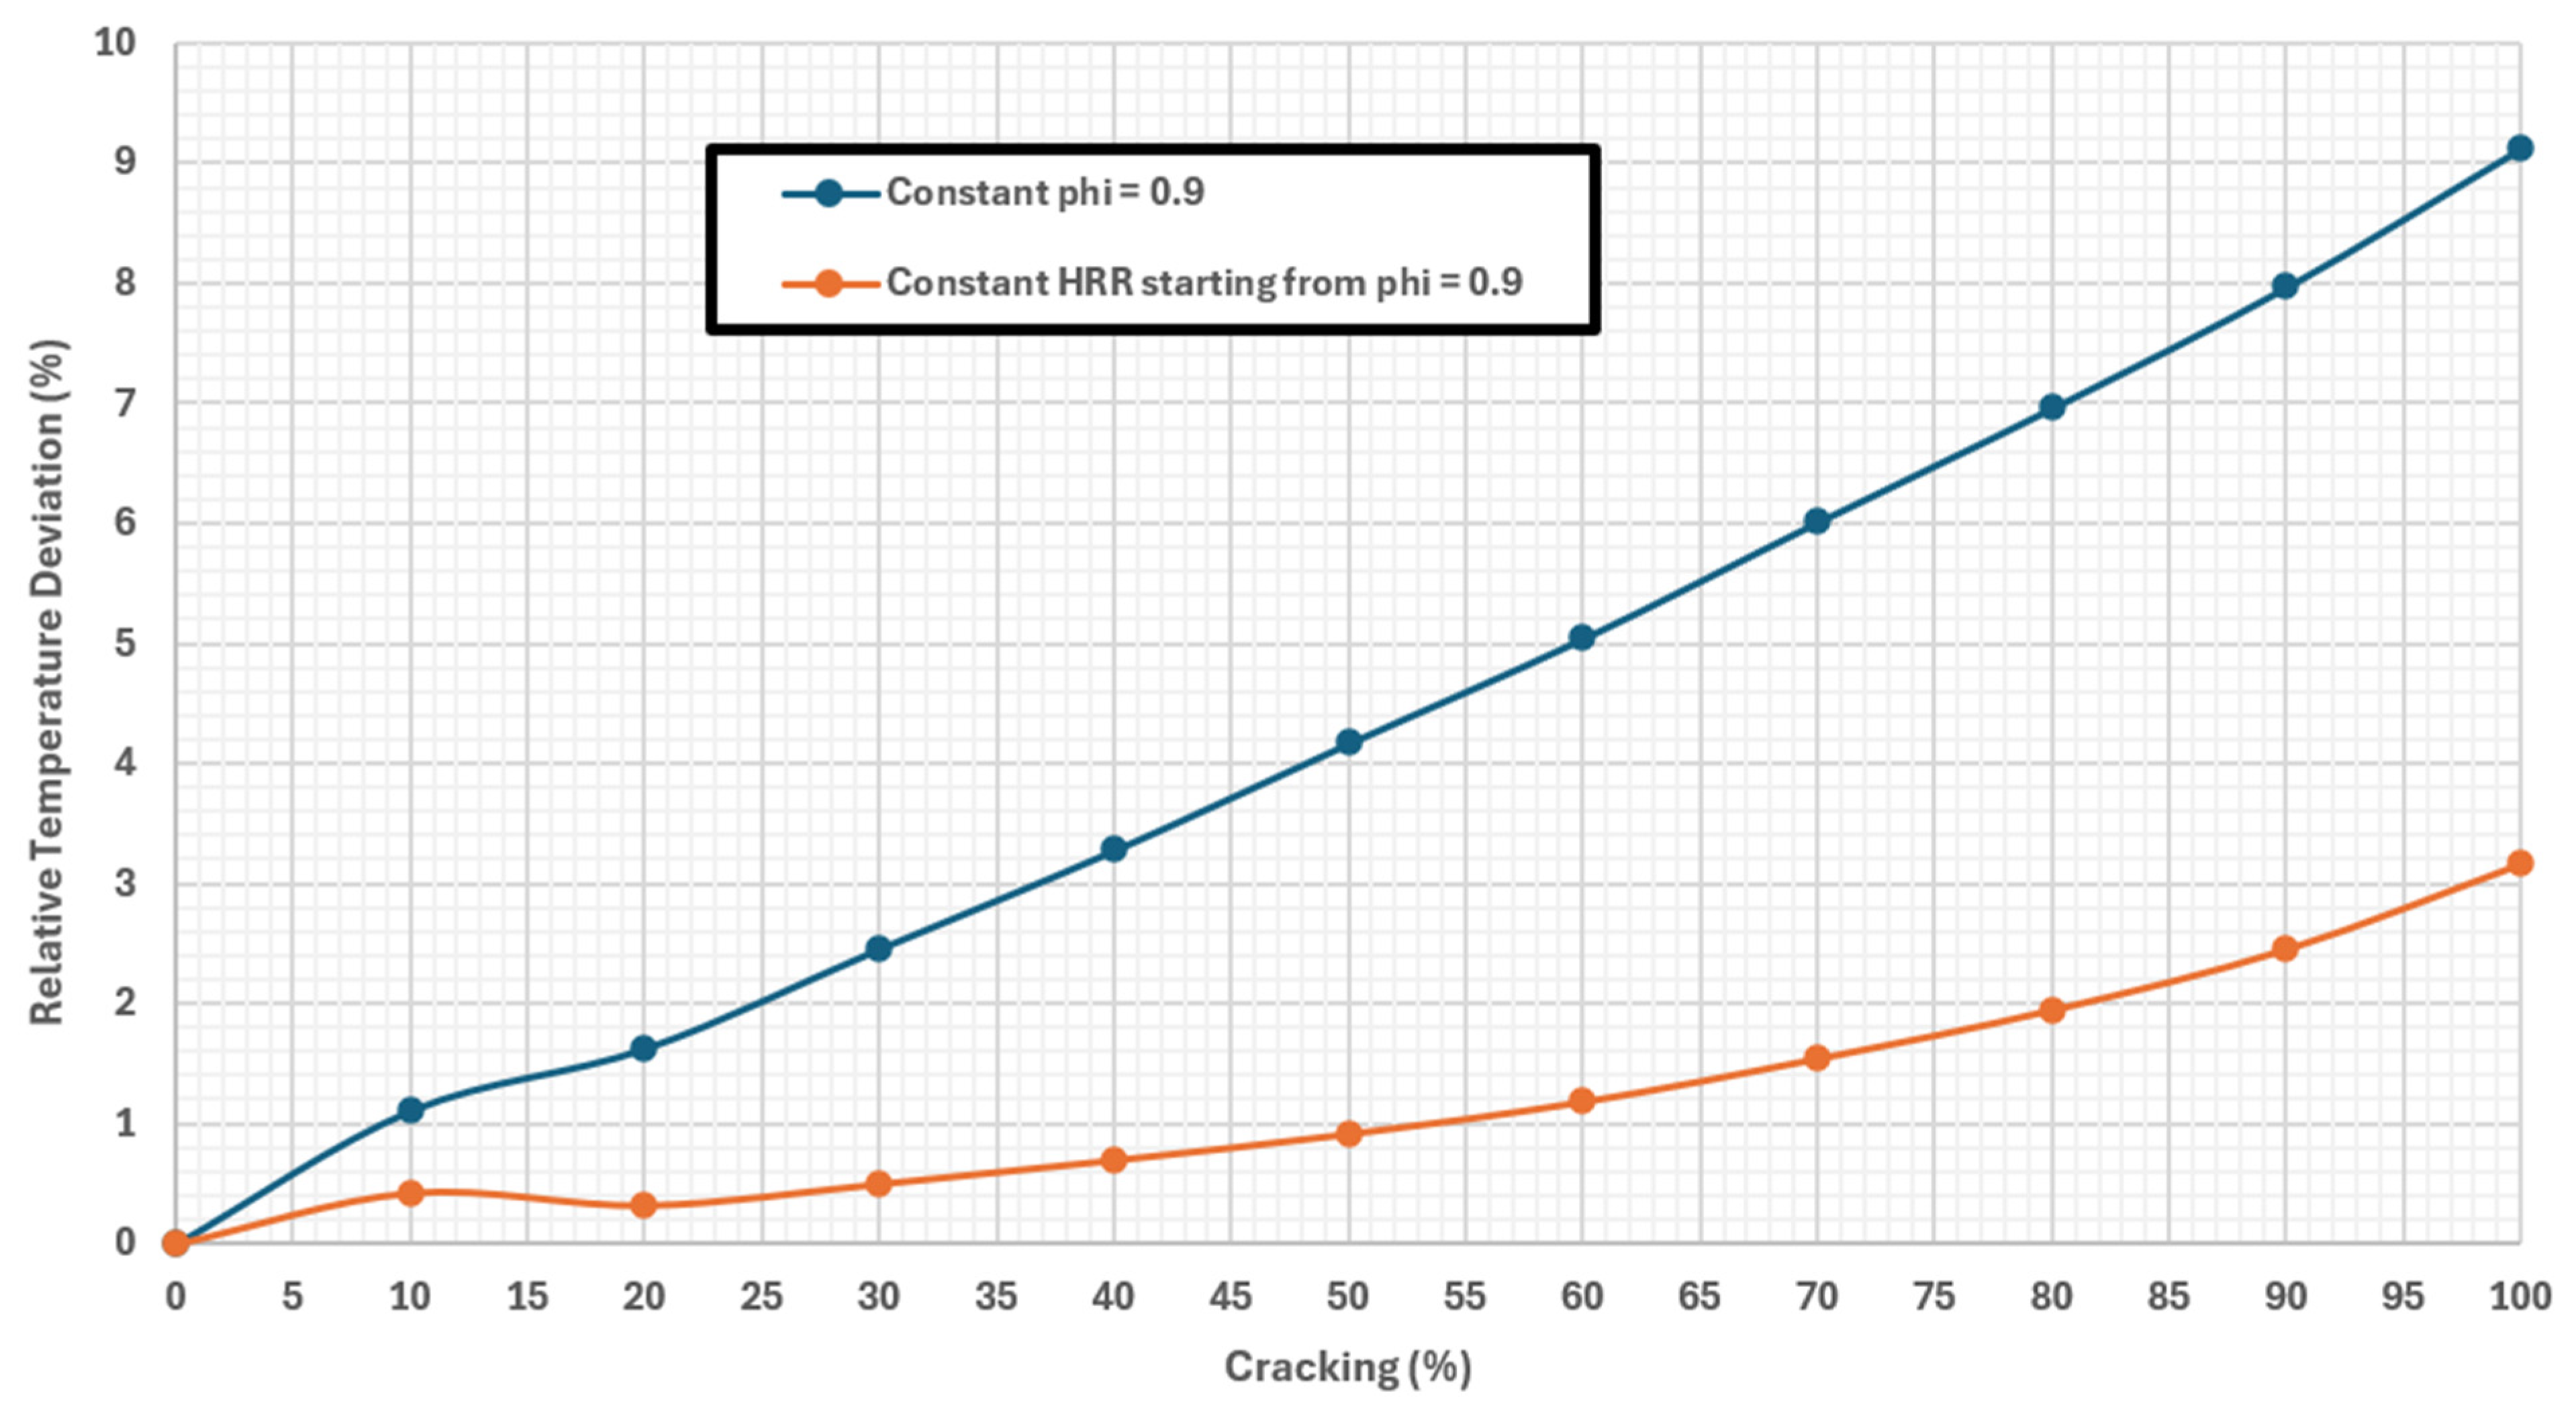
To compare the effect of cracking when holding the equivalence ratio (Sweep 2) or the HRR constant (Sweep 4) on the outlet temperatures of the combustor, the following equation is used to plot the relative deviation in temperature with pure ammonia combustion at an equivalence ratio of 0.9 serving as the reference point:
where
and
are the temperatures and wet mole fractions of NO from Sweep 2 or 4.
and
are the temperatures and wet mole fractions of NO from pure ammonia combustion.
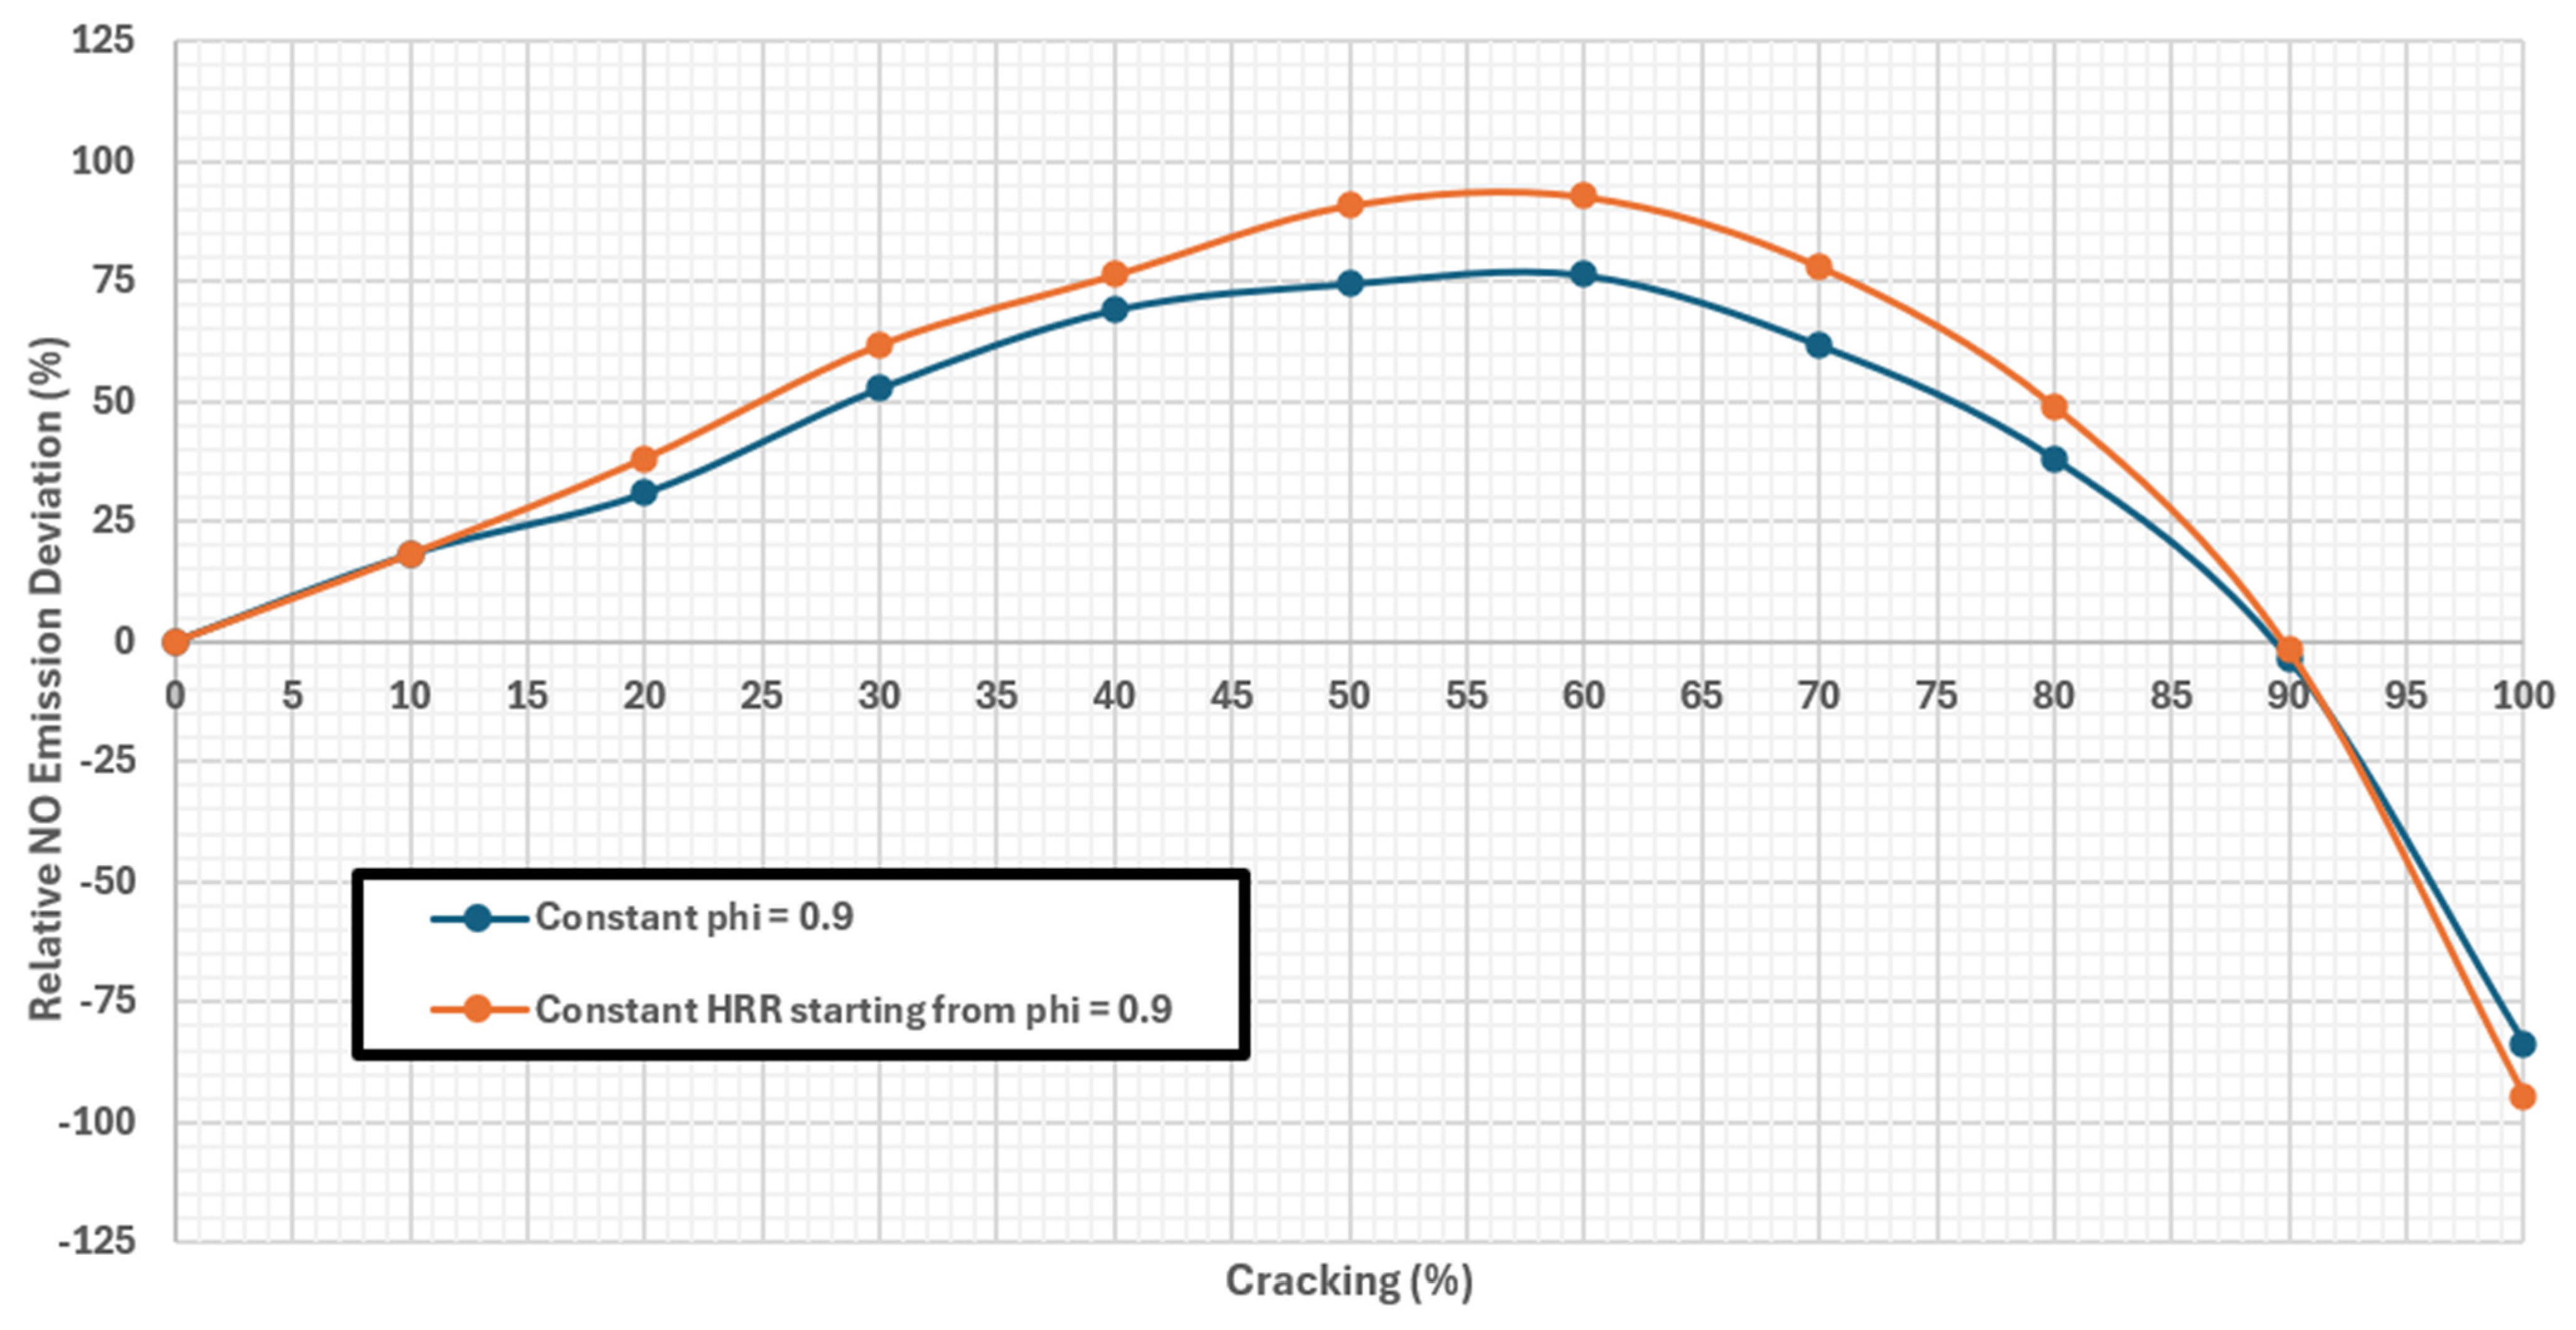
It is very apparent from
Figure 20 that cracking the ammonia fuel while holding the equivalence ratio constant increases the combustion temperatures by a considerably larger amount than holding the heat release rate constant. This can be explained by the fact that, in Sweep 4, the fuel mass flow rate is reduced as the cracking percentage increases to maintain the constant HRR using Equation (1). This produces a gradually more fuel-lean flame, reducing temperatures.
At first, it was assumed that this gradual shift to a leaner flame in Sweep 4 would produce lower NO
x than holding the equivalence ratio constant in Sweep 2, but the plots in
Figure 21 dispel this notion by showing that holding the HRR constant in Sweep 4 generally produced a larger increase in NO
x than Sweep 2 from pure ammonia combustion until about 90% cracking. As stated in the breakdown of the Sweep 4 results in
Section 3, there may be a shift in the peak NO
x emissions from an equivalence ratio of 0.9 for pure ammonia to something close to 0.8 as the cracking increases. This clearly does not hold true for the entire cracking range, as 100% cracking produces peak NO
x emissions at stoichiometric conditions, or an equivalence ratio of 1. The conditions for peak NO
x emissions may also be significantly affected by the fuel and air inlet conditions as well as the operating pressure of the combustor. To be certain, Sweep 1 would have to be repeated for each cracking percentage between 0% and 100% while using the inlet and operating conditions outlined in Ref. [
9] at the minimum. This study would take an extensive amount of time to complete through CFD simulations, so using a dedicated chemical kinetics analysis tool like Cantera would be preferable for this endeavor and could be the subject of future work.
4.3. Summary
Overall, the simulation results demonstrate that ammonia cracking has a complex influence on NOx emissions. Partial cracking initially increases emissions due to elevated flame temperatures and the continued presence of reactive nitrogen-based species. However, as the cracking fraction approaches complete decomposition, the ammonia concentration becomes sufficiently diluted that NOx formation is greatly reduced. Fully cracked ammonia therefore represents a promising pathway for enabling low-emission combustion while retaining the storage and infrastructure advantages associated with ammonia fuel.
The results collectively illustrate the dual role of ammonia cracking in combustion performance. Increasing the cracking fraction improves the reactivity of the fuel mixture due to the growing hydrogen content, which enhances flame stability and increases heat release rates. At the same time, the simulations show that moderate levels of cracking can intensify NOx formation because higher combustion temperatures promote thermal NOx pathways while sufficient ammonia remains to supply reactive nitrogen species. Only when the cracking fraction approaches complete decomposition does the ammonia concentration become sufficiently diluted to significantly suppress NOx formation. These findings indicate that near-complete ammonia cracking may be required to simultaneously achieve acceptable combustion stability and low emissions in ammonia-fueled combustors.
5. Conclusions
This study used computational fluid dynamics coupled with detailed chemical kinetics to investigate how varying degrees of ammonia cracking influence combustion behavior and NOx formation. The results show that combustion of pure ammonia produces very high NOx emissions, reaching levels in the thousands of parts per million. Introducing partial cracking initially increases NOx formation, with emissions peaking at approximately 60% cracking due to the enhanced reactivity and elevated flame temperatures associated with hydrogen addition. However, at sufficiently high cracking levels, the combustion characteristics shift and NOx emissions decrease substantially.
At cracking fractions approaching 90% or greater, the fuel mixture benefits from an increase in lower heating value of approximately 14.5% while simultaneously reducing peak NOx emissions by up to about 90% at the highest NOx-emitting condition for pure ammonia combustion. These findings highlight the strongly nonlinear relationship between ammonia cracking fraction, combustion temperature, and NOx formation. The results therefore suggest that while partial cracking can exacerbate NOx formation, sufficiently high levels of cracking may enable ammonia-based combustion systems to achieve improved energy release while mitigating emissions.
Future work should focus on validating these computational trends against available experimental data and further exploring the practical implementation of ammonia cracking systems in propulsion environments. In particular, the integration of efficient cracking technologies with ammonia-fueled aeroengines represents an important step toward enabling carbon-free aviation while avoiding the unintended consequence of increased NOx emissions. Another avenue of investigation would be to assess the effects of ammonia cracking on the performance of two-stage combustors, since this style of combustor is practically required to ensure low NOx emissions when using ammonia fuel, especially for gas turbines. Much literature has already been produced on the design and modeling of two-stage combustors that use pure ammonia fuel but very little on cracked ammonia fuel in this application. This provides the potential to fill a relatively large research gap. Overall, these results underscore the importance of carefully managing ammonia cracking in future propulsion systems, as the degree of fuel decomposition may play a critical role in determining whether ammonia can be used as a practical carbon-free aviation fuel without exacerbating NOx emissions.