Article

Effects of Superheat and Secondary-Fluid Inlet Temperature on a Water-Cooled Transcritical CO2 Heat Pump


1
Department of Energy Facility, Korea Polytechnic University, Chungju 27324, Republic of Korea
2
Department of Refrigeration and Air-Conditioning Engineering, Pukyong National University, Busan 48513, Republic of Korea
*
Author to whom correspondence should be addressed.
Energies 2026, 19(18), 4273; https://doi.org/10.3390/en19184273
Submission received: 6 August 2026 / Revised: 4 September 2026 / Accepted: 7 September 2026 / Published: 9 September 2026
(This article belongs to the Section J2: Thermodynamics)

Abstract

This study aims to provide essential data for the optimal design of a transcritical CO2 water-cooled heat pump system utilizing an internal heat exchanger (IHX). To investigate cycle and application characteristics, a heat pump test rig consisting of a compressor, gas cooler, expansion valve, evaporator, IHX, and liquid receiver was fabricated. All heat exchangers were counterflow, concentric dual copper tubes. System performance was evaluated by varying the IHX and evaporator outlet superheat degrees (10–30 °C and 0–20 °C, respectively) via expansion valve opening control, alongside changes in the secondary fluid inlet temperature. The experimental results indicate that optimal high-pressure conditions exist to maximize both capacity and coefficient of performance (COP) in cooling and heating modes. Furthermore, changes in the secondary fluid inlet temperatures of the evaporator and gas cooler significantly impact the COP, showing trends similar to conventional Freon-based systems. Ultimately, precise control of the expansion valve opening, using the IHX outlet superheat as a control variable, is a key factor in operating the CO2 heat pump system near its maximum COP.

1. Introduction

Owing to the ozone-depleting and greenhouse effects of chlorofluorocarbon (CFC)- and hydrochlorofluorocarbon (HCFC)-based refrigerants, interest in natural refrigerants has grown substantially in recent years. Among these, carbon dioxide (CO2) has attracted particular attention—especially in Western developed countries—owing to its environmental friendliness and ready availability. Research on CO2-based systems is steadily expanding into applications such as residential water heaters, heat pumps, and automotive air-conditioning systems, and in Korea, active development is likewise underway, particularly for CO2-based heating, ventilation, and air-conditioning (HVAC) systems and heat pumps.
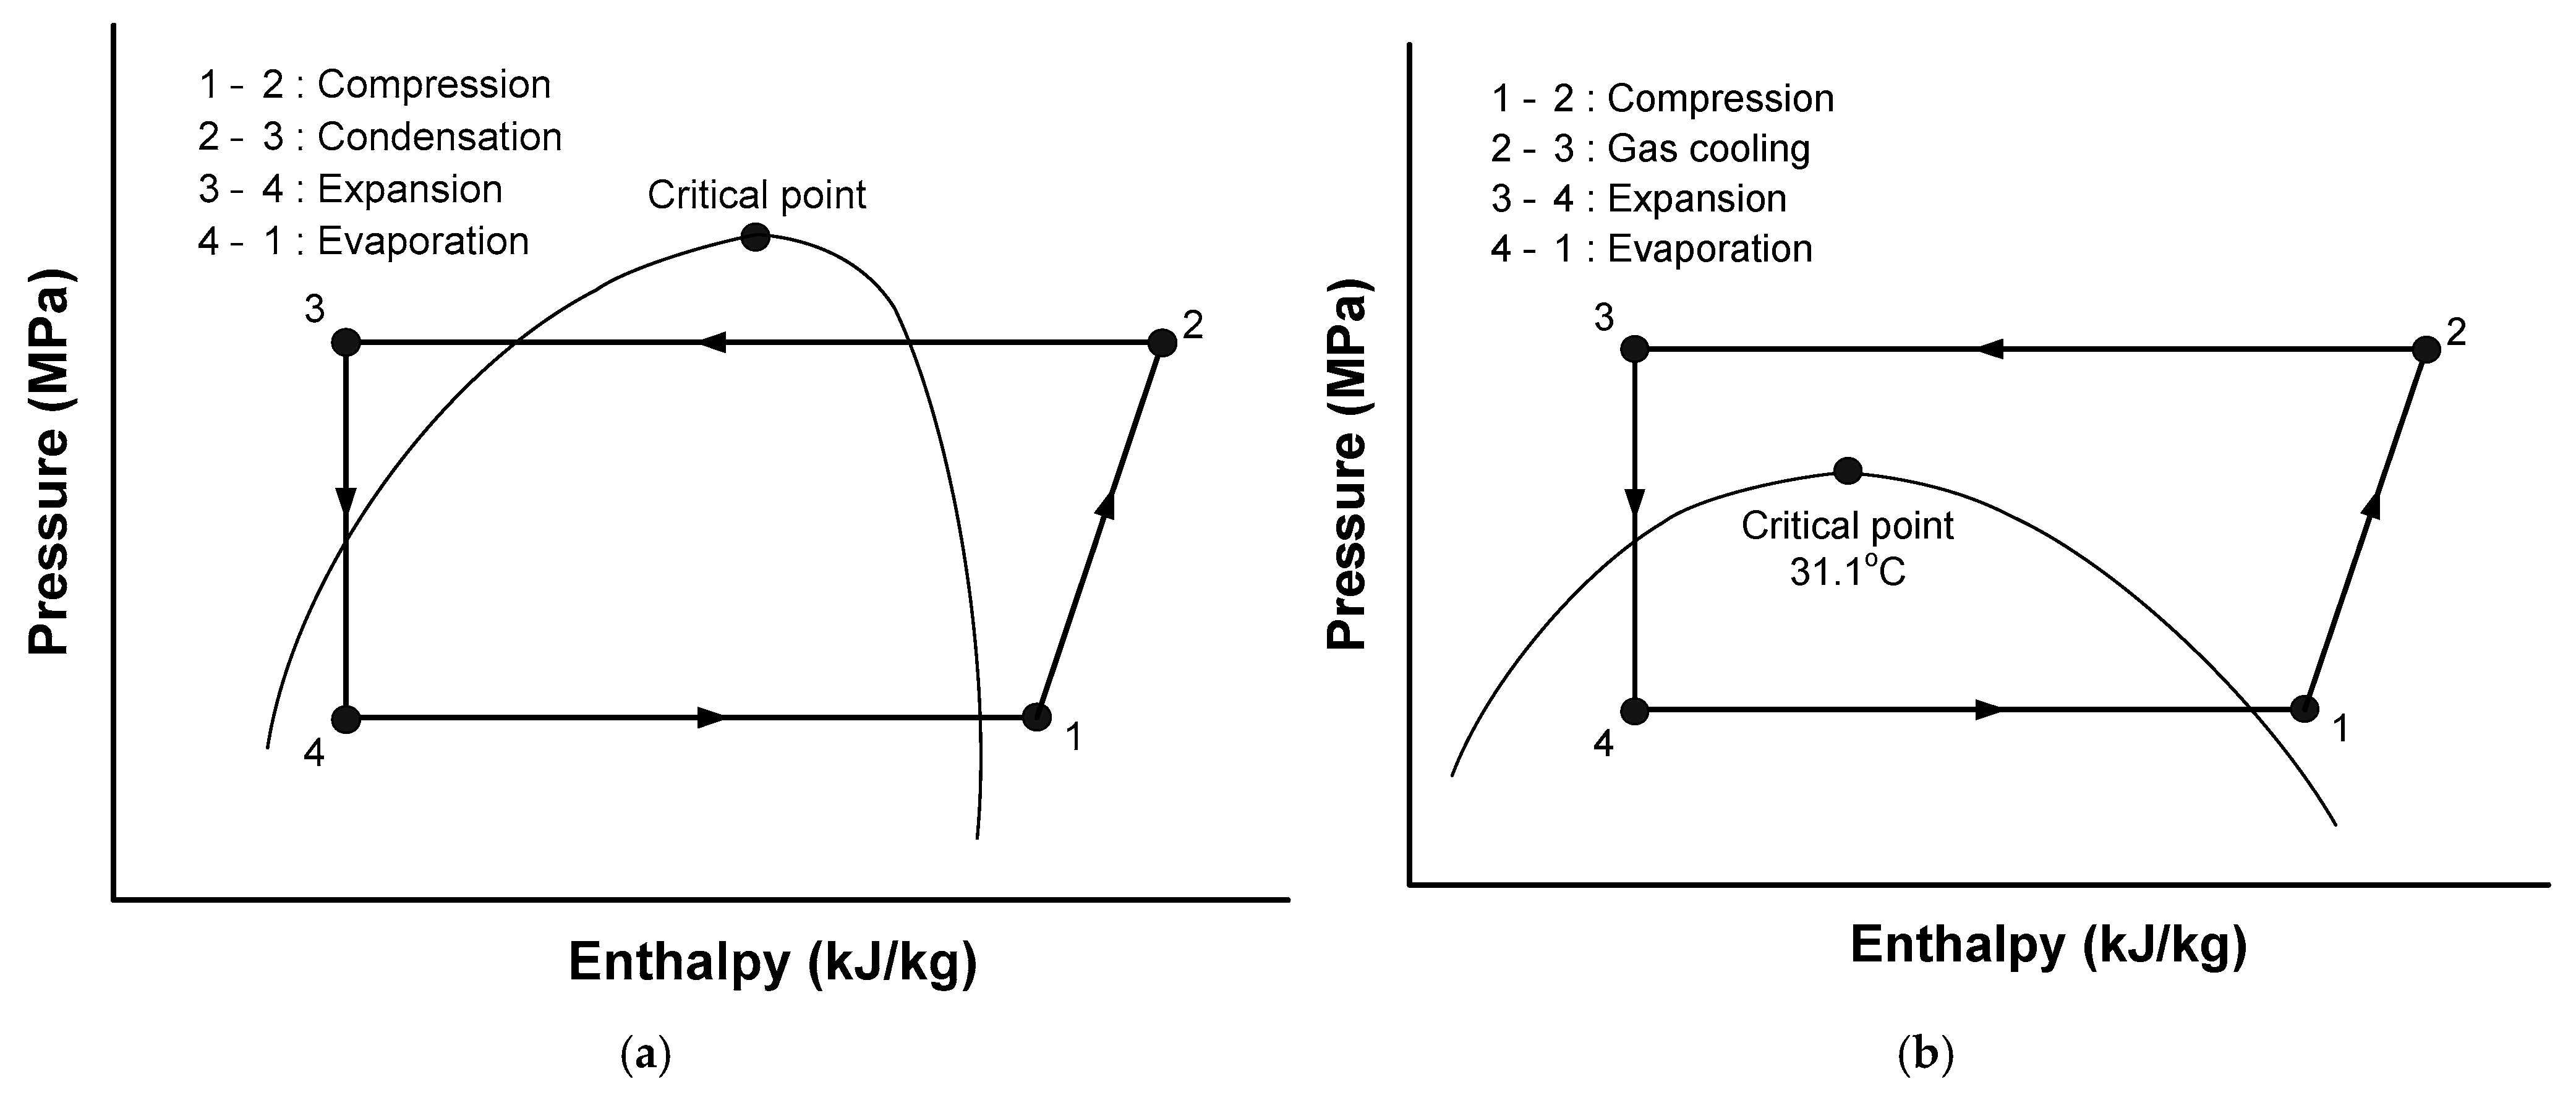
As shown in Figure 1, CO2 heat pump systems operate on a transcritical cycle, in which the high-pressure side (gas-cooling pressure) lies above the critical point owing to CO2’s low critical temperature (31.1 °C) and high critical pressure (7.38 MPa). Consequently, the thermodynamic performance of transcritical CO2 cycles is generally lower than that of conventional subcritical cycles [1,2]. CO2 heat pumps therefore require not only a control system capable of maintaining optimal operating conditions but also a system design that enhances overall performance. One effective approach to addressing these challenges and ensuring stable operation is the installation of an internal heat exchanger (IHX). Since the early stages of CO2 heat pump research, the application of IHXs has been extensively investigated as a means of improving system performance.
A review of previous studies on CO2 heat pump systems reveals a range of findings regarding IHX performance. Lorentzen and Pettersen [3] reported that although the coefficient of performance (COP) improvement achieved through an IHX results from reduced expansion losses via subcooling of the liquid refrigerant prior to expansion, this benefit is partially offset by an increase in the average gas cooler temperature. Bivens et al. [4], investigating alternative refrigerants, found that refrigeration systems equipped with IHXs and counterflow heat exchangers achieved a performance improvement of approximately 6–7%. Bullock [5] reported that increasing the evaporator outlet superheat from 0 °C to 20 °C via an IHX raised the system COP by approximately 5%, whereas Rozhentsev and Wang [6] observed that once the IHX heat transfer area exceeded a certain threshold, the system COP actually declined. In contrast, Boewe et al. [7] emphasized that an IHX could enhance system COP by up to 25%.
More recent studies have quantified these effects in greater detail. Sarkar et al. [8] performed an energy and exergy analysis of a supercritical CO2 heat pump equipped with an IHX and found that although IHX efficiency had a negligible effect on COP, it improved second-law (exergy) efficiency; specifically, increasing the IHX efficiency from 0.6 to 0.9 raised exergy efficiency by approximately 3%. Cho et al. [9] reported that adopting an IHX reduced the optimal discharge pressure by approximately 0.5 MPa, and that at compressor frequencies between 40 and 60 Hz, the cooling capacity and COP increased by 6.2–11.9% and 7.1–9.1%, respectively. Chen and Gu [10] argued that conventional heat exchanger efficiency equations are unsuitable for CO2 heat pump systems and proposed a more practical enthalpy-based IHX efficiency formulation, further finding that the IHX significantly reduces system sensitivity to the vapor quality at the evaporator outlet. Aprea and Maiorino [11] experimentally evaluated the effect of an IHX on a supercritical CO2 system and reported a 10% improvement in COP, attributable to an increase in cooling capacity and a reduction in the optimal high-side pressure. Purohit et al. [12] conducted experiments on a supercritical CO2 system and reported that the benefits of an IHX are most pronounced at ambient temperatures up to 45 °C at an evaporation temperature of 5 °C, where the COP and exergy efficiency increased by 5.71% and 5.05%, respectively.
Cao et al. [13] investigated the effect of IHX length through theoretical and experimental analyses. They found that increasing the IHX length from 0 to 4 m reduced the optimal discharge pressure by more than 1 MPa and increased the compressor discharge temperature.
Cui et al. [14] recently reviewed transcritical CO2 air-source heat pump systems and identified dynamic operating-condition control as one of the major remaining technical challenges. This finding highlights the need for experimentally validated control parameters that can be directly implemented in practical CO2 heat pump systems. In this context, the present study investigates the IHX-outlet superheat ( D S H I H X ) as a directly controllable parameter and experimentally evaluates its influence on the performance of a water-cooled transcritical CO2 heat pump under varying secondary-fluid inlet temperatures.
Although the studies reviewed above [3,4,5,6,7,8,9,10,11,12,13,14] have established that an IHX can improve COP by 5–25% depending on configuration and that an optimal high-side pressure exists for transcritical CO2 cycles [2,8,10], two gaps remain. First, most of this evidence comes from theoretical or simulation-based analyses [6,10,13] or from air-source/refrigerant-side studies [5,9,11,12]; experimental data for water-cooled CO2 heat pumps in which both the IHX outlet superheat and the secondary-fluid (water/brine) inlet temperatures of the gas cooler and evaporator are varied independently are scarce. Second, prior work has generally identified the optimum in terms of discharge pressure [2,8,10] or IHX efficiency [8], both of which are not directly actionable by the expansion device; none of the reviewed studies validates the IHX-outlet superheat ( D S H I H X ) itself as a directly controllable set-point for the expansion valve. This study addresses both gaps: a CO2 water-cooled heat pump test rig with an IHX was built, and the cycle performance was mapped as a function of D S H I H X and secondary-fluid inlet temperature, in order to provide experimentally validated, directly implementable guidance for expansion-valve control of water-cooled CO2 heat pumps.

2. Materials and Methods

2.1. Experimental Apparatus

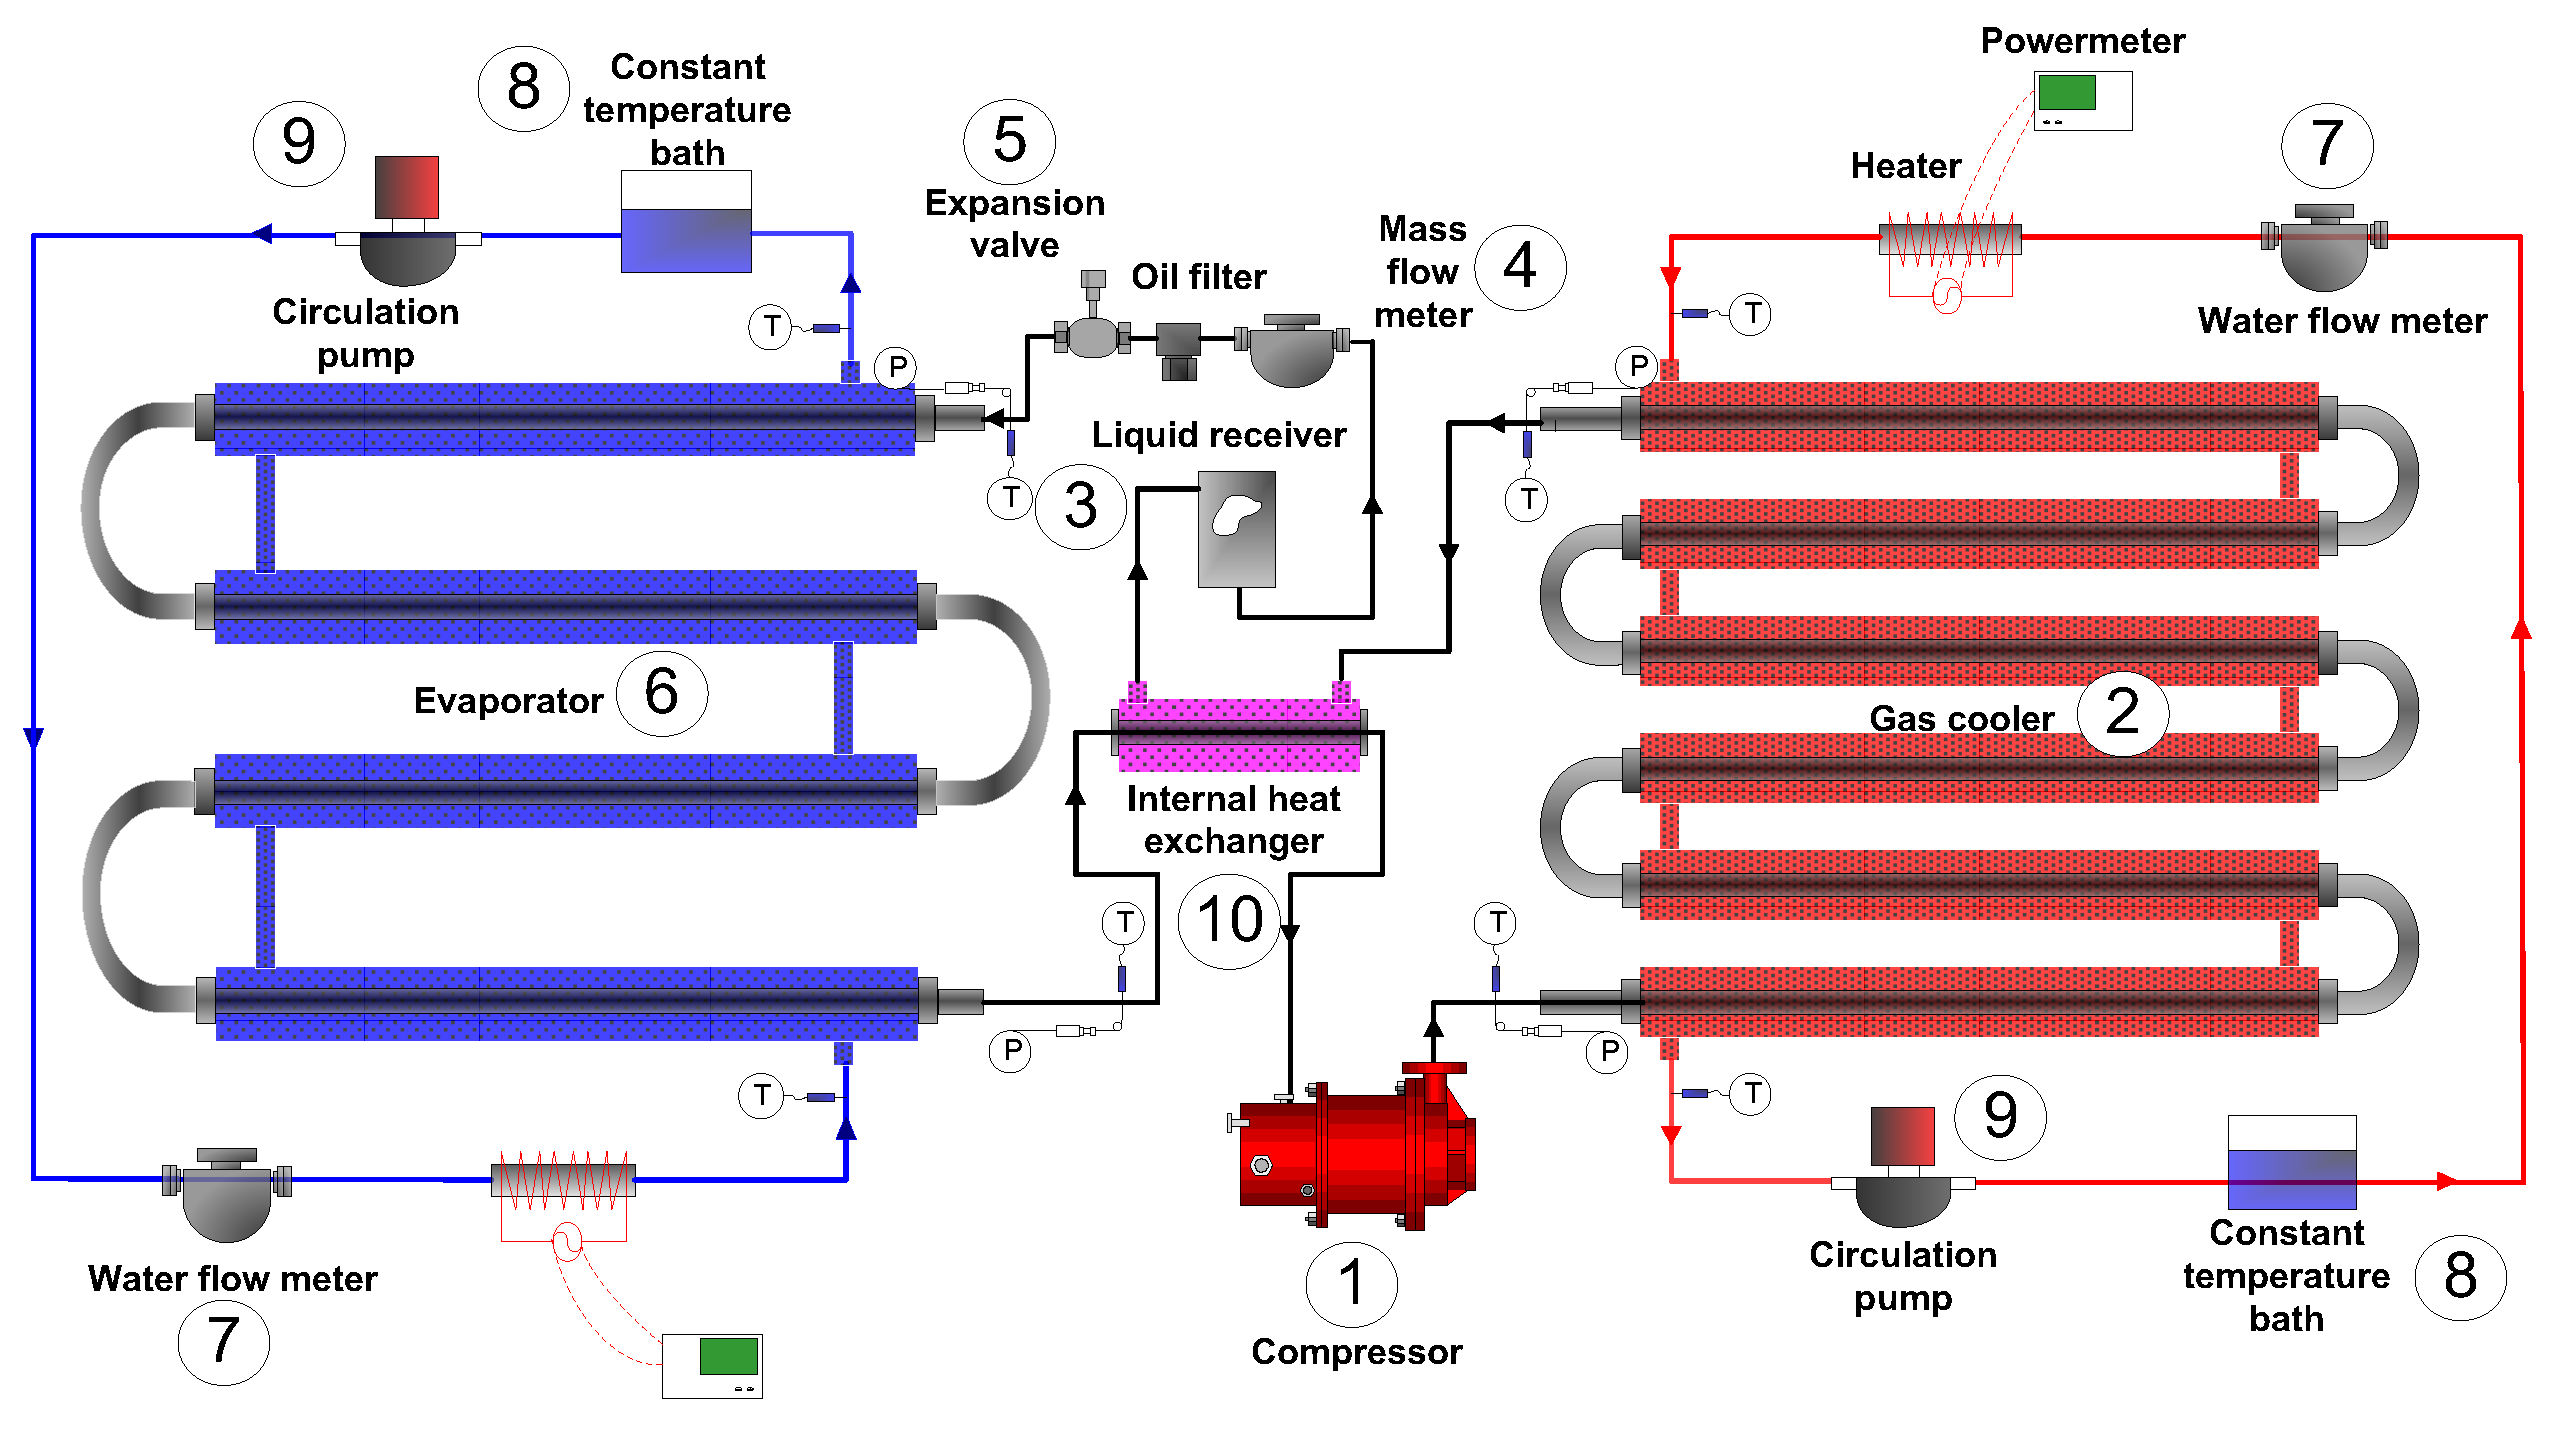
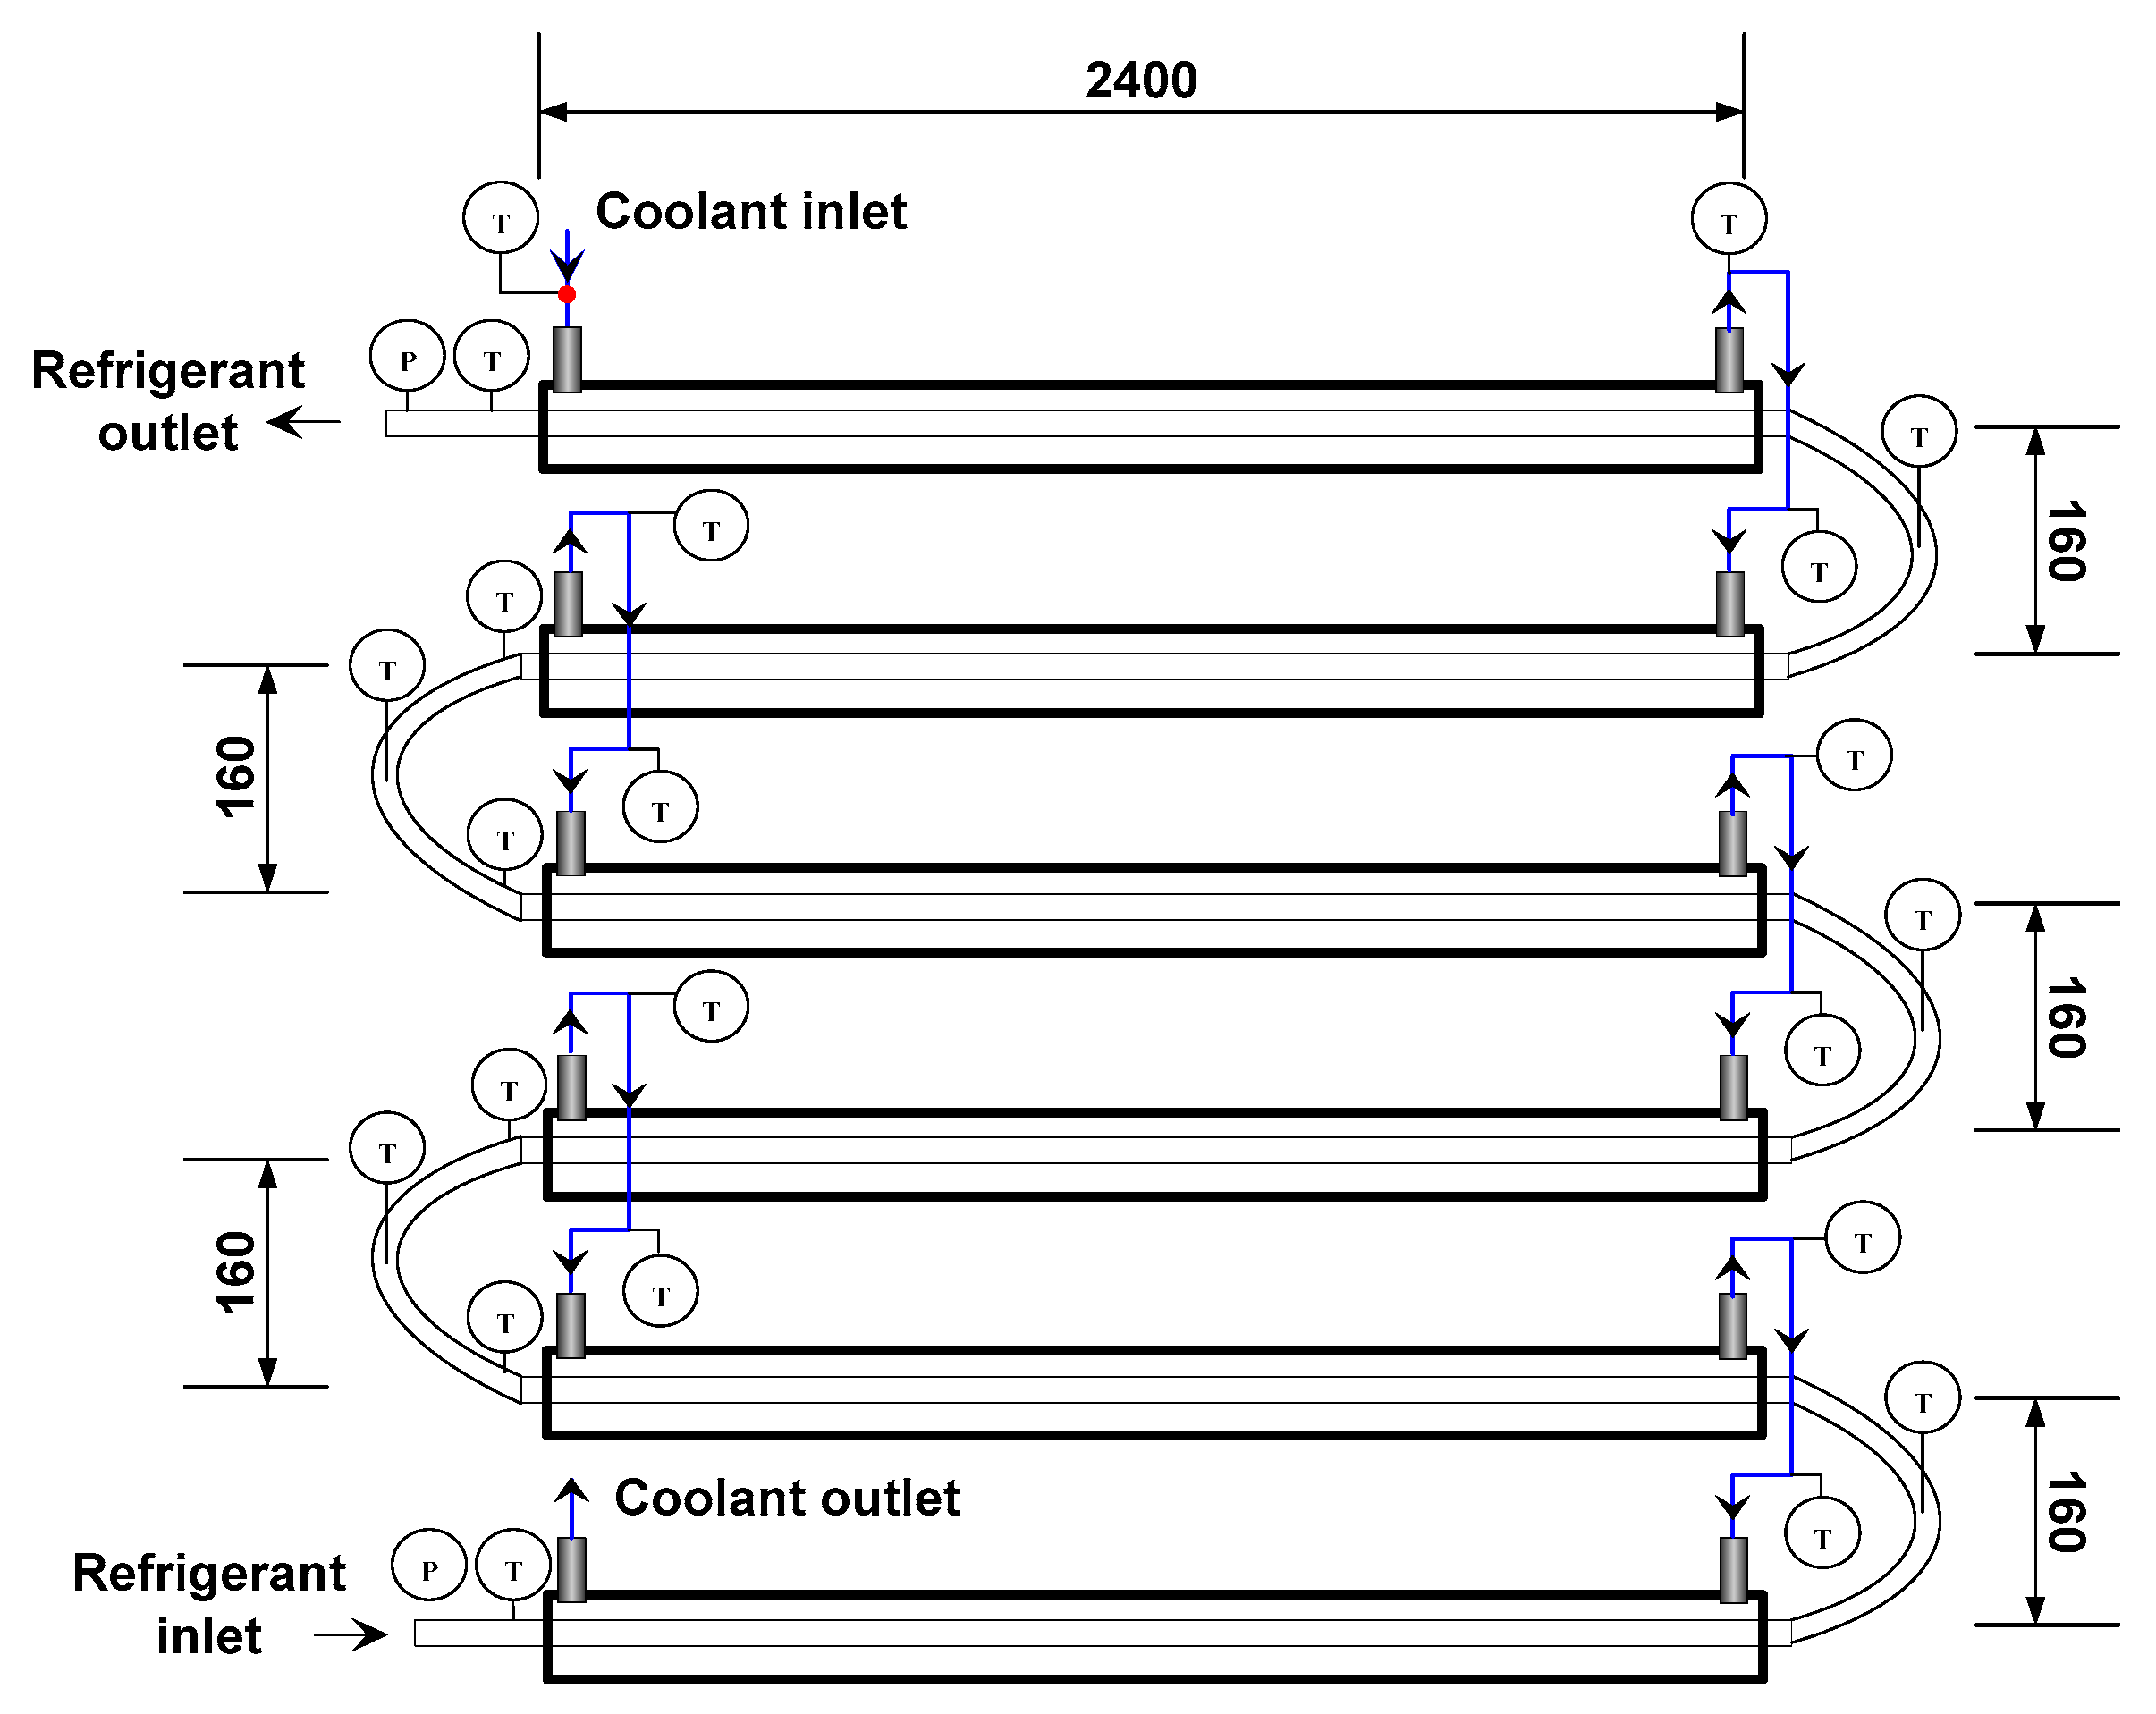
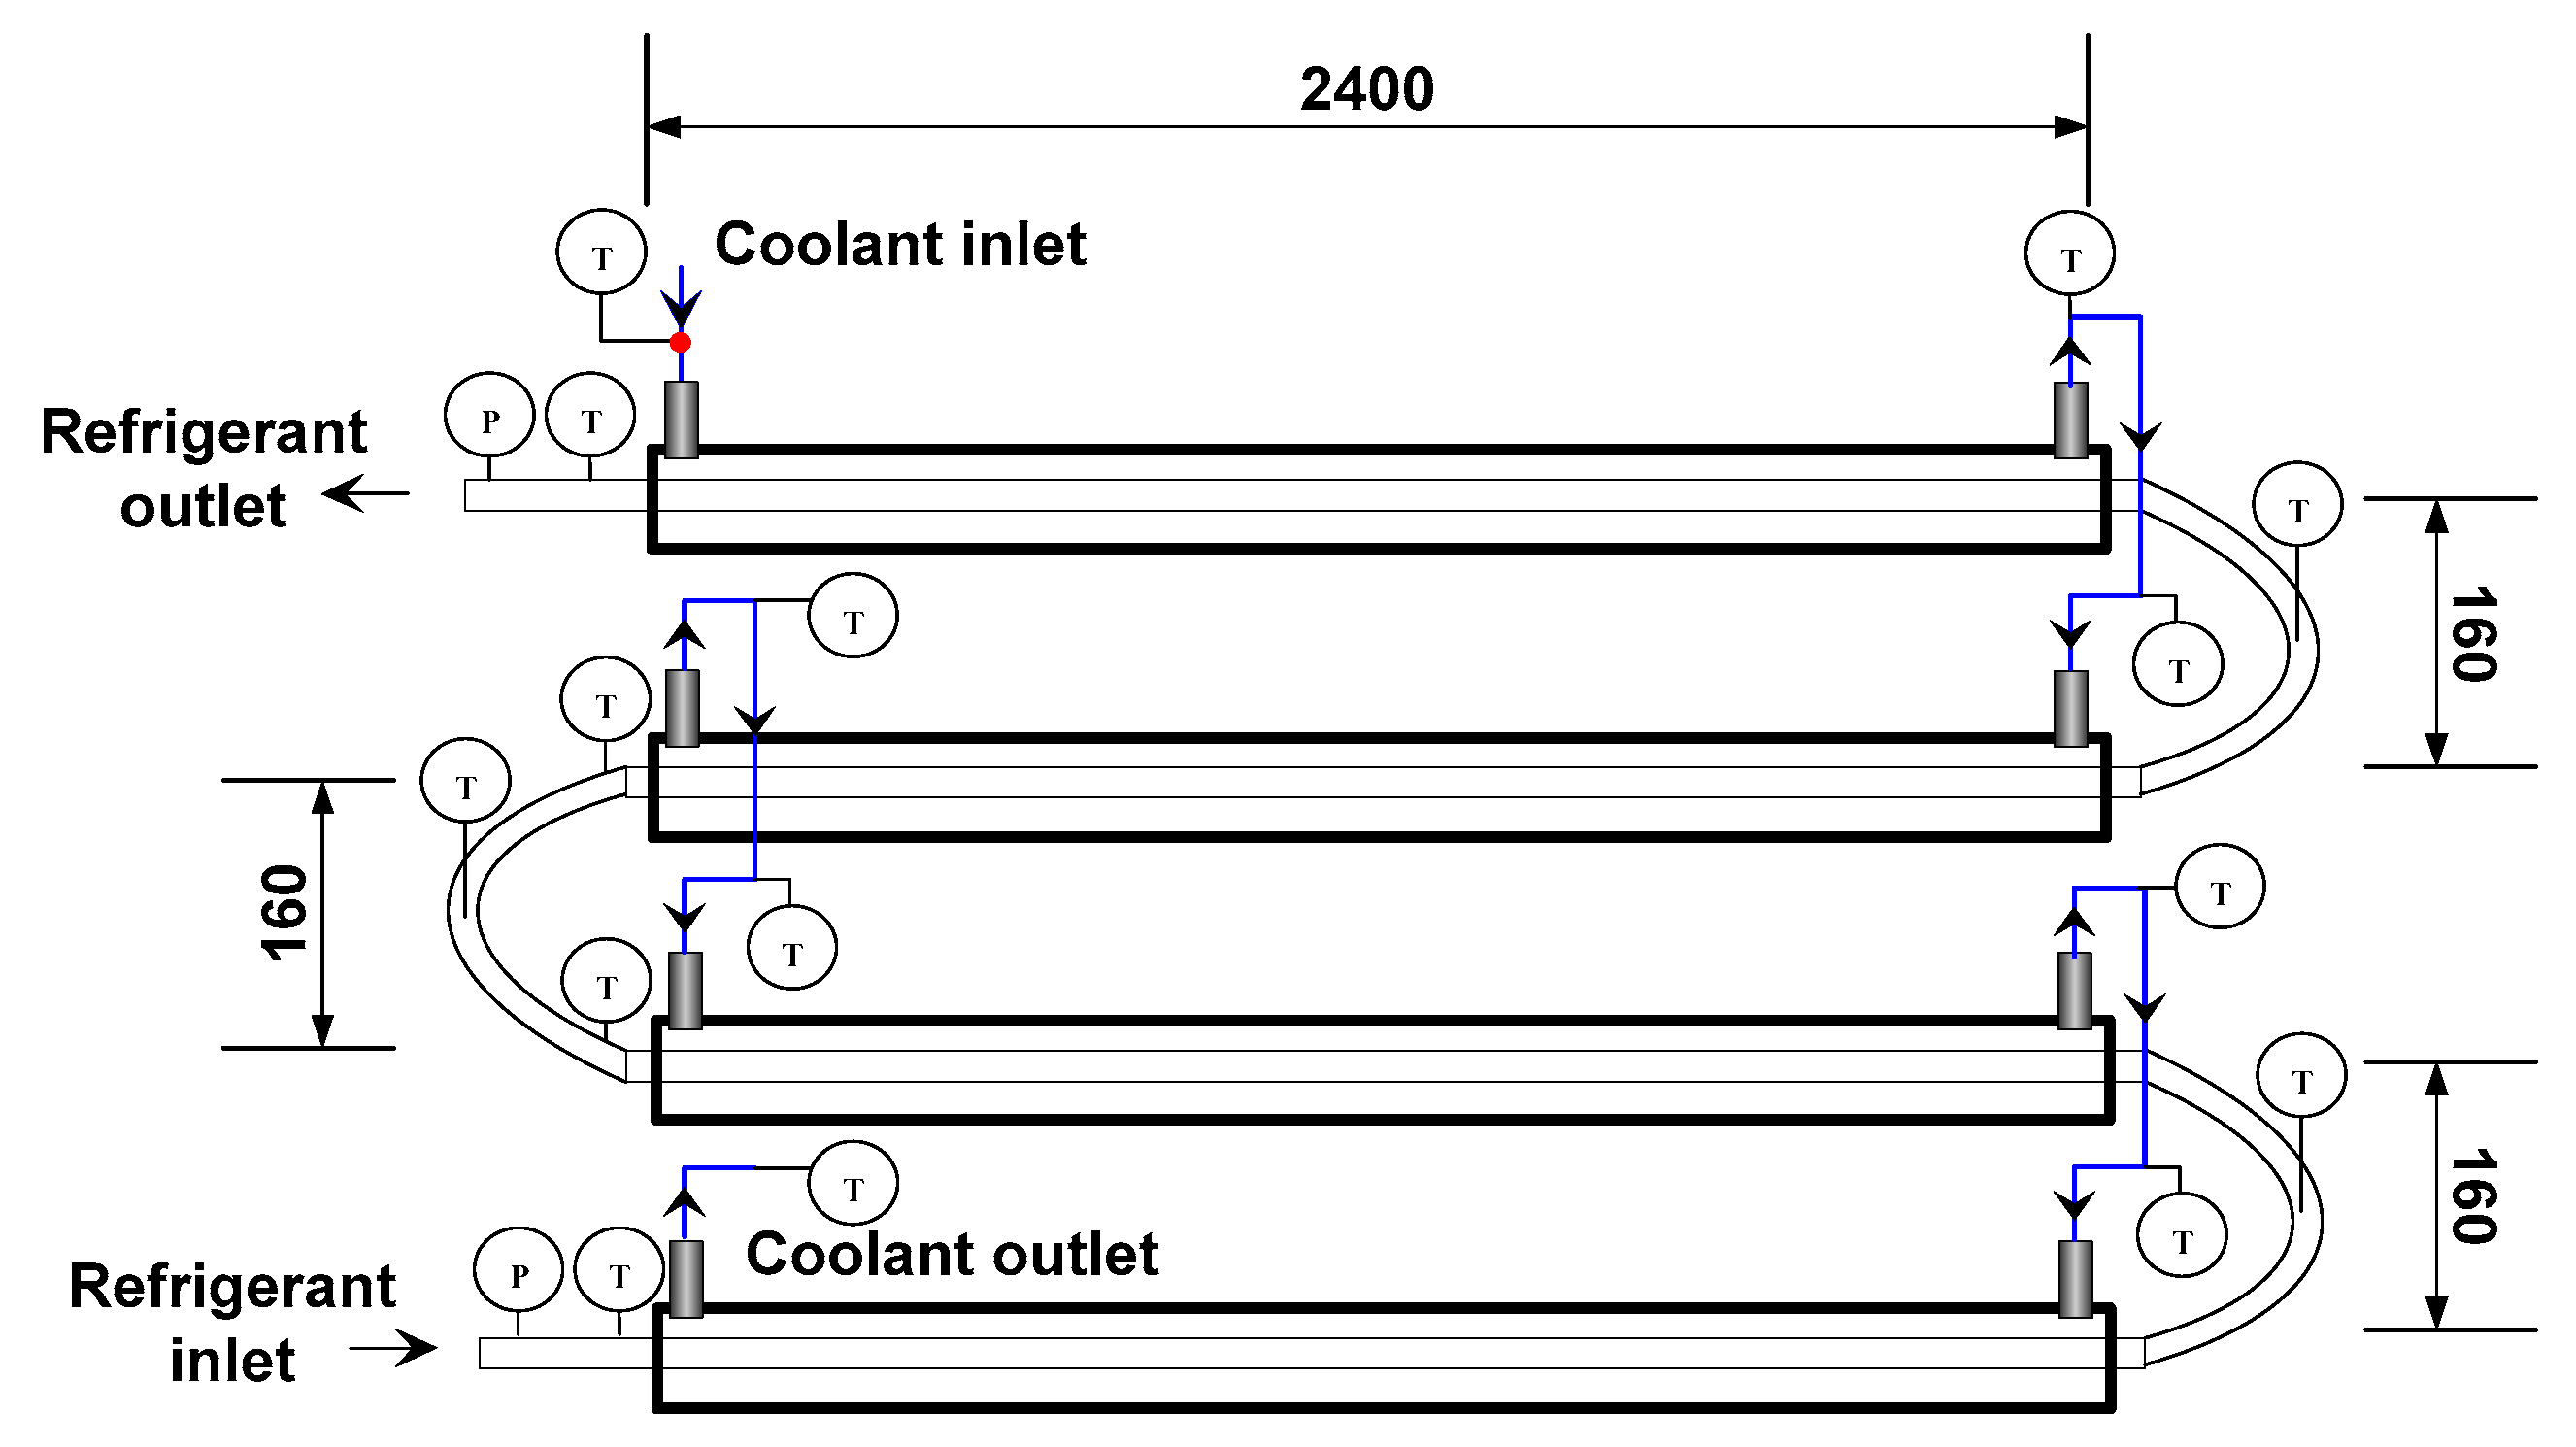
Figure 2 presents a schematic diagram of the experimental apparatus used for the CO2 water-cooled heat pump in this study. Figure 3 and Figure 4 provide detailed views of the gas cooler and evaporator, respectively. Table 1 further summarizes the specifications of the IHX incorporated into the heat pump system.
The experimental apparatus consists of a refrigerant circulation loop and a heat source water circulation loop, both of which are forced-circulation systems driven by a compressor and a water circulation pump, respectively. The refrigerant circulation loop comprises a hermetic compressor (1), a gas cooler (2), a liquid receiver (3), a mass flow meter (4), an expansion valve (5), an evaporator (6), and an internal heat exchanger (10). The heat source water circulation loop consists of a water flow meter (7), a constant-temperature bath (8), and a water circulation pump (9).
Referring to the heat pump system configuration shown in Figure 2, the supercritical CO2 refrigerant vapor discharged from the compressor first enters the gas cooler, where it exchanges heat with the heat source water. The refrigerant, cooled in this process, then flows to the IHX, where it exchanges heat with the refrigerant vapor discharged from the evaporator, before proceeding to the liquid receiver. The liquid refrigerant exiting the receiver passes through a mass flow meter, where its mass flow rate and density are measured to accurately determine the thermodynamic state of the CO2. The refrigerant subsequently passes through the expansion valve and enters the evaporator, where it exchanges heat with the brine, before re-entering the IHX. In the IHX, after exchanging heat with the high-temperature, high-pressure refrigerant introduced from the gas cooler side, the refrigerant returns to the compressor, thereby completing the cycle. Throughout this process, the cooling water and brine supplied to the gas cooler and evaporator, respectively, are each maintained at a constant temperature using independent constant-temperature baths, and heat exchange with the CO2 refrigerant occurs in a counter-flow arrangement.
The heat exchangers used for the CO2 refrigerant consist of an evaporator, a gas cooler, and an IHX. The evaporator and gas cooler were fabricated as double-pipe heat exchangers using copper tubing: the inner tubes, through which the CO2 refrigerant flowed, had an inner diameter of 7.75 mm and an outer diameter of 9.53 mm, while the outer tubes, through which the brine and cooling water flowed, respectively, had an inner diameter of 26 mm and an outer diameter of 28.5 mm. Excluding the U-bend sections, the total lengths of the evaporator and gas cooler were 9600 mm and 14,400 mm, respectively. As summarized in Table 1, the IHX was likewise a double-pipe heat exchanger fabricated from copper tubing, with an inner-tube inner diameter of 7.75 mm and an outer-tube (shell) inner diameter of 26 mm. Refrigerant temperatures at the inlet and outlet of the evaporator, gas cooler, and IHX were measured using T-type thermocouples, while pressure sensors and differential pressure gauges were installed at the same locations to measure the refrigerant pressure and pressure drop, respectively.
The two pressure transducers have the same measurement range (0–16 MPa) but were used for different purposes. The high-accuracy transducers (±0.004% FS) were installed at the primary measurement points used for thermodynamic and performance calculations, whereas the ±0.2% FS transducers were used for system monitoring.
All three heat exchangers (evaporator, gas cooler, IHX) were fabricated from seamless copper tubing rated for CO2 transcritical service. Each unit was hydrostatically pressure-tested at 1.5 times its maximum working pressure prior to installation, and the assembled system was leak-tested by holding pressurized nitrogen for 24 h (Section 2.2) before refrigerant charging. A pressure-relief valve (Obrist, 316 stainless steel, set pressure 30 MPa; Table 2) was installed on the refrigerant loop, providing a safety margin above the maximum compressor discharge pressure recorded in this study (≤13.7 MPa) and below the compressor’s rated safety pressure (40.1 MPa). The design and hydrostatic pressure test were conducted in accordance with the High-Pressure Gas Safety Control Act of Korea (KGS AC111). The pressure test was performed as a hydrostatic test at 15 MPa, which is 1.5 times the design pressure (10 MPa), and it was confirmed that there was no pressure drop or leakage for 20 min. In addition, at the design stage, the maximum heating capacity of the gas cooler, the maximum cooling capacity of the evaporator, and the maximum heat-transfer capacity of the IHX were estimated to be 9.5 kW, 6.5 kW, and 3.0 kW, respectively.
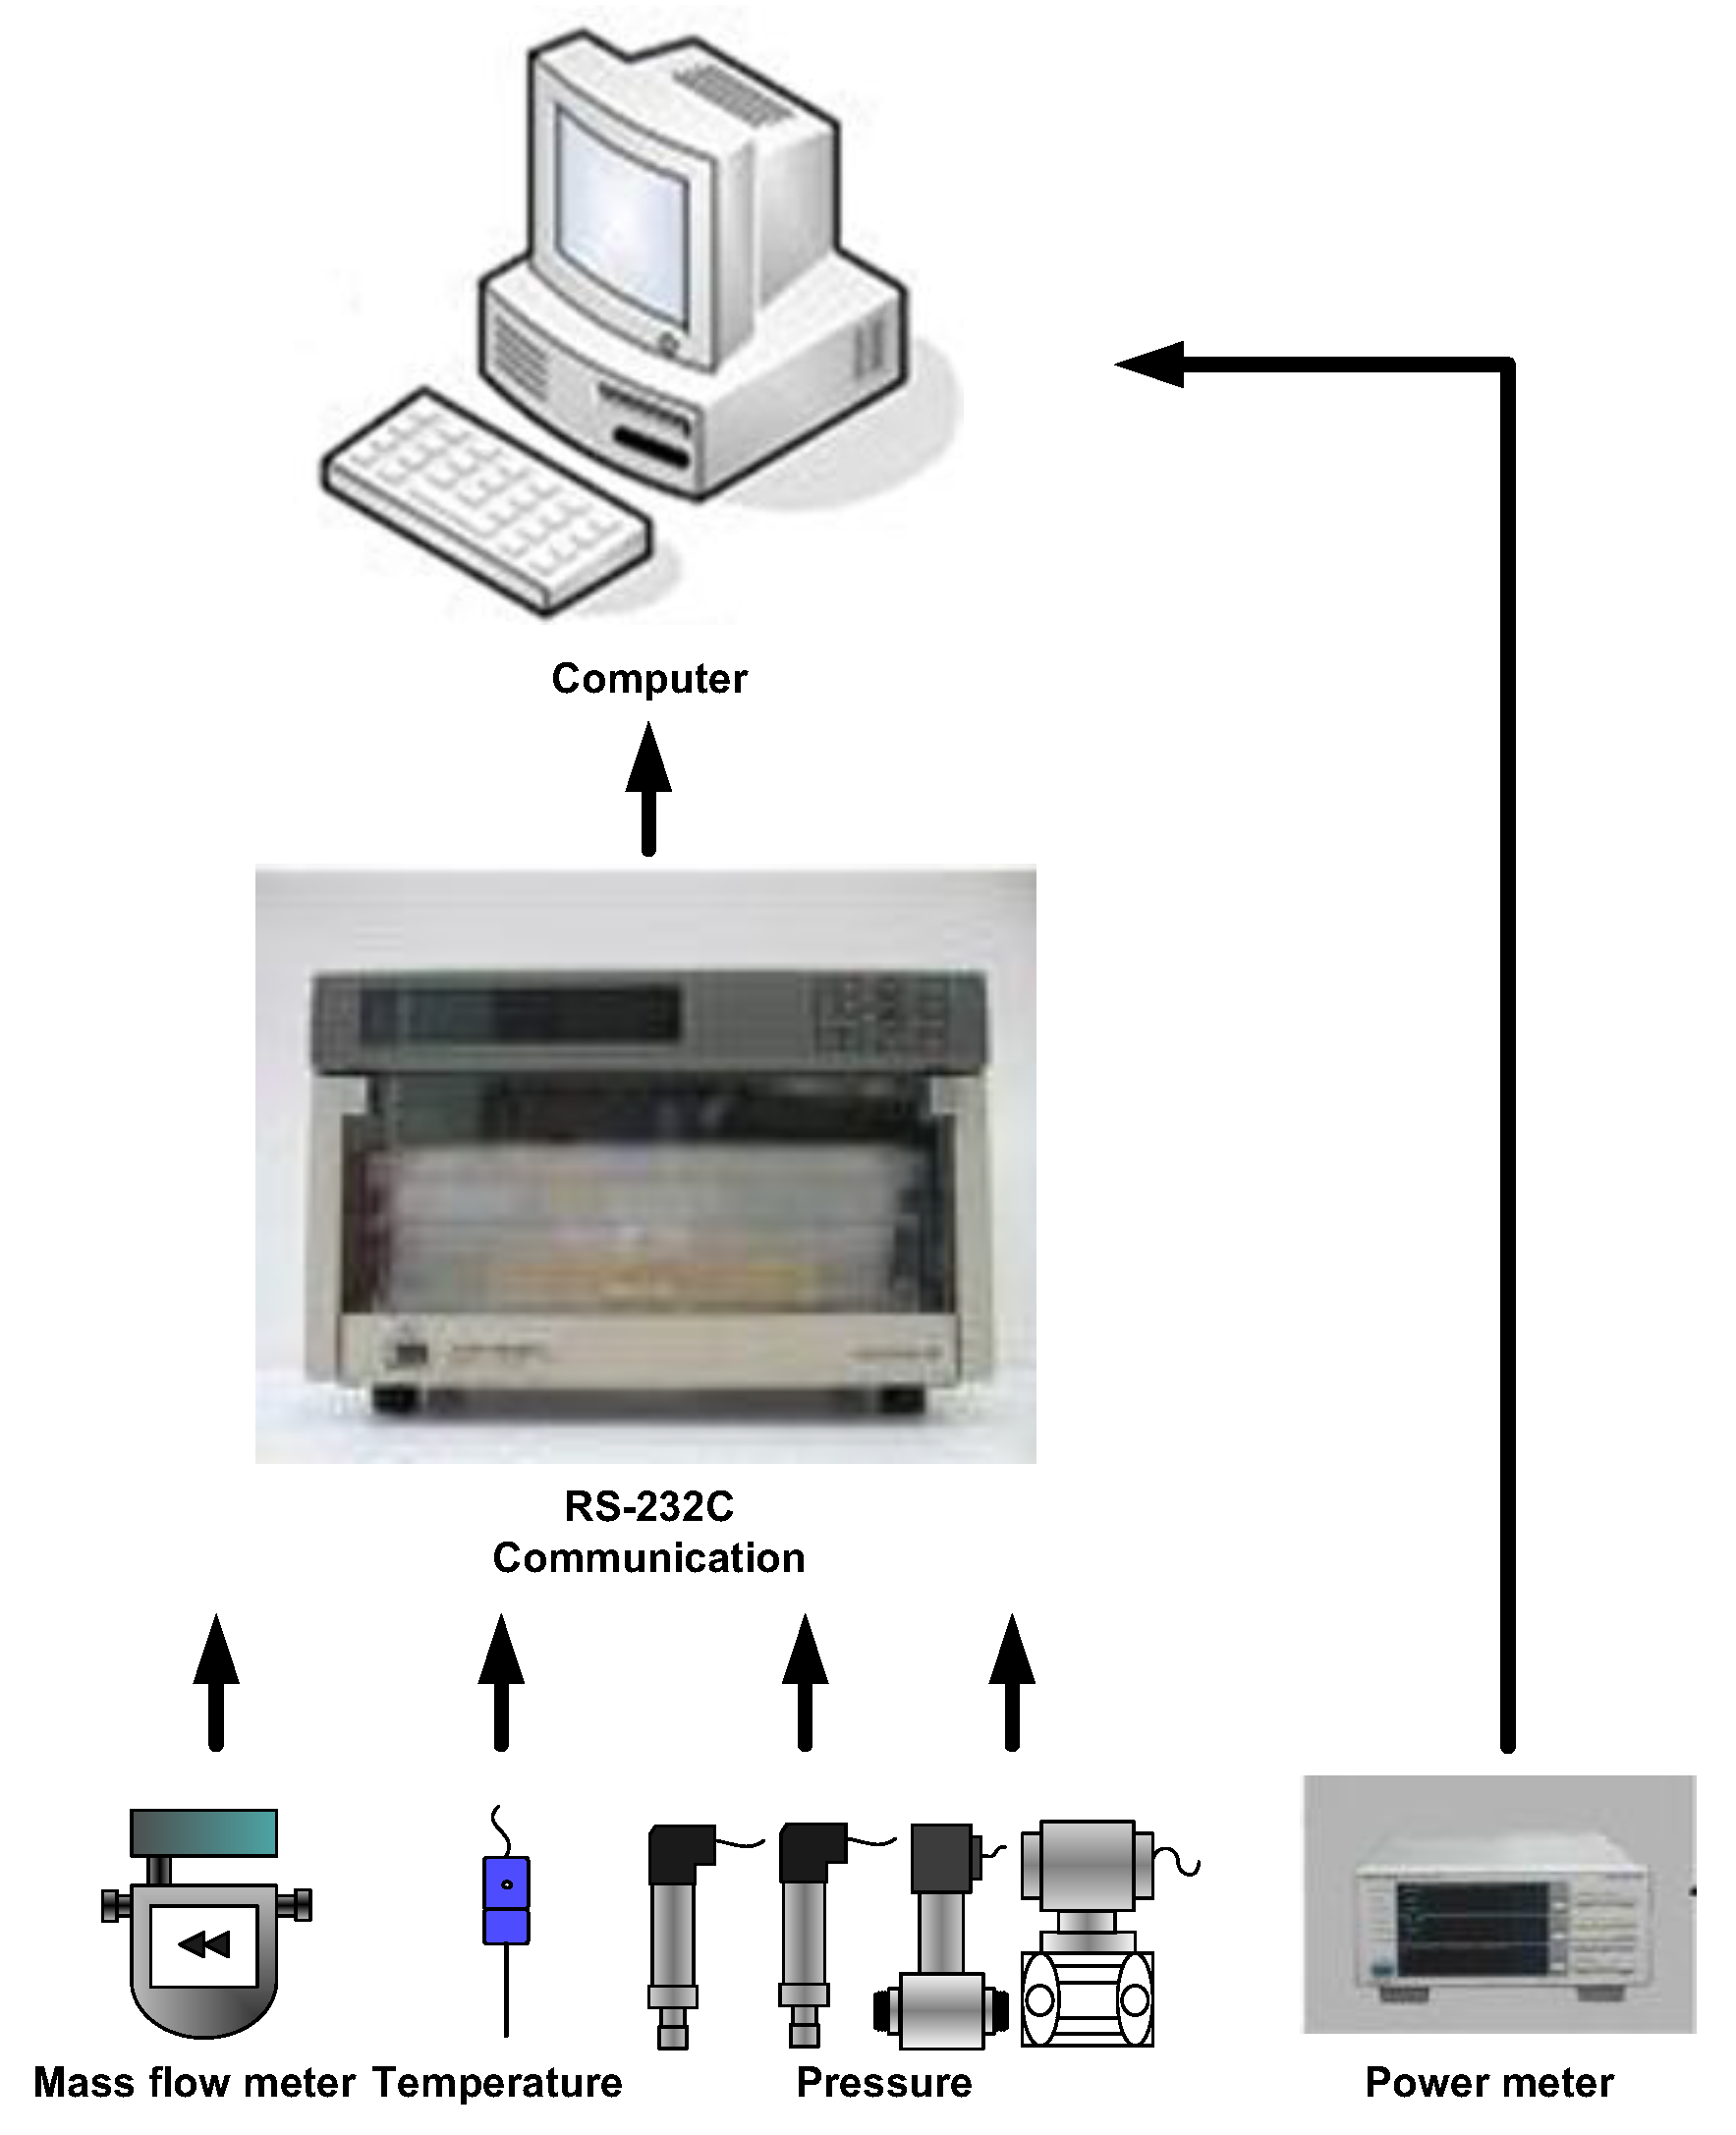
A data acquisition unit and a computer were used for data collection and processing. As shown in Figure 5, the output signals from the thermocouples, pressure transducers, mass flow meter, and power meter were all transmitted to the data acquisition unit via an RS-232C interface. The inlet temperatures of the secondary fluids in the gas cooler and evaporator were each maintained constant using the temperature controllers installed in their respective constant-temperature baths.
Table 2 and Table 3 show the components of the CO2 heat pump system and the specifications of the instrumentation and data acquisition system, respectively.

2.2. Experimental Methods and Conditions

Prior to the main experiments, the airtightness of the system was verified by charging high-pressure nitrogen gas into the apparatus. After maintaining this pressurized state for 24 h and confirming no leakage, a vacuum pump was operated to completely remove the residual nitrogen and other non-condensable gases, thereby evacuating the system to a vacuum state to facilitate subsequent refrigerant charging. The charging valve on the liquid receiver was then opened to charge the CO2 refrigerant, after which the compressor was operated to initiate refrigerant circulation. Meanwhile, the secondary fluids, each maintained at a constant temperature by their respective constant-temperature baths, were supplied to the heat exchangers via circulation pumps, with the mass flow rate of each fluid precisely controlled using inverters connected to the pumps.
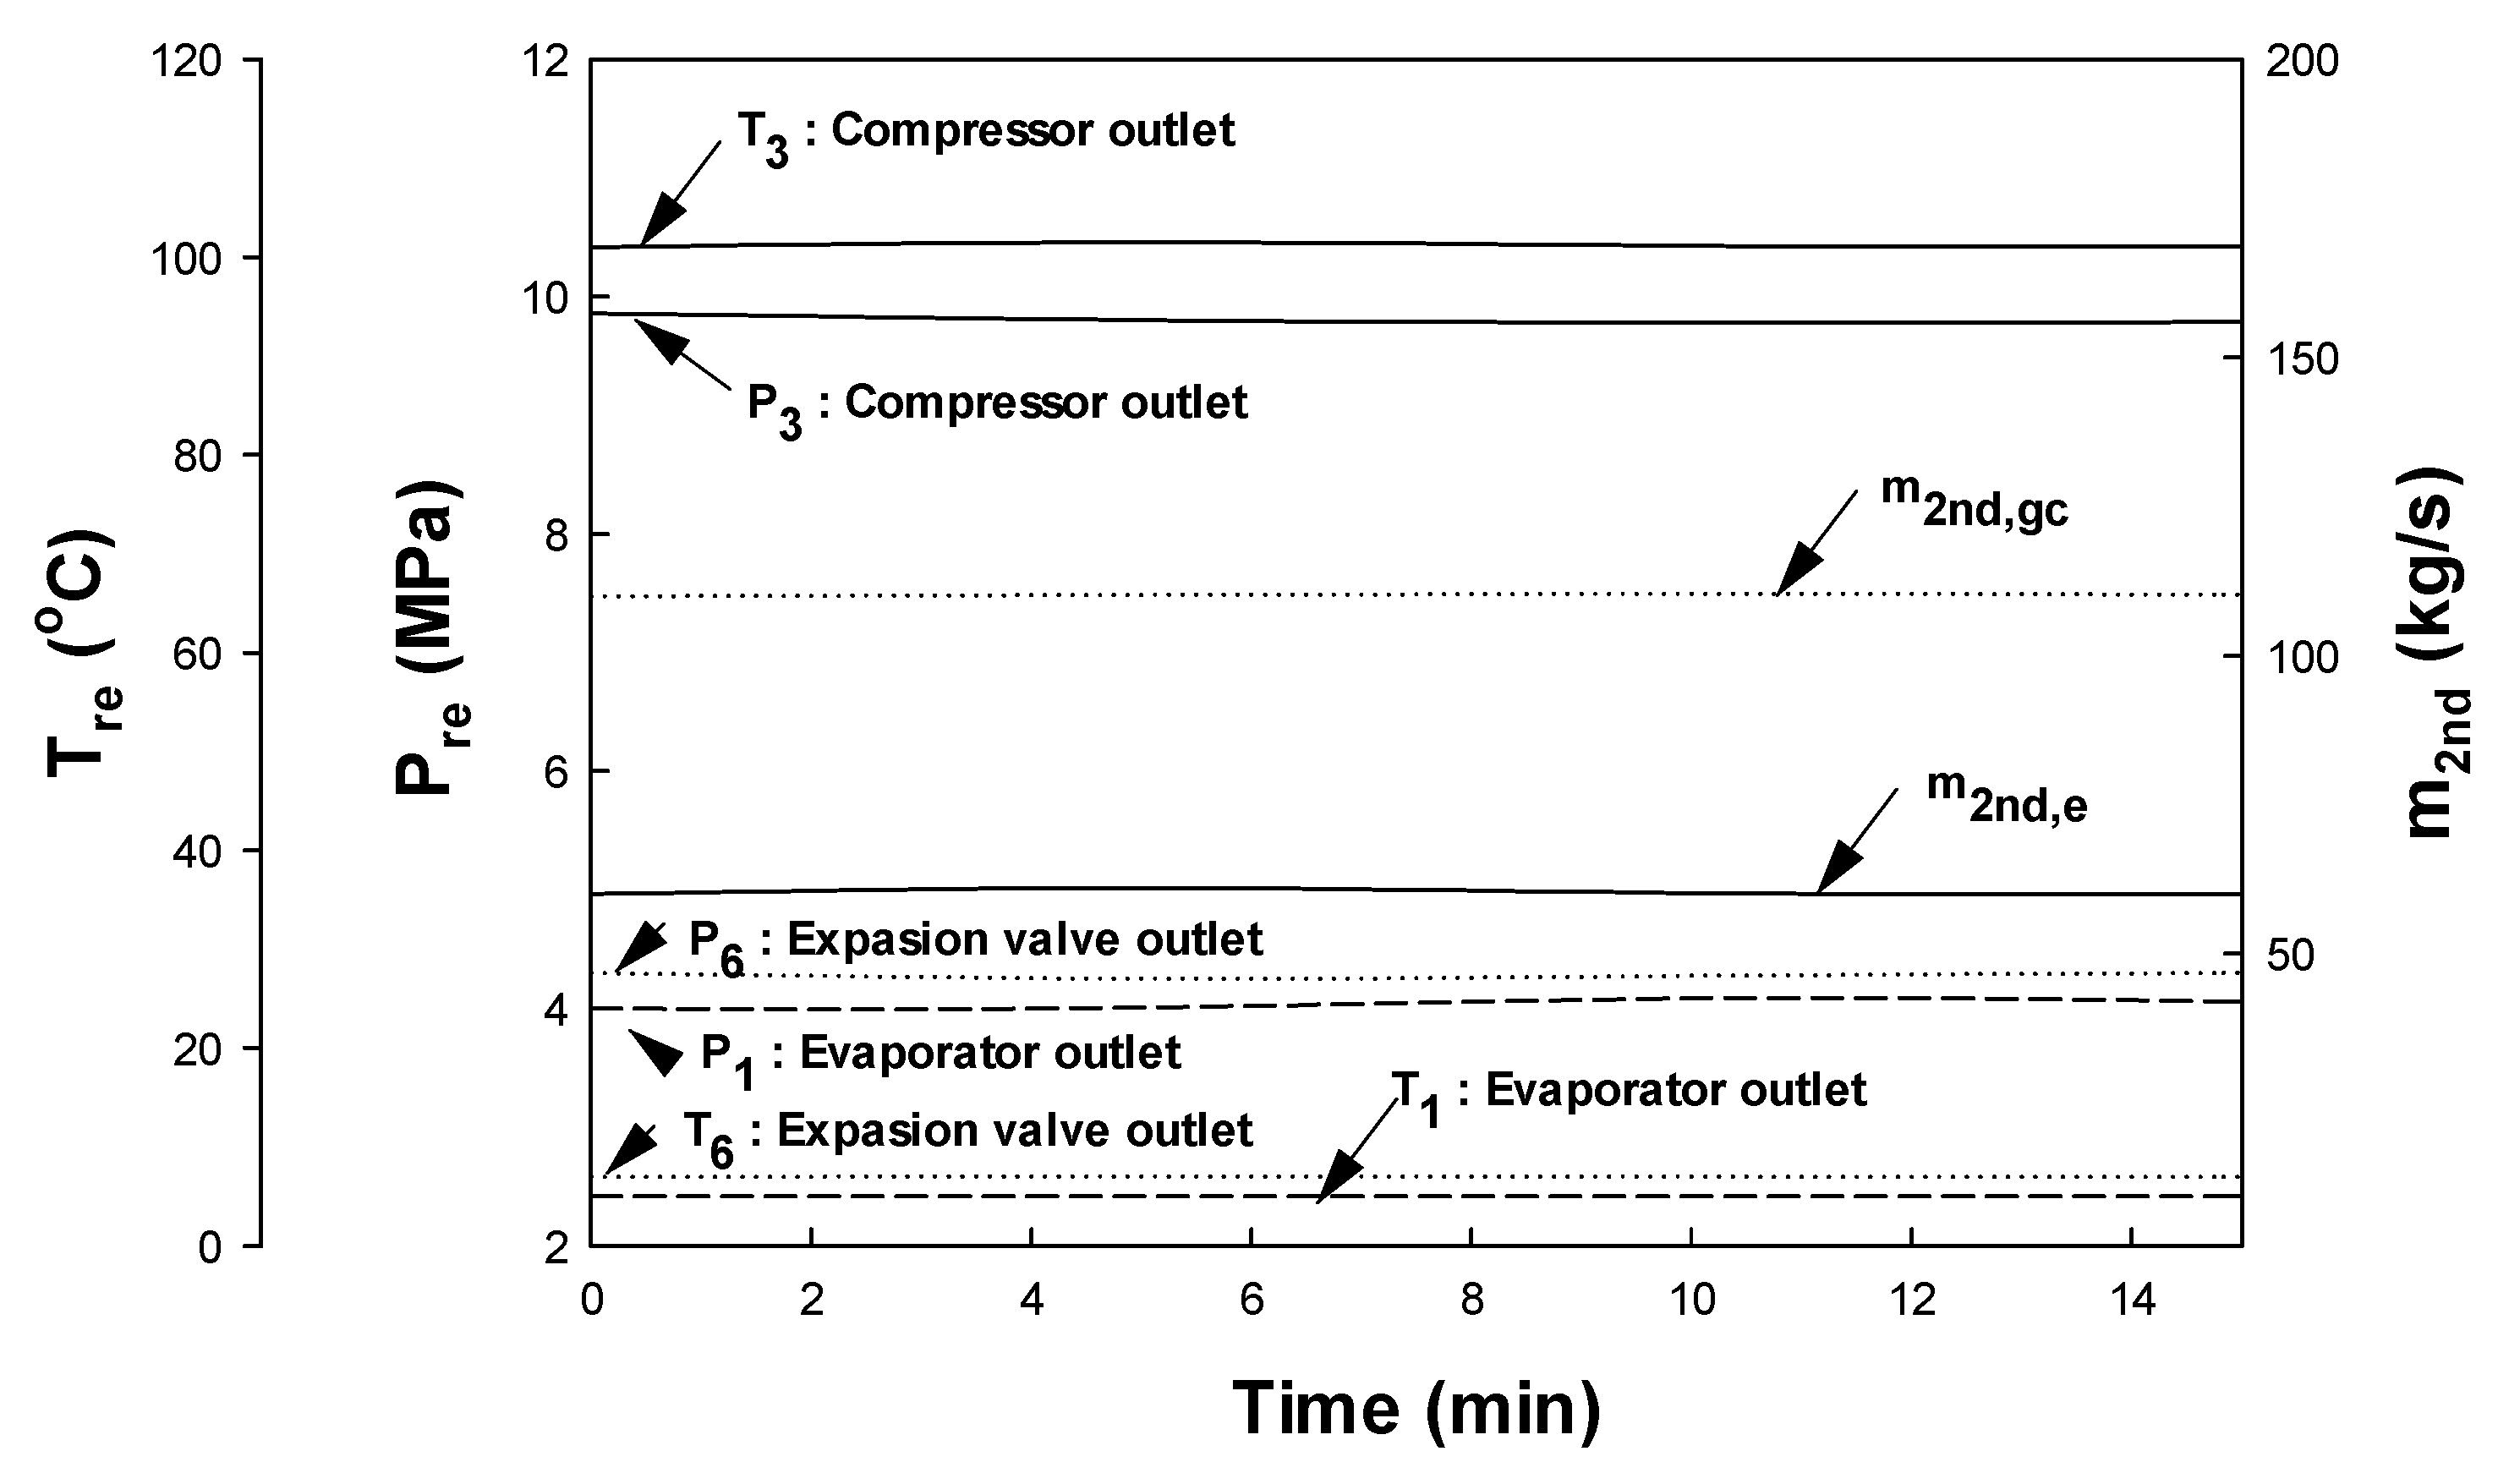
In this experiment, the inlet conditions of the secondary fluids were maintained constant for each experimental condition, while the opening of the expansion valve was adjusted to control the degree of superheat at the outlets of the IHX and the evaporator. The system was considered to have reached steady state when the fluctuations in the measured temperature, pressure, and mass flow rate remained within ±0.2 °C, ±3 kPa, and ±0.1 g/s, respectively, for a period of 15 min, as shown in Figure 6.
As summarized in Table 4, the experimental conditions for evaluating the performance of the CO2 heat pump system with respect to variations in IHX superheat and secondary fluid inlet temperature were established as follows. The inlet temperature and mass flow rate of the secondary fluid in the gas cooler were set within the range of 20–27 °C and held constant at 60 g/s, respectively. Similarly, the inlet temperature and mass flow rate of the secondary fluid in the evaporator were set within the range of 10–35 °C and held constant at 110 g/s, respectively. The experiments were conducted by adjusting the opening of the expansion valve to control the superheat at the outlets of the IHX and the evaporator within the ranges of 10–30 °C and 0–20 °C, respectively.
The secondary-fluid inlet-temperature ranges tested (10–35 °C evaporator; 20–27 °C gas cooler) were selected for two reasons: (i) they span the region in which the IHX-outlet superheat has the strongest and most systematically resolvable effect on the transcritical high-side pressure, allowing the underlying control relationship (optimal D S H I H X vs. secondary-fluid inlet temperature) to be established with the resolution needed for the parametric study, and (ii) they were bounded by the operating range of the constant-temperature baths available for the test rig’s secondary-fluid loops. They do not represent the full delivery/source temperature range of a field-installed residential or commercial heating application (typically 40–70 °C gas-cooler-side delivery and −10 to 15 °C evaporator-side source temperature). This study is not tied to a specific field application; it is intended as a controlled, fundamental characterization of the D S H I H X -based control concept. Extending the present test matrix to the higher gas-cooler-side and lower evaporator-side secondary-fluid temperatures representative of field heating duty is identified as necessary future work (Section 4).

2.3. Data Reduction

The thermophysical properties of the CO2 refrigerant used in this experiment were calculated using REFPROP [15], a refrigerant property database developed by the National Institute of Standards and Technology (NIST). The equations presented below were used to analyze the operating and performance characteristics of the CO2 heat pump system. In general, the heating and cooling capacities of the gas cooler and evaporator, together with the compressor power consumption, are the key parameters governing heat pump performance evaluation and prediction. Among these, the heat exchange capacities of the gas cooler and evaporator were calculated from the inlet-to-outlet temperature difference of the secondary fluid and from the enthalpy change on the refrigerant side, and the corresponding equations are as follows:
Q g c = m 2 n d , g c T 2 n d c p , 2 n d d T = m g c h g c , i h g c , o
Q e = m 2 n d , e T 2 n d c p , 2 n d d T = m e h e , o h e , i
where m 2 n d , g c and m 2 n d , e represent the mass flow rates of the secondary fluid in the gas cooler and evaporator, respectively, and c p , 2 n d is the specific heat of the secondary fluid. m g c and m e denote the mass flow rates of the refrigerant flowing through the gas cooler and evaporator, respectively. h g c , i and h g c , o are the inlet and outlet refrigerant enthalpies of the gas cooler, and h e , i and h e , o are the inlet and outlet refrigerant enthalpies of the evaporator.
Degree of superheat at the evaporator outlet:
D S H E v a p = T e , o T s a t
where T e , o is the measured refrigerant temperature at the evaporator outlet, and T s a t is the saturation temperature corresponding to the measured evaporator (low-side) pressure P e , obtained from REFPROP [15].
Degree of superheat at the IHX outlet (low-pressure side, i.e., at compressor suction):
D S H I H X = T s u c T s a t
where T s u c is the measured refrigerant temperature at the IHX low-pressure outlet/compressor suction.
Compressor power consumption W c o m p is measured directly by the power meter and is not a derived quantity.
Heating and cooling COP:
C O P h e a t i n g = Q g c / W c o m p
C O P c o o l i n g = Q e / W c o m p
The performance characteristics of the system were evaluated based on the heating capacity obtained from Equation (1) and the compressor power consumption measured by the power meter. To verify the reliability of the experimental data, an energy balance analysis was additionally performed for the gas cooler using Equation (7), which was derived from Equations (1) and (2)—representing the heat exchange capacity calculated from the secondary-fluid inlet-to-outlet temperature difference and from the refrigerant-side enthalpy change, respectively. Across all experimental conditions, the heat balance deviation remained within ±5%, confirming that a reliable heat balance was maintained within an acceptable engineering error range.
E B ( % ) = Q 2 n d Q r e Q 2 n d × 100
Here, Q 2 n d and Q r e denote the heat transfer rates calculated from Equations (1) and (2), respectively—i.e., based on the inlet-to-outlet temperature difference of the secondary fluid and the enthalpy difference of the refrigerant, for each of the evaporator and gas cooler.
In addition to the heat balance check (Equation (7)), the overall heat-transfer conductance UA of the gas cooler and evaporator was estimated from U A = Q / T l m , where Q is the heat-transfer rate from Equations (1) and (2), and Δ T l m  is the log-mean temperature difference between the refrigerant and secondary fluid, computed from the measured inlet/outlet temperatures of both streams. Because the refrigerant undergoes gas cooling (single-phase, gliding temperature) rather than condensation in the gas cooler and single-phase superheating in part of the evaporator, Δ T l m was evaluated using the counterflow LMTD formulation for a variable-temperature (glide) stream.

2.4. Uncertainty Analysis

Derived quantities calculated from the experimental data—such as the mass flow rate, evaporating capacity, compressor work, and COP—inevitably accumulate the measurement errors of the directly measured variables (temperature, pressure, and compressor input power) through the calculation process. This study therefore applied the error-propagation method proposed by Kline and McClintock [16] to quantitatively examine the uncertainty of the principal results. When a derived quantity R is expressed as a function R = R( x 1 , x 2 , …, x n ) of independent measured variables x 1 , x 2 , …, x n , the relative uncertainty of R can be expressed as the root-sum-square of the relative uncertainties of the individual measured variables, as in Equation (8).
U R / R = { Σ [ ( R / x i ) × ( U x i ) / R ] 2 } 1 / 2
The variables directly measured in this experiment are the refrigerant temperature (T) at each location, the high- and low-side pressures (P), and the compressor input power ( W c o m p ). Based on typical instrument specifications, the measurement uncertainties were assumed as UT = ±0.3 °C for the thermocouples, UP = ±0.5%F.S. for the pressure transducers, and U W c o m p = ±1.0% of reading for the power meter. Because the refrigerant enthalpy (h) at each state point is obtained by inputting the measured T and P into REFPROP [15], the uncertainty of each state-point enthalpy was assumed to be Uh ≈ ±1.0 kJ/kg, accounting for both the propagation of the temperature/pressure measurement uncertainty and the uncertainty of the property-calculation procedure itself. Assuming the uncertainties at the two state points are independent, the uncertainty of the enthalpy difference (Δh) between them is given by Equation (9).
U Δ h = U h 1 2 + U h 2 2 1 / 2
Because the mass flow rate (m) was back-calculated from the directly measured compressor input power ( W c o m p ) and the compressor inlet-outlet enthalpy difference ( Δ h c o m p ) as m = W c o m p / Δ h c o m p , its relative uncertainty is given by Equation (10). Using this result, the relative uncertainty of the evaporating capacity ( Q e v a = m · Δ h E v a p ) is given by Equation (11).
U m m = U w c o m p w c o m p 2 + U h c o m p Δ h c o m p 2 1 / 2
U Q E v a p Q E v a p = U m m 2 + U h E v a p Δ h E v a p 2 1 / 2
Substituting m = W c o m p / Δ h c o m p into the definition COP = Q E v a p / W c o m p  gives COP = Δ h E v a p / Δ h c o m p , showing that the compressor input power ( W c o m p ) term cancels out. In other words, COP is determined solely by the ratio of the two enthalpy differences obtained from the temperature and pressure measurements at the compressor and evaporator inlets/outlets, independent of the accuracy of the compressor power measurement; its relative uncertainty is expressed as in Equation (9).
U C O P C O P = U h E v a p Δ h E v a p 2 + U h c o m p Δ h c o m p 2 1 / 2
Table 5 shows the uncertainty calculated by applying Equations (9)–(12). The relative uncertainty was estimated at ±1.0% for the compressor work (direct measurement), about ±2.6% for the mass flow rate, about ±2.7% for the evaporating capacity, and about ±2.5% for COP. As all uncertainties remained below ±2.7%, the accuracy and reliability of the experimental results were considered to be verified.

3. Results and Discussion

3.1. Temperature and Pressure Distributions in the Cycle

To analyze the performance characteristics of the CO2 heat pump, the temperature distributions of the refrigerant and secondary fluids in the gas cooler and evaporator were experimentally investigated. The experiments were conducted while maintaining the secondary-fluid inlet temperatures of the gas cooler and evaporator at 25 °C and 20 °C, respectively, and their corresponding mass flow rates at 60 g/s and 110 g/s. The superheat degree was maintained at 5 °C.
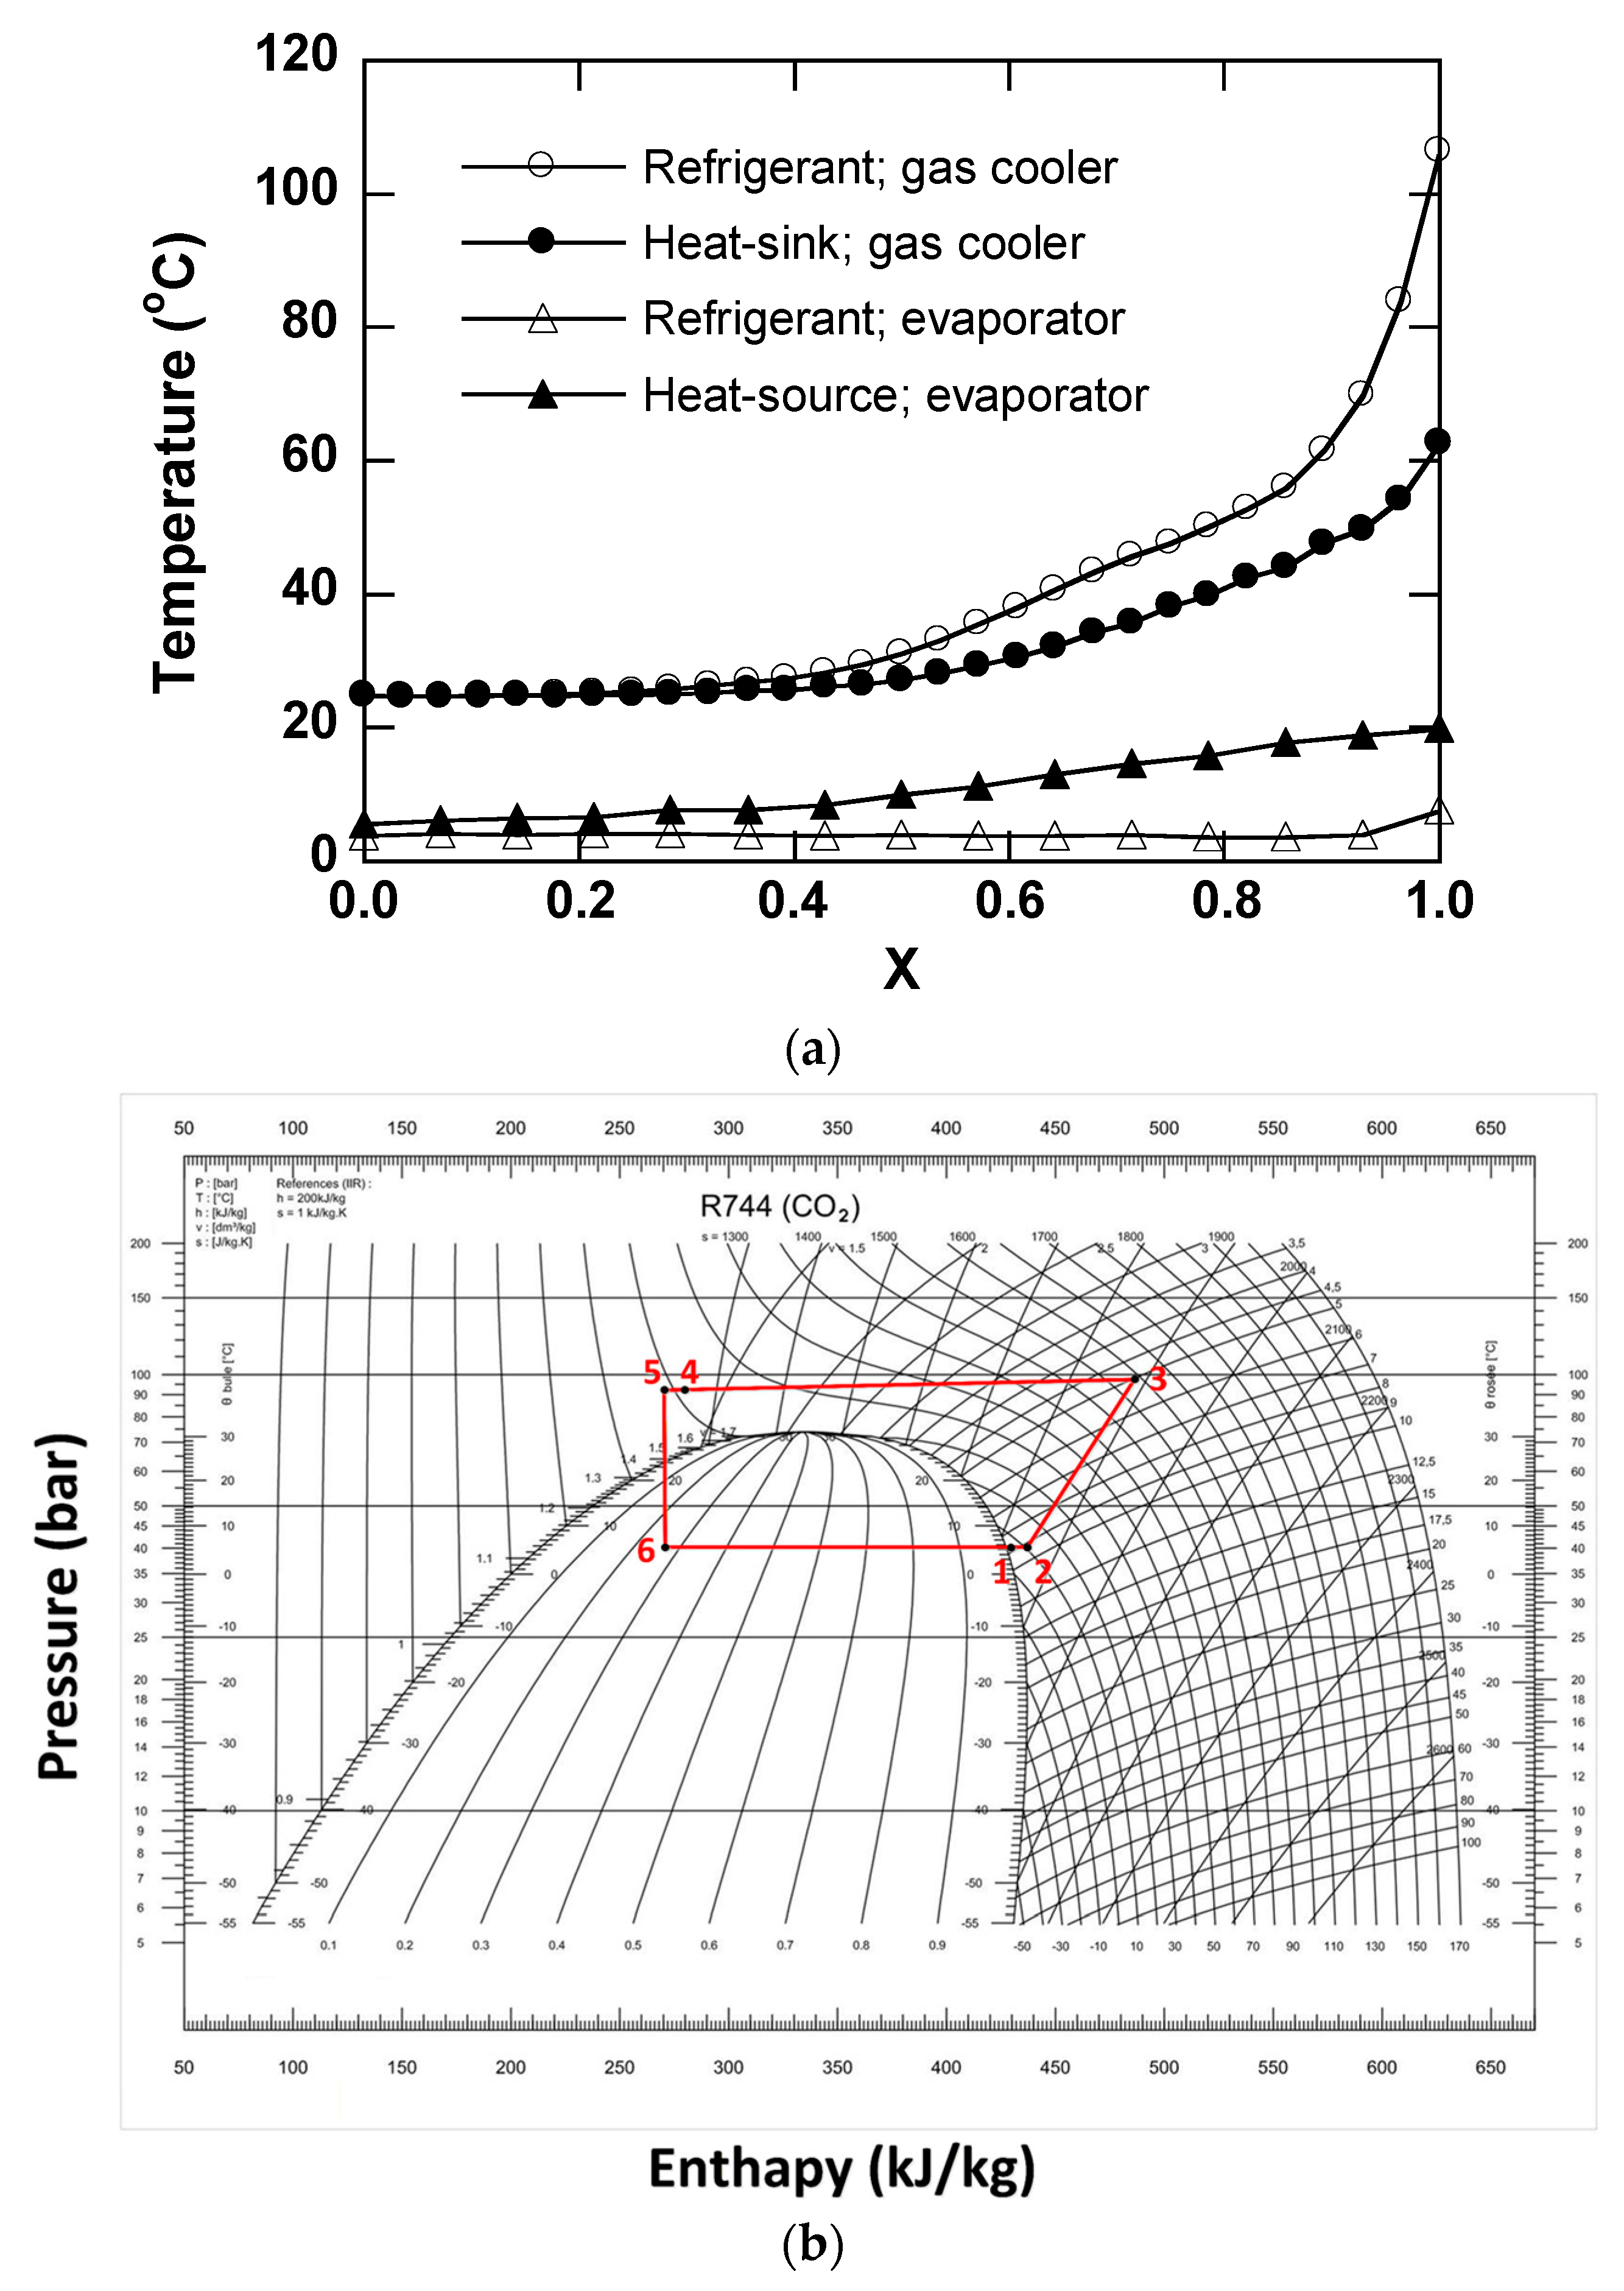
Figure 7a shows the temperature distributions of the refrigerant and secondary fluids in the gas cooler and evaporator of the transcritical CO2 heat pump system as a function of the dimensionless axial position ( Χ ) along the heat exchangers. The vertical axis represents the temperatures of the refrigerant and secondary fluids, whereas the horizontal axis represents the dimensionless axial position ( Χ ), defined as the ratio of the axial position to the total heat-exchanger length. The inlet positions of the gas cooler and evaporator correspond to Χ = 1 and Χ = 0 , respectively.
As shown in Figure 7a, a relatively large temperature difference between the refrigerant and secondary fluid is observed at the gas-cooler inlet. After passing the intermediate region of the gas cooler, the temperature difference gradually decreases in an approximately linear manner and subsequently increases again near the gas-cooler outlet. The reduction in the temperature difference between the refrigerant and secondary fluid in the middle region of the gas cooler can be attributed to the substantial variation in the specific heat of supercritical CO2 with temperature at a given gas-cooling pressure. In general, the specific heat is relatively low near the inlet and outlet regions of the gas cooler and reaches a higher value in the intermediate region.
Figure 7b presents the measured state points of the heat pump system on a pressure–enthalpy diagram under the same operating conditions. In the figure, processes 1 → 2 and 4 → 5 represent heat exchange between the low- and high-pressure refrigerant streams in the internal heat exchanger (IHX), process 2 → 3 represents the compression process, process 4 → 5 represents the expansion process, and process 6 → 1 represents the evaporation process. The refrigerant pressure decreases slightly along the evaporator and gas cooler because of frictional pressure losses occurring as the refrigerant flows through the heat exchangers.

3.2. Heating Characteristics of the CO2 Heat Pump

3.2.1. Effect of Outlet Superheat Degree

(1) Superheat Degree at the IHX Outlet ( D S H I H X )
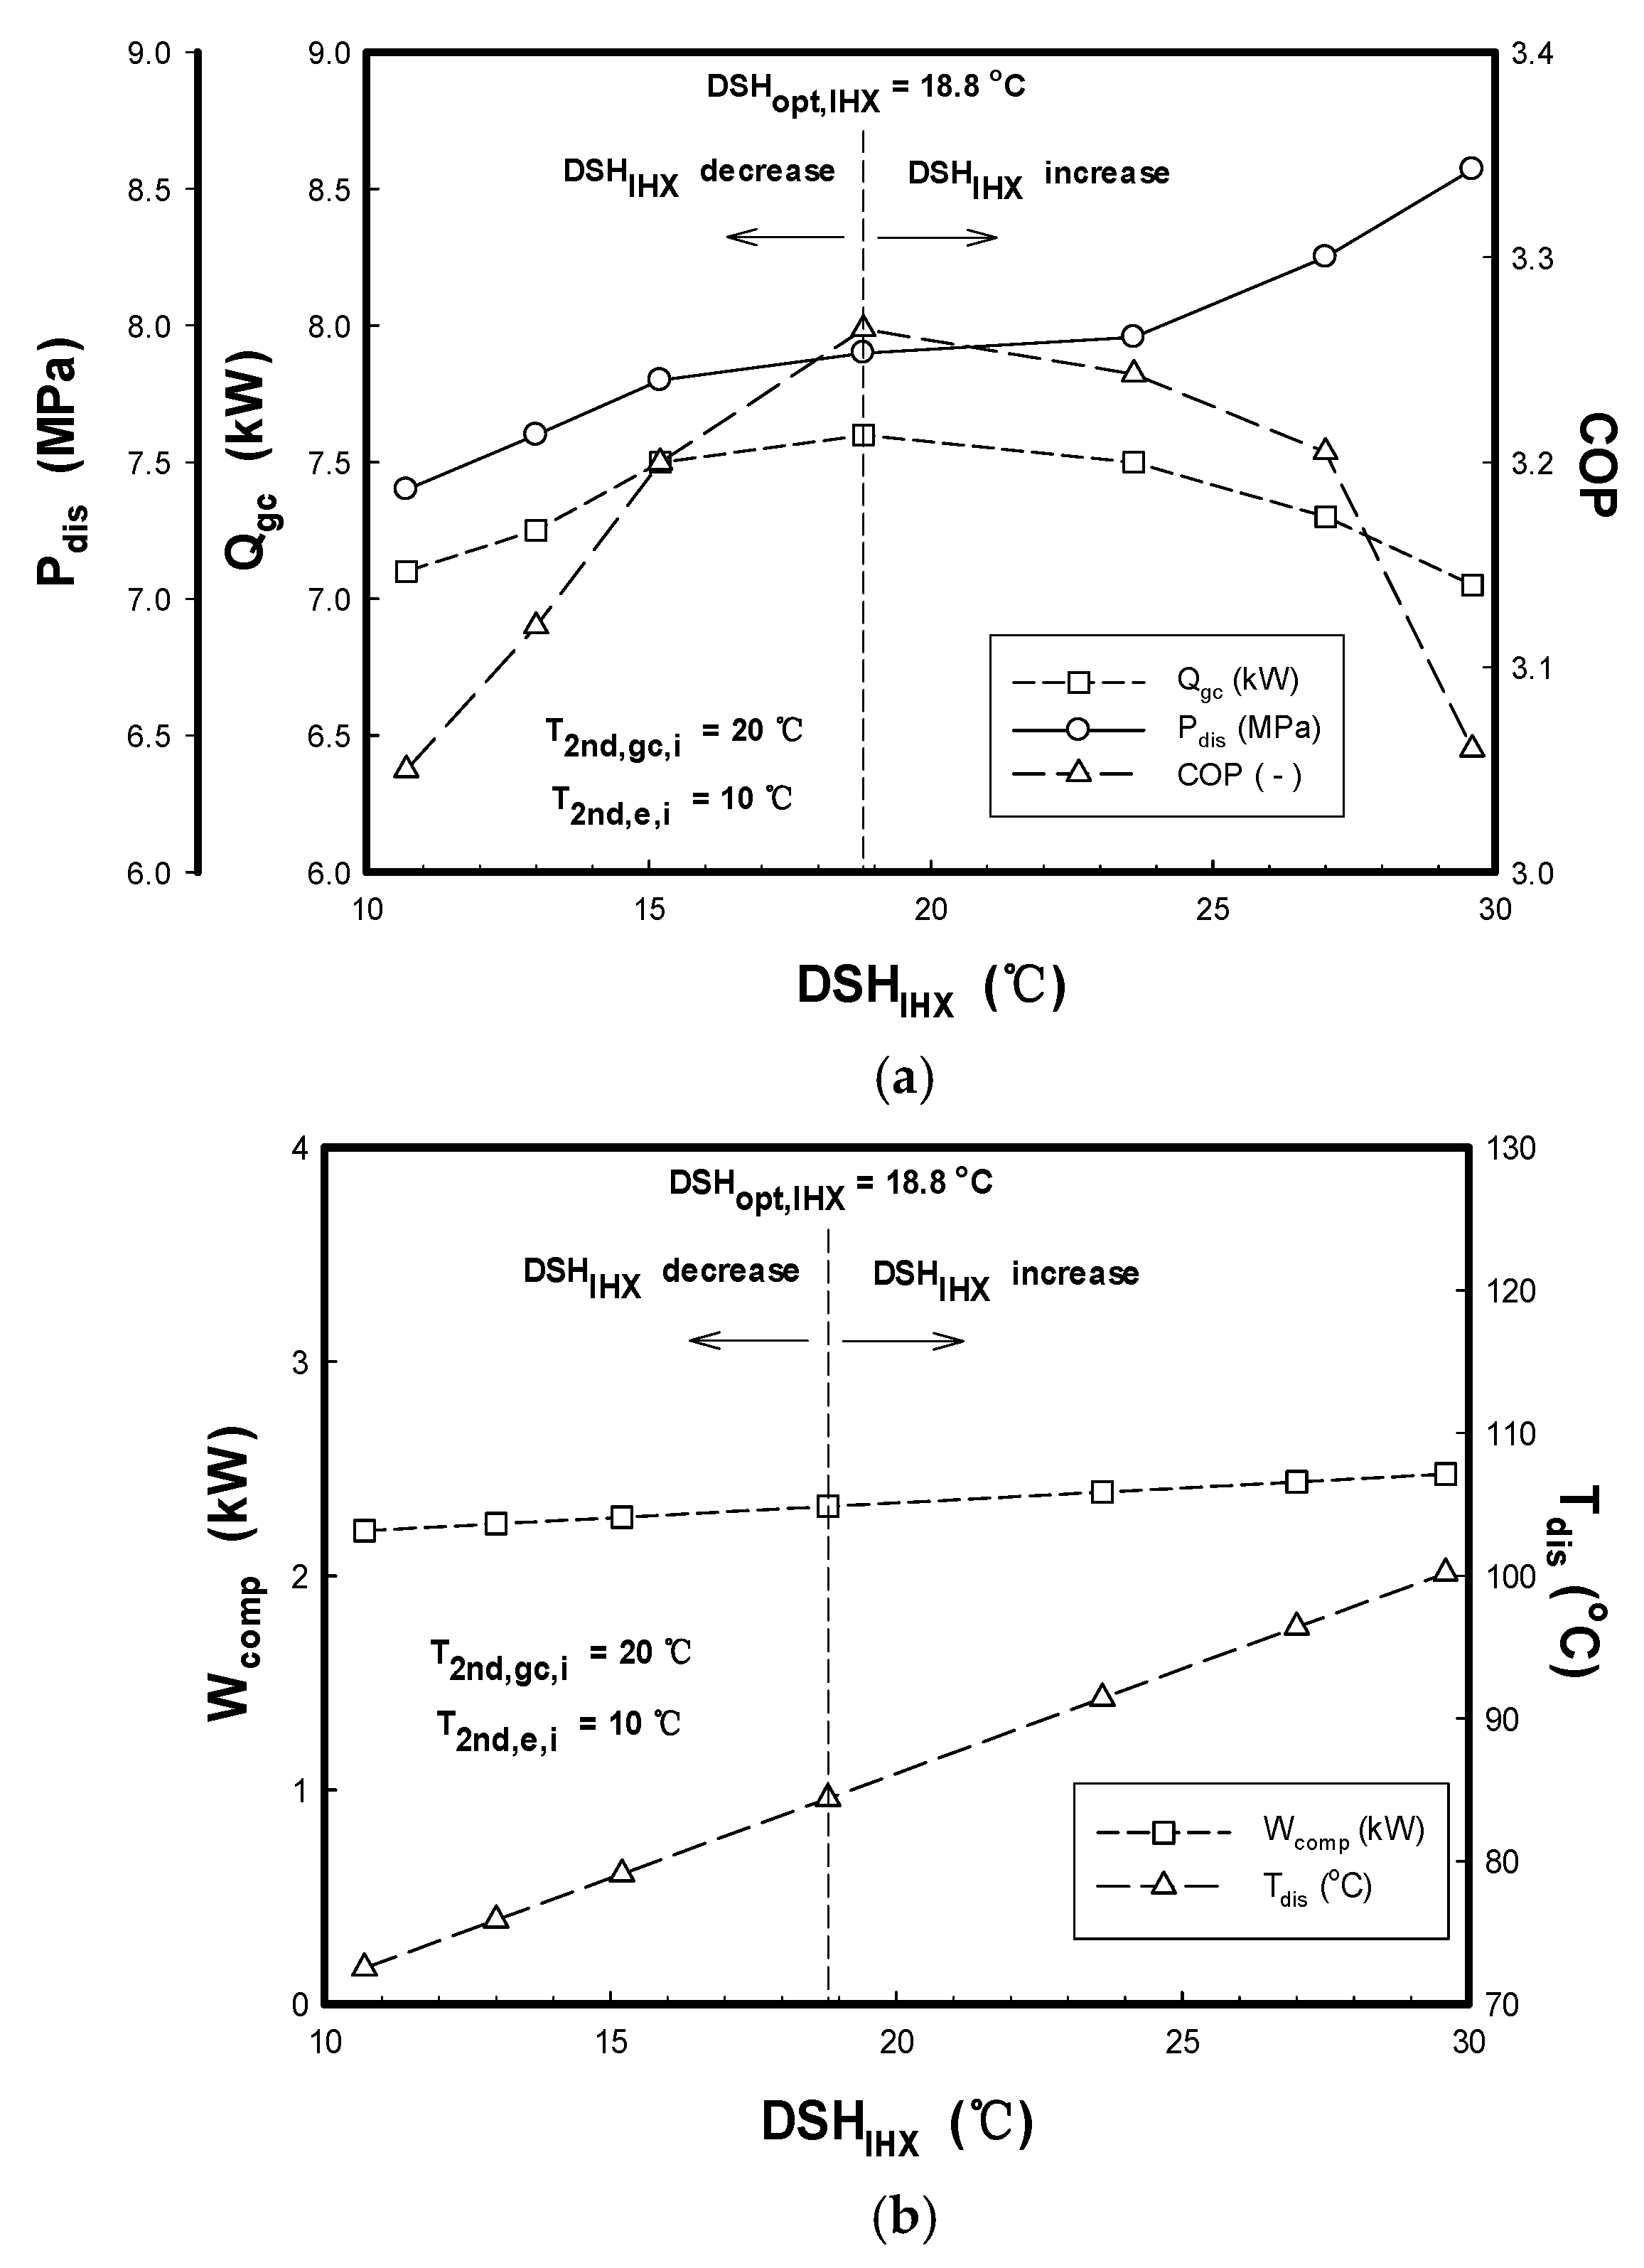
Figure 8 illustrates the variation in heating performance of the CO2 heat pump system with the superheat degree at the IHX outlet ( D S H I H X ), under the conditions of a secondary-fluid inlet temperature of 10 °C in the evaporator and 20 °C in the gas cooler. As shown in the figure, the D S H I H X was regulated by adjusting the expansion valve opening: increasing the valve opening decreased the outlet superheat degree, whereas decreasing the valve opening increased it.
As shown in Figure 8, the compressor discharge pressure increased with increasing D S H I H X . Both the heating capacity and COP decreased as the D S H I H X deviated either higher or lower from an optimal point ( D S H I H X = 18.8 °C). The underlying reasons for this trend are as follows.
When the D S H I H X decreased below this optimal point ( D S H I H X < 18.8 °C)—that is, when the expansion valve opening was large—the refrigerant mass flow rate increased, which increased the pressure drop across the heat exchangers and other system components. In addition, the higher refrigerant flow rate increased the heat transfer rate within the IHX, thereby reducing the compression ratio, while also narrowing the temperature difference between the refrigerant and the secondary fluid in the evaporator and lowering the heat exchange effectiveness there. As a result, both the heating capacity and the heating COP decreased.
On the other hand, when the D S H I H X increased beyond the optimal point ( D S H I H X > 18.8 °C)—that is, when the expansion valve opening was reduced—the refrigerant mass flow rate decreased. This widened the pressure difference between the high- and low-pressure sides and reduced the refrigerant density at the compressor inlet, thereby lowering the compressor efficiency. In addition, the reduced refrigerant flow rate induced a pinch point at the gas cooler outlet, which degraded the heat exchange effectiveness there. As a result, both the heating capacity and the heating COP decreased.
Based on the experimental results shown in Figure 8, obtained under the conditions of a 10 °C secondary fluid inlet temperature in the evaporator and a 20 °C secondary fluid inlet temperature in the gas cooler, the heating capacity and heating COP reached their maximum values when the D S H I H X was 18.8 °C. Defining this value as the optimal superheat degree, the corresponding optimal discharge pressure ( P o p t , d i s ), optimal heating capacity ( Q o p t , g c ), and optimal COP ( C O P o p t ) were determined to be 7.9 MPa, 7.6 kW, and 3.26, respectively.
Note that the discharge pressure was not independently controlled in these experiments; it is a dependent outcome of the manually set valve opening (and hence of D S H I H X ) at fixed secondary-fluid boundary conditions. The value P o p t , d i s = 7.9 MPa identifies, post hoc, which of the tested valve openings produced the pressure at which capacity and COP were maximized; it is reported as a diagnostic characterization of the optimal operating point, not as an independently regulated set-point.
These results indicate that an optimal expansion valve opening exists at which the heating COP of the CO2 heat pump is maximized. In other words, the expansion valve of a CO2 heat pump has an optimal opening that depends on the specific operating conditions of the system.
(2) Superheat Degree at the Evaporator Outlet ( D S H E v a p )
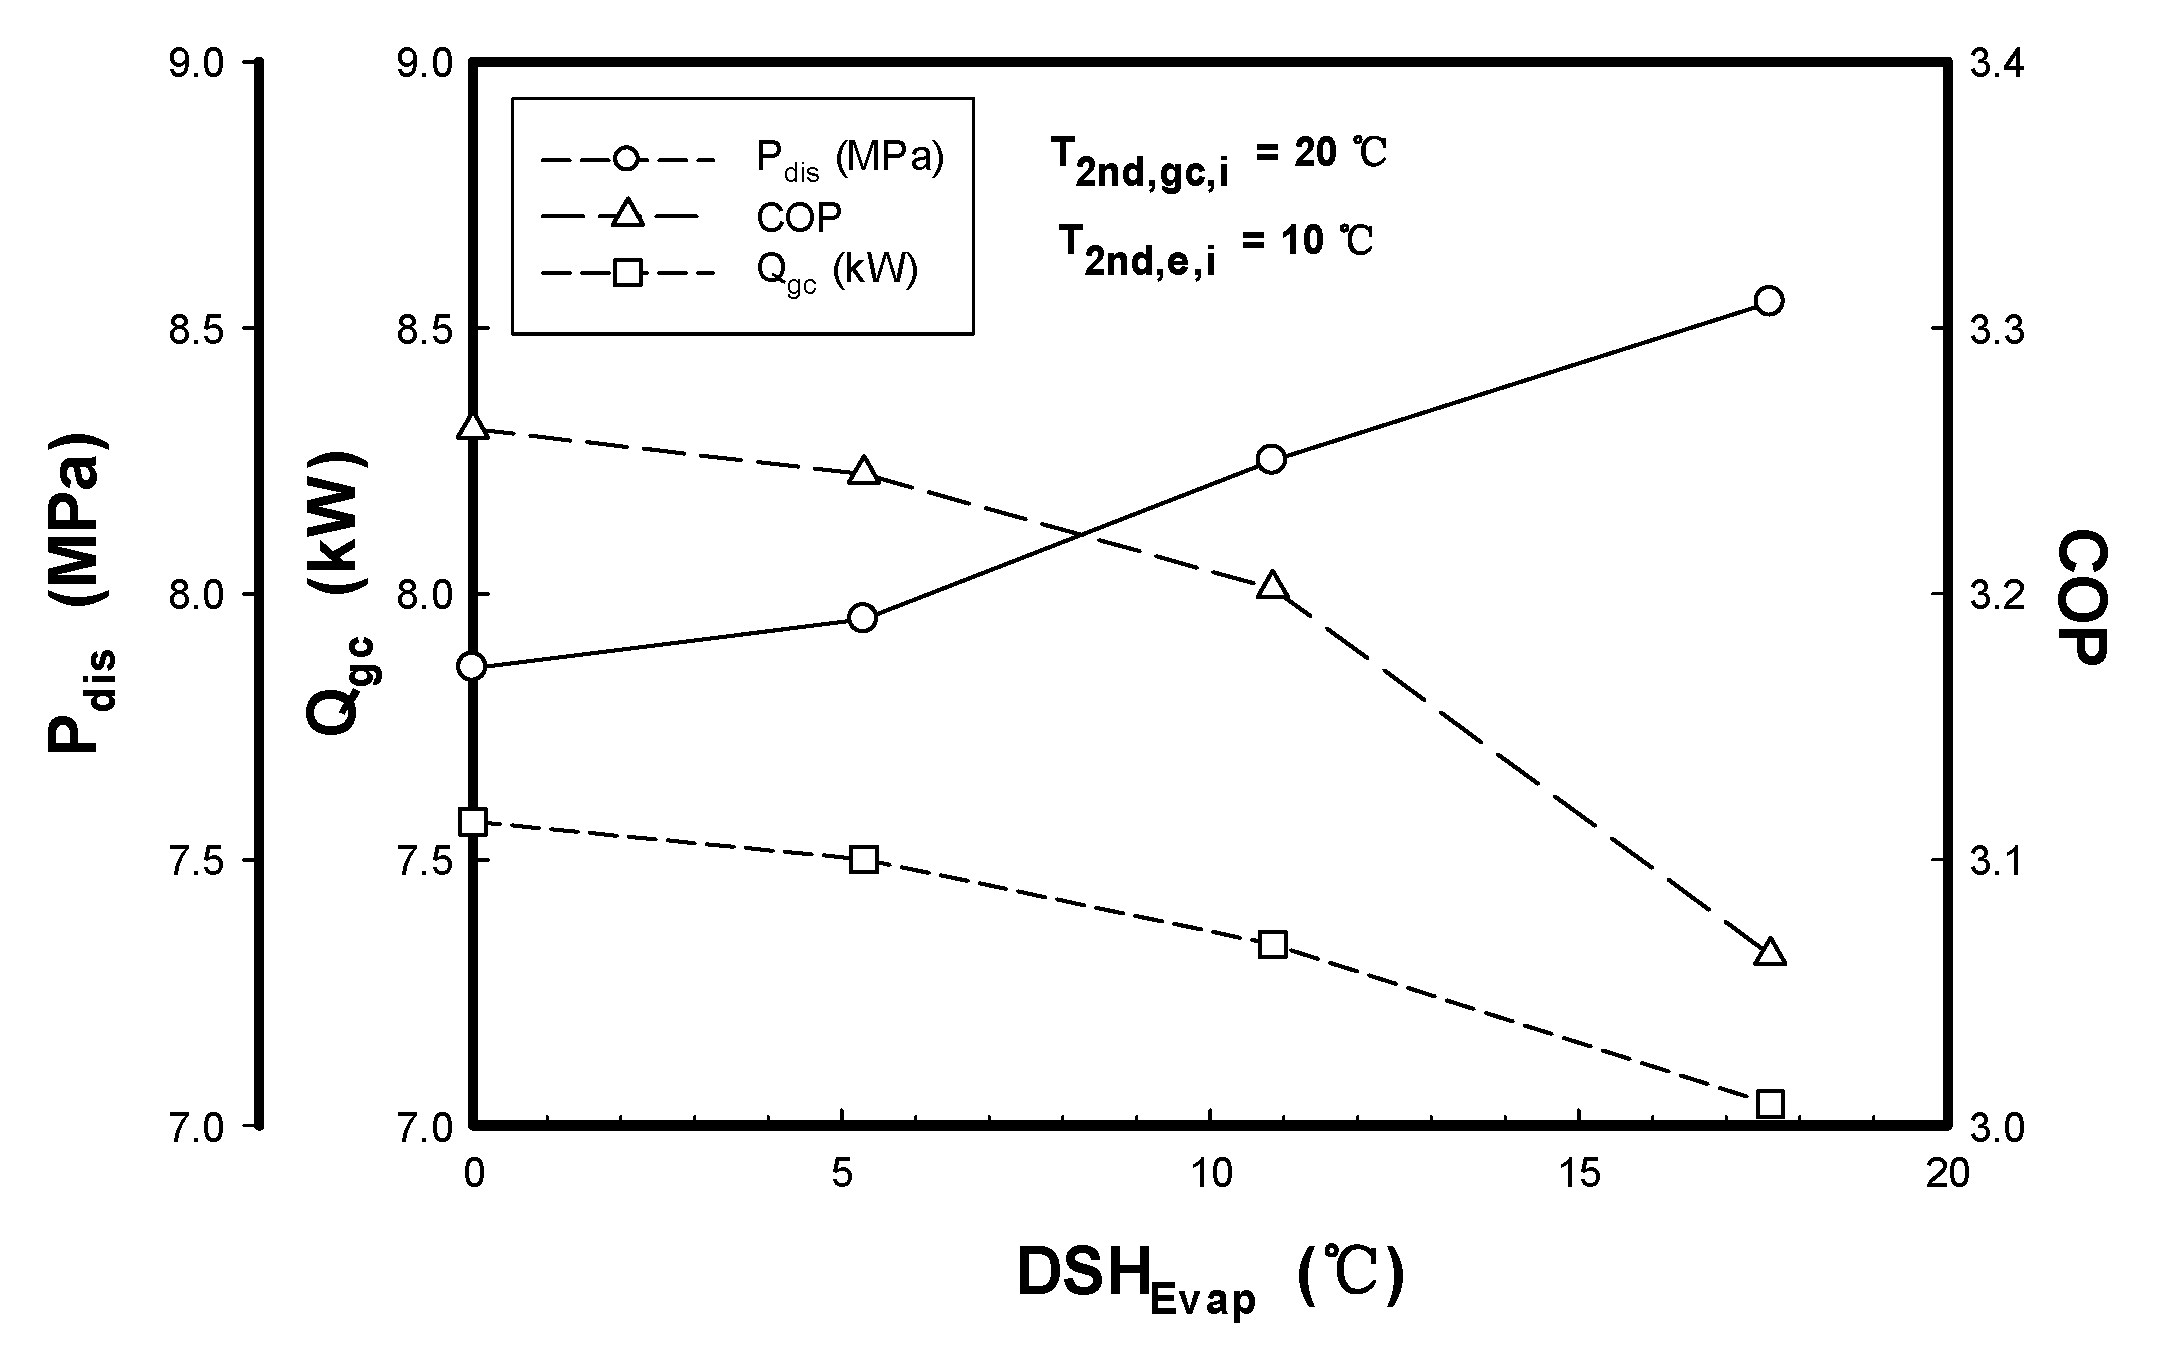
Figure 9 illustrates the variation in heating performance of the CO2 heat pump system with the superheat degree at the evaporator outlet ( D S H E v a p ), under the same secondary fluid inlet temperature conditions as before (10 °C for the evaporator and 20 °C for the gas cooler). As shown in the figure, the compressor discharge pressure increased with increasing D S H E v a p , whereas the heating capacity and COP both decreased. This trend occurs because an increase in the evaporator outlet superheat reduces the refrigerant mass flow rate, which in turn lowers both the heating capacity and the COP.
Based on the experimental results shown in Figure 9, the heating capacity and COP reached their maximum values when the D S H E v a p was 0 °C. Defining this value as the optimal superheat degree, the corresponding P o p t , d i s , Q o p t , g c , and C O P o p t were determined to be 7.86 MPa, 7.57 kW, and 3.26, respectively.
The near-identical optimal capacity, COP, and discharge pressure obtained here, compared with Section 3.2.1 (1), confirm—rather than merely repeat—that both sweeps converge on the same physically optimal valve opening; the two experiments differ only in which superheat variable ( D S H E v a p  vs. D S H I H X ) is used to index that optimum, and the two variables are not numerically equivalent because they are measured at different locations in the cycle.
These results indicate that the heating capacity and COP reach their maximum values when there is no superheat at the evaporator outlet ( D S H E v a p = 0 °C). Therefore, although an optimal expansion valve opening exists depending on the operating conditions, using the D S H I H X as the control variable for adjusting the expansion valve opening is evidently more appropriate.

3.2.2. Effect of the Secondary Fluid Inlet Temperature in the Evaporator

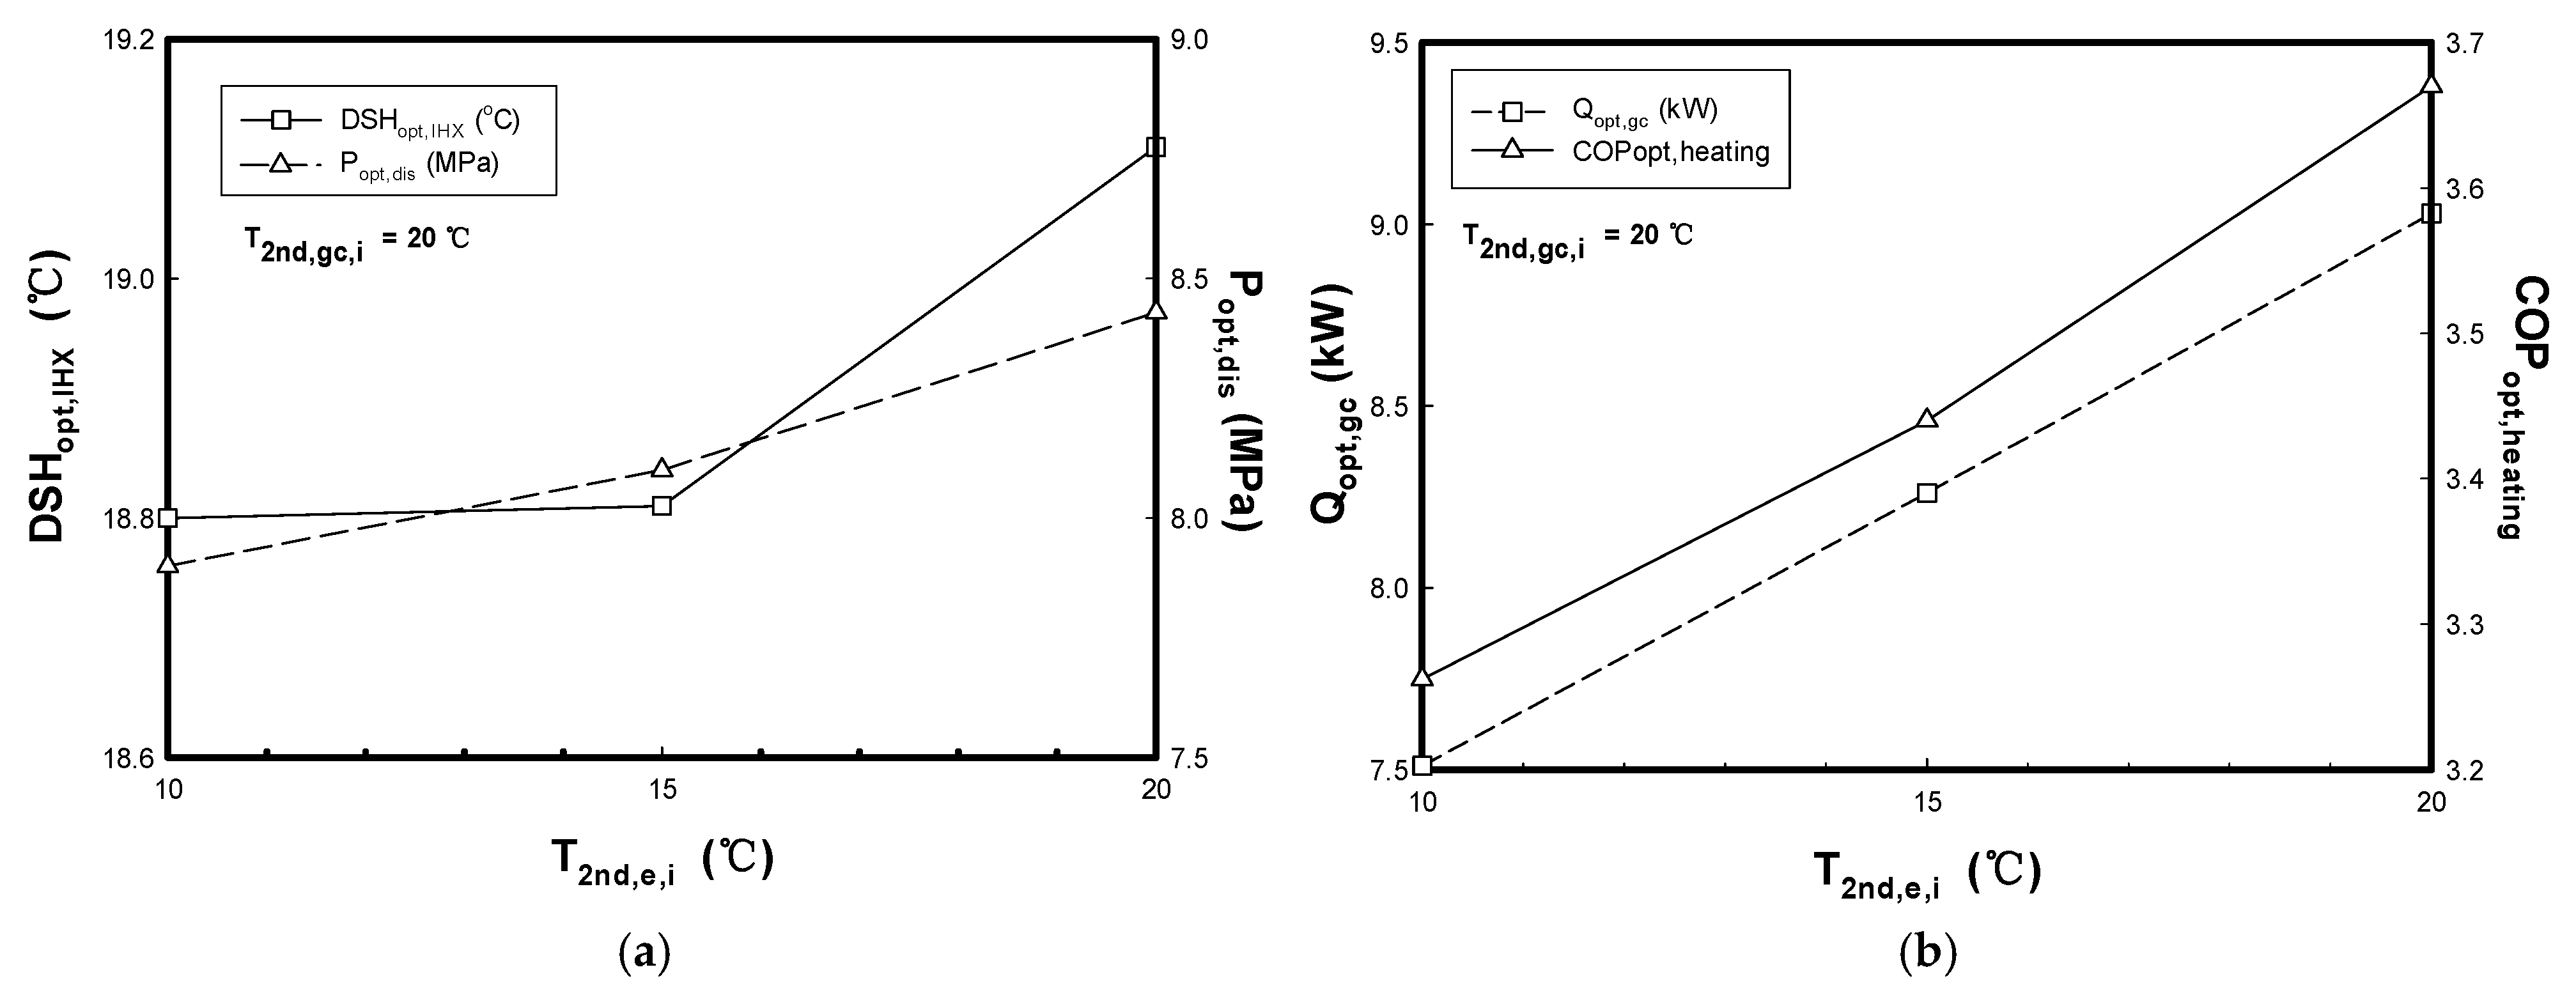
Figure 10 shows the optimal IHX outlet superheat degree ( D S H o p t , I H X ), P o p t , d i s , Q o p t , g c , and C O P o p t as functions of the secondary fluid inlet temperature in the evaporator under optimal heating-operation conditions. As shown in the figure, as the secondary fluid inlet temperature in the evaporator increased, D S H o p t , I H X and P o p t , d i s increased, while the heating capacity and COP also increased.
As discussed above, under heating-mode operation, a higher secondary fluid inlet temperature in the evaporator increased the evaporating pressure, which reduced the compression ratio while simultaneously increasing the refrigerant density at the compressor suction. The reduced compression ratio lowered the compressor power consumption, while the increased suction-side density improved the volumetric efficiency and thereby increased the refrigerant mass flow rate, which in turn increased the heating capacity. As a result, the combined increase in heating capacity and decrease in compressor power consumption led to a marked improvement in COP, and consequently, the optimal COP, heating capacity, and discharge pressure all exhibited a concurrent upward trend with increasing evaporator secondary fluid inlet temperature.
Meanwhile, as shown in Figure 10a, as the secondary fluid inlet temperature on the evaporator side increased, the rate of increase in the D S H o p t , I H X became more gradual than that of the D S H E v a p , indicating a decrease in the heat exchange effectiveness and heat transfer rate within the IHX. This behavior is attributable to a characteristic of the transcritical CO2 cycle: as the evaporating pressure rose toward the critical point, the saturated vapor enthalpy tended to decrease with increasing pressure, so that the latent heat of vaporization decreased accordingly. This reduction in latent heat near the critical point, in turn, resulted in an increase in the D S H I H X under the operating conditions corresponding to the optimal high pressure.

3.3. Cooling Characteristics of CO2 Heat Pumps

3.3.1. Effect of Outlet Superheat

(1) IHX Outlet Superheat ( D S H I H X )
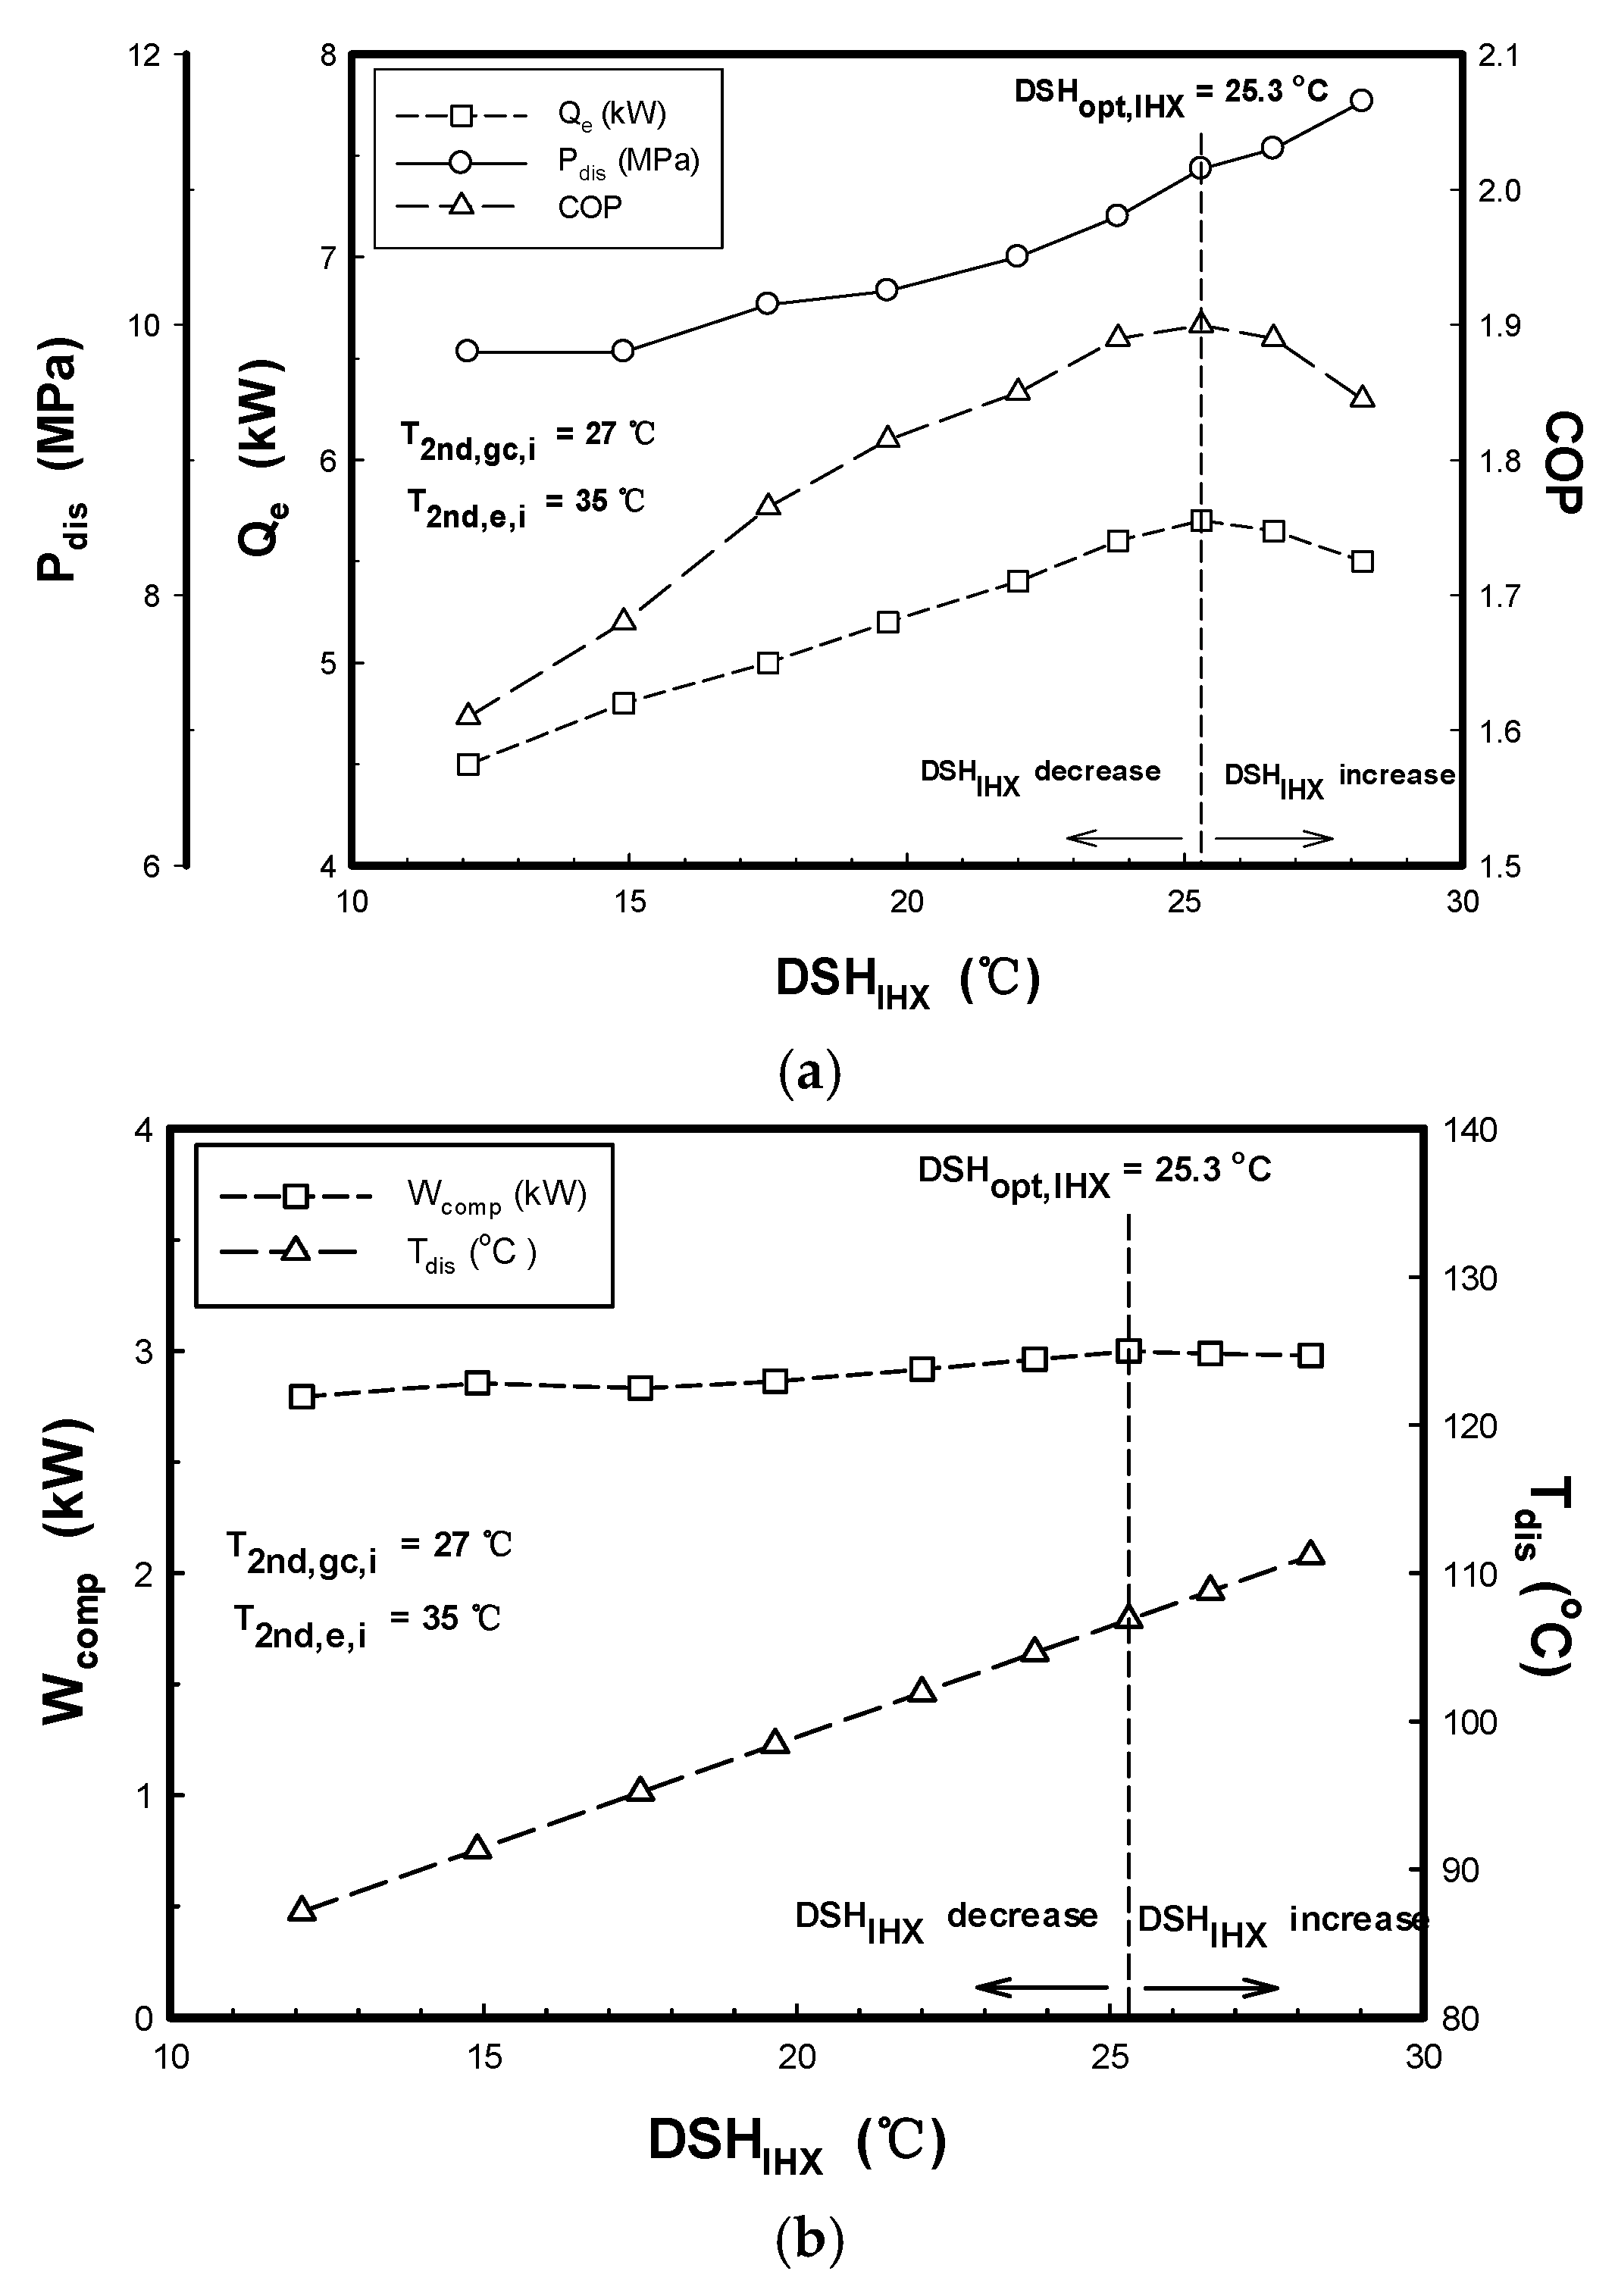
Figure 11 shows the changes in the cooling performance of a CO2 heat pump system as a function of the D S H I H X , under conditions where the inlet temperature of the secondary fluid in the evaporator is 35 °C and the inlet temperature of the secondary fluid in the gas cooler is 27 °C. As shown in Figure 11, the compressor discharge pressure increases as the outlet superheat increases. However, the cooling capacity and COP first increase and then decrease. As mentioned earlier, this phenomenon can be analyzed by dividing the cases into those where the superheat increases ( D S H I H X ≥ 25.3 °C) and those where it decreases ( D S H I H X ≤ 25.3 °C) relative to a specific superheat value ( D S H I H X = 25.3 °C), as follows.
When the D S H I H X increases ( D S H I H X ≥ 25.3 °C)—that is, when the expansion valve opening decreases—the refrigerant flow rate decreases, resulting in a reduction in cooling capacity and COP. Conversely, when the D S H I H X decreases ( D S H I H X ≤ 25.3 °C)—that is, when the expansion valve opening increases—the refrigerant flow rate increases. This leads to an increase in the heat exchange within the IHX, resulting in a decrease in the compression ratio. Consequently, the temperature difference between the refrigerant and the secondary fluid in the evaporator decreases, reducing heat exchange effectiveness. Therefore, both the cooling capacity and the COP decrease.
As shown in Figure 11, under test conditions where the inlet temperature of the secondary fluid in the evaporator was 35 °C and the inlet temperature of the secondary fluid in the gas cooler was 27 °C, the maximum cooling capacity and cooling COP occur when the D S H o p t , I H X at the outlet of the IHX is 25.3 °C. Therefore, taking this superheat as the optimal superheat, the P o p t , d i s is 11.15 MPa, the Q o p t , e is 5.7 kW, and the C O P o p t is 1.9.
As in the heating-mode tests (Section 3.2.1 (1)), the compressor operated at a fixed, constant speed throughout all cooling-mode tests shown in Figure 11; no inverter was connected to the compressor in this study. Compressor power consumption and discharge temperature, both measured directly, are added as companion traces to Figure 11 so that the reader can confirm that the observed capacity/COP optimum is not an artifact of changing compressor input power.
(2) Evaporator Outlet Superheat ( D S H E v a p )
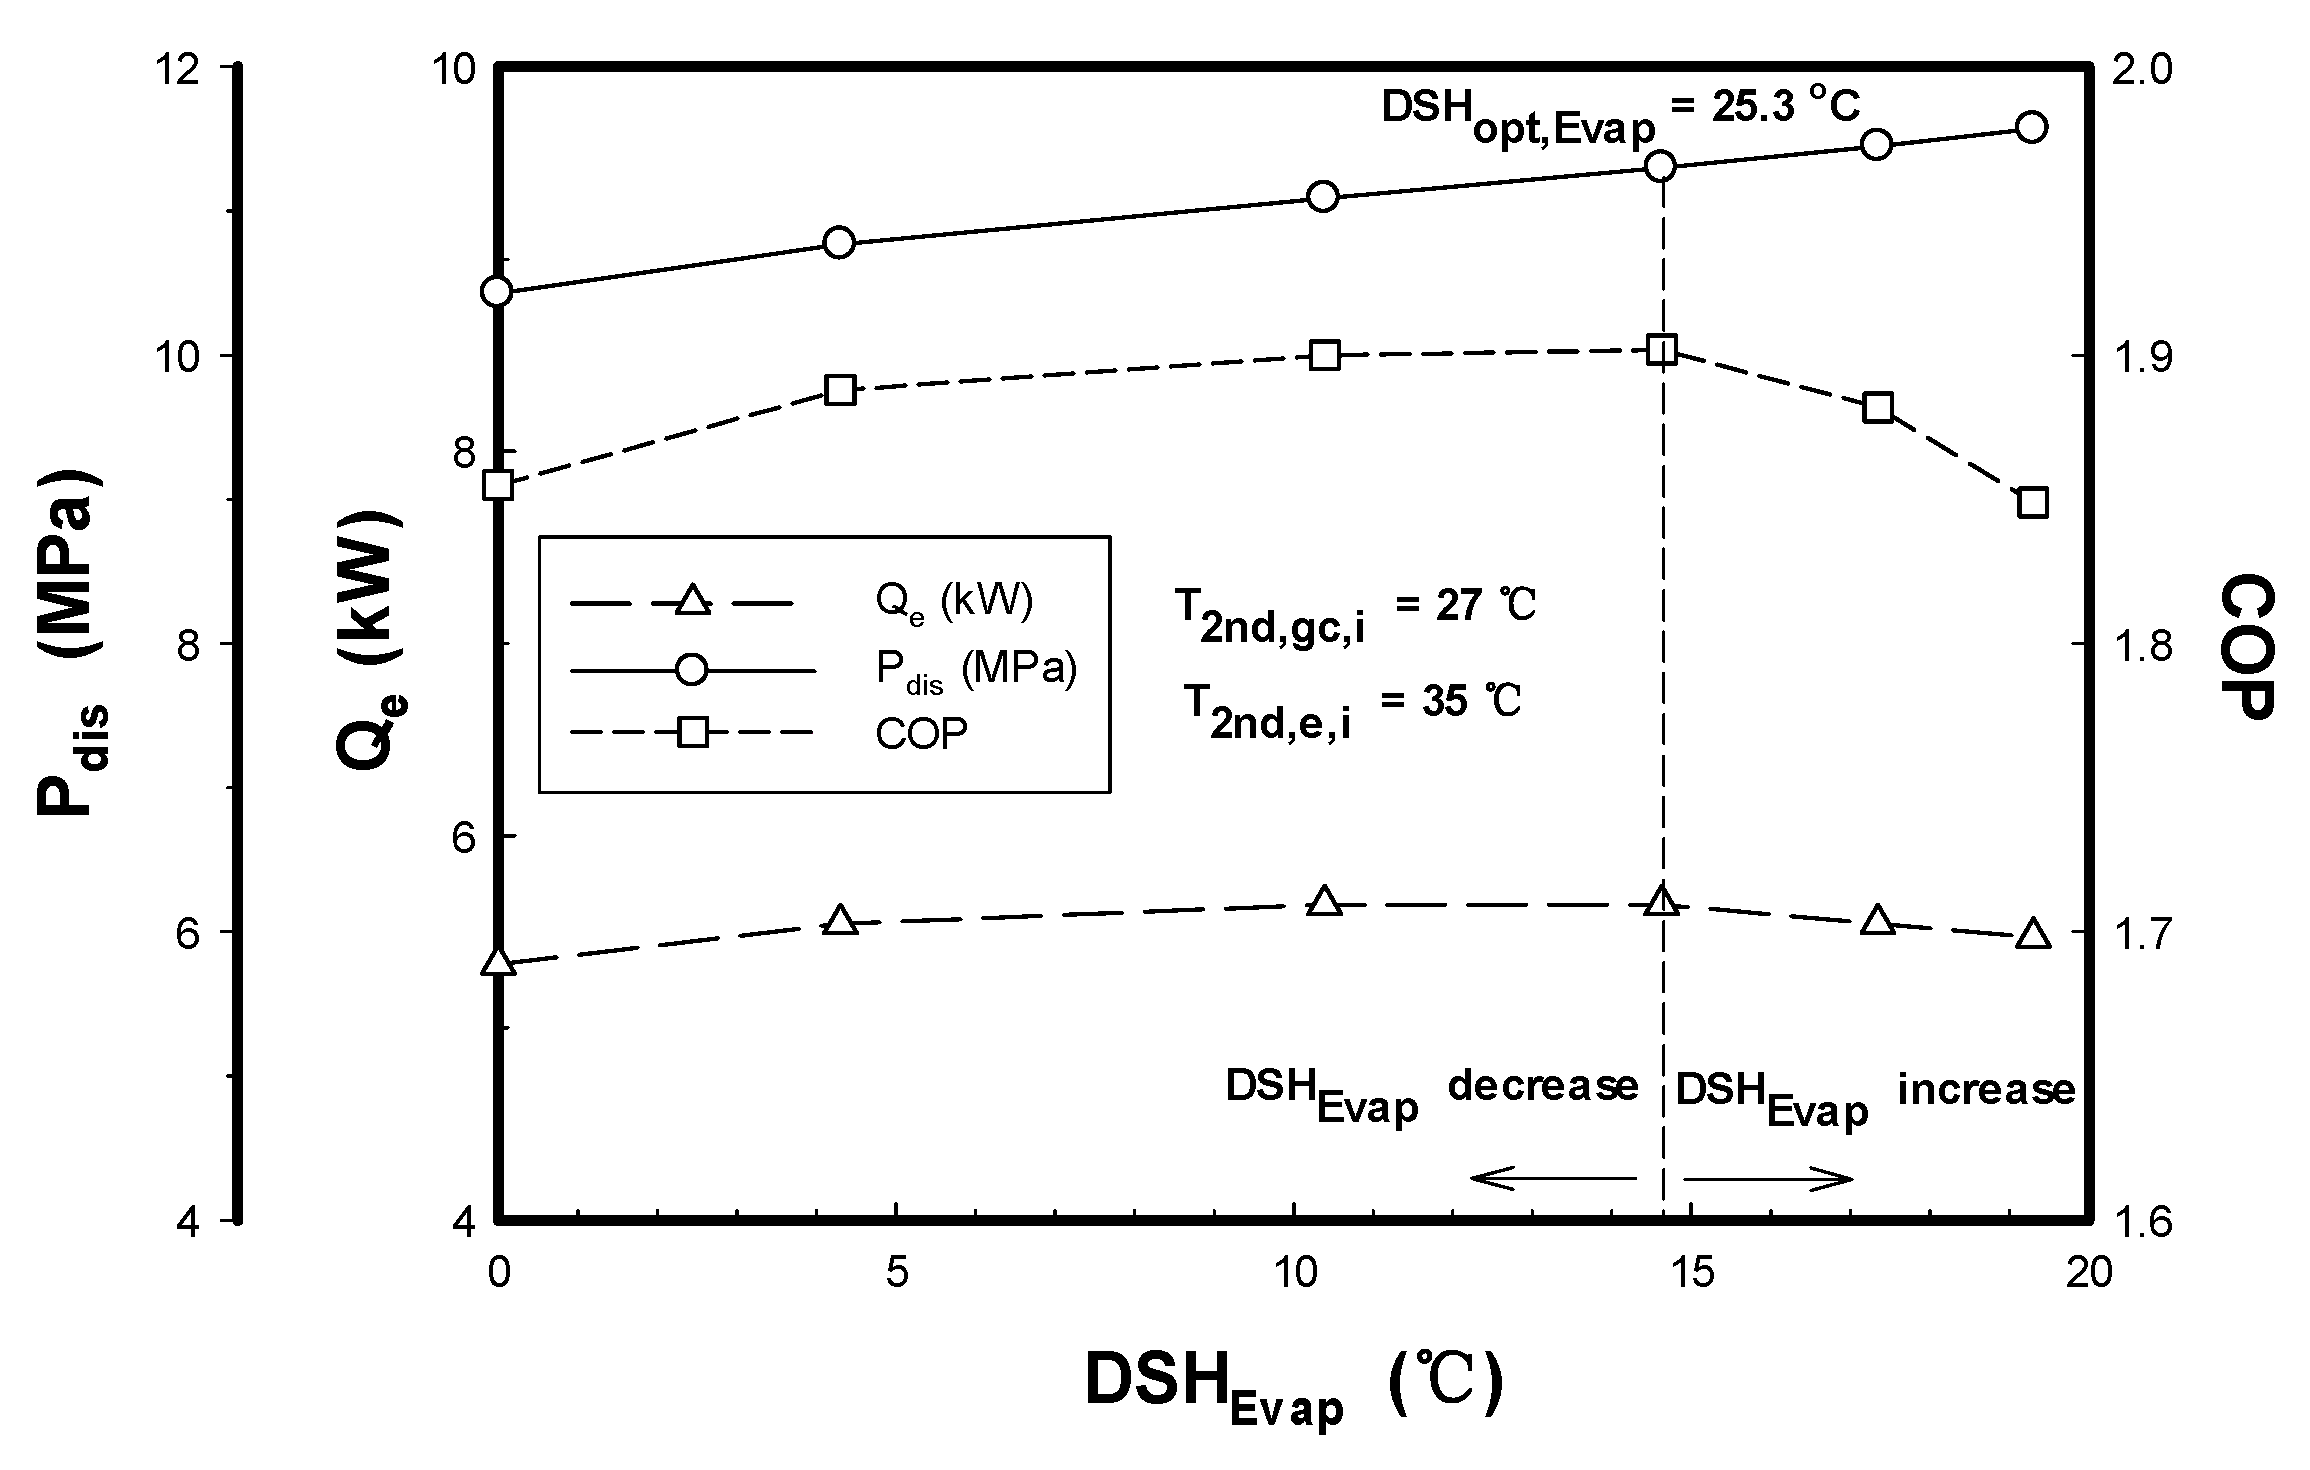
Figure 12 shows the variation in the cooling performance of a CO2 heat pump system as a function of D S H E v a p under conditions where the inlet temperature of the secondary fluid in the evaporator is 35 °C and the inlet temperature of the secondary fluid in the gas cooler is 27 °C. As shown in Figure 12, the characteristics of system performance variations resulting from adjustments to the expansion valve opening in cooling mode are similar to those observed under heating conditions, and there is a distinct optimal expansion valve opening that maximizes system performance. However, compared to the heating test results, the maximum cooling capacity and COP are achieved in the range where D S H E v a p is present. If sufficient D S H E v a p is not maintained, refrigerant in a two-phase flow state enters the IHX, ultimately leading to a reduction in cooling capacity. Therefore, to achieve high levels of cooling performance, D S H E v a p must be maintained. In summary, when optimizing performance through expansion valve control in a heat pump system with an IHX, it is more appropriate to adopt “ D S H I H X ” as the control variable rather than “ D S H E v a p .” This is because, although the D S H E v a p can be utilized even under cooling conditions, the D S H I H X provides a wider temperature tolerance range that allows for flexible control of the system’s overall cooling and heating capacity and enables the identification of the optimal operating point.
As shown in Figure 12, when the inlet temperature of the secondary fluid in the evaporator is 35 °C, the inlet temperature of the secondary fluid in the gas cooler is 27 °C.
The maximum cooling capacity and cooling COP occur when D S H o p t , E v a p    is 14.63 °C. The corresponding compressor-suction superheat ( D S H I H X ) resulting at this optimal evaporator-outlet superheat setting was close to, but not identical to, D S H o p t , I H X = 25.3 °C found in Figure 11, for the same reason given in Section 3.2.1 (2) for the heating-mode Figure 6 and Figure 7 comparison: D S H E v a p    and D S H I H X    are measured at different locations in the cycle and are not numerically equivalent, even though both sweeps locate the same physically optimal valve opening.
As in the heating-mode comparison (Section 3.2.1 (2)), the optimum identified via D S H E v a p in Figure 12 ( P o p t , d i s = 11.3 MPa, Q o p t , e = 5.64 kW, C O P o p t = 1.9) is closely consistent with—rather than a repetition of—the optimum identified via D S H I H X in Figure 11 ( P o p t , d i s = 11.15 MPa, Q o p t , e = 5.7 kW, C O P o p t = 1.9); both sweeps locate the same underlying optimal valve opening, and the small numerical differences between them (11.15 vs. 11.3 MPa; 5.7 vs. 5.64 kW) reflect ordinary point-to-point variation between two independent experimental sweeps rather than any inconsistency in the results.
The discharge pressure shown in Figure 12 was likewise not independently controlled: it is a dependent outcome of the manually set valve opening (and hence of D S H I H X ) at the fixed secondary-fluid boundary conditions ( T 2 n d , e , i = 35 °C, T 2 n d , g c , i = 27 °C). P o p t , d i s = 11.15 MPa identifies, post hoc, which of the tested valve openings produced the pressure at which cooling capacity and COP were maximized; it is not a pressure that was independently regulated or targeted during the test.

3.3.2. Effect of the Secondary Fluid Inlet Temperature in the Gas Cooler

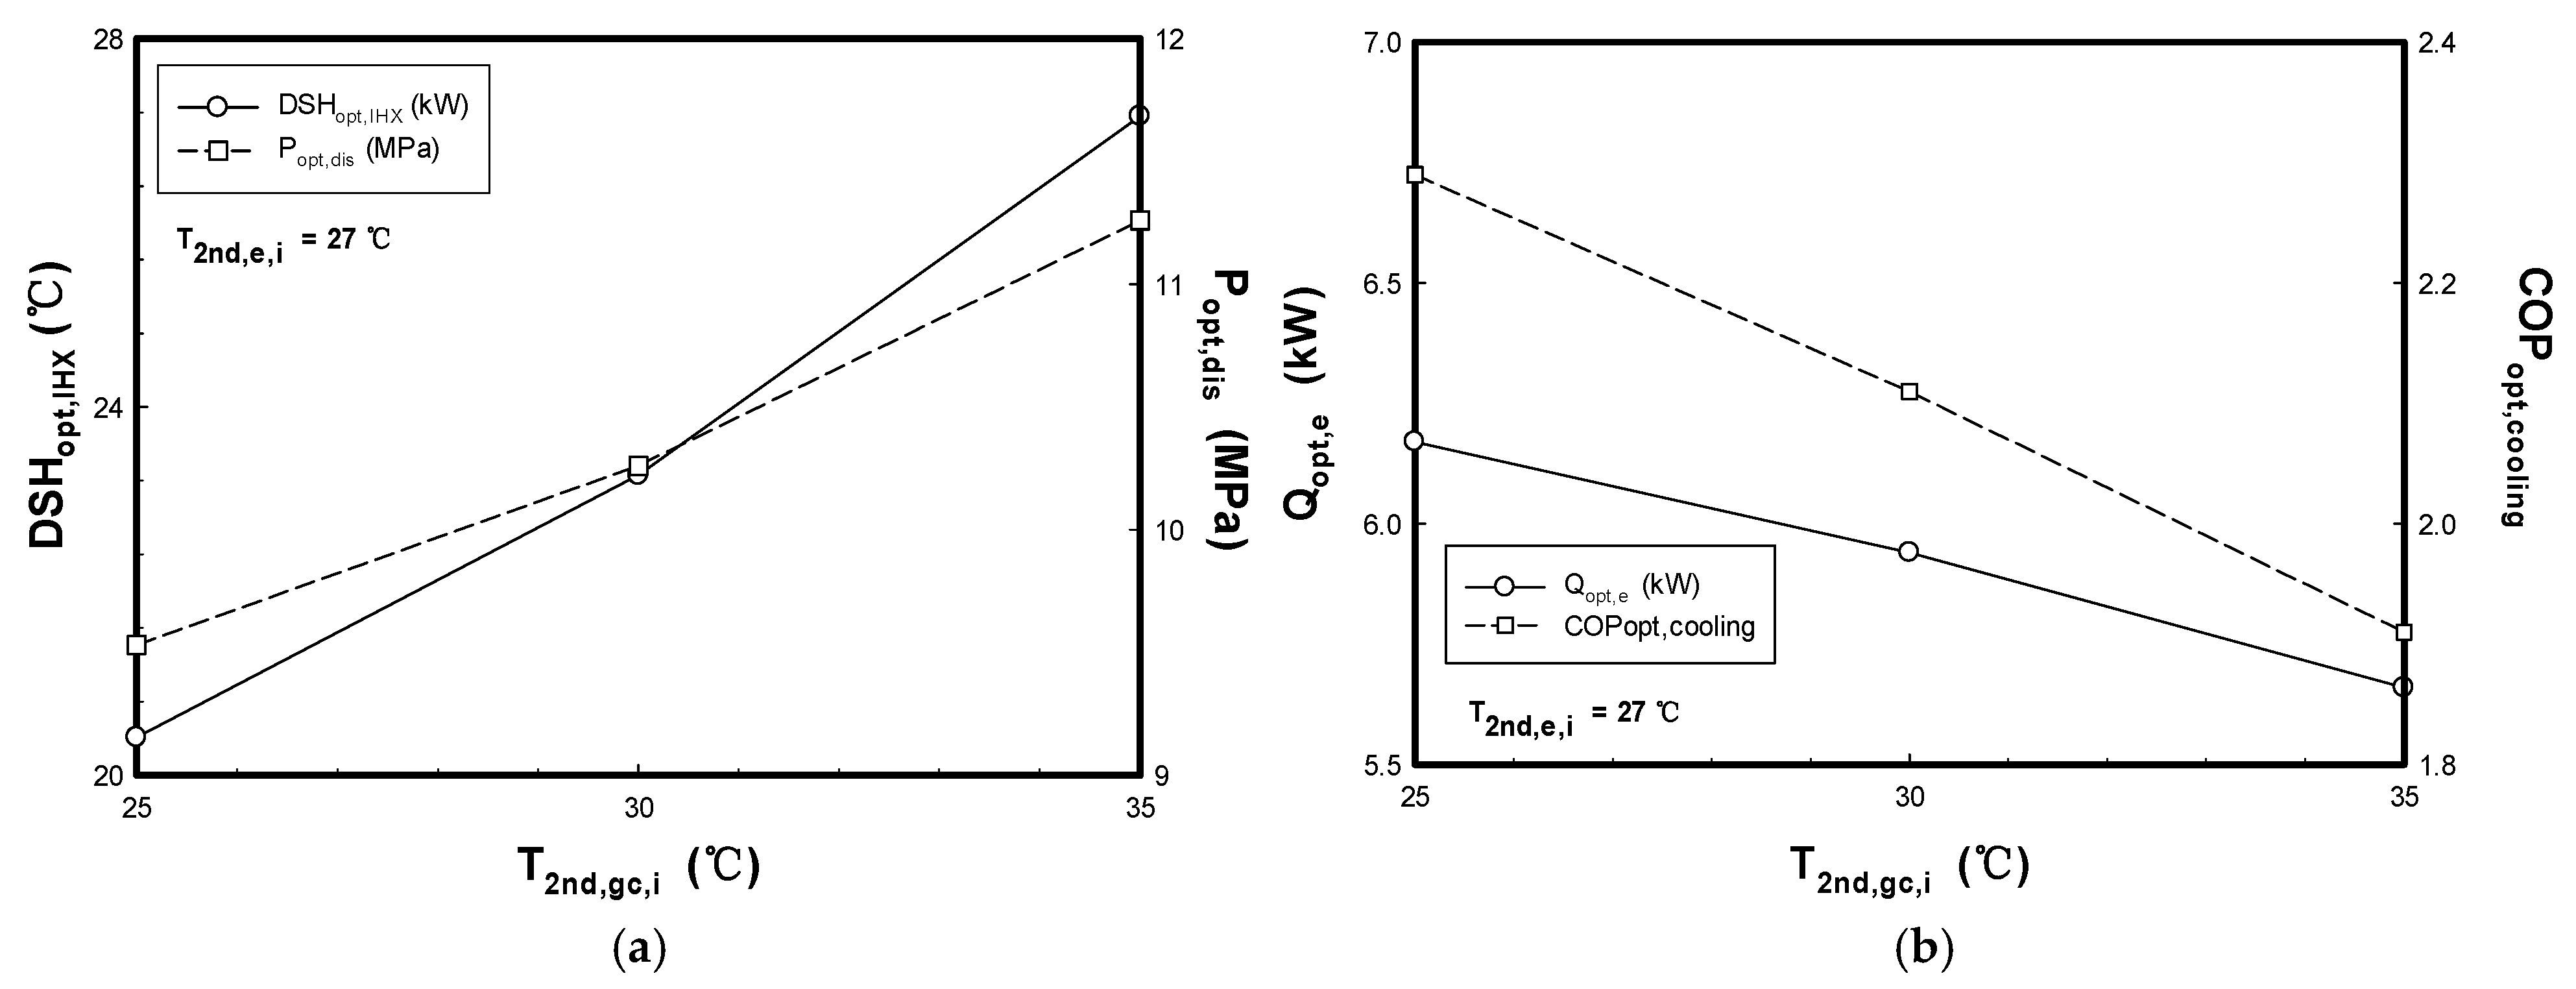
Figure 13 shows the D S H o p t , I H X , P o p t , d i s , Q o p t , e , and the C O P o p t ,   c o o l i n g , among other parameters, as a function of changes in the secondary fluid inlet temperature within the gas cooler under optimal cooling operating conditions.
In Figure 13, it can be seen that as the inlet temperature of the secondary fluid in the gas cooler increases, the D S H o p t , I H X increases, and consequently, the compressor outlet pressure rises. Similar to the results of the optimal heating experiment, as the refrigerant pressure on the evaporator side increases, the latent heat of evaporation decreases, causing D S H I H X to rise under operating conditions that satisfy the optimal high-pressure requirement.
As shown in the results in Figure 13, as the temperature of the secondary fluid entering the gas cooler rises, the optimal cooling capacity and COP decrease. This is because during cooling operation, the temperature rise of the secondary fluid on the gas cooler side pushes up the refrigerant pressure, thereby increasing the compression ratio and ultimately leading to an increase in refrigerant flow rate. However, as the expansion valve opening decreases in tandem with this, the rate of increase in refrigerant flow rate is relatively lower than the rate of increase in compressor power consumption. Consequently, the refrigerant pressure on the evaporator side rises, narrowing the temperature difference with the secondary fluid and, as a result, reducing the effective heat transfer rate. In other words, while cooling capacity decreases, the power required by the compressor increases, resulting in a lower COP. For this reason, the optimal COP and cooling capacity decrease, while the discharge pressure increases.

4. Discussion

The present results reinforce the general premise, established analytically for transcritical CO2 cycles, that an optimal high-side operating pressure exists at which cycle performance is maximized [2,10]. By identifying this optimum in terms of the directly controllable D S H I H X rather than discharge pressure itself, which is not straightforward to regulate directly via the expansion valve, the present study extends the optimal-high-pressure control concept demonstrated by Sarkar et al. [8] and Chen and Gu [10] into a form that is directly actionable for expansion valve control in a practical water-cooled CO2 heat pump.
A notable point of contrast arises with respect to the D S H E v a p results. Whereas the present study found that heating and cooling capacity and COP were maximized at D S H E v a p   = 0 °C and declined monotonically as D S H E v a p increased, Bullock [5] reported a COP improvement of approximately 5% when the D S H E v a p was expanded from 0 °C to 20 °C in an IHX-equipped cycle. This apparent discrepancy may stem from differences in system configuration, compressor characteristics, or in how the high-side pressure was regulated across the two studies; however, it also suggests that the benefit of evaporator-outlet superheating relative to IHX-outlet superheating may be system-dependent and warrants further comparison under matched operating conditions.
The degradation in performance observed beyond the D S H o p t , I H X is consistent with the mechanism proposed by Rozhentsev and Wang [6], who reported that excessive internal heat exchanger surface area or heat exchange capacity can reduce, rather than improve, system COP. In the present study, this manifested as a pinch-point-induced reduction in heat exchange effectiveness at high superheat degrees, providing further experimental support for the existence of a practical upper limit on IHX heat exchange duty in transcritical CO2 systems.
The finding that the D S H I H X offers a wider effective control range than the D S H E v a p is consistent with the observation of Chen and Gu [10] that an IHX reduces the sensitivity of overall system performance to the refrigerant quality at the evaporator outlet. This buffering effect is precisely what makes D S H I H X the more practical control variable identified in this study: whereas the D S H E v a p must be held tightly near 0 °C to sustain near-optimal performance, the IHX moderates the impact of deviations in evaporator-side conditions, allowing the expansion valve to be regulated over a broader operating window without a comparable performance penalty.
More broadly, the similarity between the present trends with respect to secondary fluid inlet temperature and those long established for subcritical, HFC-based heat pump cycles suggests that conventional heat pump design and control heuristics remain largely transferable to transcritical CO2 systems, despite the fundamentally different high-side thermodynamic behavior illustrated in Figure 1. This is a practically encouraging result for the continued adoption of CO2 as a natural, environmentally benign refrigerant in water-cooled heat pump applications and supports the broader research direction motivated by Lorentzen and Pettersen [3] and subsequent studies [4,7,8,9,11,12,13,14] of using IHX integration to close the performance gap between transcritical CO2 systems and conventional subcritical alternatives.
Several limitations of the present study should be acknowledged. First, the experiments were conducted using a single IHX geometry (a double-pipe exchanger of fixed tube diameter and length range); given that Cao et al. [13] reported a significant dependence of the optimal discharge pressure on IHX length, the present optimal superheat values should be interpreted as specific to the tested IHX configuration rather than universal. Second, the secondary fluid inlet temperature ranges investigated (10–35 °C for the evaporator, 20–27 °C for the gas cooler) do not extend to the elevated ambient conditions (up to 45 °C) considered by Purohit et al. [12], under which IHX benefits have been reported to be especially pronounced; extending the present test matrix to such conditions would help generalize the control strategy proposed here. Third, the test rig has no bypass line around the IHX. Consequently, the evaporator’s own intrinsic stable-operation envelope—expressed as the Minimum Stable Signal (MSS), i.e., the evaporator-outlet superheat below which hunting/instability occurs, as a function of refrigerant mass flow rate—could not be characterized independently of the IHX prior to the coupled tests reported here. All D S H E v a p  values reported in Section 3.2.1 (2) and Section 3.3.1 (2) are therefore cycle-level, IHX-coupled observations rather than a validated evaporator MSS map. Future revisions of the rig will incorporate an IHX bypass line so that the evaporator can be characterized in isolation (MSS vs. refrigerant mass flow rate) before it is used in coupled superheat-control experiments.
Future work should also examine the coupling between IHX-outlet-superheat-based expansion valve control and variable compressor speed operation, following the approach of Cho et al. [9], as well as an exergetic evaluation of the optimal operating points identified here, in the manner of Sarkar et al. [8], to quantify the thermodynamic quality, not only the COP, of operation at the identified optimum.

5. Conclusions

To optimize the design of a CO2 water-cooled heat pump system incorporating an IHX, the experimental results on performance characteristics as a function of D S H I H X and secondary fluid inlet temperature are summarized as follows:
  • Under heating-mode operating conditions, the compressor discharge pressure increased with increasing D S H I H X . However, the heating capacity and COP decreased whenever the D S H I H X deviated—either higher or lower—from a specific optimal value. Similarly, as the D S H E v a p outlet increased, the compressor discharge pressure rose while the heating capacity and COP declined. These results indicate the existence of an optimal expansion valve opening at which the heating-mode COP of the CO2 heat pump reaches a maximum. Accordingly, the expansion device should be set to the optimal opening based on the specific operating conditions of the heat pump.
  • In cooling mode, the compressor discharge pressure likewise increased with increasing D S H I H X ; however, the cooling capacity and COP initially increased before subsequently decreasing beyond a certain superheat range. In addition, as the secondary fluid inlet temperature at the gas cooler increased, both the D S H o p t ,   I H X and the corresponding compressor discharge pressure increased. Consistent with the heating-mode results, an increase in evaporator-side refrigerant pressure reduced the latent heat of evaporation; consequently, the IHX outlet superheat required to satisfy the optimal high-pressure condition tended to increase accordingly.
  • Under heating conditions with secondary fluid inlet temperatures of 10 °C (evaporator) and 20 °C (gas cooler), a maximum heating capacity of 7.6 kW and a COP of 3.26 were achieved at an IHX outlet superheat of 18.8 °C, corresponding to an optimal discharge pressure of approximately 7.9 MPa. Under cooling conditions with secondary fluid inlet temperatures of 35 °C (evaporator) and 27 °C (gas cooler), a maximum cooling capacity of 5.7 kW and a COP of 1.9 were achieved at an D S H I H X of 25.3 °C, with an optimal discharge pressure of approximately 11.15 MPa.
  • These results confirm the existence of optimal high-pressure conditions that maximize both capacity and COP in both cooling and heating modes. Within the experimental range examined in this study, the system can therefore be operated near its maximum COP by using the D S H I H X as a control variable to adjust the expansion valve opening. Precise control of the expansion valve opening is thus identified as a key factor in improving the performance of CO2 heat pump systems.
  • In both heating and cooling modes, the response of the CO2 heat pump system to variations in secondary fluid inlet temperature at the evaporator and gas cooler was found to be qualitatively similar to that of conventional Freon-based refrigeration cycles. This finding demonstrates that variations in secondary fluid inlet temperature significantly affect the COP of the CO2 heat pump system.

Author Contributions

Conceptualization, J.-H.L.; methodology, J.-H.L.; writing—original draft preparation, S.-J.H.; data curation, S.-J.H.; Formal analysis, S.-J.H.; visualization, S.-J.H.; Validation, S.-J.H. and J.-H.L.; Visualization, S.-J.H. and J.-H.L.; investigation, J.-H.L.; supervision, J.-H.L. All authors have read and agreed to the published version of the manuscript.

Funding

This research received no external funding.

Data Availability Statement

The data presented in this study are available on request from the corresponding author.

Conflicts of Interest

The authors declare no conflict of interest.

Glossary

Nomenclature
COPCoefficient of performance-
C p Specific heat at constant pressurekJ/kg·K
DSHDegree of superheat°C
EBHeat balance%
hEnthalpykJ/kg
IHXInternal heat exchanger-
kCoverage factor-
mMass flow ratekg/s
PPressureMPa
QHeat transfer ratekW
RMeasured variable-
TTemperature°C
UUncertainty-
UAOverall heat-transfer conductancekW/K
XDimensionless axial position-
WInput powerkW
Subscripts
2ndSecondary fluid-
disCompressor discharge-
compCompressor-
e, EvapEvaporator-
gcGas cooler-
iInlet-
IHXInternal heat exchanger-
lmLog mean-
oOutlet-
optOptimal value-
ratioRatio-
reRefrigerant-
sSaturation-
sucSuction-

References

  1. Neksa, P.; Rekstad, H.; Zakeri, G.R.; Schiefloe, P.A. CO2 heat pump water heater: Characteristics, system design and experimental results. Int. J. Refrig. 1998, 21, 172–179. [Google Scholar] [CrossRef] [Scilit]
  2. Hwang, Y.; Radermacher, R. Theoretical evaluation of carbon dioxide refrigeration cycle. HVAC&R Res. 1998, 4, 245–263. [Google Scholar] [CrossRef] [Scilit]
  3. Lorentzen, G.; Pettersen, J. A new, efficient and environmentally benign system for car air-conditioning. Int. J. Refrig. 1993, 16, 4–12. [Google Scholar] [CrossRef] [Scilit]
  4. Bivens, D.B.; Allgood, C.C.; Rizzo, J.J.; Shiflett, M.B.; Patron, D.M.; Chisolm, T.E.C.; Shealy, G.S.; Yokozeki, A.; Wells, W.D.; Geiger, K.A. HCFC-22 alternative for air conditioners and heat pumps. ASHRAE Trans. 1994, 100, 566–572. [Google Scholar]
  5. Bullock, C.E. Theoretical performance of carbon dioxide in subcritical and transcritical cycles. In Proceedings of the ASHRAE/NIST Refrigerants Conference, Gaithersburg, MD, USA, 6–7 October 1997; pp. 20–26. [Google Scholar]
  6. Rozhentsev, A.; Wang, C.C. Some design features of a CO2 air conditioner. Appl. Therm. Eng. 2001, 21, 871–880. [Google Scholar] [CrossRef] [Scilit]
  7. Boewe, D.E.; Yin, J.M.; Park, Y.C.; Bullard, C.W.; Hrnjak, P.S. The role of suction line heat exchanger in transcritical R-744 mobile A/C systems. In Proceedings of the SAE International Congress and Exposition, Detroit, MI, USA, 1 March 1999. [Google Scholar] [CrossRef] [Scilit]
  8. Sarkar, J.; Bhattacharyya, S.; Gopal, M.R. Optimization of a transcritical CO2 heat pump cycle for simultaneous cooling and heating applications. Int. J. Refrig. 2004, 27, 830–838. [Google Scholar] [CrossRef] [Scilit]
  9. Cho, H.; Ryu, C.; Kim, Y. Cooling performance of a variable speed CO2 cycle with an electronic expansion valve and internal heat exchanger. Int. J. Refrig. 2007, 30, 664–671. [Google Scholar] [CrossRef] [Scilit]
  10. Chen, Y.; Gu, J.C. The optimum high pressure for CO2 transcritical refrigeration systems with internal heat exchangers. Int. J. Refrig. 2005, 28, 1238–1249. [Google Scholar] [CrossRef] [Scilit]
  11. Aprea, C.; Maiorino, A. An experimental evaluation of the transcritical CO2 refrigerator performances using an internal heat exchanger. Int. J. Refrig. 2008, 31, 1006–1011. [Google Scholar] [CrossRef] [Scilit]
  12. Purohit, N.; Gupta, D.K.; Dasgupta, M.S. Experimental investigation of a CO2 transcritical cycle with IHX for chiller application and its energetic and exergetic evaluation in warm climate. Appl. Therm. Eng. 2018, 136, 617–632. [Google Scholar] [CrossRef] [Scilit]
  13. Cao, F.; Wang, Y.; Ye, Z. Theoretical analysis of internal heat exchanger in transcritical CO2 heat pump systems and its experimental verification. Int. J. Refrig. 2019, 106, 506–516. [Google Scholar] [CrossRef] [Scilit]
  14. Cui, T.; Ma, G.; Wang, L. Research progress of CO2 air source heat pump system for heating. Renew. Energy 2026, 259, 125083. [Google Scholar] [CrossRef] [Scilit]
  15. McLinden, M.O.; Klein, S.A.; Lemmon, E.W.; Peskin, A.P. NIST Standard Reference Database 23: NIST Thermodynamic and Transport Properties of Refrigerants and Refrigerant Mixtures-REFPROP; Version 6.0; National Institute of Standards and Technology: Gaithersburg, MD, USA, 1998.
  16. Kline, S.J.; McClintock, F.A. Describing Uncertainties in Single-Sample Experiments. Mech. Eng. 1953, 75, 3–8. [Google Scholar]
Figure 1. Temperature–entropy diagrams for the vapor-compression cycles of (a) conventional R-22 and (b) transcritical CO2.
Energies 19 04273 g001
Figure 2. Schematic diagram of the experimental apparatus for the CO2 heat pump.
Energies 19 04273 g002
Figure 3. Overview of gas cooler with thermocouple and pressure transducer locations.
Energies 19 04273 g003
Figure 4. Overview of evaporator with thermocouple and pressure transducer locations.
Energies 19 04273 g004
Figure 5. Measurement system of temperature, pressure, mass flow rate, and electric power.
Energies 19 04273 g005
Figure 6. CO2 temperature and pressure and secondary fluid mass flow rate according to operating time ( T 2 n d , g c = 25 °C, T 2 n d , e = 20 °C, m 2 n d , g c = 60 g/s, m 2 n d , e = 110 g/s).
Energies 19 04273 g006
Figure 7. Temperature profile and P-h diagram for the transcritical heat pump system with internal heat exchanger ( T 2 n d , g c = 25 °C, T 2 n d , e = 20 °C, m 2 n d , g c = 60 g/s, m 2 n d , e = 110 g/s): (a) Temperature profile of CO2 and secondary fluid in the gas cooler and evaporator; (b) Pressure and enthalpy diagram.
Energies 19 04273 g007
Figure 8. Heating performance variation with respect to the expansion valve opening and superheat degree of internal heat exchanger outlet. (a) P d i s ,   Q g c , and C O P ; (b) W c o m p and T d i s .
Energies 19 04273 g008
Figure 9. Heating performance variation with respect to the expansion valve opening and superheat degree of evaporator outlet.
Energies 19 04273 g009
Figure 10. Optimum heating performance with respect to the inlet temperature of the secondary fluid in the evaporator: (a) Discharge pressure and superheat degree at internal heat exchanger outlet; (b) Heating capacity and COP.
Energies 19 04273 g010
Figure 11. Cooling performance variation with respect to the expansion valve opening and superheat degree of internal heat exchanger outlet. (a) P d i s ,   Q e , and C O P ; (b) W c o m p and T d i s .
Energies 19 04273 g011
Figure 12. Cooling performance variation with respect to the expansion valve opening and superheat degree of evaporator outlet.
Energies 19 04273 g012
Figure 13. Optimum cooling performance with respect to the inlet temperature of the secondary fluid in the gas cooler: (a) Discharge pressure and superheat degree at internal heat exchanger outlet; (b) Cooling capacity and COP.
Energies 19 04273 g013
Table 1. Specifications of IHX for CO2 heat pump.
ParametersValues
Internal heat exchangerTypeDouble pipe type
Length, [mm]1500, 3000, 4500
TubeInner diameter (Out diameter), [mm]7.75
(9.53)
ShellInner diameter (Out diameter), [mm]26
(28.5)
EvaporatorTypeDouble pipe type
Length, [mm]9600
TubeInner diameter (Out diameter), [mm]7.75
(9.53)
ShellInner diameter (Out diameter), [mm]26
(28.5)
Gas coolerTypeDouble pipe type
Length, [mm]14,400
TubeInner diameter (Out diameter), [mm]7.75
(9.53)
ShellInner diameter (Out diameter), [mm]26
(28.5)
Table 2. Components of the CO2 heat pump system.
Refrigerant Compressor
ModelDaikin (Osaka, Japan), 1YC30AXD
Discharge pressure13.7 MPa
Volume640 mL
Safety pressure40.1 MPa
Power supply range3-phase, AC 200~220 V, 50~60 Hz
18~20 A
Metering valve (Manual)
ModelSwagelok (Solon, OH, USA), ss-6 L-mH
Range100 °C, 12 MPa
Pressure relief valve
ModelObrist (Lustenau, Austria), 316 stainless steel
pressure30 MPa
Constant temperature bath
ModelJeioTech (Daejeon, Republic of Korea), HL-55H
Range−20~40 °C
70 L/min (max.)
7.1 kW @20 °C/6.0 kW @10 °C
Accuracy±1 °C
Table 3. Specifications of the instrumentation and data-acquisition system.
Multi-Channel Recorder
ModelYokogawa (Tokyo, Japan), Dr-232 C
Maximum input channels60 channels
Measurement accuracy±(0.05% of reading + 5 digits)
DC power supply rangeNot DC-powered—rated 100–240 V AC (operating range 90–250 V AC), 50/60 Hz, ≈130 VA max
Output signal rangeN/A—the recorder logs input signals (thermocouple, RTD, 4–20 mA, DC voltage)
Absolute Pressure Transducer
ModelSenzors (Dover, DE, USA), PT1H
Range0~16 MPa
Accuracy±0.2%
ModelDruck (Leicester, UK), PTX611
Range0~16 MPa
Accuracy±0.004%
DC power supply range8–32 VDC (for the 4–20 mA, 0–5 VDC, or 0.5–4.5 VDC output options) or 13–32 VDC (for the 0–10 VDC option)
Output signal range4–20 mA DC (2-wire) is the standard/most common option; 0–5 VDC, 0–10 VDC, or 0.5–4.5 VDC also selectable
Differential pressure transmitter
ModelSenzors (Dover, DE, USA), PD1M
Range0~0.5 MPa
Accuracy±0.2%
ModelDruck (Leicester, UK), STX2100
Range0~0.3 MPa (static Pressure: 14 MPa)
Accuracy±0.1%
DC power supply range8–32 VDC (4–20 mA/0–5 VDC/0.5–4.5 VDC options) or 13–32 VDC (0–10 VDC option)
Output signal range4–20 mA DC (2-wire) standard; 0–5 VDC, 0–10 VDC, or 0.5–4.5 VDC also
Mass flow meter of refrigerant
ModelOval (Tokyo, Japan), CT9401
Mass flow rate0~6 kg/min
Pressure15 MPa
Accuracy±0.1%
DC power supply range85–264 V AC, 50/60 Hz, or 20–30 VDC (dual-rated field-mount transmitter)
Output signal range4–20 mA DC analog (two configurable channels, max. load 600 Ω), and/or pulse output (open-collector, 0.1–10,000 Hz full scale)
Power meter
ModelYokogawa (Tokyo, Japan), Wt110-253401
Range0~600 V, 0~300 A
Accuracy±0.1%
DC power supply rangeNot DC-powered—AC mains powered (auto-ranging, 50/60 Hz); optional D/A analog output module available for retransmitting measured values—
Output signal rangeSee note above (D/A option)
Flow meters of secondary fluid
ModelKROHNE (Duisburg, Germany), OPTIFLUX 1050 C (DN10)
Range1.33~56.5 kg/min
Pressure4 MPa
Accuracy±0.5% of measured value ±1 mm/s
DC power supply range24 VDC (20.4–28.8 VDC)
Output signal range4–20 mA DC
Table 4. Experimental conditions for performance test of CO2 heat pump.
ParametersValues
Internal heat exchangerOutlet superheat degree [°C]10~30
Gas coolerSecondary fluidInlet temperature [°C]20~27
Mass flow rate [g/s]60
EvaporatorSecondary fluidInlet temperature [°C]10~35
Mass flow rate [g/s]110
Outlet superheat degree [°C]0~20
Table 5. Estimated relative uncertainty of key performance parameters.
ParameterRelative Uncertainty
Compressor work, W c o m p (direct measurement)±1.0%
Enthalpy difference, Δ h c o m p ±2.4%
Enthalpy difference, Δ h E v a p ±0.6%
Mass flow rate, m±2.6%
Evaporating capacity, Q E v a p ±2.7%
Gas cooling heat, Q g c ±2.2%
COP±2.5%
Disclaimer/Publisher’s Note: The statements, opinions and data contained in all publications are solely those of the individual author(s) and contributor(s) and not of MDPI and/or the editor(s). MDPI and/or the editor(s) disclaim responsibility for any injury to people or property resulting from any ideas, methods, instructions or products referred to in the content.