Article

Insulation-Condition Assessment of Oil-Immersed Transformer Bushings Based on a Physics-Proxy-Residual-Guided Cross-Attention Ensemble Neural Network

1
Guangdong Power Grid Co., Ltd., Qingyuan 511500, China
2
Hebei Provincial Key Laboratory of Safety and Protection for Transmission and Transformation Equipment, North China Electric Power University, Baoding 071003, China
*
Author to whom correspondence should be addressed.
Energies 2026, 19(18), 4239; https://doi.org/10.3390/en19184239
Submission received: 25 July 2026 / Revised: 29 August 2026 / Accepted: 5 September 2026 / Published: 8 September 2026

Abstract

This study proposes a physics-proxy-residual-guided cross-attention ensemble neural network (PGAE-NN) for oil-immersed transformer bushing insulation-condition assessment and early warning. Eight core indicators are selected from twelve candidates via Pearson correlation and Fisher discriminant analyses, with four insulation levels defined with reference to IEEE Std C57.104-2019. LightGBM, 1D-CNN, and Transformer Encoder serve as heterogeneous base learners for statistical, local temporal, and global temporal features. A cross-attention meta-learner fuses their outputs by penalizing predictions that deviate from Arrhenius thermal-aging and Fick moisture-migration proxy residuals. A piecewise regularization strategy and a classification-precursor dual-task objective further enhance degradation-stage adaptivity and early warning. Validation uses 23,400 accelerated-aging samples from four 110 kV bushings under four typical defects. PGAE-NN achieves 96.14% test accuracy (F1 = 0.9613; AUC = 0.9835) and 96.36% ± 0.54% five-fold cross-validation accuracy, outperforming PSO-SVM and Traditional Stacking by 7.99 and 2.69 percentage points, respectively. The precursor-warning F1 reaches 0.923, and ablation studies confirm the meta-learner, dual physics constraints, and dual-task design contribute 1.82, 1.46, and 1.11 percentage points, respectively. The proxy residual under severe conditions drops by 44.9%, demonstrating that physics-guided fusion constrains predictions within physically consistent boundaries.

1. Introduction

Power transformers are critical grid equipment, and the oil-immersed bushing—responsible for guiding high-potential current and providing insulation support—is among their most vulnerable components [1,2]. With the rapid development of new power systems characterized by abundant harmonics and frequent transient disturbances [3,4], bushing insulation is subjected to combined electrical, thermal, and mechanical stresses that significantly accelerate degradation [5,6]. As bushing failures have severe consequences and require prolonged repair cycles [7,8,9], accurate condition assessment and early warning are essential for grid safety.
Considerable research has been devoted to bushing insulation evaluation. Offline characterization methods include polarization/depolarization current analysis extracting relaxation contribution coefficients [10], temperature-corrected dielectric response curves [11], and multi-source defect identification integrating dielectric spectroscopy, partial discharge, and thermography [12]. These approaches rely on offline tests and cannot capture dynamic operating variations. For online monitoring, real-time perception of insulation degradation through multi-source parameters has become a prevailing direction [13,14]. Intelligent assessment methods have also emerged, including cloud models coupled with evidential reasoning [15], deep-learning-based infrared image diagnosis [16], and frequency-domain-spectroscopy-based moisture ingress evaluation [17]. Nevertheless, these approaches either depend on offline testing or adopt a purely data-driven perspective, lacking physical interpretability.
Data-driven approaches represented by deep learning offer new solutions for equipment-condition assessment [18,19], yet their application to bushing evaluation faces three challenges: (1) fault samples with explicit state labels are extremely scarce due to the slow ageing process; (2) condition parameters span heterogeneous dimensions—electrical and non-electrical quantities—making scientific fusion difficult; and (3) purely data-driven black-box models may yield predictions that violate physical laws, limiting interpretability and extrapolation reliability.
Recent studies have explored these challenges from various angles. In ensemble learning, Ref. [20] applied gradient-boosted decision trees to predict the condition of insulating paper and Ref. [21] adopted stacked ensembles for transformer fault diagnosis, but the Stacking meta-learner relies on fixed-weight summation without dynamic credibility adjustment. For physics-informed approaches, Ref. [22] embedded physical equations as soft constraints for power transformer thermal modeling; Refs. [23,24] provided mechanistic insights into moisture influence on partial discharge and temperature-dependent adsorption–desorption in oil–paper insulation; Ref. [25] highlighted the lack of physical interpretability in data-driven models; Ref. [26] applied PINN to bushing insulation parameter inversion; and Ref. [27] noted that current physical constraints employ globally uniform weights without adaptive degradation-stage adjustment.
Regarding attention mechanisms, Ref. [28] proposed cross-attention feature fusion for fault diagnosis, Ref. [29] developed multi-modal fusion for multi-condition fault diagnosis, and Ref. [30] introduced Transformer networks for DGA data reconstruction; however, none incorporated physical mechanisms to guide attention allocation. For early warning, Ref. [31] developed a DGA-based fault early-warning model with deep learning, Ref. [32] emphasized state-transition warning for fault risk reduction, and Ref. [33] demonstrated the regularization effect of auxiliary tasks on main-task feature learning. Nevertheless, these studies each address a single dimension, and no framework yet integrates heterogeneous ensemble, physics-guided dynamic fusion, and dual-task early warning. Embedding physics-proxy residuals into cross-attention scores for bushing insulation assessment remains an open research gap.
To address these challenges, this paper proposes a physics-proxy-residual-regularized cross-attention ensemble neural network (PGAE-NN) for transformer bushing insulation assessment. LightGBM, 1D-CNN, and Transformer Encoder serve as heterogeneous base learners to extract statistical, local temporal, and global temporal features. A PGCA meta-learner introduces Arrhenius thermal ageing and Fick moisture-migration dual physics-proxy residual penalties into cross-attention scores for physics-guided dynamic fusion, with a piecewise regularization strategy (λ = 0.1–0.7) that adaptively strengthens constraints with degradation severity. A classification–precursor dual-task framework enables early warning 15 min before state transitions. The method is validated on 23,400 accelerated ageing samples from four 110 kV bushings under four typical defect types.
The main contributions of this paper are as follows:
  • A physics-proxy-residual-guided cross-attention (PGCA) meta-learner replaces the fixed-weight summation of Traditional Stacking with physics-proxy-residual-guided cross-attention, dynamically allocating inter-modal weights based on physical consistency and suppressing predictions that violate physical laws.
  • A piecewise regularization strategy based on Arrhenius thermal ageing and Fick moisture-migration dual physics-proxy residuals is constructed, with λ increasing from 0.1 (normal) to 0.7 (severe) to strengthen constraints under severe conditions and guide predictions toward mechanistic trends.
  • A classification–precursor dual-task framework simultaneously detects precursor signals 15 min before state transitions, enhancing early degradation identification through shared-feature complementary supervision.
Relative to existing cross-attention ensemble designs, the contribution of this paper is not the attention mechanism itself but its physics-guided conditioning: the PGCA meta-learner modulates cross-attention with dual physics-proxy residuals under a segmental schedule and is coupled with a classification–precursor dual-task objective, which remains largely unexplored for bushing insulation assessment.

2. Materials and Methods

2.1. Condition-Assessment Indicator System

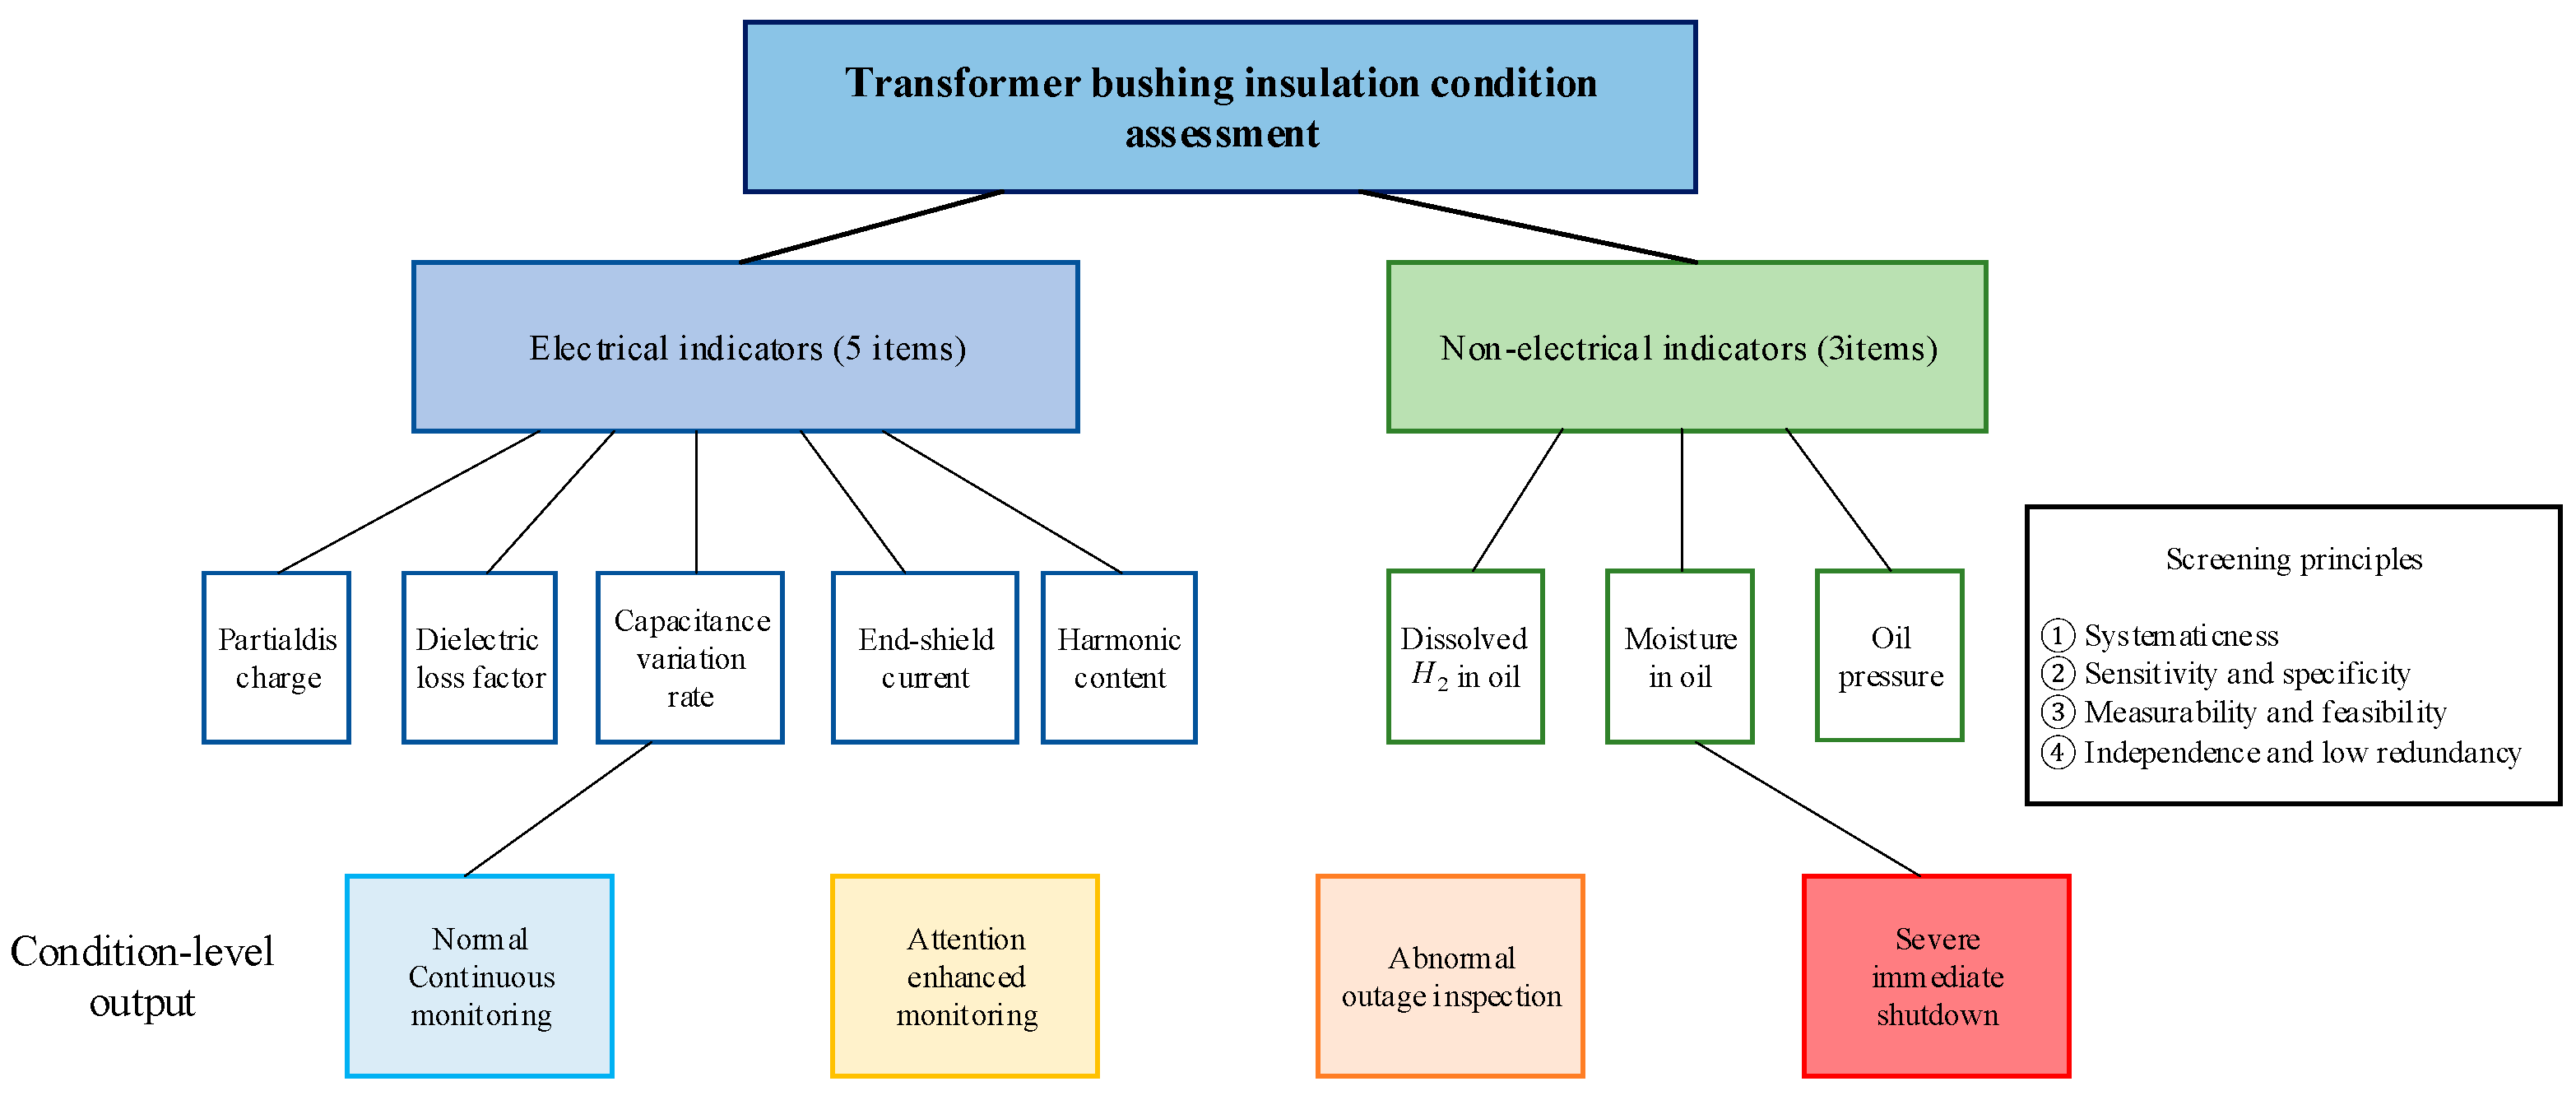
The indicator system is constructed based on systematicity, sensitivity, measurability, and independence principles, with reference to relevant standards. Twelve candidate indicators are preliminarily selected: partial discharge, dissipation factor, capacitance change rate, end-screen current, harmonic content, dissolved hydrogen, dissolved acetylene, moisture content, oil pressure, oil temperature, ambient temperature, and load rate.
A three-step screening method determines the final indicator set. First, Pearson correlation analysis removes dissolved acetylene (r = 0.89 with hydrogen) due to redundancy. Second, Fisher discriminant ratios are calculated across four condition levels on the training set only; indicators with ratios below 0.5 are removed (oil temperature, 0.31; ambient temperature, 0.22; and load rate, 0.28). Third, all remaining indicators are verified as online-measurable via the KLJC-28E monitoring device. Oil temperature is retained as an auxiliary variable for Arrhenius residual computation but not as a classifier input. Eight core indicators are ultimately determined, as listed in Table 1.

2.2. Condition-Level Classification

With reference to the grading approach in IEEE Std C57.104-2019 [34] and relevant national standards [35,36], and incorporating the data characteristics of accelerated ageing tests under four typical defects, the bushing insulation condition is classified into four levels: normal, attention, abnormal, and severe. The physical interpretation, threshold ranges, and corresponding maintenance strategies for each level are listed in Table 2.
The condition-level classification follows three principles: (1) the rule evaluation index S is computed as a weighted sum of eight normalized indicators using objective weights, used solely for label calibration and engineering interpretation rather than as a model output; (2) when any core parameter exceeds the severe threshold, the condition is directly classified as severe regardless of the S value, ensuring assessment reliability and conservatism; and (3) the parameter thresholds for each level are determined with reference to IEEE Std C57.104-2019, relevant national standards, and manufacturer specifications, balancing standardization with engineering practice.
The architecture of the insulation-condition-assessment indicator system for transformer bushings is shown in Figure 1.

2.3. Experimental Data and Preprocessing

2.3.1. Experimental Data Overview

The experiments were conducted in the high-voltage test hall of Nanjing Electric on four identical 110 kV oil-immersed bushings, each pre-loaded with one typical defect: (i) moisture ingress, by injecting 20 mL of water, baking at 65 ± 5 °C for 24 h, and then energizing for 9 h; (ii) conductor-rod surface defects, introduced with metal wires; (iii) porcelain inner-wall creepage, simulated with aluminum foil near the flange; and (iv) ground-shield loss, emulated by a pin structure mimicking virtual welding. A KLJC-28E multi-condition monitoring device recorded the electrical variables every 10 s and the non-electrical variables every 5 min; the latter were forward-filled onto the 10 s grid without future interpolation. The two-month campaign yielded 65 h of valid acquisition and 23,400 samples in total (Table 3). Each defect type was carried by a single bushing of the same type, so defect type and individual specimen are coupled; this study therefore verifies state recognition under the designed defect scenarios, while cross-device generalization awaits additional bushing samples.
The test specimens are oil–paper capacitor bushings rated for 110 kV class service, whose representative nameplate data—rated capacitance of Cx = 432 pF, dielectric loss of 0.31% (10 kV to 1.5 Um/√3), partial discharge ≤ 6 pC, lightning-impulse withstand of 550 kV, wet withstand voltage of 255 kV, and oil mass of 25 kg—were verified by routine tests according to IEC 60137:2017 [36] and GB/T 4109—2022 [37]; the bushings serve 110 kV class power transformers within the conventional engineering rating range of 20–63 MVA. Each defect series comprised 5–33 h of continuous staged energization (Table 3), during which the monitoring device recorded the full electrical and non-electrical response envelopes.
The four defect modes were selected against three criteria. First, field failure statistics: Moisture ingress, surface defects, and earth-screen faults are among the frequently reported causes of bushing failures in service, and moisture ingress, in particular, is widely reported as a leading cause of oil–paper bushing failures [1,9]. Second, modeling evidence: Guided by a literature review, preliminary COMSOL multiphysics (v6.3) simulations compared the relative bushing severity under candidate defect modes and thereby determined the defect and test types investigated here. Third, online monitorability: The evolving signatures of all four modes lie within the sensing envelope of the KLJC-28E suite. Accordingly, the eight indicators combine five electrical quantities with three oil-state quantities, while diagnostic means beyond online electrical and oil-state monitoring, such as frequency-response analysis and thermal imaging, fall outside the present continuous-assessment framework and are left for future extensions.
As shown in Table 3, moisture-ingress samples accounted for 50.8% (longest monitoring period) and ground-shield-loss samples for 7.7% (shortest). State distributions varied across defect types: moisture ingress had the highest normal proportion (42.0%), whereas ground-shield loss had the highest severe proportion (22.0%). Overall, normal, attention, abnormal, and severe states accounted for 38.8%, 27.9%, 20.0%, and 13.3%, respectively, indicating moderate class imbalance (max:min ≈ 2.9:1).

2.3.2. Data Preprocessing

Data preprocessing comprised outlier removal, normalization, and label calibration. First, boxplot thresholds (1.5 × IQR) from the training set identified 256 outliers (1.09%), leaving 23,144 valid samples. Second, min–max normalization mapped each parameter to [0, 1], with parameters estimated solely from the training set, as shown in Equation (1):
x i = x i x min x max x min
where x i is the original value of a given parameter for the i-th sample; x max and x min are the maximum and minimum values of that parameter, respectively; and x i is the normalized value.
Finally, each sample was labeled according to Section 2.2 criteria, using a double-confirmation rule: (1) the rule-based index S must fall within the corresponding interval, and (2) at least one core indicator must meet the threshold for that level. When inconsistent, the more severe level was assigned to maintain conservatism.
A differentiated sliding-window strategy was applied: electrical variables (L = 10, step = 5) and non-electrical variables (L = 60, step = 5). All sample counts reported in this paper (e.g., the 23,400 raw samples and the 23,144 valid samples after preprocessing) refer to raw sampling points; sliding-window augmentation is applied only during time-series base-learner training and does not change the sample counts used for evaluation.
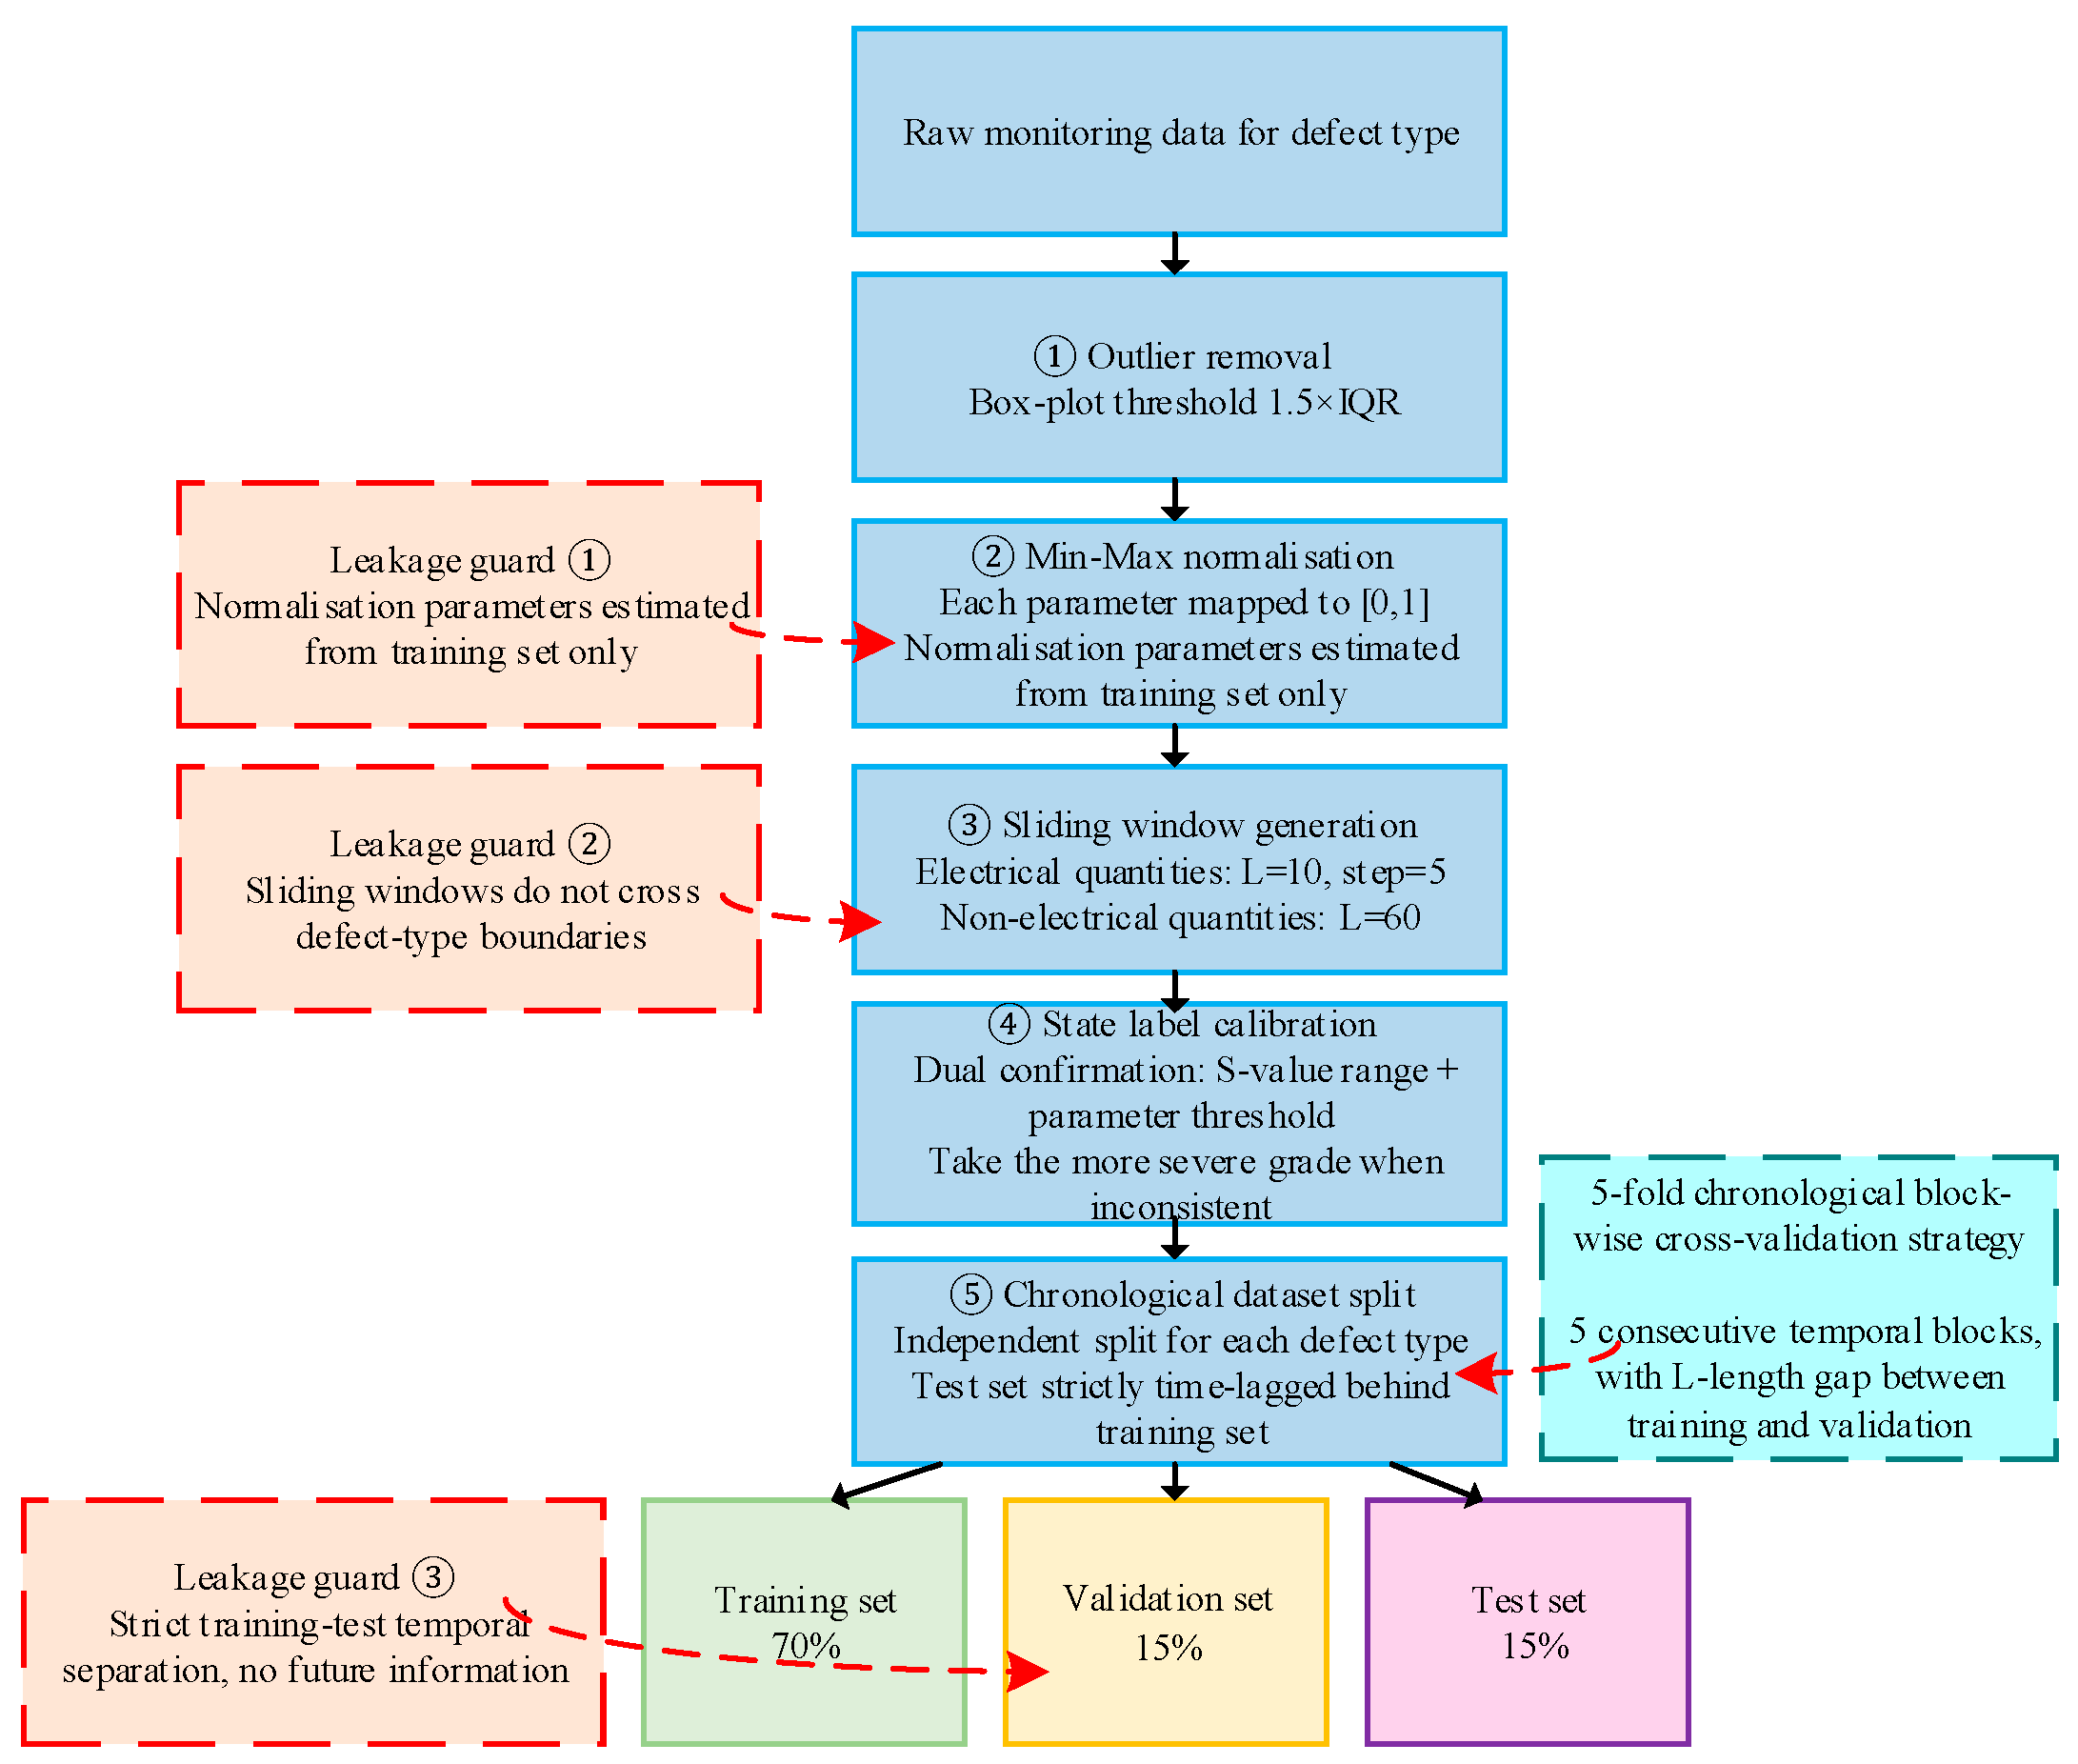
To prevent data leakage, windows were generated within their own defect-type series without cross-contamination, and training/test windows were strictly separated in time. All preprocessing parameters were determined only from the training set.

2.3.3. Class Imbalance Treatment

Class imbalance was handled using weighted cross-entropy loss combined with stratified sampling. Weights were set inversely proportional to class sample counts, as shown in Equation (2):
w j = N 4 N j , j = 0 , 1 , 2 , 3
where N is the total sample count, and N j denotes the sample count of the j-th level. The weights were computed from the training set only; due to stratified splitting, the training-set class proportions closely match those of the full dataset (Table 3), yielding w = [1.00, 1.39, 1.94, 2.92] and giving the severe-state weight 2.92× that of the normal state. Stratified sampling ensured consistent class proportions across five-fold cross-validation folds.

2.3.4. Objective Weighting by Coefficient of Variation

To avoid subjective bias, the coefficient-of-variation method was used to weight the eight indicators. Indicators with greater variability in the training set contain richer discriminative information and receive larger weights. The coefficient of variation is calculated using Equation (3):
C V j = σ j μ j , j = 1 , 2 , , 8
where σ j and μ j denote the standard deviation and mean of the j-th indicator in the training set, respectively.
The weight of the j-th indicator is then calculated using Equation (4):
w j = C V j k = 1 8 C V k
The coefficients of variation and weights computed from the training set are listed in Table 4. The behavior of oil pressure during the training campaign explains its minimal objective weight: over the five-day moisture-ingress series, the channel drifted slowly upward (≈+3.3 kPa between campaign halves; envelope ≈ 10.5 kPa), with no minute-scale transients, consistent with its role as a slow-horizon sealing and gas-accumulation indicator rather than a fast fault sentinel; under the CV criterion, such limited within-campaign discriminative variation naturally translates into a low weight.

2.4. PGAE-NN Condition-Assessment Method

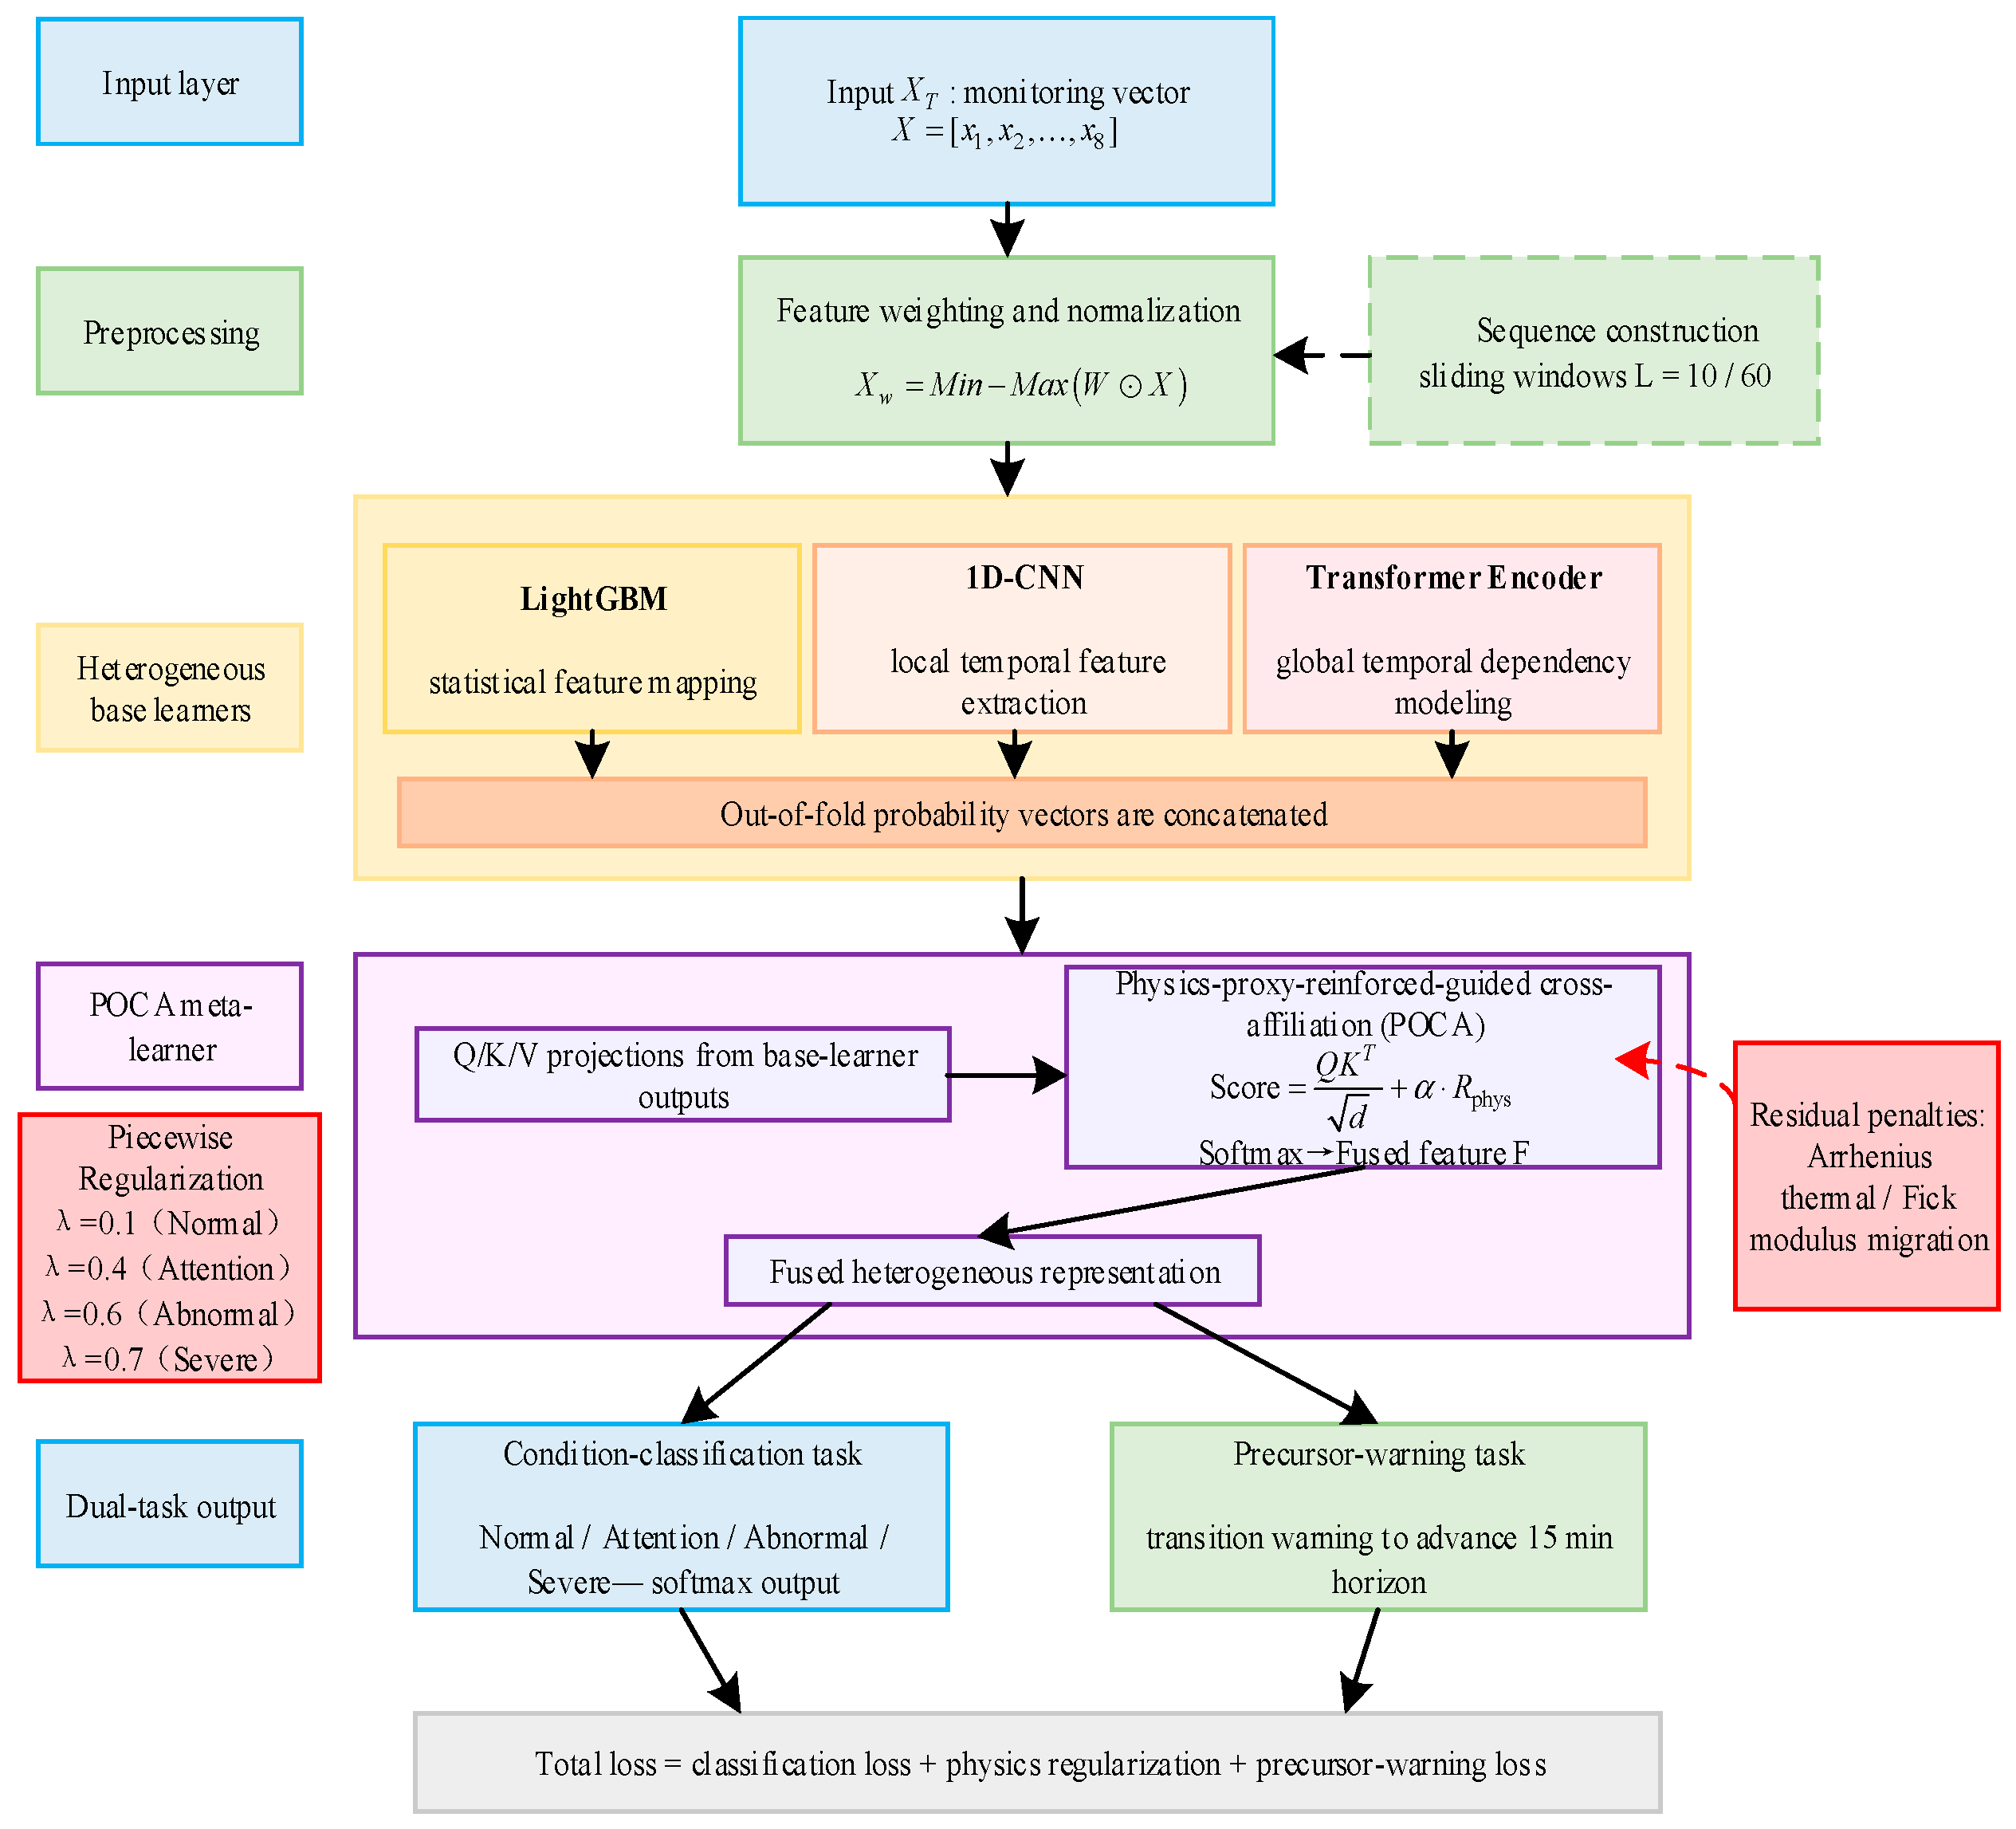
To address the insufficient mechanistic constraints and insufficient heterogeneous-feature complementarity in existing bushing insulation assessment methods, a physics-proxy-residual-regularized cross-attention ensemble neural network (PGAE-NN) is proposed. The method integrates heterogeneous base learners with a proxy-residual-guided attention mechanism, and has three core innovations: (1) a physics-proxy-residual-guided cross-attention (PGCA) Stacking meta-learner that replaces fixed-weight summation with cross-attention fusion, incorporating thermal-ageing and moisture-migration proxy-residual penalties into the attention scores; (2) dual physics-proxy-residual piecewise regularization that constructs equivalent proxy residuals from the Arrhenius thermal-ageing and Fick-inspired moisture-migration mechanisms, with state-adaptive piecewise regularization strength; and (3) a classification–precursor dual-task joint optimization that simultaneously outputs state classification and transition early-warning. The overall architecture (Figure 2) comprises four layers: preprocessing, heterogeneous base learners, PGCA meta-learner, and dual-task output.

2.4.1. Preprocessing Layer

The preprocessing layer performs feature weighting and normalization. The composite weight vector, W = [w1, w2, …, w8], determined by the CV method (Section 2.3.4), is applied to the 8-dimensional monitoring parameters, yielding the weighted feature vector, as given in Equation (5):
X w = W X = [ w 1 x 1 , w 2 x 2 , , w 8 x 8 ]
where ⊙ denotes element-wise multiplication, and X is the normalized 8-D input. For time-series base learners, a sliding window extracts a temporal feature matrix, X t L × 8 , from the weighted sequence.

2.4.2. Heterogeneous Base-Learner Layer

Only three principle-complementary base learners extract features from different perspectives: LightGBM captures nonlinear feature interactions and window-level statistical patterns; 1D-CNN extracts local pulses and short-range transients via multi-scale convolution; and the Transformer Encoder captures global temporal dependencies via self-attention. Together they span statistical, local-temporal, and global-temporal levels. Each base learner outputs a 4-D state probability vector; these three vectors are stacked row-wise to form the heterogeneous feature matrix, Z ∈ 3×4, which is then projected via a learned linear layer into a unified d-dimensional space (d = 32) for cross-attention computation. To prevent information leakage in Stacking, the meta-learner is trained on out-of-fold outputs produced by time-block cross-validation within the training set; validation and test outputs are generated by base learners fitted on the training set only.
  • LightGBM Base Learner.
LightGBM classifies a 40-D augmented vector (8-D weighted spatial features concatenated with 32-D temporal statistics) using histogram-based decision trees with leaf-wise growth [38]. Key parameters: Learning rate of 0.05, max depth of 6, max leaves of 64, min child samples of 20, and 300 iterations with 50-round early stopping. Output: 4-D state probability vector.
  • 1D-CNN Base Learner.
The 1D-CNN takes the temporal feature matrix as input and comprises three convolutional layers (kernel sizes of 3, 5, and 7; channels of 32, 64, and 128), each followed by batch normalization and ReLU activation, with global average pooling and a fully connected layer producing the 4-D probability vector [39].
These kernel sizes correspond to physical windows of 30, 50, and 70 s at the 10 s sampling interval, chosen so that the three branches respectively capture the sample-to-sample fluctuation of discharge activity, the smoothing horizon of tail-current fluctuations, and the short-term drift of harmonic content—the fast dynamics that characterize the electrical indicators.
  • Transformer Encoder Base Learner.
The Transformer Encoder takes the temporal feature matrix, X t L × 8 , as input. It first maps the 8-dimensional features into a d model = 64 dimensional embedding space via linear projection, adds learnable positional encoding, and processes the result through a 2-layer Transformer Encoder with 4 attention heads, a feed-forward dimension of 256, and a dropout rate of 0.1. The output is then passed through global average pooling and a fully connected layer to produce a 4-dimensional condition probability vector [40], h TE 4 .
Given the modest labeled-sample scale of the corpus, this capacity-controlled configuration is a deliberate regularization choice: long-range dependencies beyond the window horizons are delegated to the multi-scale dual-encoder design rather than to encoder depth. The sequence lengths—L = 10 (electrical, 100 s) and L = 60 (non-electrical, statistical windows)—likewise follow the physical timescale separation between fast electrical quantities and slow oil-state evolution.

2.4.3. PGCA Meta-Learner Layer

Traditional Stacking ensembles [41] adopt fixed-weight weighted summation to fuse base-learner outputs, failing to dynamically allocate credibility to each base learner according to the current insulation state. To address this, a physics-proxy-residual-guided cross-attention (PGCA) meta-learner is proposed, which treats the outputs of the three heterogeneous base learners as three modalities, dynamically computes inter-modal correlations via cross-attention, and introduces thermal-ageing and moisture-migration proxy-residual penalty biases into the attention scores.
First, the output of each base learner is projected into a unified d-dimensional space (d = 32), as shown in Equation (6):
Q k = h k W k Q , K k = h k W k K , V k = h k W k V , k = 1 , 2 , 3
where W k Q , W k K , and W k V are the query, key, and value projection matrices of the k-th base learner, respectively. The inter-modal cross-attention scores are then computed, and a dual-physics-residual penalty term is introduced into the scores, as shown in Equation (7):
A i j = Q i K j T d β R phys , j
where A i j is the attention score from the i-th base learner to the j-th base learner, d is the scaling factor, λ = 0.1 is the proxy-residual penalty coefficient, and R phys , j is the physics-proxy residual of the j-th base learner. The residual is computed by substituting that learner’s output probability vector, together with the corresponding measurable physical variables (oil temperature, moisture content, and elapsed ageing time), into Equation (12); a larger residual indicates a greater deviation from physical ageing trends, and the attention score is reduced accordingly. After Softmax normalization, the meta-learner output is given by Equation (8):
h meta = Softmax ( A i j ) V j
The PGCA mechanism adaptively regulates inter-learner information flow based on physical consistency: when a base learner’s prediction yields a large proxy residual, its attention score is suppressed, and the meta-learner shifts reliance toward learners with smaller residuals, achieving physics-residual-guided fusion across heterogeneous modalities.

2.4.4. Dual Physics-Proxy-Residual Segmental Regularization

To improve consistency between model outputs and observable ageing trends, a dual physics-proxy-residual regularization is constructed from an Arrhenius thermal-ageing term and a Fick-inspired moisture-migration term [42]. This regularization does not constitute a rigorous physical solution of the internal temperature or moisture fields; rather, it extracts observable mechanistic trends—irreversible cumulative ageing and directional moisture migration—to form a mechanism-consistency penalty.
The Arrhenius equation (Equation (9)) describes the thermal-ageing rate of insulating paper. The thermal-ageing residual (Equation (10)) penalizes non-physical “reversals” of degradation based on two properties: (1) ageing is an irreversible, monotonically cumulative process, and (2) the ageing rate exhibits a fast-then-slow saturation trend. Under the approximately isothermal conditions of the accelerated ageing experiment, this residual serves as a cumulative-ageing-trend proxy.
k aging = A exp E a R T
R Arr = p ^ risk σ ( k aging t )
where A is the pre-exponential factor; E a is the activation energy (typically about 110 kJ/mol for oil–paper insulation); R is the gas constant; T is the absolute temperature converted from the synchronously recorded oil temperature; p ^ risk is the ageing risk obtained by probability-weighting the model output; σ is the sigmoid function; t is the relative ageing time; and σ ( k aging t ) represents the cumulative-ageing-trend proxy under isothermal conditions.
The Fick diffusion equation describes the directionality and timescale of moisture migration. As no internal spatial moisture sensors were deployed, the spatial gradient term cannot be computed directly; instead, the time-derivative of the oil-moisture series is used to construct a moisture-migration proxy intensity (Equation (11)). When the model predicts worsening degradation but the moisture trend is declining, this residual imposes a penalty, enforcing directional consistency.
R Fick = p ^ risk σ η f | C t C t L | L Δ t
The combined dual-physics residual is a normalized weighted sum (Equation (12)), with weights 0.6 and 0.4 for thermal ageing and moisture migration, respectively, selected via validation-set grid search over {0.5, 0.6, 0.7}.
R phys = 0.6 R Arr + 0.4 R Fick
where C t is the moisture concentration in oil at time t, Δ t is the uniform sampling interval, and η f is the scaling coefficient.
The segmental regularization strategy allows data-driven dominance under normal conditions ( λ = 0.1), while increasing the proxy-residual weight under severe conditions ( λ = 0.7). This design reflects the fact that, as degradation deepens, the cumulative effects of thermal ageing and moisture migration impose stronger constraints on state evolution. During training, λ is determined per batch by the mean predicted risk (Table 5); the segmentation decision has its gradient detached to avoid discontinuous gradients at thresholds, while the residual itself back-propagates normally.
The four strength levels (0.1 → 0.3 → 0.5 → 0.7) trace a warm-up–balance–consolidation trajectory: in the early phase, the physics-proxy terms steer the representation toward physically admissible regions; in the middle phase, data-driven fitting and physical consistency are balanced; and in the final phase, the increased weight consolidates physical admissibility as the data-driven loss converges. The level boundaries coincide with the segmental thresholds of Table 5, and the four levels keep the proxy-residual norms commensurate with the classification loss.
The framework is accordingly physics-regularized rather than physics-informed in the strict PDE-embedding sense: the Arrhenius and Fick terms do not enter the network as governing-equation residuals of the solution; instead, they act as auxiliary proxy targets that shape the representation space, as discussed in Section 4.

2.4.5. Classification–Precursor Dual-Task Joint Optimization

A precursor-signal detection task is introduced alongside the state-classification task [43]: samples within a 15 min window before a state transition are labeled as precursor (label 1), and the rest as non-precursor (label 0). The 15 min window corresponds to approximately 90 samples, matching typical operational response times. Precursor labels are constructed offline using only pre-transition samples; at inference, the model uses only current and historical observations. Both tasks share the feature-extraction and fusion layers (preprocessing, base learners, and PGCA meta-learner), with only the output heads being independent.
The classification task uses the weighted cross-entropy loss (Equation (13), Section 2.3.3). The precursor task uses binary cross-entropy (Equation (14)). The total loss is as follows (Equation (15)):
L cls = j = 0 3 w j y j log ( p ^ j )
L precursor = y p log ( y ^ p ) + ( 1 y p ) log ( 1 y ^ p )
L total = L cls + λ ( p ^ ) L phys + 0.15 L precursor
where w j is the weight of the j-th class, y j is the one-hot encoded true label, p ^ j is the predicted probability, y p is the true precursor label, y ^ p is the predicted precursor probability, L cls is the state-classification loss, λ ( p ^ ) is the segmental regularization strength, L phys is the physics-proxy residual loss, and L precursor is the precursor-detection loss. the precursor-task weight of 0.15 was selected via grid search over {0.05, 0.10, 0.15, 0.20, 0.25}, using the harmonic mean of classification accuracy and precursor F1 as the criterion. The precursor task provides additional transition-supervision signals, constraining the shared feature layers to learn representations sensitive to early degradation signs. The two tasks are complementary: classification focuses on the current absolute state, while precursor detection captures transition trends.

2.4.6. Comprehensive Risk Index and State Grading

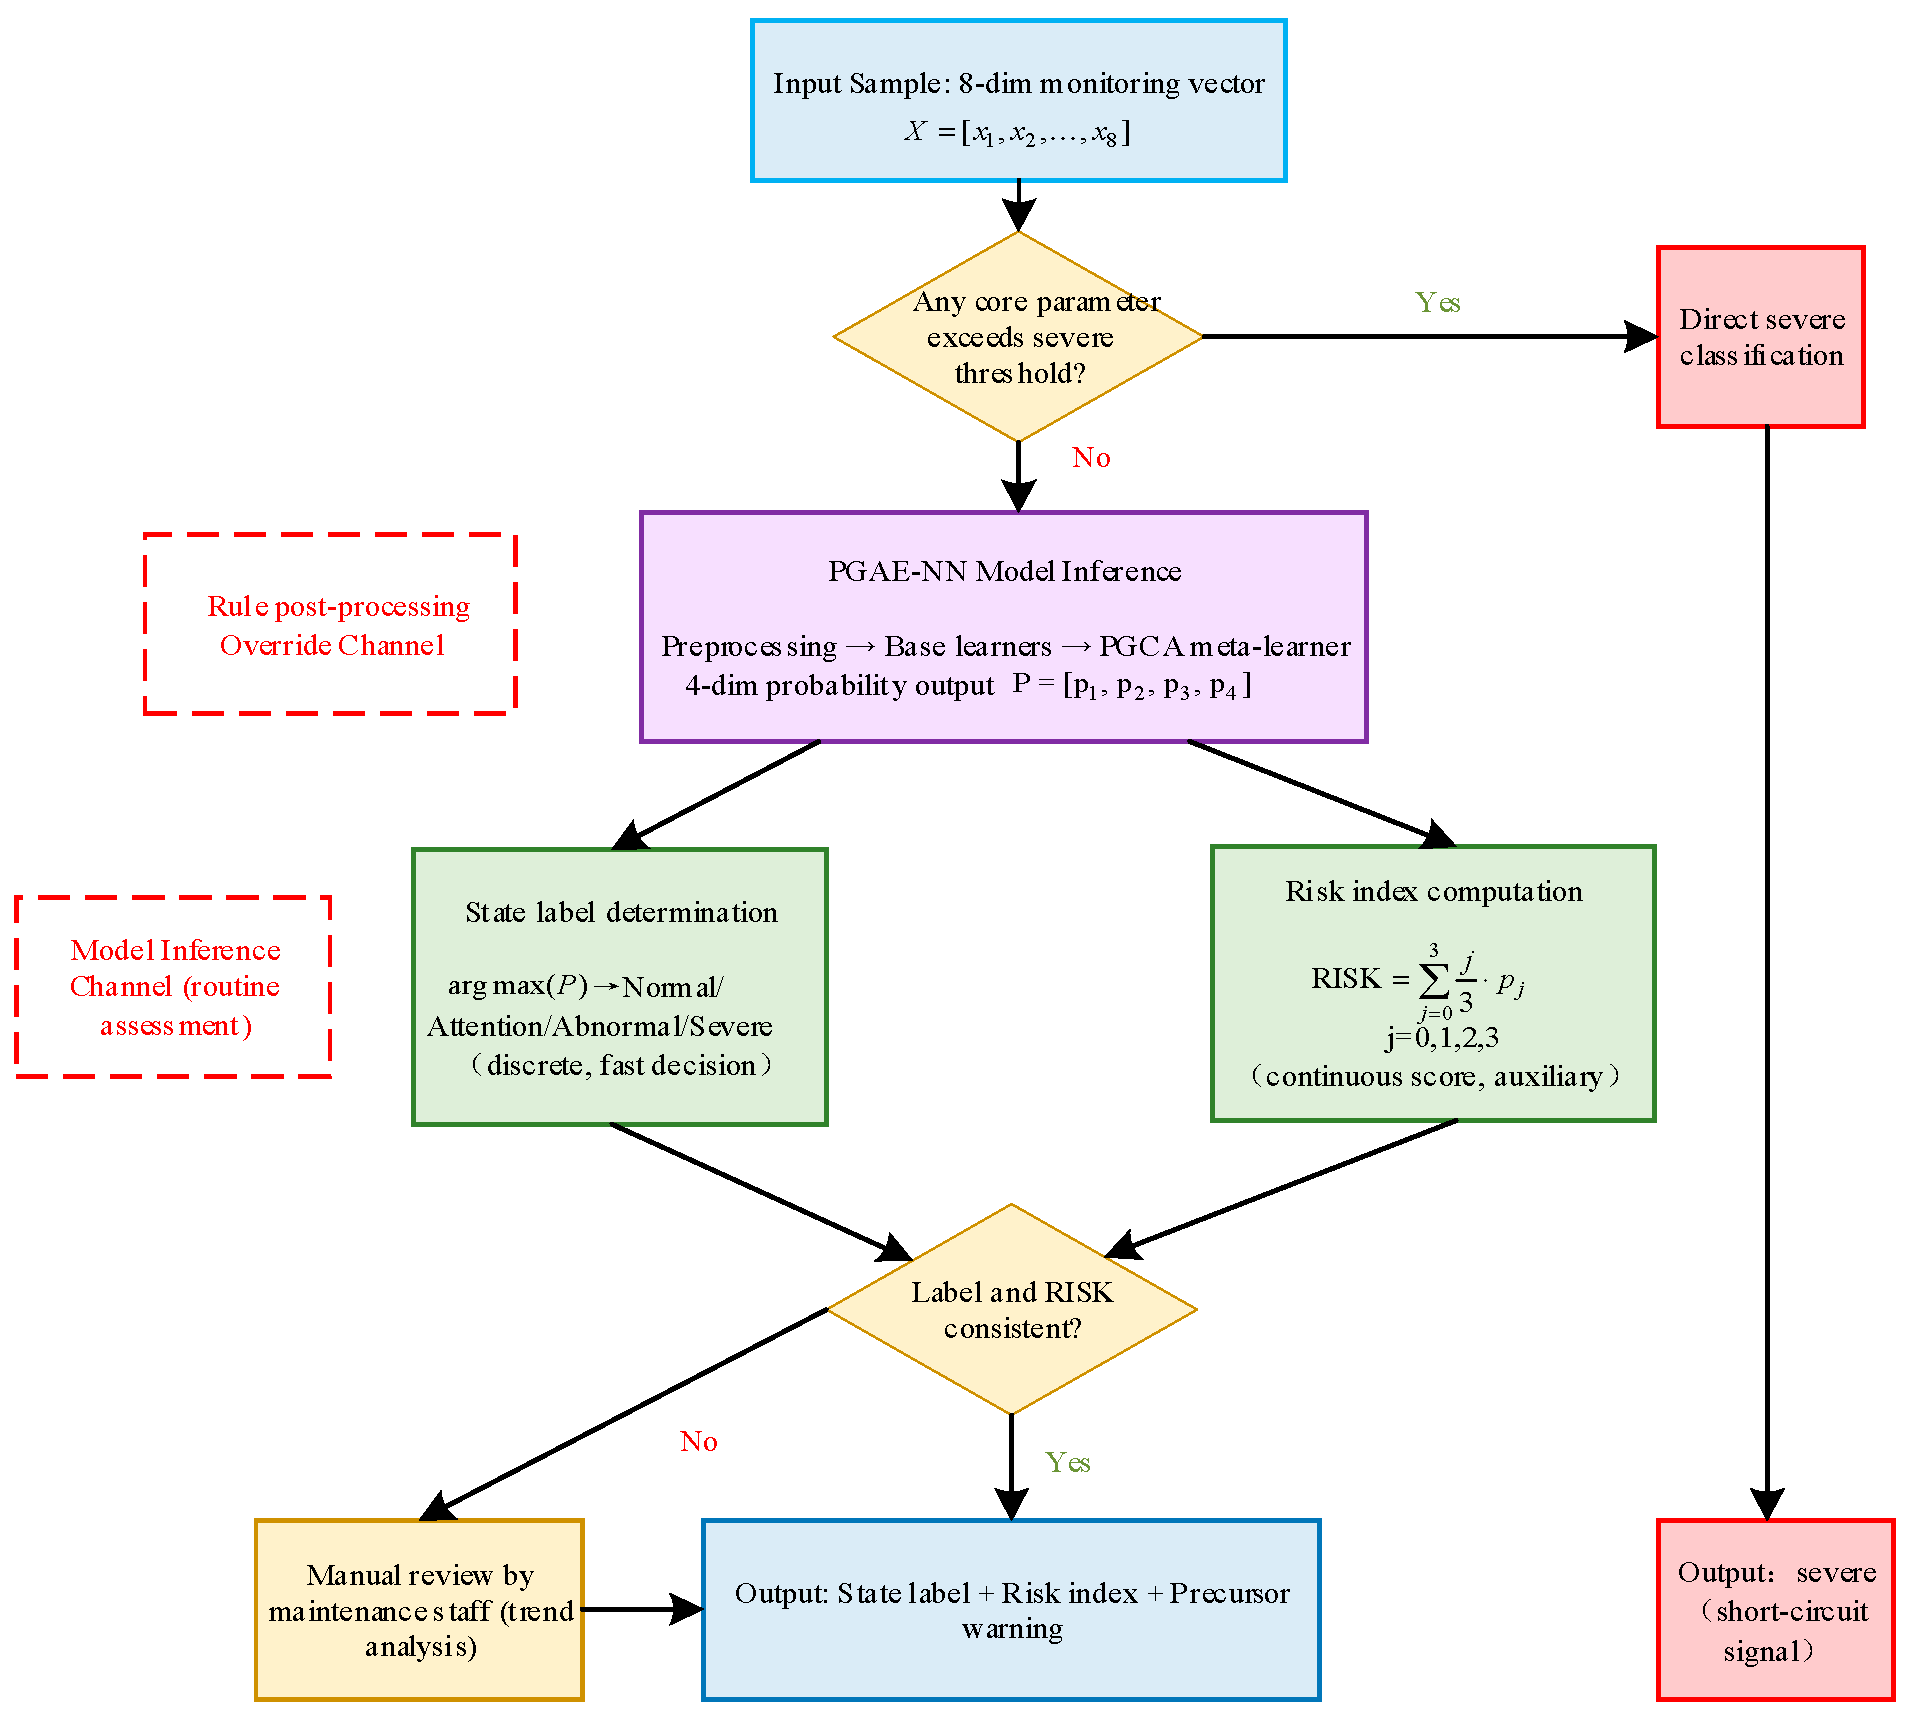
The evaluation workflow of PGAE-NN is shown in Figure 3.
At inference, if any core indicator exceeds the severe threshold, the sample is directly classified as severe without model inference; otherwise, the 8-D monitoring vector is fed into PGAE-NN, and the meta-learner outputs a 4-D probability distribution. The final state is determined by argmax. This severe-threshold hard rule is applied identically to all baseline methods in Table 6 to ensure a fair comparison; it reflects engineering safety practice and does not favor PGAE-NN specifically.
To provide a continuous risk score, the model risk index, R model , is computed (Equation (16)):
R model = j = 0 3 j 3 p ^ j
where j/3 are equal-interval state weights (0, 1/3, 2/3, and 1), consistent with the four equal-width threshold intervals in Table 2. The discrete label arg max p ^ facilitates rapid operational decisions, while the continuous R model reflects intra-level risk differences for trend analysis and maintenance prioritization. R model is computed post hoc from inference probabilities and does not participate in training. When arg max p ^ and R model disagree (e.g., arg max p ^ = attention but R model near the abnormal boundary), R model serves as supplementary reference. Together with the precursor signal, which captures short-term transition trends, they jointly support maintenance decisions.

3. Results

3.1. Experimental Setup

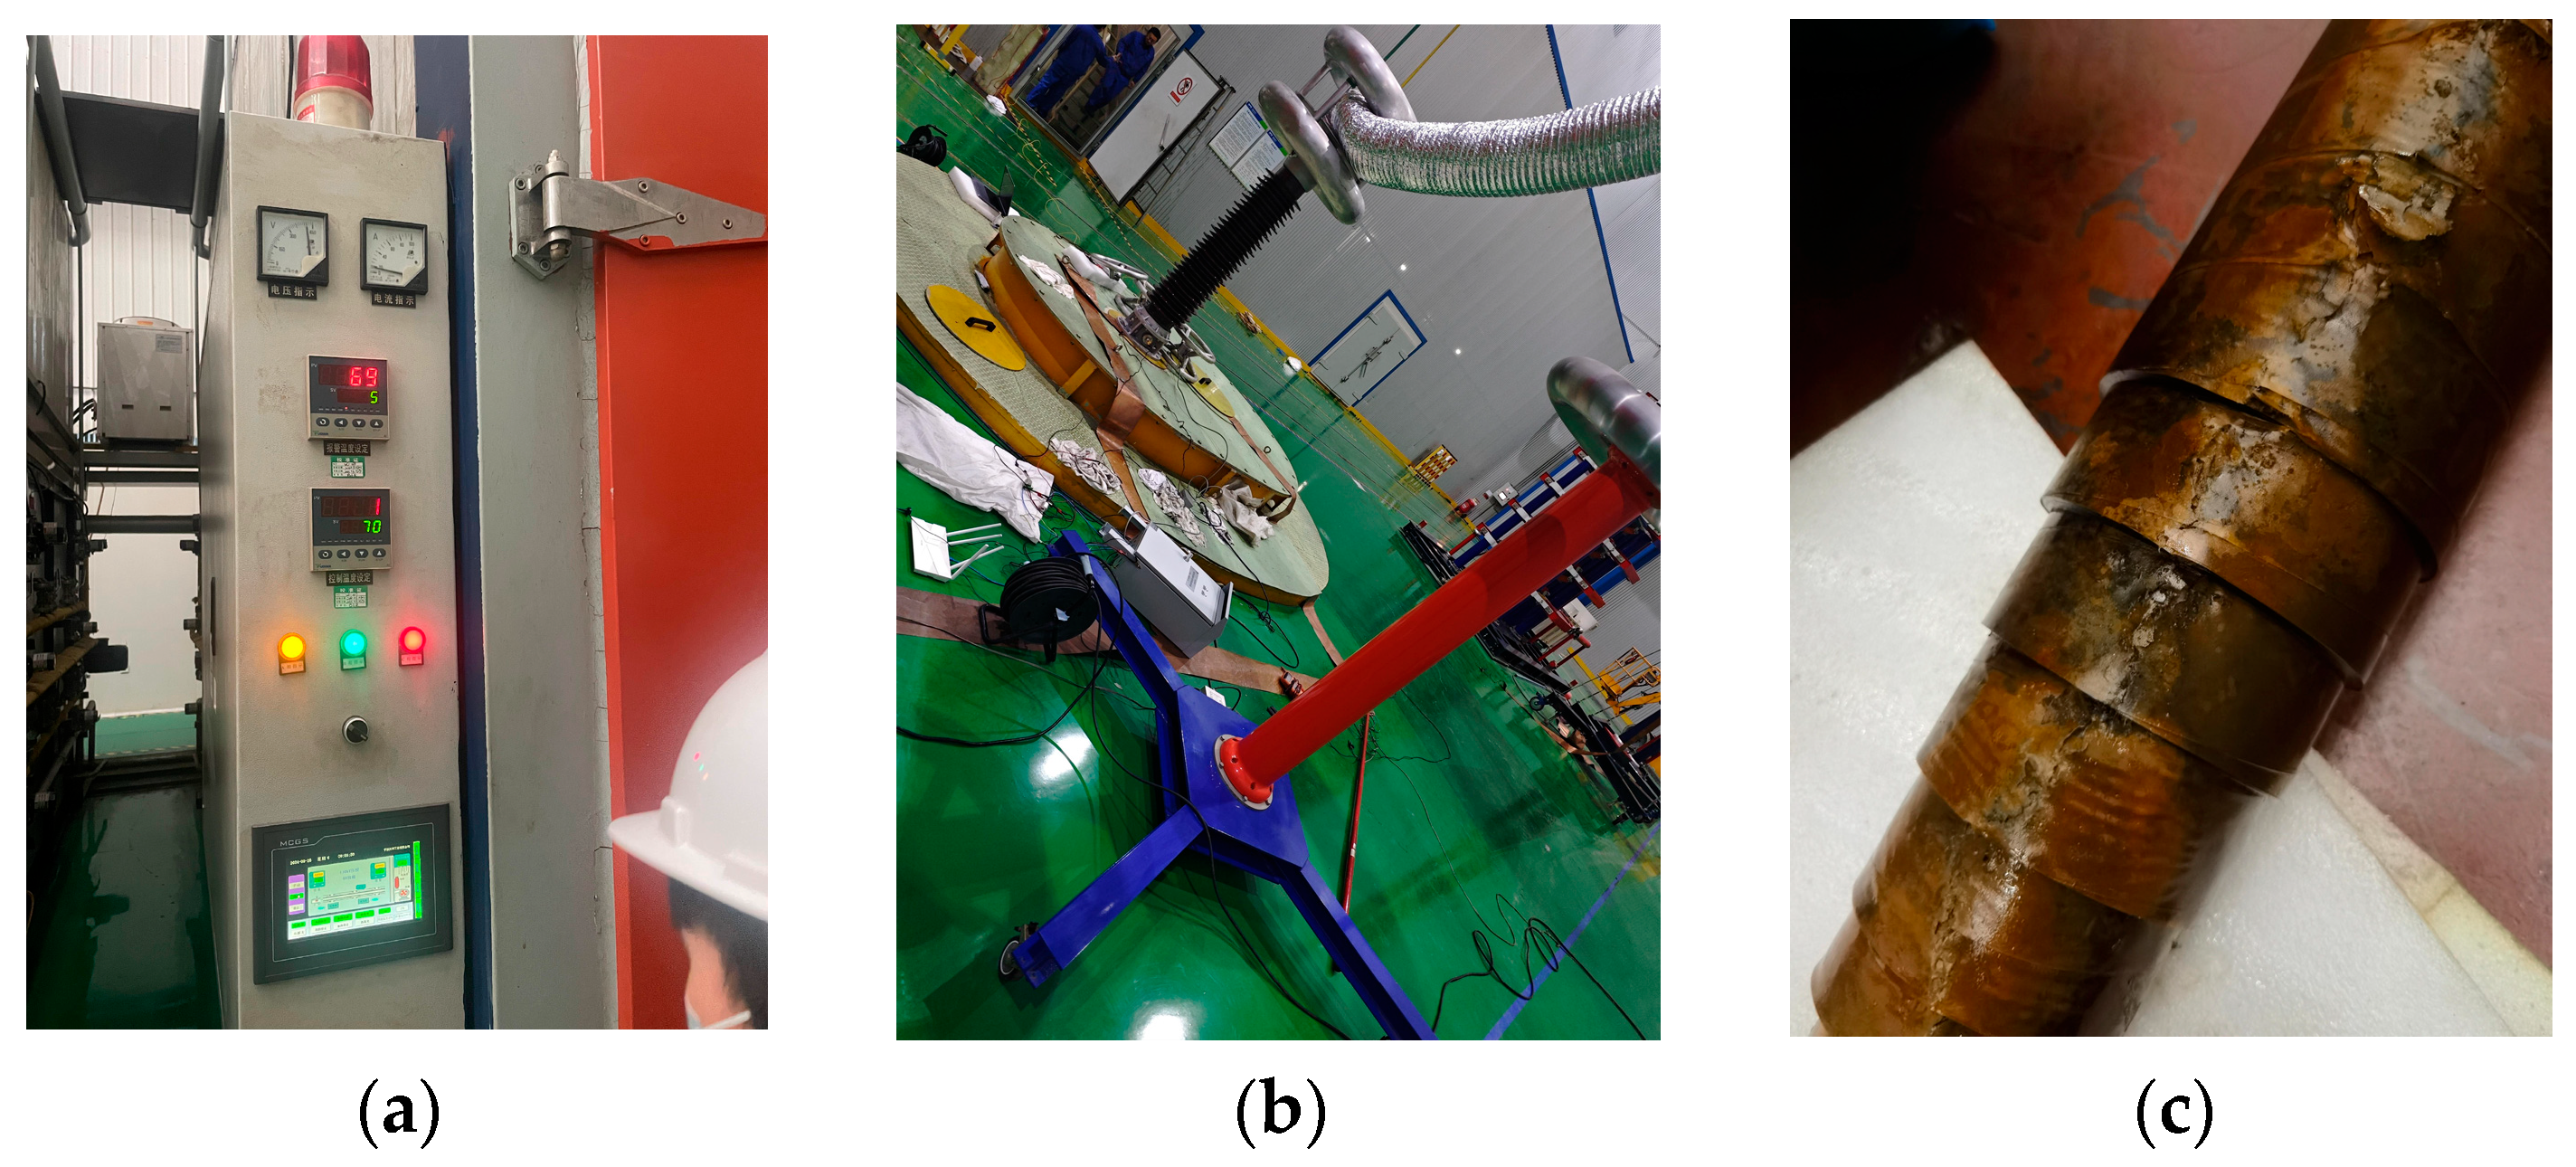
The experimental data were collected from 110 kV oil-immersed transformer bushing defect tests conducted at the Nanjing Electrical High-Voltage Test Hall. The test campaign (Figure 4) comprised three stages: (a) accelerated ageing, (b) on-site testing with online monitoring, and (c) disassembly inspection. A total of 23,400 raw samples were acquired, of which 23,144 valid samples were retained after preprocessing.
To prevent data leakage from sliding-window overlap, the dataset was split strictly by temporal order for each defect type: the first 70% of the time series as the training set (16,201 samples), the middle 15% as the validation set (3471 samples), and the final 15% as the test set (3472 samples). This ensures that all test samples are temporally downstream of the training data, eliminating evaluation bias from future information leakage.
Model training employed a per-model optimization strategy: LightGBM used its built-in gradient-boosting framework (learning rate, 0.05); the 1D-CNN and Transformer Encoder used Adam [44] (lr = 0.001, β1 = 0.9, and β2 = 0.999), batch size of 256, 100 epochs, with 15-round early stopping. Five-fold cross-validation was used solely for stability analysis, employing a time-block splitting scheme: each defect type’s temporal sequence was divided into five contiguous blocks with stratified state-level constraints, and a buffer of length, L, was inserted between training and validation folds to prevent sliding windows from crossing fold boundaries. The data-processing and leakage-prevention workflow is illustrated in Figure 5.

3.2. Comparative Experiments

Five baseline methods were selected for comparison: (1) PSO-SVM; (2) Random Forest; (3) LightGBM (single model, to verify the necessity of heterogeneous ensemble); (4) conventional Stacking with the same base-learner pool (LightGBM + 1D-CNN + Transformer Encoder) but fixed-weight summation fusion and no physical constraint to validate the PGCA mechanism; and (5) Physics-Regularized NN, a homogeneous MLP with a single global Arrhenius constraint (λ = 0.3) and no precursor task to verify the advantages of the heterogeneous architecture and dual-physics segmental regularization. To ensure fairness, all ensemble methods (3, 4, and PGAE-NN) share the same base-learner pool and training/test split, differing only in meta-learner fusion and physical-constraint design. Precision, recall, and F1 in Table 6, Table 7 and Table 8 are macro-averages over the four condition levels, whereas the overall metrics in Table 9 are weighted averages. Classification performance on the test set (3472 samples) is given in Table 6.
As shown in Table 6, PGAE-NN achieves the best performance across all metrics. Three key observations are drawn:
  • Ensemble strategy. Conventional Stacking reaches 93.45% accuracy, exceeding single LightGBM by 1.58 pp, confirming that heterogeneous base-learner fusion captures more comprehensive spatio-temporal degradation features and compensates for single-model blind spots.
  • Physical-constraint mechanism. A notable paradox emerges: the Physics-Regularized NN (Method 5, 92.28% accuracy; 90.02% precision) underperforms unconstrained Stacking (93.45%; 92.31%) in accuracy and precision, yet achieves higher recall (93.15% vs. 92.88%). This “high-recall, low-precision” pattern reveals a typical pitfall of rigid physical constraints—a single global Arrhenius penalty on a homogeneous network over-sensitizes the model to abnormal/severe states, misclassifying many normal samples and producing a “over-correction” effect. In contrast, PGAE-NN disperses fitting risk through heterogeneous learners, uses PGCA to dynamically suppress modalities with large proxy residuals, and adapts constraint strength via segmental regularization, achieving simultaneous improvements in precision (96.26%) and recall (96.01%). This demonstrates that the physical prior is effectively transformed into actionable knowledge—accurately capturing anomalies while avoiding false alarms on healthy samples.
  • Computational efficiency. PGAE-NN achieves a single-sample inference time of 64 ms—well below the 10 s monitoring interval—and an AUC of 0.9835, confirming stable ranking across multiple decision thresholds and practical deployment feasibility.

3.3. Cross-Validation Analysis

Five-fold stratified cross-validation was employed to assess model stability and generalization. The results are given in Table 7.
PGAE-NN achieves a mean accuracy of 96.36% (std 0.54%) and a mean F1 of 0.9586 (std 0.0059) across the five folds, with per-fold accuracy ranging from 95.88% to 96.98% (range = 1.10 pp). The small variance indicates that the model is insensitive to data partitioning and exhibits robust generalization stability.

3.4. Ablation Study

To verify the contribution of each innovative component, four ablation configurations were designed: (1) w/o PGCA—replacing cross-attention with fixed-weight summation; (2) w/o dual-physics segmental regularization—using a single global Arrhenius constraint (λ = 0.3); (3) w/o dual-task—retaining only the classification task; and (4) w/o all three—degrading to a controlled Stacking baseline. All configurations use the same train/test split as in Table 6. Results are given in Table 8.
Removing PGCA causes the largest accuracy drop (−1.82 pp), confirming that physics-guided cross-attention is the most impactful component and that dynamic, residual-aware fusion across heterogeneous modalities is more effective than fixed-weight summation. Removing the dual-physics segmental regularization (−1.46 pp) demonstrates the significant contribution of the Arrhenius + Fick joint constraint and segmental λ strategy. Removing the dual-task optimization (−1.11 pp) not only degrades classification accuracy but also eliminates the precursor-warning capability, indicating that multi-task joint optimization improves classification performance through regularization effects, in addition to providing transition early warning. Removing all three components degrades the model to Traditional Stacking (93.45%, −2.69 pp), confirming the necessity of joint optimization.
Notably, the sum of individual accuracy drops (4.39 pp) substantially exceeds the total gain over Traditional Stacking (2.69 pp), indicating strong coupling among the three components across the feature–physics–task dimensions. Each component reinforces the others—PGCA relies on physically consistent base-learner outputs, the dual-physics regularization benefits from attention-weighted fusion, and the dual-task provides complementary gradients that stabilize the shared feature layers—demonstrating that the joint design achieves synergistic gains beyond simple additive contribution.

3.5. Per-State-Level Recognition Performance

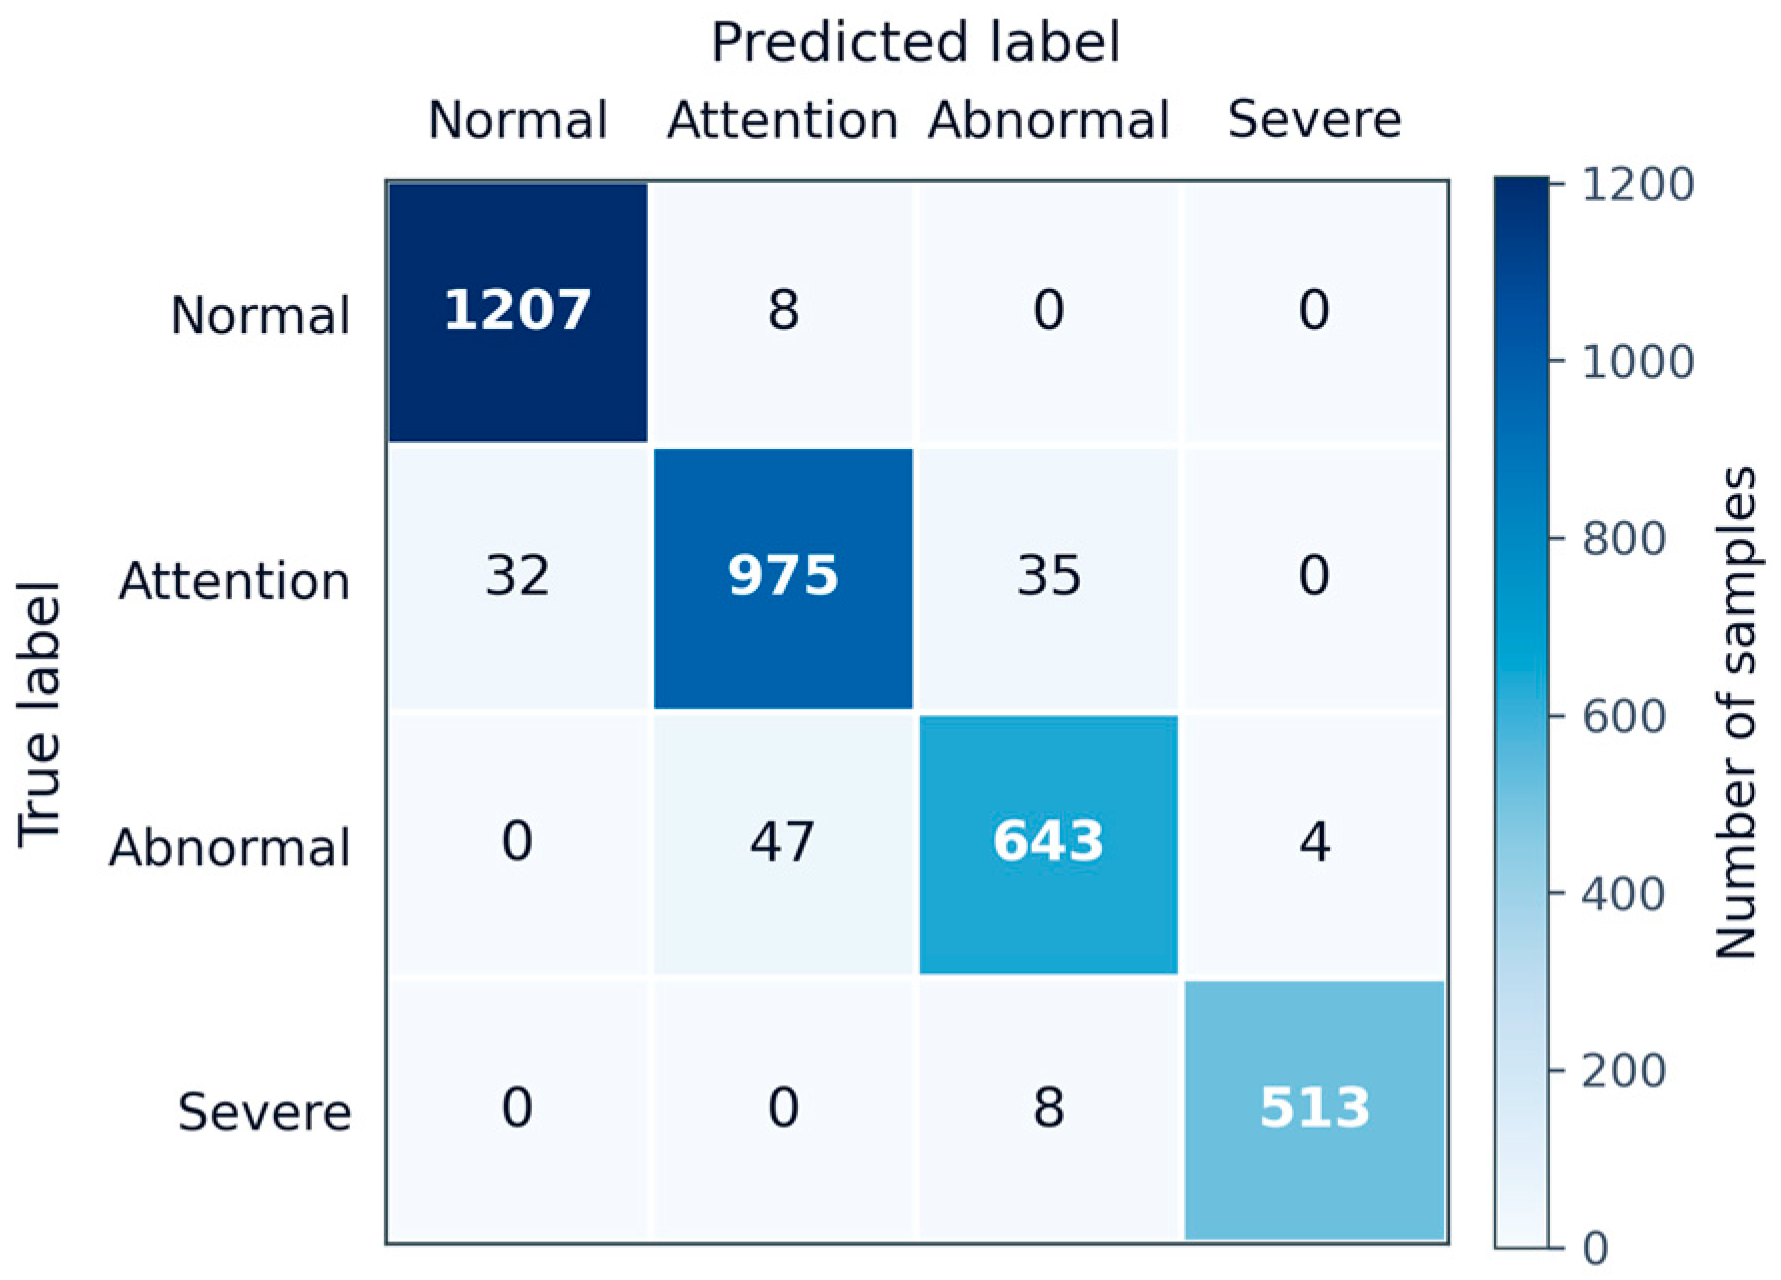
Figure 6 presents the confusion matrix on the test set. Misclassifications are predominantly bidirectional confusions between attention and abnormal (35 and 47 cases, totaling 82 or 61.2% of all errors), constituting the main performance bottleneck. No cross-level errors occur between normal and severe, confirming high reliability at both extremes of the degradation spectrum.
Per-level metrics are detailed in Table 9. Both terminal states exhibit strong recognition: severe achieves the highest F1 (0.9884; precision, 99.23%; recall, 98.46%), as deep-degradation features—large-amplitude shifts in moisture, hydrogen, and partial discharge—provide the most discriminative separation; normal follows closely with F1 = 0.9837 (precision, 97.42%; recall, 99.34%), reflecting the stable, low-variance feature baseline of healthy insulation. The intermediate states yield lower F1 values (attention, 0.9411; abnormal, 0.9319), owing to the inherently ambiguous boundary between these two transition stages, where gradual feature shifts produce classification uncertainty. The slight recall gap between severe (98.46%) and normal (99.34%) reflects feature-space overlap at the early-severe/late-abnormal boundary—a physically expected transition ambiguity. Overall, all F1-scores range from 0.9319 to 0.9884, with no pronounced performance bottlenecks, confirming balanced and reliable performance across all degradation levels.

3.6. Precursor Warning Performance

The precursor-detection task evaluates the model’s ability to provide early warning of state transitions. Samples within a 15 min window preceding a state-level transition are labeled as positive (precursor signal; ≈90 samples at 10 s electrical-quantity sampling), and the remainder as negative. Across the full labeled corpus, 19 condition-level transition events occur. Because the test set comprises only the final 15% of each defect-type time series, by which point most degradation has already stabilized, only a subset of transitions falls within the test window, yielding 298 precursor samples. The evaluation is therefore conducted at the sample level; event-level aggregation is not adopted, as it would require an additional rule for grouping precursor windows by transition event, to which the resulting statistics would be sensitive. At this sample size, the achieved recall of 0.938 carries a 95% Wilson confidence interval of [0.905, 0.960], and the achieved precision of 0.908 carries an interval of [0.870, 0.936].
The precursor-detection module achieves precision of 90.82%, recall of 93.83%, and F1 of 0.923. Compared with the single-parameter-threshold warning method (F1 = 0.821), the F1 improvement of 0.102 confirms the effectiveness of the dual-task joint optimization framework for transition early warning. Notably, recall (93.83%) exceeds precision (90.82%), reflecting a conservative “better false alarm than missed alarm” strategy that is advantageous for equipment safety. A representative case from the moisture-ingress test illustrates this: the model issued a precursor warning during the stage where tan δ rose from 0.45% to 0.62%—still within the attention interval—approximately 15 min before the actual upgrade to abnormal, providing valuable lead time for maintenance response.

3.7. Effectiveness of Physical Constraint

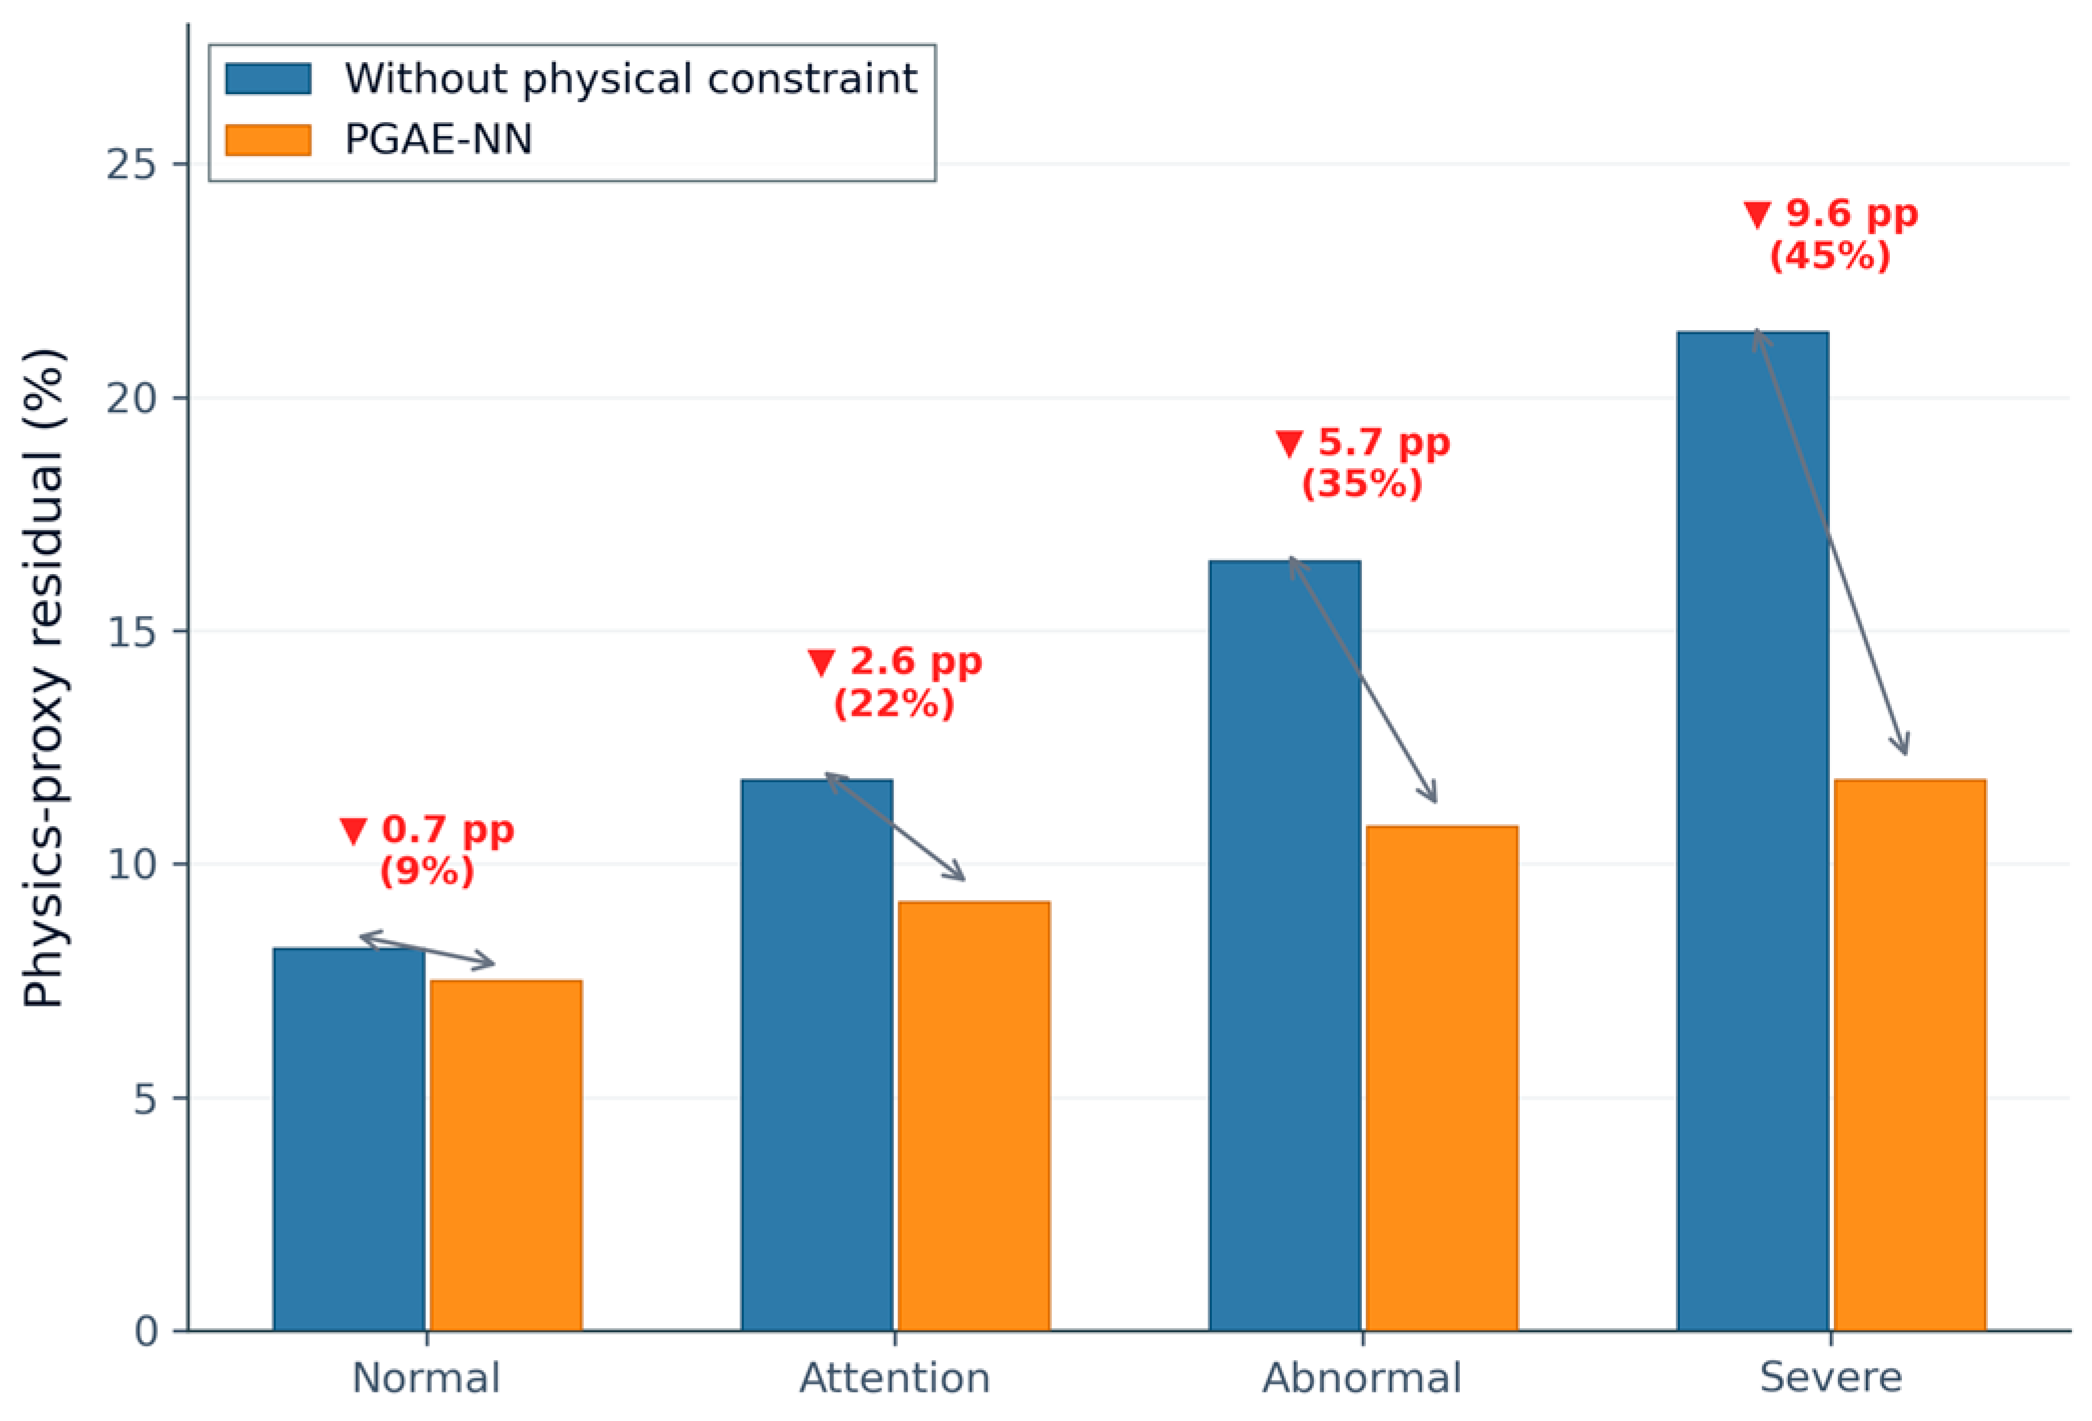
The physics-proxy residual measures the consistency between model predictions and insulation ageing mechanisms; a lower value indicates better physical plausibility. Table 10 compares the average dual-physics-proxy residuals of the unconstrained baseline (w/o dual-physics segmental regularization) and PGAE-NN across state levels, and Figure 7 visualizes the comparison.
PGAE-NN achieves lower residuals than the unconstrained model at all state levels, confirming that the dual-physics segmental regularization effectively guides predictions toward the trends characterized by Arrhenius thermal ageing and Fick moisture migration. The improvement increases monotonically with degradation severity: only 0.7 pp under normal but 9.6 pp (44.9% relative reduction) under severe, consistent with the sevenfold increase in λ (0.1 → 0.7) designed in Section 2.4.4. This validates the “deeper degradation, stronger constraint” strategy.
The physical rationale is clear: as degradation progresses, thermal-ageing accumulation and moisture-migration trends increasingly dominate state evolution, yet purely data-driven models—constrained by scarce severe-state training samples—tend to produce physically implausible predictions. The unconstrained model’s residual rises from 8.2% (normal) to 21.4% (severe), a 161% increase reflecting this tendency. PGAE-NN, through segmentally strengthened regularization, constrains all state-level residuals below 12%, effectively suppressing mechanism deviation under extreme conditions.

3.8. Per-Defect-Type Recognition Performance

Per-defect classification metrics and primary misclassification directions on the test set are summarized in Table 11. Recognition performance varies across defect types, reflecting differences in feature saliency and sample availability.
Moisture ingress achieves the highest accuracy (97.62%, F1 = 0.9761), as large-amplitude variations in oil moisture and hydrogen provide highly discriminative features. Its 20 attention → abnormal misclassifications concentrate in the moisture-migration transition stage, where tan δ and capacitance variation fall within the attention/abnormal threshold overlap zone due to the gradual nature of Fick diffusion; the model’s conservative bias (overestimating by one level) aligns with the “better strict than lenient” principle in insulation assessment.
Porcelain inner-wall creepage (96.14%, F1 = 0.9605) develops slowly with gradual transitions, leading to attention/abnormal boundary confusion (15 cases, attention → abnormal). Conductor-rod surface defect (94.32%, F1 = 0.9428) relies primarily on electrical indicators (PD, tan δ), with the main error being abnormal → attention (30 cases)—a risk-underestimation pattern suggesting that future work should incorporate PD transient features to refine thresholds. Ground-shield loss yields the lowest accuracy (91.70%, F1 = 0.9177) due to the fewest training samples (253, 7.3% of the test set) and feature coupling between end-shield current/oil pressure and other defect types; its primary error direction (eight cases, abnormal → attention) also represents risk underestimation.
Notably, all misclassifications occur between adjacent state levels, with no cross-level dangerous errors (e.g., normal ↔ severe), confirming the model’s inherent safety characteristics for power-equipment-condition assessment.

3.9. Robustness of Assessment Outputs to Measurement Perturbations

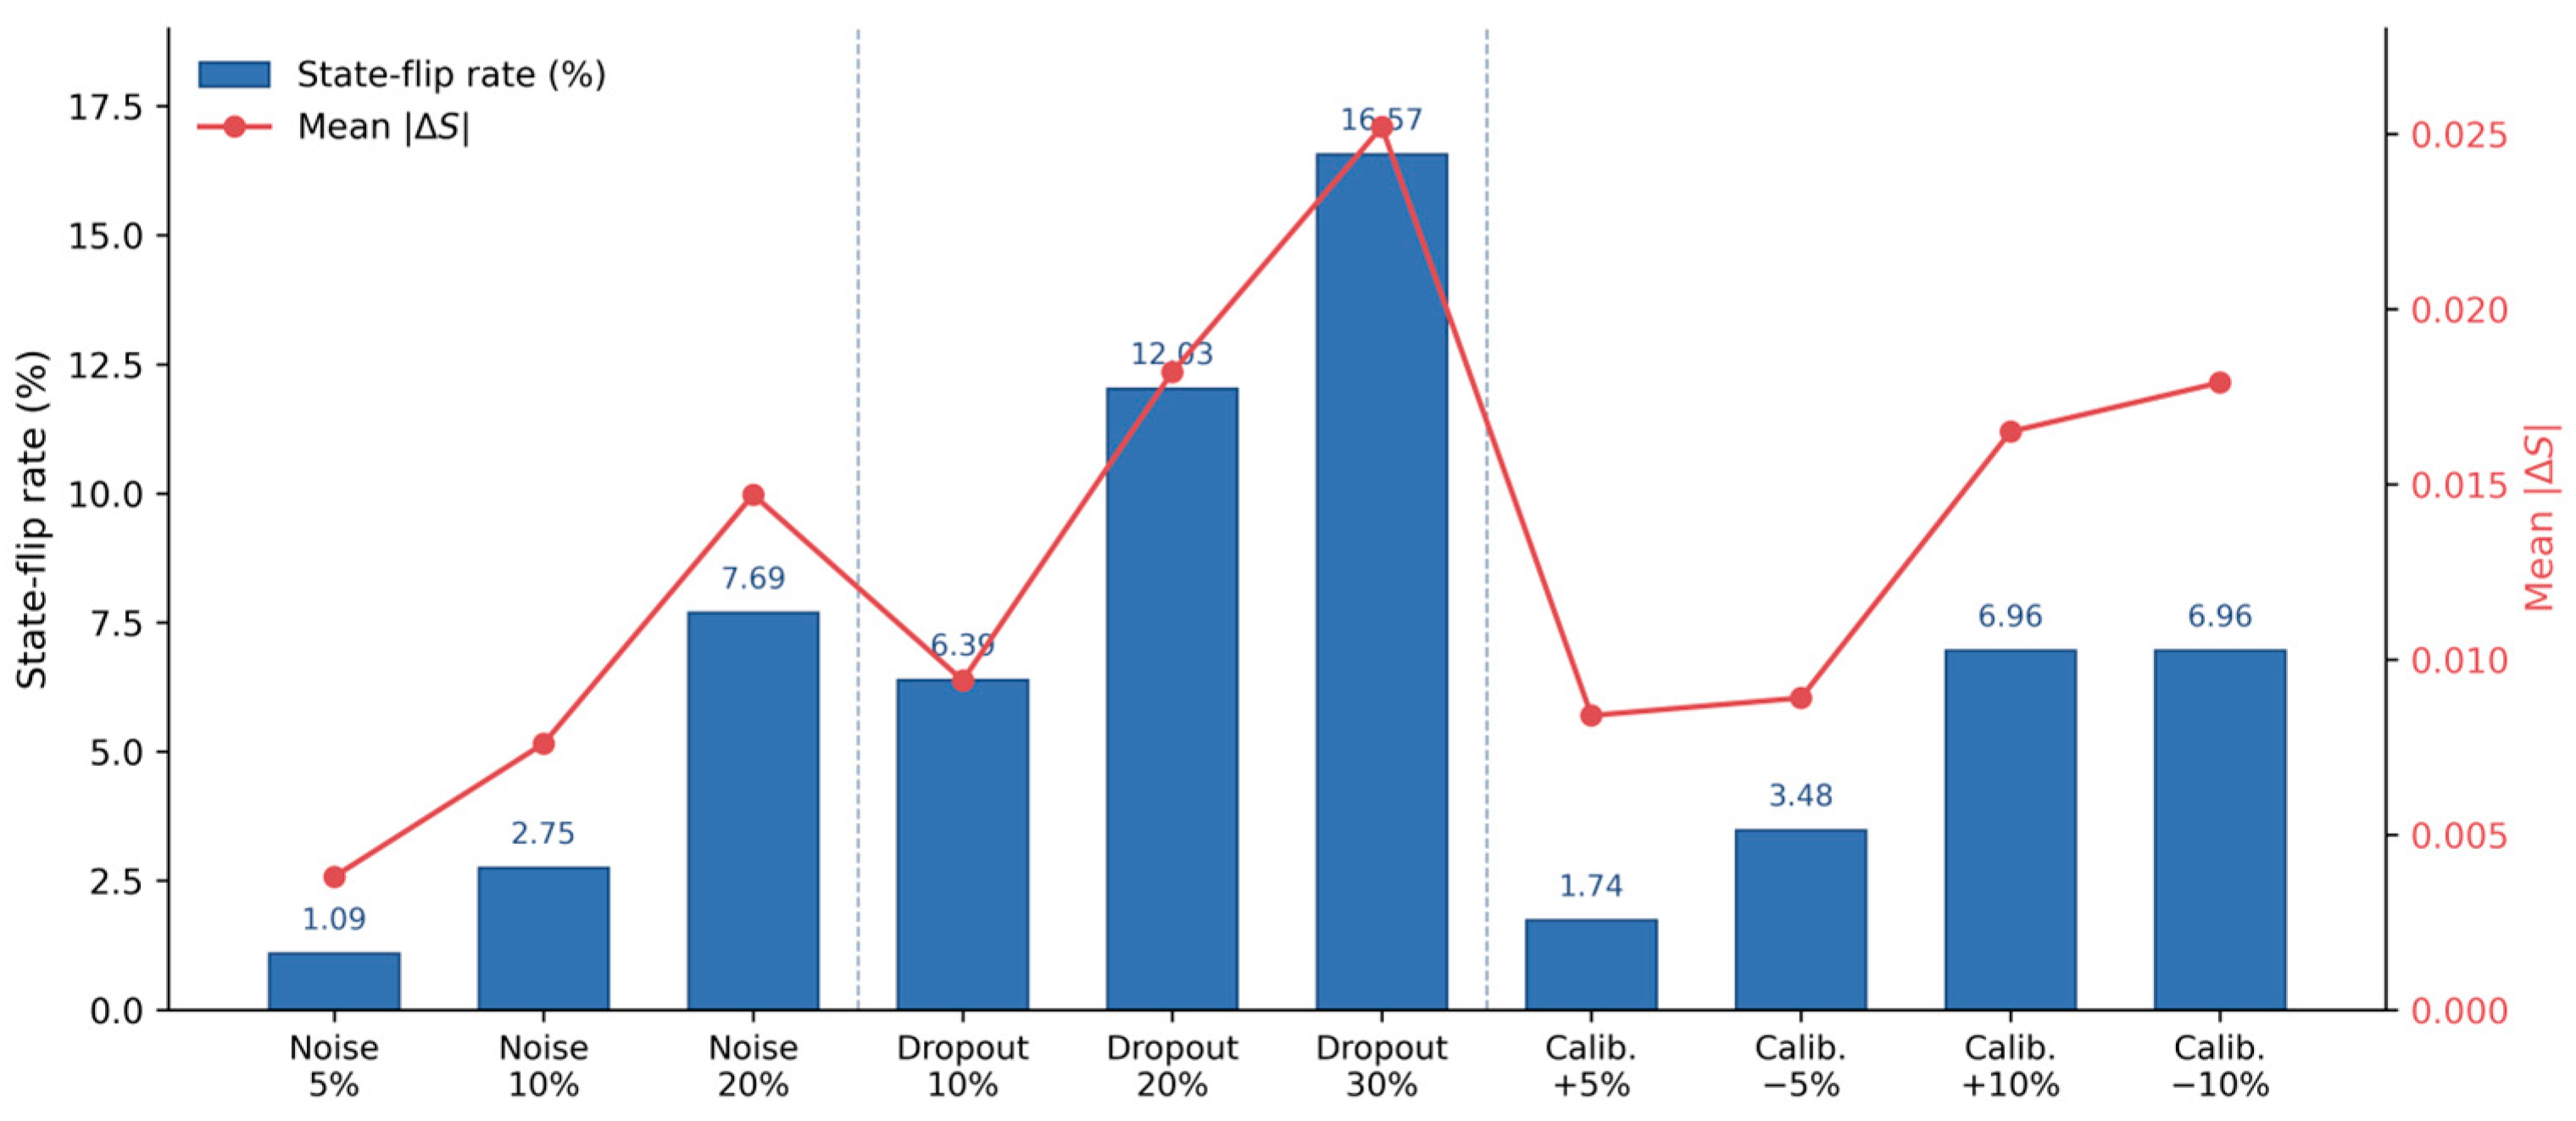
The robustness of the assessment outputs to imperfect measurements was evaluated on the monitoring records of the four defect series described in Section 2.3. The rule-based grading layer of Section 2.2 was applied with its trained weights and normalization anchors, and each scenario in the perturbation grid was repeated 100 times: multiplicative Gaussian noise (σ = 5%, 10%, and 20%), random sensor dropout (10%, 20%, and 30%, with within-channel median imputation), and systematic calibration shifts (±5% and ±10%).
Table 12 and Figure 8 summarize the results. Under realistic sensor noise (5–10%), fewer than 3% of the assignments change, and the mean absolute risk-index drift stays below 0.8% of the full range; even under the severe 20% noise, the flip rate is 7.69%, with a mean drift of 1.5% of the range. Sensor dropout is the dominant perturbation, producing flip rates of 6.39%, 12.03%, and 16.57% at 10%, 20%, and 30% missing values under median imputation, and calibration shifts yield 1.74–6.96%. Across all scenarios, the mean drift never exceeds 2.6% of the full range, and no assignment moves by more than one level, so the grading output degrades gracefully rather than discontinuously. The flips concentrate on records adjacent to level boundaries, and no single channel contributes more than 1.4% of flips under 10% noise, confirming that the grading stability does not hinge on any individual sensor.
The analysis targets perturbation-induced output stability rather than the absolute condition distribution.
To isolate the effect of the weighting scheme itself, the grading layer was additionally evaluated under alternative weighting vectors on the same records, with the normalization held fixed across schemes: equal weights and PCA-derived weights (loadings weighted by explained variance). Both alternatives shift the risk index by a mean of 2.0–2.6% of the full range, with re-assignments confined to boundary records and never exceeding one level, indicating that the grading output varies smoothly and boundedly with the weighting choice. The objective CV weighting is retained as the data-driven choice computed from training-set statistics only.

4. Discussion

From an engineering perspective, PGAE-NN’s advantages manifest in three aspects: multi-source parameter fusion, boundary-state discrimination, and precursor early warning. The PGCA meta-learner exploits complementarity among base learners to dynamically adjust fusion weights at attention–abnormal boundaries, while the dual-physics proxy residual imposes monotonic-degradation and moisture-migration trend constraints that suppress non-physical predictions under severe degradation where training samples are scarce.
It should be emphasized that the Arrhenius thermal-ageing and Fick moisture-migration terms constructed in this study are observation-based physical proxy trend constraints, rather than rigorous solutions of the internal temperature or moisture fields. Since no internal spatial temperature/moisture sensors were deployed, the proxy residual primarily reflects the consistency between model predictions and equivalent ageing trends. The relevant conclusion is therefore improved consistency with the physics-proxy constraints, rather than full verification of the underlying multi-physics mechanisms.
Furthermore, the experimental samples originate from accelerated ageing tests on four same-type bushings, with each defect type pre-set on a single specimen, so defect type and individual bushing remain partially coupled. Although temporal-order splitting and sliding-window isolation reduce data-leakage risk, adjacent sampling points retain strong temporal correlation, and the 23,400 samples should not be equated with 23,400 fully independent observations. As a preliminary external check beyond the four designed tests, an additional campaign was conducted 17 months after the training-data collection: 14 bushings from three further manufacturers (72.5–220 kV, covering finished, standard-reference, and prefabricated-defect specimens) were monitored for approximately 55 h with all quantities sampled at 20 s intervals (within-segment coefficients of variation: 0.10% for oil pressure, 0.17% for hydrogen, 0.96% for moisture). The framework was applied as trained, without retraining or re-calibration: the measured signatures of the terminal events, namely order-of-magnitude tail-current excursions, capacitance deviations, and dielectric-loss excursions, were consistent with the design intent of the indicator system, and the slow oil-state channels produced no false excursions, indicating preliminary transferability to independent tests and monitoring data. This campaign, however, provided no sample-level labels and no repeat experiments, and therefore does not constitute a full capability validation; systematic repeat-validation experiments on independent and in-service batches are planned as the immediate continuation of this work.
PGAE-NN relates to the physics-based and standalone transformer-based benchmark families in three respects. First, the physics-based assessment paradigm is embedded in the framework itself: the rule-based grading layer of Section 2.2 implements the threshold logic of IEEE Std C57.104 and DL/T 596-2021 [45], its stability under measurement perturbations is quantified in Section 3.9, and the dual-confirmation labeling protocol (Section 2.3.2) evaluates every sample under both the threshold paradigm and the learning-based paradigm, so the contrast between the two paradigms is inherent in the evaluation design. Second, the benchmark set of Table 6 already includes a physics-regularized neural network (92.28%) as a head-to-head representative of the physics-based family. Third, PGAE-NN embeds a Transformer Encoder as one of its heterogeneous base learners, and the ablation study (Table 8) quantifies its individual and combined contributions: removing the physics-guided cross-attention meta-learner causes the largest accuracy drop (−1.82 pp), confirming that the transformer component is realized through physics-guided fusion rather than through the architecture alone. A standalone Transformer classifier lacks both the physics-proxy regularization and the cross-learner attention fusion whose removal the ablation quantifies; benchmarking against such single-architecture methods on the present corpus is therefore largely covered by the ablation design, and expanded standalone benchmarks will be conducted once labeled in-service monitoring data become available.


5. Conclusions

(1)
An assessment framework comprising eight core indicators (electrical and non-electrical) was established for oil-immersed transformer bushing insulation evaluation. Indicators were selected via Pearson correlation and Fisher discriminant ratio, weighted by the coefficient-of-variation method, and the insulation state was graded into four levels (normal, attention, abnormal, and severe) with reference to IEEE Std C57.104-2019 and DL/T 596-2021. Accelerated ageing experiments on four 110 kV bushings with four typical defect types yielded 23,400 monitoring samples, providing the data foundation for model training and validation.
(2)
A physics-proxy-residual-regularized cross-attention ensemble neural network (PGAE-NN) was proposed, employing LightGBM, 1D-CNN, and Transformer Encoder as heterogeneous base learners to extract complementary features at statistical, local-temporal, and global-temporal levels. The PGCA meta-learner achieves physics-guided dynamic fusion across modalities, while dual Arrhenius–Fick proxy-residual segmental regularization (λ = 0.1–0.7) enhances state-adaptive physical consistency. A classification–precursor dual-task framework enables simultaneous state recognition and transition early warning. Ablation experiments confirmed the contribution of each component (1.82, 1.46, and 1.11 pp, respectively).
(3)
PGAE-NN achieves 96.14% test-set accuracy, F1 = 0.9613, AUC = 0.9835, and 5-fold CV accuracy of 96.36% ± 0.54%, outperforming PSO-SVM by 7.99 pp and conventional Stacking by 2.69 pp. Per-defect recognition ranges from 91.70% to 97.62%, with all misclassifications confined to adjacent state levels and no cross-level dangerous errors. The precursor warning achieves F1 = 0.923 (+0.102 over the threshold method), providing approximately 15 min of lead time. Physics-proxy residuals decrease by 44.9% under severe conditions, validating the effectiveness of segmental regularization across all degradation stages. Furthermore, on an independent validation set of 14 bushings from three additional manufacturers spanning 72.5–220 kV, the measured capacitance-change and tail-current signatures of breakdown and flashover events (Section 4) are consistent with the physical rationale of the indicator system.
Future work will conduct systematic repeat-validation campaigns on independent and in-service bushing batches, with sample-level labeling and repeated fault scenarios, to further verify the generality of the proposed framework.

Author Contributions

Conceptualization, Y.L., S.H. and W.S.; Methodology, S.H., S.D. and W.S.; Software, S.D.; Validation, S.D. and X.J.; Formal analysis, Y.L.; Investigation, Y.L., S.H., X.J. and W.S.; Resources, Y.L., S.H., X.J. and W.S.; Data curation, Y.L.; Writing—original draft, S.D.; Writing—review & editing, Y.L., S.H., S.D., X.J. and W.S.; Supervision, Y.L., S.H., X.J. and W.S.; Project administration, Y.L., X.J. and W.S.; Funding acquisition, Y.L., S.H., X.J. and W.S. All authors have read and agreed to the published version of the manuscript.

Funding

This research received funding by Science and Technology Project of Guangdong Power Grid Co., Ltd. grant number GDKJXM20240406.

Data Availability Statement

The data presented in this study are available upon request from the corresponding author (subject to permission from the cooperating enterprise and applicable confidentiality restrictions).

Conflicts of Interest

Authors Yechuan Luo, Shihua Huang, Xue Jia, and Wenxing Sun were employed by Guangdong Power Grid Co., Ltd. The remaining author (Shenghao Dong) declares that the research was conducted in the absence of any commercial or financial relationships that could be construed as potential conflicts of interest. The funder was not involved in the study design, collection, analysis, interpretation of data, the writing of this article, or the decision to submit it for publication.

Abbreviations

The following abbreviations are used in this manuscript:
1D-CNNOne-Dimensional Convolutional Neural Network
CVCoefficient of variation
MLPMulti-Layer Perceptron
PGAE-NNPhysics-proxy-residual-regularized cross-attention ensemble neural network
PGCAPhysics-proxy-residual-guided cross-attention
PSO-SVMParticle Swarm Optimization–Support Vector Machine

References

  1. Martin, D.; Tenbohlen, S. Power Transformer Component Reliability Using CIGRE Large-Scale Data Surveys. Energies 2026, 19, 3197. [Google Scholar] [CrossRef] [Scilit]
  2. Liu, S.; Song, S.L.; Lu, L.C.; Liang, X.D.; Liu, Z.H. Fault analysis and design improvement of ±800 kV UHV DC wall bushing. High Volt. Eng. 2019, 45, 2928–2935. (In Chinese) [Google Scholar] [CrossRef]
  3. Tang, H.; Wu, G.; Chen, M.; Deng, J.; Li, X. Analysis and Disposal of Typical Breakdown Failure for Resin Impregnated Paper Bushing in the Valve Side of HVDC Converter Transformer. Energies 2019, 12, 4303. [Google Scholar] [CrossRef] [Scilit]
  4. Wang, Q.; Liu, P.; Tian, H.; Xie, G.; Peng, Z.; Yang, X. Research on the dynamic characteristics of electric field distribution of the ±1100 kV Ultra high voltage converter transformer valve-side bushing using weakly ionised gas conductance model. High Volt. 2022, 7, 288–301. [Google Scholar] [CrossRef] [Scilit]
  5. Mikulecky, A.; Stih, Z. Influence of temperature, moisture content and ageing on oil impregnated paper bushings insulation. IEEE Trans. Dielectr. Electr. Insul. 2013, 20, 1421–1427. [Google Scholar] [CrossRef] [Scilit]
  6. Sun, H.; Yang, D.Q.; Shi, W.H.; Sun, Y.M.; Liu, X.D. Influence of Multiorder Harmonic Voltage on Degradation in Epoxy Resin Layer of High-Voltage Valve Side Bushing. IEEE Trans. Dielectr. Electr. Insul. 2025, 32, 2906–2914. [Google Scholar] [CrossRef] [Scilit]
  7. Christina, A.J.; Salam, M.A.; Rahman, Q.M.; Wen, F.; Ang, S.P.; Voon, W. Causes of transformer failures and diagnostic methods—A review. Renew. Sustain. Energy Rev. 2018, 82, 1442–1456. [Google Scholar] [CrossRef] [Scilit]
  8. Wang, M.; Duan, Y.; He, J. Dynamic reliability analysis of the bushings’ base fracture of a 220 kV transformer-bushing system subjected to fully nonstationary earthquake loads. Eng. Fail. Anal. 2025, 174, 109539. [Google Scholar] [CrossRef] [Scilit]
  9. Tenbohlen, S.; Jagers, J.; Vahidi, F. Standardized survey of transformer reliability: On behalf of CIGRE WG A2.37. In Proceedings of the 2017 International Symposium on Electrical Insulating Materials (ISEIM), Toyohashi, Japan, 11–15 September 2017; pp. 593–596. [Google Scholar] [CrossRef] [Scilit]
  10. Saha, T.K.; Purkait, P. Investigation of polarization and depolarization current measurements for the assessment of oil-paper insulation of aged transformers. IEEE Trans. Dielectr. Electr. Insul. 2004, 11, 144–154. [Google Scholar] [CrossRef] [Scilit]
  11. Gu, Z.; Gu, C.; Zhu, M.; Zhu, W.; Li, Z.; Xu, R.; Wang, J. Influence of temperature on frequency domain spectroscopy detection of transformer bushings. Energy Rep. 2022, 8, 381–387. [Google Scholar] [CrossRef] [Scilit]
  12. Jiang, Z.; Li, X.; Zhang, H.; Zhang, E.; Liu, C.; Fan, X.; Liu, J. Research Progress and Prospect of Condition Assessment Techniques for Oil–Paper Insulation Used in Power Systems: A Review. Energies 2024, 17, 2089. [Google Scholar] [CrossRef] [Scilit]
  13. Msane, M.R.; Thango, B.A.; Ogudo, K.A. Condition Monitoring of Electrical Transformers Using the Internet of Things: A Systematic Literature Review. Appl. Sci. 2024, 14, 9690. [Google Scholar] [CrossRef] [Scilit]
  14. Hao, Z.; Jiang, C.M.; Li, H.; Cheng, D.L.; Tang, Y.P.; Liu, G.W.; Nv, Z.; Mu, K. High-frequency partial discharge monitoring technology based on current transformers at the bushing lifting seat of transformers. High Volt. Eng. 2025, 51, 1126–1134. (In Chinese) [Google Scholar] [CrossRef]
  15. Liao, R.; Zhang, Y.; Yang, L.; Zheng, H.; She, X. A cloud and evidential reasoning integrated model for insulation condition assessment of high voltage transformers. Int. Trans. Electr. Energy Syst. 2014, 24, 913–926. [Google Scholar] [CrossRef] [Scilit]
  16. Tang, Z.; Jian, X. Thermal fault diagnosis of complex electrical equipment based on infrared image recognition. Sci. Rep. 2024, 14, 5547. [Google Scholar] [CrossRef] [Scilit]
  17. Yao, H.; Mu, H.; Ding, N.; Zhang, D.; Liang, Z.; Tian, J.; Zhang, G. Evaluation method for moisture content of oil-paper insulation based on segmented frequency domain spectroscopy: From curve fitting to machine learning. IET Sci. Meas. Technol. 2021, 15, 517–526. [Google Scholar] [CrossRef] [Scilit]
  18. Xu, C.; Li, X.; Wang, Z.; Zhao, B.; Xie, J. Improved BLS based transformer fault diagnosis considering imbalanced samples. Energy Rep. 2022, 8, 1446–1453. [Google Scholar] [CrossRef] [Scilit]
  19. Al-Sakini, S.R.; Bilal, G.A.; Sadiq, A.T.; Al-Maliki, W.A.K. Dissolved Gas Analysis for Fault Prediction in Power Transformers Using Machine Learning Techniques. Appl. Sci. 2025, 15, 118. [Google Scholar] [CrossRef] [Scilit]
  20. Ghoneim, S.S.M.; Baz, M.; Alzaed, A.; Zewdie, Y.T. Predicting the insulating paper state of the power transformer based on XGBoost/LightGBM models. Sci. Rep. 2025, 15, 17836. [Google Scholar] [CrossRef] [Scilit]
  21. Jiang, Y.; Fan, X.; Zhang, X.; Tang, X. Transformer fault diagnosis based on expert-designed feature fusion and stacked ensemble learning. Electr. Power Syst. Res. 2026, 260, 113240. [Google Scholar] [CrossRef] [Scilit]
  22. Bragone, F.; Morozovska, K.; Hilber, P.; Laneryd, T.; Luvisotto, M. Physics-informed neural networks for modelling power transformer’s dynamic thermal behaviour. Electr. Power Syst. Res. 2022, 211, 108447. [Google Scholar] [CrossRef] [Scilit]
  23. Du, B.X.; Jiang, J.P. A review on the influence of moisture on partial discharge behavior in oil-paper insulation of converter transformers. High Volt. Eng. 2021, 47, 2932–2945. (In Chinese) [Google Scholar] [CrossRef]
  24. Yang, C.J.; Liu, Y.P.; Zhao, T.; Yang, J.J.; Liu, Y.J. Effect of temperature on moisture adsorption and desorption in cellulose insulation. Trans. China Electrotech. Soc. 2025, 40, 300–311. (In Chinese) [Google Scholar] [CrossRef]
  25. von Rueden, L.; Mayer, S.; Beckh, K.; Georgiev, B.; Giesselbach, S.; Heese, R.; Kirsch, B.; Walczak, M.; Pfrommer, J.; Pick, A.; et al. Informed machine learning—A taxonomy and survey of integrating prior knowledge into learning systems. IEEE Trans. Knowl. Data Eng. 2023, 35, 614–633. [Google Scholar] [CrossRef] [Scilit]
  26. Lyu, Y.H.; Liu, Y.D.; Yan, Y.J.; Cai, J.F.; Huang, X.B. An inversion method for equivalent thermal conductivity of bushing capacitance core based on physics-informed neural networks. Trans. China Electrotech. Soc. 2026, in press. (In Chinese) [Google Scholar] [CrossRef]
  27. McClenny, L.; Braga-Neto, U. Self-adaptive physics-informed neural networks. J. Comput. Phys. 2023, 474, 111722. [Google Scholar] [CrossRef] [Scilit]
  28. Jin, Y.; Luo, X.; Kong, X. A multi-level bidirectional cross-attention framework for multi-sensor fault diagnosis of rotating machinery. Meas. Sci. Technol. 2026, 37, 286114. [Google Scholar] [CrossRef] [Scilit]
  29. Han, X.; Cao, Y.; Hu, P.; Feng, W. Multi-modal and multi-condition fault diagnosis of rotating machinery via a heterogeneous graph learning framework. Inf. Fusion 2026, 130, 104106. [Google Scholar] [CrossRef] [Scilit]
  30. Jiang, J.; Zhang, W.Q.; Li, B.; Li, X.H.; Fan, L.D. Outlier identification and data reconstruction of dissolved gases in power transformer oil. Trans. China Electrotech. Soc. 2024, 39, 5521–5533. (In Chinese) [Google Scholar] [CrossRef]
  31. Zhang, P.; Hu, K.; Yang, Y.; Yi, G.; Zhang, X.; Peng, R.; Liu, J. Research on Prediction of Dissolved Gas Concentration in a Transformer Based on Dempster–Shafer Evidence Theory-Optimized Ensemble Learning. Electronics 2025, 14, 1266. [Google Scholar] [CrossRef] [Scilit]
  32. Yu, Q.; Wang, X.; Lv, D.; Qi, B.; Wei, Y.; Liu, L.; Zhang, P.; Zhu, W.; Zhang, W. Data Fusion and Situation Awareness for Smart Grid and Power Communication Network Based on Tensor Computing and Deep Reinforcement Learning. Electronics 2023, 12, 2606. [Google Scholar] [CrossRef] [Scilit]
  33. Liebel, L.; Körner, M. Auxiliary tasks in multi-task learning. arXiv 2018, arXiv:1805.06334. [Google Scholar] [CrossRef] [Scilit]
  34. IEEE Std C57.104-2019, Revision of IEEE Std C57.104-2008; IEEE Guide for the Interpretation of Gases Generated in Mineral Oil-Immersed Transformers. IEEE: New York, NY, USA, 2019; pp. 1–98. [CrossRef] [Scilit]
  35. IEC 60599:2022; Mineral Oil-Filled Electrical Equipment in Service—Guidance on the Interpretation of Dissolved and Free Gases Analysis. International Electrotechnical Commission: Geneva, Switzerland, 2022.
  36. IEC 60137:2017; Insulated Bushings for Alternating Voltages Above 1000 V. International Electrotechnical Commission: Geneva, Switzerland, 2017.
  37. GB/T 4109-2022; Insulated Bushings for Alternating Voltages Above 1000 V. National Standards of People’s Republic of China: Beijing, China, 2022.
  38. Ke, G.; Meng, Q.; Finley, T.; Wang, T.; Chen, W.; Ma, W.; Ye, Q.; Liu, T.-Y. LightGBM: A highly efficient gradient boosting decision tree. In Advances in Neural Information Processing Systems 30; Curran Associates Inc.: Red Hook, NY, USA, 2017; pp. 3146–3154. [Google Scholar]
  39. Kiranyaz, S.; Avci, O.; Abdeljaber, O.; Ince, T.; Gabbouj, M.; Inman, D.J. 1D convolutional neural networks and applications: A survey. Mech. Syst. Signal Process. 2021, 151, 107398. [Google Scholar] [CrossRef] [Scilit]
  40. Vaswani, A.; Shazeer, N.; Parmar, N.; Uszkoreit, J.; Jones, L.; Gomez, A.N.; Kaiser, Ł.; Polosukhin, I. Attention is all you need. In Advances in Neural Information Processing Systems 30; Curran Associates Inc.: Red Hook, NY, USA, 2017; pp. 5998–6008. [Google Scholar]
  41. Wolpert, D.H. Stacked generalization. Neural Netw. 1992, 5, 241–259. [Google Scholar] [CrossRef] [Scilit]
  42. Ruan, G.C.; He, Y.L.; Tan, Z.F.; Zhong, H.W. Review of hybrid data-driven and physics-based modeling for the operation of new-type power systems. Proc. CSEE 2024, 44, 5021–5036. (In Chinese) [Google Scholar] [CrossRef]
  43. Zhang, Y.; Yang, Q. A Survey on Multi-Task Learning. IEEE Trans. Knowl. Data Eng. 2022, 34, 5586–5609. [Google Scholar] [CrossRef] [Scilit]
  44. Kingma, D.P.; Ba, J. Adam: A method for stochastic optimization. In Proceedings of the 3rd International Conference on Learning Representations (ICLR), San Diego, CA, USA, 7–9 May 2015. [Google Scholar]
  45. DL/T 596-2021; Preventive Test Code for Electric Power Equipment. National Energy Administration: Beijing, China, 2021.
Figure 1. Architecture of the insulation-condition-assessment indicator system for transformer bushings. The blue and green blocks denote the electrical and non-electrical indicator groups, respectively, and the light-blue, yellow, orange, and red blocks in the bottom row represent the four condition levels (Normal, Attention, Abnormal, and Severe) in order of increasing severity.
Energies 19 04239 g001
Figure 2. Overall architecture of PGAE-NN. Block colors correspond to the pipeline stages labelled on the left (blue: input and output layers; green: preprocessing and precursor-warning task; yellow: heterogeneous base learners; purple: POCA meta-learner; red: physics-based regularization components). Solid arrows denote the main data flow, and the red dashed arrow indicates the injection of physics-proxy residual penalties into the POCA scoring.
Energies 19 04239 g002
Figure 3. Evaluation workflow of PGAE-NN.
Energies 19 04239 g003
Figure 4. Experimental scenes of the 110 kV bushing defect tests: (a) accelerated ageing test; (b) on-site testing with online monitoring; (c) disassembly inspection.
Energies 19 04239 g004
Figure 5. Data-processing and leakage-prevention verification workflow.
Energies 19 04239 g005
Figure 6. Confusion matrix of PGAE-NN on the test set.
Energies 19 04239 g006
Figure 7. Comparison of physics-proxy residual distribution across state levels.
Energies 19 04239 g007
Figure 8. Stability of the rule-layer grading output under the perturbation grid: state-flip rate (bars, left axis) and mean absolute risk-index drift (line, right axis).
Energies 19 04239 g008
Table 1. Eight core online monitoring indicators for bushing-condition assessment.
CategoryNo.IndicatorSymbolUnitInsulation Feature Represented
Electrical variables1Partial dischargePDpCInternal partial-discharge activity
2Dielectric loss factortanδ%Dielectric-loss severity
3Capacitance variation rateΔC%Capacitive-screen structural integrity
4End-shield currentIemAMain-insulation leakage current
5Harmonic contentTHD%Additional stress from voltage waveform distortion
Non-electrical variables6Dissolved hydrogen in oilH2ppmCharacteristic gas of local overheating and discharge
7Moisture in oilH2OppmInsulation moisture degree
8Oil pressurePoilkPaSealing condition and internal gas accumulation
Table 2. Four-level bushing insulation-condition classification, with risk index ranges and maintenance strategies.
Condition LevelRisk Index (RISK)Physical MeaningCore-Parameter ThresholdMaintenance Strategy
Normal[0, 0.25)Good insulation performance without obvious degradationAll parameters below attention thresholdsContinue monitoring
Attention[0.25, 0.50)Early degradation signs; enhanced attention requiredAny parameter exceeds the attention thresholdShorten inspection interval
Abnormal[0.50, 0.75)Obvious insulation degradation with fault riskAny parameter exceeds the abnormal thresholdArrange outage inspection
Severe[0.75, 1.0]Severe insulation degradation with imminent failure riskAny parameter exceeds the severe thresholdImmediate shutdown
Table 3. Sample distribution across four defect types and four insulation-condition levels.
Defect TypeSamplesProportion (%)Valid Acquisition Time (h)Condition-Level Distribution
(Normal/Attention/Abnormal/Severe)
Moisture ingress11,88050.8334989/3326/2138/1427
Conductor-rod surface defect540023.1151728/1512/1350/810
Porcelain creepage432018.5121944/1209/691/476
Ground-shield loss18007.75414/486/504/396
Total23,400100.09075/6533/4683/3109
Table 4. Coefficients of variation and weights of the eight core indicators computed from the training set.
No.IndicatorStandard DeviationMeanCoefficient of VariationWeight
1Partial discharge0.2140.1421.5070.1836
2Dielectric loss factor0.1780.1521.1710.1427
3Capacitance variation rate0.1650.1481.1150.1359
4End-shield current0.1560.1680.9290.1132
5Harmonic content0.1320.2120.6230.0759
6Dissolved hydrogen in oil0.1880.1581.1900.1450
7Moisture in oil0.1690.1651.0240.1248
8Oil pressure0.1180.1820.6480.0790
Table 5. Segmental regularization strength for the physics-proxy residual.
Condition LevelPredicted RiskConstraint StrengthRole of Physical Constraint
Normal<0.250.1Weak constraint; data-driven learning dominates
Attention0.25~0.500.3Gradually introduce proxy physical constraints
Abnormal0.50~0.750.5Increase physics-residual weight
Severe≥0.750.7Strong constraint to limit abnormal predictions
Table 6. Classification performance of different methods on the test set.
MethodAccuracy (%)Precision (%) (Macro-Average)Recall (%)
(Macro-Average)
F1-Score
(Macro-Average)
AUC
PSO-SVM88.1586.7287.310.86980.9415
Random Forest90.3289.0389.670.89320.9538
LightGBM91.8790.6591.120.90870.9621
Traditional Stacking93.4592.3192.880.92580.9702
Physics-Regularized NN92.2890.0293.150.91560.9658
PGAE-NN (proposed)96.1496.2696.010.96130.9835
Table 7. Five-fold cross-validation results of PGAE-NN.
FoldAccuracy (%)Precision (%)Recall (%)F1-Score
Fold-196.9296.2896.620.9645
Fold-295.8895.1595.520.9534
Fold-396.9896.3896.720.9655
Fold-496.1295.4295.720.9557
Fold-595.9295.2295.580.9540
Mean +/− standard deviation96.36 ± 0.5495.69 ± 0.5996.03 ± 0.590.9586 ± 0.0059
Table 8. Ablation study results of PGAE-NN.
Model ConfigurationAccuracy (%)Delta from Full Model (%)F1-Score
(Macro-Average)
Precursor F1-Score
PGAE-NN (full)96.140.96130.9233
w/o PGCA94.32−1.820.94150.8867
w/o dual-physics94.68−1.460.94520.9015
w/o dual-task95.03−1.110.9498
w/o all (Traditional Stacking)93.45−2.690.9258
Table 9. Per-state-level recognition performance of PGAE-NN on the test set.
Condition LevelSamplesPrecision (%)Recall (%)F1-Score
Normal1 21597.4299.340.9837
Attention1 04294.6693.570.9411
Abnormal69493.7392.650.9319
Severe52199.2398.460.9884
Overall (weighted average)3 47296.1396.140.9613
Table 10. Physics-proxy residuals by state level, with and without physical constraint.
Condition LevelWithout Physical Constraints (%)PGAE-NN (%)Reduction (Percentage Points)
Normal8.27.50.7
Attention11.89.22.6
Abnormal16.510.85.7
Severe21.411.89.6
Table 11. Recognition performance of PGAE-NN by defect type.
Defect TypeSamplesAccuracy (%)F1-ScoreMain Misclassification Direction
Moisture ingress176197.620.9761Attention → abnormal (20 cases)
Conductor-rod surface defect81094.320.9428Abnormal → attention (30 cases)
Porcelain creepage64896.140.9605Attention → abnormal (15 cases)
Ground-shield loss25391.700.9177Abnormal → attention (8 cases)
Table 12. Stability of the rule-layer grading output under measurement perturbations (100 Monte Carlo runs).
Perturbation ScenarioState-Flip Rate (%)Mean |ΔS|P95 |ΔS|
Gaussian noise σ = 5%1.090.00380.0108
Gaussian noise σ = 10%2.750.00760.0217
Gaussian noise σ = 20%7.690.01470.0407
Sensor dropout 10%6.390.00940.0500
Sensor dropout 20%12.030.01820.0847
Sensor dropout 30%16.570.02520.1124
Calibration shift +5%1.740.00840.0165
Calibration shift −5%3.480.00890.0176
Calibration shift +10%6.960.01650.0319
Calibration shift −10%6.960.01790.0355
Disclaimer/Publisher’s Note: The statements, opinions and data contained in all publications are solely those of the individual author(s) and contributor(s) and not of MDPI and/or the editor(s). MDPI and/or the editor(s) disclaim responsibility for any injury to people or property resulting from any ideas, methods, instructions or products referred to in the content.