1. Introduction
As the cornerstone of societal advancement, energy production and utilization are deeply intertwined with human progress [
1]. However, the energy crisis driven by continuous reliance on fossil fuels has accelerated the global shift toward cleaner energy substitutes [
2], among which solar and wind power have drawn widespread interest due to their eco-friendly profiles [
3,
4]. Nevertheless, modern low-carbon energy systems are still constrained by geographical dependencies and inherent supply intermittency [
5,
6]. Because thermal energy storage can seamlessly reconcile spatio-temporal mismatches between energy supply and demand, developing effective storage technologies is vital to securing a reliable power supply [
7,
8]. In solar heating applications, deploying heat storage tanks is an indispensable requirement to mitigate operational volatility and bridge temporal energy supply-demand gaps [
9,
10].
To address the limitations of conventional sensible thermal storage (such as large space requirement and continuous temperature drop), phase change heat storage tanks have emerged as an essential and highly promising technology [
11,
12]. Their necessity stems from their exceptionally high thermal storage density and unique capability to maintain a stable outlet temperature during phase change processes [
13,
14]. Current research has extensively investigated both the dynamic charging/discharging behavior of PCM tank systems [
15,
16] and the thermophysical properties of various phase change materials (PCMs) [
17]—including organic PCMs (e.g., paraffins and fatty acids operating at 303–363 K with latent heat capacities of 150–240 kJ/kg) and inorganic PCMs offering higher volumetric storage densities [
18].
Both the geometrical configuration of a phase change heat storage unit and its operating parameters strongly affect its transient thermal response and storage performance. Ye and Khodadadi [
19] examined an L-shaped shell-and-tube latent heat energy storage unit and demonstrated that introducing radial eccentricity and optimizing the geometrical parameters significantly improved the melting performance. Hu et al. [
20] developed a baffle-type phase change heat storage electric heating device and analyzed the effects of the number and thickness of rectangular plates on the charging and discharging processes. Their optimized device achieved thermal storage and release efficiencies of 85.83% and 90.1%, respectively. Punniakodi et al. [
21] investigated cylindrical PCM capsules and found that increasing the HTF inlet temperature from 338 K to 348 K increased the PCM melting rate by 23%.
Encapsulation geometry also strongly influences the transient thermal response of PCM storage systems. Feng et al. [
22] compared plate-type, cylindrical, and spherical PCM units under identical tank dimensions, PCM mass, inlet temperature, and HTF flow rate. The plate-type arrangement required the longest charging and discharging times, whereas the spherical arrangement responded more rapidly but exhibited pronounced vertical temperature nonuniformity and local regions with weak heat transfer. The cylindrical arrangement stored a relatively large amount of thermal energy but did not provide the fastest thermal response. These findings indicate that conventional PCM encapsulation structures generally involve a trade-off among thermal response rate, tank compactness, stored thermal energy, and temperature uniformity.
Bio-inspired structures provide another promising route for enhancing PCM heat transfer because natural systems have evolved efficient geometrical forms through long-term interaction with their environments [
23,
24,
25,
26,
27]. Cheng et al. [
28,
29] designed a red-blood-cell-shaped thermal storage unit and combined experiments with numerical simulations to evaluate its flow and heat transfer characteristics. The cold charging rate of this configuration was 2.12 times that of a conventional spherical capsule. Tian et al. [
30] introduced an artificial mitochondrion-shaped storage unit and showed that its shorter average harmonic distance reduced the PCM melting time by 48% relative to a spherical unit. Dong et al. [
31] designed a bionic oval PCM device and found that the elliptical capsule reduced the unconstrained melting time by 12% and increased the average Nusselt number by 20% compared with a spherical capsule.
Although these bio-inspired geometries can markedly accelerate phase change, the engineering merit of a PCM storage configuration cannot be evaluated solely by its melting rate. Practical tank design requires a balance among thermal response, PCM inventory, storage compactness, temperature uniformity, and structural regularity. From this perspective, honeycomb architectures provide a favorable engineering compromise by subdividing the PCM into smaller domains and enlarging the effective heat transfer interface while maintaining compact tessellation and regularly distributed HTF passages.
Nevertheless, the hexagonal cell should not be regarded as universally optimal in terms of melting rate. Duan et al. [
32] numerically compared the constrained melting of paraffin in triangular, trapezoidal, rectangular, hexagonal, and circular honeycomb cores over a Rayleigh number range of 3.095 × 10
5 to 3.87 × 10
7. The PCM mass and cross-sectional area were kept identical among the different geometries. Their results showed that rectangular cells consistently melted faster than the corresponding hexagonal cells at the same aspect ratio and Rayleigh number. The maximum melting time reduction achieved by triangular cells ranged from approximately 14% to 20% relative to their hexagonal counterparts. In addition, changing the orientation of a hexagonal cell reduced its melting time by up to 9.9%, demonstrating that cell shape, aspect ratio, orientation, and natural convection jointly determine melting performance.
Rahmani et al. [
33] further investigated two thermally conductive honeycomb fin configurations in a PCM-filled cavity. For the cavity without fins, increasing the Rayleigh number from 10
2 to 10
5 reduced the dimensionless complete melting time from Ste·Fo = 6 to approximately 0.4. After honeycomb fins were introduced, the complete melting time was reduced to approximately Ste·Fo = 0.5, and the melting process became less sensitive to variations in the Rayleigh number and cavity orientation. Increasing the fin thickness, and consequently decreasing the PCM area ratio, approximately halved the melting time. However, thicker conductive structures also increased the structural mass and reduced the available PCM volume and thermal storage capacity.
These findings demonstrate that honeycomb design involves an inherent trade-off between heat transfer enhancement and preservation of PCM storage capacity. Accordingly, the hexagonal arrangement adopted in the present study is intended as a balanced engineering configuration rather than the fastest possible melting geometry. Hexagonal cells are selected because they can be regularly tessellated, provide compact space utilization and structural stability, and divide the PCM into uniformly distributed smaller domains while forming regular HTF passages. Unlike conductive honeycomb fin systems, in which increasing the fin thickness reduces the available PCM volume, the present configuration investigates distributed hexagonal PCM cells under an approximately constant total PCM inventory.
Most existing honeycomb PCM studies have focused on melting within individual cells or on the effects of cell shape, orientation, aspect ratio, and conductive-fin configuration inside enclosed cavities. Comparatively limited attention has been paid to the tank-level influence of the number of distributed PCM cells under an identical or approximately identical PCM inventory. Moreover, the combined effects of cell number, HTF inlet temperature, inlet velocity, and HTF type on tank charging performance have not been systematically clarified. To address these gaps, the present study varies the number of distributed hexagonal PCM cells from 4 to 25 while maintaining an approximately constant PCM mass. The transient PCM temperature, liquid fraction, complete melting time, heat storage rate, and thermal energy stored within a prescribed charging period are systematically evaluated. Comparisons between prior relevant studies and the current research are presented in
Table 1. The main contribution of this study is to isolate the effect of PCM cell subdivision from that of PCM inventory, thereby clarifying how the number of distributed honeycomb cells influences the effective heat transfer interface, temperature uniformity, melting progression, charging duration, and usable thermal storage performance at the tank level.
2. Materials and Methods
2.1. Geometric Description
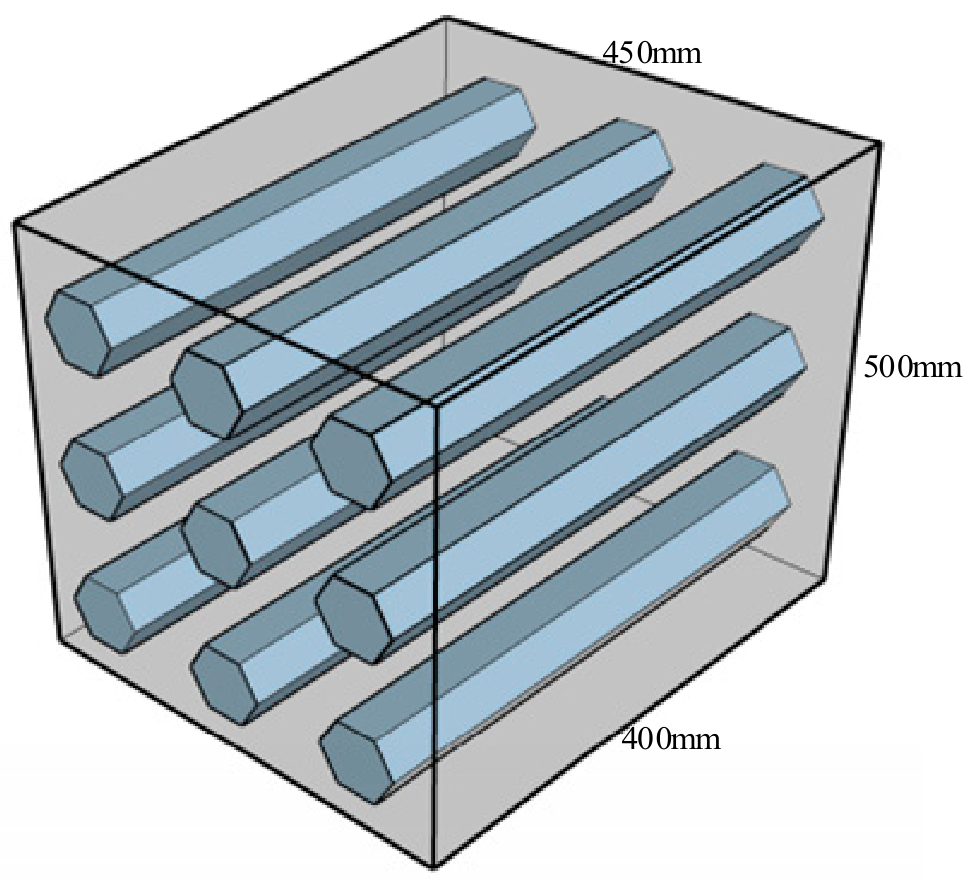
The dimensions of the numerical domain are selected with reference to the geometric proportions and internal arrangement of a practical thermal storage tank. The present model is not intended as a strictly dynamically and thermally similar scale model for directly predicting the absolute performance of the full-scale tank. Instead, it serves as a representative computational unit for comparing the effects of honeycomb cell number and HTF operating parameters under consistent geometric and boundary conditions. Direct reproduction of the full-scale tank substantially increases the size of the computational domain, the number of mesh cells, and the computational cost of the transient simulations. Therefore, a simplified storage unit with internal dimensions of 500 mm × 450 mm × 400 mm is adopted, corresponding to an effective internal volume of 0.0900 m3. The two-dimensional model is adopted because the honeycomb tubes maintain a uniform cross-section along the axial direction, and the model assumes that the geometric configuration and boundary conditions remain unchanged along this direction. Therefore, the dominant differences among the investigated configurations mainly arise from the HTF distribution, heat transfer distance, and PCM melting behavior within the transverse cross-section. The two-dimensional model captures these principal physical processes while enabling the effects of cell number and HTF operating parameters to be compared under consistent conditions. This model is intended for evaluating cross-sectional charging characteristics rather than predicting local three-dimensional phenomena near the inlet, outlet, and end walls, such as flow development, axial heat conduction, and end-wall effects. Consequently, the two-dimensional simplification is considered appropriate for the comparative objectives of the present study, while its applicability to local three-dimensional behavior remains limited. The inlet and outlet are idealized as continuous 25-mm-high slots extending over the full 400-mm axial length. This axially uniform slot assumption is the basis for the two-dimensional reduction.
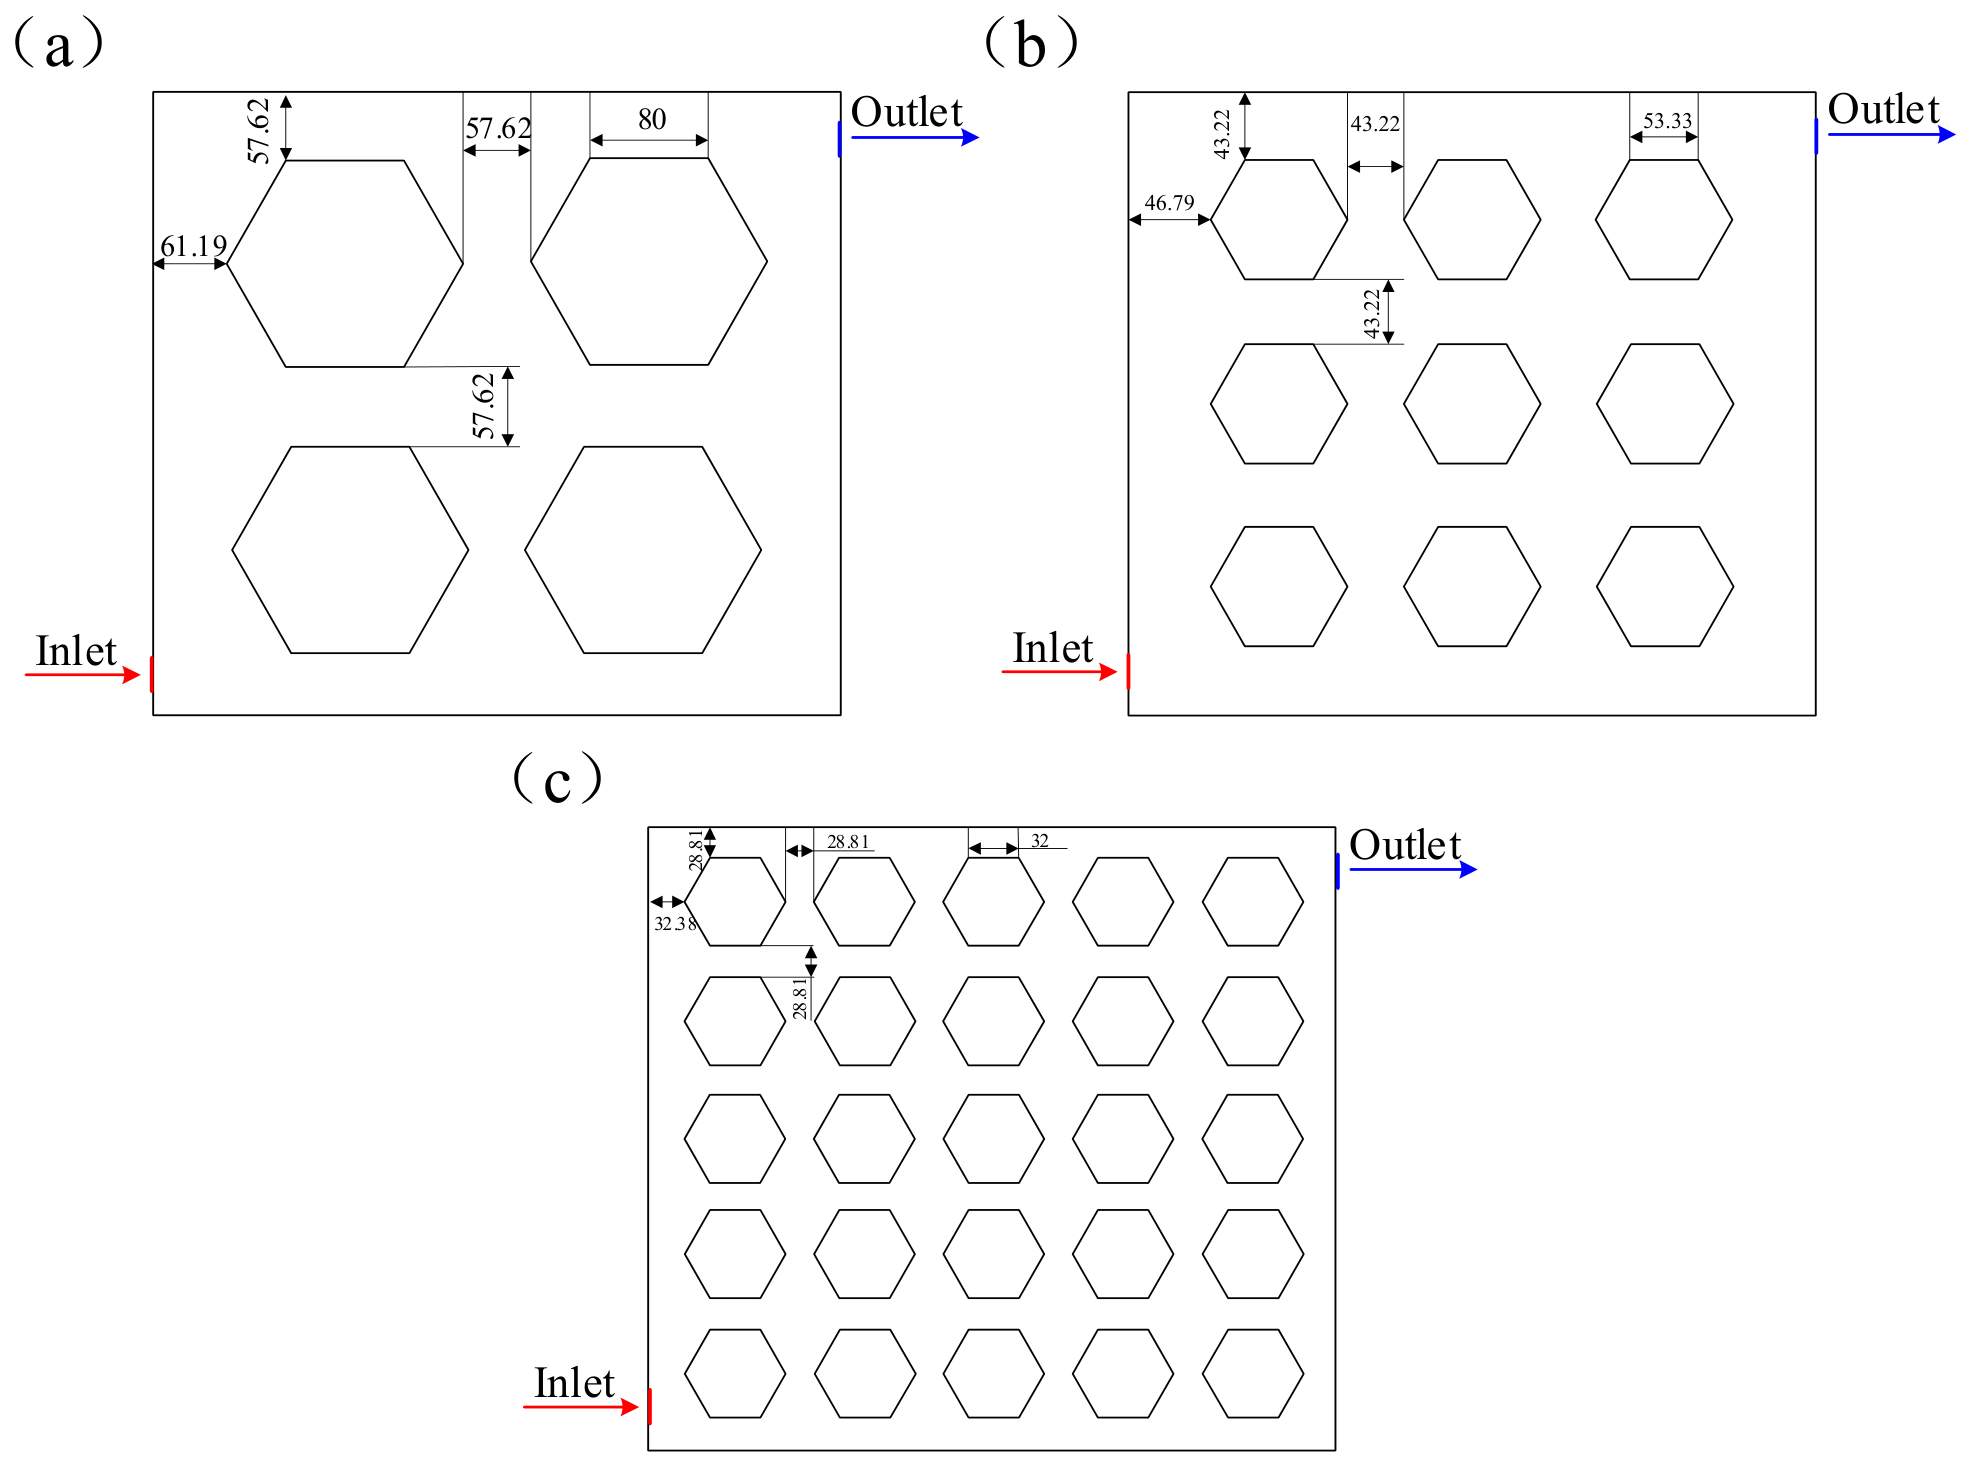
Four honeycomb configurations containing 4, 9, 16, and 25 hexagonal PCM cells are considered. To maintain a nearly constant PCM inventory, the side lengths of the hexagonal cells are set to 80.00, 53.33, 40.00, and 32.00 mm for the 4-, 9-, 16-, and 25-cell configurations, respectively. Thus, the hexagonal side length of 40 mm applies only to the 16-cell configuration. All honeycomb cells have an axial length of 400 mm. The tank volume is 0.0900 m
3. The common PCM cross-sectional area is approximately 0.06651 m
2, giving a solid PCM volume of approximately 0.02660 m
3. Accordingly, solid PCM occupies approximately 29.56% of the internal tank volume. To isolate the effect of cell number, the total PCM inventory is maintained nearly constant. Each configuration contains approximately 0.02660 m
3 of solid PCM, corresponding to a mass of approximately 26.34 kg. The three-dimensional physical model of the 9-cell honeycomb phase-change unit is shown in
Figure 1.
Figure 2 illustrates the two-dimensional geometric configurations and corresponding dimensions of the three units. The 29.56% value is not an independently optimized PCM filling fraction. It follows directly from the constant-inventory geometric criterion. For every configuration, the total PCM cross-sectional area is A
PCM = N(3√3/2)a
2 ≈ 0.06651 m
2, while the tank cross-sectional area is A
tank = 0.500 × 0.450 = 0.225 m
2. Therefore, the PCM volume fraction is φ
PCM = A
PCM/A
tank = 0.06651/0.225 = 29.56%.
2.2. Modeling Scheme
The proposed honeycomb PCM unit is intended for low-temperature clean energy heating and hot water thermal storage systems, particularly solar-assisted heating applications. During periods of excess thermal energy supply, the heat transfer fluid transfers heat to the encapsulated PCM. The stored thermal energy is subsequently released when solar input is unavailable or when the instantaneous heating demand exceeds the output of the heat source.
RT54HC (Rubitherm Technologies GmbH, Berlin, Germany) is selected as the thermal storage material because its phase change temperature is suitable for low-temperature hot water storage applications. The thermophysical properties of RT54HC and the selected heat transfer fluids are summarized in
Table 2, and the thermophysical properties of water, ethylene glycol, and propylene glycol are obtained from the ANSYS2021 Fluent material database.
The effects of honeycomb cell number, HTF inlet temperature, inlet velocity, and HTF type are investigated. The cell number is selected as a geometric factor because subdividing the PCM into different numbers of honeycomb cells changes the heat transfer area, the characteristic heat transfer distance, and the distribution of the HTF passages. Because the total PCM inventory remains nearly constant, the comparison among the 4-, 9-, 16-, and 25-cell configurations primarily reflects the influence of honeycomb subdivision rather than differences in PCM quantity.
The HTF inlet temperature is investigated because it directly determines the temperature difference between the HTF and the PCM and therefore affects the thermal driving force during the charging process. The investigated inlet temperature range of 338–348 K represents low-temperature hot water charging conditions in clean energy heating and solar-assisted thermal storage systems. The inlet velocity is also considered because it affects the convective heat transfer coefficient, the heat transfer rate between the HTF and the honeycomb walls, and the pumping requirement of the system.
Water, ethylene glycol, and propylene glycol are selected as representative HTFs for low-temperature heating and thermal storage applications. Water serves as the reference fluid because of its favorable heat transfer properties. Ethylene glycol and propylene glycol represent glycol-based HTFs that provide freeze protection in cold environment applications. Moreover, the three fluids exhibit distinct differences in density, thermal conductivity, specific heat capacity, and dynamic viscosity. Their comparison therefore enables the influence of HTF thermophysical properties on the charging behavior of the honeycomb PCM unit to be evaluated and clarifies whether the use of glycol-based HTFs causes a substantial reduction in thermal storage performance compared with water. The simulation scheme is shown in
Table 3.
2.3. Mathematical Model
The following simplifications are made:
(1) Liquid phase PCM and HTF are incompressible Newtonian fluids, and the natural convection of liquid PCM adopts the Boussinesq hypothesis.
(2) The volume change associated with the solid–liquid phase transition is neglected.
(3) The wall thickness and thermal resistance of the phase change heat storage unit are ignored. The encapsulation wall is idealized as a zero-thickness thermally coupled interface. Accordingly, wall thermal resistance and wall heat capacity are not explicitly included. This simplification is introduced to isolate the effects of cell subdivision and HTF operating parameters while maintaining the same PCM inventory among the compared configurations. It should not be interpreted as evidence that the casing material has no physical influence. Finite wall thickness may enhance heat transfer while reducing the available PCM volume, and this trade-off is included in the limitations and future work discussion.
(4) Heat loss through the outer walls of the tank is neglected.
For HTF:
Energy equation:
where
t is time, s.
is the velocity vector, m/s.
is HTF density, kg/m
3.
, and
are specific heat, J/(kg·K), and thermal conductivity, W/(m·K) of HTF.
P and
T are pressure, Pa and temperature, K.
For PCM:
The liquid fraction is calculated as follows:
The specific enthalpy of the PCM is calculated as follows:
where
is PCM density, kg/m
3.
Ts and
Tl are the solidus and liquidus temperatures of the PCM, K.
αv is the thermal expansion coefficient, 1/K.
β is liquid fraction of PCM.
is the acceleration of gravity, m/s
2.
Tm is the reference temperature used in the Boussinesq approximation and is taken as the average phase change temperature of the PCM, 326.5 K.
Amush is a constant in the solid–liquid mushy zone, 10
5 kg/(m
3∙s).
ε is 0.001.
H is the specific enthalpy of PCM, J/kg.
href and
L are the specific enthalpy of PCM at reference temperature, J/kg, and latent heat of PCM, J/kg.
Tref is the reference temperature, K.
λPCM is the thermal conductivity of PCM, W/(m·K). The total specific enthalpy of the PCM is expressed as the sum of the sensible enthalpy and latent heat. Because a constant specific heat capacity is adopted, the sensible enthalpy term can be simplified to
.
The outer rectangular walls of the storage tank are assumed to be adiabatic in order to neglect heat loss to the ambient environment and focus on the internal charging process:
The PCM–HTF interfaces are not adiabatic. They are treated as zero-thickness coupled thermal boundaries satisfying temperature continuity and heat flux conservation. At the zero-thickness thermally coupled PCM–HTF interface, the local temperature and normal heat flux are continuous:
where
THTF is the local HTF temperature, K.
TPCM is the temperature of the area of the cellular heat storage unit, K.
T0 is the initial temperature, 298 K. The inlet of the honeycomb phase change unit is defined as a velocity inlet, while the outlet is treated as a pressure outlet. The
Γ denotes the PCM–HTF interface and
n is the common unit normal direction. The temperature-continuity condition applies only to the local interface temperatures and does not imply equality between the bulk HTF temperature and the internal PCM temperature.
2.4. Model Verification
The two-dimensional CFD solver adopts the standard k-ε turbulence model. Pressure-velocity coupling is handled using the SIMPLE algorithm, and the mass, momentum and energy equations are discretized with a second-order upwind scheme. The relaxation factors for momentum, pressure correction, energy and melting fraction are kept at their default values of 0.7, 0.3, 1 and 0.6, respectively. The PCM and HTF regions are defined as separate computational domains sharing a conformal interface. Because the encapsulation wall thickness and thermal resistance are neglected, the interface is represented as a zero-thickness coupled thermal boundary. Temperature continuity and heat flux conservation are imposed across the interface, and no mass transfer is permitted. Phase change occurs only within the PCM domains and is modeled using the enthalpy–porosity method.
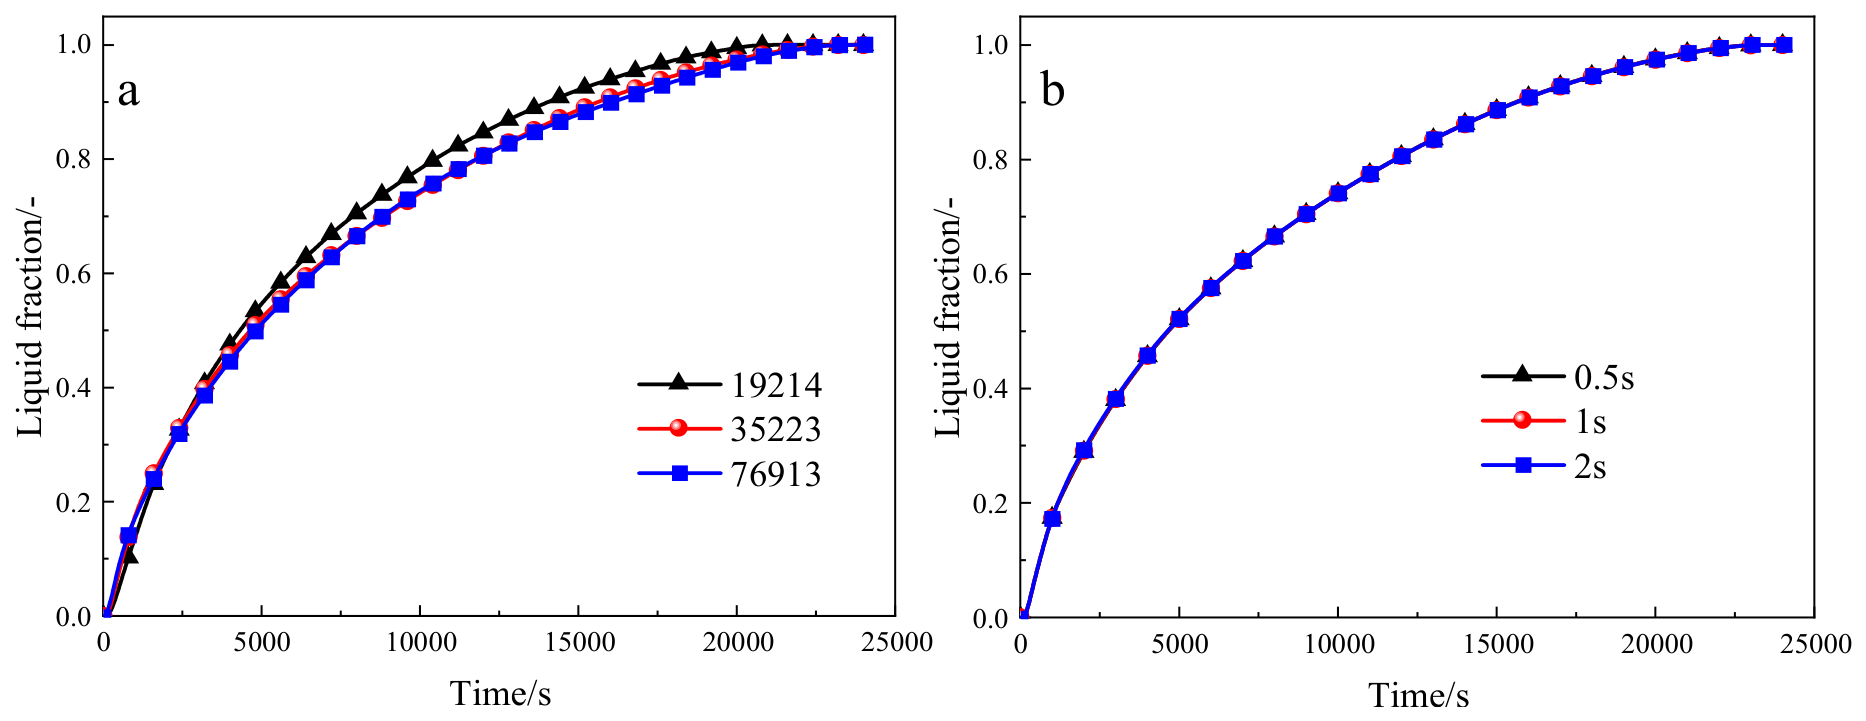
A hybrid mesh is employed in the numerical simulations. The HTF region is discretized using structured quadrilateral cells, whereas the PCM domains are discretized using unstructured triangular cells to conform to the hexagonal boundaries and facilitate local refinement. The mesh is locally refined near the PCM–HTF interfaces to resolve the relatively large temperature gradients during phase change. Grid independence analysis is conducted using meshes containing 19,214, 35,223, and 76,913 cells, and time step independence is examined using time steps of 0.5, 1, and 2 s. As shown in
Figure 3, further mesh refinement to 76,913 cells produces negligible changes in the results. Considering both accuracy and computational cost, the final simulations use 76,913 grid cells and a time step of 1 s. The minimum orthogonal quality and maximum aspect ratio of the final mesh are 0.467 and 4.35, respectively. A fully quadrilateral mesh inside every PCM cell would require block partitioning of each hexagon into several subdomains. For the present comparison of 4–25 cells, such partitioning would introduce configuration-dependent internal block lines and substantially increase preprocessing complexity. The unstructured triangular PCM mesh was therefore retained to conform to the hexagonal interfaces and support uniform local refinement; its adequacy is demonstrated by the reported mesh-independence results and mesh-quality indices.
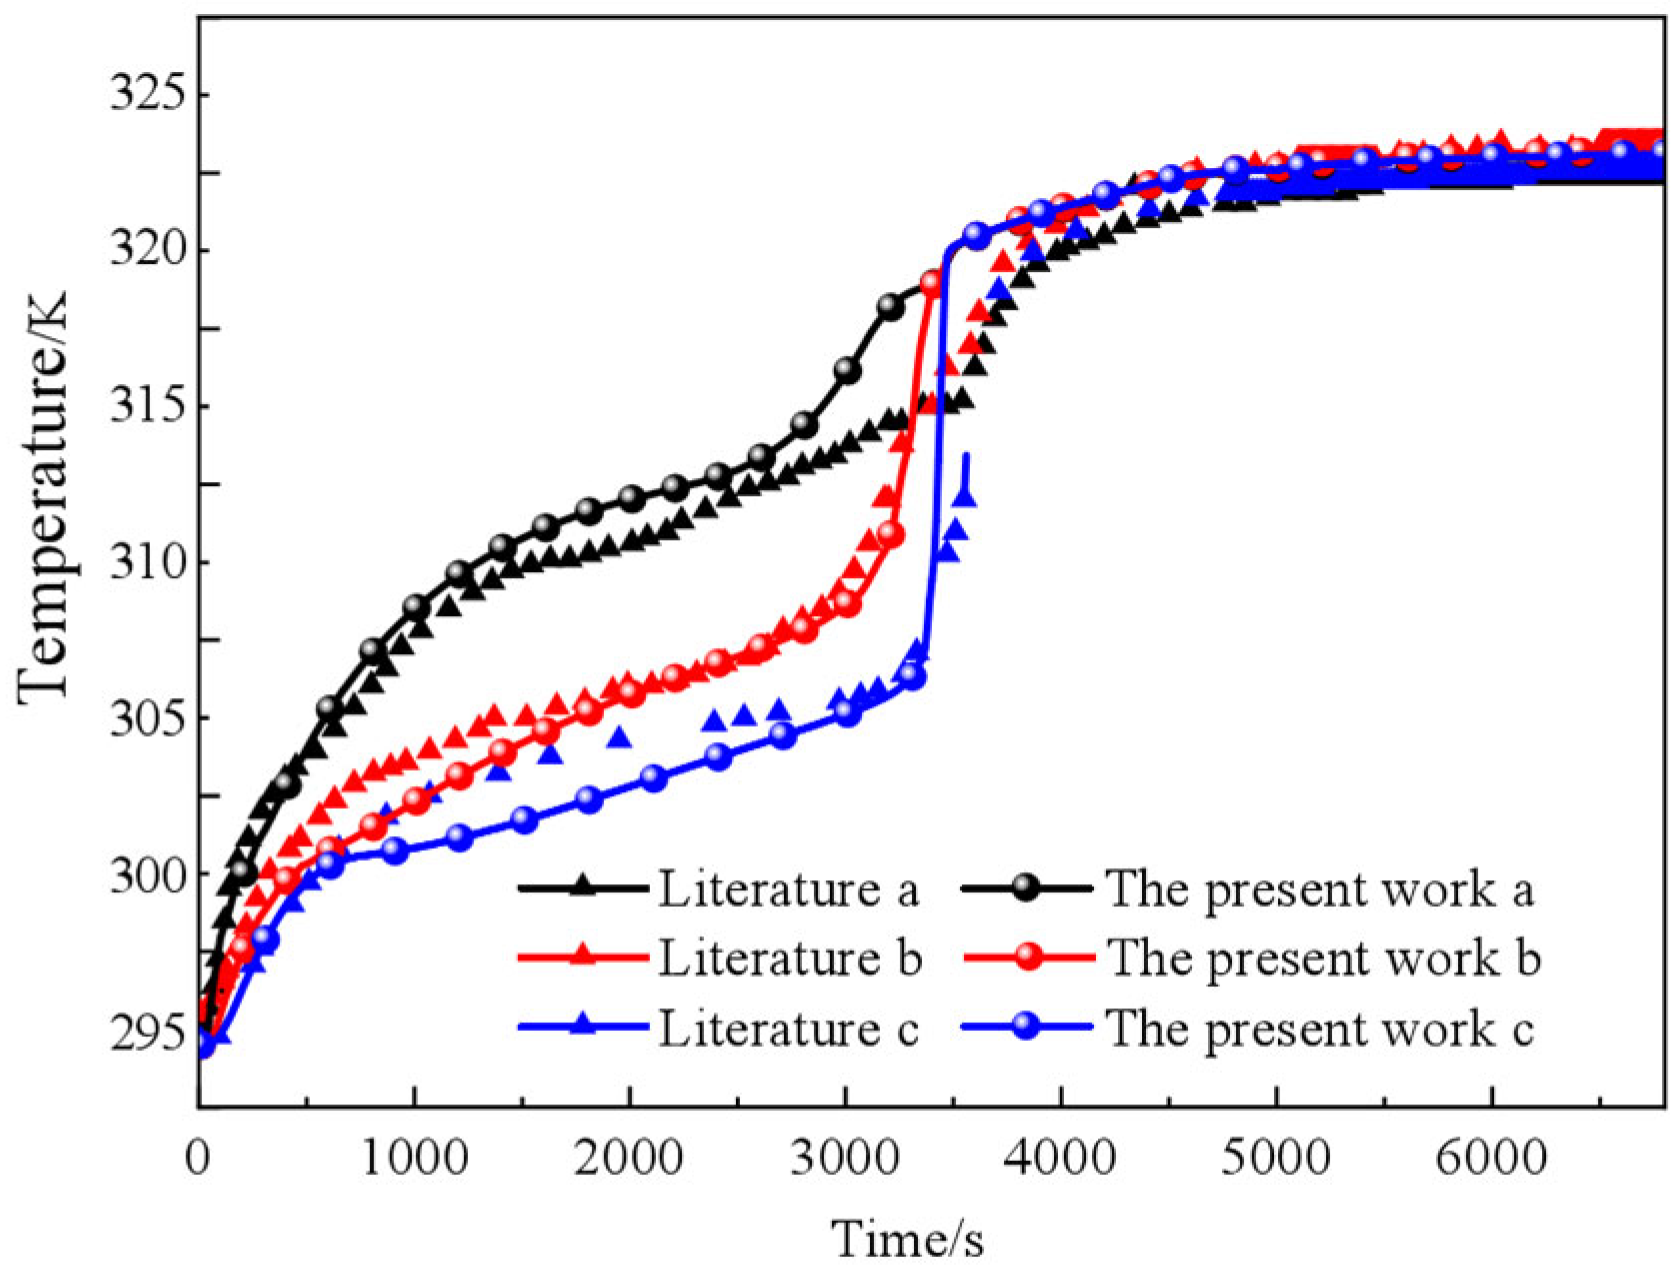
Figure 4 compares the present numerical predictions with the experimental temperature data reported by Longeon et al. [
35] for annular PCM melting in the presence of natural convection. This verification case is selected because it includes the same dominant physical mechanisms considered in the present model, namely heat conduction, latent heat absorption, buoyancy-driven flow in the molten PCM, and solid–liquid interface evolution. The purpose of this experiment is to verify whether the mathematical model proposed in the article is reasonable; it is not presented as a material-specific verification of RT54HC. Labels a, b, and c denote the three radial temperature-monitoring positions in section D of the experimental unit, located approximately 3, 6, and 9 mm from the HTF tube, respectively. The adequacy of the present simplification is evaluated against experimental data: the overall RMSE, R
2, and MAPE are 1.240 K, 0.9725, and 1.876%, respectively. This discrepancy is mainly associated with differences in boundary and material treatments: in the experiment, ambient temperature and PCM thermophysical properties vary with time, whereas the simulation uses a constant ambient temperature of 298 K and constant PCM specific heat and thermal conductivity. Constant mean values are adopted because the objective is a controlled comparison of structural and operating parameters and complete temperature-dependent RT54HC data are unavailable. A similar treatment has been used in previous honeycomb PCM simulations [
32,
33].
3. Results and Discussion
3.1. The Effect of Cell Number
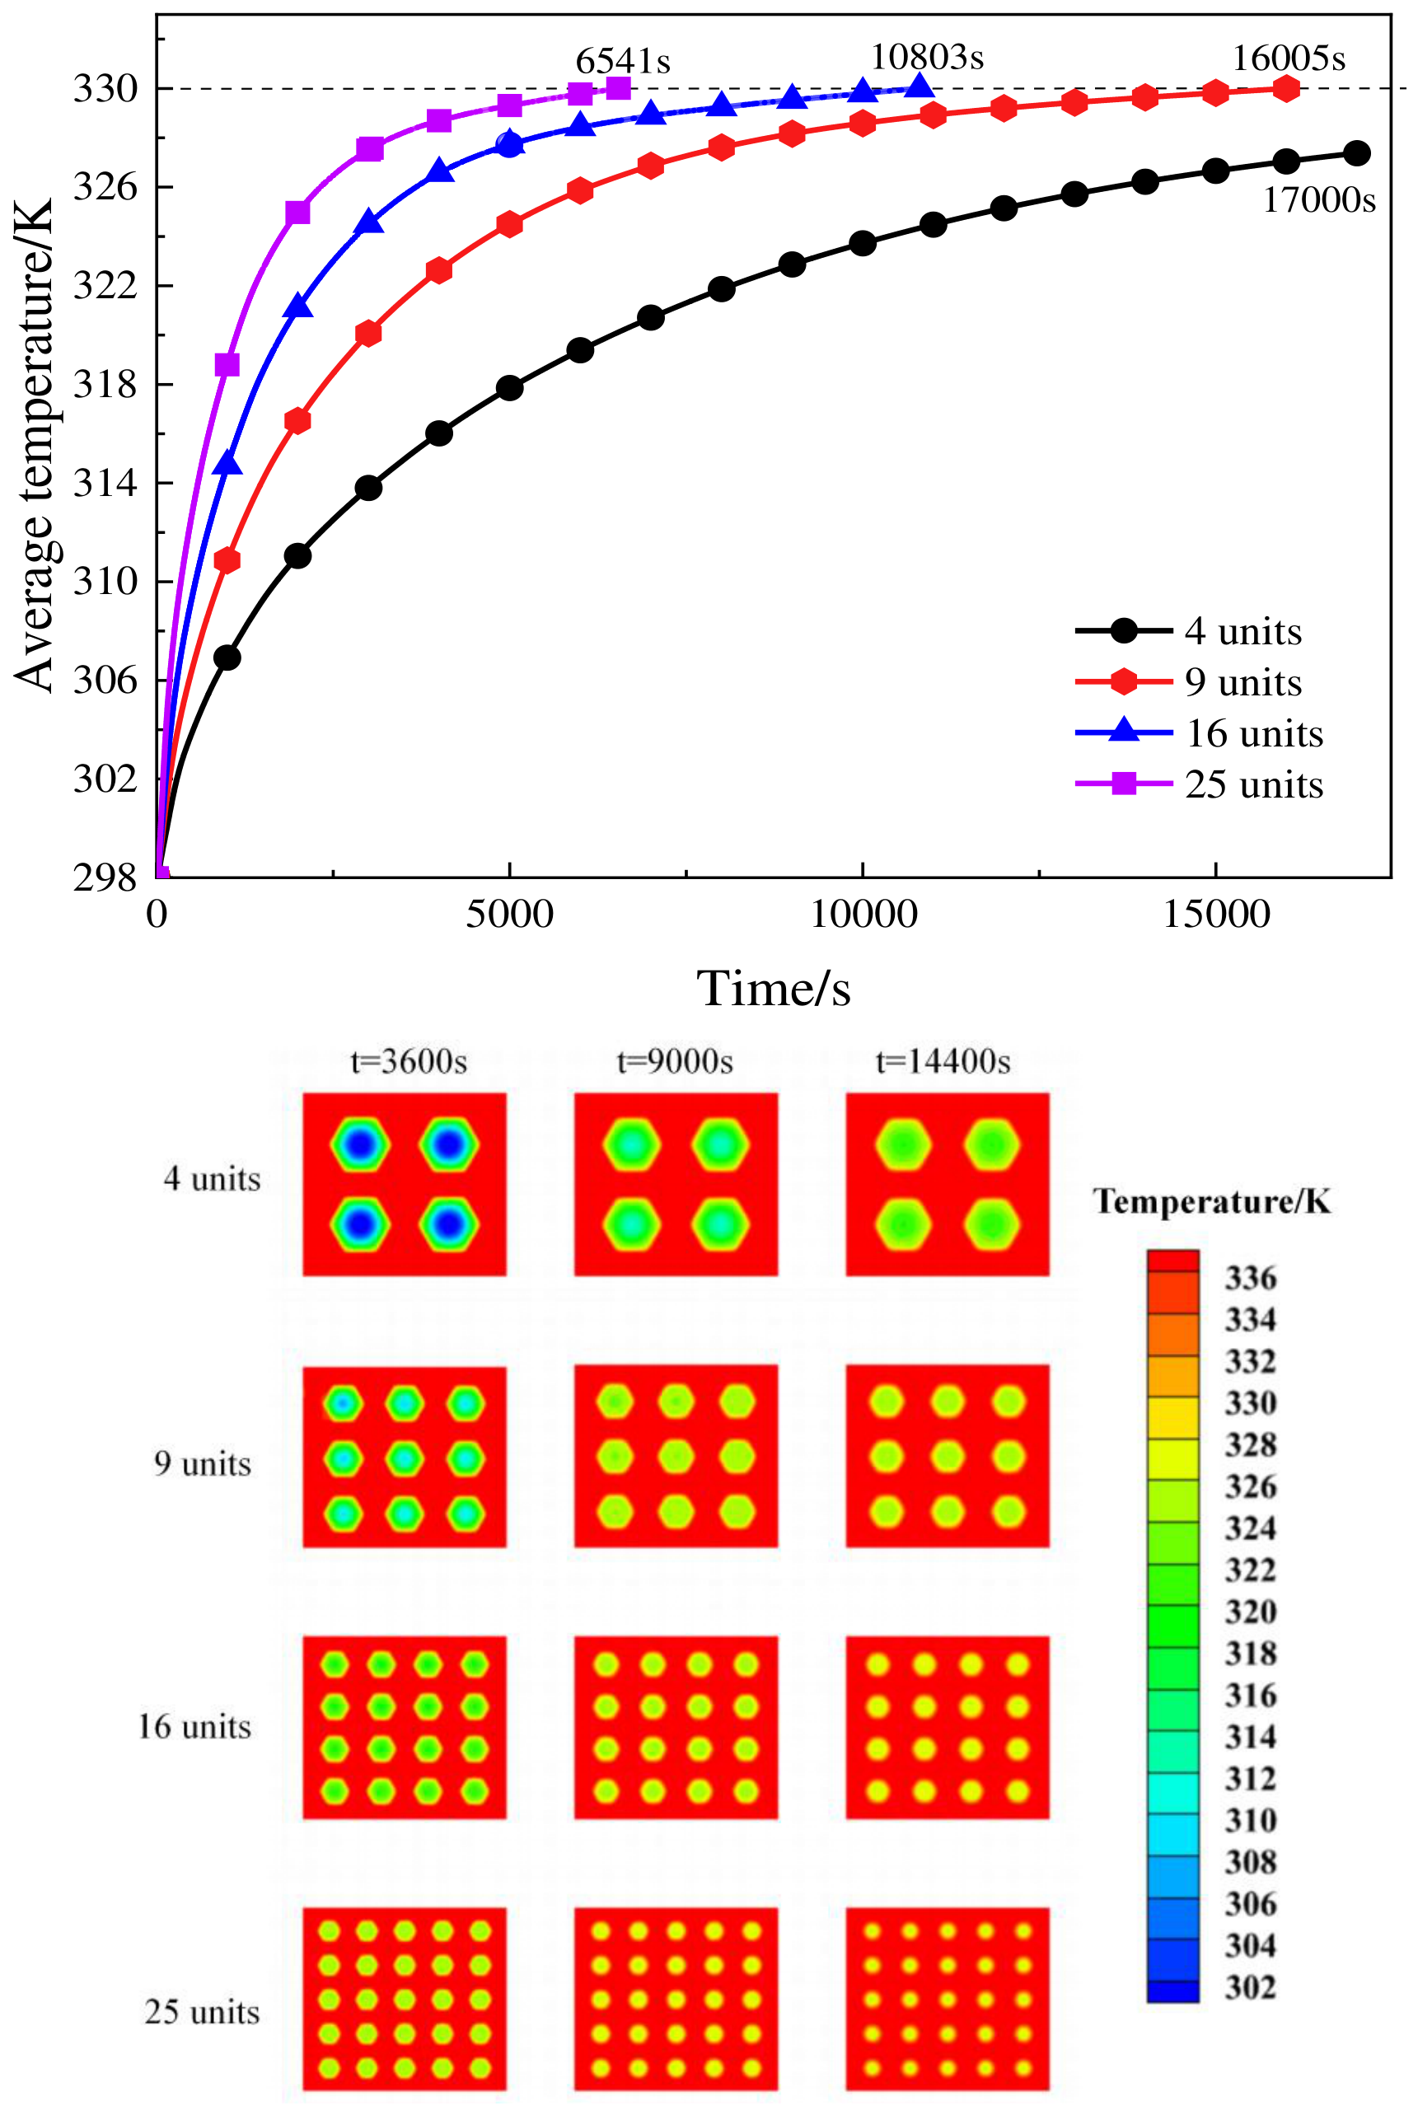
Figure 5 compares the transient average PCM temperatures and temperature contours of the 4-, 9-, 16-, and 25-cell configurations. Increasing the cell number accelerates the temperature rise, although the incremental improvement gradually decreases. The 4-cell unit requires 31,117 s for the average PCM temperature to reach 330 K, whereas the 9-, 16-, and 25-cell units require 16,005, 10,803, and 6541 s, respectively. These values correspond to time reductions of 48.6%, 65.3%, and 79.0% relative to the 4-cell unit. The contours at t = 3600, 9000, and 14,400 s further show that increasing the number of cells reduces the characteristic heat transfer distance and promotes a more uniform temperature distribution.
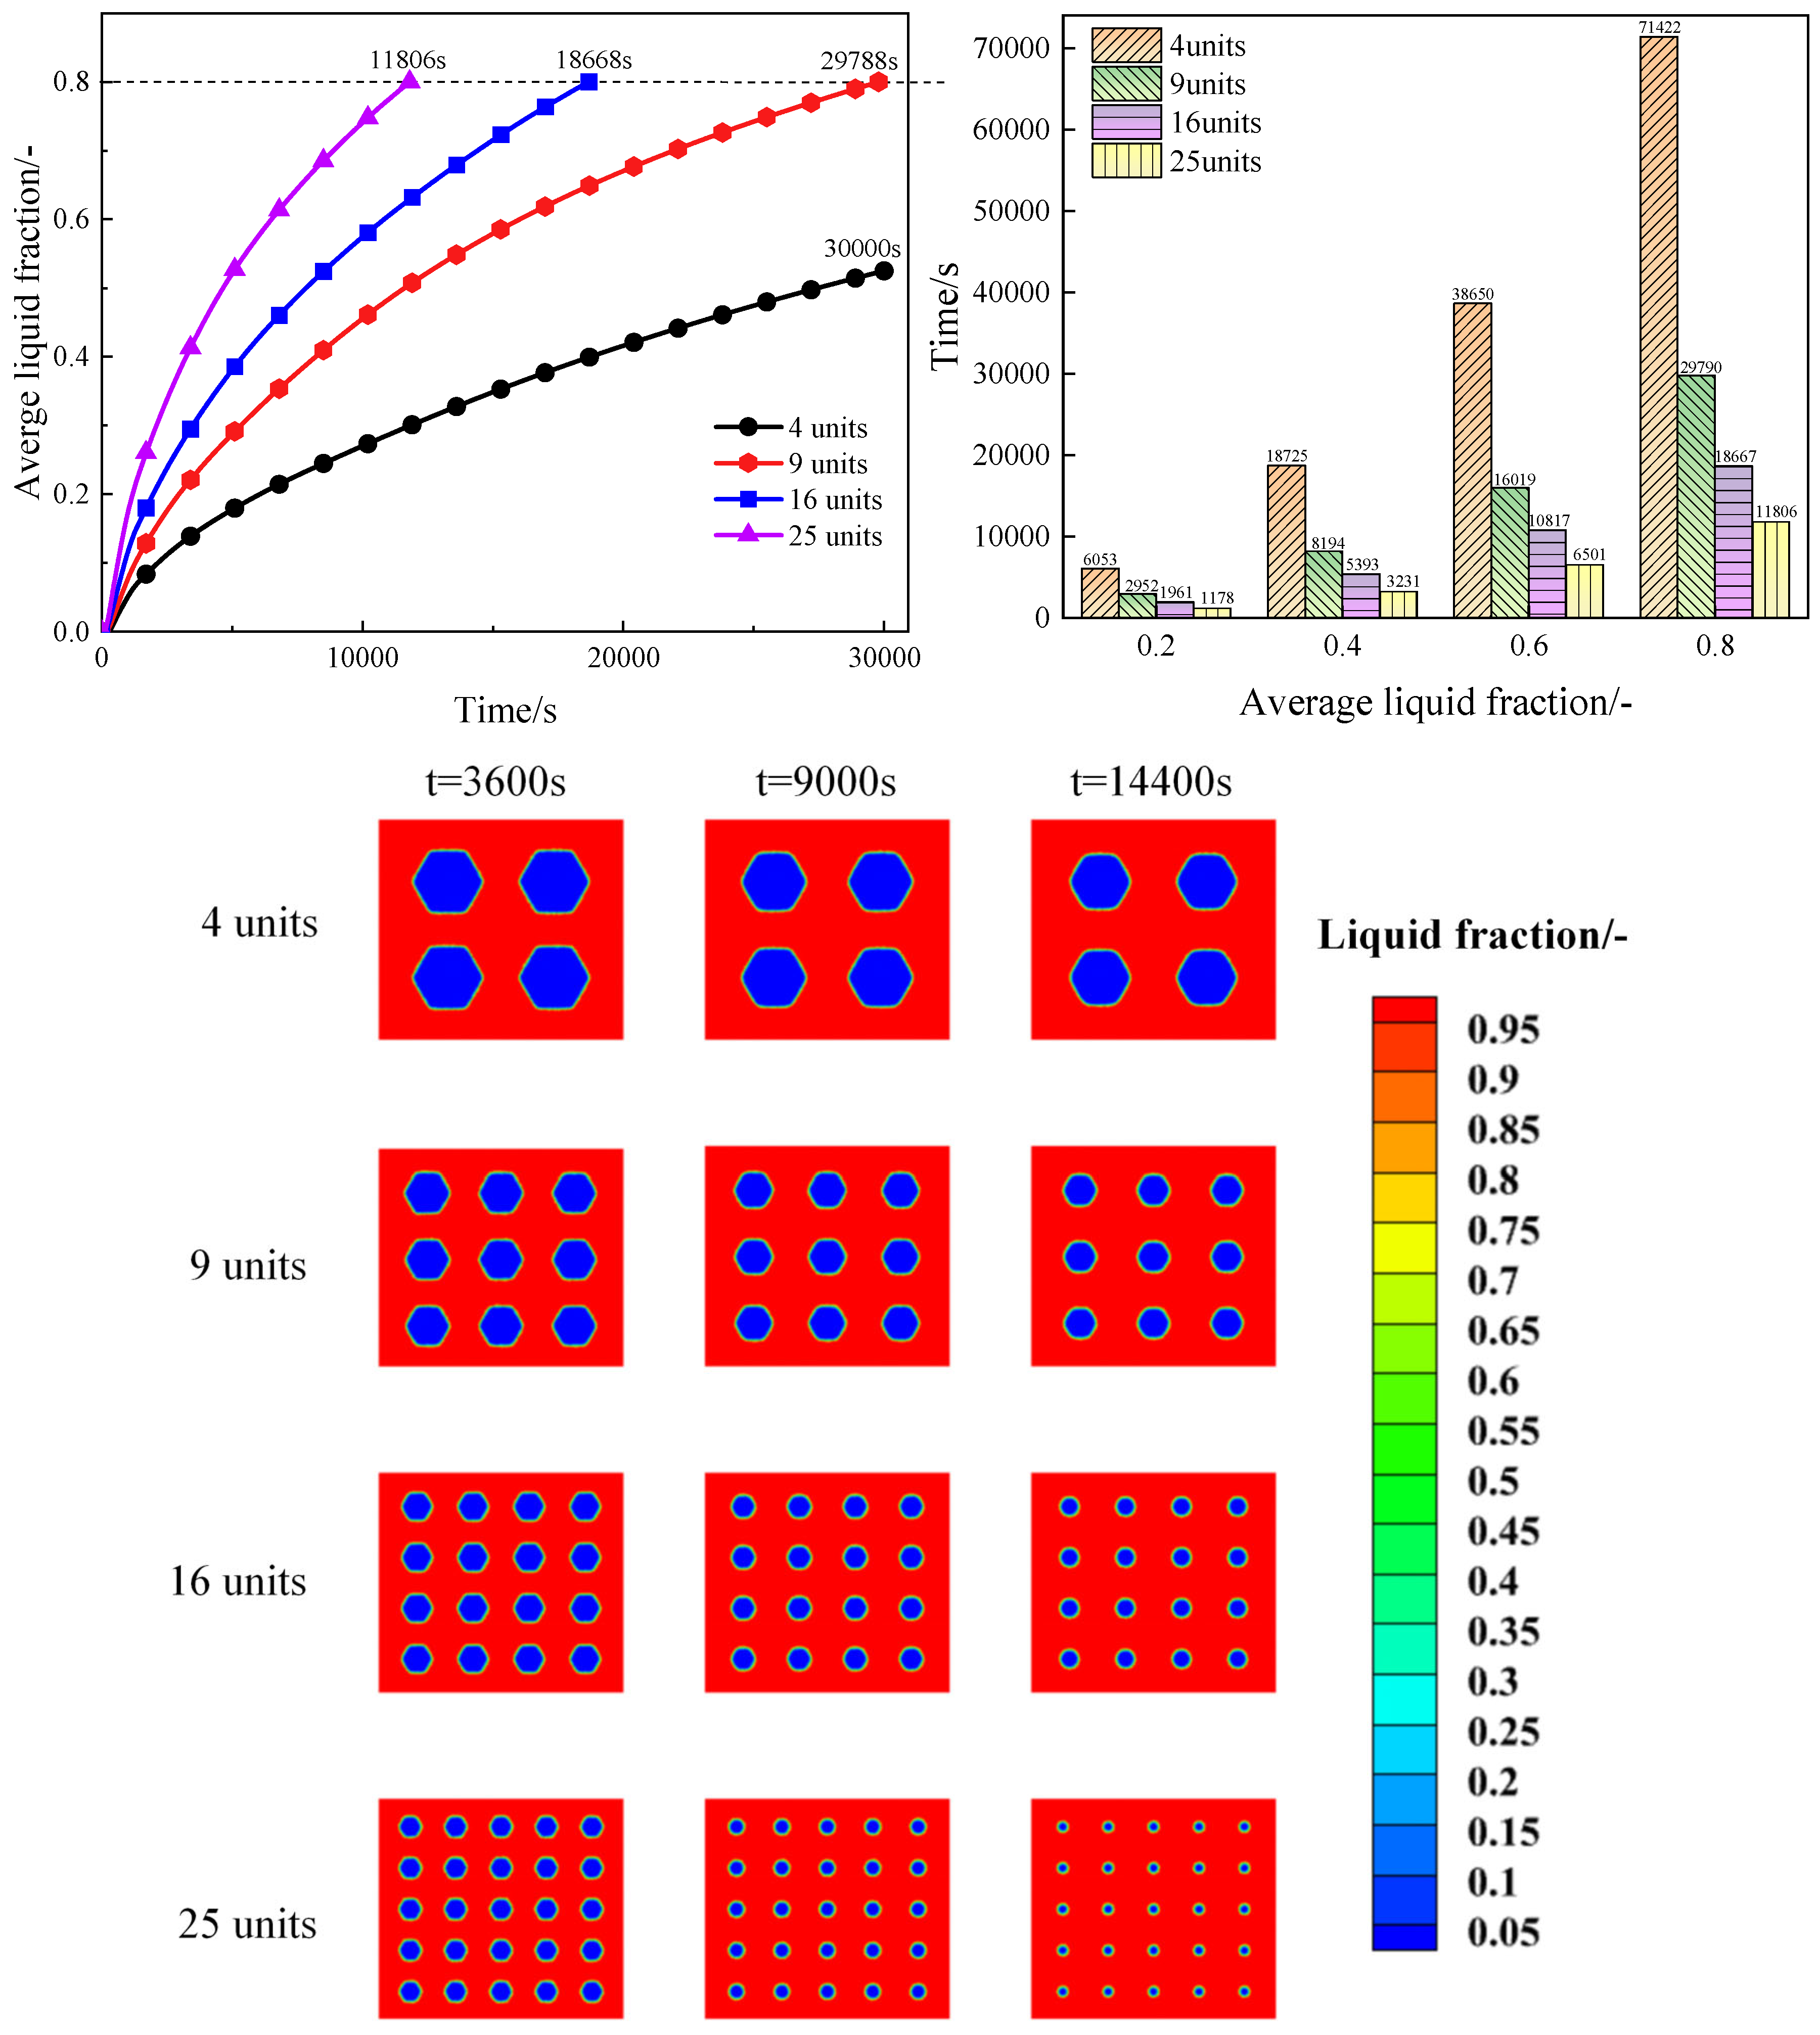
The progression of phase change aligns closely with the overall thermal response, as captured by the average liquid fraction histories and spatial melting patterns in
Figure 6. To reach an average PCM liquid fraction of 0.8, the 4-, 9-, 16-, and 25-cell units require 71,423 s, 29,788 s, 18,668 s, and 11,806 s, respectively. Relative to the 4-cell benchmark, subdividing the PCM into 9, 16, and 25 cells shortens the time to reach an 80% melt fraction by 58.3%, 73.9%, and 83.5%. Physically, this acceleration stems from two synergistic mechanisms: enlarging the effective heat transfer area per unit volume accelerates interfacial heat flux, while establishing smaller interstitial fluid pathways reduces stagnant flow zones, thereby lowering local convective thermal resistance.
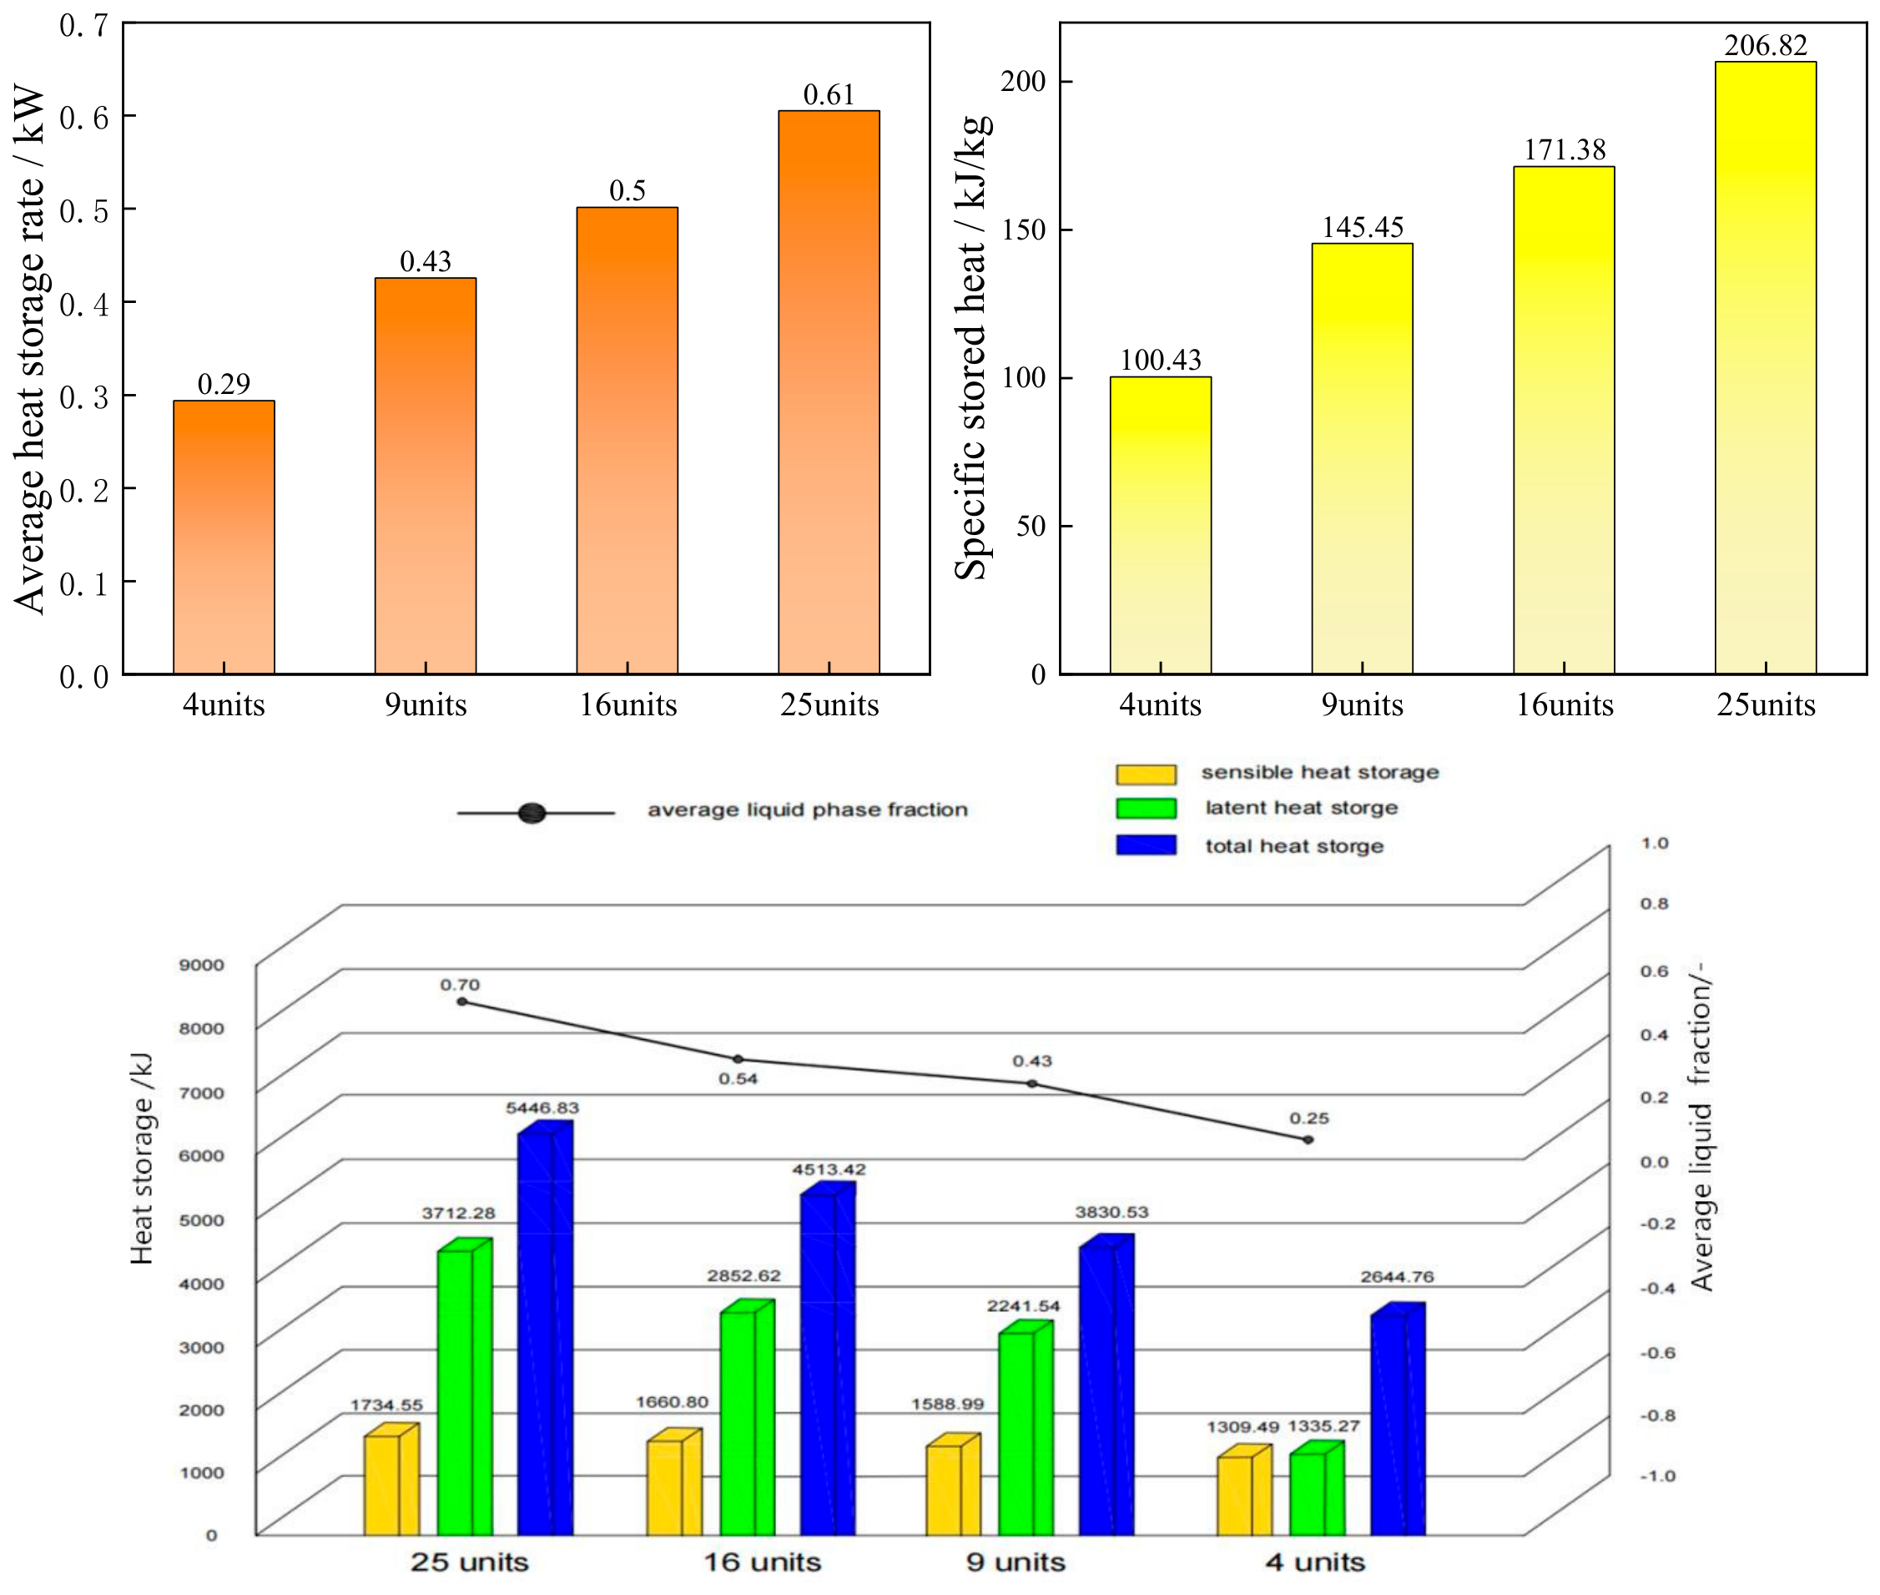
Figure 7 summarizes the charging performance at t = 9000 s. Because the PCM inventory is maintained nearly constant among the four configurations, the differences reported here represent the heat accumulated within the prescribed charging period rather than differences in the theoretical maximum storage capacity. In the following analysis, the average heat storage rate is calculated as the total stored heat accumulated over the first 9000 s divided by the charging time, while the specific stored heat is calculated as the total stored heat divided by the PCM mass. The average heat storage rates of the 4-, 9-, 16-, and 25-cell units are 0.29, 0.43, 0.50, and 0.61 kW, respectively, and the corresponding specific stored heats are 100.43, 145.45, 171.38, and 206.82 kJ/kg. The accumulated sensible heat/latent heat/total stored heat values are 1309.49/1335.27/2644.76 kJ, 1588.99/2241.54/3830.53 kJ, 1660.80/2852.62/4513.42 kJ, and 1734.55/3712.28/5446.83 kJ, respectively. Compared with the 4-cell unit, the 25-cell configuration increases the accumulated sensible heat, latent heat, and total stored heat at t = 9000 s by 32.5%, 178.0%, and 106.0%, respectively. These results indicate that increasing the number of PCM cells substantially accelerates the utilization of both sensible and latent heat storage capacities within the prescribed charging period.
3.2. The Effect of Inlet Temperature
The HTF inlet temperature determines the temperature difference that drives heat transfer into the honeycomb PCM domains.
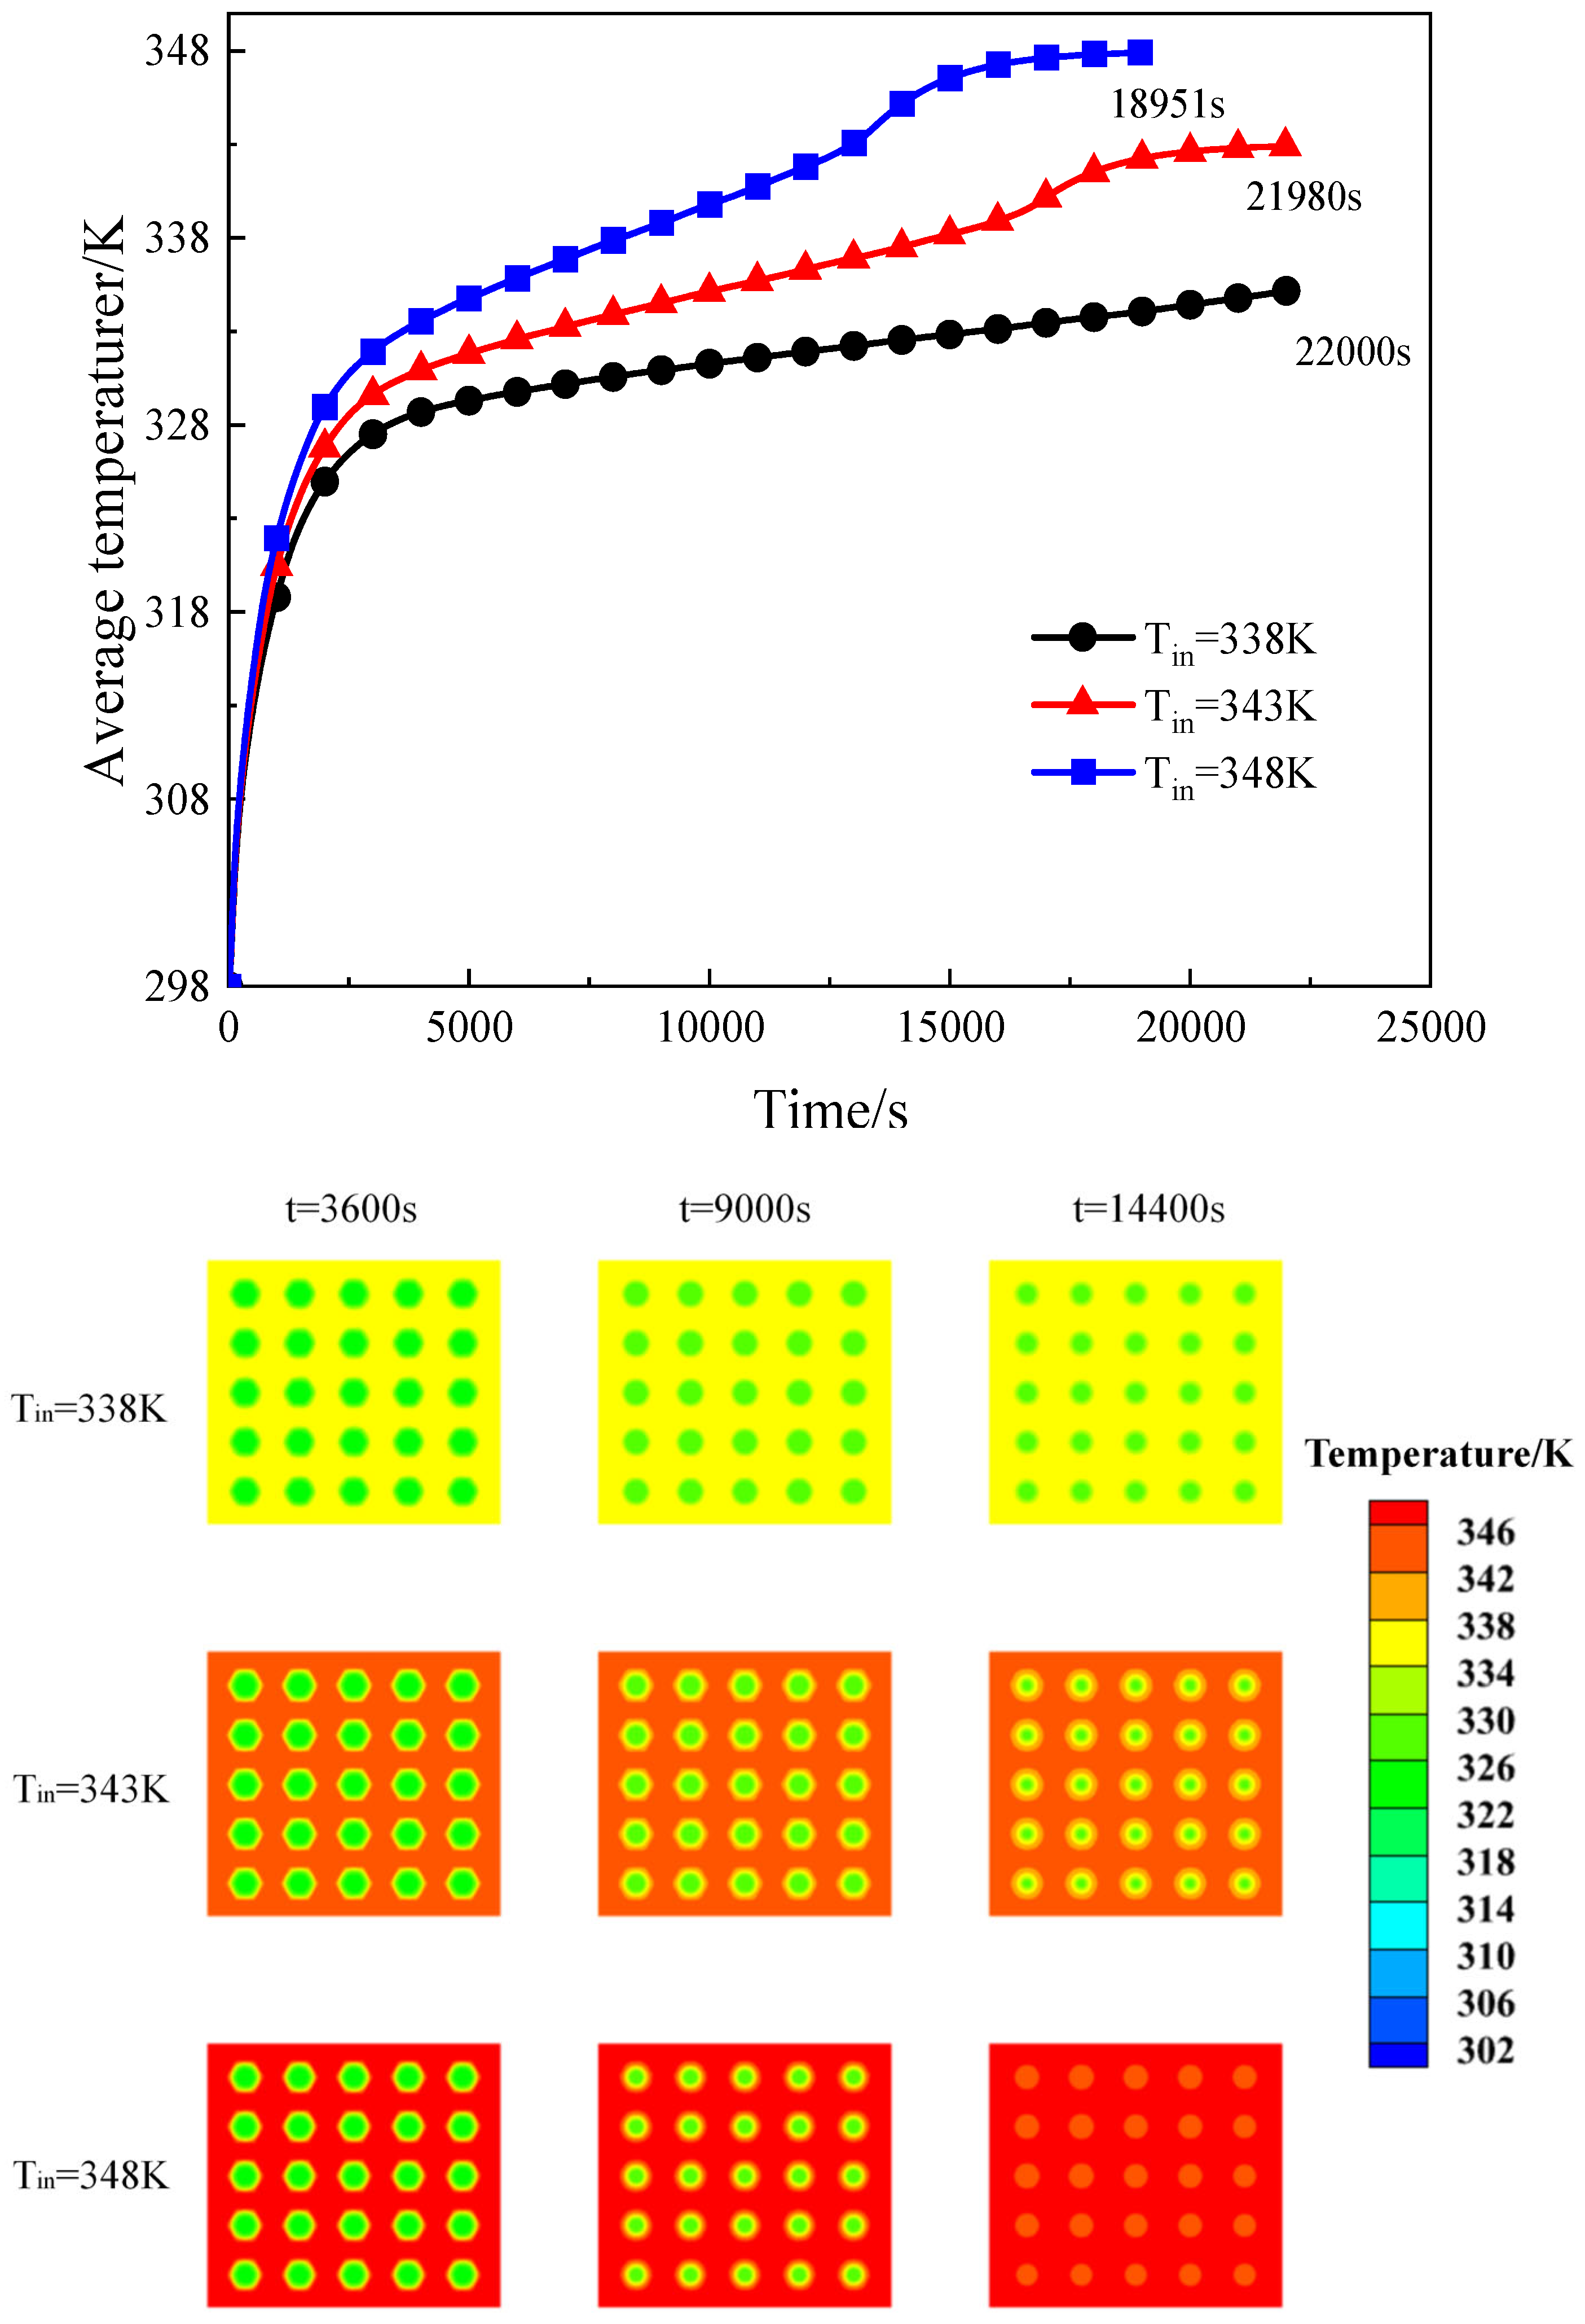
Figure 8 presents the transient PCM temperature histories and temperature contours at inlet temperatures of 338, 343, and 348 K. All three curves show an initial rapid sensible heating stage, a reduced-slope stage dominated by latent heat absorption during phase change, and a final sensible heating stage after melting. Increasing the inlet temperature from 338 K to 343 and 348 K reduces the time required for the average PCM temperature to approach the inlet temperature from 27,688 s to 21,980 and 18,951 s, corresponding to reductions of 20.6% and 31.6%, respectively.
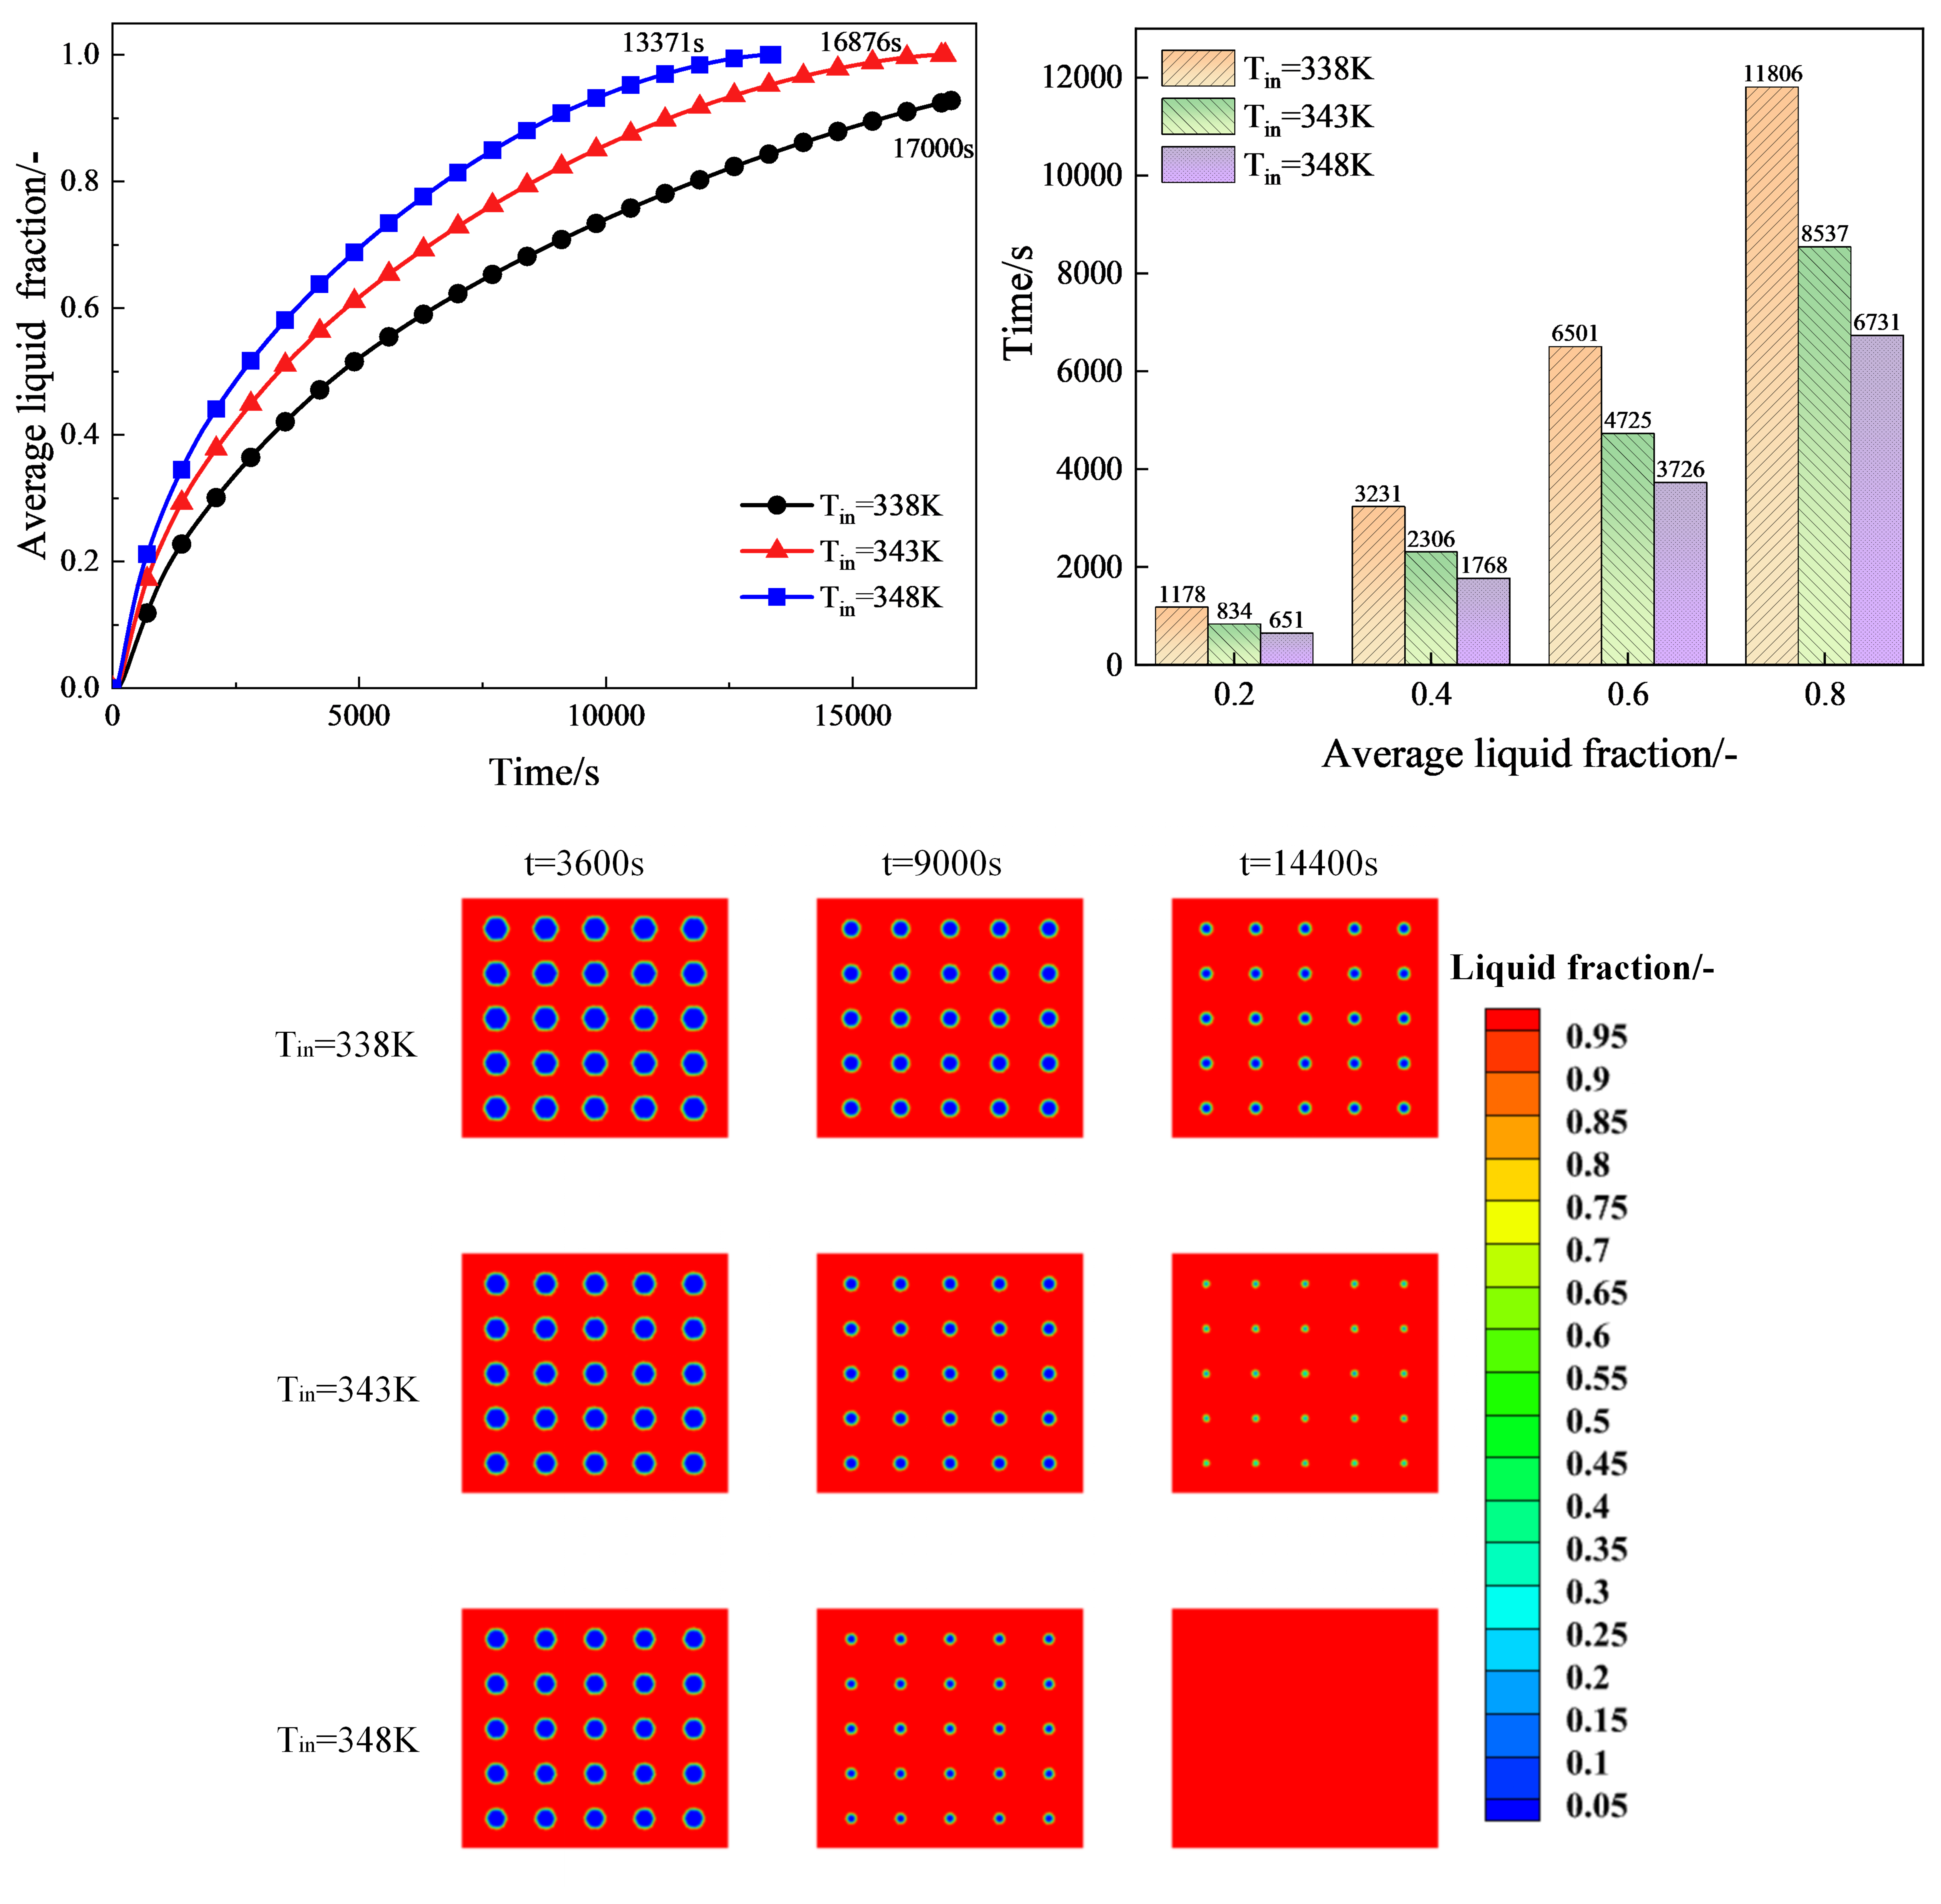
The corresponding phase change kinetics and liquid fraction contours are detailed in
Figure 9. Complete melting occurs at 23,236 s under an inlet temperature of 338 K. Raising the inlet temperature to 343 K and 348 K reduces the complete melting duration to 16,876 s and 13,371 s, corresponding to reductions of 27.4% and 42.5%. Similarly, the duration required to achieve an average liquid fraction of 0.8 decreases from 11,806 s (338 K) to 8537 s (343 K) and 6731 s (348 K), providing accelerations of 27.7% and 43.0%. Higher operational fluid temperatures broaden the local temperature gradient across the container wall, which intensifies conductive heat fluxes and enhances buoyancy-driven natural convection within the expanding melt layer. As seen in the contour sequences, while solid PCM cores persist in lower temperature cases at t = 14,400 s, full liquefaction is achieved at 348 K.
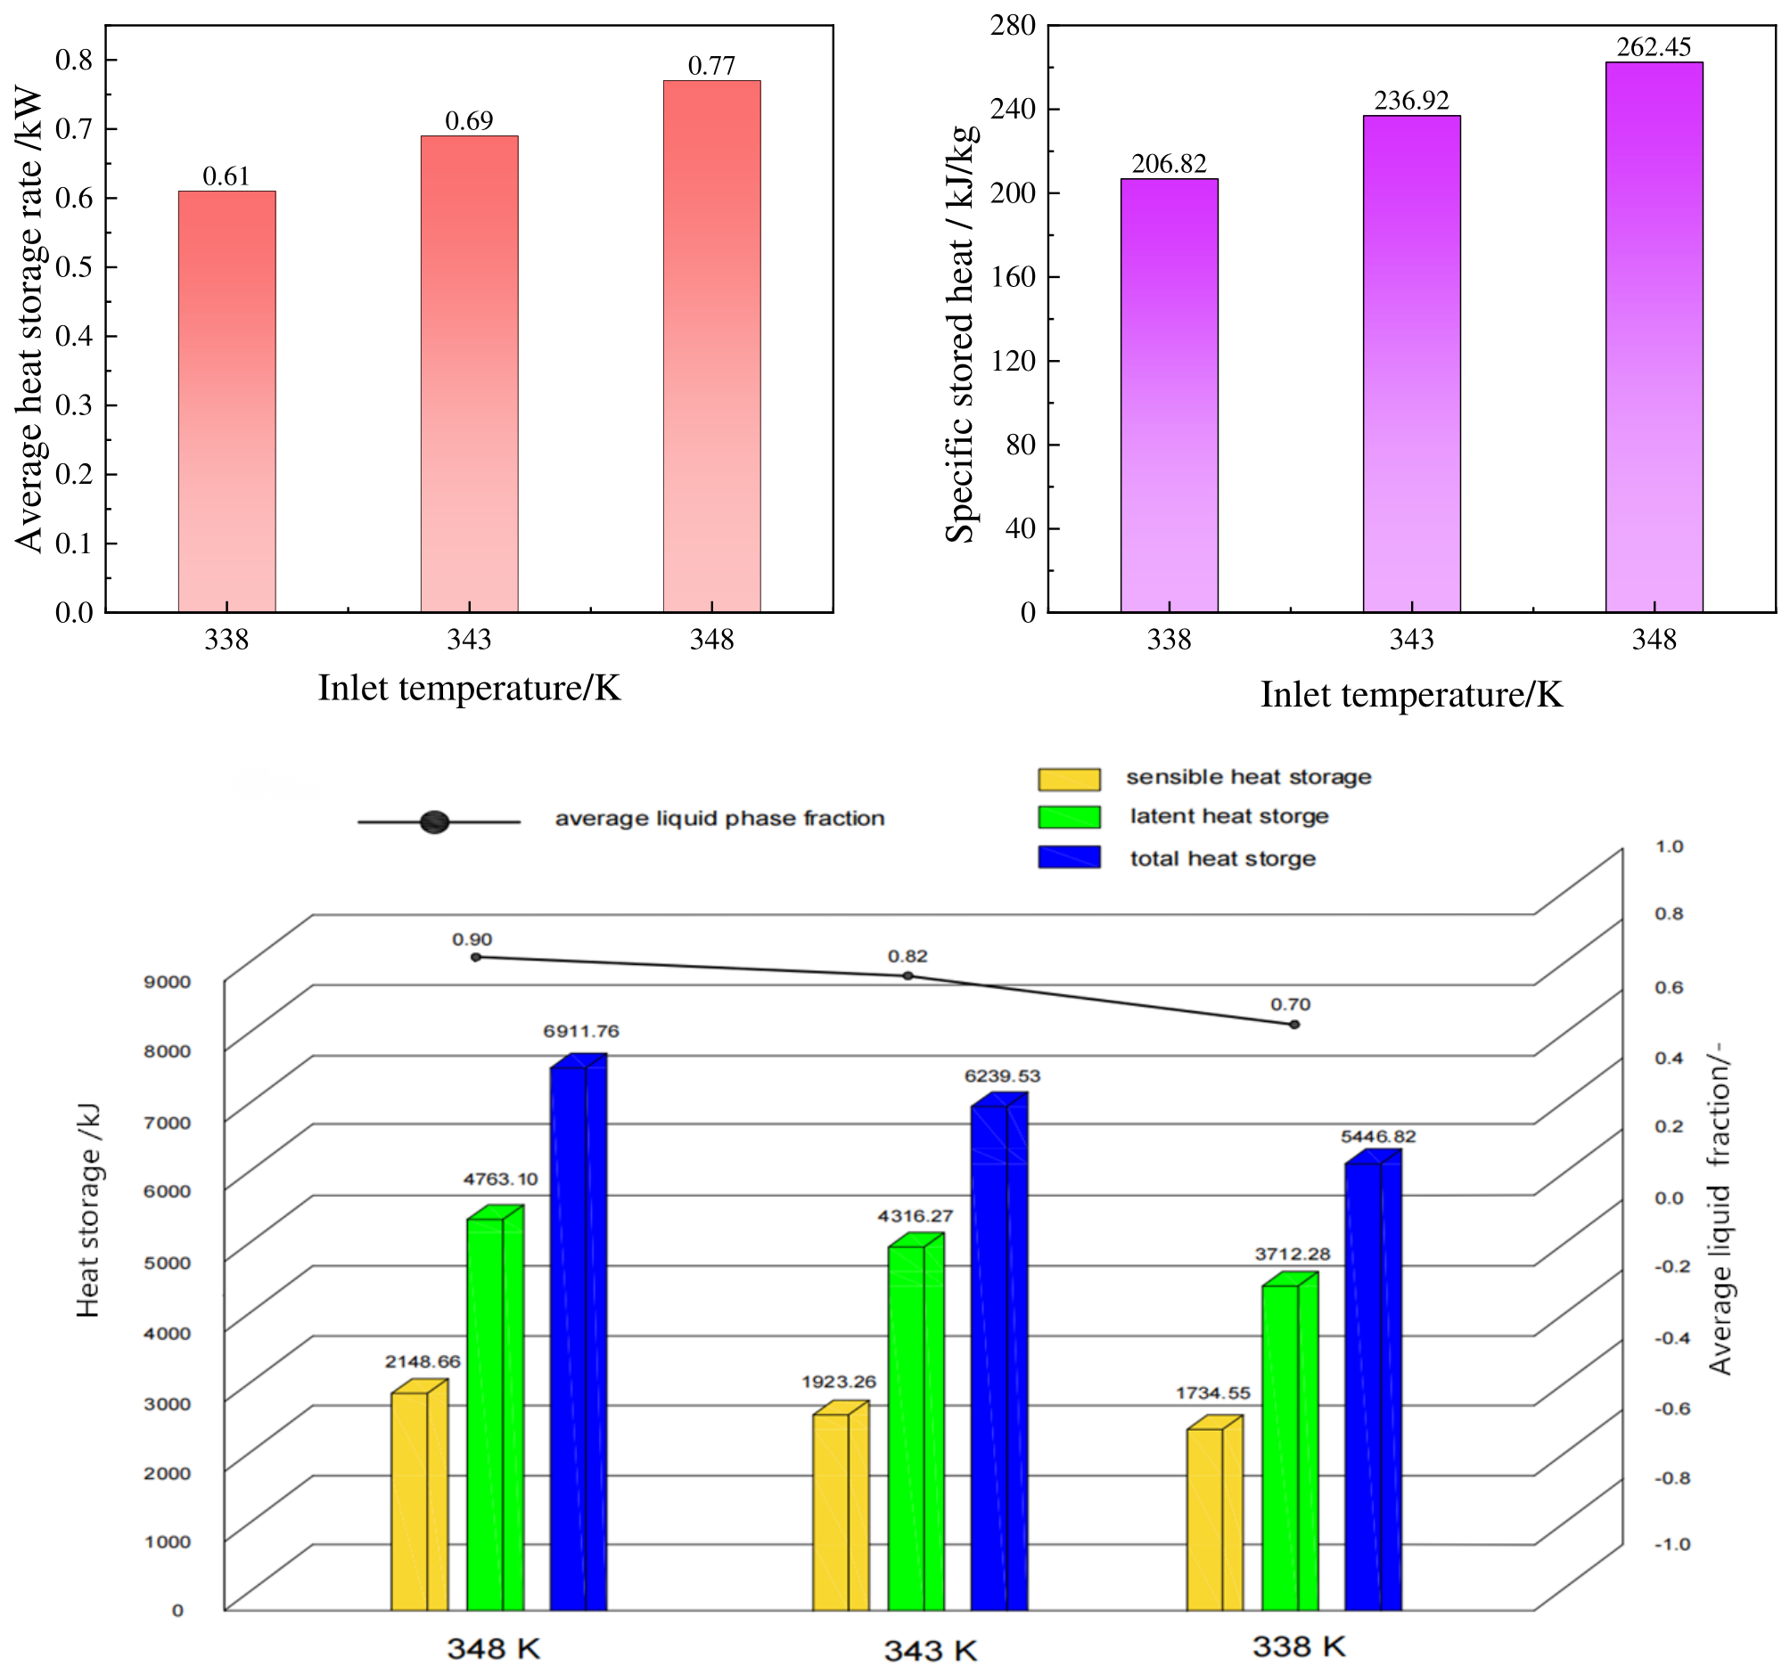
Figure 10 compares the charging performance at t = 9000 s. The average PCM liquid fraction increases from 0.70 at 338 K to 0.82 at 343 K and 0.90 at 348 K. The corresponding average heat storage rates over the first 9000 s are 0.605, 0.693, and 0.768 kW, while the specific stored heats are 206.82, 236.92, and 262.45 kJ/kg, respectively. At 338 K, the accumulated sensible heat and latent heat are 1734.55 and 3712.28 kJ, giving a total stored heat of 5446.82 kJ. Increasing the inlet temperature to 343 K raises these values to 1923.26, 4316.27, and 6239.53 kJ, whereas at 348 K they reach 2148.66, 4763.10, and 6911.76 kJ. Relative to 338 K, the accumulated sensible heat, accumulated latent heat, and total stored heat increase by 10.9%, 16.3%, and 14.6% at 343 K and by 23.9%, 28.3%, and 26.9% at 348 K. These increases represent greater heat accumulation within the fixed charging period rather than an increase in the theoretical maximum storage capacity of the PCM.
3.3. The Effect of Inlet Velocity
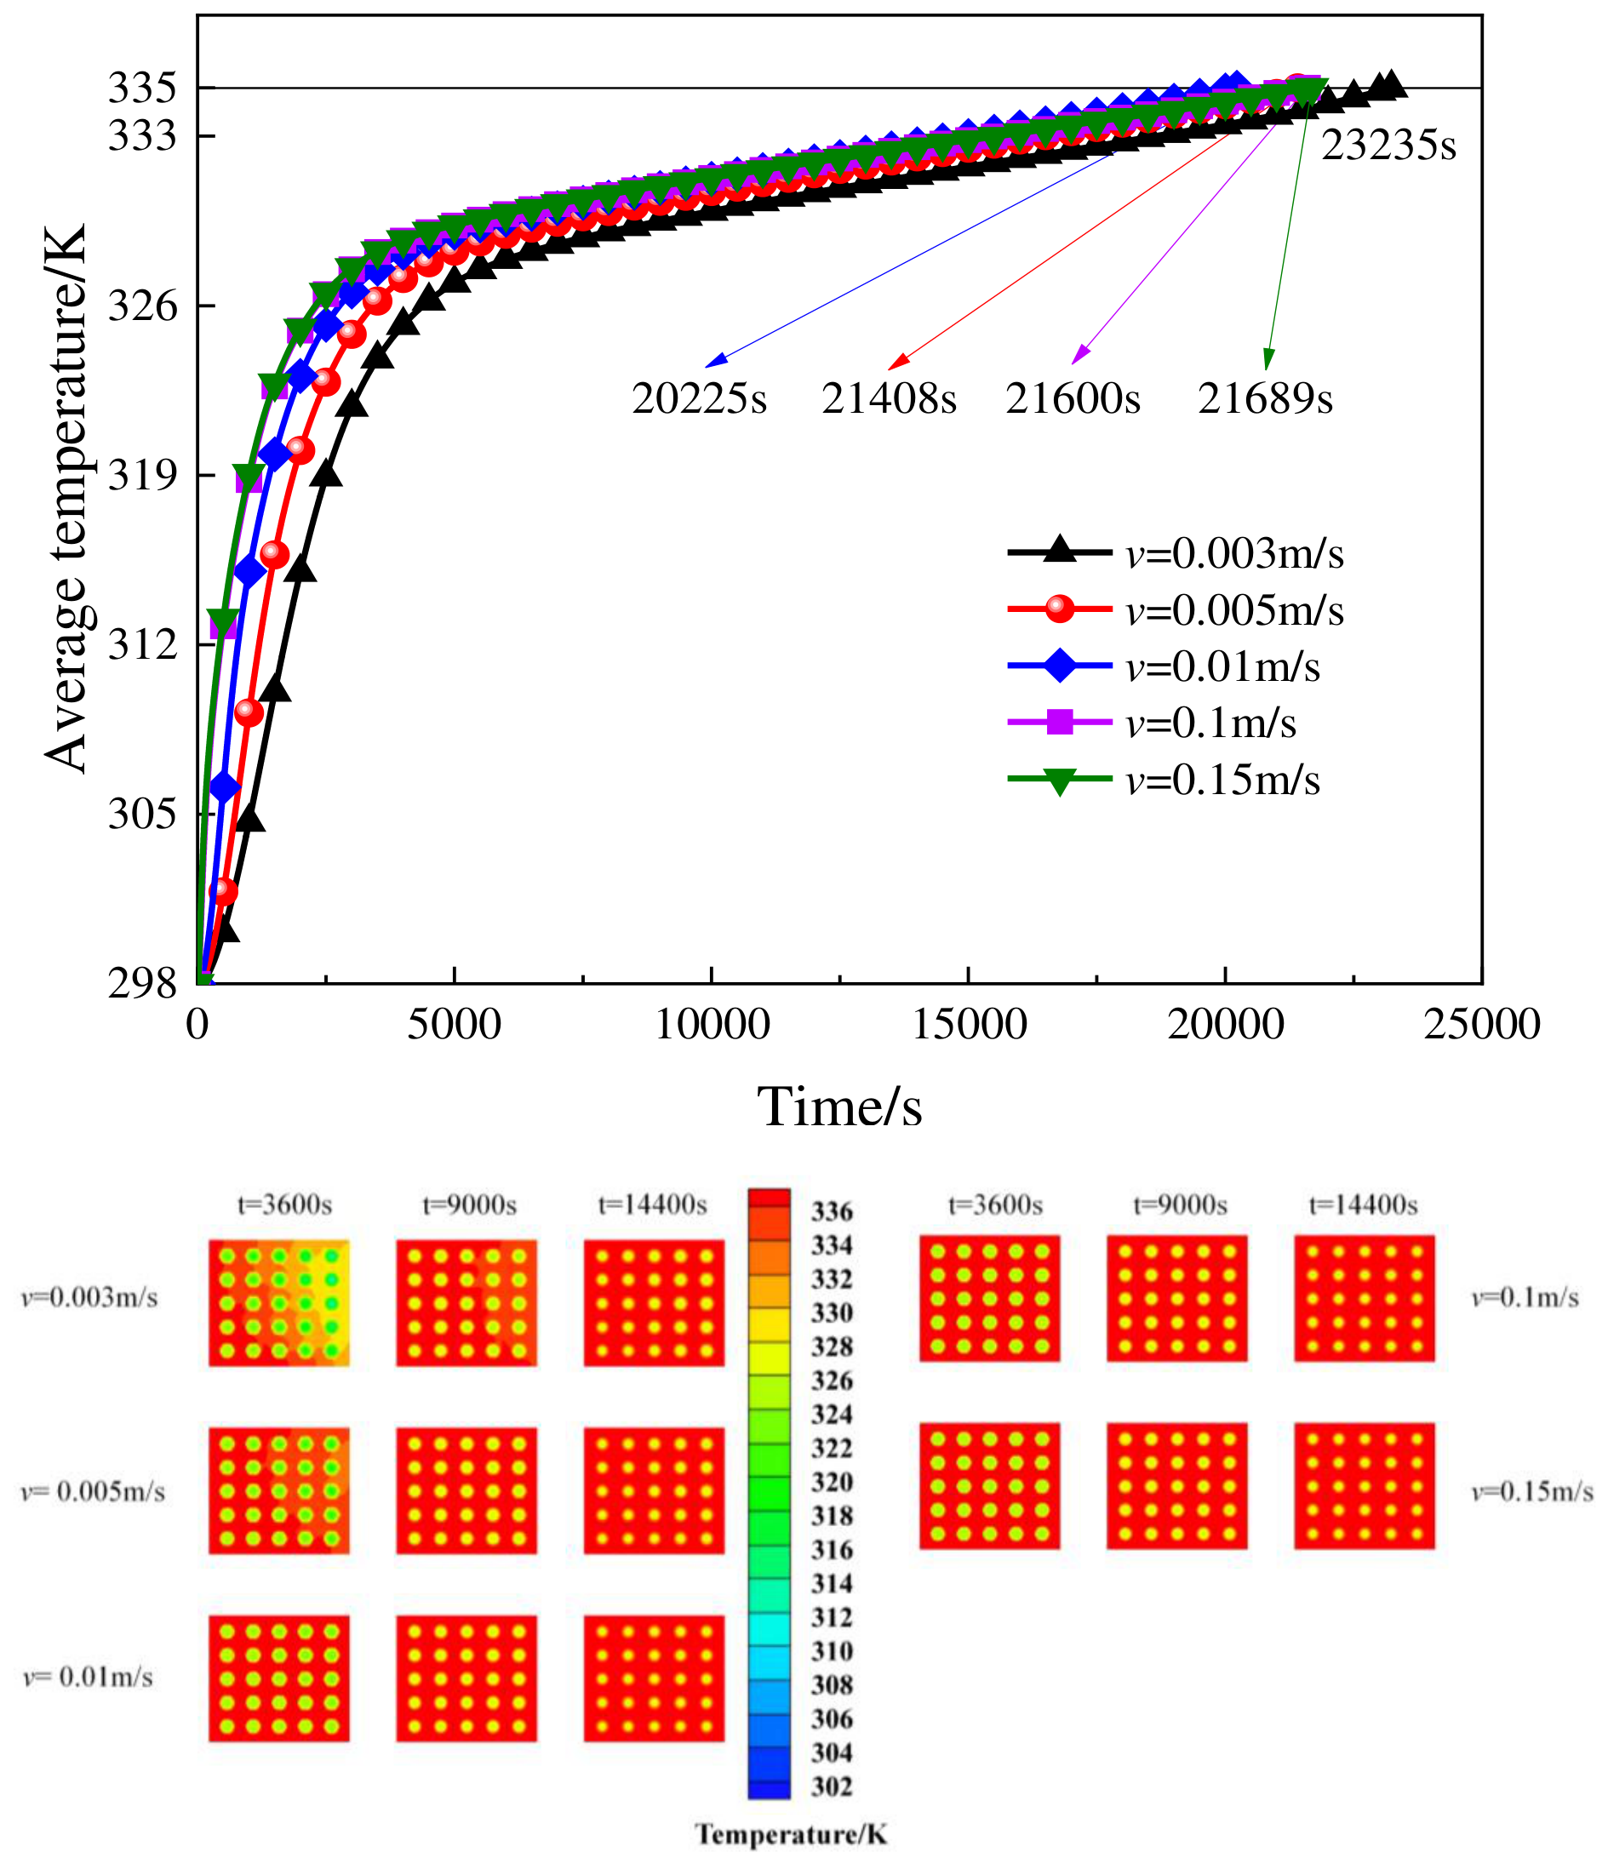
Figure 11 compares the average PCM temperature histories and temperature contours at inlet velocities from 0.003 to 0.15 m/s. Increasing the velocity from 0.003 to 0.005 and 0.01 m/s improves heat transfer, reducing the time required for the average PCM temperature to reach 335 K from 23,235 s to 21,408 and 20,225 s, respectively. These values correspond to reductions of 7.9% and 13.0%. However, this trend reverses when the velocity is increased beyond 0.01 m/s. Increasing the velocity from 0.01 to 0.1 m/s lengthens the heating time by 6.8%, and the 0.15 m/s case also provides no further improvement. Therefore, higher inlet velocity enhances charging only up to 0.01 m/s; further increases cause a slight deterioration rather than a plateau. This result suggests that, in the present unbaffled geometry, increasing the bulk velocity does not necessarily improve heat transfer uniformly throughout all PCM cells, possibly because of increasingly nonuniform HTF distribution.
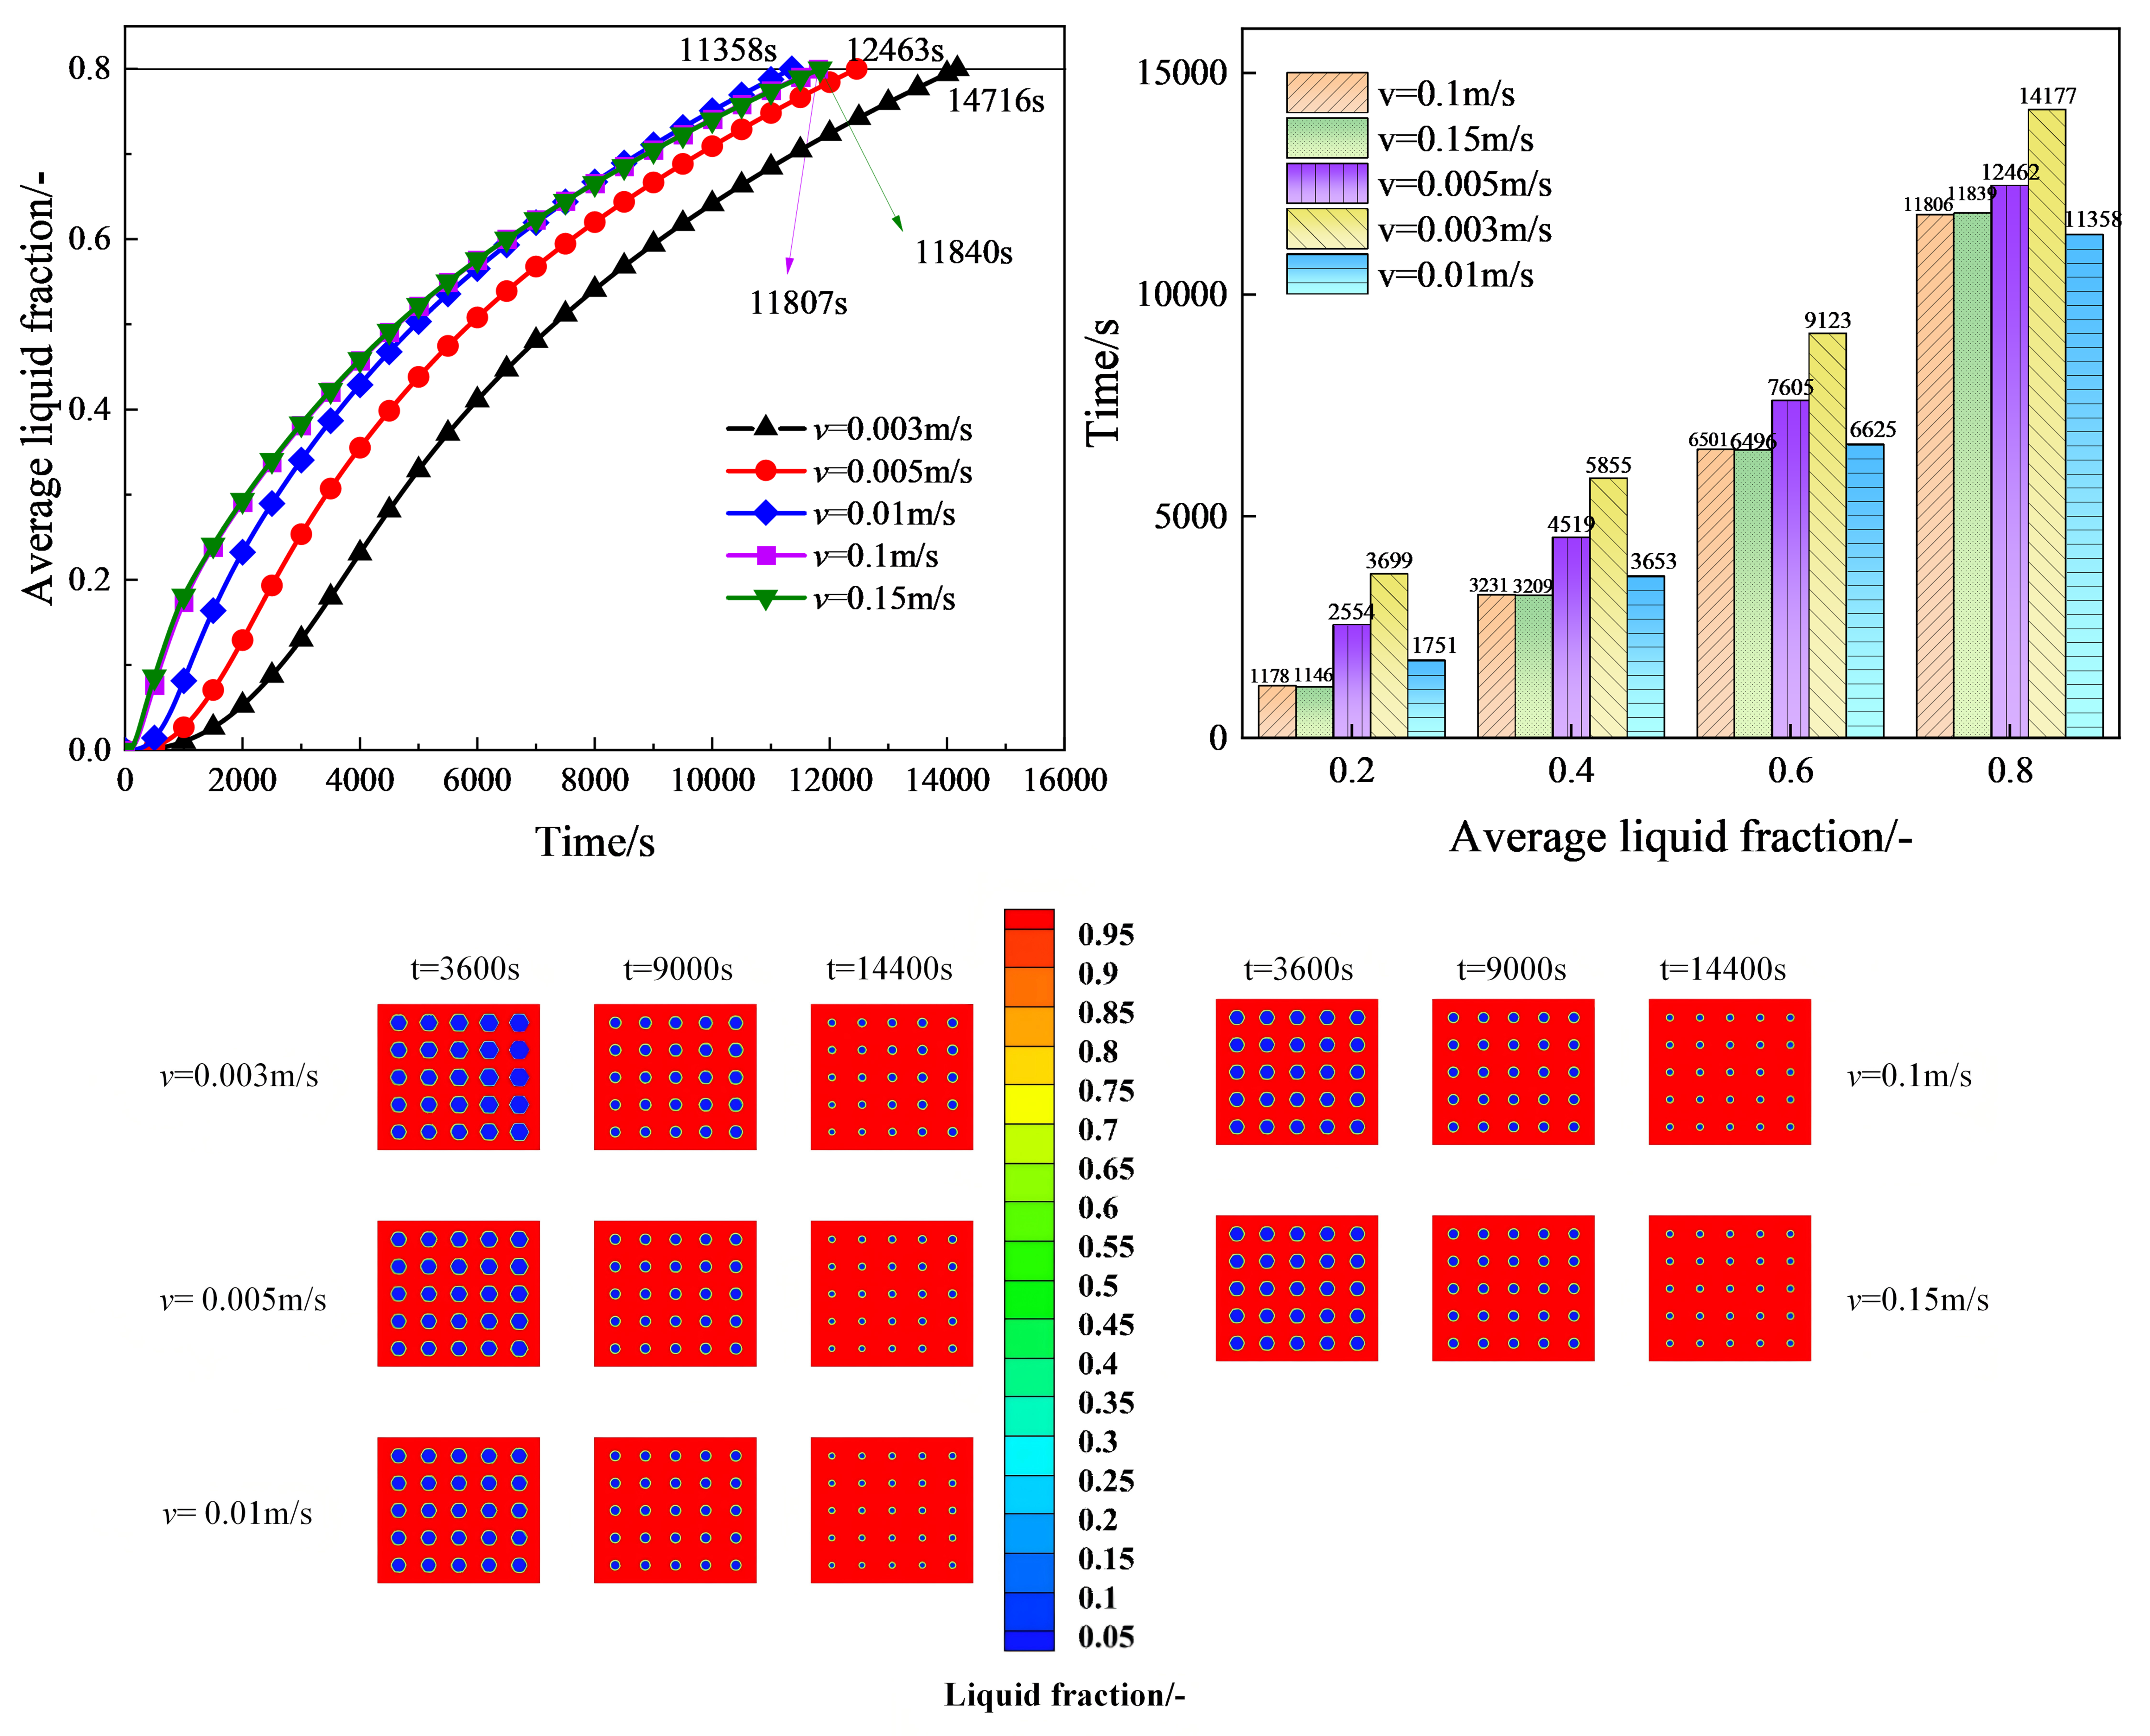
The liquid fraction histories and contours in
Figure 12 confirm the same nonmonotonic response. Relative to 0.003 m/s, increasing the inlet velocity to 0.005 and 0.01 m/s shortens the time required to reach an average liquid fraction of 0.8 by 15.3% and 22.8%, respectively. In contrast, increasing the velocity from 0.01 to 0.1 m/s lengthens this time by 4.0%, and the 0.15 m/s case again shows no additional benefit. Thus, the melting process is accelerated as the velocity increases to 0.01 m/s, whereas higher velocities slightly slow the overall charging process.
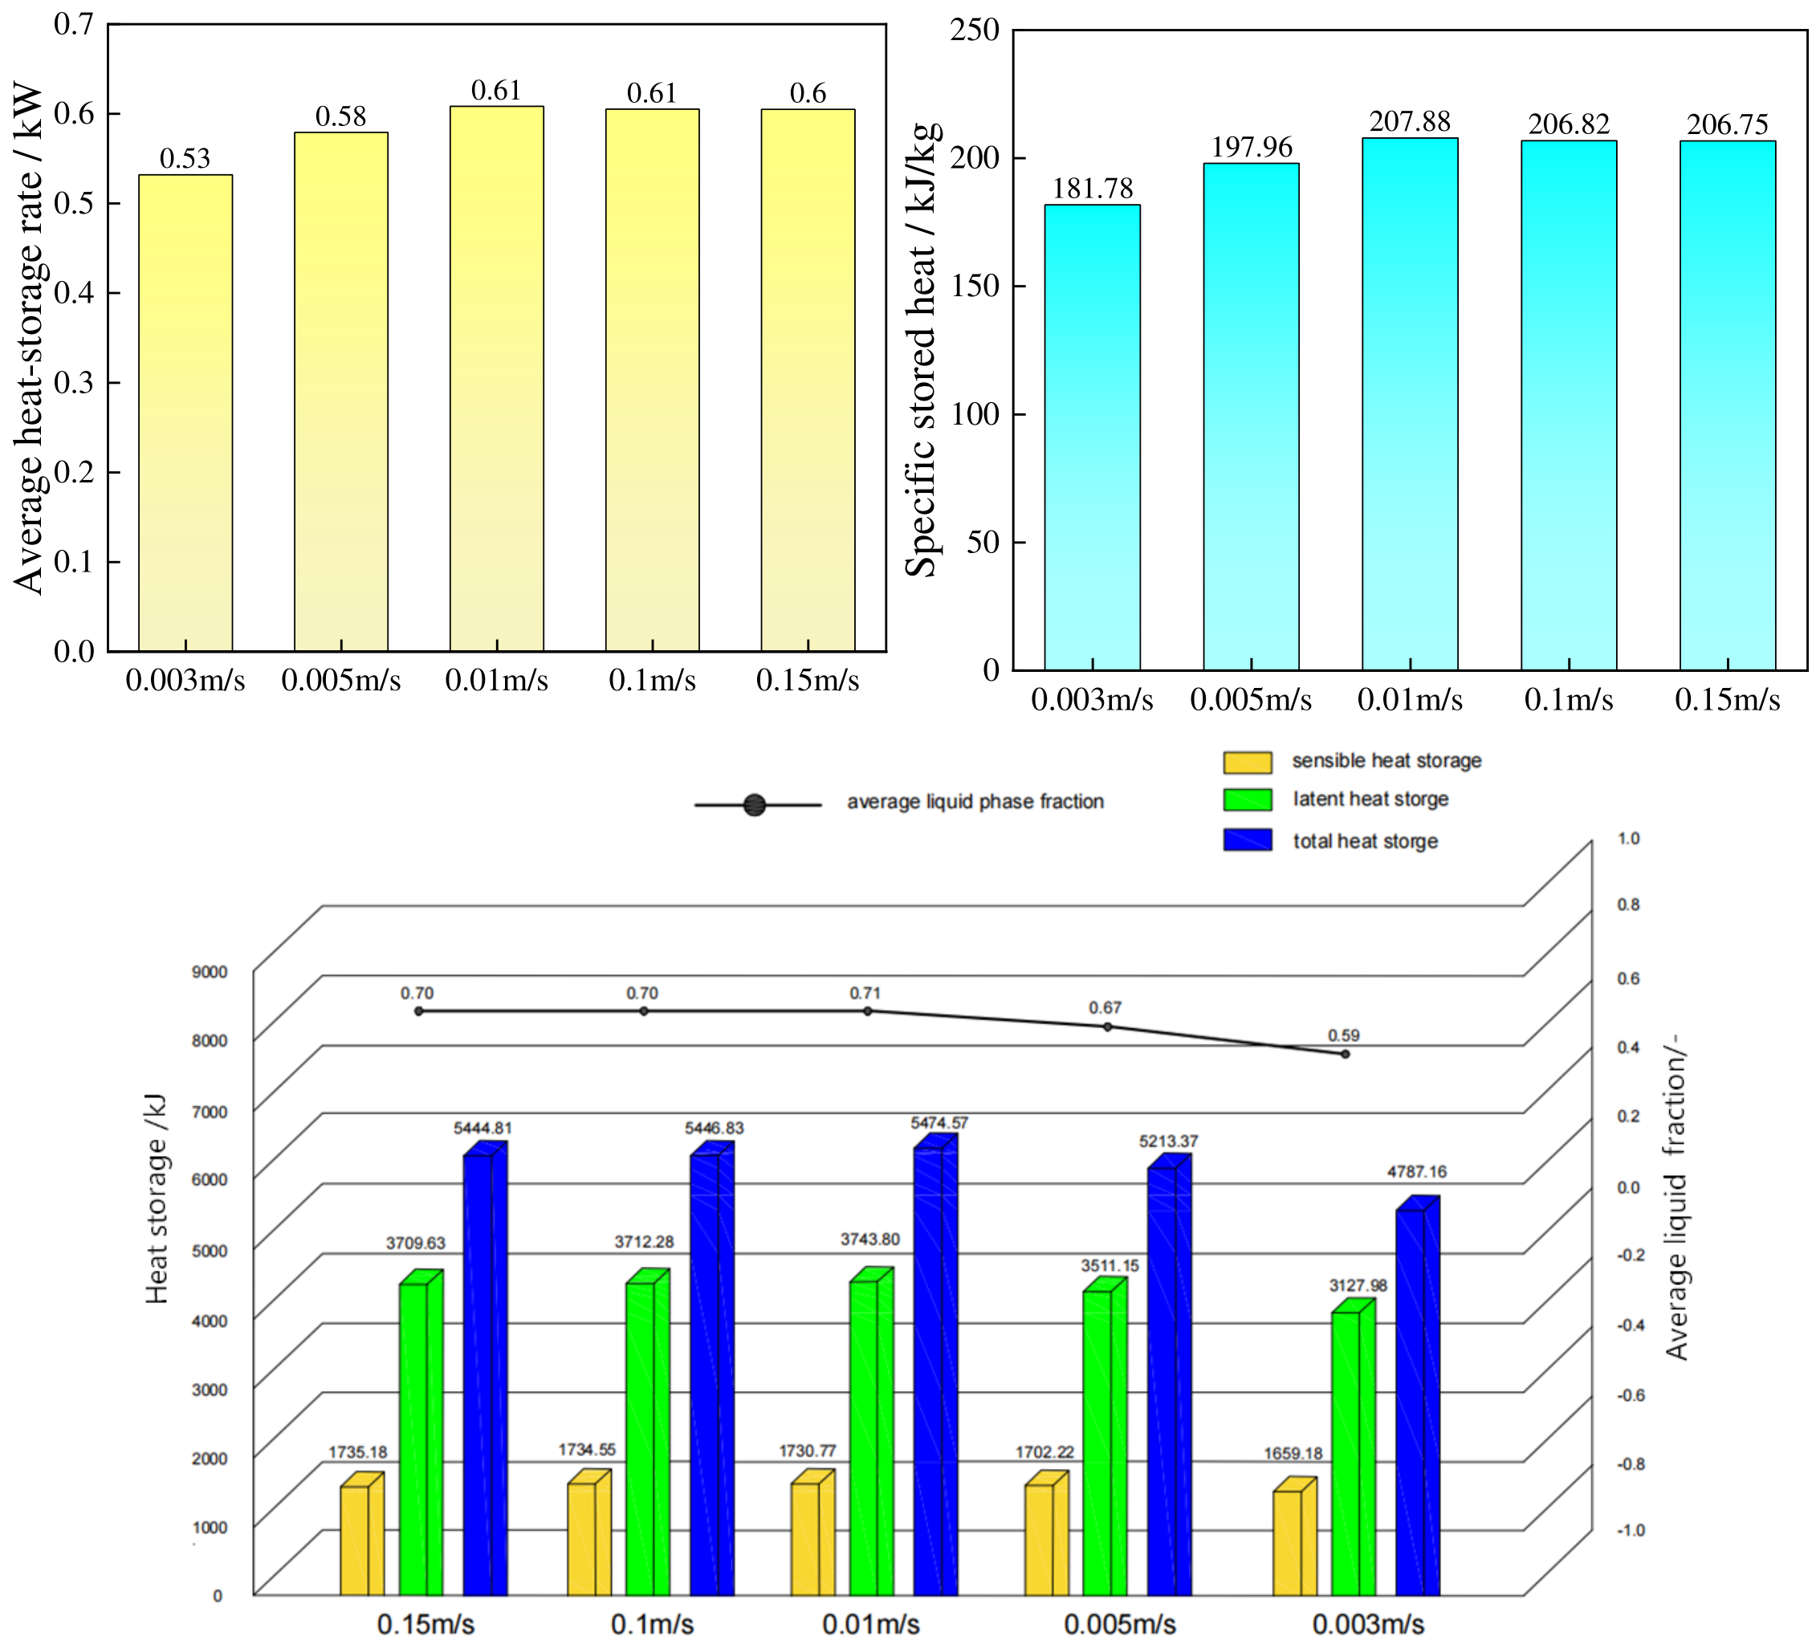
Figure 13 compares the charging indicators at t = 9000 s. The average liquid fraction reaches its maximum value of 0.71 at 0.01 m/s, compared with 0.59 at 0.003 m/s, 0.67 at 0.005 m/s, and 0.70 at both 0.1 and 0.15 m/s. Based on the total heat accumulated over the first 9000 s, the average heat storage rates are 0.532, 0.579, 0.608, 0.605, and 0.605 kW at inlet velocities of 0.003, 0.005, 0.01, 0.1, and 0.15 m/s, respectively. The corresponding specific stored heats are 181.78, 197.96, 207.88, 206.82, and 206.75 kJ/kg. The accumulated sensible heat/latent heat/total stored heat values are 1659.18/3127.98/4787.16 kJ, 1702.22/3511.15/5213.37 kJ, 1730.77/3743.80/5474.57 kJ, 1734.55/3712.28/5446.83 kJ, and 1735.18/3709.63/5444.81 kJ, respectively. The total stored heat reaches its maximum value of 5474.57 kJ at 0.01 m/s and then decreases slightly to 5446.83 and 5444.81 kJ at 0.1 and 0.15 m/s. Therefore, increasing the inlet velocity from 0.003 to 0.01 m/s accelerates charging, whereas further increases cause a slight deterioration rather than a plateau. Among the investigated cases, 0.01 m/s provides the best overall thermal storage performance.
3.4. The Effect of Fluid Type
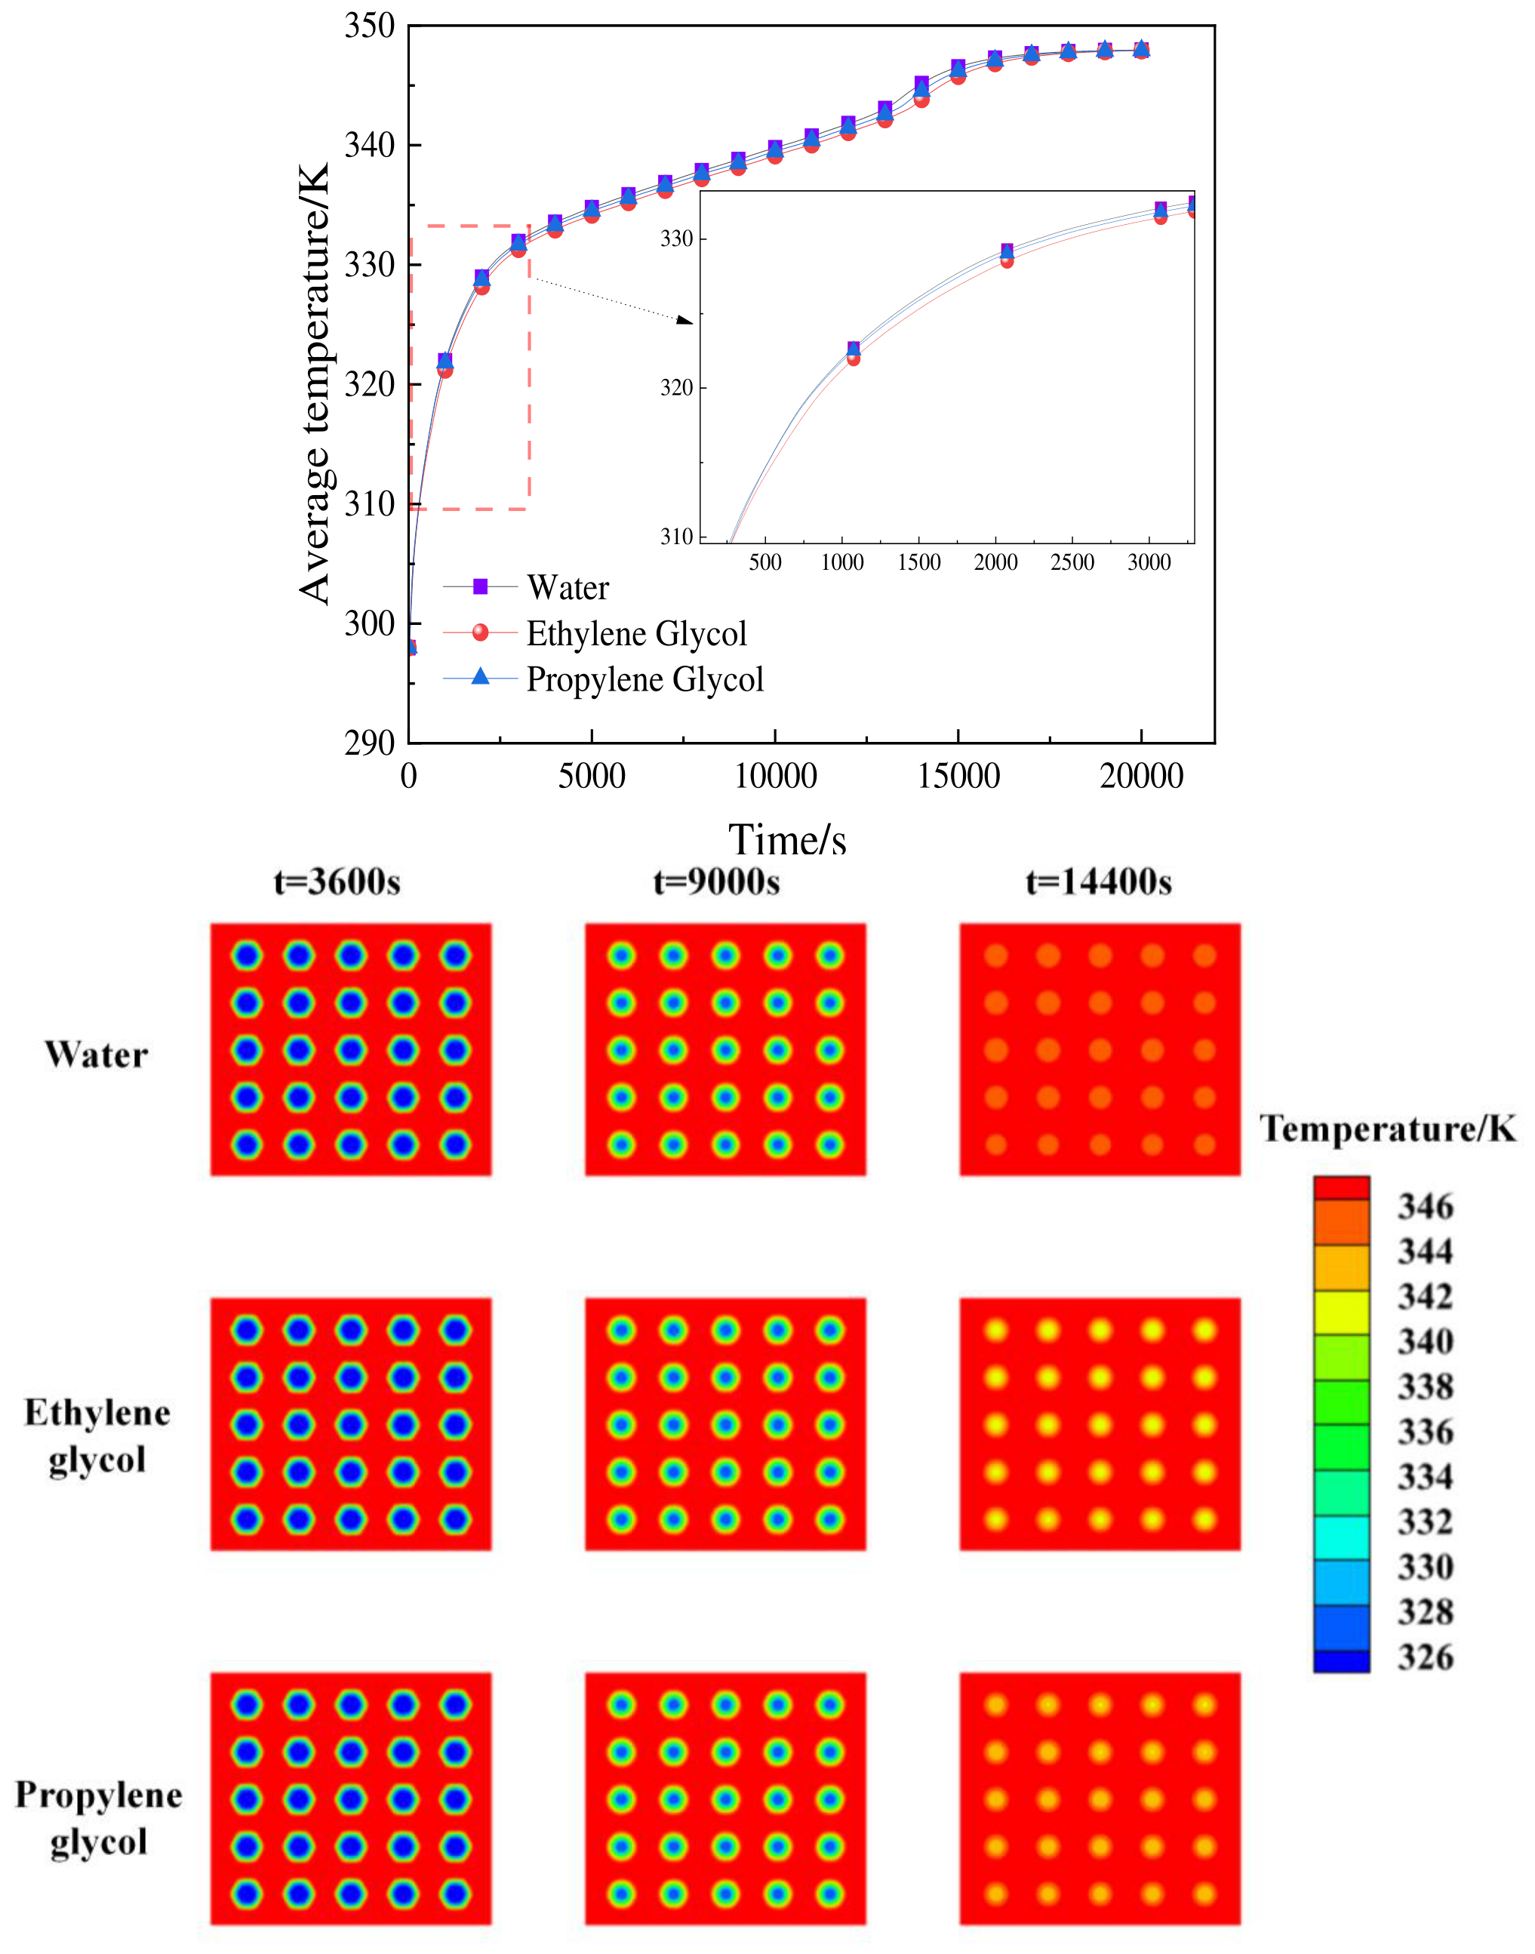
Figure 14 compares the transient temperature responses obtained using water, ethylene glycol, and propylene glycol, which are representative HTFs for low-temperature storage applications. The three fluids exhibit similar heating trajectories during the initial sensible heating, phase change, and final sensible heating stages. The times required for the average PCM temperature to approach the inlet temperature of 348 K are 18,951 s for water, 21,427 s for ethylene glycol, and 21,288 s for propylene glycol, indicating that HTF type has a moderate influence on the final sensible heating stage, although the overall temperature response trends remain similar.
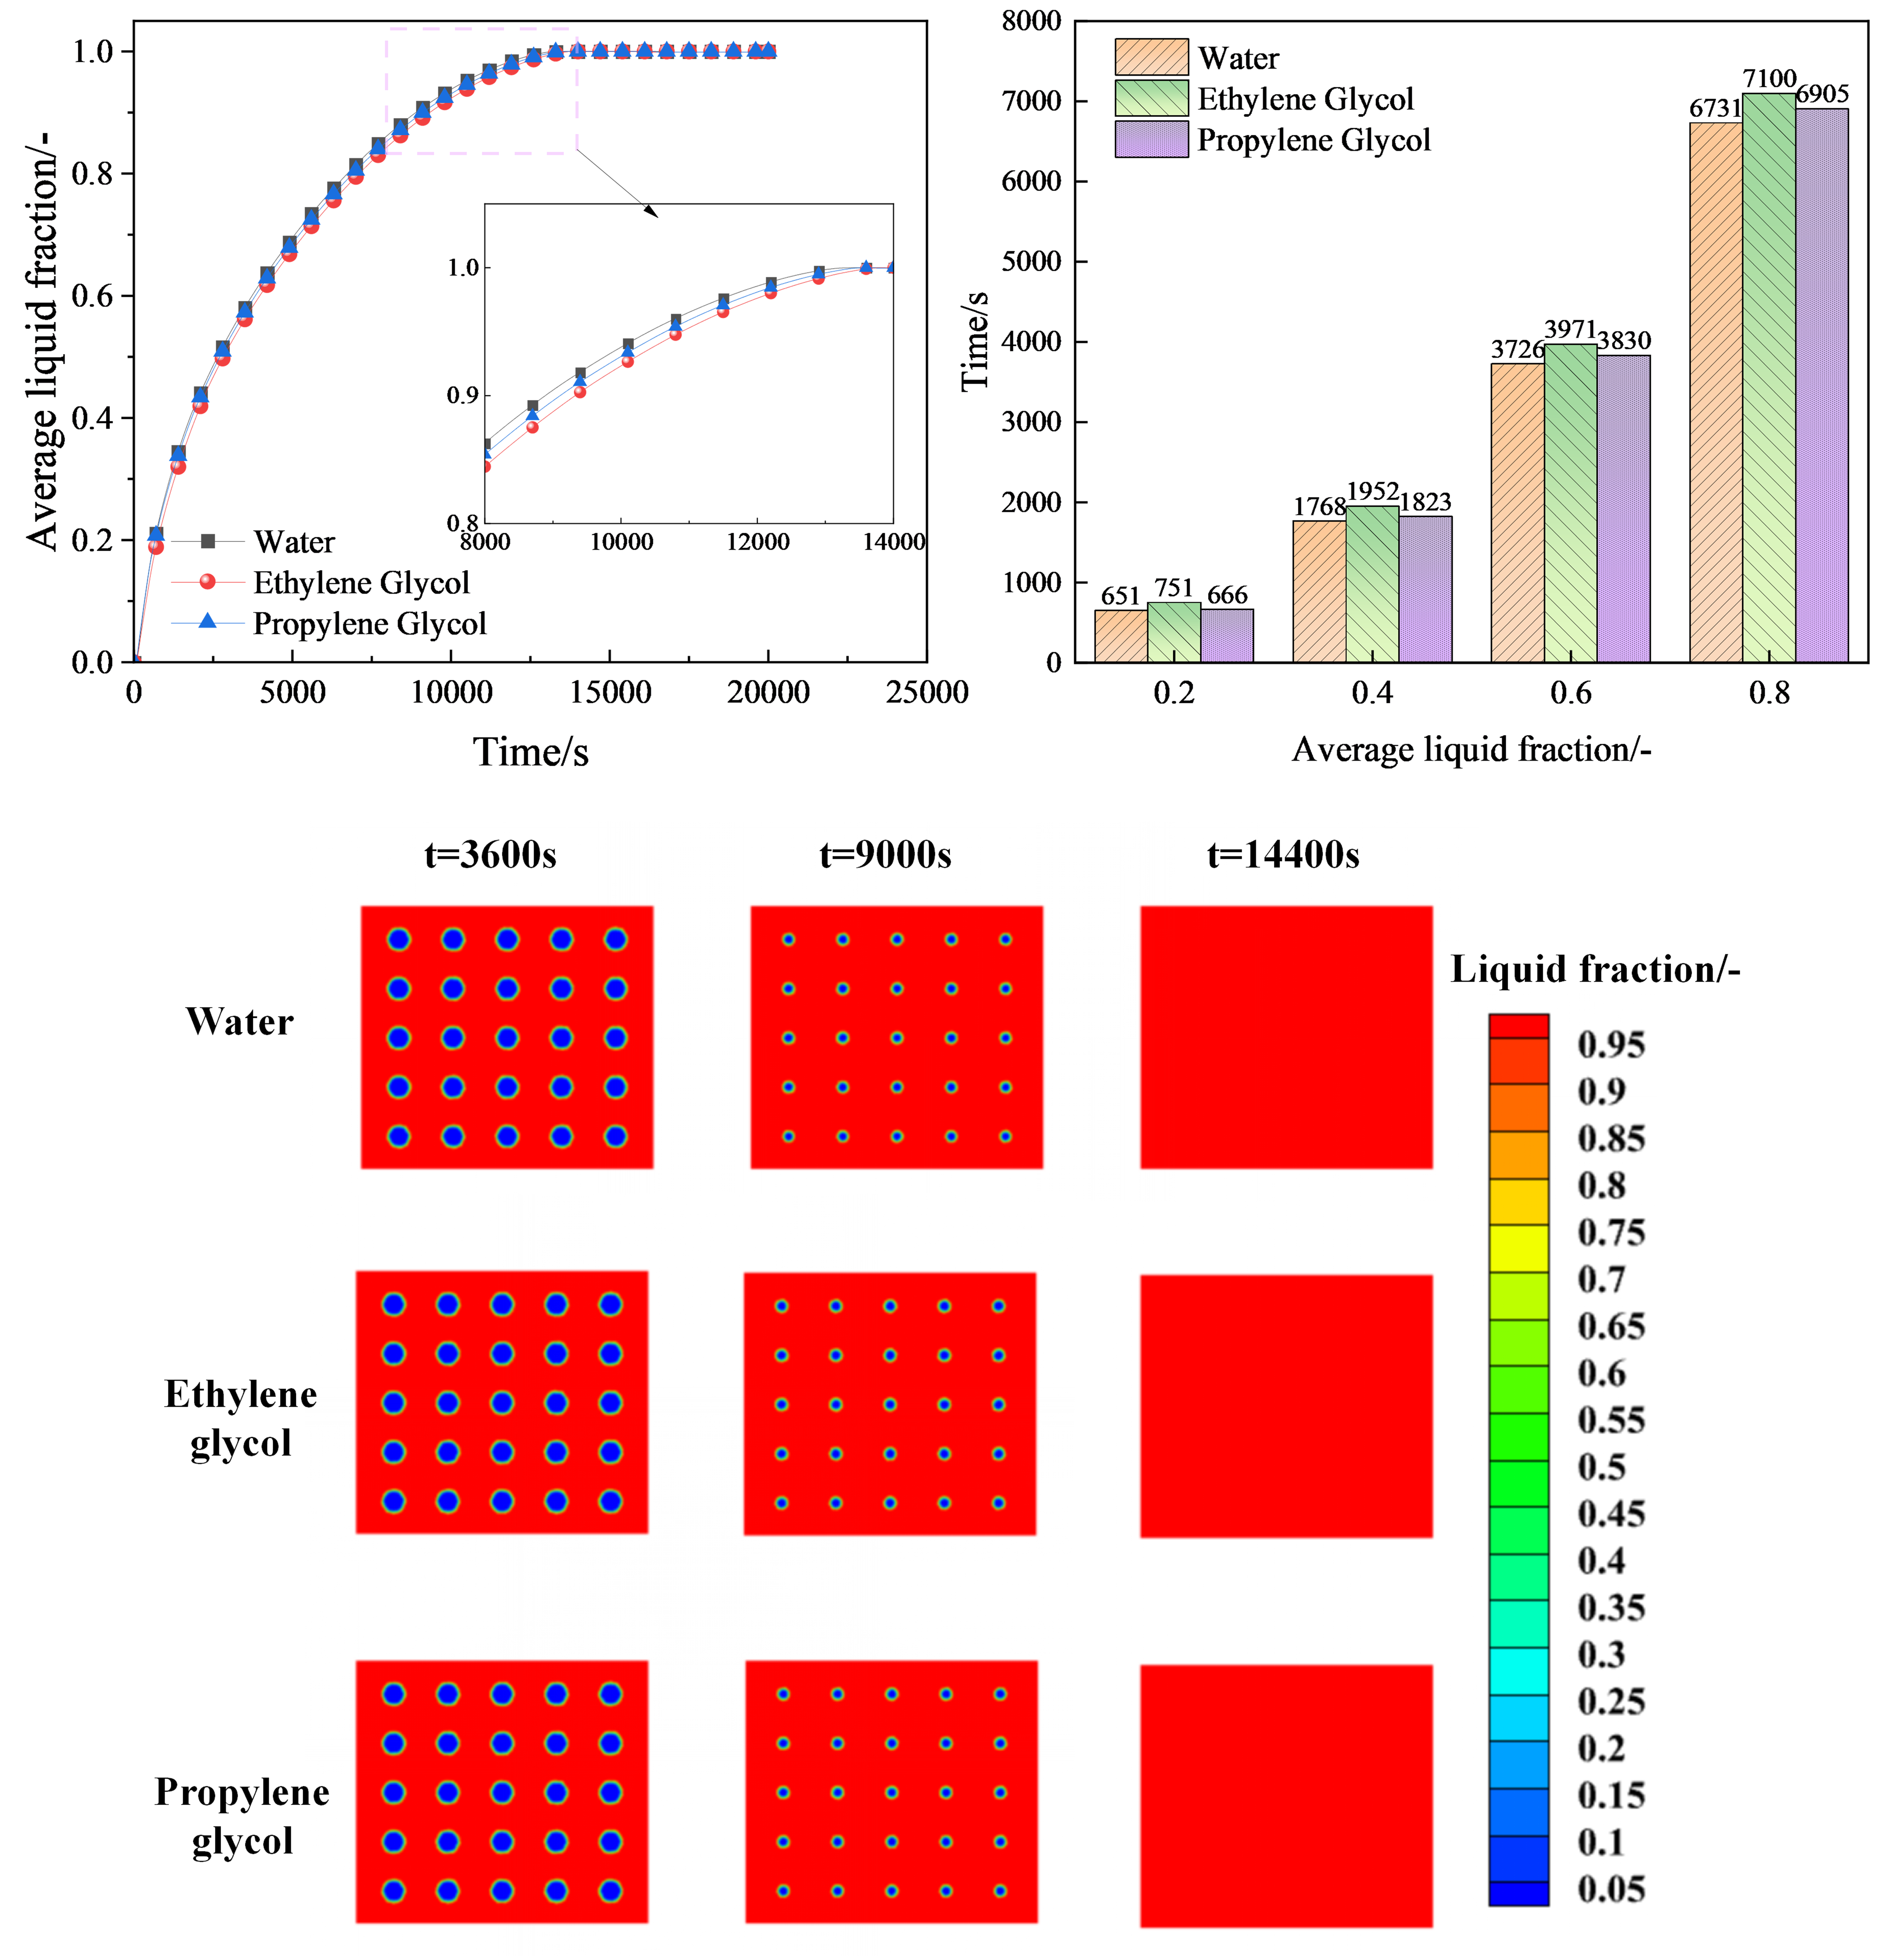
The phase change dynamics shown in
Figure 15 reinforce this operational similarity. Complete melting of the PCM domain is achieved at 13,371 s for water, 13,840 s for ethylene glycol, and 13,560 s for propylene glycol. Similarly, the times needed to attain an average liquid fraction of 0.8 are recorded as 6731 s (water), 7100 s (ethylene glycol), and 6905 s (propylene glycol).
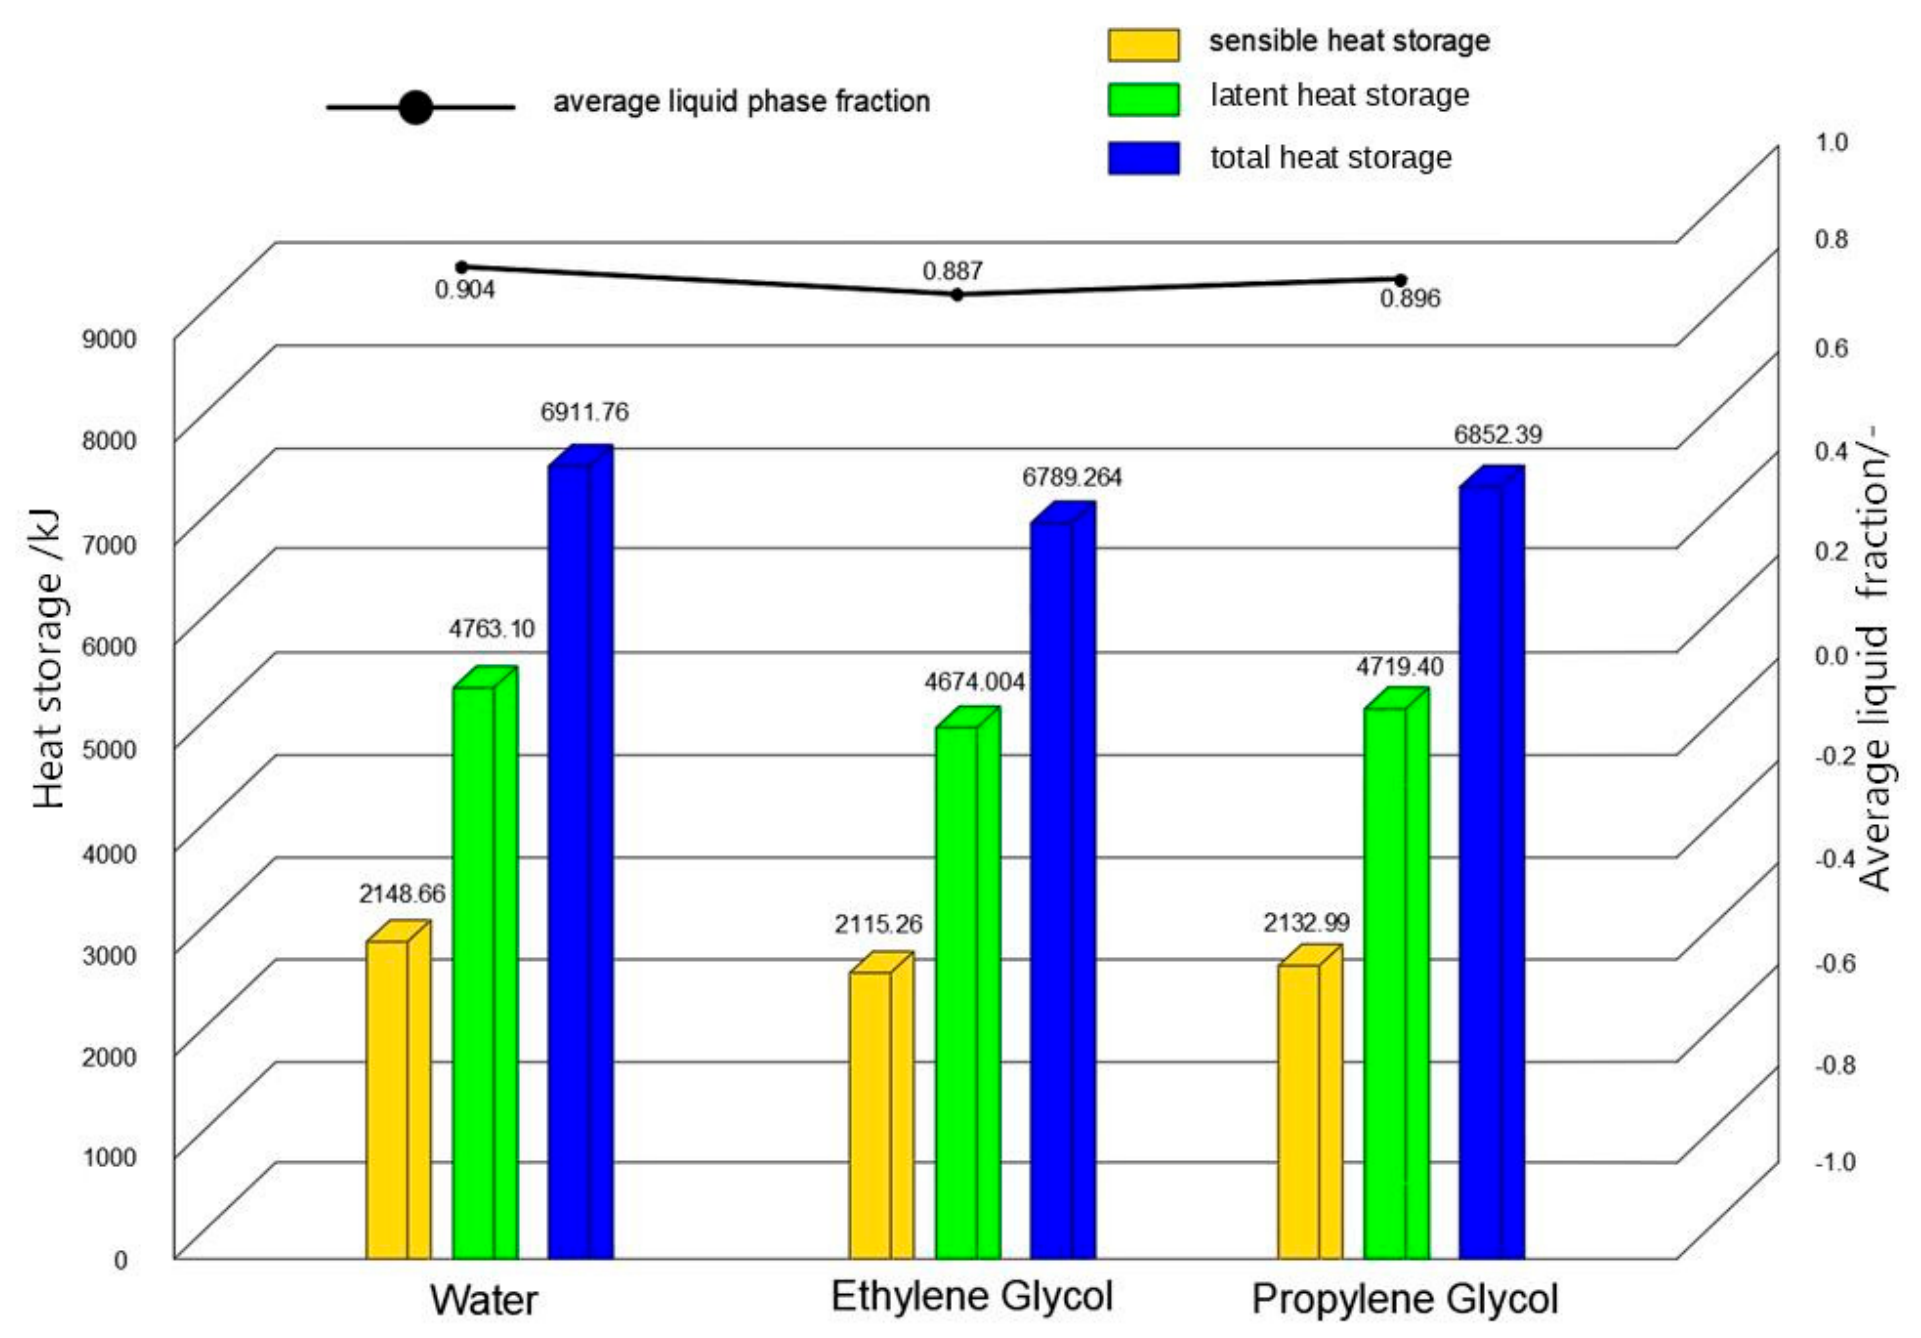
Figure 16 compares the charging performance at t = 9000 s. The average PCM liquid fractions are 0.904 for water, 0.887 for ethylene glycol, and 0.896 for propylene glycol. Water provides accumulated sensible heat/latent heat/total stored heat values of 2148.66/4763.10/6911.76 kJ, an average heat storage rate of 0.768 kW, and a specific stored heat of 262.45 kJ/kg. The corresponding values for ethylene glycol are 2115.26/4674.004/6789.264 kJ, 0.754 kW, and 257.80 kJ/kg, while those for propylene glycol are 2132.99/4719.40/6852.39 kJ, 0.761 kW, and 260.20 kJ/kg. Accordingly, the overall thermal performance follows the order water > propylene glycol > ethylene glycol, although the differences remain small. Under the investigated conditions, glycol-based fluids therefore cause only a small reduction in charging performance and may be considered when freeze protection is required.
3.5. Limitations and Future Work
Several limitations of the present study should be acknowledged. First, the numerical model is two-dimensional and therefore mainly describes the cross-sectional heat transfer and melting behavior of the honeycomb PCM unit. This simplification reduces the computational cost required for the comparative transient simulations and enables the effects of cell number and operating parameters to be evaluated under consistent conditions. The objective of this study is to isolate the effects of cellular unit count and HTF parameters, thereby keeping other variables constant. Therefore, axial heat conduction, inlet and outlet flow development, end-wall effects, and possible three-dimensional flow nonuniformity are not explicitly represented. Future work will therefore establish a three-dimensional model and compare its predictions with the present two-dimensional results and experimental measurements. The inlet and outlet are modeled as continuous full-length slots, which removes imposed axial manifold nonuniformity but does not reproduce local three-dimensional entrance, exit, or end-wall effects.
Second, the casing is treated as a zero-thickness interface, excluding wall thermal resistance, wall heat capacity, and contact resistance. Future studies will include finite wall thickness and casing properties to quantify the trade-off between enhanced heat transfer and reduced PCM volume. Because no finite casing is included, material-to-material comparisons and structural effects cannot be inferred from the present results.
Third, constant mean PCM thermal conductivity and specific heat capacity are used because complete temperature-dependent data are unavailable. Future work will incorporate temperature-dependent thermophysical properties and evaluate their effects on local melting behavior and charging time through sensitivity analysis.
Finally, only cell number, HTF inlet temperature, inlet velocity, and HTF type are examined. Future research will investigate PCM thermal conductivity, latent heat, melting temperature, wall thickness, honeycomb side length, and PCM filling ratio, followed by multi-parameter sensitivity analysis and multi-objective optimization.
The supplementary fixed-gap case accounts for the geometric space required by the solid-to-liquid density change, but it does not simulate transient PCM expansion into the gap. Future work will use a free-surface or multiphase formulation together with gas compression and structural deformation models to quantify the coupled thermal and mechanical effects of volume expansion.
4. Conclusions
This study numerically investigates the charging characteristics of a honeycomb phase change storage unit under different cell numbers, HTF inlet temperatures, inlet velocities, and HTF types. The total PCM inventory is maintained nearly constant among the different honeycomb configurations, allowing the effects of structural subdivision and operating parameters to be compared independently. The main conclusions are as follows:
(1) Increasing the number of honeycomb cells markedly accelerates PCM heating and melting. Compared with the 4-cell configuration, the times required for the 9-, 16-, and 25-cell units to reach an average liquid fraction of 0.8 are shortened by 58.3%, 73.9%, and 83.5%, respectively, while the times required for the average PCM temperature to reach 330 K are reduced by 48.6%, 65.3%, and 79.0%. At t = 9000 s, increasing the cell number from 4 to 25 increases the accumulated sensible heat, latent heat, and total stored heat by 32.5%, 178.0%, and 106.0%, respectively. This improvement indicates that honeycomb subdivision enables a greater proportion of the available PCM storage capacity to be utilized within the same charging period.
(2) Increasing the HTF inlet temperature strengthens the thermal driving force and substantially improves charging performance. Raising the inlet temperature from 338 K to 343 K and 348 K reduces the complete melting time by 27.4% and 42.5%, respectively, and shortens the time required for the average PCM temperature to approach the inlet temperature by 20.6% and 31.6%. At t = 9000 s, the total stored heat increases from 5446.82 kJ at 338 K to 6239.53 kJ at 343 K and 6911.76 kJ at 348 K, corresponding to increases of 14.6% and 26.9%.
(3) The influence of inlet velocity is nonmonotonic. Increasing the velocity from 0.003 to 0.01 m/s accelerates PCM charging and increases the total stored heat from 4787.16 to 5474.57 kJ at t = 9000 s. The corresponding average heat storage rate over the first 9000 s increases from 0.532 to 0.608 kW. However, increasing the velocity beyond 0.01 m/s causes a slight deterioration rather than a plateau. When the velocity increases from 0.01 to 0.1 m/s, the times required to reach the selected liquid fraction and average temperature increase by 4.0% and 6.8%, respectively, while the total stored heat decreases slightly to 5446.83 kJ. A further increase to 0.15 m/s provides no additional improvement, with the total stored heat decreasing to 5444.81 kJ. Therefore, 0.01 m/s provides the best overall charging performance among the investigated velocities.
(4) HTF type has a considerably smaller influence than cell number and inlet temperature under the investigated conditions. Water provides the shortest melting time and the highest thermal storage performance, followed by propylene glycol and ethylene glycol. At t = 9000 s, the total stored heat values are 6911.76 kJ for water, 6852.39 kJ for propylene glycol, and 6789.26 kJ for ethylene glycol. The relatively small differences indicate that glycol-based fluids cause only a limited reduction in charging performance when freeze protection is required.
Overall, honeycomb cell subdivision and HTF inlet temperature are the dominant factors affecting the charging behavior of the investigated storage unit. Inlet velocity improves performance only within a limited range, whereas HTF type produces comparatively minor differences. These findings clarify the relative importance of structural and operating parameters and provide a quantitative basis for the design and operation of honeycomb PCM thermal storage units.