Article

Ambient Temperature-Dependent Parameterization of the IEC 60076-7 Top-Oil Thermal Model

by
João Pedro da Costa Souza
1,*,
Patrick Picher
2,
Issouf Fofana
1,* and
Arnaud Zinflou
2
1
Department of Applied Science, Université du Québec à Chicoutimi (UQAC), Chicoutimi, QC G7H 2B1, Canada
2
Hydro-Québec (IREQ), Varennes, QC J3X 1S1, Canada
*
Authors to whom correspondence should be addressed.
Energies 2026, 19(17), 4224; https://doi.org/10.3390/en19174224
Submission received: 22 July 2026 / Revised: 30 August 2026 / Accepted: 2 September 2026 / Published: 7 September 2026
(This article belongs to the Section F1: Electrical Power System)

Abstract

Transformer top-oil temperature prediction is essential for reliable thermal assessment and lifetime management. Although the IEC 60076-7 loading guide model is widely adopted for this purpose, its thermal parameters are generally assumed to remain constant regardless of environmental conditions: an assumption that has received limited attention. This paper investigates the influence of ambient temperature on the IEC top-oil model parameters and proposes an adaptive ambient-dependent parameterization framework. A segmented optimization methodology is applied to field measurements from a 66 MVA, 225/26.4 kV power transformer to identify the optimal rated top-oil temperature rise and thermal exponent x over different ambient temperatures. The results reveal an approximately linear dependence of the optimized parameters on ambient temperature, suggesting that the thermal dynamics represented by the IEC model evolve with environmental conditions. Incorporating this dependency improves prediction accuracy, achieving a mean absolute error (MAE) of 2.03 °C and a root mean squared error (RMSE) of 2.56 °C on the test dataset, outperforming both the conventional IEC model with fixed parameters and a previously published adaptive approach. These findings offer a practical extension of the IEC model with applications in transformer monitoring, dynamic loading, and digital-twin-based asset management.

1. Introduction

Transformers are among the most expensive assets in power systems. Their performance and longevity are closely related to internal thermodynamic conditions. Thus, accurate transformer thermal modeling offers a tool for dynamic thermal rating and diagnostics, contributing to the planning of maintenance schedules and optimized transformer operation with extended useful life [1].
Various approaches to transformer thermal modeling have been developed over the years, such as those proposed by Swift [2,3] and Susa [4,5,6,7]. Nevertheless, the methods derived from the IEEE [8] and IEC [9] loading guides are still more widely adopted in the industry. Despite their usage, these models can yield significant errors, sometimes of the order of ten degrees Celsius [10,11], and their accuracy varies according to external conditions, especially in climates with a wide range of ambient temperatures [12].
Researchers have partially addressed these limitations by proposing new thermal models [13,14] and improving conventional models through parameter calibration using field measurement data [15,16]. Parameter estimation is the objective of the authors in [17], who applied genetic algorithms to identify parameters in the IEEE thermal model and showed that effective parameterization can enhance the power system’s operation margins during overload conditions. Similarly, the authors in [18] utilized Kalman filters to estimate the parameters of a simplified thermal model, but the approach focused on manufacturer-defined conditions and predefined operating scenarios. In practice, thermal model parameters may vary with seasonal changes and operating conditions, such as the action of pumps and fans [19]. Therefore, the development of dynamic parameterization methodologies has emerged as a promising approach for improving transformer internal temperature prediction.
The authors of [20] incorporate dynamic transformer conditions to improve prediction accuracy and propose an evolution of the IEC top-oil thermal model based on the changes in oil viscosity with temperature, highlighting the importance of considering changes in environmental factors in models. However, the viscosity analysis was only secondary and tested under controlled conditions, limiting the applicability of the proposed improvements. Consequently, the potential dependence of the effective IEC thermal parameters themselves on ambient conditions across different cooling stages was not investigated.
Evaluating models under diverse scenarios is essential to obtain a comprehensive understanding of their applicability to the wide range of conditions encountered during the service life of a transformer [21]. While considering external factors, such as wind velocity and solar radiation, can improve transformer thermal modeling [22], the study of the impacts of extreme climates on the parameterization of the models is still limited. The work presented in [23], for example, suggests that changes in ambient temperature may increase distribution transformers’ loss of life over the years up to 32%. Another study in South Korea [24] identified trends in extreme weather and failures of distribution transformers related to temperature and humidity. Of all the external factors, ambient temperature is one of the most important factors in transformer thermal dynamics, especially regarding top-liquid temperatures.
Accounting for the effects of ambient temperature on the optimized parameters of the models can increase the accuracy of the internal temperature predictions while providing a deeper understanding of the thermodynamics of transformers. This approach paves the way for the development of more robust models, capable of operating under a wider range of ambient conditions. In this context, this study proposes a segmented parameter-identification framework to investigate variations in the effective parameters of the IEC top-oil thermal model under changing operating and environmental conditions. Unlike previous approaches in which temperature dependence was introduced indirectly through oil viscosity under restricted cooling conditions, the proposed approach directly identifies ambient-temperature-dependent variations in selected IEC parameters across different cooling stages. These relationships are then incorporated into an adaptive IEC model, in which the parameters are dynamically adjusted according to ambient temperature and cooling operation while preserving the original IEC thermal formulation.

2. Materials and Methods

The present work focuses on a 66 MVA, 225 kV Y/26.4 kV Δ power transformer. The equipment was installed at the La Suète substation, Québec, Canada, and is further described in Table 1. The studied dataset contains 1-min transformer internal temperature measurements from 8 December 2021 to 15 December 2025, including the temperature at the top of the insulation liquid in the tank, hereafter referred to as the top-oil temperature. Operation conditions, such as the ambient temperature, cooling stage, tap position, and normalized load, are also included in the dataset.
This study focuses exclusively on top-oil temperature modeling. Thus, the dataset was resampled to 5-min intervals to reduce computational costs. This decision was made considering the high thermal inertia of the top-oil temperature dynamics, which often presents a time constant on the order of hours [21,25]. Continuous variables were resampled using the average value in the period, whereas discrete variables (e.g., the cooling stage) were resampled using the mode. The final dataset comprised 423,072 samples and encompassed different ambient conditions and load patterns, providing a solid basis for analysis, which has rarely been observed in related studies.
The data were divided into two groups for parameterization/analysis and testing, using a chronological 70/30 split. Two optimization processes were carried out using the parameterization and analysis dataset: global optimization, in which the entire subset was used to determine optimized parameters, and segmented optimization, in which the subset was divided into segments for local parameter estimation. These optimization processes are described in the following subsections. All analyses were performed using Python 3.12.7.

2.1. The IEC Top-Oil Thermal Model

The top-oil thermal model described in IEC 60076-7 [9] can be characterized by the differential solution presented in (1), which represents the variation in the top-oil temperature to a level corresponding to a load factor K in a period dt:
Δ θ to , r 1   +   K 2 1   +   R x =   k 11 τ o θ to dt   +   θ to θ a ,
where θ to is the top-oil temperature, in °C; θ a is the ambient temperature, also in °C; and θ to ,   i and θ to ,   r are the initial top-oil temperature rise over ambient temperature (at t = 0) and the top-oil temperature rise over ambient temperature at rated losses, respectively, in K. R is the ratio of load loss at rated load to no-load loss on the tap position at the rated voltage, x is the exponential power of total losses versus top-oil (in tank) temperature rise, k11 is a thermal model constant, and τo is the oil time constant. Based on the thermal relationship described in (1), the top-oil temperature can be calculated using the difference equations presented in (2):
D θ to =   Dt k 11 τ o Δ θ to , r 1   +   K 2 1   +   R x   [ θ to   θ a ]
where the “D” operator represents the difference associated with the variable to step Dt. Thus, the nth value of D θ to ,   r is calculated from the (n − 1)th value using (3).
θ to =   θ to n 1 + D θ to
The difference method is commonly used in online monitoring [9] because of its simple implementation using computational tools, and is therefore adopted in this study.

2.2. Global Optimization

The parameterization and analysis subset was used to optimize the parameters of the IEC top-oil thermal model. The global and segmented optimization processes were performed using a framework for hyperparameter tuning [26] using a Tree-structured Parzen Estimator (TPE) for parameter selection. Each optimization process used 150 trials, where each trial evaluated a candidate set of parameters selected by the framework. The global optimization procedure focused on the following parameters: the exponential power relating total losses to top-oil temperature rise, hereafter referred to as exponent x ; the top-oil temperature rise over ambient temperature at rated losses, hereafter referred to as the rated top-oil temperature rise ( Δ θ to , r ) ; the oil time constants for ONAN and ONAF operation; and the load loss ratio, R. The parameters selected for optimization are summarized in Table 2 along with their optimization boundaries. The number of trials was empirically determined after no substantial changes were observed in the resulting optimized parameters through 10 independent runs using random seeds (standard deviations below 1 °C for Δ θ to , r and 0.02 for the exponent x). Early stopping was applied when no improvement in the objective function was observed for 25 consecutive trials.
Previous studies [27,28] reported exponent x values ranging from 0.6 to 1.0. However, owing to the unusual characteristics of the transformer under analysis, where the combined top-oil rise over ambient temperature and hot-spot temperature rise over top-oil frequently exceeded the typical limit of 80 °C, the parameter bounds adopted in this study were expanded. In addition to accommodating these operating conditions, wider bounds can provide additional information during the calibration process by allowing broader exploration of the relationships between variables.
A simplified optimization strategy based on block coordinate descent [29] was adopted to obtain the final calibrated parameters. The procedure consisted of four stages: joint optimization of Δ θ to , r and the exponent x; optimization of the ONAN and ONAF oil time constants; refinement of Δ θ to , r and the exponent x using the updated time constants; and final adjustment of the loss ratio R. The conducted trials used the Mean Absolute Error (MAE) described in (4) as the objective function to evaluate each parameter combination:
MAE   =   1 n i = 1 n y i       y ^ i ,
where n is the number of measurements, y i is the actual measured temperature at measurement i, and y ^ i is the corresponding predicted value. The complete mathematical form of the objective function J is described in (5) and (6), and the ONAN and ONAF oil time constants were defined to represent operations without fans and with half or all fans activated, respectively:
J ( β )   =   1 n i = 1 n y i       y ^ i ( β ) , and
β * = arg min β Ω J ( β ) ,
where β is the vector of optimized parameters and Ω is the predefined search space defined by the bounds in Table 2. In this context, β * is the parameter combination that minimizes the MAE between the measured and predicted top-oil temperatures in the compared intervals. The global optimization process utilized metrics calculated over the entire parameterization/analysis subset, whereas the segmented optimization used the MAE calculated independently for each segment.
Preliminary analyses indicated that the tap position had a limited influence on the variations in the optimized parameters for the transformer under study. This transformer predominantly operates under low-load conditions, with approximately 68% of the samples corresponding to tap positions between 5 and 9, which are close to or equal to the measurement tap (tap position 9). Under these operating conditions, previous studies suggest that including the tap position results in only marginal improvements in the top-oil temperature prediction [30].

2.3. Segmented Optimization

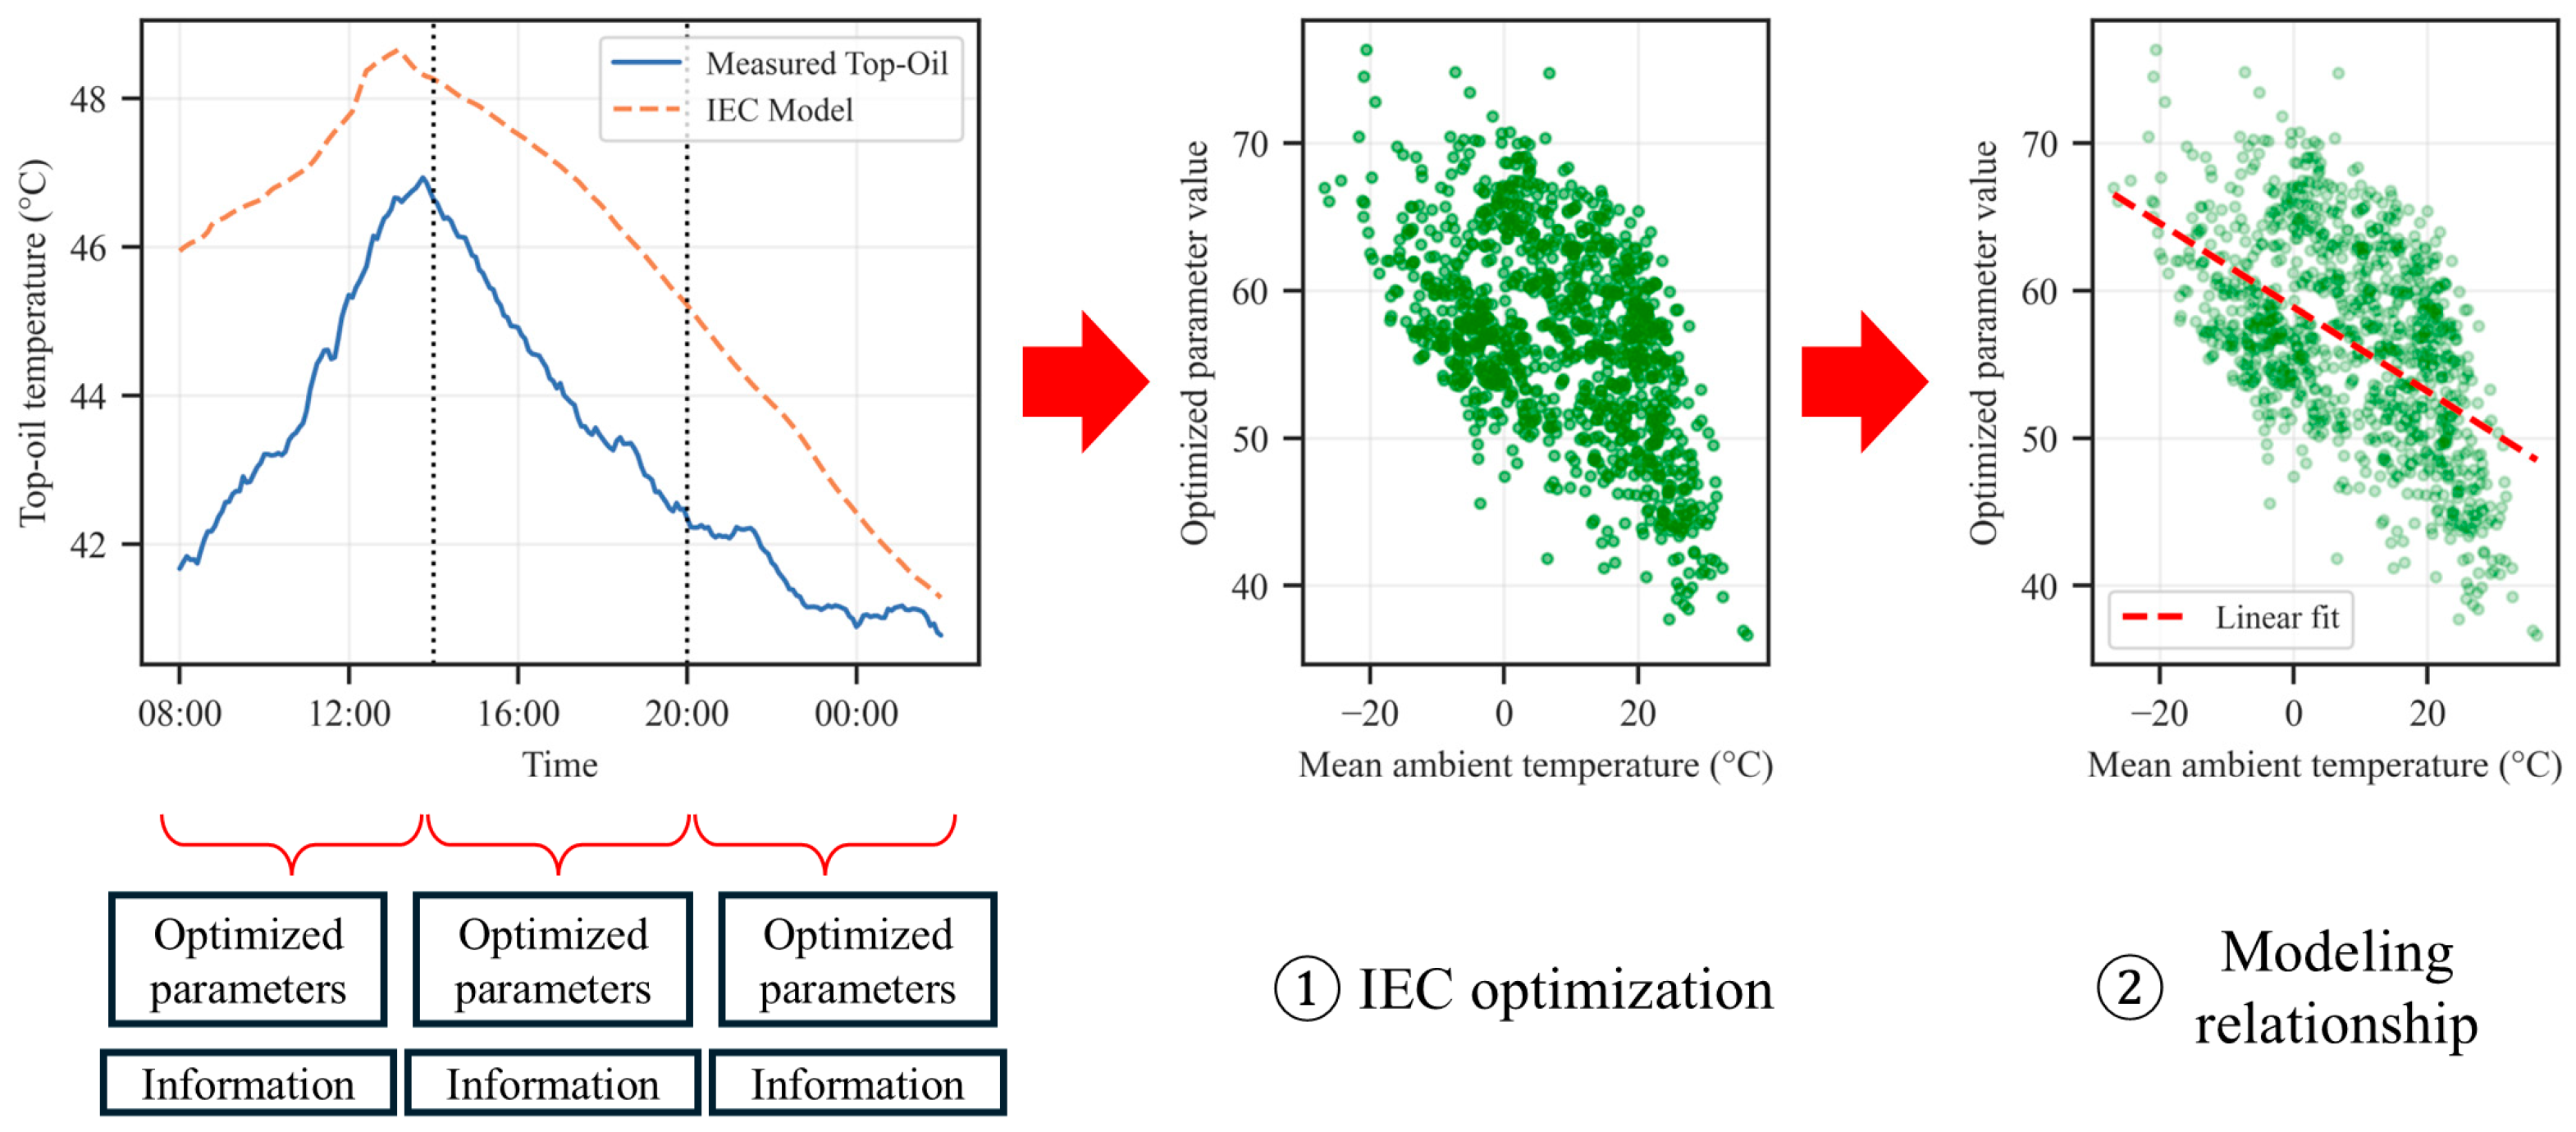
The segmented optimization process utilized in this study is illustrated in Figure 1. It was designed to capture the influence of operating conditions, particularly ambient temperature, on the optimized parameters by associating the optimized parameter values with specific operational scenarios. In this approach, the calibration and analysis datasets were divided into 6-h segments; for each segment, statistical and operational characteristics were extracted, including mean load, mean ambient temperature, dominant tap positions, and cooling stages. The 6-h interval was selected as a compromise between two competing requirements: providing sufficient data for local parameter estimation while maintaining sufficiently homogeneous operating and external conditions within each segment. Because consecutive 6-h segments originate from a continuous time series measured on the same unit, temporal dependence between neighboring segments cannot be excluded. Thus, statistical analysis was also conducted using aggregated temporal blocks (days and weeks) to reduce the impact of short-term autocorrelation. Segments with gaps superior to one hour were removed from the analysis, since they do not preserve the transformer’s thermal dynamics.
To account for the cooling stage, segments were classified based on the most frequently observed cooling stage. For example, if a six-hour segment sampled every 5 min contains 37 samples of cooling stage 1 (out of 72 total samples), it would be classified as cooling stage 1, ONAN. This approach ensured that the dominant cooling behavior within the segment is accurately represented.
The 6-h period was selected to balance the temporal resolution and the thermal response of the insulating liquid, the thermal time constant of which may reach several hours [9]. This approach ensures that variations in ambient temperature are captured without introducing excessive noise into the analysis.
The segmented optimization procedure was applied only to the rated top-oil temperature rise and exponent x, because of their significant impact on transformer internal temperature calculations [31]. The optimization was performed sequentially, optimizing one parameter at a time, while maintaining the remaining parameters fixed at their globally optimized values. Subsequently, both parameters were optimized simultaneously.
The resulting parameter variations were then analyzed as a function of the operating conditions of each segment, with a particular emphasis on the ambient temperature. Regression-based simplifications were applied to investigate the relationships between the operating conditions and optimized parameters. Finally, a model incorporating the observed effects is proposed and evaluated in the test subset, with a focus on the extreme ambient temperature scenarios.

2.4. Assessment

The proposed approach was compared with the loading guide using the recommended values. The values of MAE, Root Mean Squared Error (RMSE), and coefficient of determination, R2, represented by (4), (7), and (8), respectively, were chosen for assessment in the prediction subset:
RMSE =   1 n i = 1 n y i   y ^ i 2   , and
R 2 = 1 i = 1 n y i     y ^ i 2 i = 1 n y i     y - i 2 ,
where n is the number of measurements, y i is the actual top-oil temperature at measurement i,  y - i is the corresponding mean of actual values, and y ^ i is the corresponding predicted value. These metrics were also used to assess the proposed mathematical models for the optimized top-oil temperature rise.

3. Results and Discussion

This section presents the results of the optimization procedures conducted in this study and discusses their implications for transformer thermal modeling. First, the results obtained from the global optimization approach are presented. Then, the segmented optimization results are analyzed to investigate the influence of the operating conditions, particularly ambient temperature, on the parameter behavior.

3.1. Global Optimization Results

The globally optimized IEC top-oil thermal model presented an optimized MAE of 3.27 °C in the parameterization and analysis subset. The globally optimized parameters and their respective units are listed in Table 3.
The optimization of parameter R resulted in only a marginal reduction in the objective function. This behavior may be attributed to the concentration of tap positions near the rated tap position in the dataset. The globally optimized top-oil temperature rise was slightly higher than the value reported in [20] (51.20 K). Finally, the optimized oil time constants indicated a longer ONAN time constant and shorter ONAF time constants than the recommended values.

3.2. Segmented Optimization Results

The segmentation of the parameterization and analysis subset resulted in 3463 6-h segments. Locally optimized parameters reduced the segment-wise MAE by an average of 61.40% (and a median of 71.68%) when compared to the globally optimized IEC model, used as the baseline, with a standard deviation of 30.60%. When the results were aggregated into daily and weekly temporal blocks, MAE improvements of 69.86% and 72.39% were obtained, respectively, with lower aggregated MAE values observed in 100% of both daily and weekly blocks. Lower MAE values were obtained in 96.30% of the analyzed segments. These results highlight the potential benefits of dynamic parameterization procedures that consider specific operation conditions. Table 4 lists the number of segments in the dominant cooling stage.
The mean ambient temperature values in the segments ranged from a minimum of—26.90 °C (on 4 February 2023) to a maximum of 36.30 °C (on 19 June 2024). This wide temperature amplitude (63.20 °C) is advantageous for understanding the behavior of parameters across different temperatures, as it provides a diverse set of environmental conditions for analysis.
The results originating from the segmented optimization process for the exponent x, the rated top-oil temperature rise, and the joint segmented optimization are presented in the following subsections.

3.2.1. Optimization of Δ θ t o , r

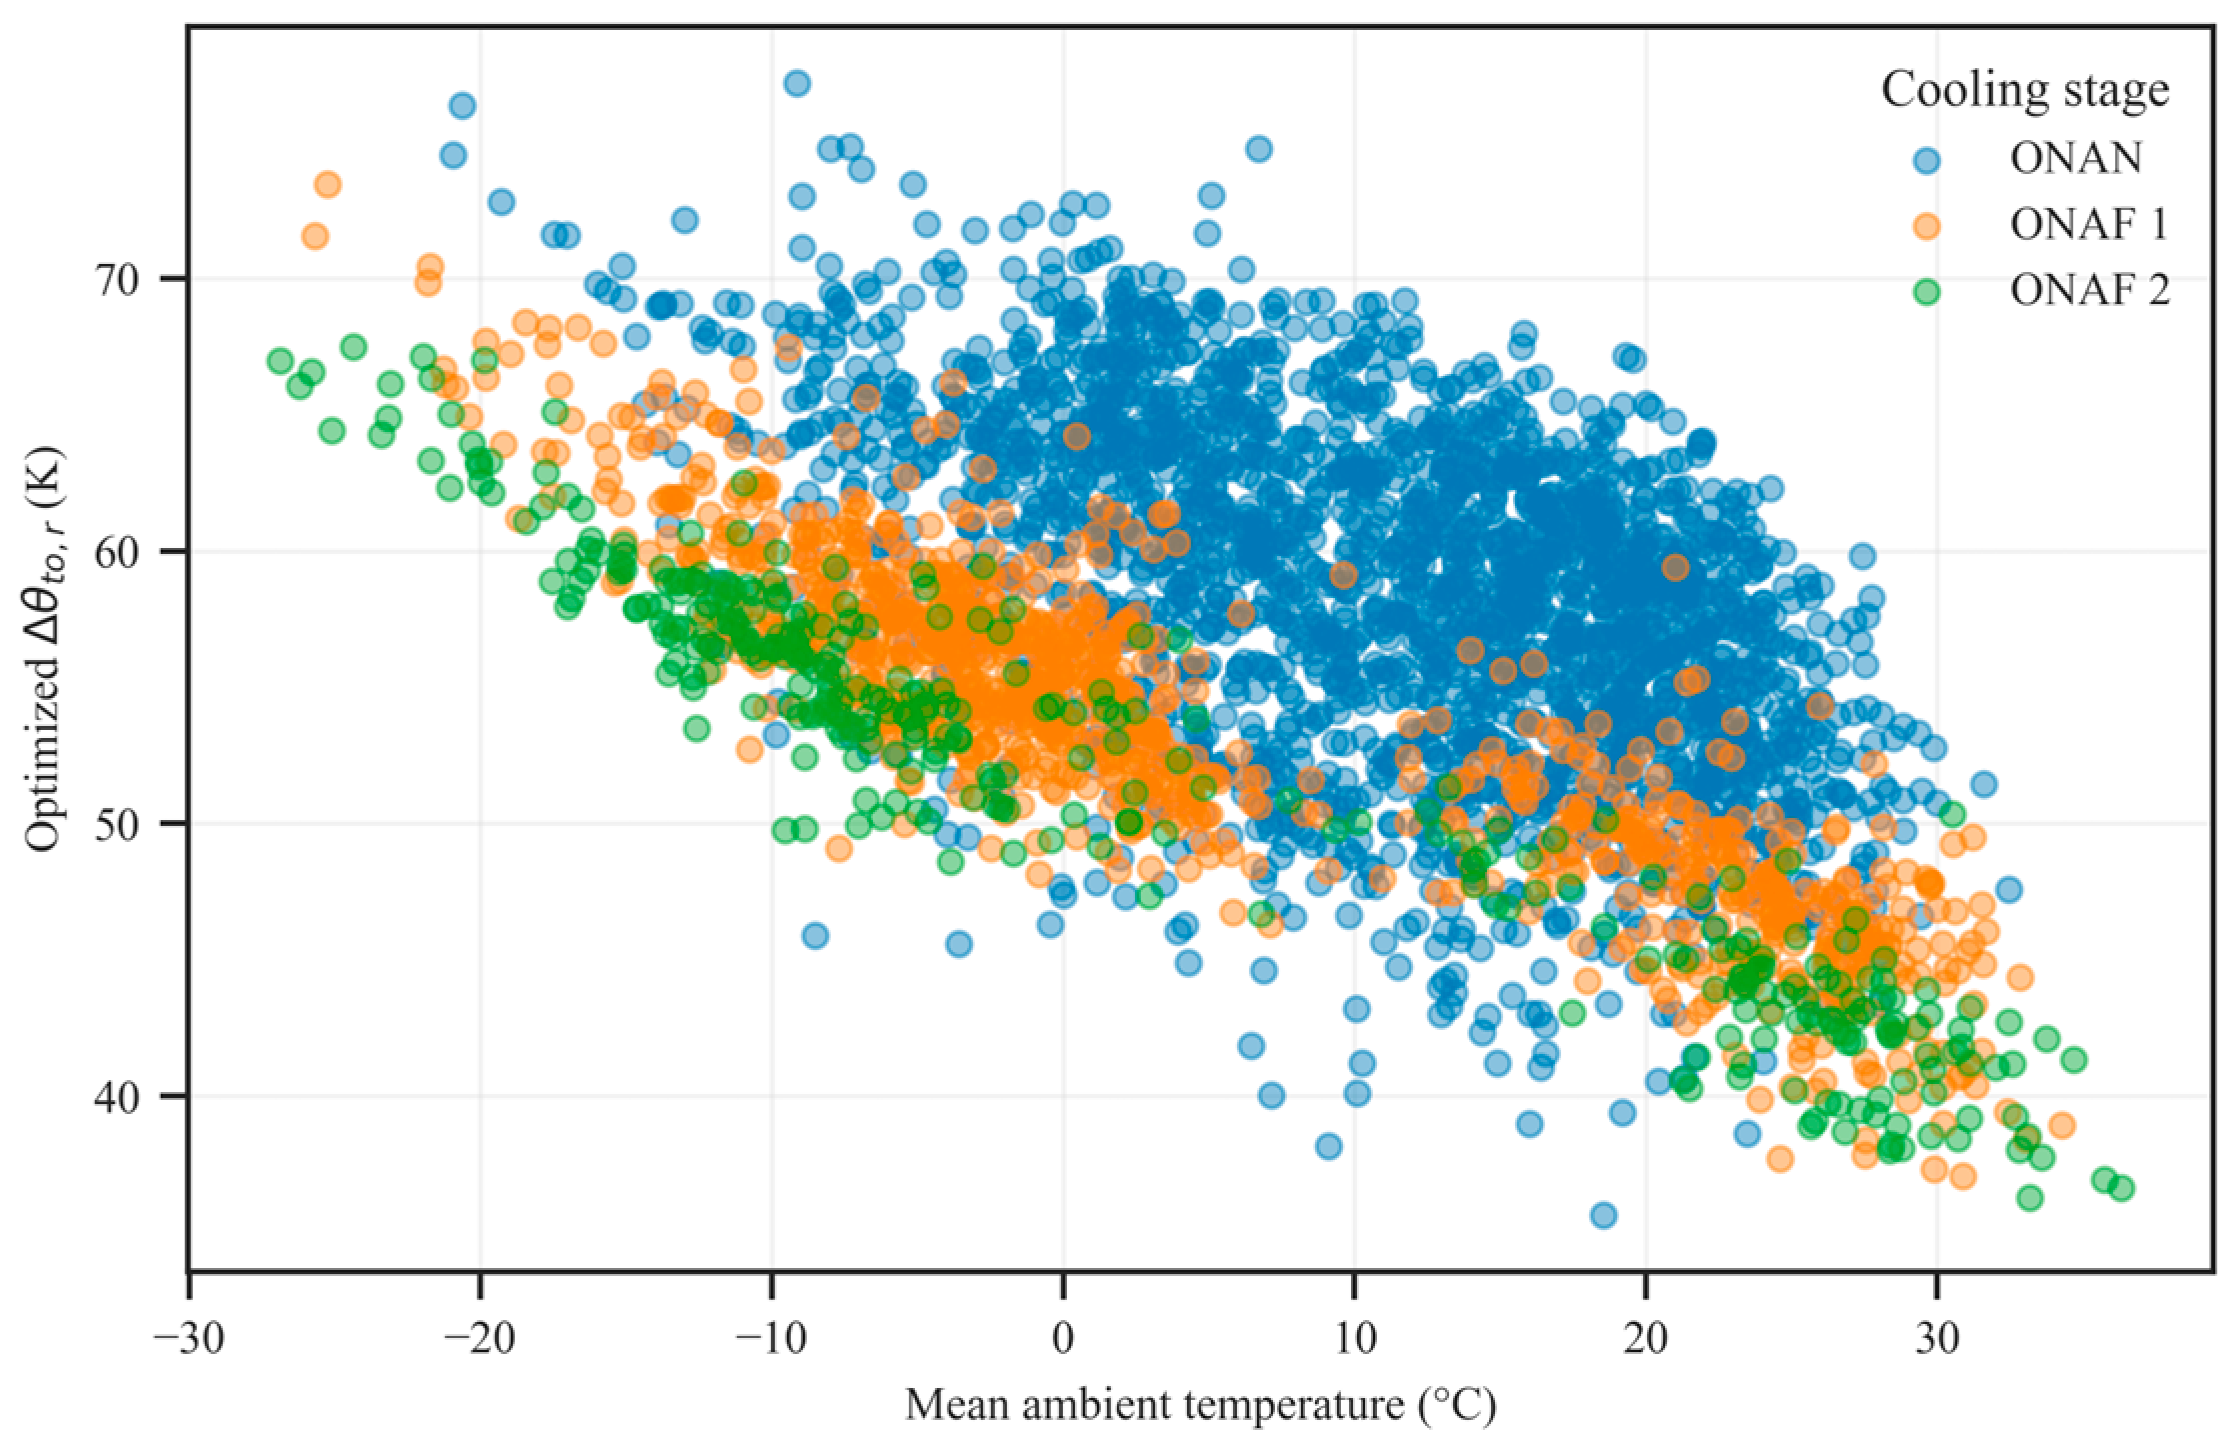
The rated top-oil temperature rise determines the steady-state top-oil temperature elevation above the ambient conditions. Figure 2 illustrates the distribution of the optimized rated top-oil temperature rise values as a function of ambient temperature, with points colored according to the cooling stage. From the figure, it is possible to identify the distinct parameter distributions between the cooling stages.
The average optimized values for ONAN, ONAF 1, and ONAF 2 cooling stages were 58.34 K, 53.43 K, and 51.72 K, respectively. The optimized value for ONAF 2 was close to that observed in [20] (51.30 K), differing by less than 1 K. In contrast, the optimized values obtained for ONAN and ONAF 1 are substantially lower than the corresponding reference values of 89.00 K and 63.10 K. An inverse relationship between the ambient temperature and optimized parameter values was identified across all cooling stages, particularly under forced cooling. As a result, higher ambient temperatures are associated with lower optimized Δ θ t o , r values.
The optimized values of Δ θ t o , r reached exceptionally high values, approaching 80 K, particularly in segments with low ambient temperature. Additionally, the distribution of the optimized rated top-oil temperature rise under ONAN operation showed greater variability than that observed for the forced cooling stages. This behavior may be explained by the unequal distribution of segments among the cooling stages, which provides a broader range of operating conditions during ONAN operation, thereby increasing parameter variability.

3.2.2. Optimization of the Exponent x

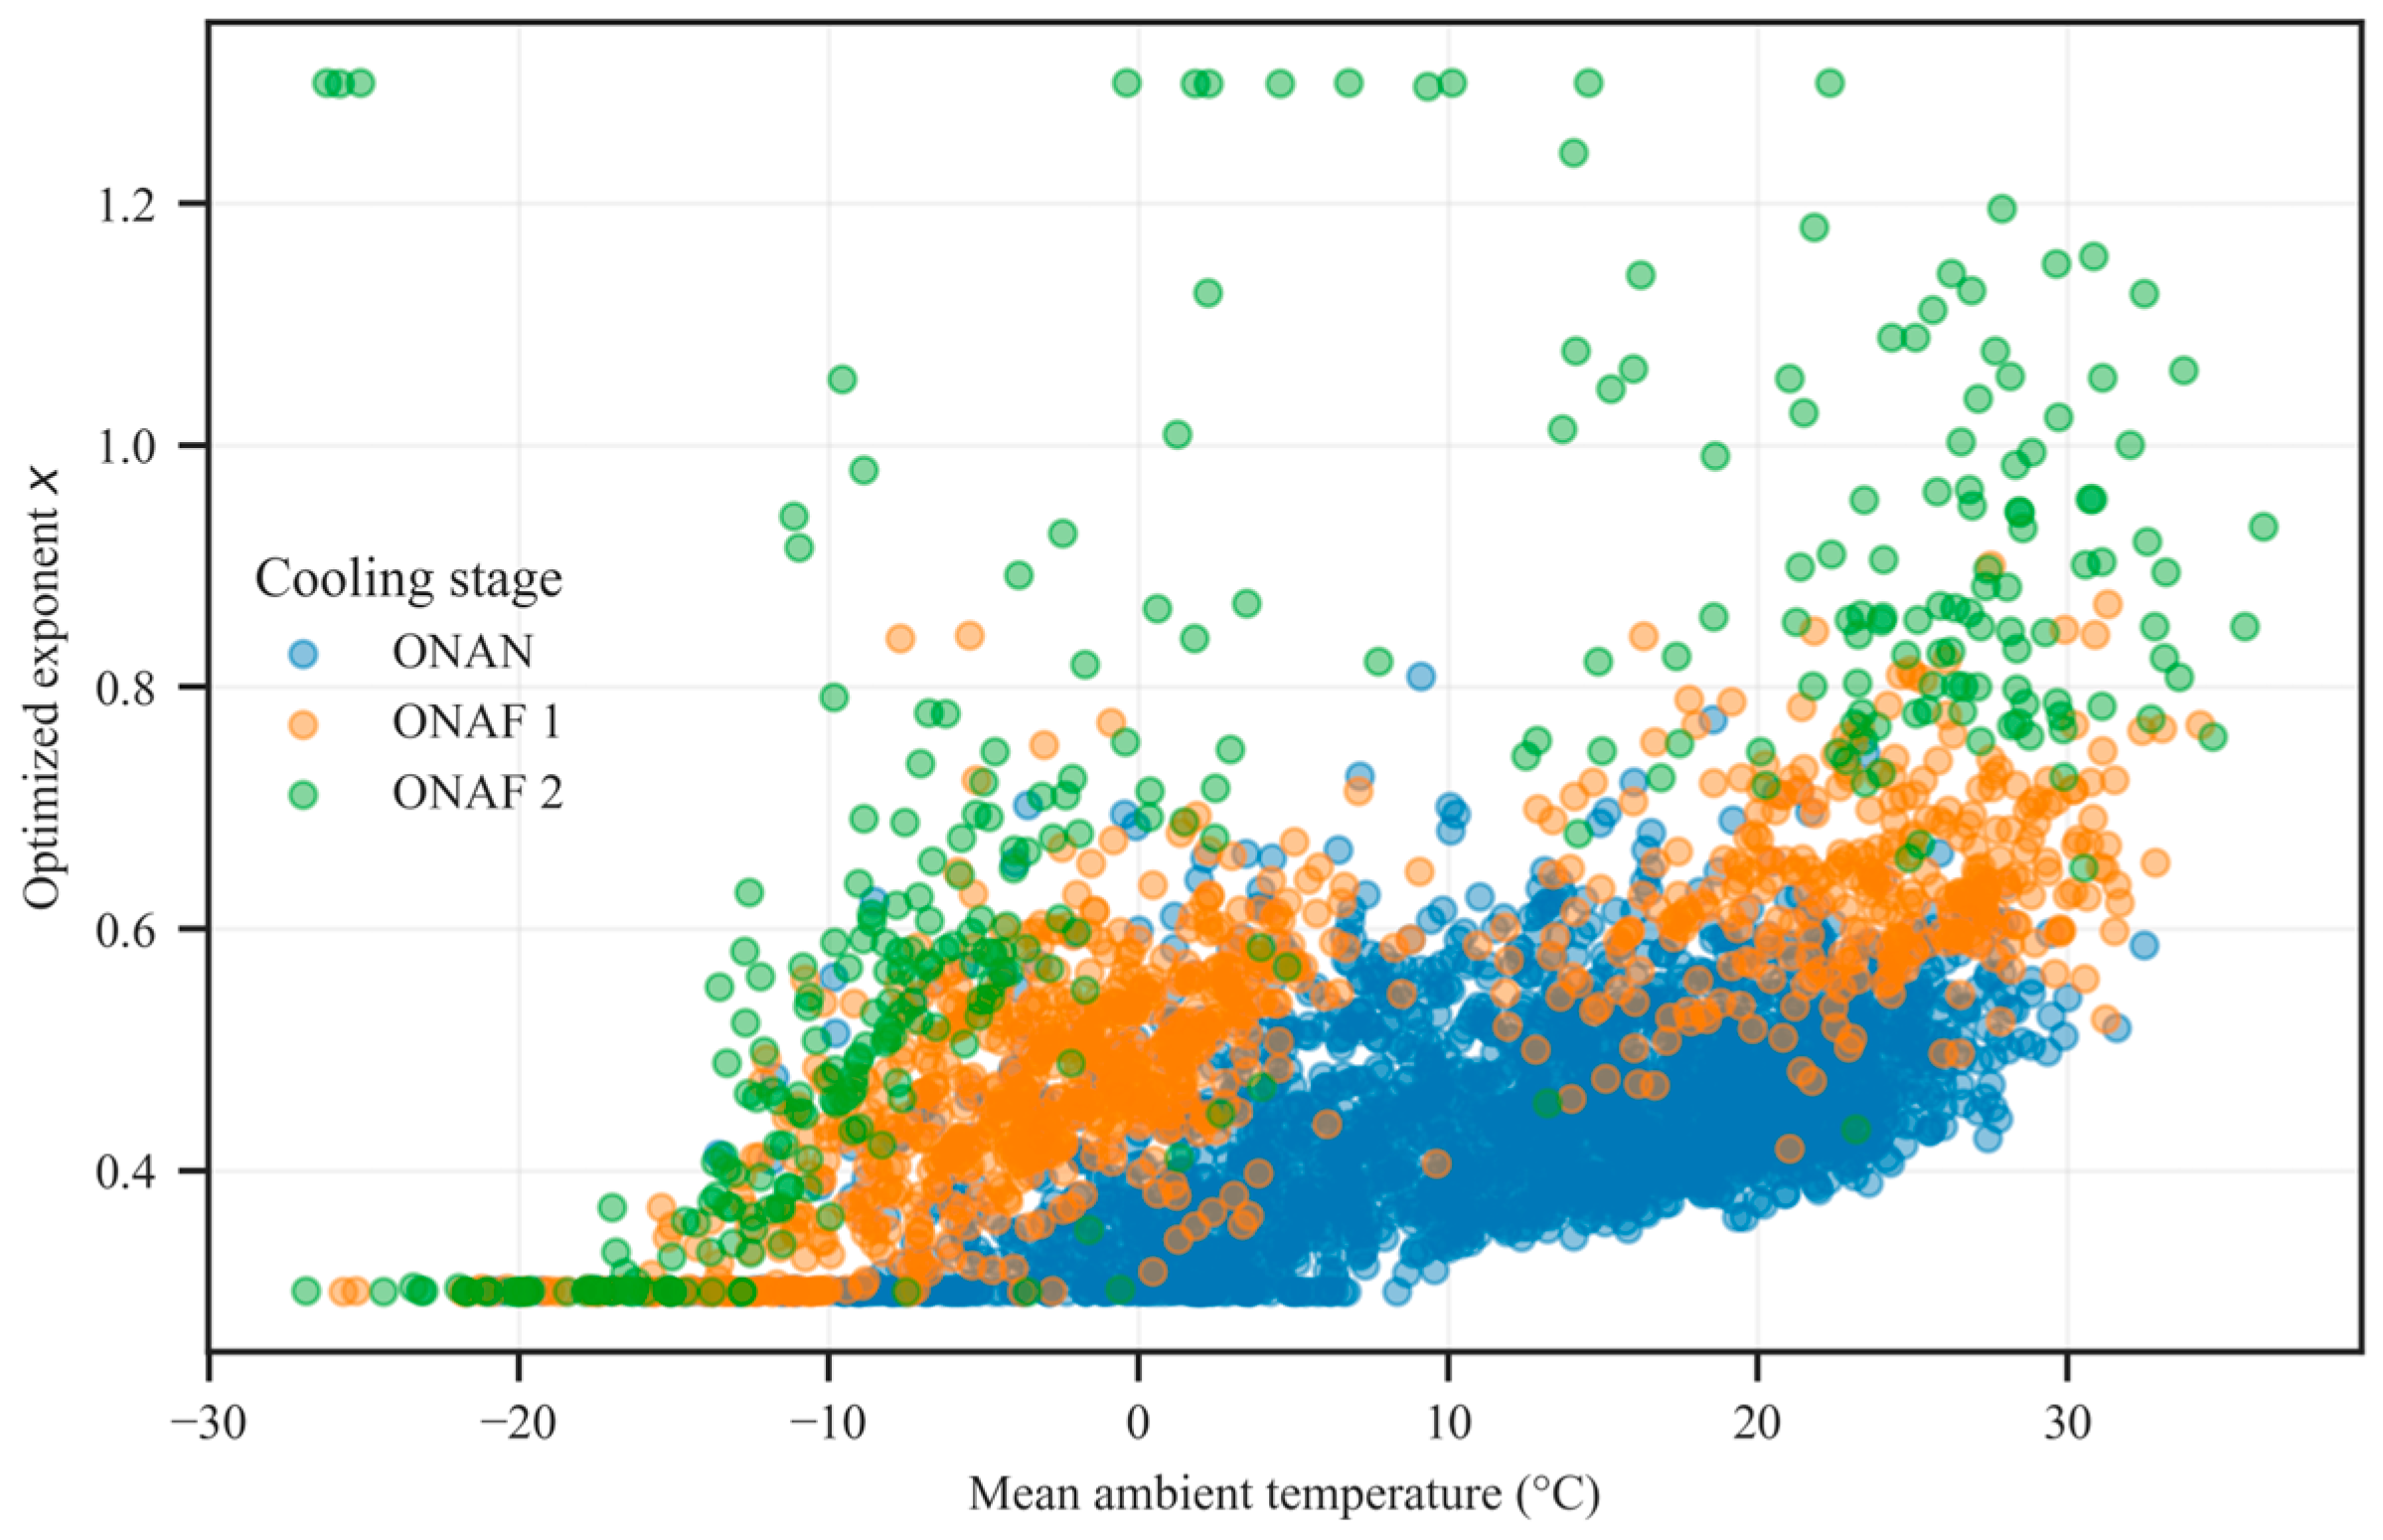
The exponent x dictates how strongly the top-oil temperature rise reacts to load variations. The relationship between the optimized exponent x and mean ambient temperature in the analyzed segments is shown in Figure 3.
The optimized exponent x did not exhibit a clear physical dependence on ambient temperature, but a tendency toward increasing values with increasing ambient temperature was observed, particularly for the ONAN and ONAF 1 cooling stages. Considering the cooling stage, mean values for the exponent x were found to be 0.44, 0.52, and 0.67 for ONAN, ONAF 1, and ONAF 2, respectively. In contrast, the ONAF 2 stage exhibited greater variability, and saturation at the lower optimization bound was observed at lower ambient temperatures, particularly below 10 °C.
Above approximately 10 °C, values close to the lower optimization bound were rarely observed. As the ambient temperature decreased, the proportion of segments associated with reduced exponent values progressively increased and became predominant under very cold conditions. This behavior suggests a progressive collapse of the optimized exponent toward its lower bound at low ambient temperatures.

3.2.3. Joint Optimization and Considerations on Load

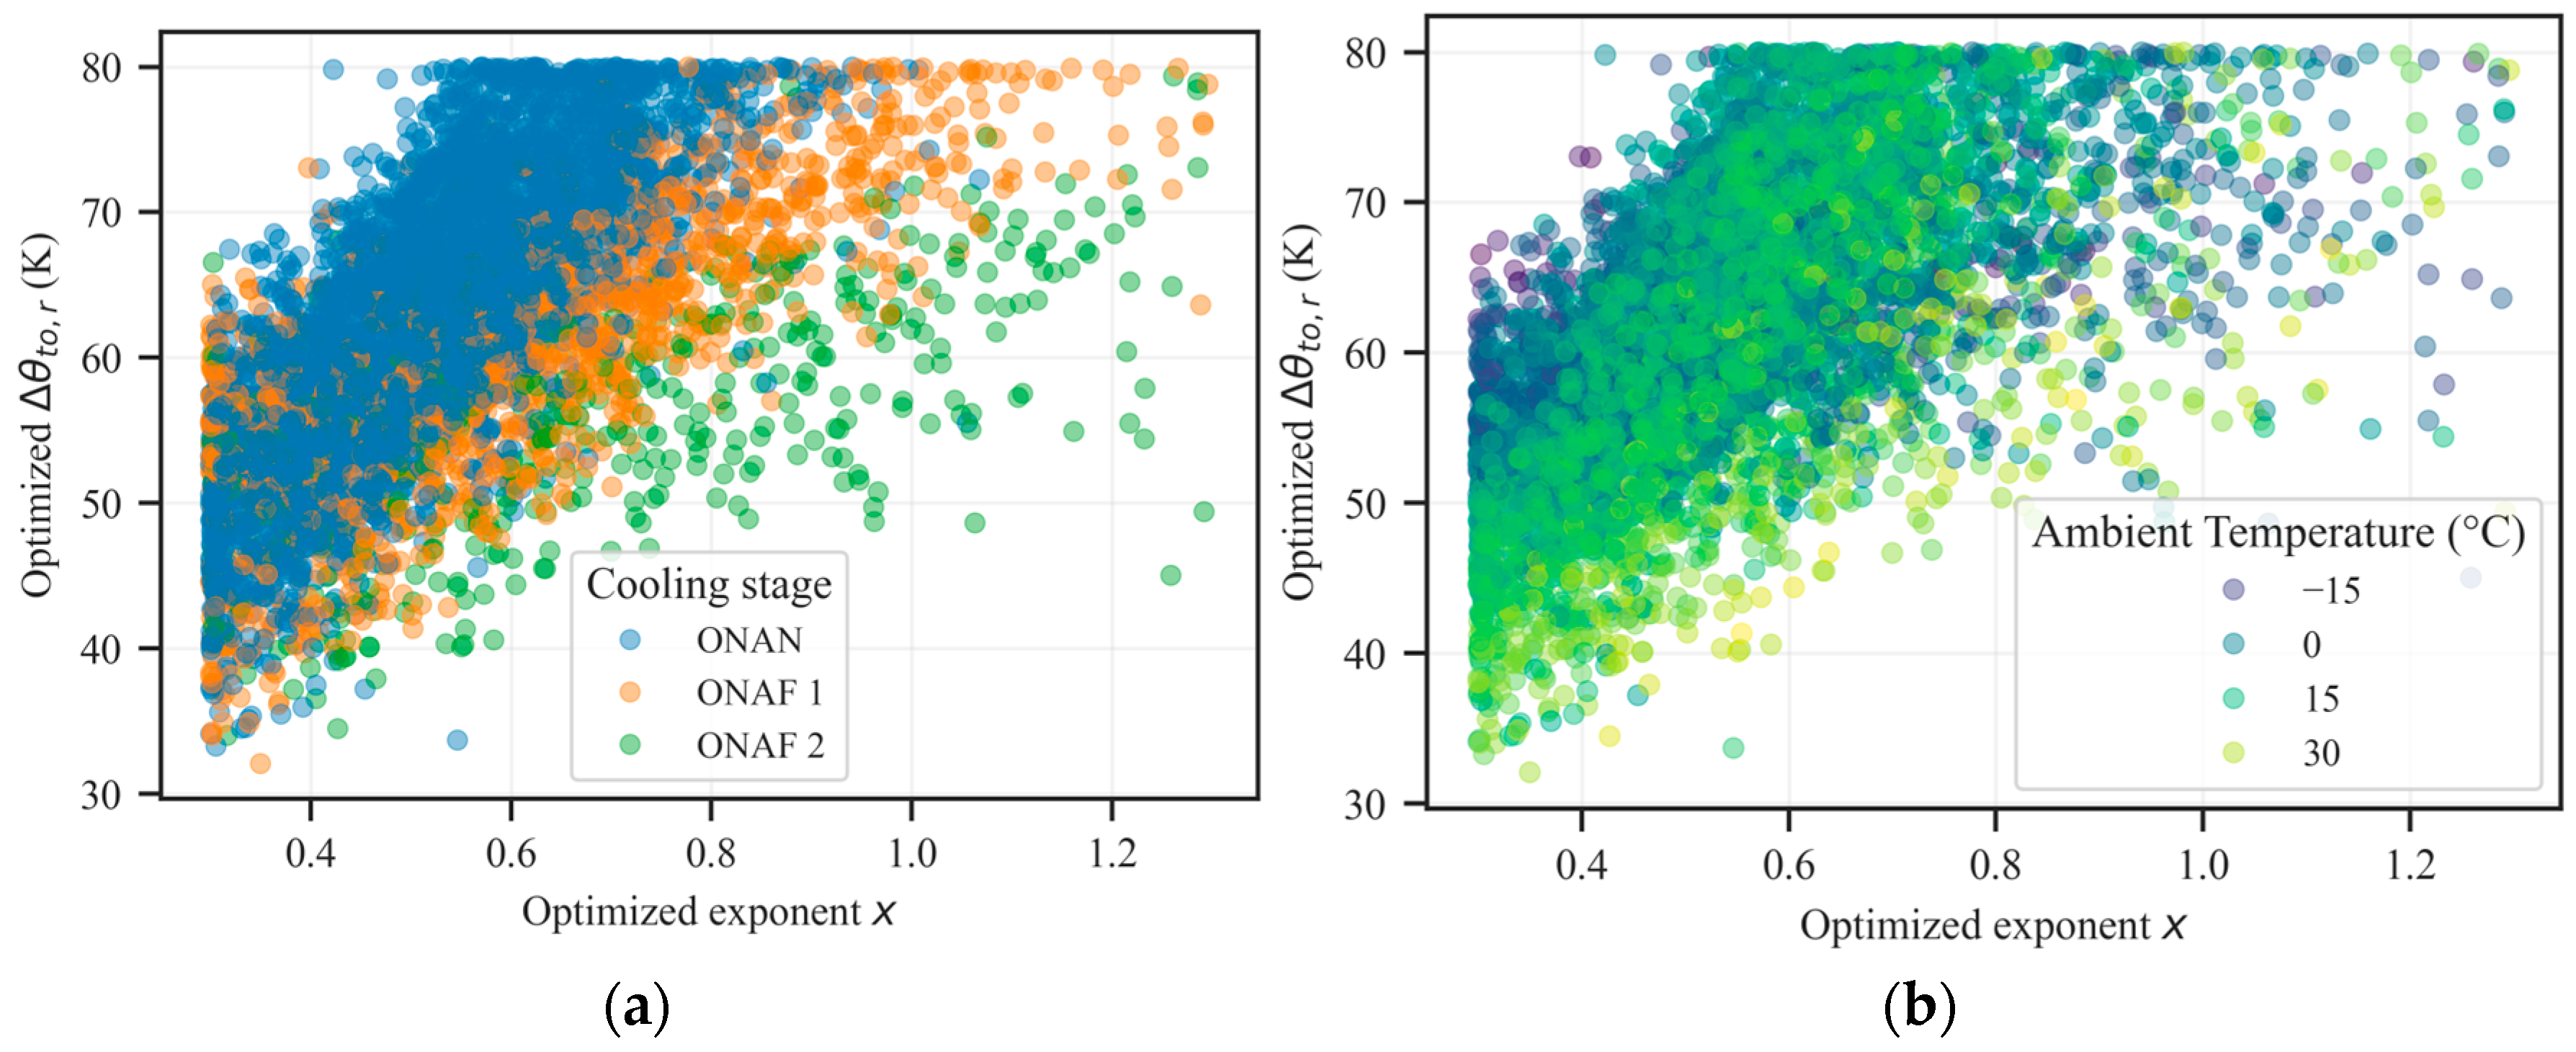
The results of the joint optimization of the exponent x and rated top-oil temperature rise are shown in Figure 4. Figure 4a presents the distribution of optimized parameters, with data points colored by the cooling stage, whereas Figure 4b shows the same distribution colored according to the ambient temperature bins.
The results suggest compensatory behavior between the optimized parameters, resulting in an approximately direct relationship between the exponent x and the rated top-oil temperature rise. The ONAN cooling stage showed a steeper slope when compared to ONAF 1 and ONAF 2, corroborating the dependence of the parameters on the cooling stage. In addition, the optimized exponent x for the ONAF 2 cooling stage presented values closer to the recommended value, reaching and, in some cases, exceeding 0.8.
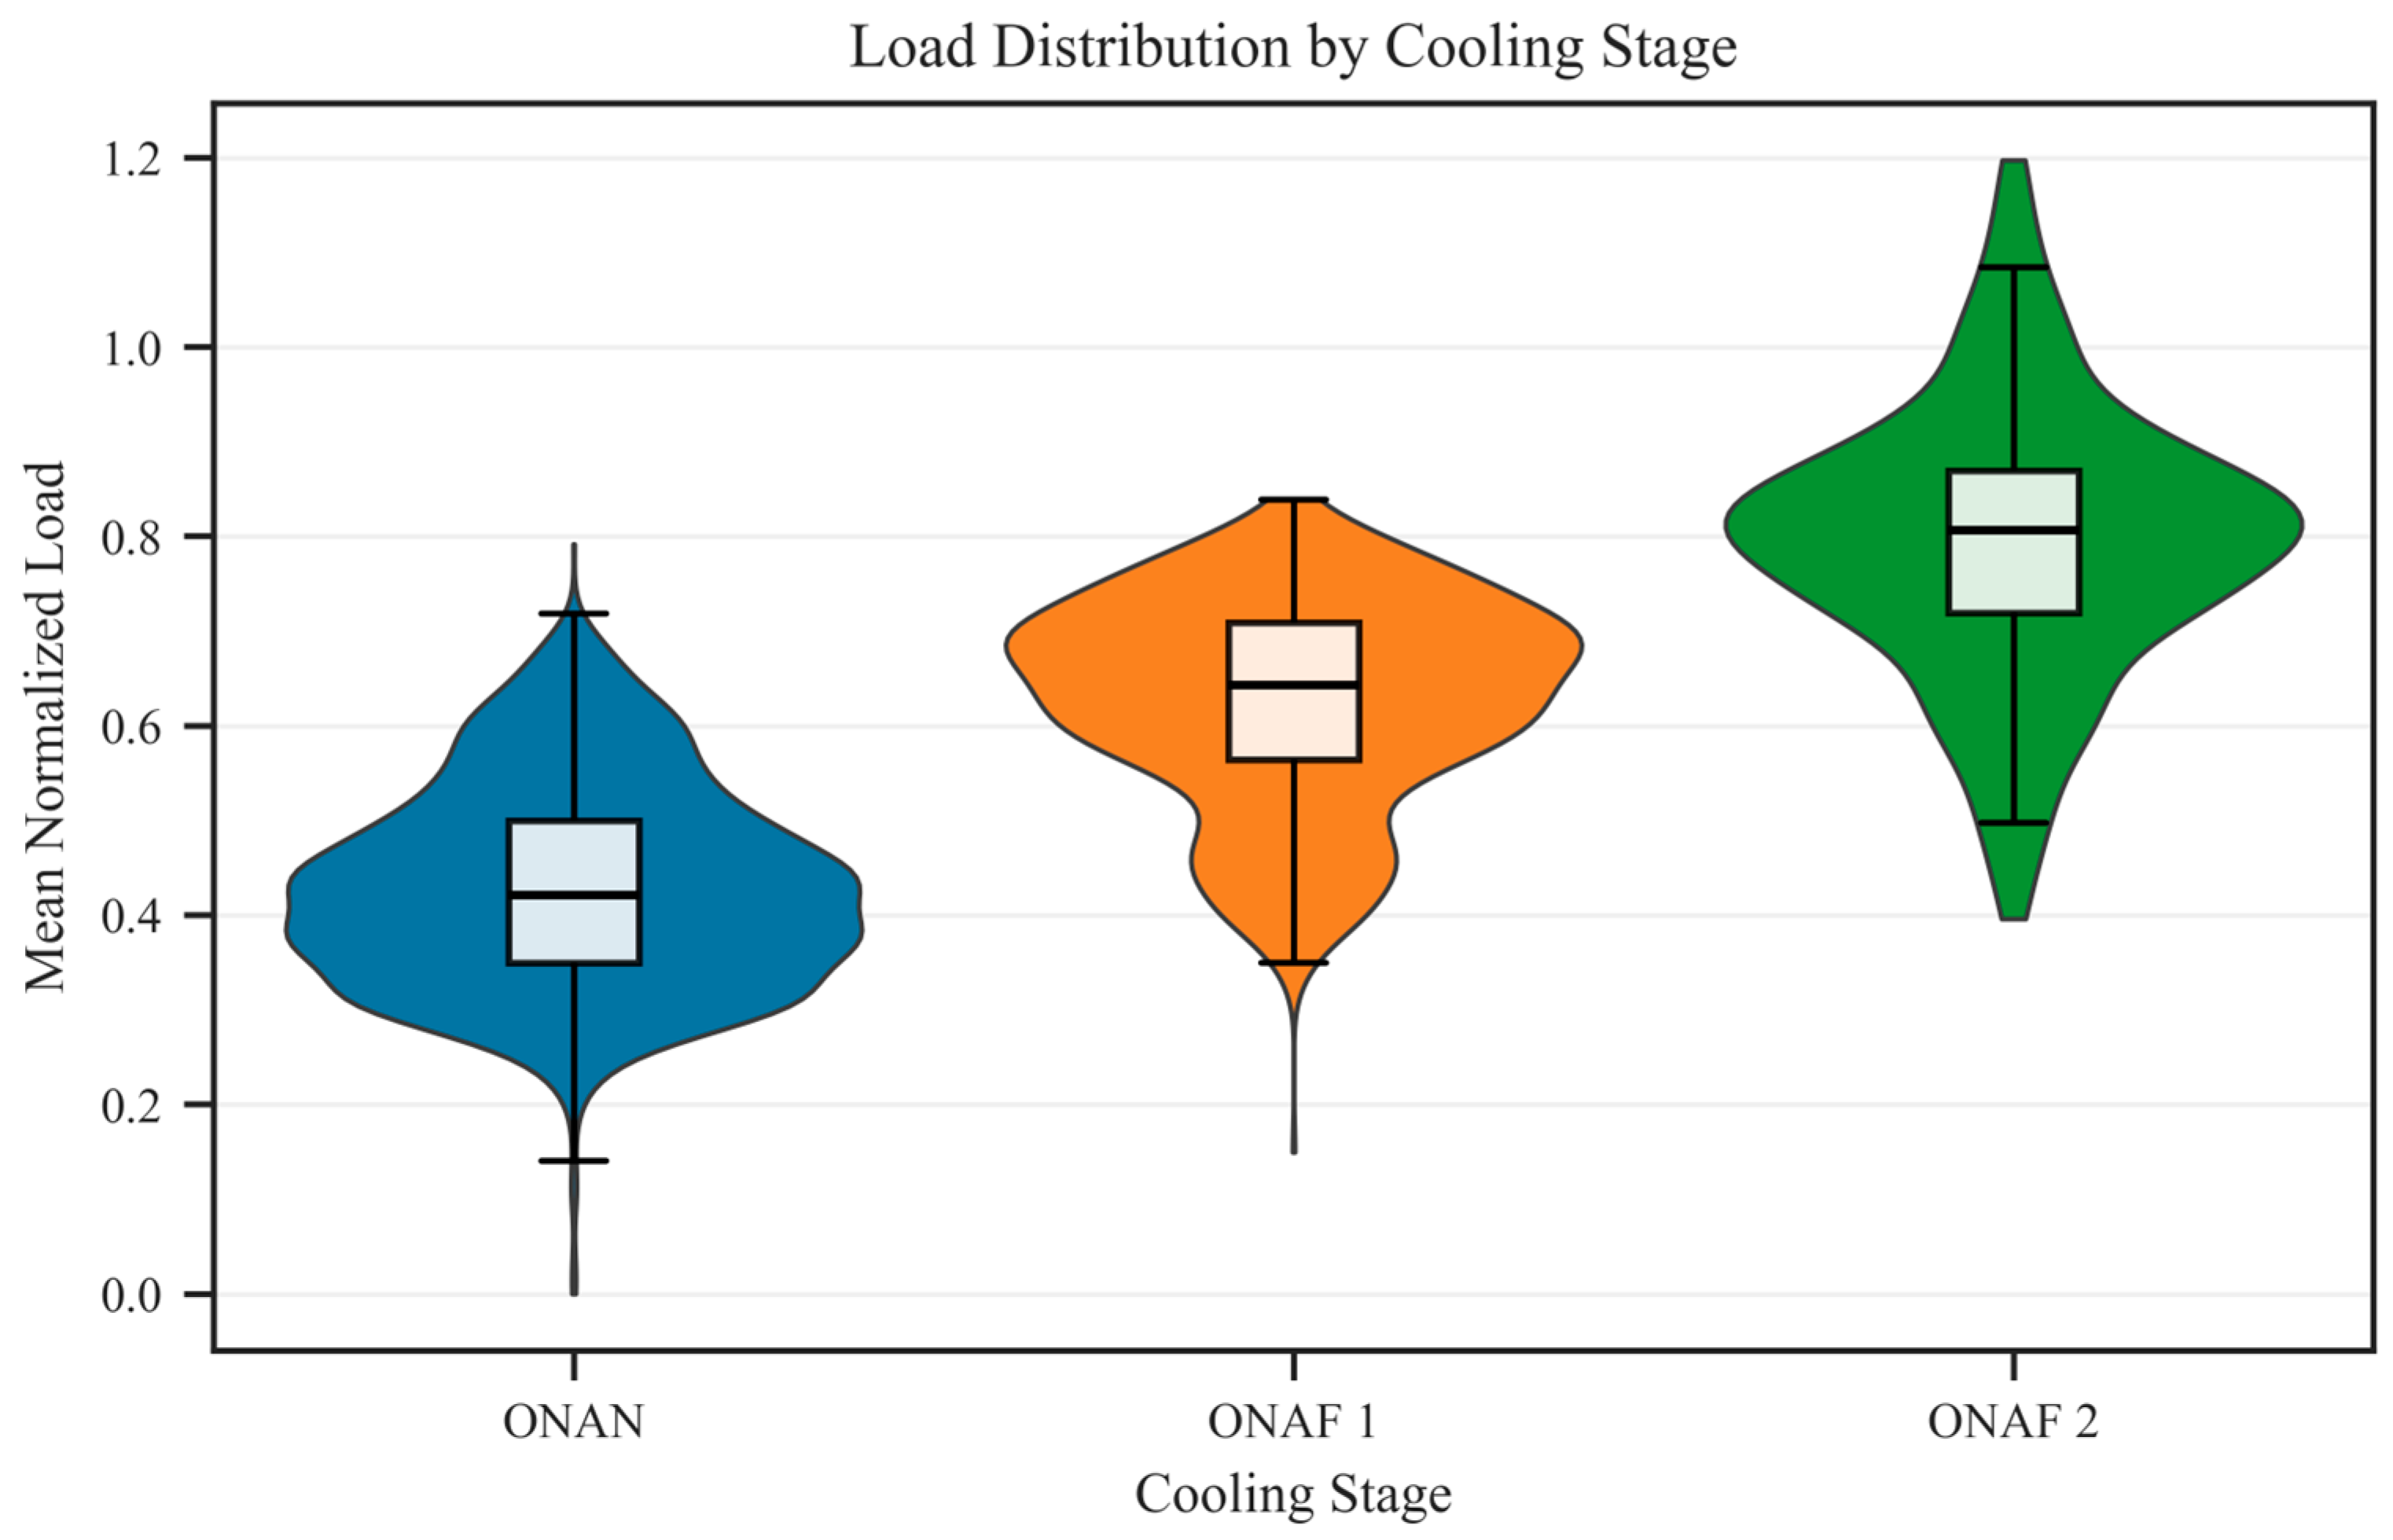
Load factor K is one of the most important inputs of the IEC model. A clear relationship between the load and cooling stages can be observed in Figure 5, which shows the distribution of the normalized load across the cooling stages. The progressive shift in the load distributions toward higher values from ONAN to ONAF 2 indicates that the cooling-stage information captured a substantial portion of the loading behavior. Mean normalized loads increase from approximately 0.42 in ONAN to 0.64 in ONAF 1 and 0.80 in ONAF 2. Although some overlap exists between adjacent stages, reflecting thermal inertia, ambient influences, and control hysteresis, the results demonstrate that the cooling-stage activation serves as a strong operational indicator of transformer loading conditions.

3.2.4. Proposed Approach for Parameterization

The proposed adaptive parameterization is based on linear regression of the rated top-oil temperature rise as a function of the ambient temperature. The parameter was selected because it has a clear physical interpretation and, unlike the exponent x, does not exhibit evident saturation effects within the analyzed range. The fitted lines showed a consistent negative slope, indicating that the optimized-rated top-oil temperature rise decreased as the ambient temperature increased.
Different regression models, including exponential, quadratic, and linear formulations, were evaluated. Table 5 describes the main results obtained through the evaluation. The linear model was selected because of its simplicity and interpretability, considering that other functions provided only marginal improvements. Table 6 reports the fitted parameters for each cooling stage, including their 95% confidence intervals.
The linear regression for forced cooling stages exhibited substantially higher explainability power, with R2 values of 0.7 and 0.90 for ONAF 1 and ONAF 2 cooling stages, respectively. In contrast, the relatively low R2 obtained under ONAN operation (R2 = 0.25) indicates that the ambient temperature alone explains only a limited fraction of the variability in the corresponding effective parameter. The linear formulation under ONAN should therefore be regarded as a parsimonious empirical approximation rather than evidence of a strong physical linear relationship. More complex functional forms were investigated but provided only marginal improvements relative to their additional complexity.

3.2.5. Application

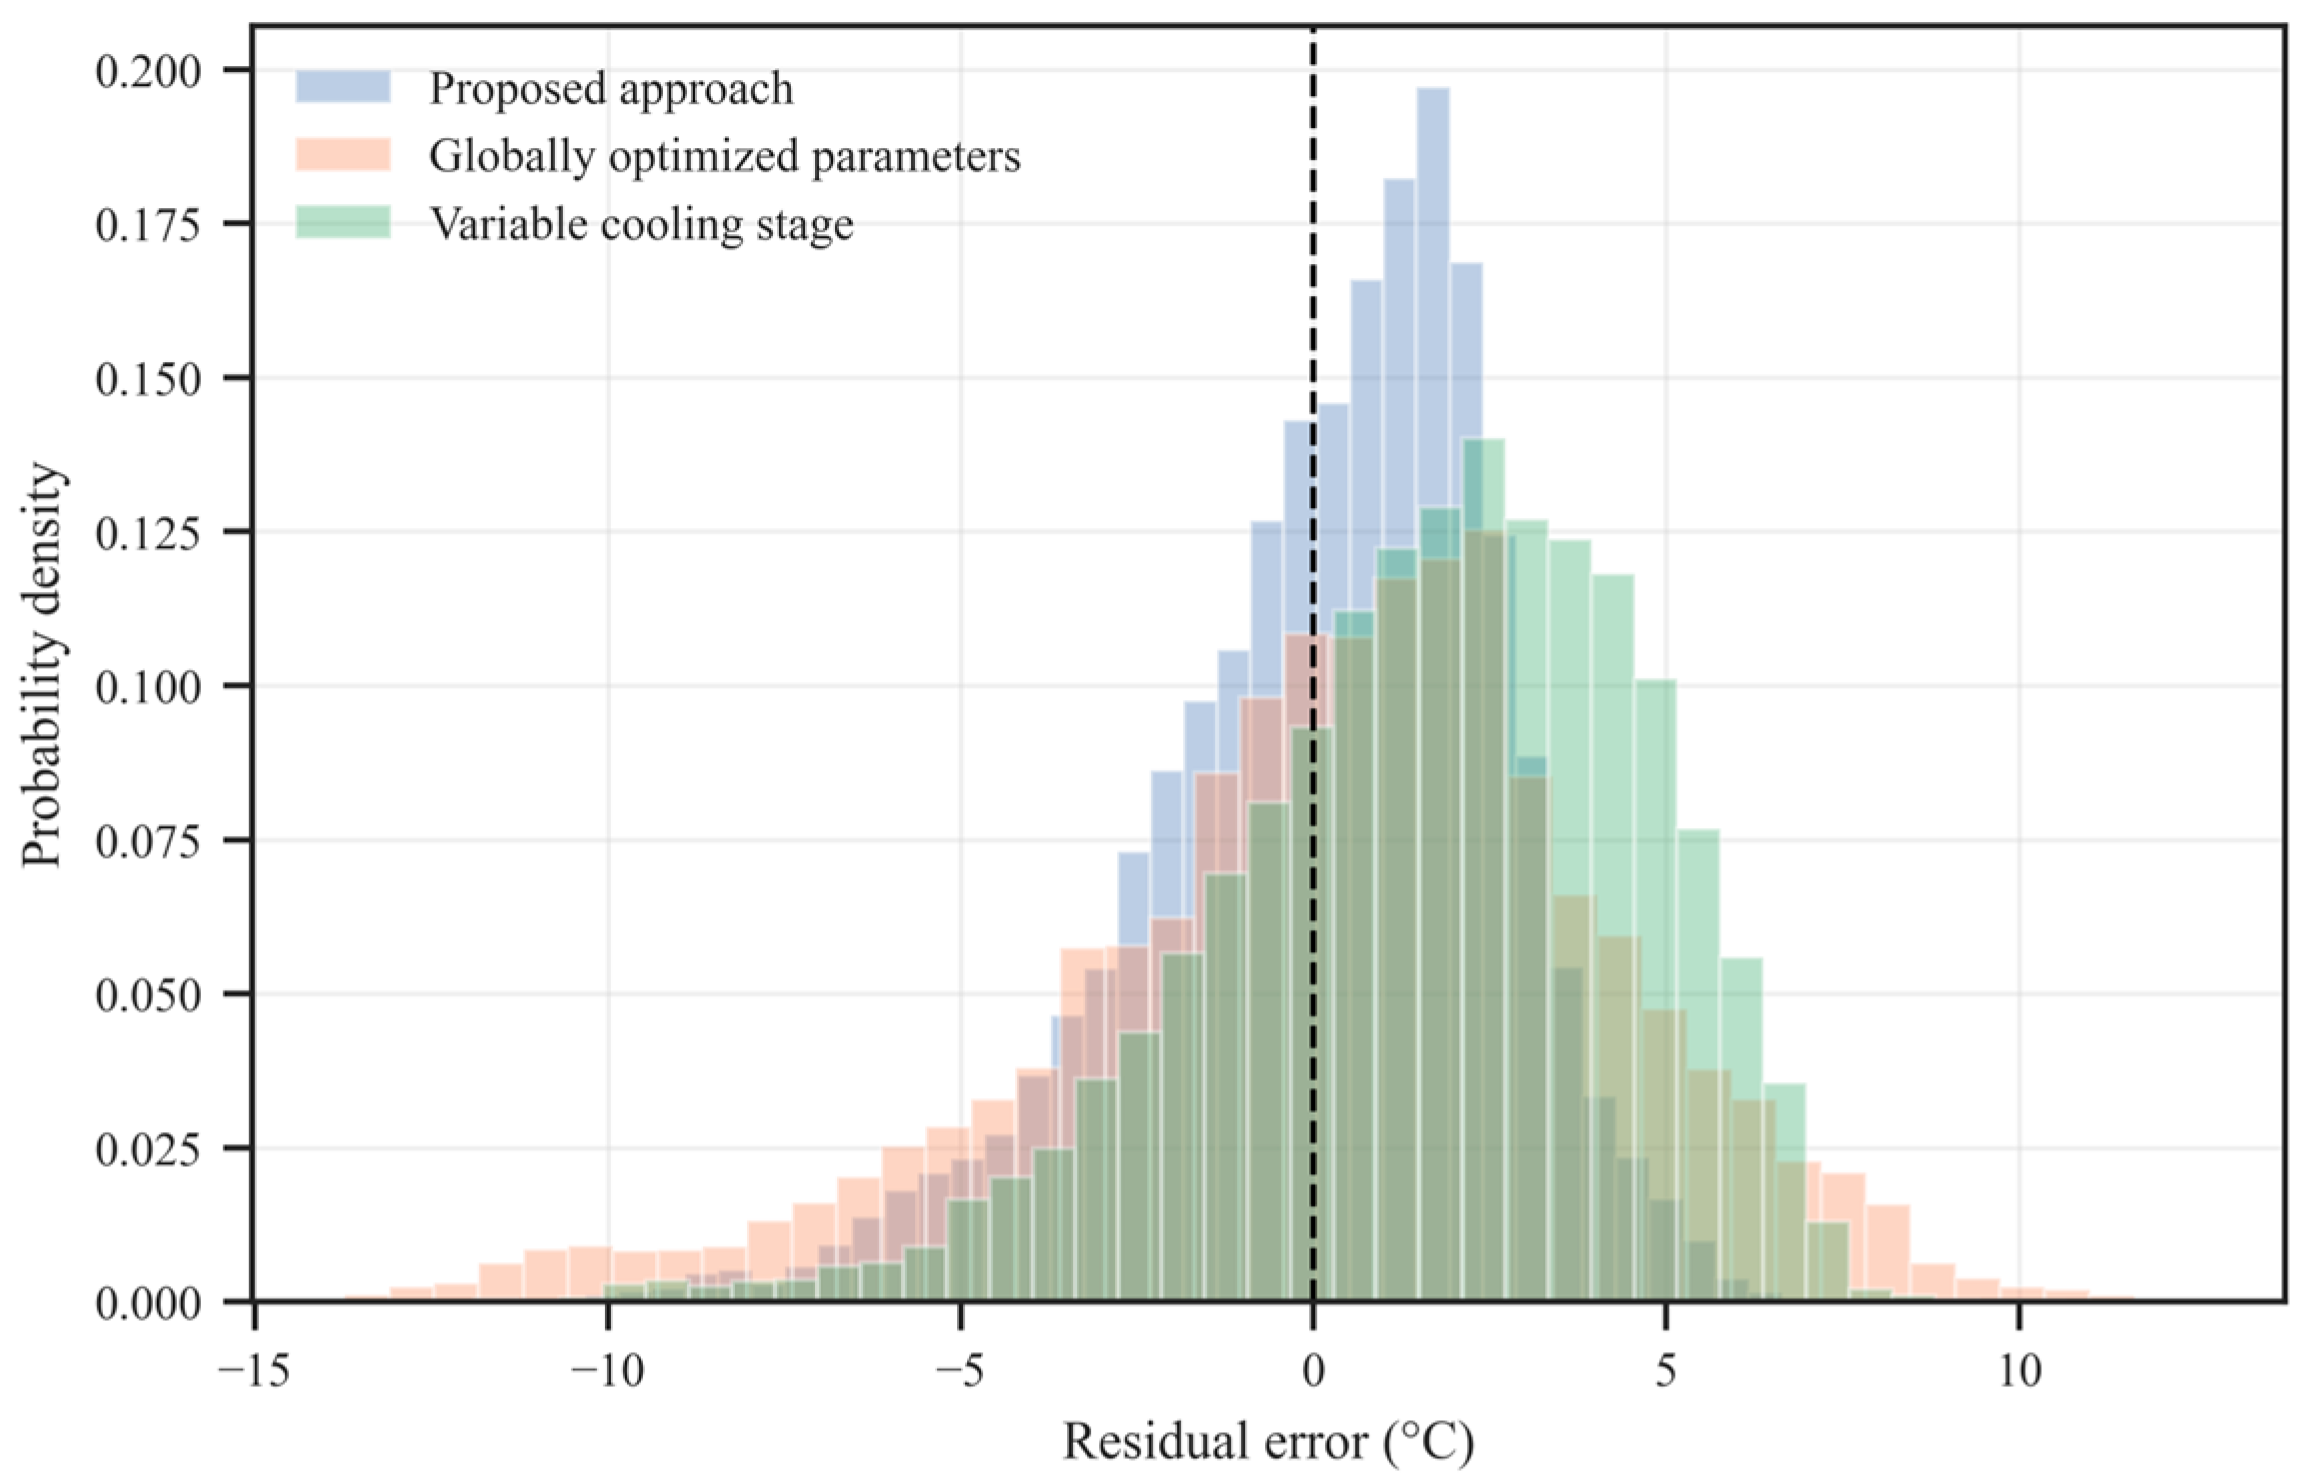
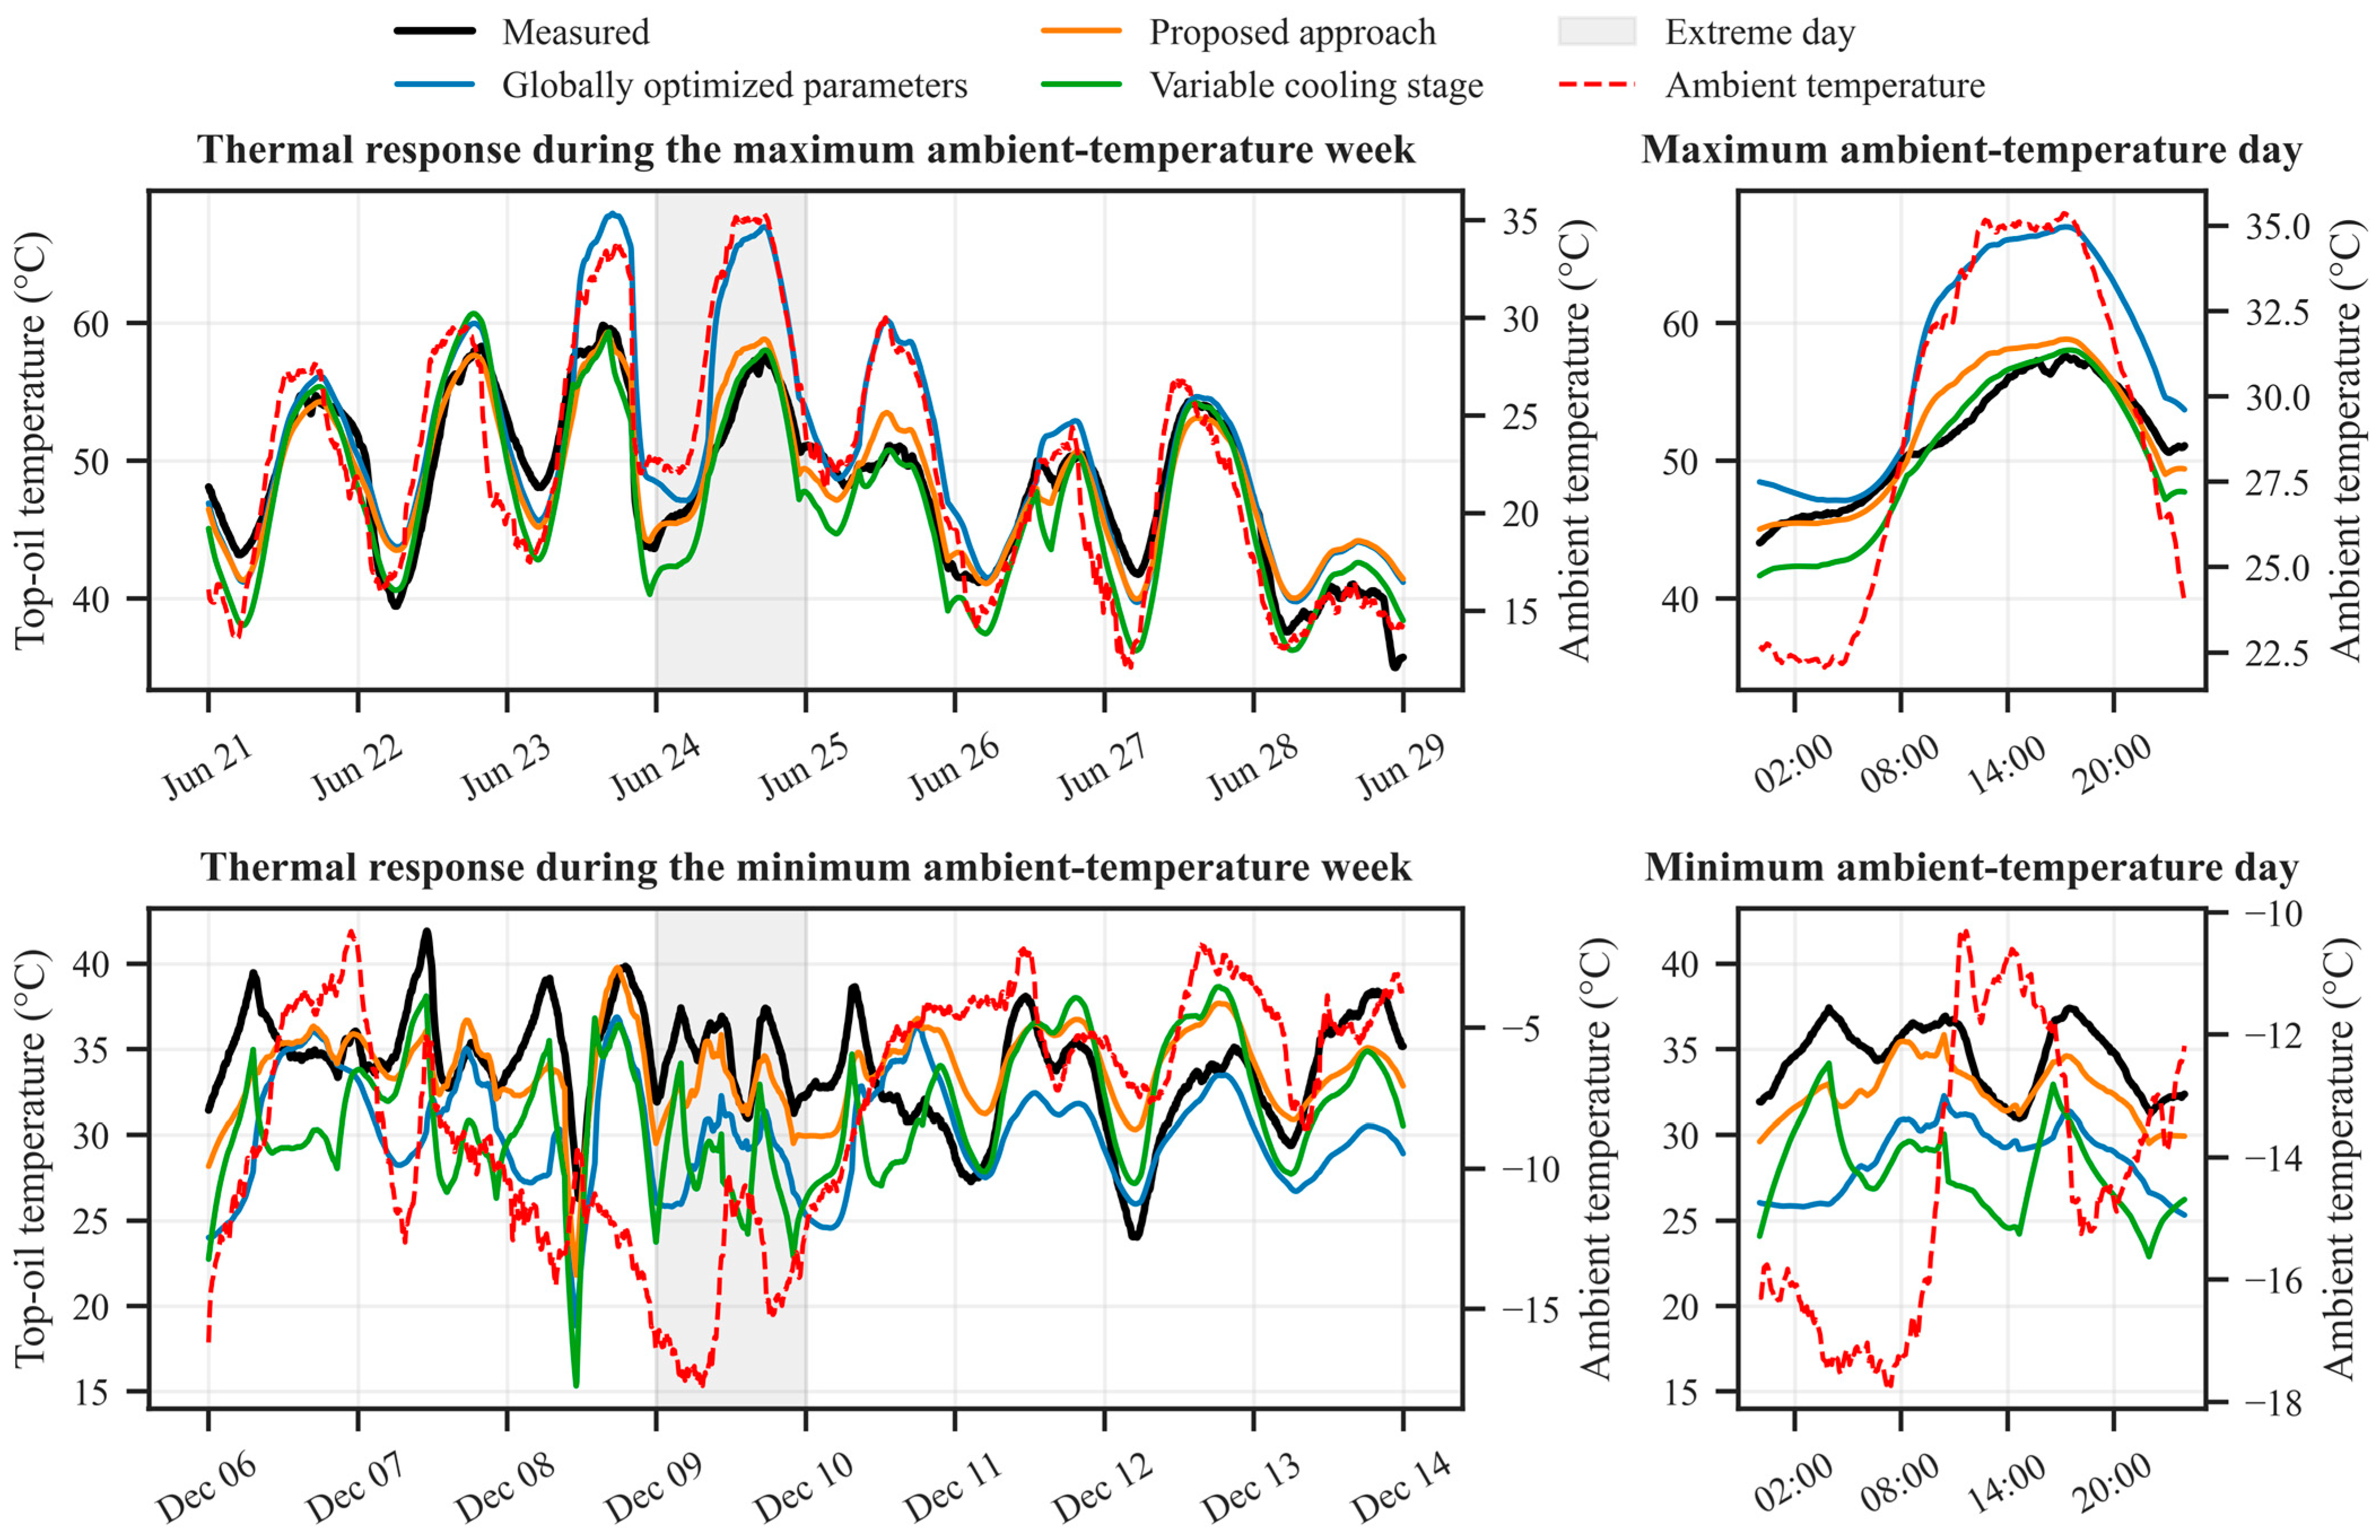
Figure 6 compares the residual distributions of the test dataset obtained using the conventional IEC model with globally optimized parameters, the adaptive model proposed in [20], and the proposed ambient-dependent adaptive IEC model. Figure 7 further compares the models on the coldest and hottest days in the test subset, highlighting their performance under extreme ambient conditions. The proposed adaptive IEC model closely follows the measured top-oil temperature profile across both operating extremes, indicating that the adaptive parameterization effectively captures the influence of ambient temperature on transformer thermal behavior.
Table 7 summarizes the performance metrics for the analyzed models over the entire test subset. Among all considered approaches, the proposed adaptive IEC model achieved the highest prediction accuracy, with an MAE of 2.03 °C, an R2 of 0.86, a bias of 0.13 °C, and a residual standard deviation (STD) of 2.56 °C. These results represent a substantial improvement over both the IEC top-oil thermal model using globally optimized parameters and the adaptive cooling stages model proposed in [20]. It is important to state that the moderate coefficient of determination obtained with the IEC top-oil thermal model using globally optimized parameters is consistent with the simplifying assumptions of the model and suggests that a single set of fixed parameters may not fully capture the range of thermal behaviors observed under varying operating and environmental conditions.
The improvement is not limited to a reduction in prediction error. The results also demonstrate that allowing the effective IEC thermal parameters to evolve with ambient temperature provides a more representative description of transformer thermal dynamics than the conventional assumption of fixed parameters. This finding suggests that ambient-dependent parameterization can improve the applicability of IEC 60076-7 under realistic operating conditions characterized by seasonal and environmental variability.

3.2.6. Limitations of the Proposed Approach

Although the proposed approach significantly improves top-oil temperature prediction, the optimized parameters should not be interpreted as intrinsic or uniquely identifiable physical properties of the transformer. The coupling among IEC model parameters may result in parameter compensation, whereby different parameter combinations produce similar thermal responses. The identified parameters are therefore treated as effective model quantities representing the combined influence of environmental and operating conditions and the simplifying assumptions inherent in the IEC thermal model. Accordingly, statistical associations between individual optimized parameters and ambient temperature should not be interpreted as direct evidence of physical causation.
Another limitation concerns the generalizability of the proposed parameter relationships. The methodology was developed using field measurements from a single transformer. Although the identified trends appear physically consistent, their applicability to transformers with different ratings, cooling configurations, insulation systems, or climatic conditions remains to be demonstrated.
Nevertheless, the observed systematic variation in the optimized parameters with ambient temperature highlights the limitations of the conventional constant-parameter assumption adopted in IEC 60076-7. Rather than assigning direct physical meaning to the optimized parameters, the proposed framework should be viewed as an adaptive thermal modeling approach that captures the influence of environmental conditions on the effective thermal response of the transformer.
Future work should extend the methodology to multiple transformers and operating environments while incorporating additional explanatory variables, such as transformer loading, oil ageing, wind speed, and solar radiation. Such investigations would contribute to establishing the robustness and generalizability of the proposed ambient-dependent parameterization framework.


4. Conclusions

This study investigates the influence of ambient temperature on the optimized parameters of the IEC 60076-7 top-oil thermal model. The segmented optimization approach enabled the identification of systematic ambient-dependent variations in the model parameters and demonstrated that adaptive parameterization significantly improved the top-oil temperature prediction accuracy compared with the conventional IEC formulation. Although the present work focused on top-oil temperature prediction, the proposed methodology can be extended to hot-spot thermal modeling, provided that the faster thermal dynamics associated with winding temperatures are appropriately considered.
The obtained results demonstrate that the effective IEC model parameters should not be regarded as constant under varying environmental conditions. Instead, they evolve systematically with ambient temperature, suggesting that the conventional constant-parameter assumption of the IEC loading guide may not fully capture transformer thermal behavior under realistic operating conditions. Furthermore, understanding how optimized parameters vary with environmental conditions supports the development of more adaptive monitoring and thermal assessment methodologies, and serves as a starting point for new units that lack sufficient historical data for parameterization, thereby reducing the reliance on extended temperature rise tests.
The linear relationships identified between ambient temperature and the optimized parameters make the proposed adaptive formulation both practical and computationally efficient for engineering applications. In particular, the effective exponent x exhibits an increasing tendency with ambient temperature in the dataset investigated, whereas the effective top-oil thermal gradient shows an inverse relationship. The observed trends indicate that the effective IEC model parameters exhibit condition-dependent variability associated with ambient temperature. Within the proposed framework, ambient temperature can therefore serve as an informative covariate for adaptive parameterization and improved top-oil temperature prediction. However, these statistical relationships should not be interpreted as evidence of direct changes in specific physical heat-transfer mechanisms. This observation provides a new perspective on adaptive thermal modeling and contributes to improving transformer thermal management under increasingly variable climatic and loading conditions associated with energy transitions.
The present work nevertheless represents an initial step toward adaptive IEC thermal modeling. Additional operational and environmental variables—including transformer loading, seasonal effects, wind speed, solar radiation, and insulation aging—may also influence effective model parameters. Future investigations involving multiple transformers operating under diverse climatic conditions will be necessary to assess the generalizability of the proposed parameterization framework. At the present stage, the identified effective parameter relationships should be considered transformer-specific rather than universal. New studies can determine if the observed trends can provide initial estimates for transformers with limited historical data. As operational data becomes available, the initial relationships can be refined for individual equipment.

Author Contributions

Conceptualization, J.P.d.C.S. Methodology, J.P.d.C.S.; Programming, J.P.d.C.S.; Funding acquisition, I.F. and P.P.; Formal analysis, J.P.d.C.S.; Writing—original draft, J.P.d.C.S.; Writing—review and editing, I.F., P.P. and A.Z.; Supervision, I.F., P.P. and A.Z. All authors have read and agreed to the published version of the manuscript.

Funding

Canada Research Chairs Program (CRC-2021-00453); Natural Sciences and Engineering Research Council of Canada (NSERC) (ALLRP 602379-24).

Data Availability Statement

The data are not publicly available due to privacy restrictions.

Conflicts of Interest

Authors Patrick Picher and Arnaud Zinflou were employed by Hydro-Québec (IREQ). The remaining authors declare that the research was conducted in the absence of any commercial or financial relationships that could be construed as potential conflicts of interest.

References

  1. Duan, R. Real-Time Hotspot Tracing and Model Analysis of a Distributed Optical Fiber Sensor Integrated Power Transformer. IEEE Access 2022, 10, 57242–57254. [Google Scholar] [CrossRef] [Scilit]
  2. Swift, G.; Molinski, T.S.; Lehn, W. A Fundamental Approach to Transformer Thermal Modeling. I. Theory and Equivalent Circuit. IEEE Trans. Power Deliv. 2001, 16, 171–175. [Google Scholar] [CrossRef] [Scilit]
  3. Swift, G.; Molinski, T.S.; Bray, R.; Menzies, R. A Fundamental Approach to Transformer Thermal Modeling. II. Field Verification. IEEE Trans. Power Deliv. 2001, 16, 176–180. [Google Scholar] [CrossRef] [Scilit]
  4. Susa, D. Dynamic Thermal Modelling of Power Transformers. Doctoral Dissertation, Helsinki University of Technology, Espoo, Finland, 2005. [Google Scholar]
  5. Susa, D.; Lehtonen, M.; Nordman, H. Dynamic Thermal Modelling of Power Transformers. IEEE Trans. Power Deliv. 2005, 20, 197–204. [Google Scholar] [CrossRef] [Scilit]
  6. Susa, D.; Lehtonen, M. Dynamic Thermal Modeling of Power Transformers: Further Development—Part I. IEEE Trans. Power Deliv. 2006, 21, 1961–1970. [Google Scholar] [CrossRef] [Scilit]
  7. Susa, D.; Lehtonen, M. Dynamic Thermal Modeling of Power Transformers: Further Development—Part II. IEEE Trans. Power Deliv. 2006, 21, 1971–1980. [Google Scholar] [CrossRef]
  8. IEEE C57.91; IEEE Guide for Loading Mineral-Oil-Immersed Transformers and Step-Voltage Regulators. IEEE: New York, NY, USA, 2012.
  9. IEC 60076-7; Power Transformers—Part 7: Loading Guide for Mineral-Oil-Immersed Power Transformers. IEC: Geneva, Switzerland, 2017.
  10. Galdi, V.; Ippolito, L.; Piccolo, A.; Vaccaro, A. Neural Diagnostic System for Transformer Thermal Overload Protection. IEE Proc. Electr. Power Appl. 2000, 147, 415. [Google Scholar] [CrossRef] [Scilit]
  11. Galdi, V.; Ippolito, L.; Piccolo, A.; Vaccaro, A. Application of Local Memory-Based Techniques for Power Transformer Thermal Overload Protection. IEE Proc. Electr. Power Appl. 2001, 148, 163. [Google Scholar] [CrossRef] [Scilit]
  12. CIGRE WG A2.38; Transformer Thermal Modelling. CIGRE: Paris, France, 2016.
  13. Aslam, M.; Haq, I.U.; Rehan, M.S.; Basit, A.; Arif, M.; Khan, M.I.; Sadiq, M.; Arbab, M.N. Dynamic Thermal Model for Power Transformers. IEEE Access 2021, 9, 71461–71469. [Google Scholar] [CrossRef] [Scilit]
  14. Ruan, J.; Deng, Y.; Quan, Y.; Gong, R. Inversion Detection of Transformer Transient Hot Spot Temperature. IEEE Access 2021, 9, 7751–7761. [Google Scholar] [CrossRef] [Scilit]
  15. Lesieutre, B.C.; Hagman, W.H.; Kirtley, J.L., Jr. An Improved Transformer Top Oil Temperature Model for Use in An On-Line Monitoring and Diagnostic System. IEEE Trans. Power Deliv. 1997, 12, 249–256. [Google Scholar] [CrossRef] [Scilit]
  16. Perez Barrios, R.J.; Matos, E.; Fernandez Garcia, S.J. Identification of the Nonlinear Model proposed by the MIT for Power Transformer applying Genetic Algorithms. IEEE Lat. Am. Trans. 2009, 7, 636–642. [Google Scholar] [CrossRef]
  17. Galdi, V.; Ippolito, L.; Piccolo, A.; Vaccaro, A. Parameter Identification of Power Transformers Thermal Model via Genetic Algorithms. Electr. Power Syst. Res. 2001, 60, 107–113. [Google Scholar] [CrossRef] [Scilit]
  18. Angel Gonzalez-Cagigal, M.; Antonio Rosendo-Macias, J.; Gomez-Exposito, A. Parameter Estimation for Hot-Spot Thermal Model of Power Transformers Using Unscented Kalman Filters. J. Mod. Power Syst. Clean Energy 2023, 11, 634–642. [Google Scholar] [CrossRef] [Scilit]
  19. Vilaithong, R.; Tenbohlen, S.; Stirl, T. Improved Top-Oil Temperature Model for Unsteady-State Conditions of Power Transformers. In Proceedings of the XIVth International Symposium on High Voltage Engineering, Beijing, China, 25–29 August 2005. [Google Scholar]
  20. Gradnik, T.; Zhang, X.; Lupandina, I.; Desquiens, R.; Portillo, A.; Portillo, F.; Picher, P.; Radakovic, Z. Improvement and Validation of IEC Dynamic Transformer Thermal Model. In Proceedings of the Study Committee A2, CIGRÉ, Paris, France, 25–30 August 2024. [Google Scholar]
  21. Doolgindachbaporn, A.; Callender, G.; Lewin, P.; Simonson, E.; Wilson, G. Data Driven Transformer Thermal Model for Condition Monitoring. IEEE Trans. Power Deliv. 2022, 37, 3133–3141. [Google Scholar] [CrossRef] [Scilit]
  22. Doolgindachbaporn, A.; Callender, G.; Lewin, P.L.; Simonson, E.; Wilson, G. A Top-Oil Thermal Model for Power Transformers That Considers Weather Factors. IEEE Trans. Power Deliv. 2022, 37, 2163–2171. [Google Scholar] [CrossRef] [Scilit]
  23. Stahlhut, J.W.; Heydt, G.T.; Selover, N.J. A Preliminary Assessment of the Impact of Ambient Temperature Rise on Distribution Transformer Loss of Life. IEEE Trans. Power Deliv. 2008, 23, 2000–2007. [Google Scholar] [CrossRef] [Scilit]
  24. Park, C.; Cho, C.; Kim, D.-I. Hazard Analysis of Weather Conditions on Distribution Transformer Failures via Cox Proportional Hazard Model. IEEE Access 2025, 13, 17414–17425. [Google Scholar] [CrossRef] [Scilit]
  25. Ippolito, L.; Siano, P. Identification of Tagaki–Sugeno–Kang Fuzzy Model for Power Transformers’ Predictive Overload System. IEE Proc. Gener. Transm. Distrib. 2004, 151, 582. [Google Scholar] [CrossRef] [Scilit]
  26. Akiba, T.; Sano, S.; Yanase, T.; Ohta, T.; Koyama, M. Optuna: A Next-Generation Hyperparameter Optimization Framework. In Proceedings of the 25th ACM SIGKDD International Conference on Knowledge Discovery & Data Mining; ACM: Anchorage, AK, USA, 2019; pp. 2623–2631. [Google Scholar]
  27. Picher, P.; Proulx, S.; Tissot, C.; Mailhot, A. Dynamic Thermal Modeling and Overload Testing for Optimization of Transformer Loadability in the Context of Energy Transition. In Proceedings of the CIGRE Canada Conference & Expo, Calgary, AB, Canada, 31 October–3 November 2022. [Google Scholar]
  28. Nordman, H.; Takala, O. Transformer Loadability Based on Directly Measured Hot-Spot Temperature and Loss and Load Current Correction Exponents. In Proceedings of the CIGRE Biannual Meeting, Paris, France, 22–27 August 2010. [Google Scholar]
  29. Nocedal, J.; Wright, S.J. Numerical Optimization; Springer Series in Operations Research; Springer: New York, NY, USA, 1999; ISBN 978-0-387-98793-4. [Google Scholar]
  30. Gradnik, T.; Zhang, X.; Lupandina, I.; Desquiens, R. Dynamic thermal modelling of power transformer with variable cooling stages. In Proceedings of the CIGRE A2 Colloquium, Split, Croatia, 29 November–2 December 2023. [Google Scholar]
  31. Tenbohlen, S.; Picher, P.; Xiaojing, Z.; Fofana, I.; Wang, Z. Overloading of Power Transformers. Transformers 2024, 11, 32–42. [Google Scholar]
Figure 1. Illustration of the segmented optimization procedure.
Energies 19 04224 g001
Figure 2. Distribution of optimized rated top-oil temperature rise values, with points colored by cooling stage.
Energies 19 04224 g002
Figure 3. Distribution of optimized exponent x values, with points colored by cooling stage.
Energies 19 04224 g003
Figure 4. Distribution of optimized parameters originating from the joint optimization procedure, with (a) points colored by cooling stage and (b) ambient temperature.
Energies 19 04224 g004
Figure 5. Violin and box plots of normalized load distributions across cooling stages.
Energies 19 04224 g005
Figure 6. Residual error distributions of the models evaluated in this study.
Energies 19 04224 g006
Figure 7. Performance of the proposed approach during the coldest and hottest days of the test set.
Energies 19 04224 g007
Table 1. Transformer Specifications.
CharacteristicValue
Rated power40/53/66 MVA at 30 °C52/64.9/80.8 MVA at 0 °C
Cooling systemONAN/ONAF/ONAF
High voltage225 kV Y
Low voltage26.4 kV Δ
Frequency60 Hz
Impedance13.77% (at 40 MVA)
MassActive parts33,202.96 kg
Tank24,584.71 kg
Oil34,745.18 kg
Total92,533.92 kg
Table 2. IEC thermal model parameters and optimization boundaries.
ParameterLower BoundUpper BoundUnit
x0.31.3[]
Δ θ to , r 10.080.0K
R0.515[]
τo (ONAN and ONAF)1.06.0h
Table 3. IEC top-oil thermal model optimized parameters and their respective units.
ParameterGlobally Optimized ValueUnit
x0.46[]
Δθto,r56.64K
R8.44[]
τo (ONAN)5.95h
τo (ONAF)1.27h
Table 4. Distribution of segments by cooling stage.
Cooling StageNumber of Segments
ONAN2196
ONAF 1938
ONAF 2324
Table 5. Comparison of different regression models.
Cooling StageFunctionMAE (K)RMSE (K)R2
ONANLinear4.345.420.26
Quadratic4.345.420.26
Exponential decay4.345.420.26
ONAF 1Linear2.312.930.77
Quadratic2.242.870.78
Exponential decay2.222.860.78
ONAF 2Linear1.882.390.90
Quadratic1.802.320.90
Exponential decay1.782.310.90
Table 6. Linear regression coefficients and goodness-of-fit metrics.
Cooling StageFunction Parameters
ab (K)
ONAN−0.33 ± 0.0262.01 ± 0.34
ONAF 1−0.38 ± 0.0155.38 ± 0.20
ONAF 2−0.40 ± 0.0153.00 ± 0.26
Table 7. Performance metrics of the analyzed models over the test subset.
ModelMAE (°C)RMSE (°C)R2Bias (°C)Residual’s STD (°C)
Globally optimized parameters3.114.000.650.353.99
Varying cooling stages2.893.480.731.663.05
Proposed approach2.032.560.860.132.56
Disclaimer/Publisher’s Note: The statements, opinions and data contained in all publications are solely those of the individual author(s) and contributor(s) and not of MDPI and/or the editor(s). MDPI and/or the editor(s) disclaim responsibility for any injury to people or property resulting from any ideas, methods, instructions or products referred to in the content.