Article

Experimental Investigation of Water-in-Oil Emulsions on Viscosity and Gas Exsolution Behavior of Heavy Oil Under CCEC Conditions


1
Program of Energy Systems Engineering, Faculty of Engineering and Applied Science, University of Regina, Regina, SK S4S 0A2, Canada
2
Canadian Natural Resources Limited (CNRL), Calgary, AB T2P 0J4, Canada
*
Author to whom correspondence should be addressed.
Energies 2026, 19(17), 4217; https://doi.org/10.3390/en19174217
Submission received: 26 July 2026 / Revised: 1 September 2026 / Accepted: 2 September 2026 / Published: 6 September 2026
(This article belongs to the Special Issue Advanced Research in Geoenergy Storage and Conversion)

Abstract

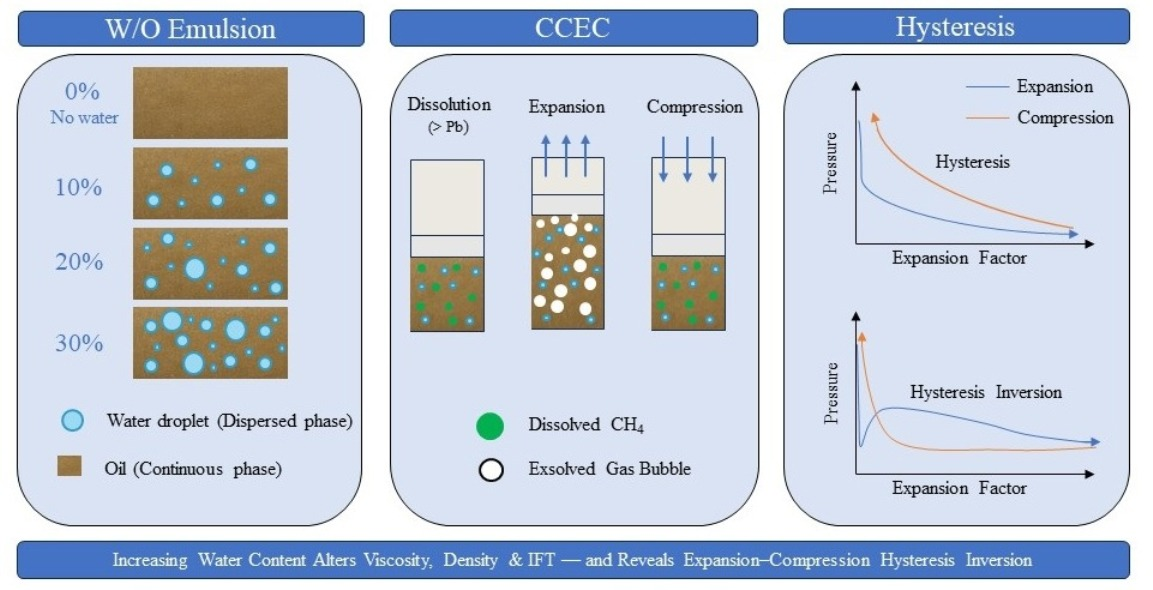
Water-in-oil (W/O) emulsions are commonly encountered during heavy oil production, yet their effects on fluid rheology and gas exsolution behavior remain poorly characterized. This study systematically investigates how the water content of W/O emulsions (10%, 20%, and 30 vol.%) influences the viscosity, interfacial tension (IFT), and pressure–volume behavior of heavy oils under conditions relevant to cyclic solvent injection. Viscosity measurements show that water content is the dominant rheological factor, with the 30% emulsion exhibiting approximately three times the viscosity of the 10% emulsion at 25 °C. In contrast, IFT between emulsified oils and methane is insensitive to water content, indicating that rheological differences across emulsions are structurally rather than thermodynamically driven. Constant-composition expansion and compression (CCEC) experiments reveal that pseudo-bubble point pressures decrease with increasing water content during fast depressurization, consistent with enhanced foamy-oil stabilization by the more viscous emulsion network. A hysteresis inversion phenomenon is identified, in which the compression path falls below the expansion path at higher water contents. Quantitative analysis using an integrated hysteresis index confirms a monotonic transition from positive to negative hysteresis with increasing water content at 15 °C, which is suppressed at elevated temperature and during slow depressurization. These findings demonstrate that conventional PVT data obtained with clean oil will systematically mischaracterize foamy-oil behavior in emulsified systems.

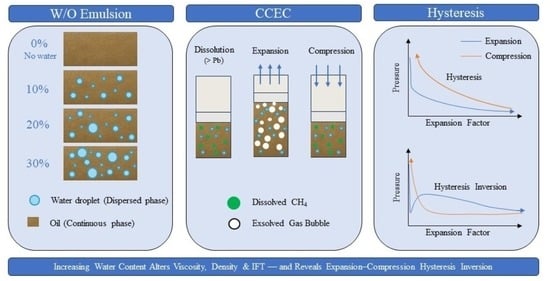
Graphical Abstract

1. Introduction

Petroleum reservoirs comprise porous rock formations located beneath the surface, where interconnected pore spaces contain reservoir fluids—primarily hydrocarbons and water—that can be extracted through production wells [1]. In addition to hydrocarbons, reservoirs may contain varying amounts of brine and other constituents. While formation water and crude oil are generally assumed to exist as distinct phases in situ [2], the produced brine may be recovered either as a free phase or as part of an emulsion, depending on reservoir conditions and production parameters [3]. The nature of the produced fluids is strongly influenced by geological characteristics, fluid origins, and the reservoir’s stage in the production life cycle [4]. During primary production, especially in heavy oil reservoirs, water-in-oil (W/O) and oil-in-water (O/W) emulsions may form at the wellhead and within surface pipelines due to pressure drops, turbulence, and fluid mixing. In the early production stages, where the water cut typically remains below 10% [4], naturally occurring surface-active components, such as asphaltenes and resins, act as emulsifying agents. These natural surfactants stabilize dispersed water droplets formed when kinetic energy breaks a small fraction of the water phase into fine droplets within the oil; once formed, the interfacial film prevents coalescence, producing stable W/O emulsions [5,6,7]. This phenomenon has prompted extensive research into emulsion stability in heavy oil and bitumen systems, with the theoretical framework highlighting the role of heavy oil components as natural surfactants [8,9,10,11,12,13].
With advances in cyclic injection technologies, the use of natural gas and solvent-based systems for enhanced recovery has gained significant attention [14,15]. Under these conditions, fluid phases within the reservoir tend to shift away from distinct, separate regions, giving rise to complex multiphase systems including water–oil mixtures and gas–water–oil three-phase interactions [16,17]. W/O emulsions are commonly encountered during crude oil production, particularly in heavy oil and mature reservoirs where substantial water co-production is prevalent. The formation and stability of such emulsions are influenced by a variety of factors, including the density difference between oil and water, droplet size, viscosity, interfacial tension [18], temperature [19], water cut [20], salinity, and shear conditions [21]. From a petroleum engineering standpoint, W/O emulsions play a dual role: they can pose flow assurance challenges when conventional gravity separation becomes ineffective [20], yet they can also be engineered to enhance oil recovery and improve flow characteristics. Fingas and Fieldhouse demonstrated that emulsified mixtures exhibit significantly altered physical properties compared to untreated crude oil, with the emulsified volume increasing by a factor of two to five, density rising by approximately 28%, and viscosity increasing nearly exponentially [22,23,24].
In cyclic solvent injection (CSI), water–oil emulsification and gas–oil foaming coexist, contributing to enhanced oil recovery. Recent studies have further demonstrated the coupled behavior of emulsification and foaming systems, highlighting the important roles of oil–water and gas–liquid interfacial structures in governing system stability under varying temperature, pressure, and shear conditions [25]. Water droplets dispersed within the oil phase form stable W/O emulsions that can modify crude oil mobility, while exsolved solution gas interacts with in situ oil to generate a foamy structure that aids recovery [17]. The solvent gases, such as CO2, CH4, and C3H8, exhibit significant solubility in crude oil under elevated pressures. In a typical CSI strategy, reservoir pressure is maintained above the bubble point to maximize gas dissolution, followed by controlled pressure drawdown below the bubble point during production to promote gas exsolution through dispersed microbubbles. This gas-in-oil dispersion increases the apparent volume and fluidity of the reservoir oil and creates flow resistance that delays gas breakthrough [26,27]. Kraus et al. introduced the concept of the pseudo-bubble point to distinguish the onset of foamy-oil formation from the traditional bubble point associated with free-gas emergence. Subsequent research on foamy oil has focused on key parameters such as the formation volume factor, apparent density reduction, gas–oil ratio trends, viscosity stabilization, and the influence of gas composition on foamy-oil stability [18,28,29].
However, existing experimental studies on foamy oil and CCEC phase behavior have been conducted exclusively using clean stock-tank oil samples, without accounting for the natural emulsion state of reservoir fluids. The influence of dispersed water content on gas exsolution kinetics, pseudo-bubble point pressure, and expansion–compression hysteresis has not been systematically investigated. While the rheological effects of W/O emulsions on heavy oil viscosity are qualitatively recognized [20,23], no published work has quantified how these structural changes propagate into non-equilibrium PVT behavior under controlled depressurization and re-pressurization conditions. This gap is significant because field-produced heavy oils invariably contain emulsified water, and the use of clean-oil PVT data to calibrate numerical models may introduce systematic errors in predicting foamy-oil stability, gas breakthrough timing, and recovery performance during solvent-based operations.
The present study addresses this gap by analyzing the non-equilibrium phase behavior differences between solvent–non-emulsified heavy oil systems and solvent–emulsified heavy oil systems. Specifically, we investigate how varying water content in W/O emulsions affects solvent dissolution and exsolution performance under different pressure-depletion and re-pressurization scenarios. By incorporating emulsion effects into vapor–liquid and liquid–liquid phase behavior analysis, this work seeks to provide a more representative depiction of in-reservoir production dynamics. The findings from this study have the potential to inform and optimize post-CHOP/CHOPS-enhanced heavy oil recovery strategies.

2. Materials and Methodology

The heavy oil sample used in this study was obtained from a Saskatchewan heavy oil reservoir and has a molecular weight of 540 g/mol. The compositional analysis was conducted using an Agilent 6890N gas chromatograph (GC) (Agilent Technologies, Inc., Santa Clara, CA, USA) through simulated distillation according to ASTM D6352. The resulting oil composition, expressed in terms of carbon-number distribution, is summarized in Table 1. The SARA analysis of the original heavy oil showed saturate, aromatic, resin, and asphaltene contents of 28.4, 27.0, 22.5, and 14.8 weight percentage (wt.%), respectively. Three stock-tank oil (STO) emulsions with target water cuts of 10%, 20%, and 30 vol.% were prepared using a high-shear homogenizer operating above 10,000 rpm. The stability of the emulsion samples was evaluated through visual observation and microscopic imaging over a 30-day resting period. No apparent phase separation was observed during this period, and the microscopic images showed a relatively uniform dispersion of water droplets without noticeable separation, providing additional qualitative evidence of emulsion stability. The water contents listed in Table 2, adopted from a previous study [30], were determined using the Karl–Fischer titration method.
Live emulsified oil samples were prepared by charging methane (C1) into the emulsified stock-tank oil to achieve the predetermined gas-to-emulsified-oil ratio (GER), defined as
G E R = V g V E o
where Vg and VEo represent the gas volume and emulsion oil volume (mL), respectively, with both quantities expressed under standard temperature and atmospheric pressure conditions. Table 3 presents the measured GER values for the three recombined live oil samples. The GER increases from 7.6 to 11.2 as water content rises from 10% to 30%. This trend reflects the reduced oil fraction available for gas dissolution: because methane exhibits negligible solubility in the dispersed water phase, the effective gas–oil ratio on an oil-volume basis increases correspondingly from approximately 8.4 to 16.9, even though the total gas content per unit emulsion volume is what GER reports.
The viscosities of dead and live emulsified oils were determined using a capillary viscometer based on Poiseuille’s equation:
P = 8 μ L Q π r 4
where ΔP is the pressure drop across the capillary tubing (kPa), μ is the dynamic viscosity (cp), Q is the volumetric flow rate (mL/min), r is the capillary radius (cm), and L is the capillary length (cm). The instrument constant 8L/πr4 was determined through calibration with a certified viscosity standard (9727-C51, Cannon Instrument Company, State College, PA, USA; 1500 cP at room temperature). Laminar flow was confirmed through Reynolds number verification for all measurements.
Density measurements were conducted following the same procedure reported by Jiang et al. [30] and Dong et al. [31]. A stainless-steel sampler with a calibrated volume of 54.13 cm3 was placed in a temperature-controlled air bath. At each specified temperature and pressure condition, the sampler was filled with the oil sample and weighed, and the density was calculated from the mass difference divided by the known sampler volume.
Interfacial tension (IFT) between the emulsified stock-tank oils and methane was measured using the axisymmetric drop shape analysis (ADSA) technique. Following stabilization at the target gas pressure, a pendant oil droplet was generated inside the high-pressure IFT cell. The droplet profile was continuously recorded at three frames per second using a computer-controlled optical imaging system [32]. The IFT was determined from the digitized drop profiles at equilibrium conditions.
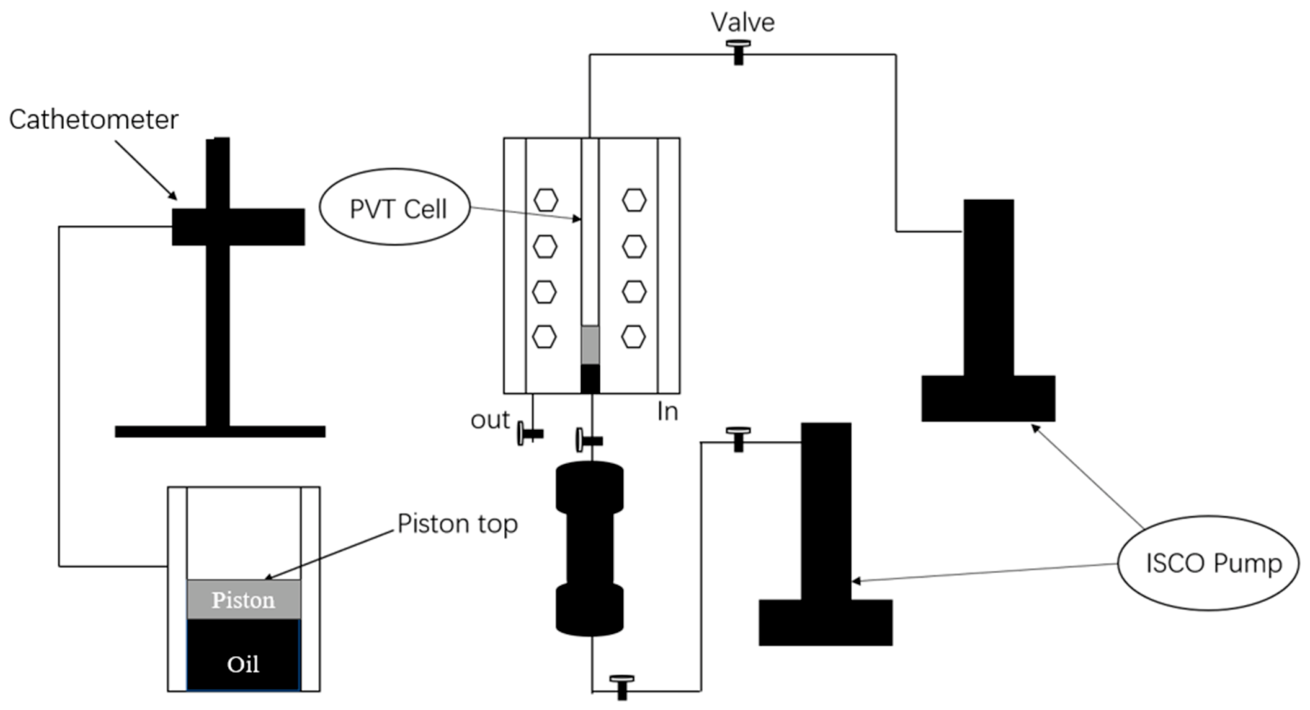
Constant-composition expansion and compression (CCEC) experiments were conducted on the synthesized C1-live oil emulsions using a mercury-free DBR PVT system (PVT-015-100-200-316-155, Schlumberger, Houston, TX, USA) at 15 °C and 75 °C. Three depressurization rates were selected, including 1.5 cm3/min for fast depressurization, 0.015 cm3/min for moderate depressurization, and 0.0003 cm3/min for slow depressurization. The experimental procedure and depressurization protocols were adopted from the methods described by Modaresghazani et al. [29], Jiang et al. [30], and Dong et al. [31]. During depressurization, the piston position—corresponding to the total fluid volume within the PVT cell—was recorded using a high-precision cathetometer with a resolution of 0.001 cm. Figure 1 shows the DBR PVT system, comprising a stainless-steel pressure vessel and a visual high-pressure cell (3.177 cm ID × 20.320 cm height) equipped with a floating piston for volume adjustment. The system operates up to 200 °C and 69,000 kPa with a temperature control accuracy of ±0.1 °C.

3. Results and Discussion

3.1. Emulsified Oil at the Microscale

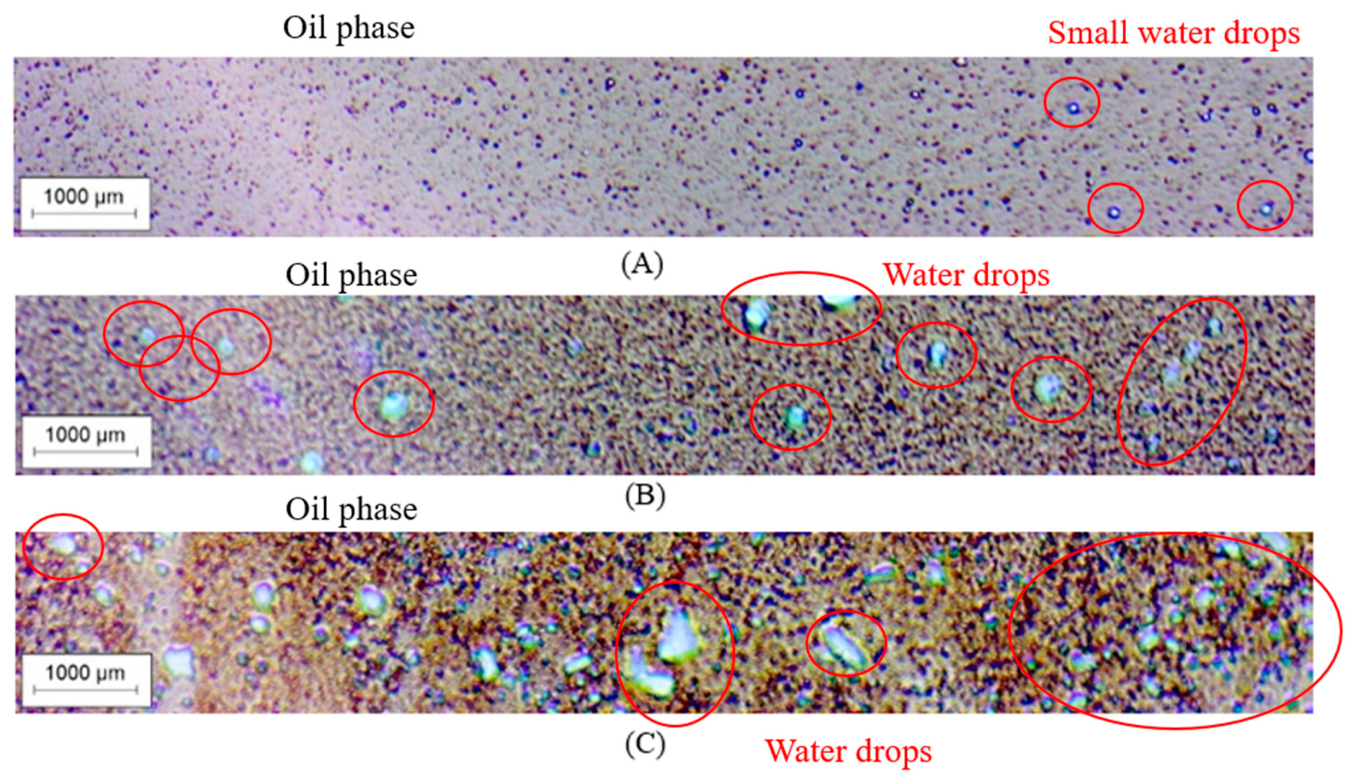
Figure 2 presents microscopic images of emulsified oil samples at three water cuts (10%, 20%, and 30%). All samples exhibit a well-dispersed W/O structure with water droplets distributed throughout the continuous oil phase. At 10% water cut, the droplets are small and uniformly distributed. As water content increases to 20% and 30%, the mean droplet size grows and spatial packing becomes denser, with the 30% sample containing visibly larger droplets in certain regions. These microstructural differences affect the bulk rheological behavior and phase-transfer kinetics examined in the following sections.

3.2. Viscosity of Emulsified Oil

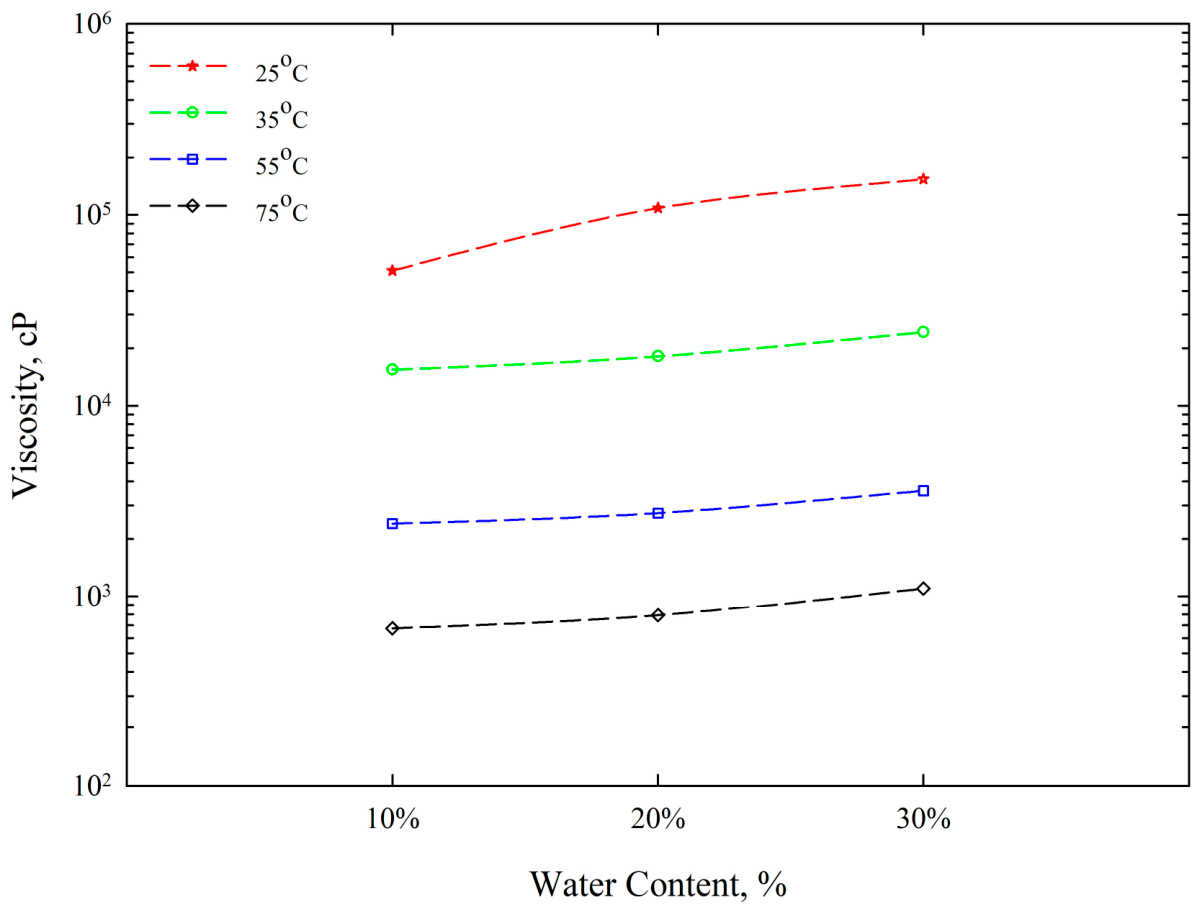
Figure 3 presents the apparent viscosity of dead emulsified oils at four temperatures and 4000 kPa. At 25 °C, the 30% emulsion reaches approximately 153,900 cP, compared with 108,600 cP for the 20% and 51,000 cP for the 10%—a roughly threefold increase from 10% to 30%. The increase in viscosity is driven by intensified droplet–droplet interactions and the development of a more rigid emulsion network at higher dispersed-phase fractions, consistent with Kokal [20]. The non-emulsified oil used in this study exhibits a viscosity of approximately 7083 cP at room temperature. Increasing water content leads to a progressive increase in viscosity relative to the base oil. At 10% water content, the viscosity is approximately 6.34 times higher than the baseline; at 20%, it increases to 12.52 times; and at 30%, it reaches 13.98 times the original value.
Temperature exerts a strong moderating effect. At 75 °C and 4000 kPa, the viscosities converge: 1099 cP (30%), 790 cP (20%), and 675 cP (10%). The effect of water content on emulsion viscosity becomes progressively weaker with increasing temperature. At 25 °C, the viscosity of the 30% water-cut emulsion is approximately 8.9 times higher than that of the 0% water-cut emulsion. This difference decreases to about 7.47 times at 35 °C and further reduces to 4.67 times at 55 °C, indicating that elevated temperature progressively weakens the sensitivity of emulsion viscosity to water content.
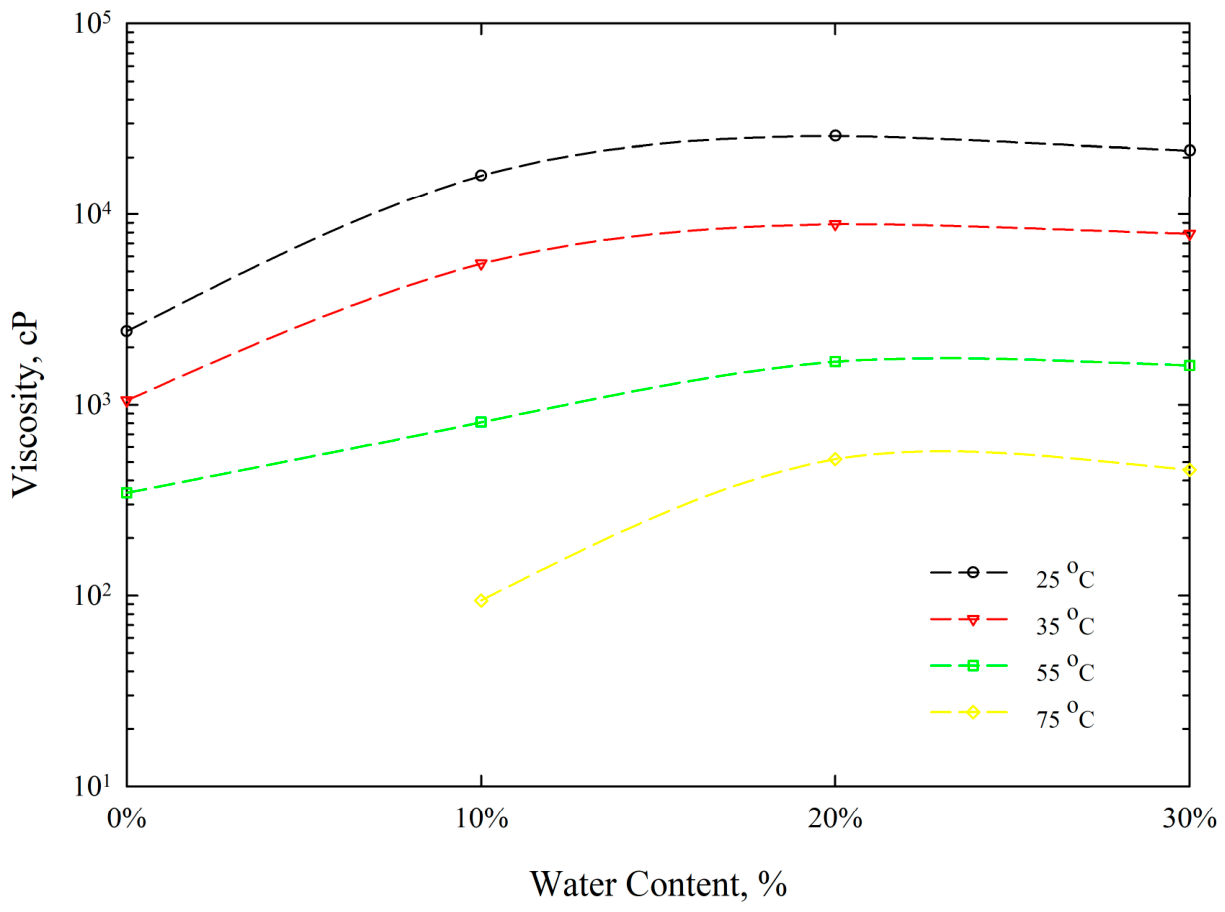
To investigate the effect of dissolved gas on emulsion rheology, emulsified live oils were prepared by saturating the oil phase with methane. Figure 4 presents the apparent viscosity of emulsified C1-live oils at various temperatures and water cuts. The live oil emulsions exhibit the same trend of increasing viscosity with water content, but the absolute values are substantially lower than those of the corresponding dead oils. Dissolved methane reduces intermolecular cohesion and increases free volume in the continuous oil phase, producing a thinning effect most pronounced at low temperatures.
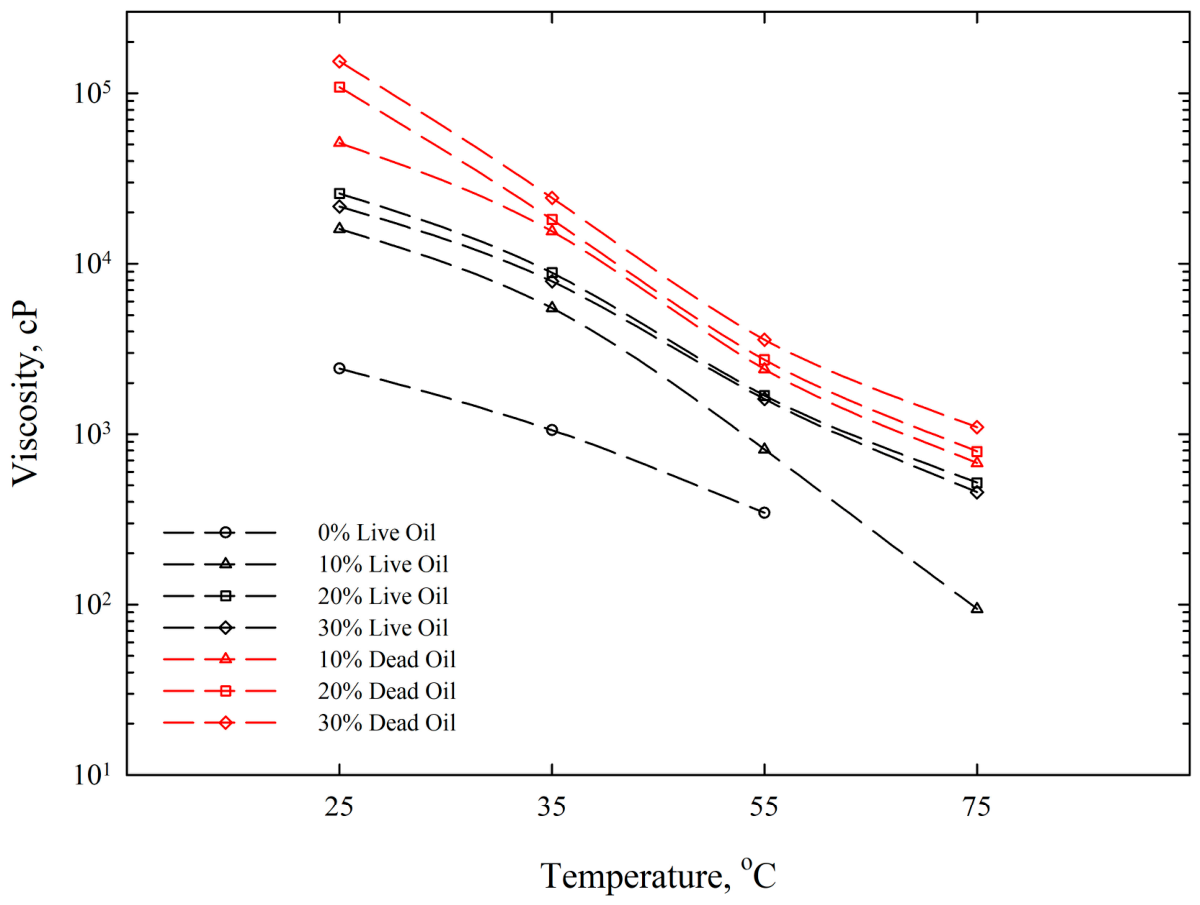
Figure 5 compares the all-tested dead-oil and C1-live oil viscosities at 4000 kPa. At lower temperatures, dissolved methane produces a large viscosity reduction. Above 55 °C, the contrast between live and dead emulsions diminishes as thermal energy dominates flow behavior and the incremental thinning from dissolved gas becomes marginal.

3.3. Density of Emulsified Stock-Tank Oil

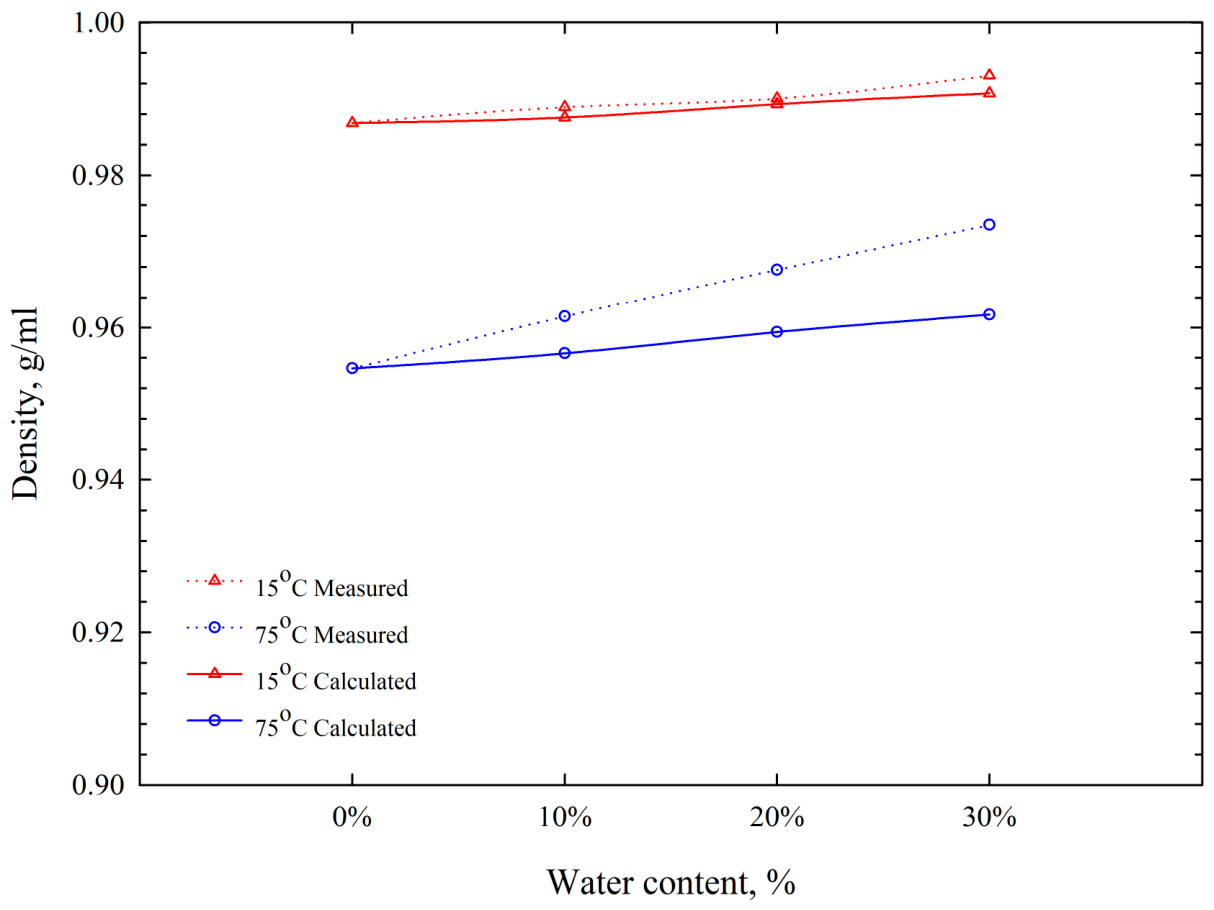
Figure 6 presents the density of emulsified stock-tank oil as a function of water content at 15 °C and 75 °C. Density increases monotonically with water content at both temperatures, reflecting the higher density of the dispersed water phase. At 15 °C, density rises from 0.987 g/mL (0%) to 0.993 g/mL (30%), an increment of 0.006 g/mL. At 75 °C, the increase is more pronounced: 0.955 to 0.973 g/mL, an increment of 0.018 g/mL. The 15 °C values are consistently 0.020–0.032 g/mL higher than the 75 °C values, with the temperature sensitivity itself increasing with water content. The emulsified oil densities exceeded the values calculated by the ideal volumetric mixing model at both temperatures. The density deviation increased from 0.074–0.232% at 15 °C to 0.506–1.205% at 75 °C, implying a greater degree of volume contraction at elevated temperature. This behavior may be attributed to improved water droplet dispersion and tighter packing of the dispersed phase within the oil matrix. Higher specific gravity in emulsified oils affects volumetric expansion factor calculations and gravitational segregation of gas and liquid within the PVT cell.
The emulsion oil density calculation equation is as follows, where ρEO is the density of the emulsified oil (g/mL), (ρO) is the density of the oil (g/mL), and (ρw) is the density of water (g/mL). Oil% and W% represent the oil content and water content in the emulsified oil, respectively.
ρ E O = ρ o × O i l % + ρ W × W %  

3.4. Interfacial Tension of Emulsified Oil with Methane

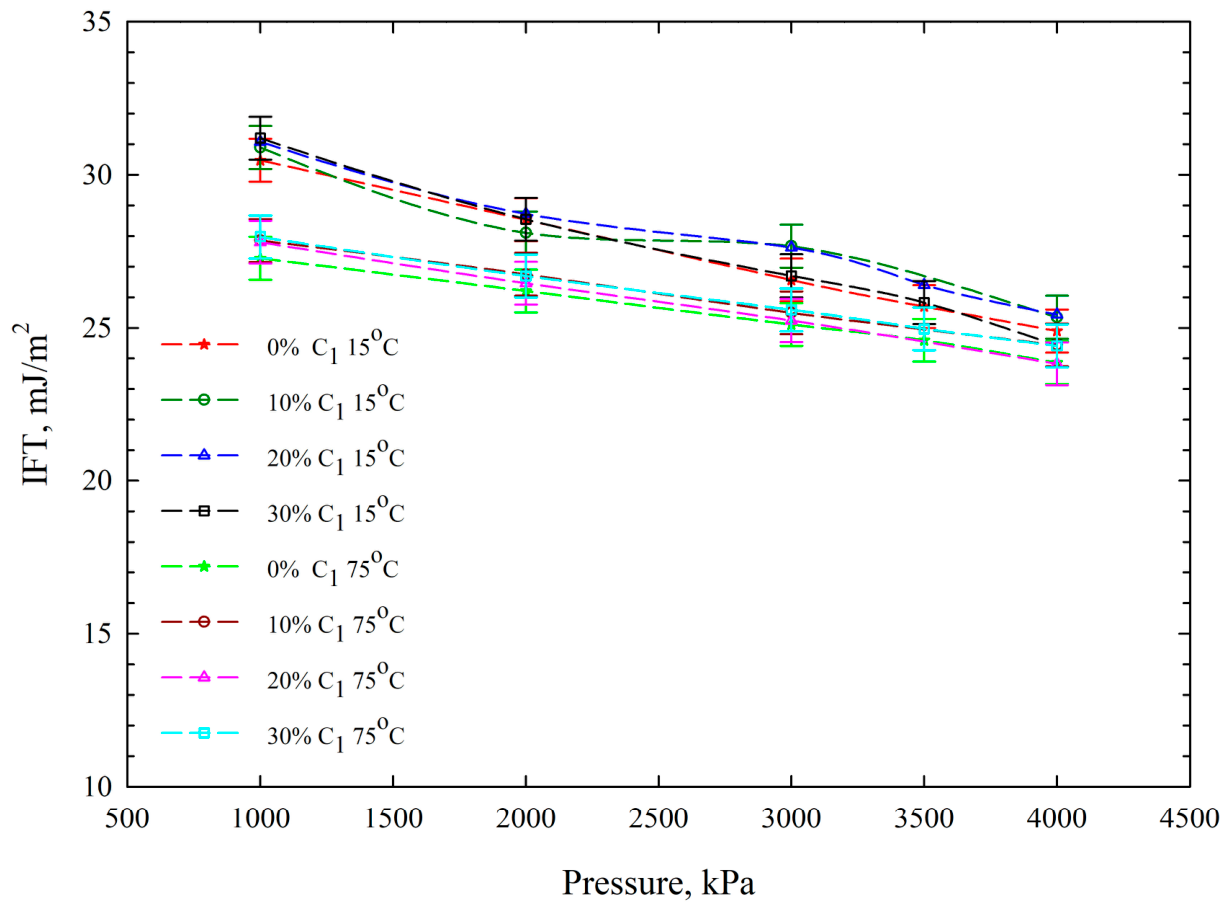
Figure 7 presents the integrated IFT results between emulsified stock-tank oils (0–30% water content) and methane at 15 °C and 75 °C over a pressure range of 1000–4000 kPa, compiled from the data reported by Jiang et al. [30]. At 15 °C, the IFT decreases with pressure from approximately 30.47–31.2 mJ/m2 at 1000 kPa to 24.89–25.43 mJ/m2 at 4000 kPa. Additionally, the IFT at 75 °C decreases with pressure from approximately 27.27–27.97 mJ/m2 at 1000 kPa to 23.82 –24.43 mJ/m2 at 4000 kPa. The four curves fall within each other’s error bars across the entire pressure range, demonstrating negligible sensitivity to water content up to 30%. Since the CCEC results in Section 3.5 show substantial differences in pseudo-bubble point and hysteresis across water contents, the invariance of IFT isolates viscosity and emulsion structure—not interfacial thermodynamics—as the governing factors.

3.5. Constant-Composition Expansion and Compression (CCEC) Tests

In the expansion process of the CCEC test, the system volume increases continuously with pressure depletion at a fixed depressurization rate. A rapid volume increase is observed once the pressure decreases below the pseudo-bubble point pressure, indicating gas exsolution from the oil phase. After reaching a volume expansion ratio of approximately four, the experiment enters the compression process, during which pressure is increased to drive the evolved gas back into solution. The expansion factor is defined as
E F = V V i n j
where V is the total volume (mL) at a given pressure, and Vinj is the initial injected emulsion volume (mL). Table 4 presents the measured pseudo-bubble point pressures for emulsified C1-live oils under varying conditions.

3.5.1. Fast Depressurization

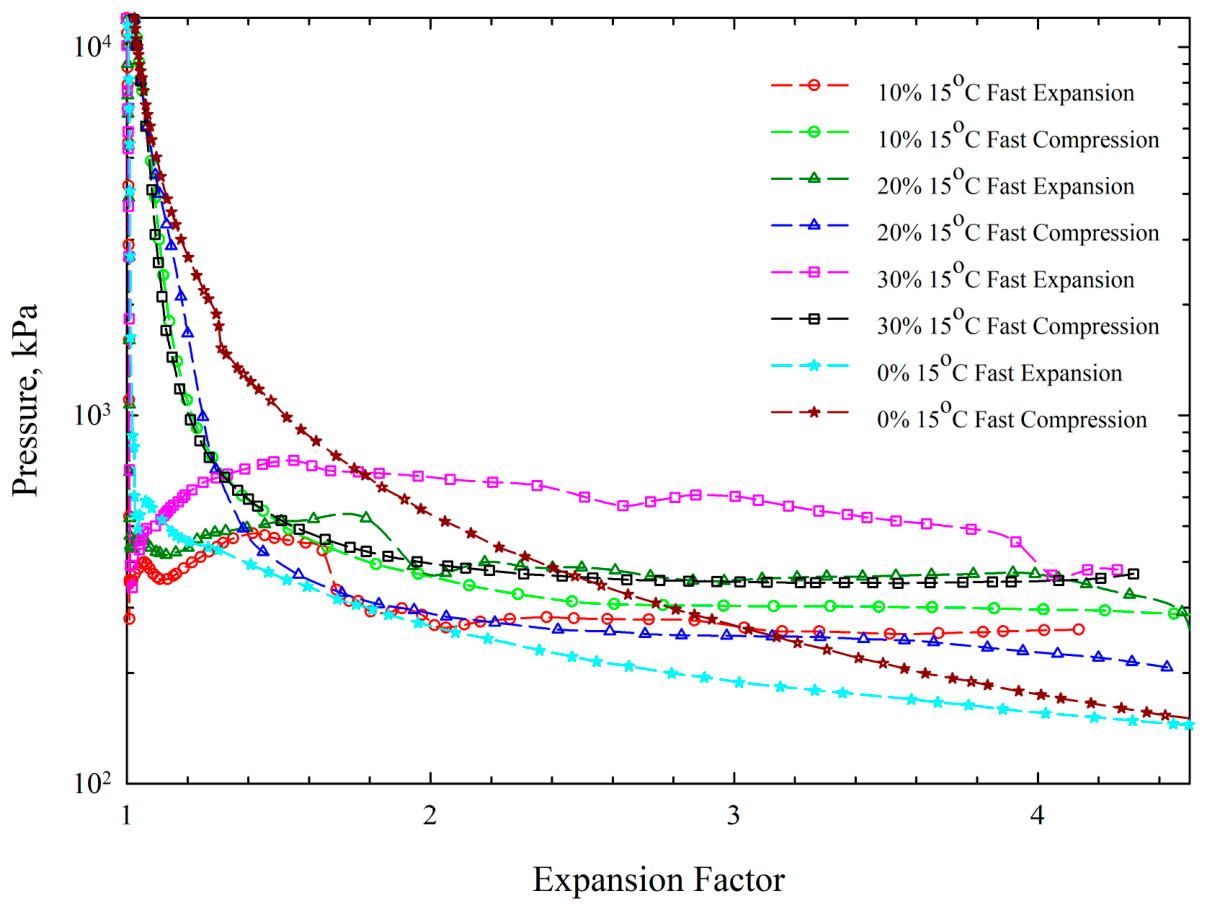
Figure 8 presents the P–EF responses from CCEC tests at 15 °C under a fast depressurization rate of 1.5 cm3/min, with water contents ranging from 0% to 30%. During expansion, all systems exhibit a gradual increase in volume prior to gas liberation, followed by a rapid increase in the expansion factor below the pseudo-bubble point. The pseudo-bubble point pressure decreases with increasing water content—from 490 kPa for the clean oil to 350 kPa (10%), 400 kPa (20%), and 320 kPa (30%)—consistent with the higher emulsion viscosity at greater water cuts stabilizing the foamy oil and delaying free-gas formation.
A potential confound in interpreting the water-content effect on pseudo-bubble point pressure is that changing water content simultaneously alters the effective gas concentration in the oil phase. Because methane exhibits negligible solubility in water, the dissolved gas partitions exclusively into the oil fraction, and the effective gas–oil ratio on an oil-volume basis increases from 8.4 (10% emulsion) to 16.1 (30% emulsion), compared with 8.63 for the clean stock-tank oil. If gas concentration were the dominant factor, higher effective GOR should produce higher pseudo-bubble point pressures. The opposite is observed: the 30% emulsion, despite having nearly double the effective GOR of the clean oil, exhibits the lowest pseudo-bubble point (320 vs. 480 kPa). The 10% emulsion provides an additional reference point, as its effective GOR (8.4) closely matches that of the clean oil (8.63), isolating water content as the variable; the resulting Pb reduction from 480 to 350 kPa is attributable solely to the structural effect of the emulsion.
The compression stage reveals distinct hysteresis behaviors that vary systematically with water content. For the clean oil (0%), the compression path lies well above the expansion path, indicating pronounced conventional hysteresis. At 10% water content, the hysteresis is substantially reduced. At higher water contents, an inversion occurs: the compression paths fall below the corresponding expansion paths. For the 20% emulsion, the crossover points at which the compression pressure re-exceeds the expansion pressure occur at an expansion factor of 1.38; for the 30% emulsion, this crossover occurs at 1.32.
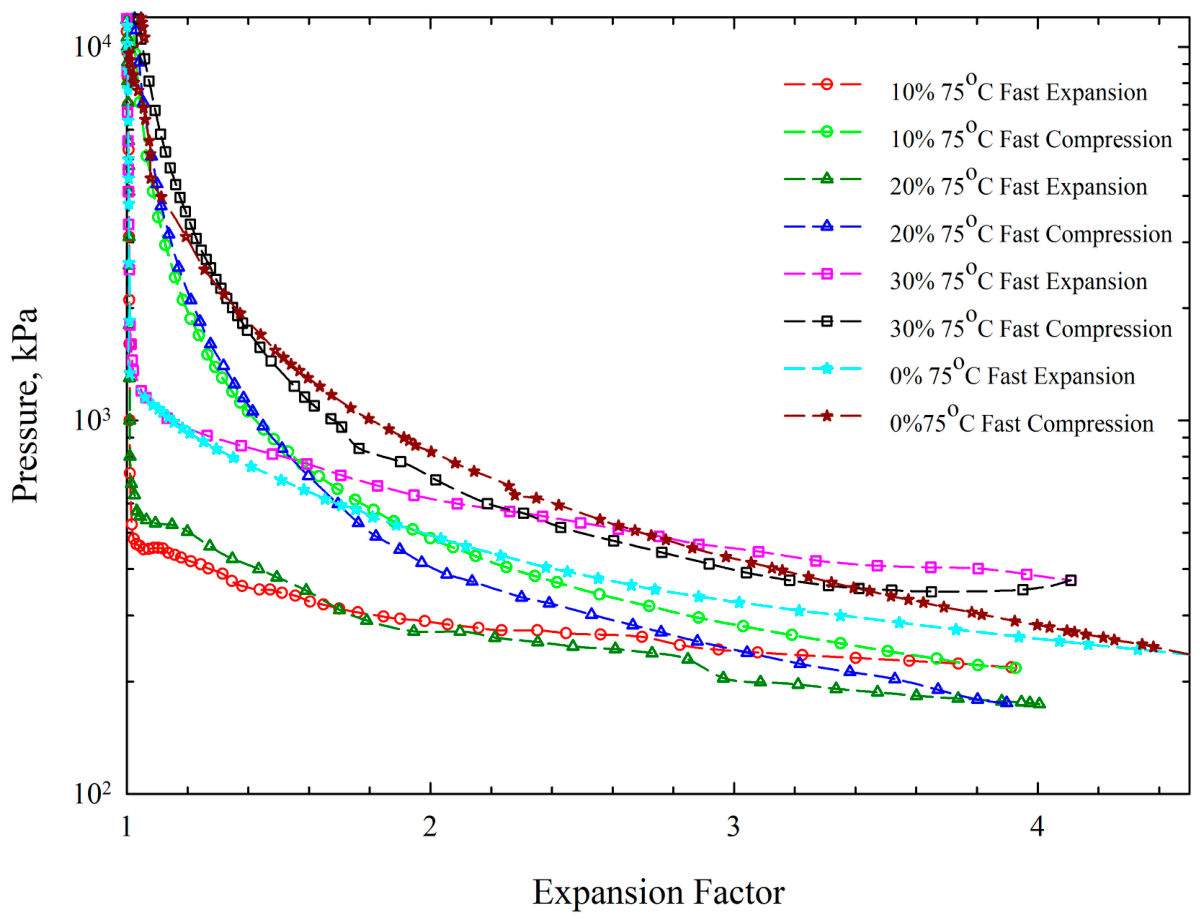
Figure 9 presents the corresponding CCEC responses at 75 °C under the same fast depressurization rate. All systems exhibit smoother P–EF responses, indicating reduced non-equilibrium effects at elevated temperature. The hysteresis inversion is significantly shifted: the crossover EF moves from 1.38 to 3.88 for the 20% emulsion and from 1.32 to 2.30 for the 30% emulsion, indicating that elevated temperature weakens the structural resistance of the emulsified water phase and facilitates both gas expansion and re-dissolution.

3.5.2. Slow Depressurization

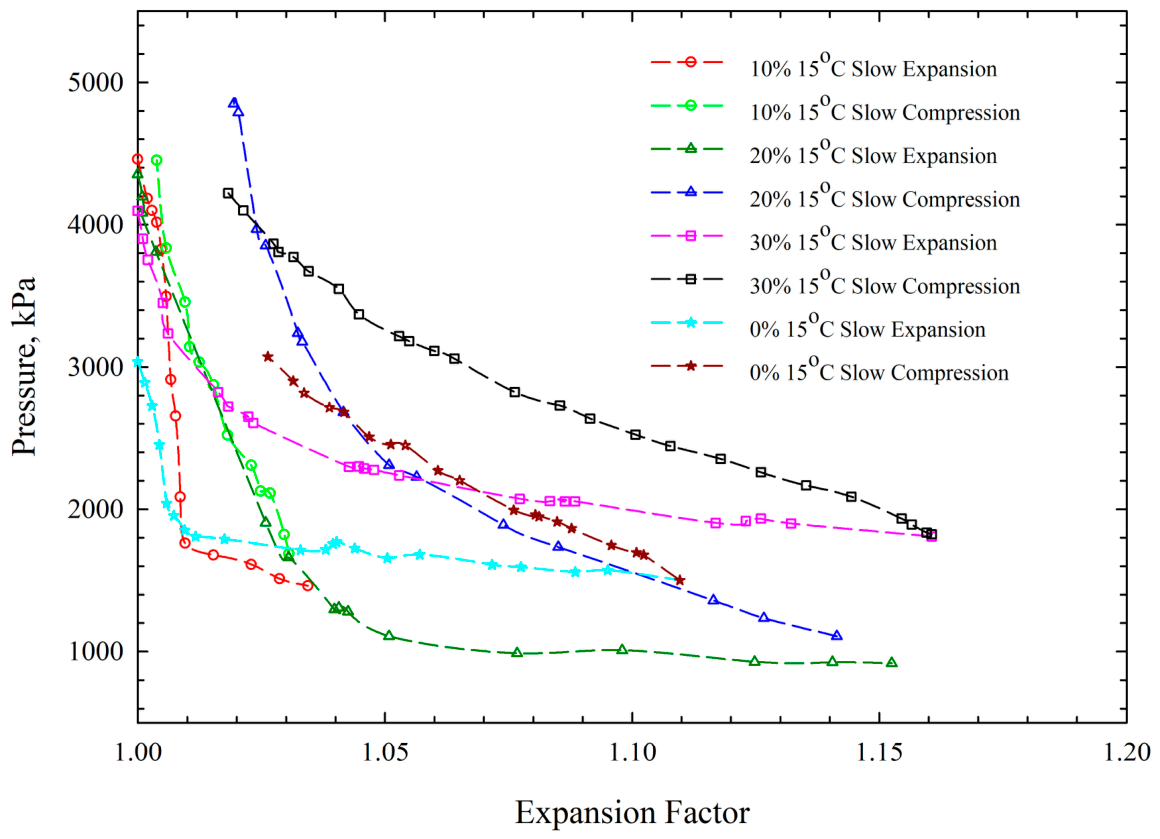
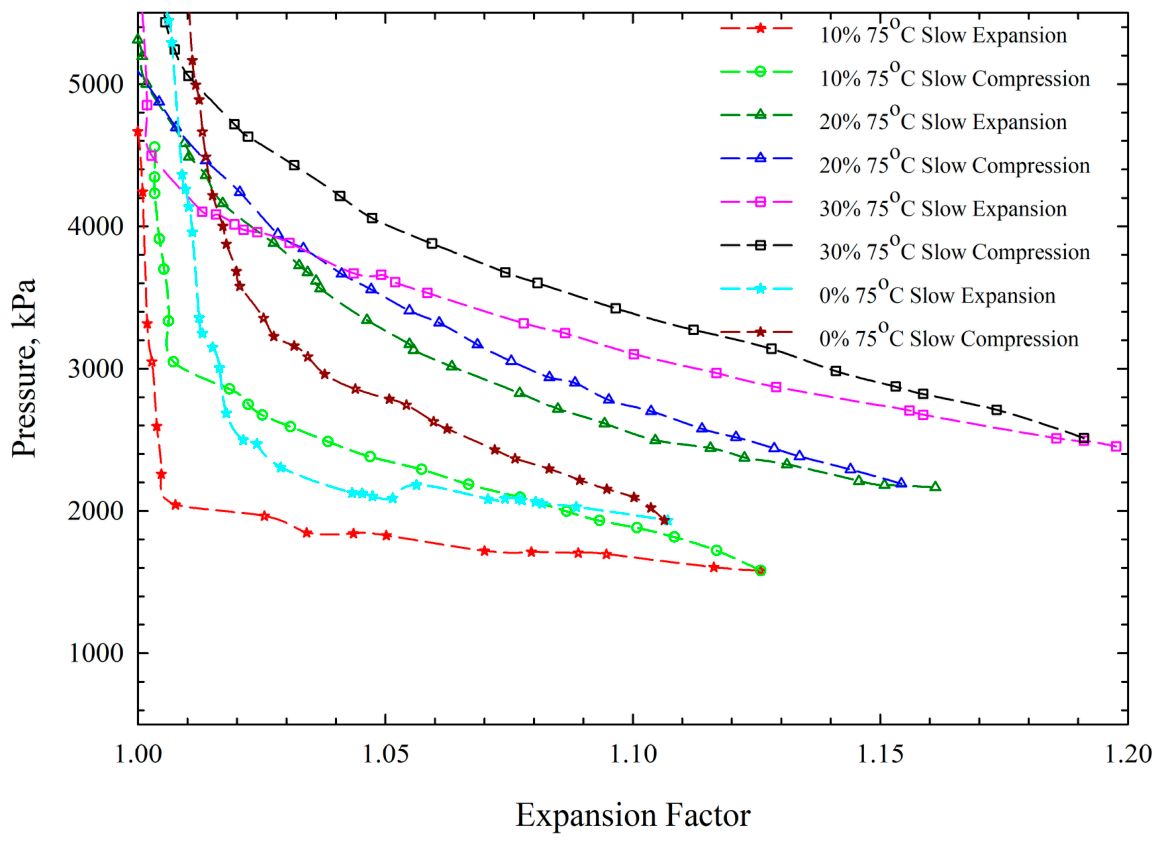
Figure 10 presents the P–EF responses at 15 °C under a slow depressurization rate of 0.0003 cm3/min. Compared with the fast-rate results, the responses are substantially smoother, with no pressure rebound observed. The expansion and compression paths closely coincide for all water contents, indicating that slow depressurization allows the system to approach quasi-equilibrium behavior. The pseudo-bubble point pressures under slow depressurization are higher than under fast depressurization (Table 4), reflecting reduced foamy-oil stabilization when sufficient time is available for gas nucleation and growth.
Under slow depressurization, the 30% emulsion exhibits the highest pseudo-bubble point pressures among all water contents at both 15 °C and 75 °C. This contrasts with the fast-rate results, in which the 30% emulsion yields the lowest pseudo-bubble point due to viscosity-mediated foamy-oil stabilization. At slow depressurization rates, sufficient time is available for gas nucleation and redistribution, diminishing the stabilizing role of emulsion viscosity. Under these near-equilibrium conditions, the elevated GER of the 30% emulsion (11.2 vs. 7.6 for 10%) becomes the dominant factor, as the greater volume of dissolved methane per unit emulsion raises the thermodynamic driving force for gas liberation and shifts the pseudo-bubble point to higher pressures. The reversal in Pb ranking between fast and slow rates confirms that the interplay between structural (viscosity-driven) and compositional (GER-driven) effects is rate-dependent: structural effects dominate at fast rates, while compositional effects prevail near equilibrium.
Figure 11 shows the corresponding slow-rate results at 75 °C. The P–EF behavior is characterized by smooth transitions near the pseudo-bubble point and minimal hysteresis. The effect of water content is primarily expressed as a systematic upward shift in the overall pressure level, with no non-equilibrium features such as pressure rebound or hysteresis inversion.

3.5.3. Effect of Depressurization Rate

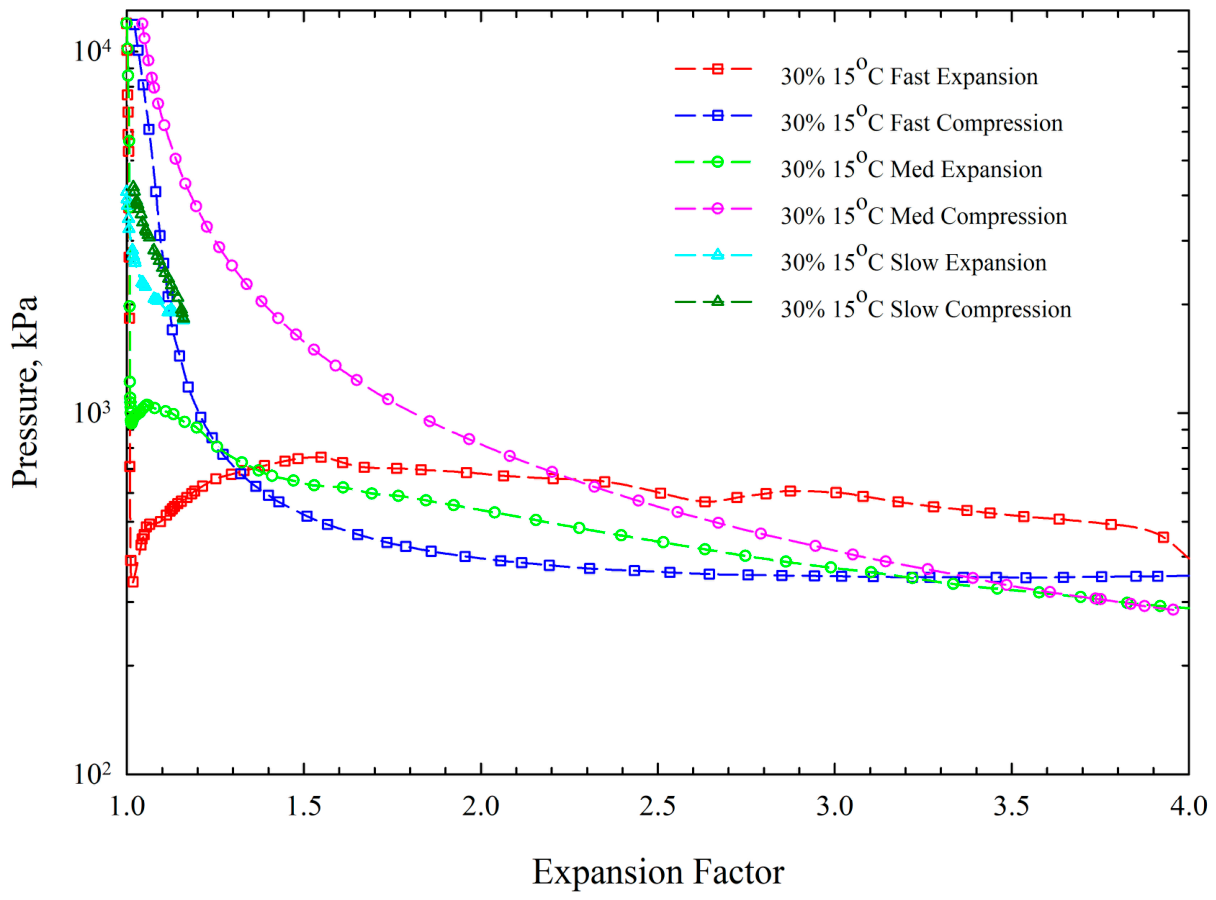
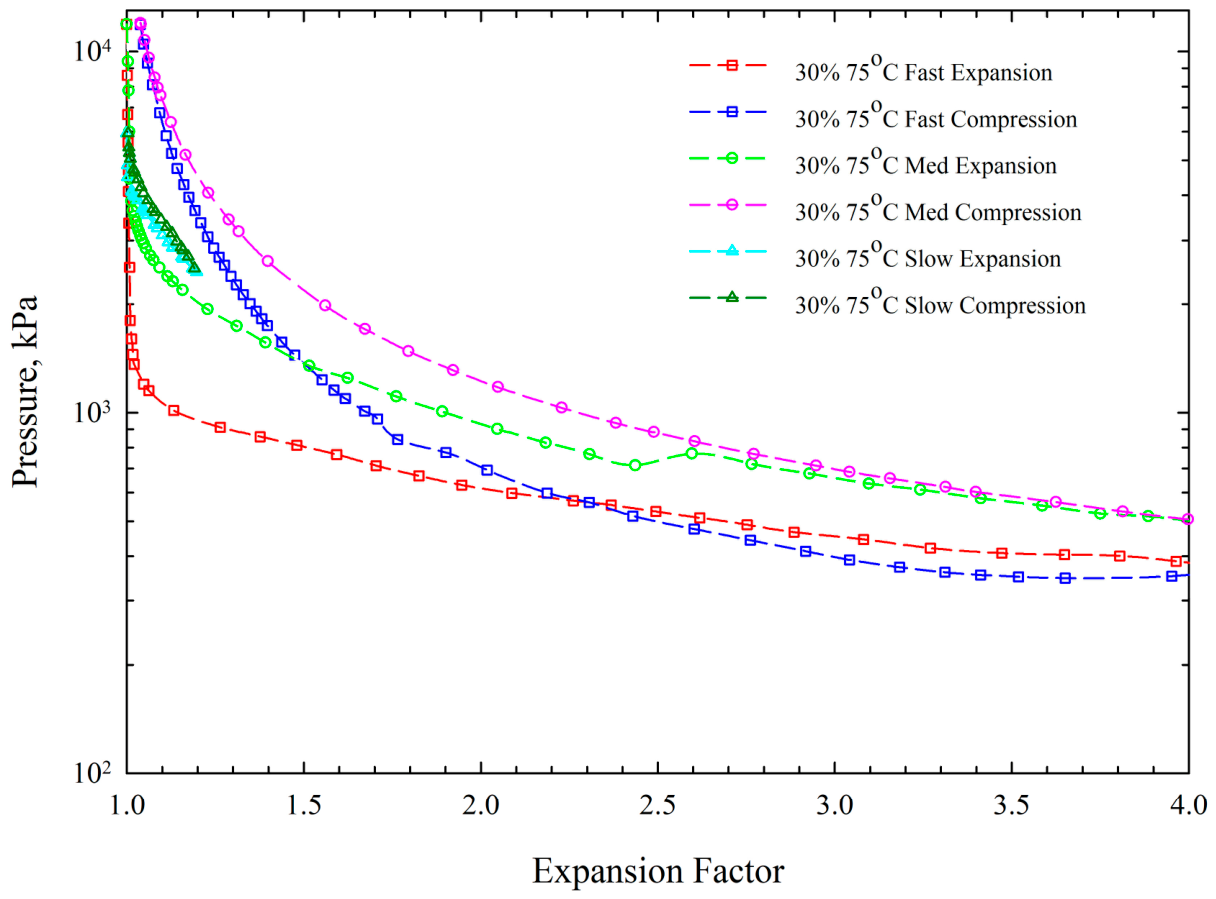
Figure 12 and Figure 13 compare the P–EF responses for the 30% water-cut emulsion across the three depressurization rates at 15 °C and 75 °C, respectively. At 15 °C, fast depressurization produces markedly divergent expansion–compression behavior with strong path dependency, whereas the moderate and slow rates yield progressively smoother responses with reduced hysteresis. At 75 °C, the rate dependence is substantially weaker, and differences among the three rates are primarily reflected as shifts in pressure level rather than changes in expansion–compression behavior.

3.6. Hysteresis Inversion in Emulsified Foamy Oil

In conventional foamy-oil systems, the compression path lies above the expansion path, producing positive hysteresis. This reflects the kinetic delay in gas re-dissolution relative to exsolution: once gas has evolved into a free phase during expansion, re-dissolving it requires higher pressures than those at which it originally exsolved [28,30]. All prior CCEC studies, conducted with clean stock-tank oils, have reported only this positive hysteresis. The present work reveals that emulsified water can reverse this relationship.
To quantify this phenomenon, the signed hysteresis index ( H s i g n e d ) is defined as the integrated pressure difference between the compression and expansion paths over the full expansion-factor range:
A N o r m a l = P c P e d V           P c > P e
A i n v e r s e = P e P c d V           P c < P e
H s i g n e d = A N o r m a l A i n v e r s e
H I M a x = A N o r m a l + A i n v e r s e
H I = A i n v e r s e H I M a x 0 < H I < 1
where Pc and Pe denote the compression and expansion pressures at the same expansion factor, respectively. The signed hysteresis index ( H s i g n e d ) is used to quantify the magnitude of conventional hysteresis, where the compression curve remains above the expansion curve. It is calculated as the enclosed area between the expansion and compression curves under normal hysteresis conditions.
When hysteresis inversion occurs, the relative positions of the expansion and compression curves are reversed, and the two curves intersect at a crossover point. The crossover point represents the transition from hysteresis inversion to conventional hysteresis behavior.
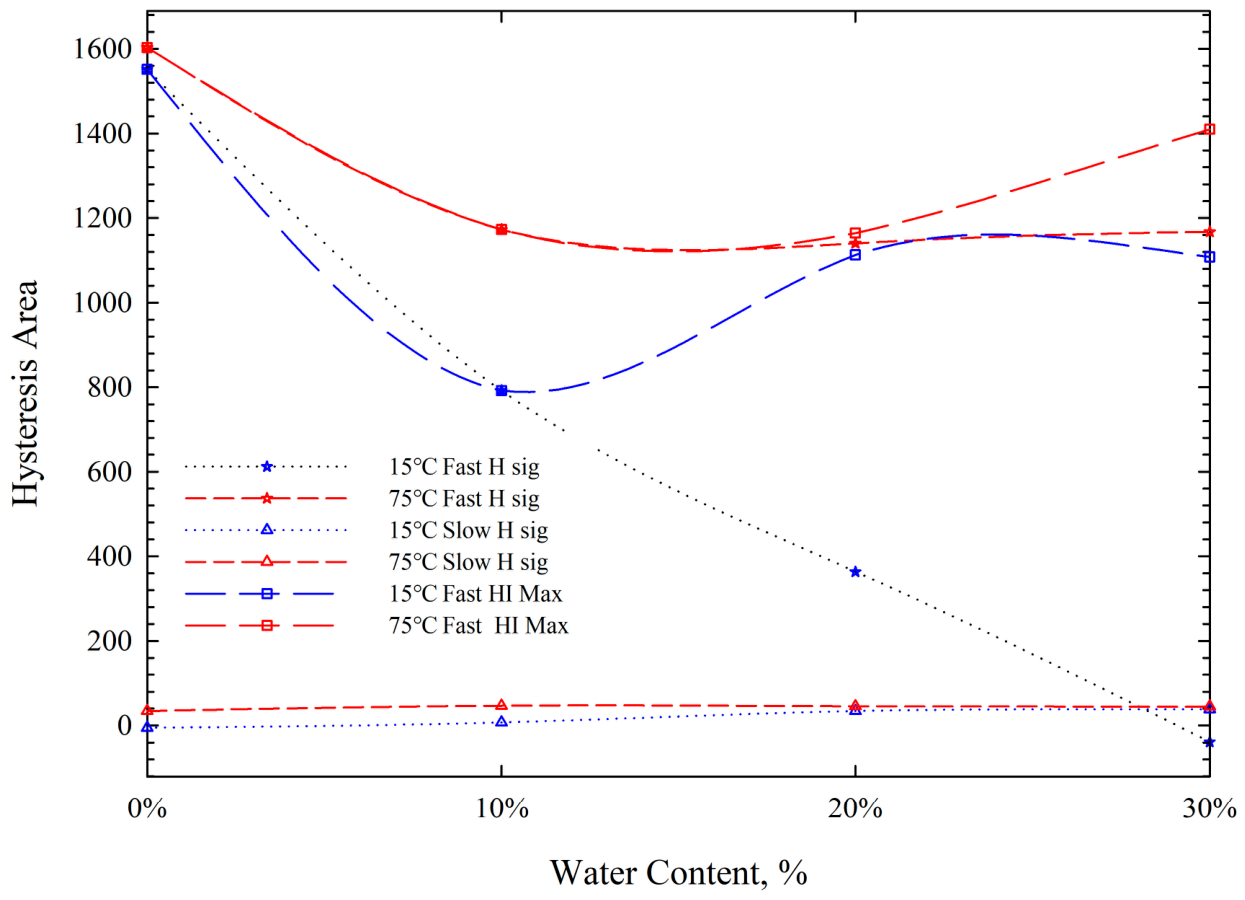
To quantify the influence of hysteresis inversion on the overall hysteresis response, the maximum hysteresis inversion area ( H I M a x ) is calculated using Equation (6). H I M a x represents the total enclosed area between the expansion and compression curves within the hysteresis inversion region, thereby characterizing the absolute magnitude of the inversion. Figure 14 presents the calculated H s i g n e d values and H I M a x under different conditions.
However, H I M a x alone cannot adequately describe the relative significance of hysteresis inversion because it is affected by the overall hysteresis magnitude. Therefore, the dimensionless Hysteresis Inversion Index (HI) is introduced and defined as the ratio of the hysteresis inversion area to the maximum hysteresis inversion area. As a normalized parameter, HI enables direct comparison of hysteresis inversion under different water contents, depressurization rates, and temperatures.
The HI value ranges from 0 to 1. An HI value of 0 indicates that no hysteresis inversion is present, whereas an HI value of 1 represents complete hysteresis inversion. A larger HI value indicates a more pronounced hysteresis inversion, corresponding to a greater contribution of the inversion region to the overall hysteresis response.
E F C r o s s = E F e n d E F C r o s s
H I p o s i t i o n = E F C r o s s E F e n d           0 < H I p o s i t i o n < 1
The hysteresis inversion position ( H I p o s i t i o n ), denoted as Δ E F Cross , is defined as the expansion factor (EF) interval between the end of the expansion process ( E F e n d ) (i.e., the starting point of compression) and the crossover point where the expansion and compression curves intersect. This parameter characterizes the extent over which hysteresis inversion persists during the compression process. A larger Δ E F Cross ( H I p o s i t i o n ) indicates that the inversion behavior is maintained over a longer portion of the compression path before transitioning back to conventional hysteresis.
Analysis of the hysteresis inversion parameters in Table 5 revealed that increasing water content promoted the occurrence and severity of hysteresis inversion. Under identical depressurization rates and temperatures, emulsified oils with higher water contents exhibited larger HI values and a higher H I p o s i t i o n , indicating a more pronounced inversion and a longer persistence of the inversion regime before returning to conventional hysteresis behavior.
In contrast, increasing temperature reduced both HI and H I p o s i t i o n , suggesting that elevated temperature weakens hysteresis inversion and shortens the inversion regime. Furthermore, for emulsified oils with the same water content tested at the same temperature, higher depressurization rates resulted in larger HI and H I p o s i t i o n values, indicating that rapid pressure depletion enhances both the intensity and persistence of hysteresis inversion.
Under fast depressurization at 15 °C, the H s i g n e d decreased monotonically with increasing water content, from +1551 (0%), +792 (10%), and +364 (20%) to −39 (30%), indicating a gradual transition from conventional hysteresis toward hysteresis inversion. Although the 20% water emulsion exhibited a positive H s i g n e d value, the presence of a crossover point, together with the calculated HI and H I p o s i t i o n value, confirms that hysteresis inversion occurred over a portion of the hysteresis path, while conventional hysteresis remained the dominant behavior. At 30% water content, the negative H s i g n e d value suggests that the inversion behavior became dominant in the overall hysteresis response.
At 75 °C, H s i g n e d values remain positive and nearly constant (+1140 to +1173), indicating that elevated temperature suppresses the inversion. Under slow depressurization, H s i g n e d approaches zero for all water contents at both temperatures, confirming the rate-dependent, non-equilibrium origin of the phenomenon. The combined dependence on water content, temperature, and depressurization rate indicates that hysteresis inversion is a non-equilibrium structural effect rather than a thermodynamic one.
The inversion arises from asymmetric structural response. During expansion, the rigid droplet network at high water contents restricts gas-bubble coalescence, trapping microbubbles and maintaining elevated pressures. During compression, partial relaxation of the emulsion structure opens pathways for gas redistribution, allowing re-dissolution at lower pressures than those sustained during expansion. The suppression of inversion at high temperature and slow rates—both of which weaken structural rigidity—is consistent with this interpretation.
For foamy-oil theory, hysteresis measures the degree of non-equilibrium gas trapping: greater hysteresis implies more undissolved gas after re-pressurization and stronger solution-gas drive in subsequent cycles. The inversion reported here suggests that in emulsified systems, the emulsion structure may facilitate gas re-dissolution during re-pressurization more effectively than it permits gas liberation during depressurization. For CSI operations, emulsified reservoirs may exhibit more efficient solvent re-dissolution during injection cycles than clean-oil PVT data would predict, potentially altering optimal cycle timing and solvent utilization. No prior CCEC study has reported this behavior, likely because all previous experiments used clean oils lacking the structural network of dispersed water droplets.

3.7. Synthesis of Results

The microstructural, rheological, IFT, density, and CCEC measurements converge on a consistent picture. Increasing water content produces larger, more densely packed droplets, which create a rigid emulsion network that drives steep increases in viscosity. IFT is unaffected, isolating emulsion structure as the controlling factor for CCEC behavior. In the PVT cell, this structural rigidity lowers pseudo-bubble point pressures at fast rates by stabilizing foamy oil, but reverses at slow rates where compositional effects (higher GER) dominate. The hysteresis inversion is the most direct expression of the emulsion network’s influence on gas-phase dynamics.
Laboratory PVT studies using only clean oil will systematically underestimate foamy-oil stabilization and overestimate pseudo-bubble point pressures in emulsified systems. For CSI field design, gas exsolution behavior, production GOR, and recovery efficiency may differ from predictions based on conventional PVT data. Operators designing CSI programs for reservoirs with significant water production should incorporate emulsion effects into experimental protocols and simulation calibration.

4. Conclusions

(1)
Water content strongly increases emulsion viscosity, with a threefold contrast between 10% and 30% emulsions at 25 °C that narrows to 1.6× at 75 °C.
(2)
IFT between emulsified oil and methane is insensitive to water content up to 30%, ruling out interfacial thermodynamics as the driver of CCEC differences.
(3)
Under fast depressurization, higher water content lowers the pseudo-bubble point through viscosity-mediated foamy-oil stabilization; under slow depressurization, higher GER reverses this ranking.
(4)
A hysteresis inversion is identified for the first time in emulsified foamy oil, with H s i g n e d transitioning from +1551 (clean oil) to −39 (30% emulsion) at 15 °C at a fast rate.
(5)
The inversion is suppressed at high temperature and slow rates, confirming its non-equilibrium structural origin.

Author Contributions

Conceptualization, J.J.; Methodology, J.J.; Validation, J.J.; Data curation, J.J.; Writing—original draft, J.J., X.B. and S.L.; Writing—review & editing, S.L. and N.J.; Supervision, N.J.; Project administration, N.J.; Funding acquisition, N.J. and A.B.-Z. All authors have read and agreed to the published version of the manuscript.

Funding

This research was funded by Canadian Natural Resources Limited (CNRL), Cenovus Limited, MITACS Canada, Petroleum Technology Research Centre (PTRC), and the Natural Sciences and Engineering Research Council of Canada (NSERC), grant number RGPIN-2019-6103, for Dr. Jia.

Data Availability Statement

The data presented in this study are available on request from the corresponding author.

Acknowledgments

The authors gratefully acknowledge the support from the Energy Systems Engineering programs at the Faculty of Engineering and Applied Science and the Faculty of Graduate Studies and Research (FGSR) at the University of Regina.

Conflicts of Interest

Author Amin Badamchi Zadeh was employed by the company Canadian Natural Resources, Calgary, Canada, The remaining authors declare that the research was conducted in the absence of any commercial or financial relationships that could be construed as a potential conflict of interest.

References

  1. Hamza, A.; Hussein, I.A.; Mahmoud, M. Introduction to reservoir fluids and rock properties. In Developments in Petroleum Science; Elsevier: Amsterdam, The Netherlands, 2023; Volume 78, pp. 1–19. [Google Scholar]
  2. Fingas, M.; Fieldhouse, B.; Bobra, M.; Tennyson, E. The Physics and Chemistry of Emulsions; Environment Canada and Consultchem: Ottawa, QC, Canada; US Minerals Management Service: Herndon, VA, USA, 1993. [Google Scholar]
  3. Romanova, Y.N.; Koroleva, M.Y.; Musina, N.S.; Maryutina, T.A. Rheology of gel-containing water-in-crude oil emulsions. Geoenergy Sci. Eng. 2023, 226, 211757. [Google Scholar] [CrossRef] [Scilit]
  4. Mohamed, A.M.O.; Elgamal, M.; Said, R.A. Determination of water content and salinity from a producing oil well using CPW probe and eigendecomposition. Sens. Actuators A 2006, 125, 133–142. [Google Scholar] [CrossRef] [Scilit]
  5. National Research Council; Division on Engineering; Physical Sciences; Commission on Physical Sciences, Mathematics, Applications; Steering Committee for the Petroleum in the Marine Environment Update. Oil in the Sea: Inputs, Fates, and Effects; National Academy Press: Washington, DC, USA, 1985. [Google Scholar]
  6. Canevari, G.P. The formulation of an effective demulsifier for oil spill emulsions. Mar. Pollut. Bull. 1982, 13, 49–54. [Google Scholar] [CrossRef] [Scilit]
  7. Fingas, M.; Fieldhouse, B. Water-in-oil emulsions: Formation and prediction. In Handbook of Oil Spill Science and Technology; Fingas, M., Ed.; Wiley: Hoboken, NJ, USA, 2014; pp. 225–270. [Google Scholar]
  8. Yarranton, H.W.; Hussein, H.; Masliyah, J.H. Water-in-hydrocarbon emulsions stabilized by asphaltenes at low concentrations. J. Colloid Interface Sci. 2000, 228, 52–63. [Google Scholar] [CrossRef] [Scilit] [PubMed]
  9. Chaverot, P.; Cagna, A.; Glita, S.; Rondelez, F. Interfacial tension of bitumen–water interfaces. Part 1: Influence of endogenous surfactants at acidic pH. Energy Fuels 2008, 22, 790–798. [Google Scholar] [CrossRef] [Scilit]
  10. Pauchard, V.; Sjöblom, J.; Kokal, S.; Bouriat, P.; Dicharry, C.; Müller, H.; Al-Hajji, A. Role of naphthenic acids in emulsion tightness for a low-total-acid-number (TAN)/high-asphaltenes oil. Energy Fuels 2009, 23, 1269–1279. [Google Scholar] [CrossRef] [Scilit]
  11. Ortiz, D.P.; Baydak, E.N.; Yarranton, H.W. Effect of surfactants on interfacial films and stability of water-in-oil emulsions stabilized by asphaltenes. J. Colloid Interface Sci. 2010, 351, 542–555. [Google Scholar] [CrossRef] [Scilit] [PubMed]
  12. McLean, J.D.; Kilpatrick, P.K. Effects of asphaltene aggregation in model heptane–toluene mixtures on stability of water-in-oil emulsions. J. Colloid Interface Sci. 1997, 196, 23–34. [Google Scholar] [CrossRef] [Scilit] [PubMed]
  13. Sjöblom, J.; Mingyuan, L.; Christy, A.A.; Gu, T. Water-in-crude-oil emulsions from the Norwegian continental shelf 7. Interfacial pressure and emulsion stability. Colloids Surf. 1992, 66, 55–62. [Google Scholar] [CrossRef] [Scilit]
  14. Wong, S.F.; Lim, J.S.; Dol, S.S. Crude oil emulsion: A review on formation, classification and stability of water-in-oil emulsions. J. Pet. Sci. Eng. 2015, 135, 498–504. [Google Scholar] [CrossRef] [Scilit]
  15. Sousa, A.M.; Matos, H.A.; Pereira, M.J. Properties of crude oil-in-water and water-in-crude oil emulsions: A critical review. Ind. Eng. Chem. Res. 2021, 61, 1–20. [Google Scholar] [CrossRef] [Scilit]
  16. Higgins, R.V.; Leighton, A.J. Computer prediction of water drive of oil and gas mixtures through irregularly bounded porous media—Three-phase flow. J. Pet. Technol. 1962, 14, 1048–1054. [Google Scholar] [CrossRef] [Scilit]
  17. Firoozabadi, A. Mechanisms of solution gas drive in heavy oil reservoirs. J. Can. Pet. Technol. 2001, 40, 15–20. [Google Scholar] [CrossRef] [Scilit]
  18. Bennion, D.B.; Mastmann, M.; Moustakis, M.L. A case study of foamy oil recovery in the Patos-Marinza Reservoir, Driza Sand, Albania. J. Can. Pet. Technol. 2003, 42, 14–22. [Google Scholar] [CrossRef] [Scilit]
  19. Johnsen, E.E.; Rønningsen, H.P. Viscosity of ‘live’ water-in-crude-oil emulsions: Experimental work and validation of correlations. J. Pet. Sci. Eng. 2003, 38, 23–36. [Google Scholar] [CrossRef] [Scilit]
  20. Kokal, S.L. Crude oil emulsions: A state-of-the-art review. SPE Prod. Facil. 2005, 20, 5–13. [Google Scholar] [CrossRef] [Scilit]
  21. Bobra, M. Water-in-oil emulsification: A physicochemical study. In Proceedings of the International Oil Spill Conference Proceedings, San Diego, CA, USA, 4–7 March 1991; American Petroleum Institute: Washington, DC, USA, 1991; Volume 1991. [Google Scholar]
  22. Fingas, M.; Fieldhouse, B. Water-in-oil emulsions: Results of formation studies and applicability to oil spill modelling. Spill Sci. Technol. Bull. 1999, 2, 195–196. [Google Scholar] [CrossRef] [Scilit]
  23. Fingas, M.; Fieldhouse, B. Studies of the formation process of water-in-oil emulsions. Mar. Pollut. Bull. 2003, 47, 369–396. [Google Scholar] [CrossRef] [Scilit] [PubMed]
  24. Fingas, M.; Fieldhouse, B. Formation of water-in-oil emulsions and application to oil spill modelling. J. Hazard. Mater. 2004, 107, 37–50. [Google Scholar] [CrossRef] [Scilit] [PubMed]
  25. Wang, Z.; Hong, J.; Zhao, X.; Chen, Y.; Wang, W.; Ismailov, A.A. Coupling Mechanism of Interfacial/Surface Film Formation in Emulsification-Foaming System under Shear Flow Field Condition: A Molecular Dynamics Simulation Study. Energy Fuels 2026, 40, 13819–13849. [Google Scholar] [CrossRef] [Scilit]
  26. Kraus, W.P.; McCaffrey, W.J.; Boyd, G.W. Pseudo-bubble point model for foamy oils. In Proceedings of the Annual Technical Meeting, Calgary, Calgary, Alberta, 8–11 May 1993; The Petroleum Society of CIM: Calgary, AB, USA, 1993; p. PETSOC-93-45. [Google Scholar]
  27. Sheikha, H.; Pooladi-Darvish, M. Micro bubbles in solution–gas drive in heavy oil: Their existence and importance. Transp. Porous Media 2012, 93, 495–516. [Google Scholar] [CrossRef] [Scilit]
  28. Sheikha, H.; Pooladi-Darvish, M. The effect of pressure-decline rate and pressure gradient on the behavior of solution-gas drive in heavy oil. SPE Reserv. Eval. Eng. 2009, 12, 390–398. [Google Scholar] [CrossRef] [Scilit]
  29. Modaresghazani, J.; Moore, R.G.; Mehta, S.A.; Anderson, M.; Badamchi-Zadeh, A. A novel method (CCE&C) to study transient phase behaviour in heavy oil and ethane. Fuel 2019, 257, 115946. [Google Scholar] [CrossRef] [Scilit]
  30. Jiang, J. Investigation of Water-in-Oil Emulsion on CSI Solvent Dissolution and Ex-Solution Performance for Heavy Oil. Master’s Thesis, University of Regin, Regina, SK, Canada, 2022. [Google Scholar]
  31. Dong, X.; Xi, Z.; Jia, N. A novel experimental method CCEC and modelling of methane dissolution and exsolution in heavy oil. In Proceedings of the SPE Canada Heavy Oil Conference, Virtual, 28 September 2020; SPE: Calgary, AB, Canada, 2020. [Google Scholar]
  32. Yang, C. A New Method for Measuring Solvent Diffusion Coefficients and Oil Swelling Factors of Heavy Oil–Solvent Systems. Master’s Thesis, University of Regina, Regina, SK, Canada, 2005. [Google Scholar]
Figure 1. Schematic illustration of the high-pressure PVT experimental system.
Energies 19 04217 g001
Figure 2. Microscopic images of emulsion oil with (A) 10%, (B) 20%, and (C) 30 vol% water content.
Energies 19 04217 g002
Figure 3. Effect of water content on emulsified dead-oil viscosity at 4000 kPa, based on the data reported by Jiang et al. [30].
Energies 19 04217 g003
Figure 4. Effect of water content on emulsified C1-live oil viscosity at 4000 kPa.
Energies 19 04217 g004
Figure 5. Effect of temperature on emulsified dead-oil and C1-live oil viscosity at 4000 kPa.
Energies 19 04217 g005
Figure 6. Density of emulsified stock-tank oil as a function of water content at 15 °C and 75 °C.
Energies 19 04217 g006
Figure 7. Pressure-dependent IFT behavior between emulsified stock-tank oils and methane at 15 °C and 75 °C [30].
Energies 19 04217 g007
Figure 8. P–EF responses for emulsified C1-live oils at 15 °C, fast rate (1.5 cm3/min), water contents 0–30%.
Energies 19 04217 g008
Figure 9. P–EF responses for emulsified C1-live oils at 75 °C, fast rate (1.5 cm3/min), water contents 0–30%.
Energies 19 04217 g009
Figure 10. P–EF responses for emulsified C1-live oils at 15 °C, slow rate (0.0003 cm3/min), water contents 0–30%.
Energies 19 04217 g010
Figure 11. P–EF responses for emulsified C1-live oils at 75 °C, slow rate (0.0003 cm3/min), water contents 0–30%.
Energies 19 04217 g011
Figure 12. P–EF responses for 30% emulsified C1-live oil at 15 °C under three depressurization rates.
Energies 19 04217 g012
Figure 13. P–EF responses for 30% emulsified C1-live oil at 75 °C under three depressurization rates.
Energies 19 04217 g013
Figure 14. H s i g n e d and H I M a x as a function of water content under different temperatures and depressurization rates.
Energies 19 04217 g014
Table 1. Non-emulsified heavy oil compositional analysis [30,31].
Carbon NumberMol%Carbon NumberMol%Carbon NumberMol%
C80.89C174.00C261.82
C93.44C183.64C271.88
C103.05C193.45C281.84
C113.61C203.11C291.56
C124.14C212.81C301.47
C134.47C222.59C31+31.95
C144.82C232.43
C154.75C242.13
C164.16C251.99Total100.00
Table 2. Measured water content for each sample [30].
Target Water ContentMeasured Water ContentAbbreviations in This PaperDeviation (%)
10%9.31%   ± 1.9%10% emulsion oil7%
20%22.55% ± 1.4%20% emulsion oil12%
30%33.34%   ± 1%30% emulsion oil11%
Table 3. Gas–emulsified oil ratio (GER) values for non-emulsified and emulsified live oil samples adopted from Jiang et al. [30].
Oil SampleGER (Solvent C1)
(cm3/cm3)
GOR (Solvent C1)
(cm3/cm3)
0% non-emulsified live oil8.638.63
10% emulsified live oil7.68.38
20% emulsified live oil8.7513.2
30% emulsified live oil11.216.86
Table 4. Pseudo-bubble point pressures for C1-emulsified live oils under different conditions.
Non-emulsified live oil (C1) [31]0% H2O
Flow RateFastMedSlow
Temperature15 °C75 °C15 °C75 °C15 °C75 °C
Pseudo-Bubble Point Pressure (kPa)4901350950235018002400
Emulsified live oil (C1)10% H2O
Flow RateFastSlow
Temperature15 °C 75 °C15 °C 75 °C
Pseudo-Bubble Point Pressure (kPa)350 4901760 2060
Emulsified live oil (C1)20% H2O
Flow RateFastSlow
Temperature15 °C 75 °C15 °C 75 °C
Pseudo-Bubble Point Pressure (kPa)400 5701860 2900
Emulsified live oil (C1)30% H2O
Flow RateFastMedSlow
Temperature15 °C75 °C15 °C75 °C15 °C75 °C
Pseudo-Bubble Point Pressure (kPa)32014201180380023504200
Table 5. Measured HI and H I p o s i t i o n values for emulsified foamy oil exhibiting hysteresis inversion.
Water%Depressurization RatesTemperature H I p o s i t i o n H I
20%Fast15 °C0.6940.285
75 °C0.0310.011
30%Fast15 °C0.6940.517
75 °C0.440.086
30%Med15 °C0.2340.021
75 °C0.0290.017
Disclaimer/Publisher’s Note: The statements, opinions and data contained in all publications are solely those of the individual author(s) and contributor(s) and not of MDPI and/or the editor(s). MDPI and/or the editor(s) disclaim responsibility for any injury to people or property resulting from any ideas, methods, instructions or products referred to in the content.