Article

Impact of Flow Direction in Borehole Heat Exchangers on Heat Recovery Efficiency in BTES Systems: A Multi-Year Simulation Study

Oil and Gas Institute—National Research Institute, 25A Lubicz Str., 31-503 Krakow, Poland
*
Author to whom correspondence should be addressed.
Energies 2026, 19(16), 3892; https://doi.org/10.3390/en19163892
Submission received: 6 July 2026 / Revised: 3 August 2026 / Accepted: 9 August 2026 / Published: 19 August 2026
(This article belongs to the Special Issue Advanced Research in Geoenergy Storage and Conversion)

Abstract

The European Union’s climate policy promotes waste incineration as an alternative to landfilling. However, the continuous nature of waste generation, combined with seasonal variability in energy demand, leads to a mismatch between heat production and consumption in waste-to-energy systems. Seasonal Borehole Thermal Energy Storage (BTES) systems are one option for mitigating this mismatch. The aim of this study was to develop a theoretical geological model of a BTES-type storage system located in the Carpathian Foredeep and to simulate its multi-year operation using the FEFLOW numerical modeling software. The model represents an initial assessment of system performance under assumed geological and operational conditions and has not yet been validated against field measurements. Two operating scenarios were analyzed. In the 1st scenario, both heat injection and heat extraction from the storage system occurred through Borehole Heat Exchangers (BHEs) located in the center of the storage system. In the 2nd scenario, heat extraction is initiated through heat exchangers located in the outermost zone of the BTES field. The analysis focused on the temperature of the circulating working fluid in the U-tubes and on variations in heat transfer rate during injection and extraction cycles. The energy performance of the system was evaluated for both configurations. The results showed that the reversed-flow operating strategy provided a higher thermal energy recovery ratio and more favorable long-term thermal performance than the center-to-center flow configuration, indicating the potential feasibility of BTES operation under the assumed Carpathian Foredeep conditions.

1. Introduction

The European Union aims to achieve carbon neutrality by 2050 and promotes measures to reduce greenhouse gas emissions across key economic sectors [1]. Emissions from the energy production and built environment sectors are included in these efforts due to their significant contribution to total emissions [2,3]. As part of its climate strategy, the EU also seeks to promote a circular economy through the use of municipal solid waste (MSW) for energy production. Waste incineration plants integrated with district heating networks often face a summer mismatch, whereby waste must continue to be incinerated for disposal purposes while heat demand declines, leading to the underutilization of thermal energy. This generates the need to store thermal energy during summer and utilize it during winter [4]. Heat storage systems are an essential element of an efficient heating system with a high share of renewable energy, as they effectively solve the problem of unstable energy supplies by storing excess energy. Among the most promising energy storage methods are borehole thermal energy storage systems (BTES), which utilize the natural heat capacity of rocks.
Seasonal BTES systems are successfully used as components of large-scale district heating systems and as large-scale thermal energy storage systems for institutional and commercial applications. Large-scale BTES can be used with a heat pump or as a standalone thermal energy storage system, with heat provided by solar collectors. BTES size can vary significantly depending on ground conditions, rock parameters, and the amount of energy required to be stored [5]. Borehole thermal energy storage (BTES) is used in numerous projects worldwide, in a variety of configurations [6,7,8,9,10,11,12,13,14,15,16,17,18,19,20,21,22,23,24,25,26,27,28,29].
Despite the growing need for seasonal thermal energy storage, the deployment of large-scale BTES systems in Poland remains very limited. Currently, only a few large installations have been implemented [20]. Therefore, there is a need to evaluate the feasibility and performance of BTES systems under Polish geological and climatic conditions in order to assess their potential for storing excess thermal energy and supporting the decarbonization of the heating sector. The novelty of the present study lies in combining a fully coupled three-dimensional thermo-hydraulic FEFLOW model with a representative geological model of the Carpathian Foredeep to evaluate the long-term influence of discharge-flow reversal on outlet temperature, thermal energy recovery ratio, and subsurface thermal evolution. The primary goal of this work is to construct a theoretical geological model of a BTES-type storage system and to forecast its operation over several years using specialized FEFLOW 11 software. The study area was chosen in the Carpathian Foredeep because of the existence and planned construction of a municipal waste thermal treatment plant in the area. The performance of the storage system was analyzed under two operating scenarios. In the 1st scenario, both heat injection and heat extraction from the storage system occurred from BHEs located in the center of the storage system. In the 2nd scenario, heat extraction occurred from heat exchangers located in the outermost zone of the BTES field. This allowed the estimation of the thermal energy recovery ratio for the modeled BTES system for both U-tube flow configurations.

2. Borehole Thermal Energy Storage

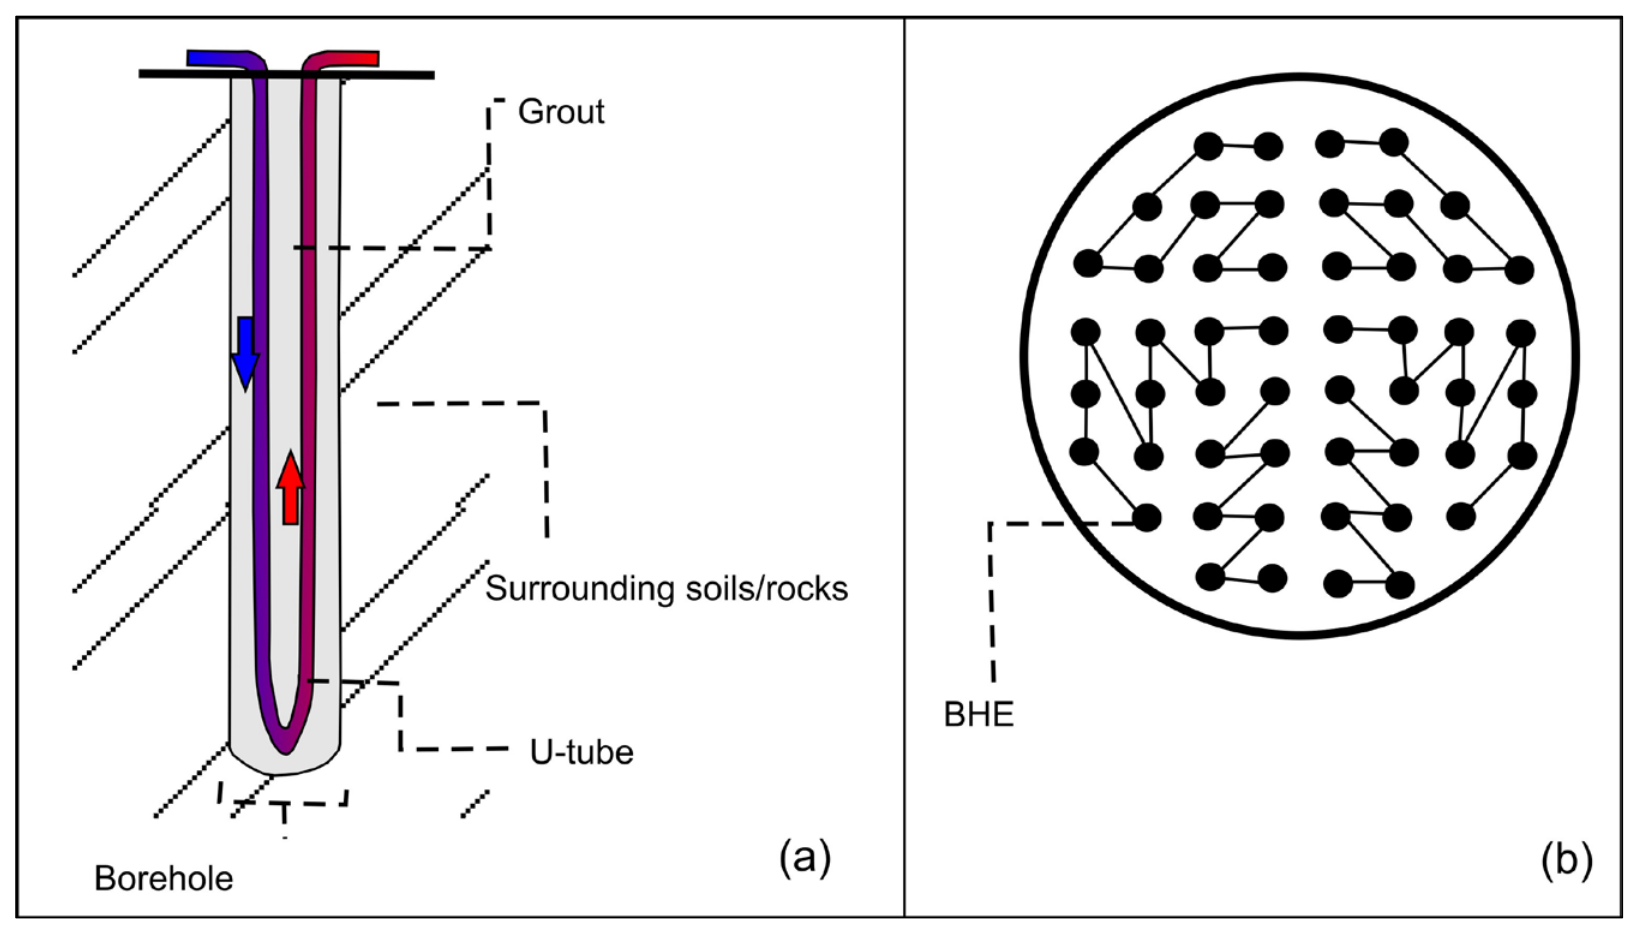
Borehole thermal energy storage (BTES) is one of the most common methods of seasonal thermal energy storage worldwide. Storing thermal energy in a borehole utilizes the large thermal capacity of underground rocks. The idea is to transfer the thermal energy of a fluid, such as hot water or brine, to the bedrock and then extract it through the same BHEs during periods of increased energy demand during the heating season. Boreholes are drilled to depths ranging from several dozen to several hundred meters, depending on ground conditions and rock composition [5], ranging in depth from several dozen to 200–300 m, spaced 2 to 6 m apart. The most efficient borefield configuration was assumed to be cylindrical. Square and rectangular configurations are also used, but circular configurations minimize heat losses, which are greater in other configurations [30]. Within the storage area, BHEs are connected within hydraulic sections, each consisting of two to several BHEs. Hot water or the working fluid is injected through the BHEs located closest to the center of the system and distributed among the individual BHE arrays. During heat extraction, the flow direction is reversed, with heat extraction starting from the outermost BHEs and progressing toward the BHEs located closer to the center of the system. This injection and energy extraction system ensures maximum temperatures occur in the center of the storage facility, while temperatures decrease further outward [31]. This benefits the storage facility by reducing stored heat losses. Heat is transferred to the rock mass via a system of U-tubes inserted into the borehole, known as a Borehole Heat Exchanger (BHE) (Figure 1). Borehole Heat Exchangers are typically 100–150 mm in diameter and deployed 30–200 m below the ground surface [30,32]. U-shape tubes are typically made of high-density polyethylene (HDPE) or cross-linked polyethylene (PEX). As a heat transfer fluid circulated around the BHE, ethanol, ethylene propylene glycol [15], or water is commonly used. The borehole is filled with brine or a special grout with increased thermal conductivity, which allows for rapid and efficient heat transfer. Hot water injected into the U-tubes releases heat first to the brine or grout, then to the bedrock surrounding the borehole. Heat transfer depends on the thermal conductivity of the rocks, the temperature difference between the circulating fluid in the BHE and the surrounding ground, and the lithological variations in the borehole profile. Higher thermal conductivity and a larger temperature difference between the circulating fluid and the surrounding formation result in enhanced heat transfer and a larger thermal influence zone around the borehole. Borehole heat exchangers installed in boreholes can be designed as single or double U-tube configurations. The use of double U-tube BHEs can increase heat transfer capacity and improve the thermal performance of the system. Additionally, multi-pipe configurations may improve operational flexibility and, in some cases, provide partial redundancy; however, this depends on the specific design and control strategy. In the case of single U-tube BHEs, failure of a heat exchanger requires the affected borehole to be taken out of operation.
Borehole thermal energy storage (BTES) systems are used in numerous projects worldwide, in a variety of configurations. Table 1 summarizes some of the existing BTES systems worldwide. The number of BHEs in storage varies within very wide limits: from 16 in Paskov (Czech Republic) to even 528 in Neckarsulm (Germany). Borehole depth is also variable, ranging from 11 m in Treviglio, Italy, to 160 m in Root Lucerne, Switzerland. The type of rock in which the BTES was created is mostly sedimentary or crystalline.
The correct and effective operation of a BTES-type storage facility is influenced by many factors, such as the volume and capacity of the storage facility, hydrogeological conditions, petrophysical parameters of the ground, BHE configuration, their distance, length, and technical parameters [33,34,35]. However, relatively few studies have addressed these factors in detail. Therefore, it is necessary to perform a detailed study of this field, such as a complete numerical modeling. Such studies can allow for the design of an optimal system and the estimation of its performance in both the short- and long-term [36].

3. Outline of the Geological Structure

Several municipal waste thermal treatment plants currently operate or are planned in the Carpathian Foredeep area. One of these facilities is located in Rzeszów; therefore, this region was selected as a potential site for a BTES facility. Three major geological-structural units are distinguished within the geological structure of this area:
The sub-Miocene basement, ranging in age from the Precambrian to the Cretaceous;
The Carpathian–Stebnik overthrust, of Cretaceous–Tertiary age;
The Miocene Carpathian Foredeep.
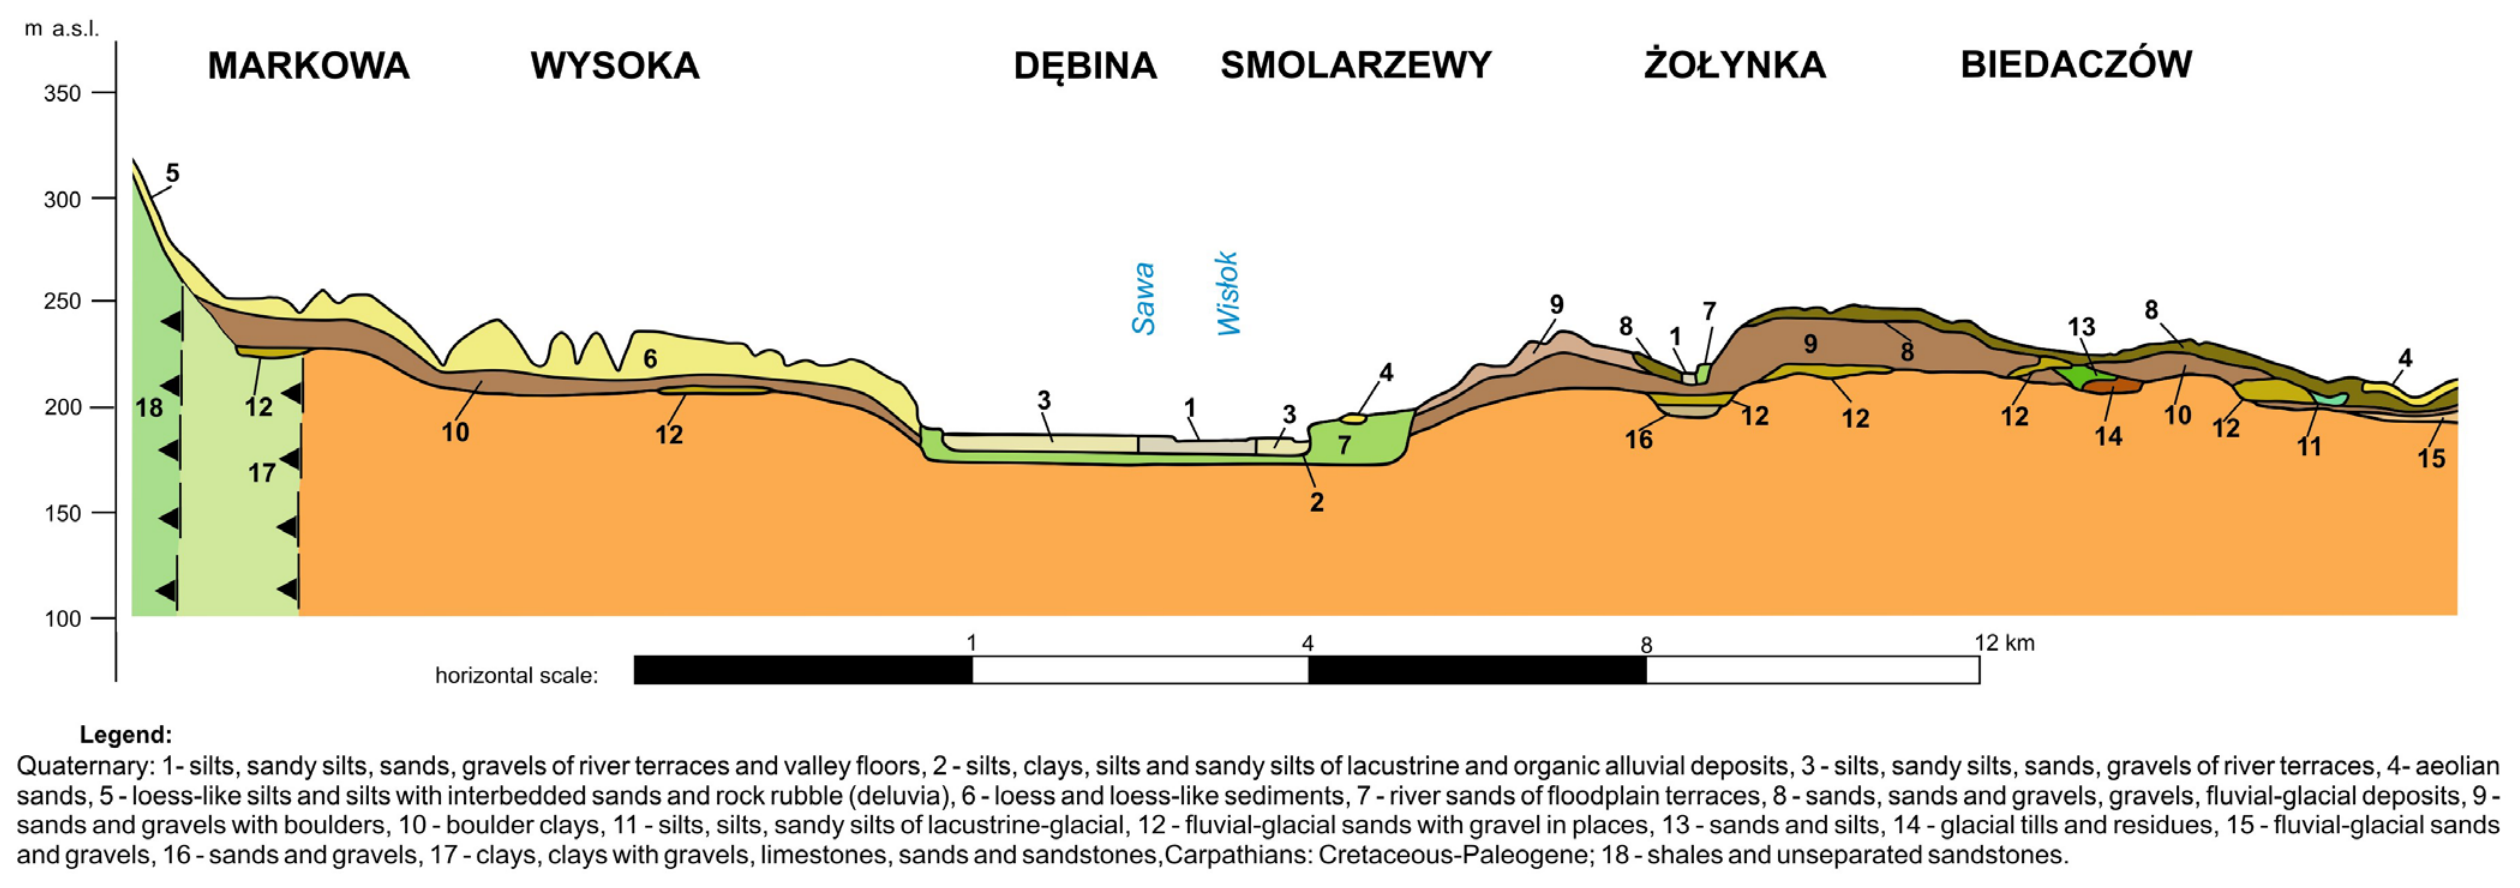
In the presented project, the rocks considered for thermal energy storage are the molasse formations of the Carpathian Foredeep (Figure 2) [37,38]. These rocks occur in the form of claystones, mudstones, sandstones, anhydrites, and, less commonly, conglomerates and limestones. Their thickness in the Rzeszów region ranges from several tens of meters to more than 2 km. Near the southern boundary of the Carpathian Foredeep, including the Rzeszów region, rocks of the Carpathian nappes overlie the Miocene molasse rocks. These nappes were thrust northward from the south during the Miocene [39]. In the Rzeszów region, these rocks range in age from the Lower Cretaceous to the Miocene and are represented by clay shales, mudstones, sandstones, marls, Menilite shales, cherts, and, less commonly, conglomerates and limestones. The thickness of the Carpathian overthrust increases southward from several tens of meters to several kilometers. The rocks of the Carpathian Foredeep and the Carpathians are covered by Quaternary deposits. Within the Foredeep, these are fluvial sediments consisting of clay, silts, sands, and gravels with thicknesses up to 10–12 m.
At the selected location, the stratigraphic-lithological profile is as follows:
From 0 to 6–12 m: soil, silt, sandy silt, clayey silt, sand or gravelly sand, and gravel;
From 6 to 12 m to 150 m: clays, clay shales, and shales;
From 150 to 175 m: sandstones;
From 175 to 600 m: clay shales and shales.
Since the BHEs will have a length of 85 m within the Miocene formations and will be open 5 m below the top of the Miocene, it may be assumed that the principal host rocks for thermal energy storage will be Tertiary clays, clay shales, and shales.
Hydrogeological conditions within the planned storage area are characterized by the occurrence of two aquifer systems: Quaternary and Tertiary [40]. Within the Quaternary aquifer, the groundwater table occurs at depths of approximately 1.5 to 6.0 m, and locally down to 12 m. In the Miocene formations, significant aquifers may occur within sandstone series identified at depths of 150–175 m below ground level, i.e., below the planned storage interval. The position of deep groundwater within the Tertiary clay formations has not been identified. The lithological characteristics of this interval indicate that groundwater within the Tertiary clays is either stagnant or exhibits only very limited flow, consistent with the inclination of local and regional structures. The stagnant nature of the Tertiary groundwater is favorable for thermal energy storage, since the absence of groundwater flow ensures that the injected heat remains in place and is not transported beyond the storage reservoir.

4. Materials and Methods

Numerical simulations were conducted using FEFLOW software (DHI Group), which proved to be a valuable tool for evaluating BTES performance, including the design of borehole heat exchangers and the optimization of operational parameters. The constructed digital BTES model measures 260 m × 170 m × 150 m and consists of 30 layers, each 5 m thick. The geological model was simplified to represent the dominant formations controlling the long-term thermal response of the BTES system. The layers are composed of alternating shale and clay shale, whose thermal and hydraulic parameters are summarized in Table 2. They represent assumed representative values selected to characterize typical shale and clay shale formations. Due to the lack of site-specific measurements, these parameters were adopted for the numerical simulations. The use of representative material properties introduces a degree of uncertainty; however, the adopted values are considered appropriate for evaluating the general thermal response and long-term performance of the BTES system. The Quaternary layer was not explicitly included in the model, as the present study focused on long-term heat storage performance and deep subsurface heat transport. Potential short-term effects related to shallow thermal processes and surface conditions were not considered within the scope of this analysis.
Since analytical infinite line source (ILS) solutions assume a homogeneous and isotropic medium with purely conductive heat transfer, an additional simplified model was created for verification purposes. The hydraulic gradient was set to zero, and homogeneous thermal properties were assigned to the domain to ensure consistency with the analytical assumptions. This verification does not represent the validation of the full-scale BTES model but confirms the correct implementation of heat transport in the numerical framework. According to Carslaw and Jaeger [41], the temperature increase in a medium at a radial distance r (m) from an infinite line source with a constant heat exchange rate, q (10.4 W/m), is expressed as
T r , t T 0 = q 4 π λ E r 2 4 α t ,
where T 0 (10 °C) is the initial ground temperature, λ (2.5 W/(mK)) thermal conductivity of solid, α (1.04 × 10⁻⁶ m2/s) the thermal diffusivity, t (31,536,000 s) time, and E is the exponential integral function.
The temperature distribution obtained from the numerical model after 365 days of continuous heat injection was compared with the analytical ILS solution at selected radial distances from the borehole (Table 3). The maximum absolute difference between the FEFLOW results and the analytical Infinite Line Source solution was 0.17 °C (approximately 1.5%). The calculated MAE and RMSE were 0.066 °C and 0.085 °C, respectively. The largest discrepancy occurred at the smallest radial distance from the borehole due to the numerical representation of the ideal line heat source within the finite-element mesh, whereas the analytical ILS solution assumes an ideal infinitesimal line source.
The numerical model was developed in FEFLOW based on the coupled solution of groundwater flow and heat-transport equations in a porous medium. Heat transfer within the geological formation was considered through conductive and advective mechanisms, while the BHEs were represented using the built-in FEFLOW BHE formulation. The model assumes local thermal equilibrium between the fluid and the porous medium.
The first step was to simulate the flow under steady-state conditions. This allowed us to obtain a hydraulic potential distribution that will define the initial condition for the simulation under BTES operating conditions. The model assumed that the entire storage zone would be located under saturated conditions, and 1st kind flow boundary conditions (Dirichlet) were established on the western and eastern walls. The groundwater flow direction was from east to west. The hydraulic gradient of 0.00192 m/m resulted from the prescribed hydraulic head boundaries of the model domain, corresponding to a head difference of 0.5 m across the domain. All other boundary surfaces represent no-flow conditions. This is automatically satisfied by natural Neumann-type boundary conditions and does not require any specifications [42].
The rock mass was represented by a sufficiently large finite conductive domain, providing an approximation of infinite-domain conditions for the purpose of heat transport simulations. The ground surface was simulated as a boundary condition with a constant temperature of 10 °C (Dirichlet), which is the average annual ground surface temperature in Poland. The average annual ground surface temperature of 10 °C may be considered representative for long-term BTES simulations, where the influence of seasonal surface temperature fluctuations is expected to be limited. A constant temperature of 14.5 °C was also assumed at the bottom of the model. For the initial conditions and the eastern side of the boundary, a linear temperature increase with depth was applied, with a specific geothermal gradient of 3 °C/100 m. Therefore, depending on the adopted timescale for heat storage, the land management method above the BTES system will be crucial. In some cases, it may be beneficial to limit the area through which heat losses to the environment occur or to insulate this area [30,43]. The no-flux boundary condition was applied to all remaining model boundaries, which were located sufficiently far from the BTES to minimize the influence of the thermal perturbations induced by the system. The dimensionless error criterion implemented in FEFLOW was used for both the groundwater flow and heat transport simulations. In addition, the adaptive automatic time-stepping algorithm available in FEFLOW was employed to ensure numerical stability and convergence throughout the transient simulations. The chosen error tolerance was 10−5, using the Euclidean L2 integral (RMS) norm. The simulations were performed using the parallel direct solver PARDISO implemented in FEFLOW, which provides an efficient and robust solution of the large sparse matrix systems generated by the finite-element discretization.
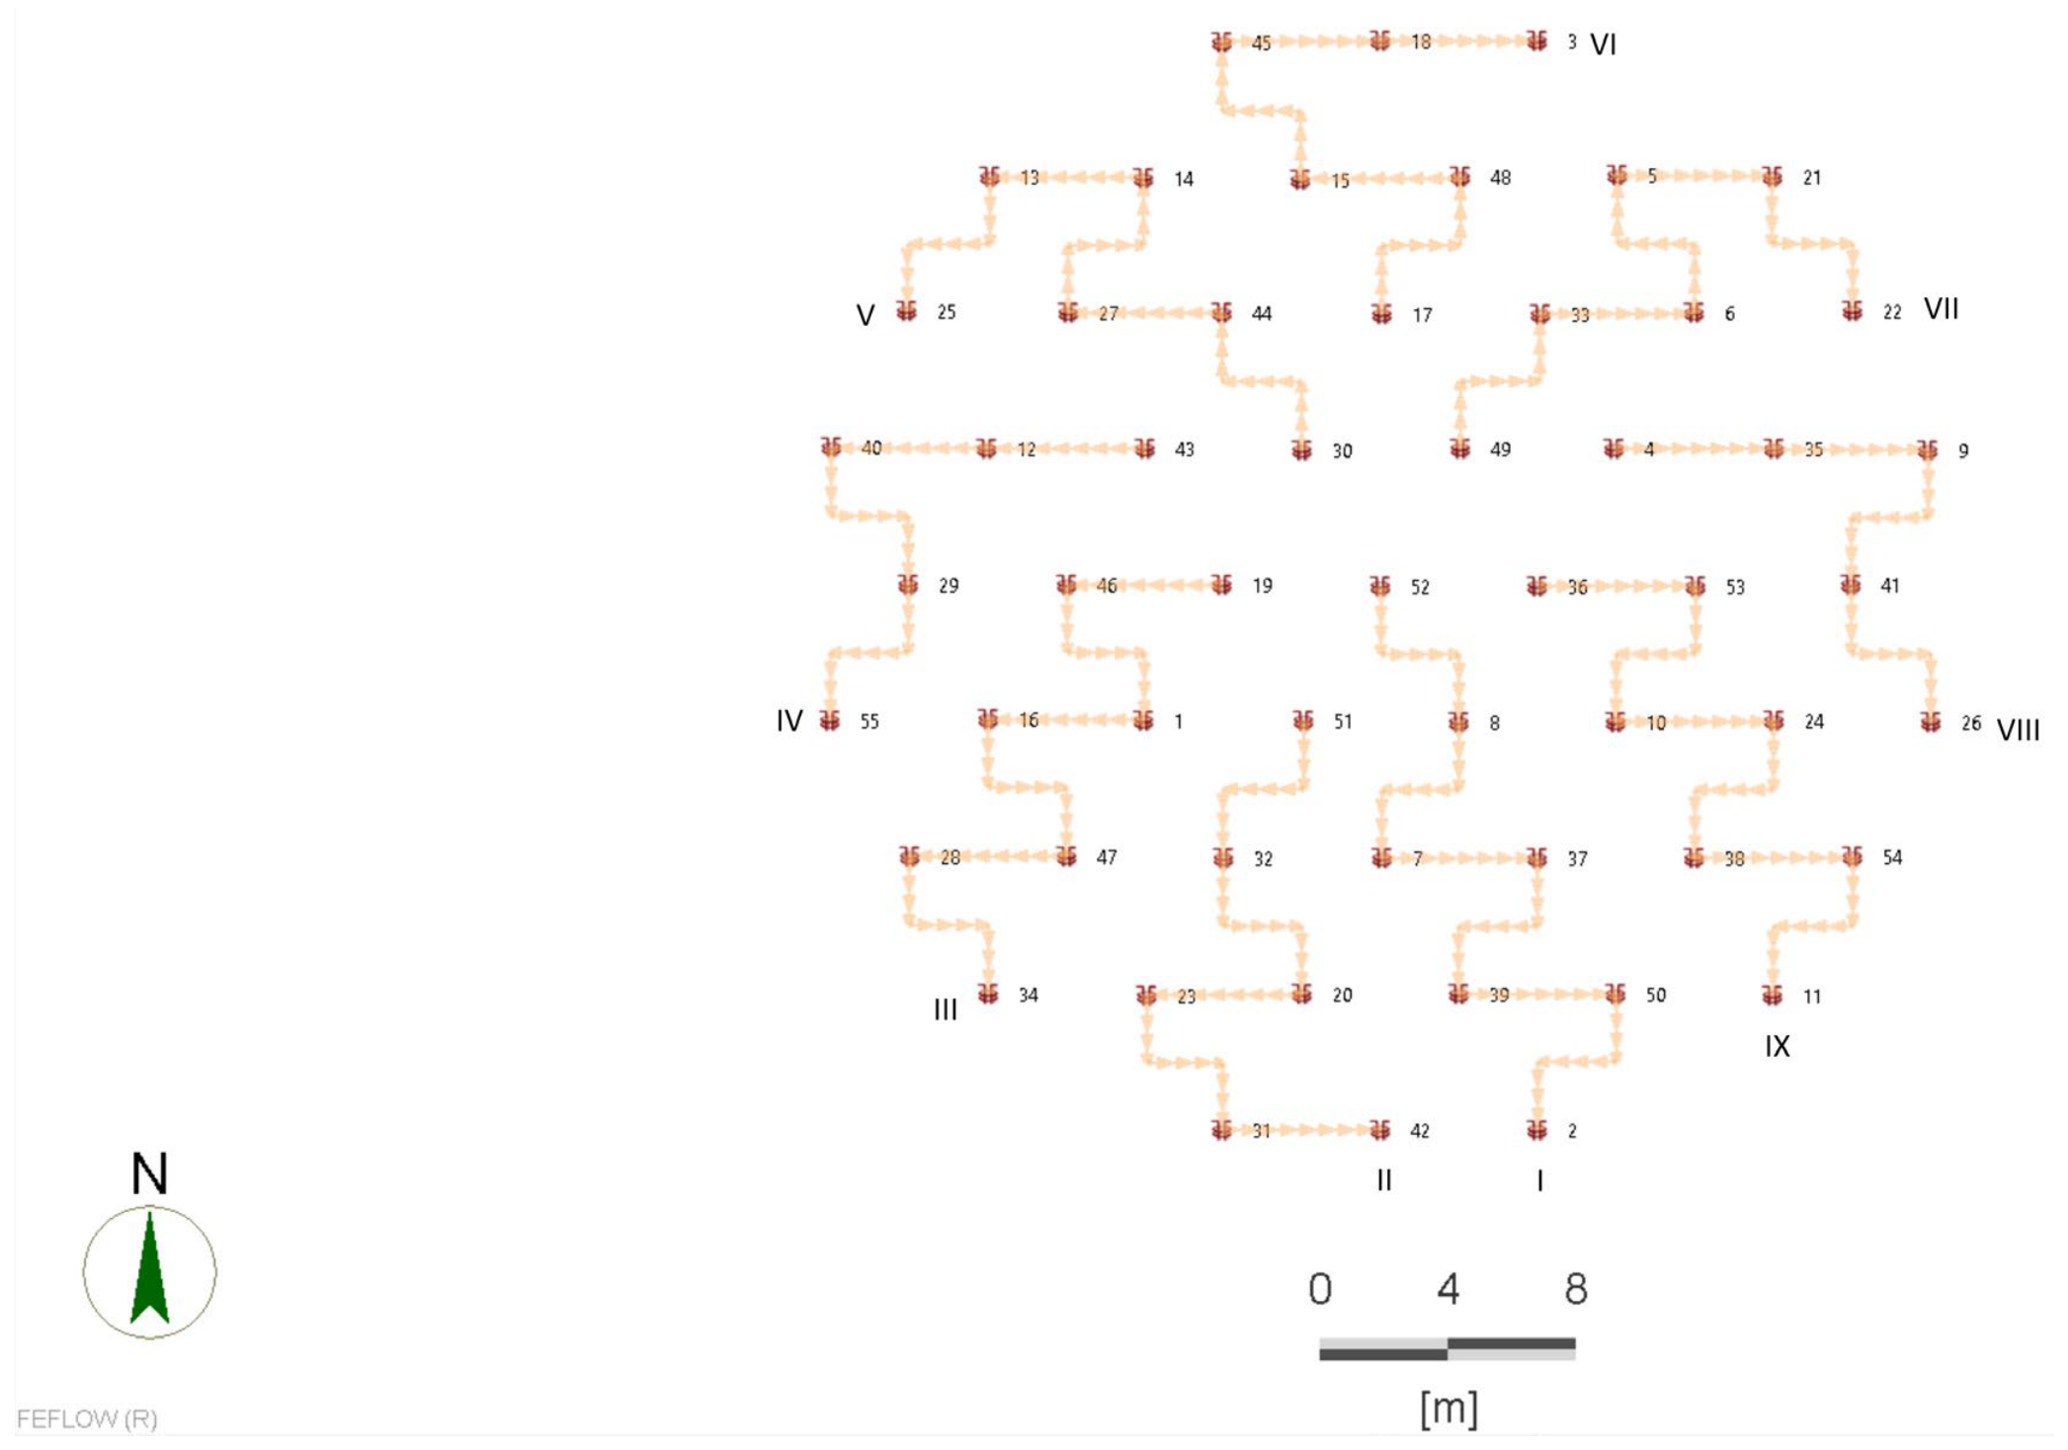
It was assumed that the BTES facility in the Carpathian Foredeep region would consist of 55 BHE spaced 5 m apart. The borefield configuration was selected as a representative medium-scale BTES system for numerical investigation. A local refinement around the BHE was conducted during its generation to obtain a greater mesh quality. The 120 mm diameter boreholes were equipped with single U-tube BHEs with an active length of 85 m. The thermophysical properties of the circulating fluid in the BHEs were assumed to be constant during the simulations. The adopted values correspond to water properties (Table 4). No temperature dependency was applied to these parameters in the BHE formulation. Nine symmetrical BHE arrays, consisting of 5, 6, or 7 BHEs each, were defined to represent the hydraulic sections of the system during operation (Figure 3).
Two storage scenarios were assumed. Scenario I assumed a constant water flow direction through the BHEs, starting from those closest to the center to those furthest out. In Scenario II, the flow direction was reversed depending on the cycle. The analyzed scenarios were selected to compare two operating strategies that differ only in the direction of fluid flow during the discharging cycle while keeping all other model parameters identical. This approach was intentionally adopted to isolate the effect of flow direction on the long-term thermal performance of the BTES system. In this study, a flow rate of 0.175 m3/h per BHE was assumed, which was selected to maintain thermal stratification while ensuring efficient heat transfer in the BTES systems. The flow rate through each BHE array depends on the number of BHEs within the array and equals 0.875, 1.05, and 1.23 m3/h for arrays containing 5, 6, and 7 BHEs, respectively. The flow rate for the entire BTES system will therefore be 9.63 m3/h. The temperature of the water injected into the system was kept constant throughout all operating cycles: 60 °C during heat injection and 15 °C during heat extraction. The storage system operation was defined by alternating charging and discharging cycles separated by standby periods, with two time series controlling the variations in flow rate and water temperature. During the initial period of 730 days (pre-heating), the storage system was continuously charged. Then, for the next 3100 days (≈8.5 years), the system operated cyclically: discharging for 180 days, followed by a 2-day standby period. Subsequently, the storage system was charged again for 180 days, followed by a 3-day break. In typical BTES operation, charging and discharging cycles occur continuously, seasonally, without significant standby periods, allowing for the gradual development and maintenance of spatial temperature gradients. The total time of the simulation was 3830 days (≈10.5 years).

5. Results

5.1. Pre-Heating

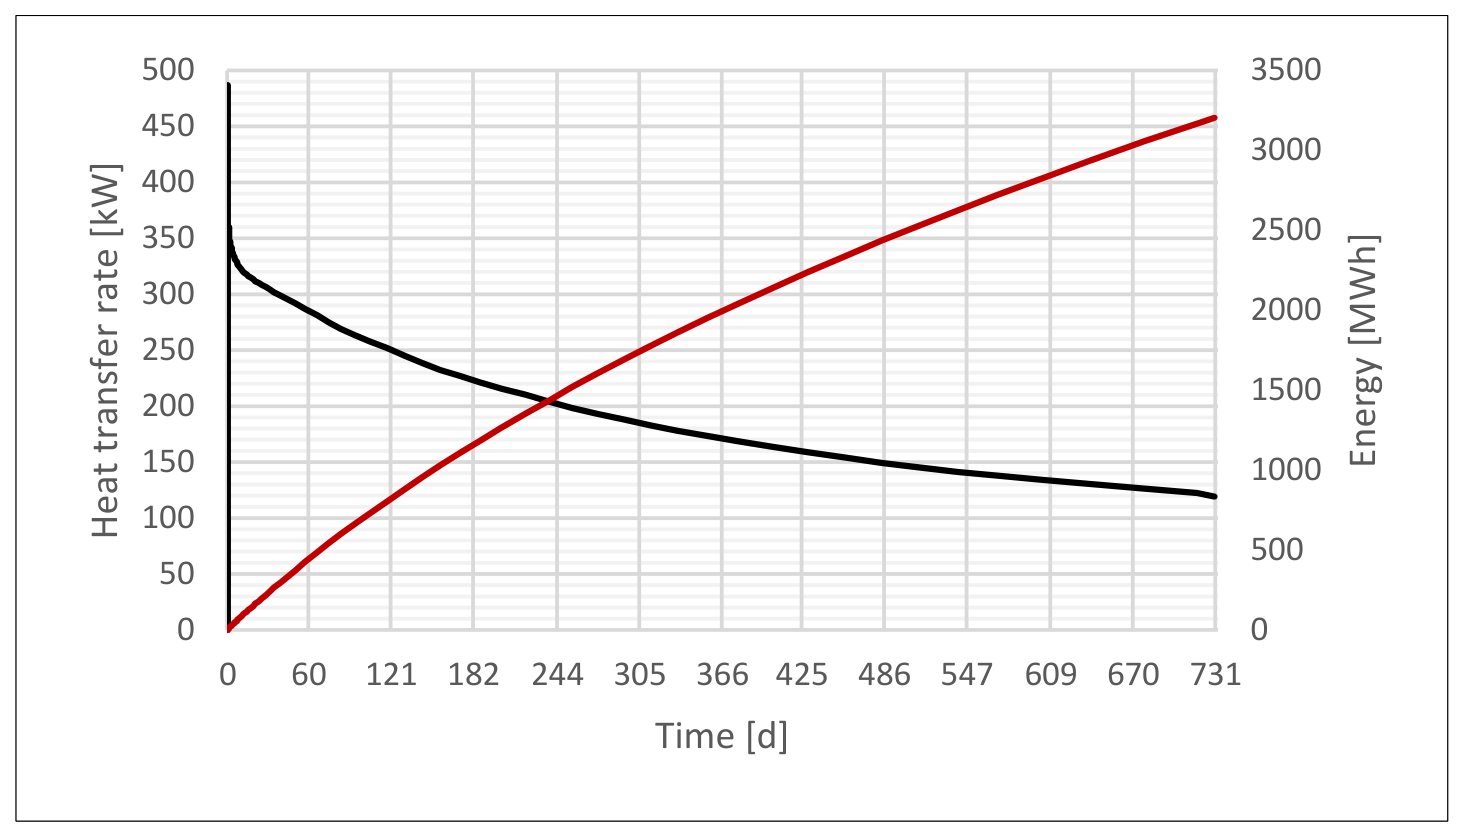
The initial stage of the storage simulation in both scenarios consisted of a 730-day pre-heating period. Pre-heating is intended to create a thermal buffer. This increases the average ground temperature and creates a broad temperature field, which consequently reduces conduction losses to the surroundings and allows for repeatable operating cycles. This period should not be considered as an optimal charging duration, since the required time for thermal build-up in a BTES system depends on multiple factors, including geological conditions, ground thermal properties, BHE configuration, and operational characteristics. The simulation was performed with an automatic time step, with the initial time step being 0.0001 days. Initially, the heat transfer rate was relatively high, approximately 485 kW (Figure 4), due to the fact that cold ground has a huge capacity to absorb heat across a large temperature gradient. However, the heat transfer rate began to decline rapidly almost immediately, reaching approximately 330 kW by day 2 and approximately 310 kW by day 20. In the following days, the decline in the heat transfer rate became much more gradual, reaching approximately 120 kW on the last day of injection. This indicates the gradual heating of the ground surrounding the borehole heat exchangers. Figure 4 also provides information on the amount of energy injected into the rock mass. In this case, 3204 MWh of energy was injected into storage.

5.2. Scenario I

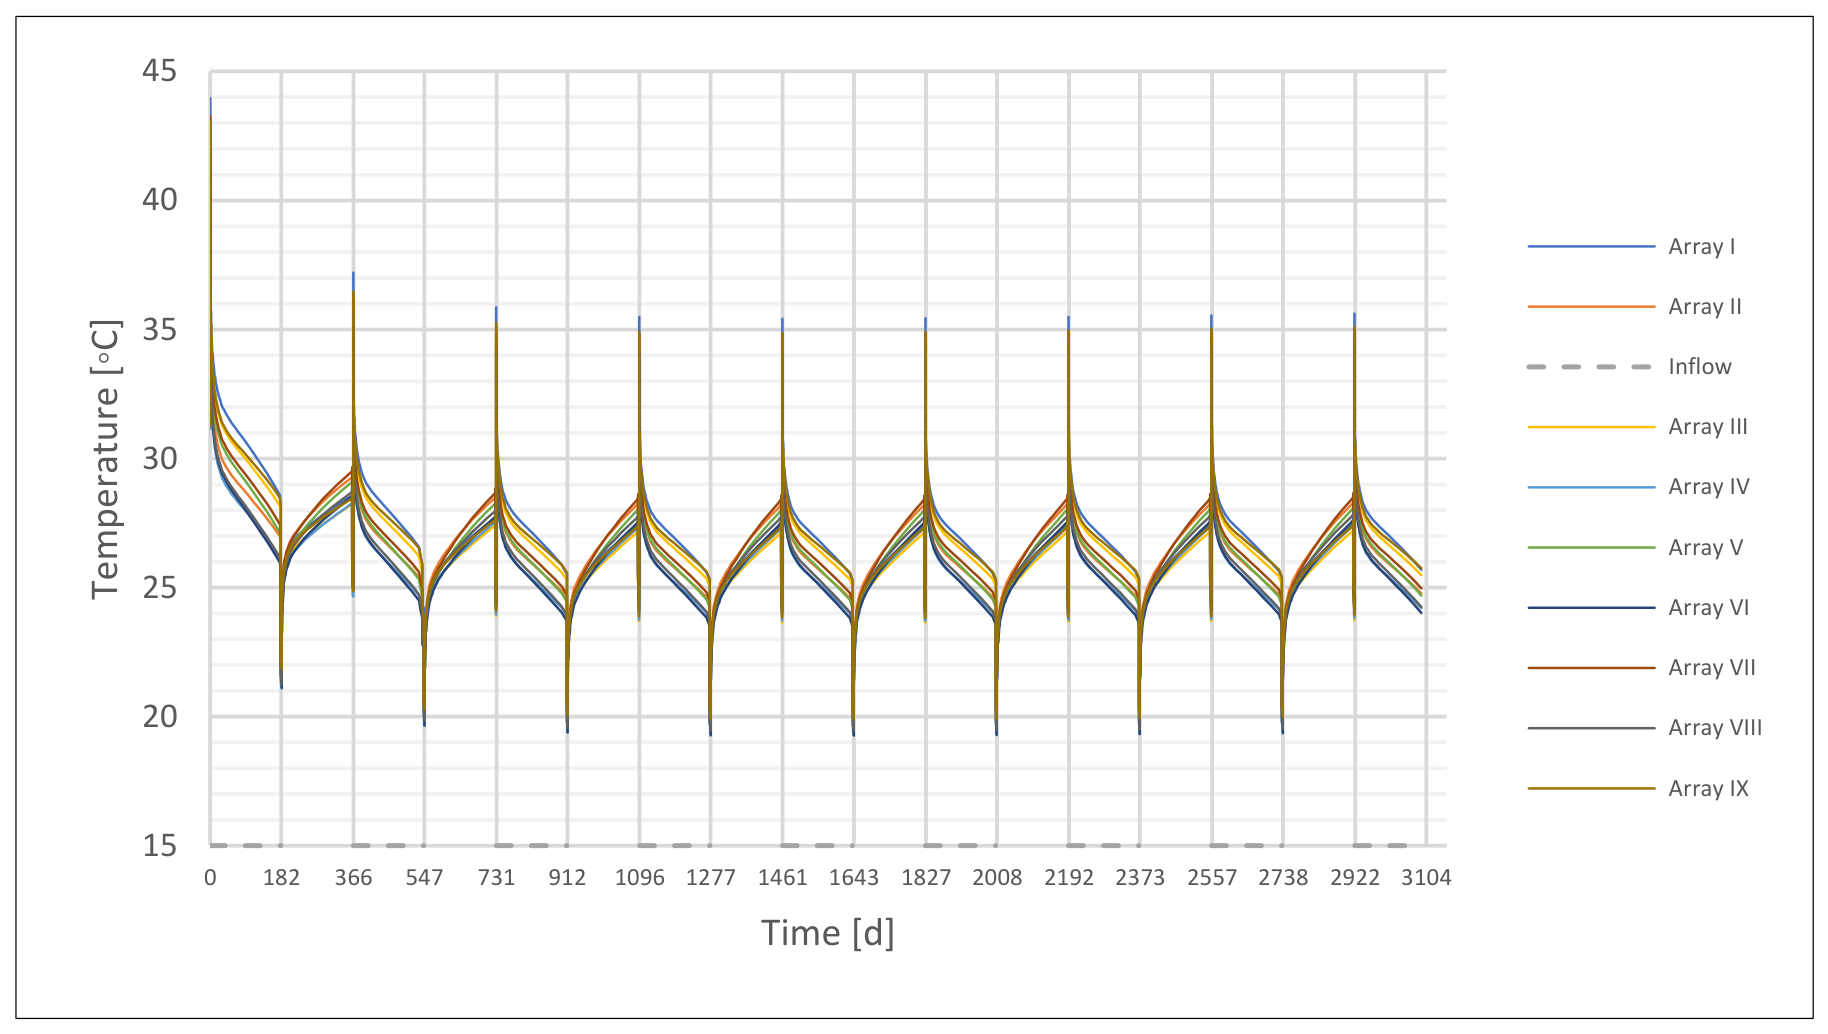
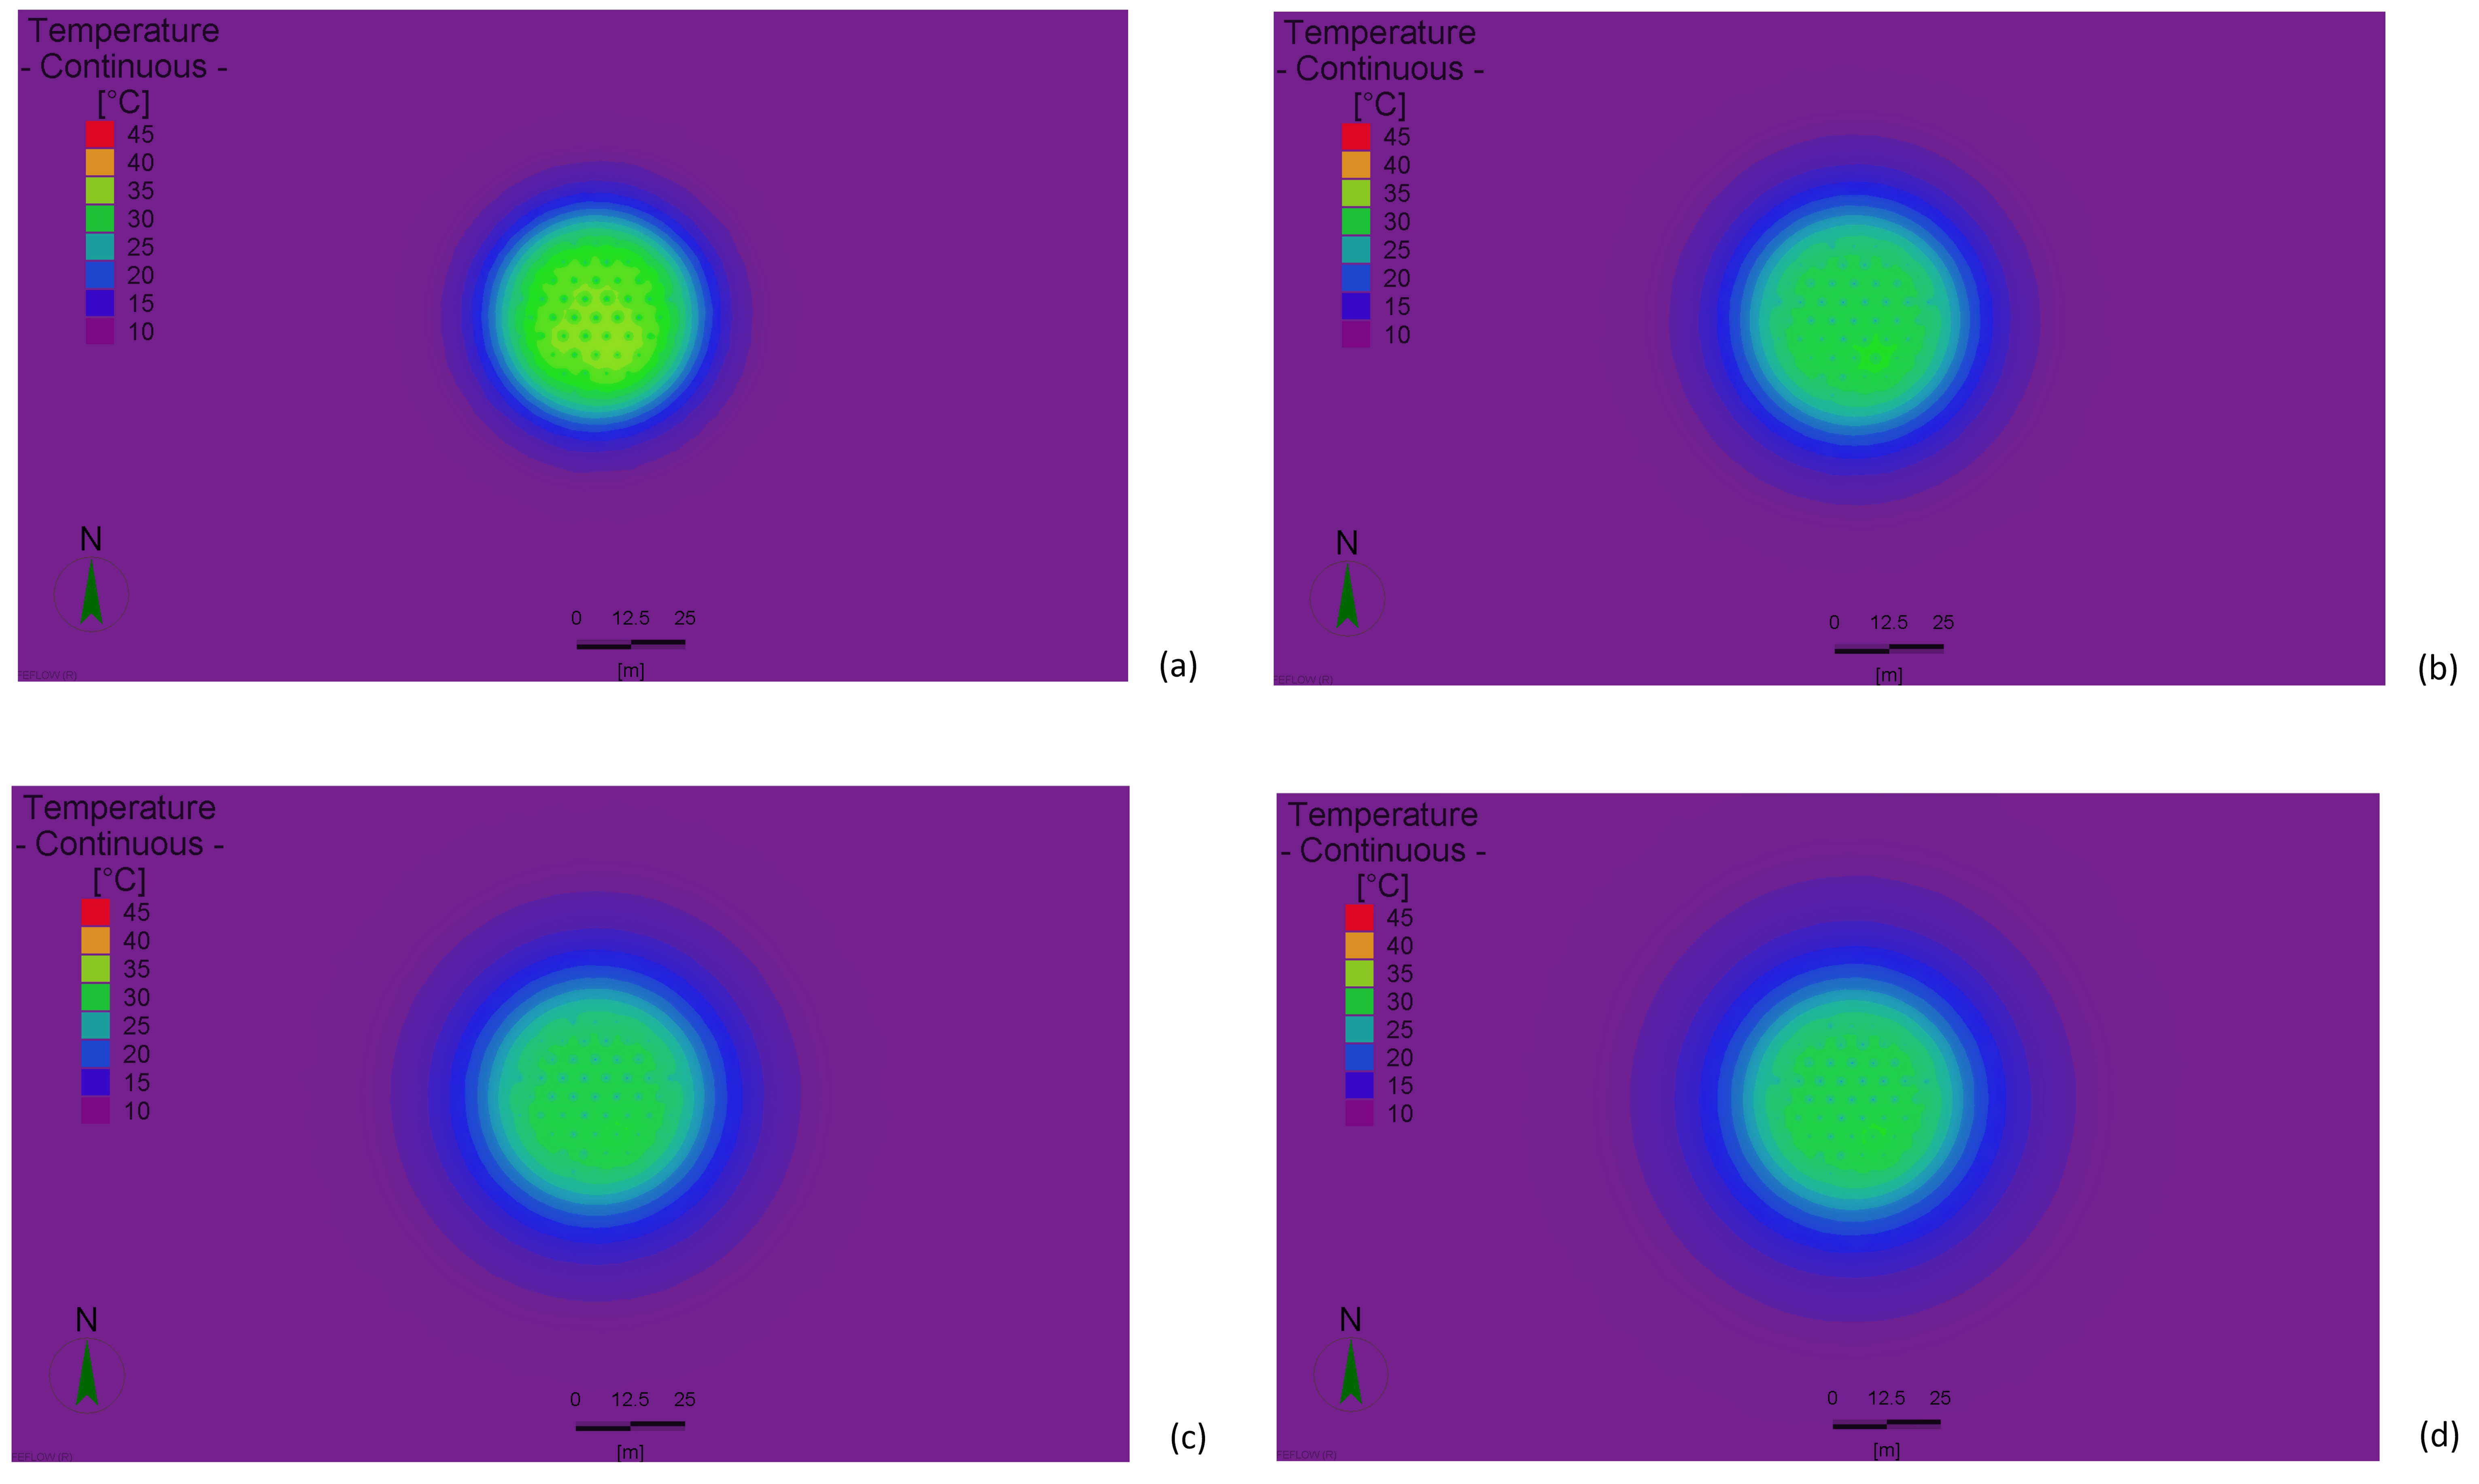
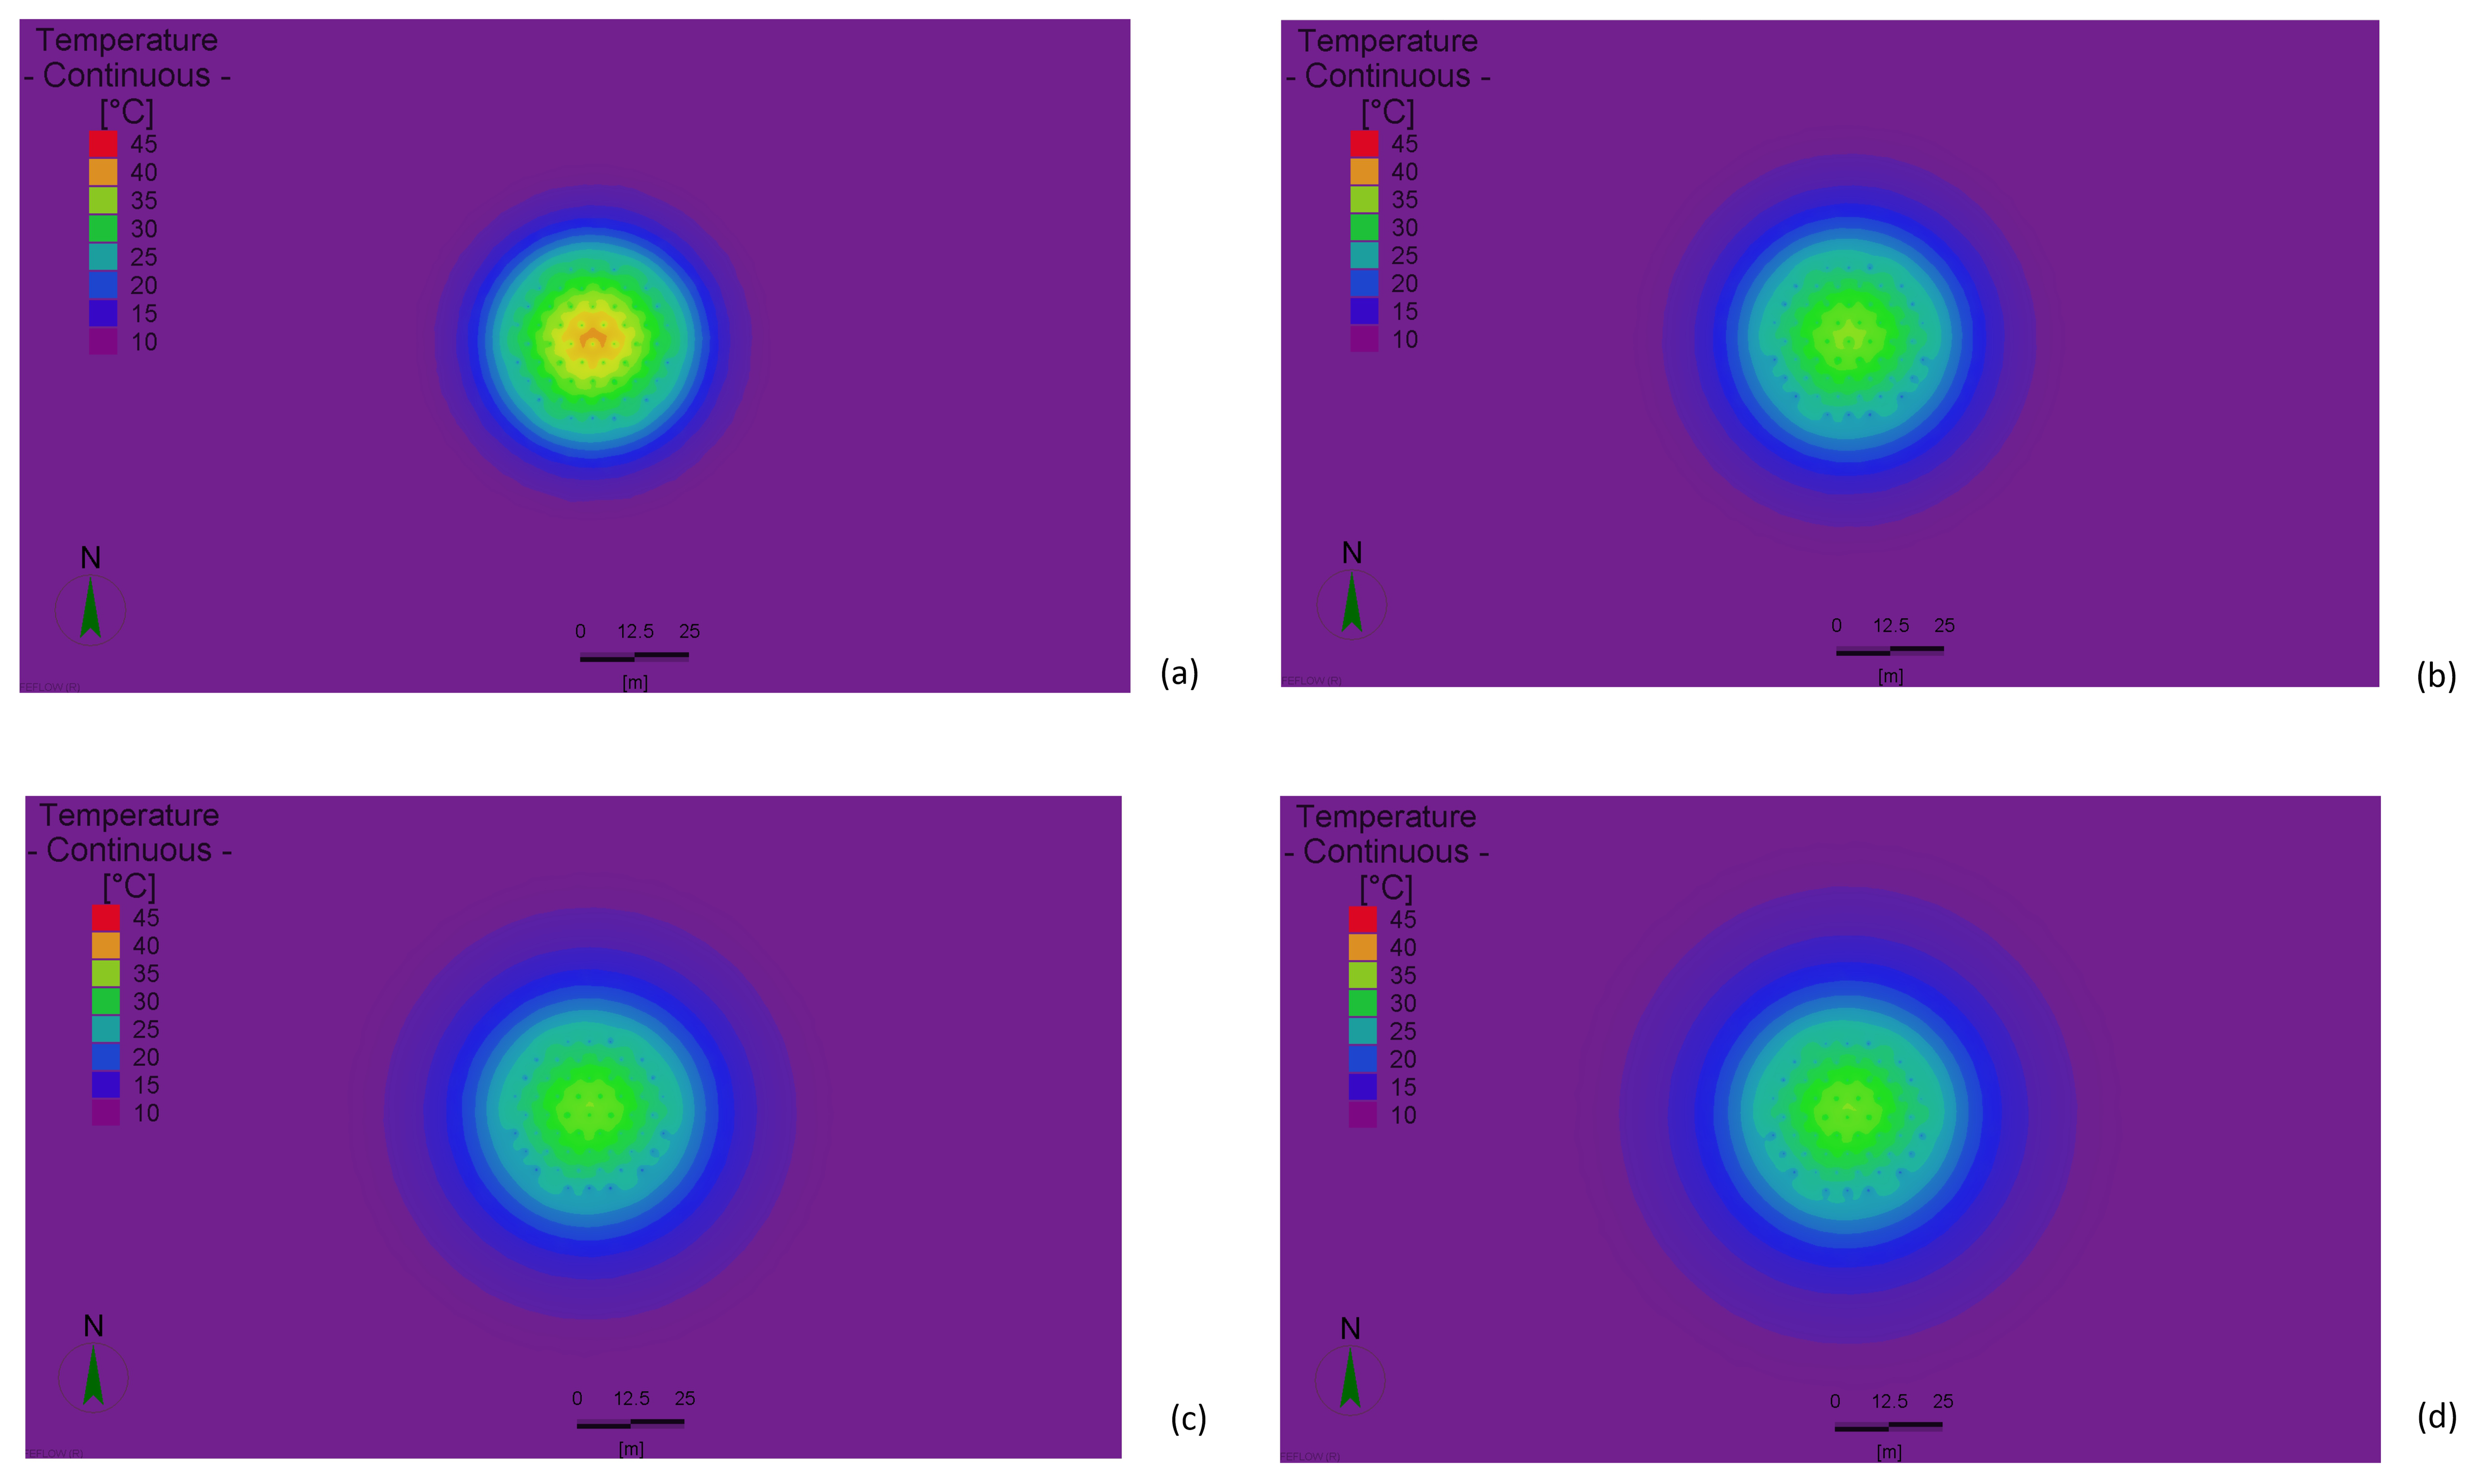
The first simulation of the BTES facility, located in the Carpathian Foredeep region, assumed a constant flow direction of the circulating fluid during charging and discharging. Discharging of the storage was conducted by injecting water at a temperature of 15 °C into BHEs located in the central part of the storage facility. As noted above, heat extraction and injection each lasted 180 days. The simulation time was 3100 days, resulting in nine cycles of discharge and eight cycles of charge to the BTES. The additional discharge cycle was intentionally included to avoid terminating the simulation with a fully charged storage volume and to provide a more representative assessment of the long-term thermal recovery of the system. The temperature changes in the individual BHE arrays during heat extraction from the storage facility are shown in Figure 5. The average outlet temperature of the BTES system was calculated as a BHE-number-weighted average of the outlet temperatures from all nine arrays, accounting for the different number of BHE in each array. The average water temperature obtained during the first year during heat extraction from the BTES was approximately 35 °C, resulting in a temperature gain of approximately 20 °C. From the following year, the outlet temperature gradually decreased; however, from the 4th cycle onward, it remained nearly constant at approximately 29.9 °C (∆T ≈ 15 °C). The simulation progress at selected stages is shown in Figure 6.
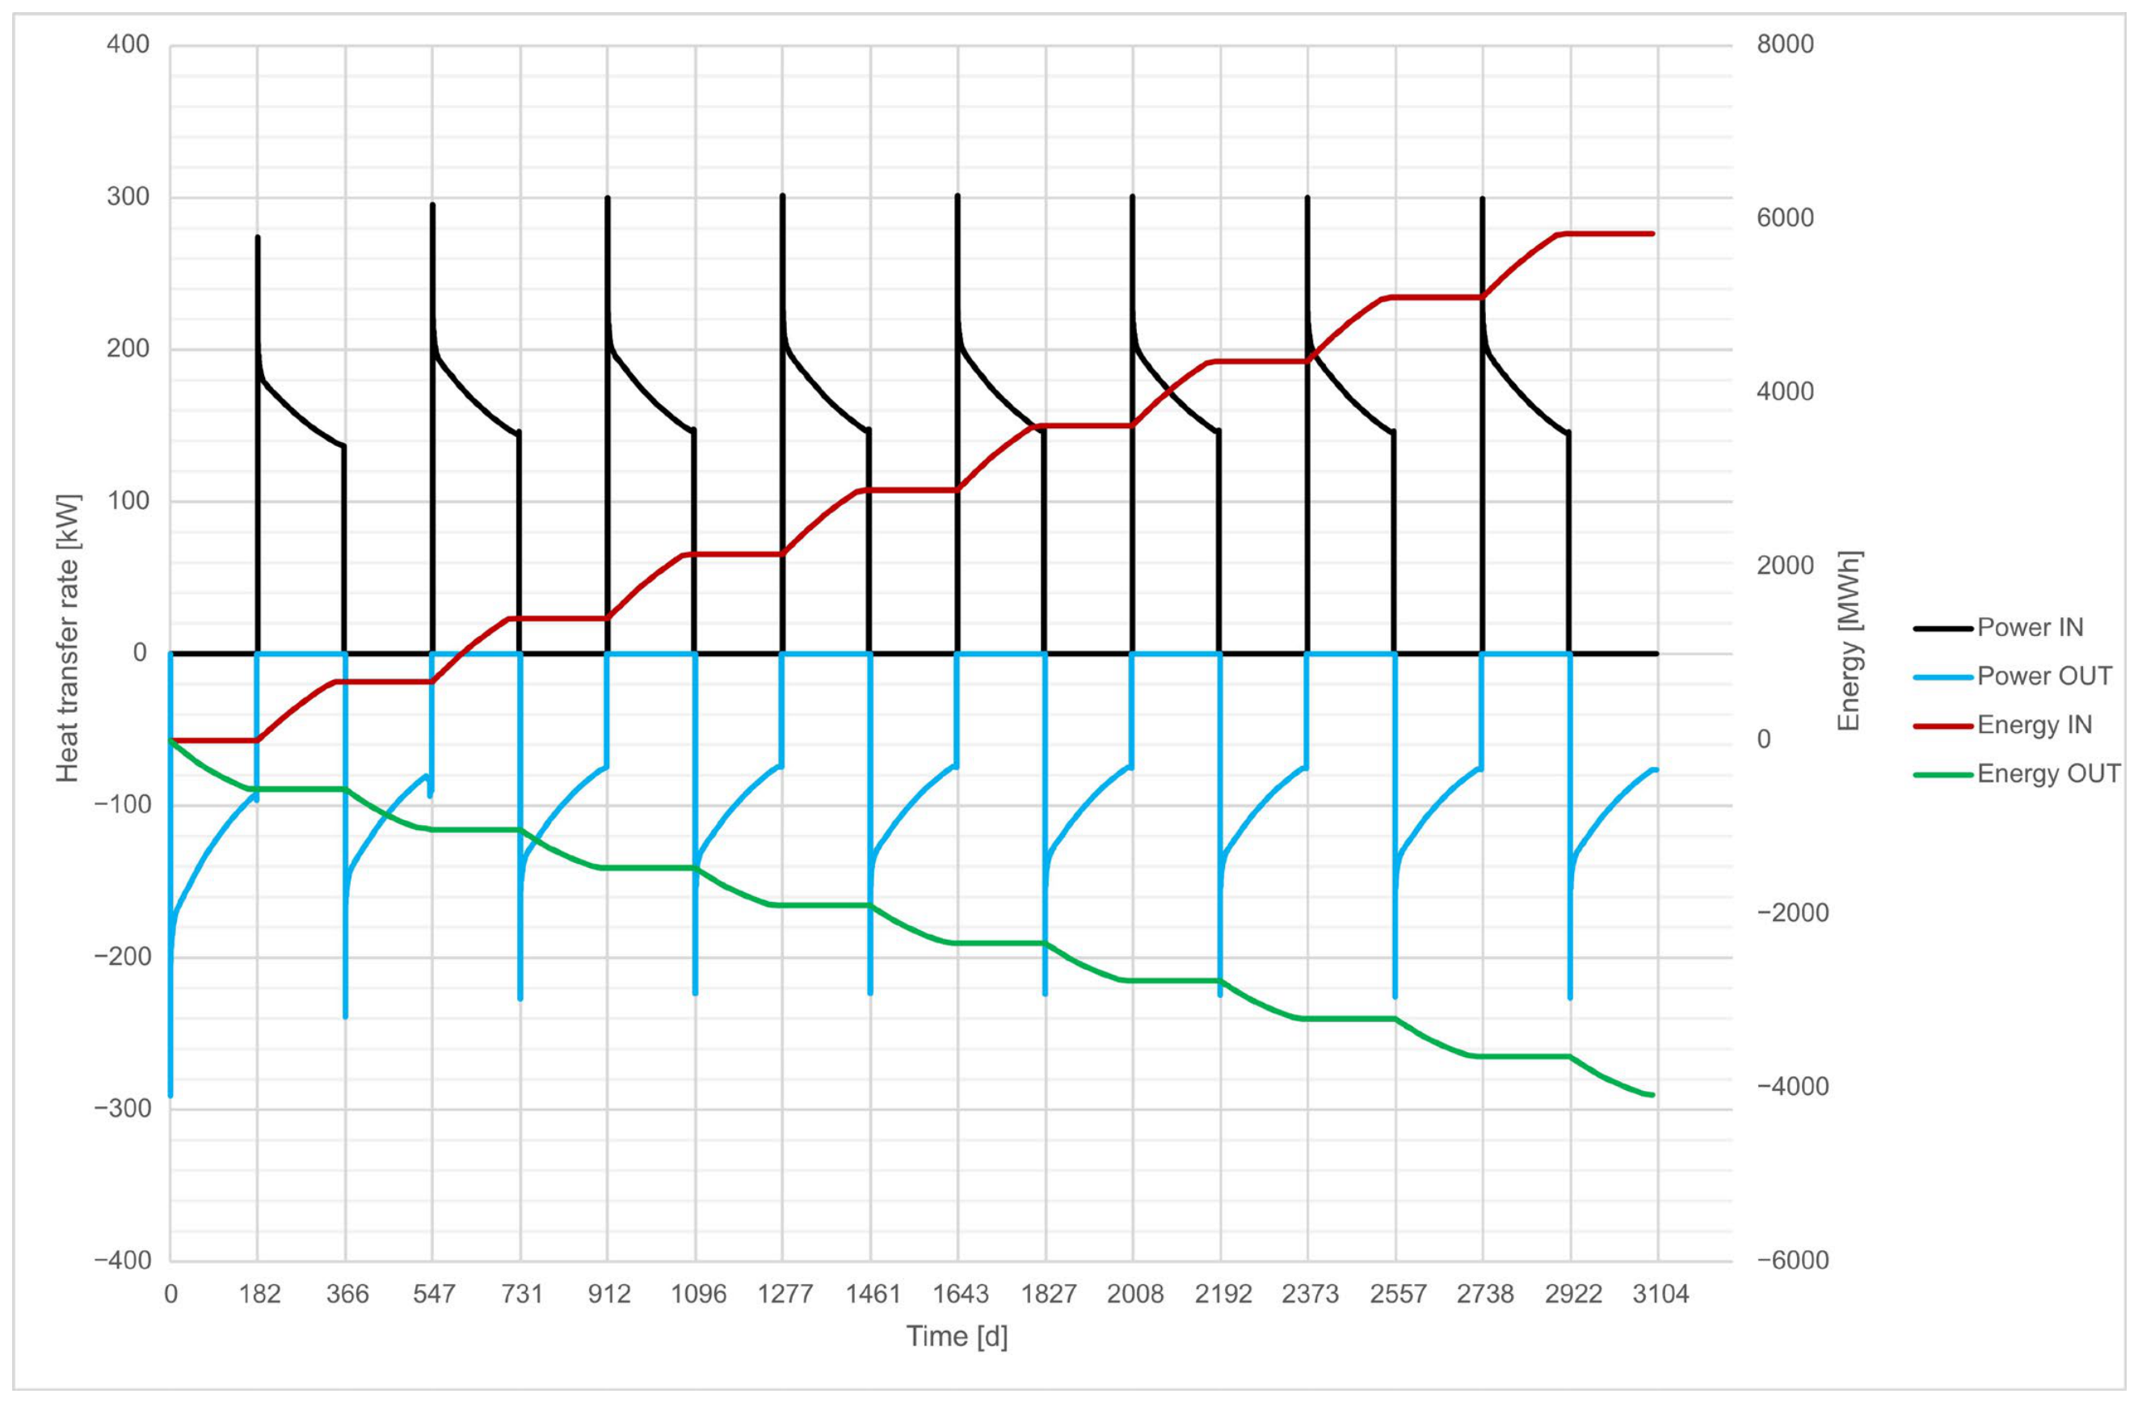
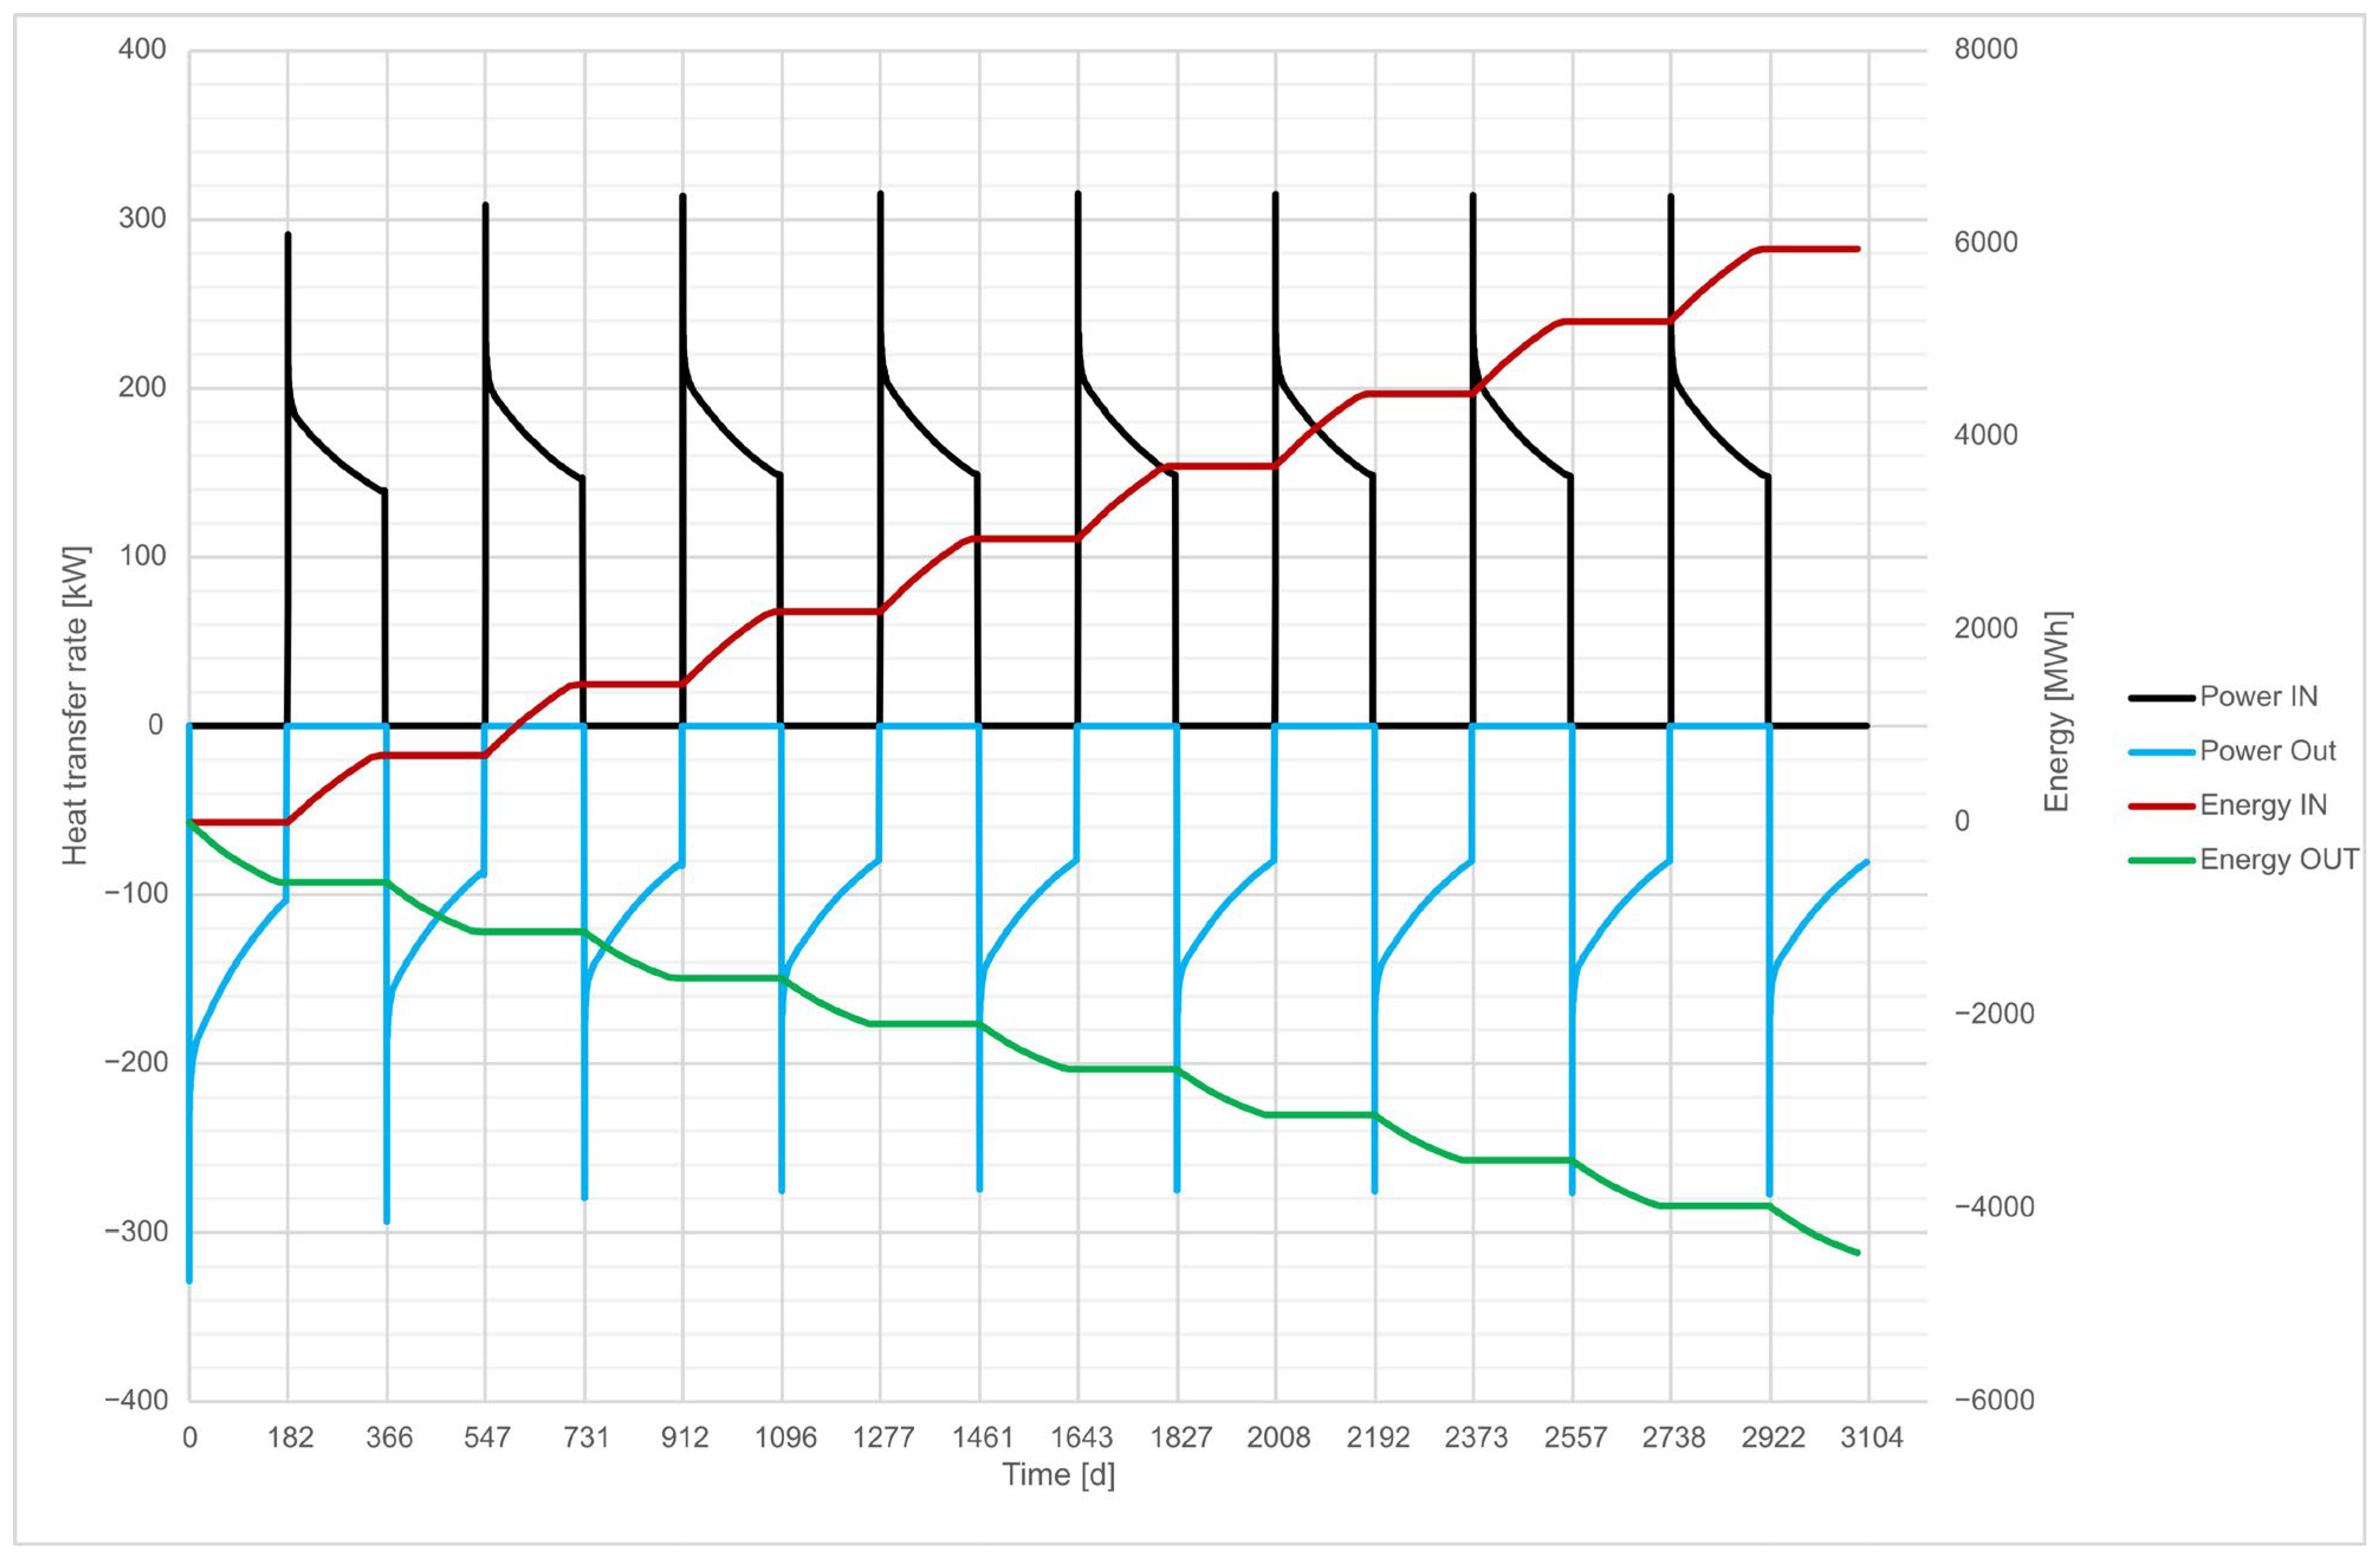
In the first discharging cycle, the highest heat transfer rate during heat extraction was observed, reaching approximately 290 kW (Figure 7). However, it decreased almost immediately to approximately 180 kW. From this point onward, the further decline in the heat transfer rate during heat extraction was much more gradual, reaching approximately 96 kW on the last day of heat recovery. In subsequent cycles, the heat transfer rate during heat extraction gradually decreased, and from approximately the 4th cycle of discharging, the curves became almost identical. An inverse trend was observed for the heat transfer rate during heat injection. During the 1st operating cycle, the heat transfer rate reached its lowest levels, with a maximum value of approximately 270 kW and a minimum of 136 kW recorded on the final day of charging. In the 2nd and 3rd cycles, the heat transfer rate during heat injection gradually increased, stabilizing during the 4th charging cycle at a maximum of approximately 300 kW and a minimum of approximately 147 kW. Beyond this point, the heat transfer rate profiles became repetitive. This behavior was observed from approximately the 4th cycle, corresponding to about six years of operation. During the 3100 days of simulation, 5837 MWh of energy was injected into the storage (red line), and 4079 MWh of energy was extracted (green line). Bearing in mind that during pre-heating 3204 MWh were loaded into it, a total of 9041 MWh of energy was introduced into the storage.

5.3. Scenario II

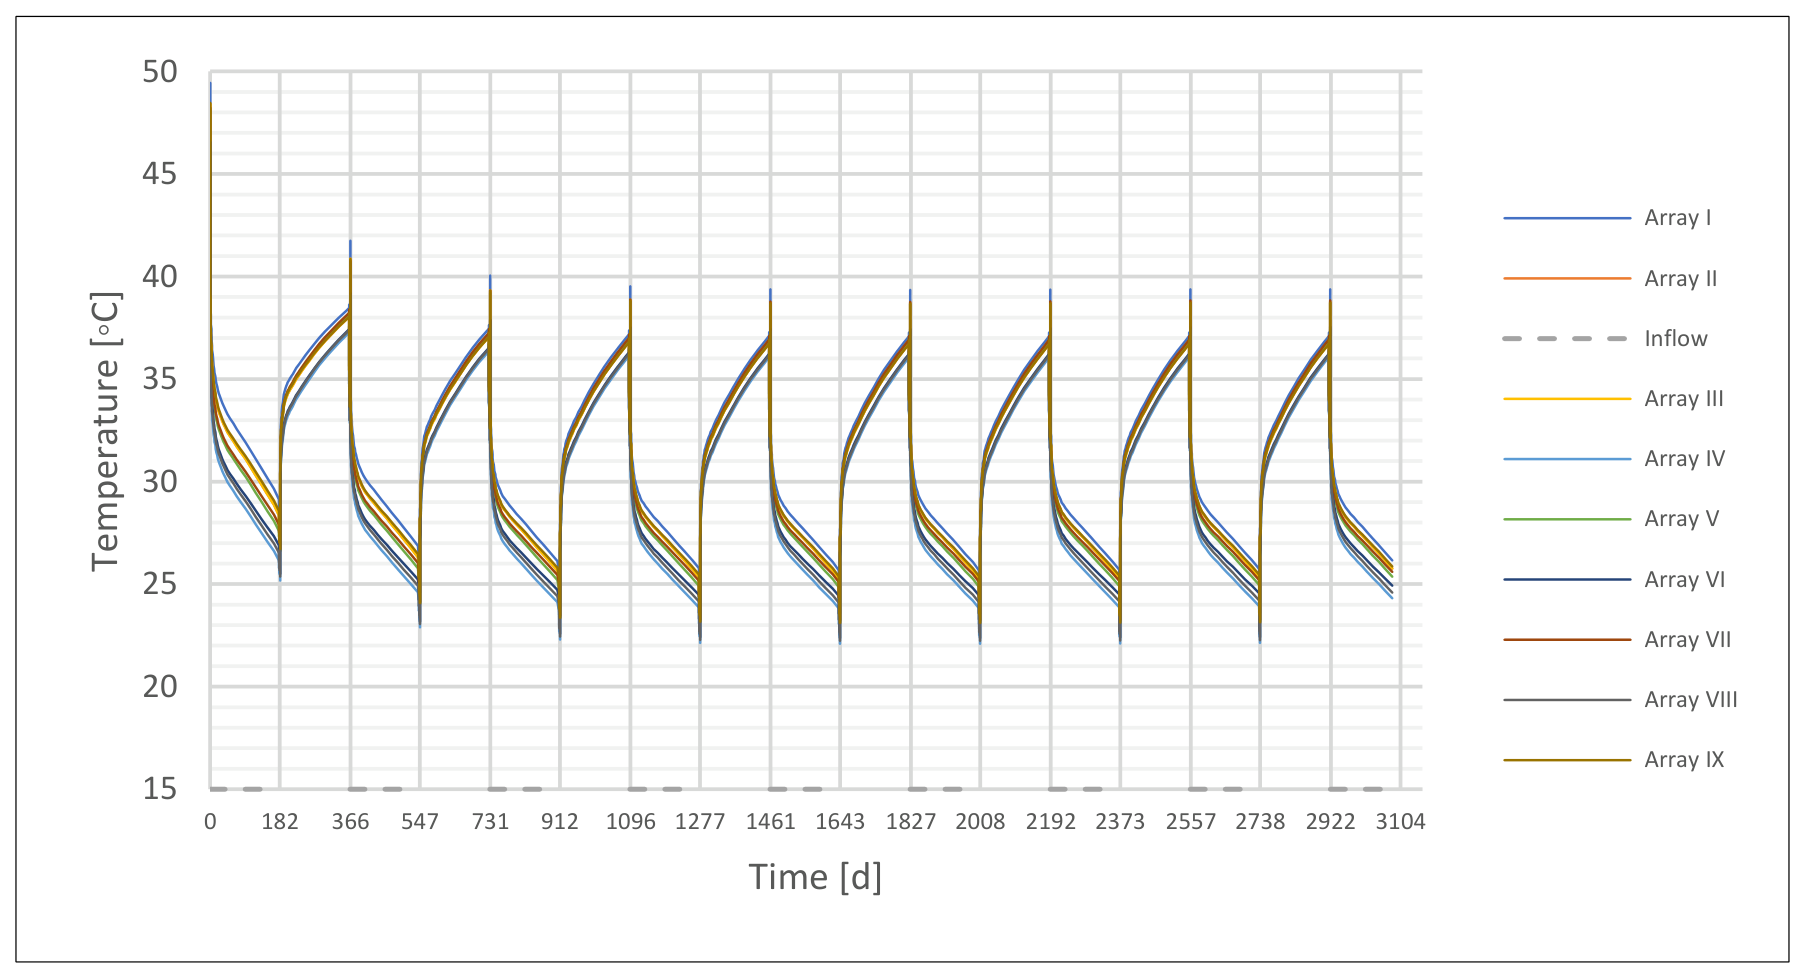
In Scenario II of the BTES operation, all operating conditions and parameters remained unchanged, except for the direction of the working fluid flow through the BHE. During this simulation, heat injection occurred in the same manner as in scenario I, i.e., from BHEs located in the central part of the storage, while heat extraction began from BHEs located in the outer part. The temperature changes in the individual BHE arrays during heat extraction from the storage are shown in Figure 8. The average water temperature obtained during discharge in the first cycle was approximately 38 °C, i.e., ∆T ≈ 23 °C.
As in Scenario I, the outlet water temperature decreased in subsequent cycles, but from the 3rd year onward, the decrease compared to the previous year was only 0.25 °C, and from the 4th cycle onward, it remained nearly constant at approximately 31.9 °C (∆T ≈ 17 °C). The simulation progress at selected stages is shown in Figure 9.
Figure 10 shows the heat transfer rate for all BHEs during all heat injection and extraction cycles from the storage facility after two years of pre-heating. Similarly to Scenario I, the highest recorded heat extraction rate occurs in the 1st discharging cycle, reaching approximately 330 kW. However, it decreases almost immediately to approximately 190 kW. From this point onward, the further decline in the heat transfer rate extracted from the BTES was much more gradual, reaching approximately 100 kW on the last day of discharging. The system reached repeatable operating conditions from approximately the 4th heat extraction cycle onward, when the maximum heat transfer rate during extraction was approximately 275 kW and the minimum was approximately 80 kW. In the 1st injection cycle, the lowest heat transfer rate was supplied to the BTES throughout the entire simulation period, ranging from approximately 140 to 280 kW. In the 2nd and 3rd cycles, the heat transfer rate during heat injection increased, stabilizing in the 4th charging cycle with a maximum value of approximately 315 kW and a minimum of approximately 150 kW. The storage facility reached repeatable operating conditions from approximately the 4th cycle, i.e., after approximately 6 years of operation. During the 3100 days of simulation, 5947 MWh of energy was injected into the storage (red line), and 4454 MWh of energy was extracted (green line). Therefore, a total of 9151 MWh of energy was fed into the storage (Figure 10).

6. Discussion

The observed repeatability of the thermal response indicates that the BTES system approached quasi-steady-state conditions. This was confirmed by the stabilization criterion, as the variation in the average outlet temperature between consecutive cycles remained below 0.2 °C from approximately the 4th cycle onward in both analyzed scenarios (Table 5). After reaching a stable quasi-steady state, the average outlet water temperature during heat extraction from the BTES facility under Scenario I remained at approximately 29.9 °C, corresponding to a temperature difference of approximately 15 °C between the injected and extracted water. Simulating the storage facility under Scenario II achieved a temperature difference of approximately 17 °C, which is 2 degrees higher. The approximately 2 °C higher outlet temperature obtained in Scenario II indicates a potential improvement in the thermal quality of the recovered heat; however, the practical impact of this temperature increase depends on the final heat utilization system and requires further evaluation within an integrated BTES–heat pump or heating system analysis. In Scenario II of the BTES simulation, the heat transfer rate injected into the storage facility was approximately 10 kW higher in each cycle than in Scenario I; however, at the end of each cycle, this difference was relatively small, on the order of 1 kW. Higher heat transfer rate values in Scenario II were also observed during heat extraction from the BTES. At the beginning of the cycle, after the storage facility reached a quasi-steady state, the difference was approximately 50 kW, and on the last day of the cycle, approximately 5 kW. Table 5 summarizes the amount of energy injected and extracted from the storage facility during both simulations. The thermal energy recovery ratio of the 1st discharge cycle was 17.4% in Scenario I and 19.36% in Scenario II. This lower value is related to the large amount of energy injected over 730 days, which was intended to build a heat buffer. The highest thermal energy recovery ratio was obtained during the second discharge cycle, reaching 68.89% in Scenario I and 74.01% in Scenario II. After subsequent operating cycles, the system reached a relatively stable annual-cycle thermal energy recovery ratio of approximately 59% for Scenario I and 63% for Scenario II. The results indicate that extracting heat from the outermost BHEs increases the annual-cycle thermal energy recovery ratio by approximately 4 percentage points compared with Scenario I. This confirms that the investigated configuration provides improved thermal recovery performance under the analyzed operating conditions.
In the 1st version of the BTES simulation, a total of 9041 MWh of energy was injected, and 4079 MWh was collected. In the 2nd scenario, both the injected and extracted energy were higher, at 9152 and 4454 MWh, respectively. Therefore, the difference between injected and extracted thermal energy over the considered simulation period was 4962 MWh in Scenario I and 4698 MWh in Scenario II. Energy difference was calculated as the difference between the total injected and extracted thermal energy over the entire simulation period. This value represents thermal energy not recovered during the simulation period and may include both heat losses and thermal energy remaining stored within the ground domain. Over the entire simulation period, Scenario II resulted in approximately 375 MWh higher extracted thermal energy compared with Scenario I; however, it was also supplied with approximately 111 MWh more injected thermal energy. Although the charging boundary conditions were identical, the total injected energy during cyclic operation was influenced by the thermal response of the storage volume and the resulting operating conditions of the system. The different heat distribution within the storage zone affected the amount of thermal energy that could be transferred during subsequent charging cycles.
The BTES facility that most closely resembles the theoretical system investigated in this article is the one located in Brædstrup, Denmark. The BTES facility in Brædstrup consists of 48 BHEs, each 45 m deep, arranged in a hexagonal configuration with a spacing of 3 m between individual BHEs. The drilling site is composed primarily of glacial clay–mudstone sediments, locally interbedded with fine sand and gravel layers. The groundwater level was measured at a depth of 69 m in a monitoring well located 20 m from the BTES system [9]. The performance and operation of the storage facility have remained consistent with expectations throughout its operational period. The system achieved an overall efficiency of 63% between 2014 and 2016 [10]. Another similar facility is the BTES system located in Anneberg, Sweden. The storage facility consists of 100 BHEs, each 65 m deep, arranged in a cylindrical configuration with a spacing of 3 m between individual BHEs. The drilling site is composed of crystalline rock. The storage efficiency of the BTES system reached 46% [6]. The BTES facility in Luleå, Sweden, contains twice as many BHEs as the theoretical system investigated in this article, with a total of 120 BHEs, each 65 m deep. The BTES system is arranged in a rectangular configuration with a spacing of 4 m between individual BHEs. The drilling site is composed of crystalline rock, and the storage efficiency of this BTES system reached 45–55% [6]. Although the systems described in the literature differ from the theoretical configuration investigated in this study, mainly due to different geological conditions and BHE depths, they provide a useful reference for assessing the plausibility of the obtained results. The storage thermal energy recovery ratio predicted by the developed numerical model is within the range reported for operational BTES systems, which confirms the consistency of the simulation results with experimentally observed performance of existing installations. It should be noted that the thermal energy recovery ratio applied in this study describes the fraction of injected thermal energy recovered during individual operating cycles and is therefore used as an indicator of thermal performance rather than as a direct equivalent of the overall storage efficiency reported for some BTES systems.

7. Conclusions

Energy storage is a critical component for future renewable energy grid performance. The analyses carried out in this work highlighted a few aspects:
The adopted theoretical geological model of the Carpathian Foredeep indicates the potential feasibility of BTES operation under the investigated conditions;
The application of a reversed-flow strategy during the discharge cycle maintains a more favorable temperature gradient within the BTES field, thereby enhancing thermal energy recovery ratio;
The average temperature difference (∆T) obtained from the storage operating with reversed flow through the BHEs during the discharging cycles was approximately 2 °C higher than that achieved in the BTES system where both heat extraction and heat injection were initiated through the BHEs located in the central part of the storage. This difference indicates a potential improvement in the usability of the recovered heat due to the higher outlet temperature; however, its practical significance depends on the requirements of the final heat utilization system;
The simulation results indicate that the reversed-flow operating strategy resulted in a higher thermal energy recovery ratio, with an improvement of approximately 4 percentage points compared with the system using constant circulation of the working fluid from the central part of the storage.
The obtained results should be interpreted considering the limitations of the theoretical numerical model, including the lack of experimental validation and site-specific field measurements.

Author Contributions

Conceptualization, methodology, software, literature review, investigation, writing—original draft preparation, visualization, overall supervision, A.M.; writing—original draft preparation, investigation, visualization, manuscript review, M.M.; manuscript review, B.F.; manuscript review, R.M.; manuscript review, T.K. All authors have read and agreed to the published version of the manuscript.

Funding

The study was financed based on the statutory work entitled “Geological Modeling and Prognostic Analysis of a BTES-Type Thermal Energy Storage System in the Carpathian Foredeep Region—the work of the Oil and Gas Institute, National Research Institute (OGI-NRI)”, commissioned by the Ministry of Science and Higher Education; order number: 0034/KP/2026.

Data Availability Statement

The data presented in this study are available on request from the corresponding author. The data are not publicly available due to the large volume of simulation data.

Conflicts of Interest

The authors declare no conflicts of interest.

References

  1. European Commission. 2050 Long-Term Strategy. Available online: https://climate.ec.europa.eu/eu-action/climate-strategies-targets/2050-long-term-strategy_en (accessed on 20 June 2026).
  2. Ürge-Vorsatz, D.; Harvey, L.D.D.; Mirasgedis, S.; Levine, M.D. Mitigating CO2 emissions from energy use in the world’s buildings. Build. Res. Inf. 2007, 35, 379–398. [Google Scholar] [CrossRef] [Scilit]
  3. Kamal-Chaoui, L.; Robert, A. Competitive Cities and Climate Change. In OECD Regional Development Working Papers; OECD Publishing: Paris, France, 2009. [Google Scholar]
  4. Penttinen, P.; Vimpari, J.; Junnila, S. Optimal Seasonal Heat Storage in a District Heating System with Waste Incineration. Energies 2021, 14, 3522. [Google Scholar] [CrossRef] [Scilit]
  5. Cruickshank, C.A.; Baldwin, C. Sensible Thermal Energy Storage. In Storing Energy, 2nd ed.; Letcher, T.M., Ed.; Elsevier: Amsterdam, The Netherlands, 2022; pp. 419–441. [Google Scholar] [CrossRef] [Scilit]
  6. Kallesøe, A.J.; Vangkilde-Pedersen, T. Underground Thermal Energy Storage (UTES)—State-of-the-Art, Example Cases and Lessons Learned. In HEATSTORE Project Report; International Geothermal Association: The Hague, The Netherlands, 2019. [Google Scholar]
  7. Rapantova, N.; Pospisil, P.; Koziorek, J.; Vojcinak, P.; Grycz, D.; Rozehnal, Z. Optimisation of Experimental Operation of Borehole Thermal Energy Storage. Appl. Energy 2016, 181, 464–476. [Google Scholar] [CrossRef] [Scilit]
  8. Malmberg, M. Transient Modeling of a High Temperature Borehole Thermal Energy Storage Coupled with a Combined Heat and Power Plant. Master’s Thesis, KTH Royal Institute of Technology, Stockholm, Sweden, 2017. [Google Scholar]
  9. Tordrup, K.W.; Poulsen, S.E.; Bjørn, H. An Improved Method for Upscaling Borehole Thermal Energy Storage Using Inverse Finite Element Modelling. Renew. Energy 2017, 105, 13–21. [Google Scholar] [CrossRef] [Scilit]
  10. Schmidt, T.; Sørensen, P.A. Monitoring Results from Large Scale Heat Storages for District Heating in Denmark. In Proceedings of the 14th International Conference on Energy Storage, Adana, Turkey, 25–28 April 2018. [Google Scholar]
  11. Peltola, S.S.; Lund, P.D.; Routti, J.T. First Year Operating Experience from Kerava Solar Village. Int. J. Ambient Energy 1985, 6, 117–122. [Google Scholar] [CrossRef] [Scilit]
  12. Baudoin, A. Stockage Intersaisonnier de Chaleur Dans Le Sol Par Batterie D’Échangeurs Baionnette Verticaux; Modèle de Prédimensionnement. Ph.D. Thesis, Université de Reims Champagne-Ardenne, Reims, France, 1988. [Google Scholar]
  13. Wijsman, A.J.T.M.; Havinga, J. The groningen project: 96 solar houses with seasonal heat storage in the soil. In Intersol Eighty Five; Bilgen, E., Hollands, K.G.T., Eds.; Pergamon: Oxford, UK, 1986; pp. 818–824. [Google Scholar] [CrossRef] [Scilit]
  14. Sibbitt, B.; McClenahan, D.; Djebbar, R.; Thornton, J.; Wong, B.; Carriere, J.; Kokko, J. The Performance of a High Solar Fraction Seasonal Storage District Heating System—Five Years of Operation. Energy Procedia 2012, 30, 856–865. [Google Scholar] [CrossRef] [Scilit]
  15. Reuss, M. The Use of Borehole Thermal Energy Storage (BTES) Systems. In Advances in Thermal Energy Storage Systems; Cabeza, L.F., Ed.; Elsevier: Amsterdam, The Netherlands, 2015; pp. 117–147. [Google Scholar] [CrossRef] [Scilit]
  16. Reuss, M.; Beuth, C.; Schmidt, M.; Schoelkopf, W. Solar District Heating with Seasonal Storage in Attenkirchen. In Proceedings of the 10th International Conference on Thermal Energy Storage (ECOSTOCK 2006), Pomona, NJ, USA, 31 May–2 June 2006. [Google Scholar]
  17. Bauer, D.; Marx, R.; Nußbicker-Lux, J.; Ochs, F.; Heidemann, W.; Müller-Steinhagen, H. German Central Solar Heating Plants with Seasonal Heat Storage. Sol. Energy 2010, 84, 612–623. [Google Scholar] [CrossRef] [Scilit]
  18. Gehlin, S. Borehole Thermal Energy Storage. In Advances in Ground-Source Heat Pump Systems; Rees, S., Ed.; Woodhead Publishing: Cambridge, UK, 2016; pp. 295–327. [Google Scholar] [CrossRef] [Scilit]
  19. Kvalsvik, K.H.; Ramstad, R.K.; Holmberg, H.; Kocbach, J. Measurements and Simulations of High Temperature Borehole Thermal Energy Storage in Drammen, Norway—Evaluation of Thermal Losses and Thermal Barrier. Geothermics 2025, 125, 103192. [Google Scholar] [CrossRef] [Scilit]
  20. Żeruń, M. Ocena Możliwości Lokalizowania Magazynów Energii Cieplnej w Górotworze Za Pomocą Systemów Zamkniętych (BTES, PTES i TTES, EF); PIG-PIB: Warsaw, Poland, 2024.
  21. Olsson, S. The Sunclay and Kullavik Projects—Heat Storage in Clay at Low and High Temperature. In First E.C. Conference on Solar Heating; Den Ouden, C., Ed.; Springer: Dordrecht, The Netherlands, 1984; pp. 894–898. [Google Scholar]
  22. Lundh, M.; Dalenbäck, J.-O. Swedish Solar Heated Residential Area with Seasonal Storage in Rock: Initial Evaluation. Renew. Energy 2008, 33, 703–711. [Google Scholar] [CrossRef] [Scilit]
  23. Nordell, B. Borehole Heat Store Design Optimization. Ph.D. Thesis, Luleå University of Technology, Luleå, Sweden, 1994. [Google Scholar]
  24. Fisch, M.N.; Guigas, M.; Dalenbäck, J.O. A review of large-scale solar heating systems in Europe. Sol. Energy 1998, 63, 355–366. [Google Scholar] [CrossRef] [Scilit]
  25. Dalenback, J.O.; Hellstrom, G.; Lundin, S.; Nordell, B.; Dahm, J. Borehole Heat Storage for the Anneberg Solar Heated Residential District in Danderyd, Sweden. In Proceedings of the 8th International Conference on Thermal Energy Storage Terrastock 2000, Stuttgart, Germany, 28 August–1 September 2000. [Google Scholar]
  26. Nordell, B.; Andersson, O.; Rydell, L.; Scorpo, A.L. Long-Term Performance of the HTBTES in Emmaboda, Sweden. In Proceedings of the 13th International Conference on Energy Storage Greenstock 2015, Beijing, China, 19–21 May 2015. [Google Scholar]
  27. Matthey, B. Accumulateur Saisonnier de Chaleur Solaire de 20000 m3 Par Sondes Verticales Sous Un Batiment Industriel a Meyrin-Geneve. In Proceedings of the 4th International Conference on Energy Storage for Heating and Cooling of Buildings JIGASTOCK 88, Versailles, France, 18–21 October 1988. [Google Scholar]
  28. Weber, R.; Baldini, L. High Temperature Seasonal BTES for Effective Load Shifting and CO2 Emission Reduction. In Proceedings of the 12th International Conference on Solar Energy for Buildings and Industry EuroSun 2018, Rapperswil, Switzerland, 10–13 September 2018. [Google Scholar] [CrossRef] [Scilit]
  29. Fiorentini, M.; Baldini, L. Control-Oriented Modelling and Operational Optimization of a Borehole Thermal Energy Storage. Appl. Therm. Eng. 2021, 199, 117518. [Google Scholar] [CrossRef] [Scilit]
  30. Skarphagen, H.; Banks, D.; Frengstad, B.S.; Gether, H. Design Considerations for Borehole Thermal Energy Storage (BTES): A Review with Emphasis on Convective Heat Transfer. Geofluids 2019, 2019, 4961781. [Google Scholar] [CrossRef] [Scilit]
  31. Mitali, J.; Dhinakaran, S.; Mohamad, A.A. Energy Storage Systems: A Review. Energy Storage Sav. 2022, 1, 166–216. [Google Scholar] [CrossRef] [Scilit]
  32. Lee, K.S. Cavern Thermal Energy Storage Systems. In Underground Thermal Energy Storage; Green Energy and Technology; Springer: London, UK, 2013; pp. 125–129. [Google Scholar]
  33. Catolico, N.; Ge, S.; McCartney, J.S. Numerical Modeling of a Soil-Borehole Thermal Energy Storage System. Vadose Zone J. 2016, 15, 1–17. [Google Scholar] [CrossRef] [Scilit]
  34. Boockmeyer, A. Numerical Simulation of Borehole Thermal Energy Storage in the Geological Subsurface. Ph.D. Thesis, Faculty of Mathematics and Natural Sciences, Christian Albrechts University, Kiel, Germany, 2020. [Google Scholar]
  35. Lanahan, M.; Tabares-Velasco, P. Seasonal Thermal-Energy Storage: A Critical Review on BTES Systems, Modeling, and System Design for Higher System Efficiency. Energies 2017, 10, 743. [Google Scholar] [CrossRef] [Scilit]
  36. Chicco, J.; Mandrone, G. Modelling the Energy Production of a Borehole Thermal Energy Storage (BTES) System. Energies 2022, 15, 9587. [Google Scholar] [CrossRef] [Scilit]
  37. Zimnal, Z.; Mrozek, T.; Wójcik, A. Mapa Geologiczna Polski A-Mapa Utworów Powierzchniowych, Arkusz Rzeszów (M-34-XVII) w Skali 1:200 000; Państwowy Instytut Geologiczny—Państwowy Instytut Badawczy: Warszawa, Poland, 2011.
  38. Zimnal, Z.; Malata, T. Objaśnienia do Szczegółowej Mapy Geologicznej Polski 1:50 000, Arkusz Rzeszów (982); Państwowy Instytut Geologiczny—Państwowy Instytut Badawczy: Warszawa, Poland, 2014.
  39. Oszczypko, N.; Ślączka, A.; Żytko, K. Regionalizacja Tektoniczna Polski (2008) Karpaty Zewnętrzne i Zapadlisko Przedkarpackie. Przegląd Geol. 2008, 56, 10. [Google Scholar]
  40. Krawczyk, J.; Chowaniec, J. Objaśnienia do Mapy Hydrogeologicznej Polski w Skali 1:50 000, Arkusz Rzeszów (982); Państwowy Instytut Geologiczny—Państwowy Instytut Badawczy: Warszawa, Poland, 2002.
  41. Carslaw, H.S.; Jaeger, C. Conduction of Heat in Solids; Clarendon: Oxford, UK, 1959. [Google Scholar]
  42. DHI-WASY. Feflow White Papers Vol. IV; DHI-WASY GmbH: Berlin, Germany, 2006; Available online: https://download.dhigroup.com/open?guid=58a025f3-2c1c-ef11-840a-000d3a262157&redirtxt=Cotinue%20to%20file%20download (accessed on 10 June 2026).
  43. Lanini, S.; Delaleux, F.; Py, X.; Olivès, R.; Nguyen, D. Improvement of Borehole Thermal Energy Storage Design Based on Experimental and Modelling Results. Energy Build. 2014, 77, 393–400. [Google Scholar] [CrossRef] [Scilit]
Figure 1. Schematic diagram of the borehole heat storage structure. (a) Borehole Heat Exchanger; (b) cylindrical BTES with BHE arrays.
Energies 19 03892 g001
Figure 2. Simplified geological cross-section through the Rzeszów area (after: [37]).
Energies 19 03892 g002
Figure 3. Horizontal section showing the BHEs as red points and the nine arrays (I–IX) as orange lines.
Energies 19 03892 g003
Figure 4. Changes in heat transfer rate (black line) and energy (red line) during pre-heating.
Energies 19 03892 g004
Figure 5. Changes in the temperature of water leaving the individual BHE arrays during heat extraction in Scenario I.
Energies 19 03892 g005
Figure 6. Horizontal view of the individual stages of the simulation in scenario I: (a) day 180 (end of I discharge); (b) day 910 (end of III discharge); (c) day 1640 (end of V discharge); (d) day 2735 (end of VIII discharge).
Energies 19 03892 g006
Figure 7. Changes in heat transfer rate (black and blue lines) and energy (red and green lines) during Scenario I. Positive values indicate heat injection into the BTES system, while negative values represent heat extraction from the storage during the discharging cycles.
Energies 19 03892 g007
Figure 8. Changes in the temperature of water leaving the individual BHE arrays during heat extraction in Scenario II.
Energies 19 03892 g008
Figure 9. Horizontal view of the individual stages of the simulation in scenario II: (a) day 180 (end of I discharge); (b) day 910 (end of III discharge); (c) day 1640 (end of V discharge); (d) day 2735 (end of VIII discharge).
Energies 19 03892 g009
Figure 10. Changes in heat transfer rate (black and blue lines) and energy (red and green lines) during Scenario II. Positive values indicate heat injection into the BTES system, while negative values represent heat extraction from the storage during the discharging cycles.
Energies 19 03892 g010
Table 1. Review of identified and described BTES systems.
CountryLocationStarting YearEnergy Source *Storage Volume
[1000 m3]
No. of BHEsBorehole Depth [m]Storage Temp.
[°C]
Soil TypeRef.
BelgiumMol2002WH1614430max. 82Sand saturated[6]
Czech
Republic
Paskov2012CCHPn/a166069–79Clay/Miocene rocks [6][7]
DenmarkBraedstrup2012SC + CCHP + EHEP + EB19484512–50Clay [8][9,10]
FinlandKerava 1983SC + EHP + EB5.4542540–50Soil and bedrock [6][11]
FranceCormontreuil1986n/an/a242530–60n/a[12]
NetherlandsGroningen1984SC + UN2320 [6]20 [6]max. 50 [6]Sand, clayey [6][13]
CanadaDLSC (Okotoks)2007SC + GB33.61443539–70 [8]Soil [8] [14]
GermanyNeckarsulm1999SC + EHP + GB63.45283045–65 [8]Clay [8][15]
Attenkirche2002SC + EHP9.39030n/an/a[16]
Crailsheim2007SC + EHP37.5805520–65 [8]Mudstone, limestone [6][17]
ItalyTreviglio1985SC + UN4341411n/an/a[18]
NorwayDrammen2020SC + HPn/a10050–5530–45n/a[19]
PolandSulejówek2020WH1501069920–40Clay, silt, sand, gravel[20]
Lidzbark Warmiński2022AHX + PVT64030099.95–15Clay, silt[20]
SwedenKungsbacka1980SC + EHP856123515–30n/a[21]
Södertuna1982SC + UN105n/an/an/an/a[22]
Luleå1983WH + HP1201206530–65 [8]Crystalline rock [6][23]
Kullavik1983SC + OB + EHP8.12861210–50n/a[21]
Grosvad1985SC + EHP-12611010–35n/a[18]
Söderköping1987SC + EHP-3821810–31n/a[18]
Lidköpingn/aSC + UN15n/an/an/an/a[24]
Anneberg2002SC + EB601006520–60Crystalline rock [6][25]
Emmaboda2010WH + HP280.814015015–45Crystalline rock [6][26]
SwitzerlandMeyrin1988SC + EHP-2581510–32n/a[27]
Dübendorf2012GB + HPn/a14410040–50n/a[28,29]
Wollerau1988HP + GB4036120n/an/a[6]
Root Lucerne2003LTN-HP36049160n/aSandstone[6]
Suurstoffi2012BCn/a220150n/an/a[6]
Oberfeld2012PVTn/a40125n/an/a[6]
Blatten Belalp2014SCn/a31120n/an/a[6]
* Abbreviations in Table 1: HP—Heat Pump; SC—Solar Collector; EB—Electrical Boiler; EHP—Electricity-Driven Heat Pump; WH—Waste Heat; GB—Gas Boiler; OB—Oil Boiler; CCHP—Combined Cooling, Heating and Power; BC—Building Cooling; PVT—Photovoltaic-Thermal Collector; AHX—Air Heat Exchanger; UN—Unknown or not mentioned in the literature; LTN-HP—Low Temperature Network Heat Pump; n/a—not available.
Table 2. Hydraulic and thermal parameters of rocks.
ParameterShaleClay shale
Hydraulic conductivity (Kxx, Kyy) [m/d] 8.64 × 10−58.64 × 10−6
Hydraulic conductivity (Kzz) [m/d]8.64 × 10−68.64 × 10−7
Porosity [–]0.040.03
Volumetric heat capacity of solid [MJ/m3/K]2.22.3
Thermal conductivity of solid [W/(mK)]2.22.0
Table 3. Comparison of FEFLOW results with the analytical Infinite Line Source solution.
r [m]TILS [°C]TFeflow [°C]∆T
0.7411.6411.810.17
1.5311.1511.210.06
2.0110.9710.990.02
5.3010.3810.34−0.04
10.6510.0910.05−0.04
Table 4. Details of the borehole system.
Borehole
Effective depth85 m
Diameter120 mm
Filling materialGrout (thermal conductivity 1 W/(mK)
BHE
TypeSingle U-tube
Pipe outer diameter32 mm
Pipe inner diameter26.2 mm
Thermal conductivity 0.42 W/(mK)
Circulating Fluid
TypeWater
Thermal conductivity0.6 W/(mK)
Heat capacity4.18 MJ/m3/K
Dynamic viscosity1 × 10−3 kg/m/s
Density998 kg/m3
Table 5. Summarized energy injected and extracted from BTES.
Cycle of Operation Scenario I Scenario II
Energy Injected [MWh]Energy Extracted (Absolute Value) [MWh]Average Outlet Temperature [°C]Thermal Energy Recovery Ratio
[%]
Energy Injected [MWh]Energy Extracted
(Absolute Value) [MWh]
Average Outlet Temperature [°C]Thermal Energy Recovery Ratio
[%]
Pre-heating3204 3204
167955735.117.40 *69362037.919.36 *
272646829.568.8973851333.274.01
373944030.160.6575247232.164.00
474143329.958.6375548231.964.16
574143329.958.3575547131.862.41
673943429.958.6075347231.862.50
773743629.959.0175247331.862.79
873543830.059.4475047531.963.13
9 44030.059.86 47632.063.47
Total energy injected [MWh]Total energy extracted [MWh] Energy difference [MWh]Total energy injected [MWh]Total energy extracted [MWh] Energy difference [MWh]
9 0414 079 4 9629 1524 454 4 698
* The lower recovery ratio in the first cycle results from the large initial energy input used to establish the thermal buffer before regular cyclic operation.
Disclaimer/Publisher’s Note: The statements, opinions and data contained in all publications are solely those of the individual author(s) and contributor(s) and not of MDPI and/or the editor(s). MDPI and/or the editor(s) disclaim responsibility for any injury to people or property resulting from any ideas, methods, instructions or products referred to in the content.