Article

Patent Entropy and Spatial Governance: Innovation Dynamics and Institutional Legacy of Clean Energy in China’s Northeastern Old Industrial Base

1
Scientific Research Department, Jilin University of Architecture and Technology, Changchun 130114, China
2
School of Energy and Environmental Engineering, Jilin University of Architecture and Technology, Changchun 130114, China
3
School of Management Engineering, Jilin University of Architecture and Technology, Changchun 130114, China
4
School of Intelligent Construction, Jilin University of Architecture and Technology, Changchun 130114, China
5
School of Architecture and Urban Planning, Jilin Jianzhu University, Changchun 130118, China
6
Jilin Weiren Technology Co., Ltd., Changchun 130012, China
*
Author to whom correspondence should be addressed.
Energies 2026, 19(17), 4178; https://doi.org/10.3390/en19174178
Submission received: 21 July 2026 / Revised: 27 August 2026 / Accepted: 31 August 2026 / Published: 3 September 2026
(This article belongs to the Special Issue Economic and Political Determinants of Energy: 3rd Edition)

Abstract

The transition to clean energy in China’s traditional industrial regions requires technological substitution and fundamentally restructures the relationship among the state, the market, and enterprises. This study examines the influence of industrial legacy and governance structures on clean energy innovation in Northeast China, with a primary focus on Jilin and comparative analyses of Liaoning and Heilongjiang. Using patent data from 2000 to 2025, we employ Shannon entropy, location quotients and logistic modeling to analyze innovation dynamics across temporal, structural, spatial and institutional dimensions. Our analysis reveals three governance regimes reflecting different industrial legacies and identifies a significant mismatch between resources and innovation: resource-rich cities generate a low number of patents relative to their resources. A high invalidation rate suggests maintenance deficits in publicly funded innovation. These patterns imply that governance arrangements may contribute to the structural weaknesses observed in regional innovation systems. We propose a differentiated strategic framework adapted to the industrial legacy of each province, suggesting that old industrial bases require reforms addressing both resource endowment and institutional capacity. Our findings have implications for regional innovation governance in resource-dependent economies undergoing energy transition.

1. Introduction

1.1. Research Background and Motivation

The world economy remains fundamentally dependent on fossil fuels, with coal, oil and natural gas accounting for 81% of the global demand for primary energy [1]. The energy price shocks that have occurred in a cascading manner since 2020, exacerbated by geopolitical conflicts and supply chain disruptions, have exposed the vulnerability of import-dependent economies and reignited policy debates around energy self-sufficiency and technological sovereignty [2]. As Europe accelerates its green transition to reduce its reliance on Russian resources and as China addresses strategic competition over access to critical minerals and technology, the political economy of energy innovation has become a key part of national development strategy [3].
The political economy of energy transitions—encompassing the distributional conflicts, institutional barriers, and power asymmetries that shape clean energy outcomes—has emerged as a critical analytical lens. This perspective moves beyond technical and economic efficiency to examine how political structures, interest coalitions, and governance arrangements determine whose interests are served by energy system change [4].
In this context, clean energy patents serve as more than just indicators of technical progress; they are also strategic assets in geopolitical competition. According to the International Energy Agency (IEA), global clean energy investment reached USD 2.2 trillion in 2025, with around USD 770 billion concentrated in patent-intensive sectors such as photovoltaics, energy storage, and hydrogen. Empirical evidence suggests that patent thickets and standard essential patents in clean energy tend to be concentrated among early innovators, generating cumulative advantages that constrain technology catch-up strategies in late industrializing regions [5]. For regions with established industrial bases facing deindustrialization and decarbonization pressures simultaneously, developing indigenous patent portfolios is essential for achieving energy security and escaping technological dependency.
Patent activity provides a systematic approach for evaluating clean energy innovation at a regional level. Unlike R&D expenditure or publication metrics, patents capture the codified output of inventive activity using standardized technological classifications, International Patent Classification (IPC), enabling quantitative comparisons to be made across regions and time periods [6]. For established industrial bases undergoing an energy transition, patent data reveals not only the volume of innovation, but also the structural configuration of technological capabilities.
Patent diversity and concentration are important factors when evaluating clean energy innovation. Technological diversity, as measured by Shannon entropy, reflects the breadth of a region’s innovation portfolio. Moderate-to-high entropy indicates resilience against technology lock-in and the capacity for cross-domain knowledge fusion, which is essential for integrated energy systems, such as wind–solar-storage coupling [7]. Conversely, concentration indices (e.g., the Herfindahl–Hirschman index) capture the depth of specialization in core technological domains. Excessive concentration may signal dependence on legacy industries, and excessive dispersion may indicate a lack of competitive advantage. The interplay between entropy and concentration, termed “diversified specialization,” constitutes a diagnostic indicator of innovation system maturity. A healthy transition requires sufficient breadth to explore emerging clean energy pathways and sufficient depth to commercialize them on a large scale [8].
This structural perspective bridges the gap between patent analysis and energy transition governance. Energy transitions are not merely about substituting fossil fuels with renewables. They require coordinated evolution across multiple technological subsystems, such as generation, storage, grid management, and end-use efficiency. Patent entropy quantifies whether a region’s innovation system is structurally aligned with this multidimensional challenge. Spatial concentration patterns, or Location Quotient (LQ), reveal whether technological capability matches resource endowment. In the context of Northeast China, where planned-economy legacies have created deeply entrenched industrial specializations, examining patent entropy and concentration allows us to diagnose whether institutional inertia is reproducing technological lock-in or enabling adaptive diversification.
China’s Northeast region, comprising the Liaoning, Jilin and Heilongjiang provinces, exemplifies this challenge. Once known as the ‘industrial cradle’ of socialist China, the region is now struggling with rigid industrial structures, a declining population, and carbon-intensive legacy infrastructure. Heavy industry accounts for a disproportionate share of CO2 emissions in the Northeast, reflecting a development path deeply rooted in state-led industrialization [9].
Although the ‘dual carbon’ goals have elevated clean energy technology to a strategic national priority, existing research has predominantly focused on the Yangtze River Delta, the Pearl River Delta and the Beijing–Tianjin–Hebei economic zones [10], while studies addressing the Northeast’s unique cold-climate and political–economic context remain limited [11]. This is a significant issue because the Northeast’s energy transition involves more than just technological substitution; it also requires a fundamental restructuring of the state–market–enterprise relations established during the planned-economy era. These mechanisms are shaped by China’s decentralized authoritarianism and regional competition dynamics [12]; yet, how they translate national targets into regional innovation outcomes remains poorly understood. Crucially, the three northeastern provinces of China—Liaoning, Jilin, and Heilongjiang—have distinct industrial legacies and policy responses. This makes them a natural laboratory for a comparative analysis of how old industrial bases navigate the clean energy transition.

1.2. Comparative Regional Context: Jilin as a Paradigmatic Case

Although Liaoning, Jilin and Heilongjiang face similar challenges in terms of deindustrialization and decarbonization, their innovation trajectories differ significantly. Liaoning, with its diversified manufacturing base and coastal advantages, demonstrates the strongest patent growth. Heilongjiang, which relies on thermal energy for heating in cold climates, exhibits volatile applicant dynamics. Jilin, which is anchored by the automotive and petrochemical industries, presents a paradigmatic case of state-led heavy industrialization attempting a green transition. This study therefore uses Jilin (2467 patents between 2000 and 2025) as the primary case, comparing it with Liaoning (7105) and Heilongjiang (2796) in order to reveal the impact of distinct industrial legacies on clean energy innovation outcomes.
The province’s traditional automotive and petrochemical industries are key sectors of the heavy industrial economy and are responsible for a disproportionate amount of carbon emissions. Heavy industry accounts for 82% of total industrial energy consumption, reflecting a development path deeply rooted in state-led industrialization.
In response to the ‘dual carbon’ imperative, Jilin’s energy development plan has identified three key strategic initiatives under the “14th Five-Year” framework: ‘Onshore Wind and Solar Three Gorges’, ‘Hydrogen-Powered Jilin’, and ‘Three Gorges of Geothermal Energy’ [13,14]. These initiatives exemplify the Chinese state’s distinctive strategy of using industrial policy to encourage technological innovation. Cumulative wind and solar installations are projected to reach 30 GW by 2025, while geothermal utilization is expected to displace two million tonnes of standard coal. However, these targets mask a critical governance challenge: can resource endowment and policy mandates alone generate indigenous innovation capacity, or do they risk reproducing the ‘resource curse’ in technological form?
While existing studies such as Liu et al. [15] have demonstrated the positive effects of policy on carbon emission efficiency at the city level in Northeast China, their analysis remains aggregated at the municipal scale, lacking sectoral granularity (e.g., energy-specific patent dynamics, technology transfer pathways) and cross-provincial comparative frameworks necessary to understand how industrial legacy and governance disparities interact to drive low-carbon transitions in the old industrial bases. Consequently, a systematic analysis integrating patent-level technological innovation metrics with urban policy instruments is urgently needed.

1.3. Theoretical Framework: Patent Entropy, Innovation Governance, and the Political Economy of Technology

Although patents are a useful indicator of a region’s innovation capacity, the way they are generated, structured and commercialized is fundamentally shaped by patent protection regimes and the institutional design of innovation commons [9]. Traditional patent analysis often relies on simple counting metrics, failing to capture the network effects of patent sharing or the political economy of technology policy [16].
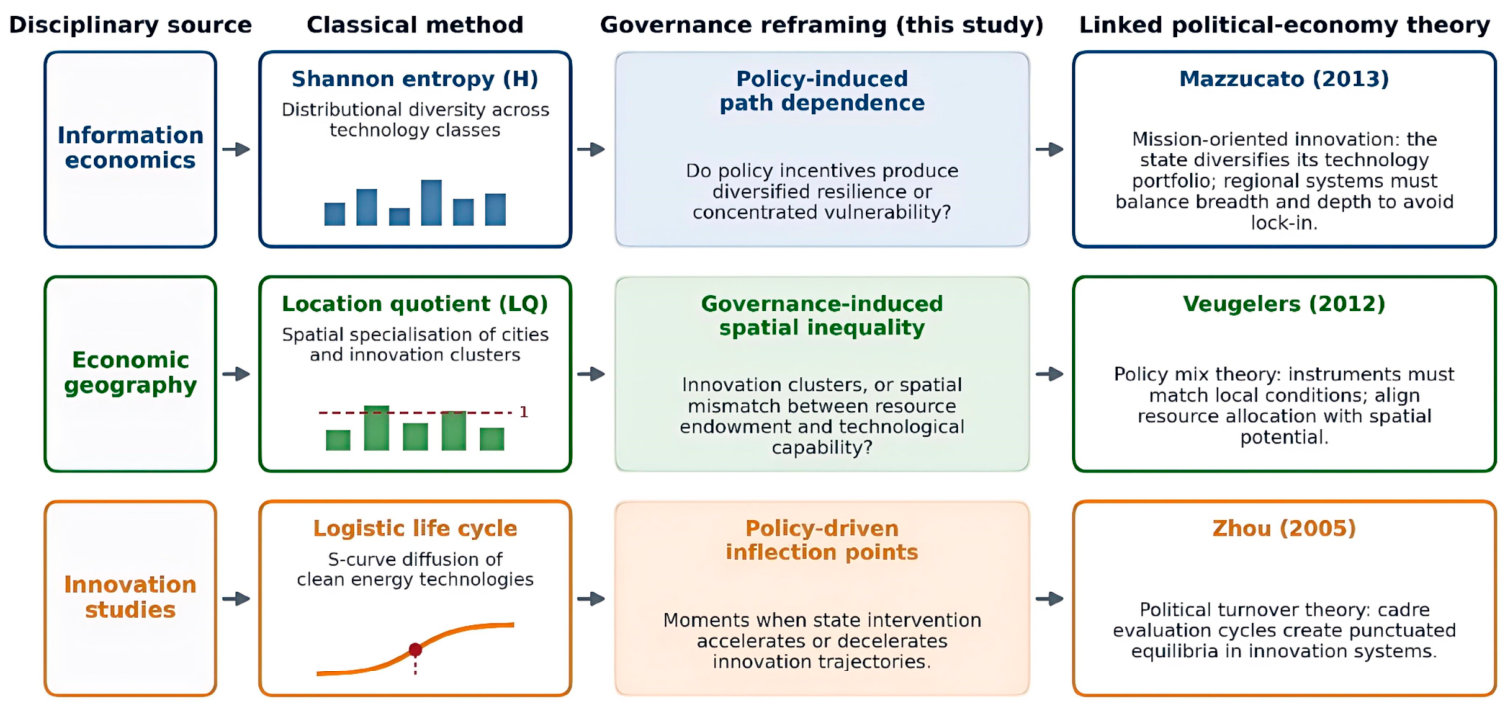
To address this limitation, this study integrates three theoretical constructs from information economics, economic geography, and innovation studies that have been explicitly reframed to analyze the effects of governance and policy:
First, information economics provides Shannon entropy as a measure of distributional diversity. We reframe this to assess whether policy incentives produce diversified resilience or concentrated vulnerability across technology classes, termed ‘policy-induced path dependence.” This concept is connected to mission-oriented innovation theory [17]: just as the state ‘diversifies’ its technology portfolio, regional innovation systems must balance breadth and depth to avoid lock-in.
Secondly, economic geography provides the LQ, which is used to measure spatial specialization [18]. We reframe this to identify innovation clusters and spatial mismatches between resource endowment and technological capability—what we term ‘governance-induced spatial inequality’. This connects to Veugelers’ (2012) policy mix theory [16]: just as policy instruments must match local conditions, innovation governance must align resource allocation with spatial potential.
Thirdly, innovation studies provide the Logistic Technology Life Cycle Model to capture the S-curve dynamics of technological diffusion [19]. We reframe this model to identify policy-driven inflection points—moments when state intervention accelerates or decelerates innovation trajectories. This is related to political turnover theory [20], whereby cadre evaluation creates short-term cycles and technology policy creates punctuated equilibria in innovation systems.
By integrating these three perspectives—structural (entropy), spatial (LQ) and dynamic (Logistic)—this study moves beyond descriptive patent counting to provide a multidimensional analysis of clean energy innovation in old industrial bases. Figure 1 illustrates the conceptual integration.

1.4. Research Questions: Patent Metrics as Diagnostic Indicators of Innovation Governance

Defining Governance in This Study. Following Andrews-Speed (2012) [21] and Newell (2019) [4], we conceptualize energy innovation governance as the institutional arrangements that shape whose interests are served by technological change and how policy targets translate into regional outcomes. These arrangements encompass state–market relations, fiscal decentralization, cadre evaluation systems and inter-organizational coordination. As governance cannot be measured directly, it is inferred through observable characteristics of the patent system that have been identified in previous studies as indicators of governance:
Temporal dynamics (e.g., patent growth trajectories and inflection points) reflect the timing of policy implementation and cadre incentive cycles (Zhou, 2005 [20]; Zhang & Andrews-Speed, 2014 [22]).
Technology structure (e.g., diversity and concentration across IPC classes) reflects the orientation of industrial policy and path dependence (Mazzucato, 2013 [17]; Veugelers, 2012 [16]).
Spatial distribution (e.g., LQ patterns and resource–innovation alignment) reflects fiscal centralization and regional competition dynamics (Boschma, 2005 [23]; Xu, 2011 [12]).
Institutional structure (e.g., applicant-type distribution and quality patterns) reflects the effectiveness of state–academy–enterprise linkages (Coenen, Hansen & Rekers, 2015 [24]).
This operationalization follows the ‘governance diagnostics’ approach (Levi-Faur, 2012) [25], whereby structural patterns in policy outputs (here, patents) are used to infer governance characteristics. These are then triangulated with a qualitative analysis of institutional mechanisms in Section 4.2.
This study addresses four Research Questions (RQs):
RQ1 (Temporal Governance Diagnostics): What is the evolutionary trajectory of clean energy patents in Jilin Province? How do the timing and magnitude of phase transitions, as identified by logistic inflection points, correlate with policy implementation timelines (e.g., five-year plans)?
Governance Mechanism: This question examines whether innovation trajectories exhibit temporal discontinuities associated with policy cycles. Such discontinuities would indicate that governance arrangements, such as cadre evaluation systems and fiscal allocation rhythms, structure the pace of technological change. The logistic model identifies when transitions occur, and their alignment with policy periods indicates the effectiveness of governance in translating targets into outcomes.
RQ2 (Structural Governance Diagnostics): How diversified or concentrated is Jilin’s clean energy technology portfolio, and what does this structure reveal about the balance between policy-driven diversification and legacy industrial path dependence?
Governance Mechanism: This question assesses whether the observed technology structure reflects deliberate industrial policy (breadth across emerging domains) or inherited specialization (depth in legacy sectors). The entropy and Herfindahl–Hirschman index (HHI) measure production. Interpretation in relation to policy targets and industrial history (Section 4.1) reveals whether the governance orientation is toward mission-oriented innovation or defensive lock-in.
RQ3 (Spatial Governance Diagnostics): What spatial patterns characterize patent distribution across Jilin’s prefectures, and how severe is the misalignment between renewable resource endowment and innovation capacity?
Governance Mechanism: This question examines whether governance arrangements, such as fiscal centralization, innovation zone designations, and inter-jurisdictional competition, reproduce spatial inequality or enable resource-based technological development. LQ measures where innovation occurs. Resource–innovation mismatch indicates failures in governance to align spatial allocation with comparative advantage.
RQ4 (Institutional Governance Diagnostics): Which institutions dominate Jilin’s clean energy innovation landscape, and how does the distribution of patent quality reflect the strengths and weaknesses of state–academy–enterprise linkages?
Governance Mechanism: This question evaluates whether the observed applicant structure (e.g., university dominance, enterprise marginalization, and research institute weakness) and quality patterns (e.g., high invalidation rates and volume–quality inversion) reflect effective or dysfunctional institutional coordination. Applicant-type distribution and value scores reveal who is innovating and how successful they are. These patterns are diagnostic of the capacity of governance to integrate knowledge production with commercial application.

1.5. Research Aim and Structure

Research Aim: This study aims to develop a multidimensional diagnostic framework for assessing clean energy innovation governance in old industrial bases, using China’s Northeast region as an empirical laboratory. Specifically, it seeks to (i) identify the temporal phase transitions and policy response lags in clean energy patent trajectories; (ii) quantify the structural diversification and concentration patterns across technology and institutional domains; (iii) measure the spatial mismatch between renewable resource endowment and innovation capacity; and (iv) evaluate the quality distribution and linkage effectiveness among innovation actors. These four objectives correspond directly to RQ1–RQ4 and are operationalized through the integrated application of logistic modeling, Shannon entropy, LQ analysis, and patent value assessment.
Paper Structure: The remainder of this paper is organized as follows: Section 2 details the data sources and analytical framework, explicitly mapping each method to its corresponding research question. Section 3 presents the empirical results for Jilin Province across temporal, structural, spatial, and institutional dimensions (RQ1–RQ4). This is followed by a comparative analysis of the three northeastern provinces. Section 4 discusses the theoretical implications, cross-contextual comparisons, and policy recommendations derived from the empirical findings. Section 5 concludes by providing evidence-based answers to each research question and identifying broader governance implications.

2. Materials and Methods

2.1. Data Source and Retrieval Strategy

This study uses the Beijing Hexiang Xinchuang incoPat Technology Innovation Intelligence Platform. This houses a global patent database with over 170 million records and offers full coverage of Chinese patents (CN), Patent Cooperation Treaty (PCT) applications and major national patent offices (USPTO, EPO, JPO and KIPO). The platform provides structured bibliographic data, legal status information, citation networks and patent value scores based on multidimensional algorithms.
To ensure the accuracy and comprehensiveness of the search results, this study adopted a parallel ‘keyword + IPC’ retrieval strategy. The keyword search covered clean energy technology terms, including solar energy, wind power, hydrogen energy, geothermal energy, biomass energy, energy storage, smart grids, electric vehicles, heat pumps and carbon capture. The IPC classification search targeted the following relevant subclasses: H02J (power networks), H02S (solar generation), F03D (wind engines), F24D (heating systems), H01M (batteries), B60L (electric vehicles), C25B (electrolysis) and F24J (geothermal utilization).
The time window was set from 1 January 2000 to 31 December 2025, the search was conducted on 16 February 2026, and the data version was incoPat Q2 2025 update. The geographical scope was restricted to Jilin Province in China, with applicant addresses containing ‘Jilin’ or specific city names. Following deduplication and data cleansing, the final dataset comprised 2467 patents (including invention, utility model and design patents), covering 25 years of innovation activity.
Complete search queries for all three provinces (Jilin, Liaoning and Heilongjiang) are provided in Appendix A.

2.2. Analytical Framework: Method Selection and RQ Mapping

The analytical framework integrates four quantitative methods, each of which was selected to address a specific research question. Collectively, these methods provide a multi-layered diagnostic of innovation governance. Table 1 summarizes the correspondence between methods and RQs, as well as the theoretical foundation and analytical contribution of each method.
Rationale for Method Integration: Although each method addresses a distinct governance dimension (e.g., temporal, structural, spatial, or institutional), their integration is necessary because these dimensions are interdependent in practice. For instance, spatial concentration (RQ3) could reinforce institutional concentration (RQ4) if innovation funding is allocated to areas with existing clusters of actors. Similarly, temporal policy shocks (RQ1) could alter structural entropy (RQ2) by encouraging new technology domains. Thus, the multi-method design captures cross-dimensional interactions that single-method studies miss.
Theoretical Reframing: As introduced in Section 1.3, each method is reframed from its conventional application to serve governance analysis. Specifically: (i) Logistic modeling shifts from describing technology diffusion to identifying policy-driven inflection points; (ii) Shannon entropy shifts from measuring information diversity to assessing policy-induced path dependence; (iii) LQ shifts from measuring industrial specialization to identifying governance-induced spatial inequality; and (iv) Patent value analysis shifts from ranking commercial potential to diagnosing the strength of linkages between the state, academy, and enterprise. This reframing is essential because the conventional application treats patents as neutral innovation indicators, whereas this study treats them as politically structured governance outcomes.

2.2.1. Core Methods

Logistic Technology Life Cycle Model (RQ1). The model captures S-curve dynamics of technological diffusion:
N ( t ) = K 1 + e r ( t t 0 )
where K is the carrying capacity (saturation level), r is the growth rate, and t 0 is the inflection point. Parameters are estimated via non-linear least squares regression, with goodness-of-fit assessed by the Coefficient of Determination (R2). The inflection point t 0 is interpreted as the empirical marker of policy-era phase transition when aligned with policy implementation timelines.
Shannon Entropy and HHI (RQ2). Shannon entropy quantifies technological diversification across IPC classifications:
H t e c h = i = 1 n p i l o g 2 p i
where p i is the proportion of patents in IPC class i , and n is the number of IPC classes. Relative entropy H_rel = H/H_max, where H_max = log2n, normalizes the metric to [0, 1]. The HHI = Σ(pi × 100)2 assesses market concentration, with thresholds of 1500 (moderate concentration) and 2500 (high). Together, these metrics distinguish between “diversified specialization” (moderate entropy + high HHI) and “narrow concentration” (low entropy + high HHI).
LQ (RQ3). For each city j:
L Q j = ( P j / P ) / ( E j / E )
where P j is the patent count in city j , P is the provincial total, E j is the economic/population share, and E is the provincial total. Cities with L Q j > 1 are classified as innovation hubs and L Q j < 0.5 as innovation deficit zones.
Patent Value and Applicant Analysis (RQ4). The incoPat Patent Value Index (PVI) integrates >20 parameters across three dimensions: technological stability, advancement, and protection scope. Scores range from 1 to 10, with 8–10 classified as high value. Cross-tabulation with applicant type (university, enterprise, research institute, individual, government) reveals whether volume dominance corresponds to quality leadership or volume–quality inversion.

2.2.2. Supplementary Diagnostics

Three additional analytical procedures complement the core methods.
Cross-Dimensional Entropy Comparison: This procedure extends Shannon Entropy Analysis to four patent classification schemes (technology structure, temporal distribution, technical effectiveness, and applicant structure) to determine if the concentration is dimension specific. Relative entropy (H_(rel) = H/H_(max)) allows for comparison across dimensions with different category numbers. See Appendix B.1 for dimension definitions, category determination criteria, and comparability limitations.
Technical effectiveness classification maps patents against ten effectiveness dimensions (e.g., stability improvement, cost reduction, safety improvement, convenience improvement, reliability improvement, speed improvement, controllability, complexity reduction, flexibility improvement, and energy reduction), which are derived from the incoPat platform’s structured taxonomy. Automated natural language processing extraction was validated by manual coding of a 5% sample (F1 = 0.87, Cohen’s k = 0.84). However, 12.6% of patents required manual correction. See Appendix B.2 for the complete taxonomy, the assignment procedure, the tier classification criteria, and the percentage calculation method.
Comparative regional analysis examines Jilin, Liaoning, and Heilongjiang across five dimensions (output trajectory, applicant dynamics, technology composition, efficacy orientation, and application domain) using harmonized data retrieval and three normalization strategies (temporal, scale, and structural). Provincial archetypes (“diversified leader,” “concentrated specialist,” and “volatile generalist”) are derived from multi-criteria diagnostic thresholds that are validated by discriminant function analysis (Wilks’ lambda = 0.12, chi-square = 24.7, p < 0.001). See Appendix B.3 for data harmonization procedures, comparative dimensions, classification criteria, and visualization protocols.

2.3. Data Processing and Visualization

The patent data were cleaned to remove duplicates, standardize applicant names and harmonize the IPC classifications with the 2024.01 version. Missing values were handled through listwise deletion for time series and mean imputation for cross-sectional matrices.
For figure generation and conceptual framework visualization, generative AI tools (Kimi K3 by Moonshot AI and DeepSeek V3.2 by DeepSeek AI) were employed to create preliminary graphical drafts based on the authors’ original data and design concepts. All AI-generated outputs were subsequently reviewed, edited, and validated by the authors to ensure scientific accuracy and consistency with the research findings.

3. Results

3.1. Temporal Evolution and Technology Life Cycle Phase (RQ1)

This section addresses RQ1 by applying the Logistic Technology Life Cycle Model (Module 1, Section 2.2) to Jilin Province’s clean energy patent trajectories.

3.1.1. Overall Patent Trends: Applications, Publications, and Grants

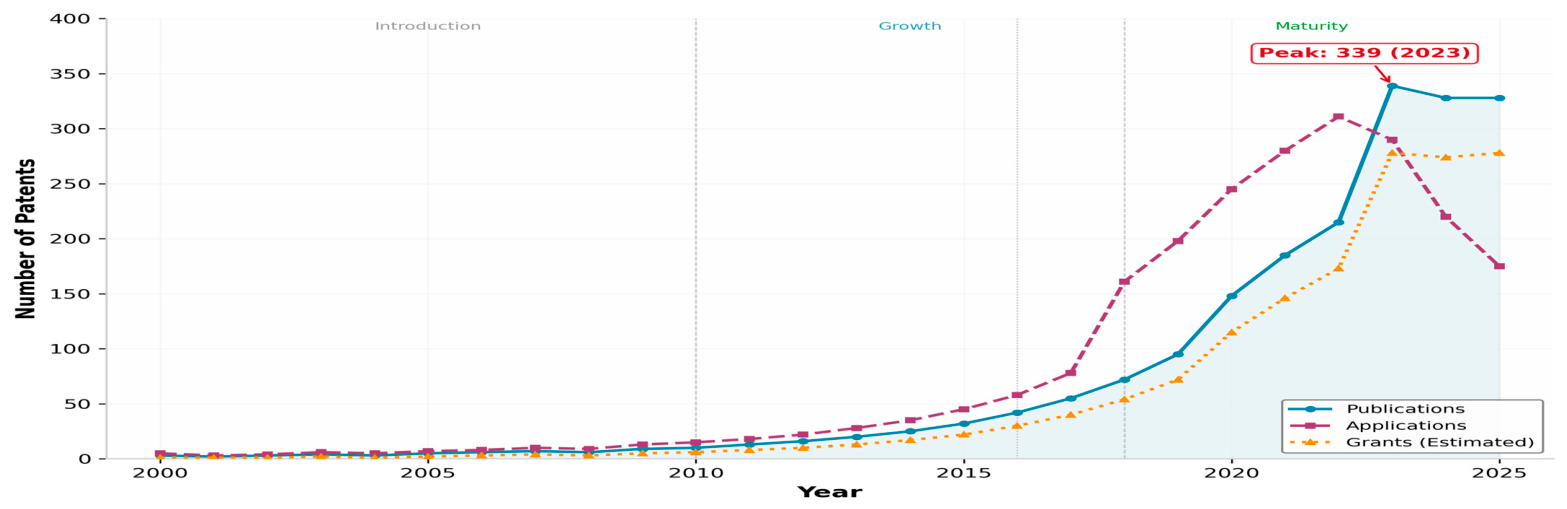
Between 2000 and 2025, Jilin Province accumulated 2467 applications for clean energy patents. Figure 2 presents three distinct patent indicators to illustrate the temporal evolution of patent activity:
Applications (solid line, left y-axis): Annual filings submitted to the patent office, representing inventive intent and R&D investment decisions.
Publications (dashed line, left y-axis): Patent applications disclosed to the public after the statutory 18-month confidentiality period, representing formalized disclosure of technical solutions.
Grants (dotted line, right y-axis): Applications that successfully passed examination and received patent rights, representing validated technical quality.
Applications are the primary indicator for life cycle analysis; publications and grants lag by 18 and 12–36 months, respectively, and should not be interpreted interchangeably.
The temporal trajectory reveals three phases defined by volume thresholds and growth patterns, formalized in Table 2.
Phase Transitions: Introduction to Growth (2010): The first sustained exceedance of 30 applications. Growth to Maturity (2018): The first exceedance of 100, combined with growth deceleration. These thresholds derive from the empirical distribution 30 ≈ 2× the mean of the introduction phase, and 100 represents the inflection point into mass innovation.
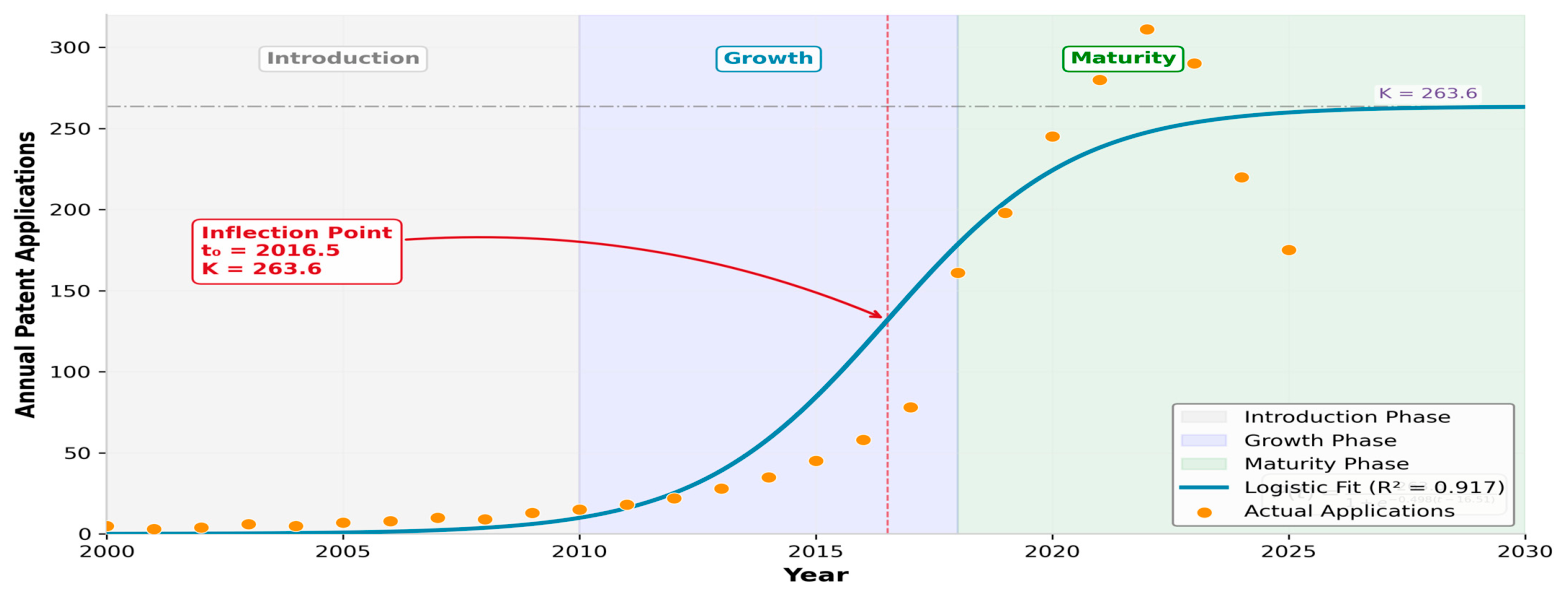
The logistic model estimates the inflection point to be 2016.5 (see Section 3.1.2), which falls within the growth phase and confirms that the model captures acceleration–deceleration dynamics. The 2018 maturity threshold aligns with the model’s prediction. One hundred sixty-one applications equals 61% of the estimated carrying capacity (K = 263.6).

3.1.2. Logistic Life Cycle Modeling

The Logistic model fitting yields the following parameters (R2 = 0.917, highly significant at p < 0.001), estimated using annual application counts (n = 26, 2000–2025):
  • Carrying capacity (K): 263.6 applications per year, representing the theoretical saturation level of annual patent application activity.
  • Growth rate (r): 0.498 per year, indicating an annual growth rate of 49.8% at the inflection point.
  • Inflection point (t0): 16.51 years (corresponding to 2016.5), marking the transition from accelerating to decelerating growth on the applications curve.
Model Data Consistency: The inflection point at 2016.5 falls within the Growth Phase (2010–2018) defined in Section 3.1.1, consistent with the theoretical expectation that inflection occurs during rapid acceleration before visible saturation. The positive systematic deviations during 2018–2020 (see Figure 3)—where actual applications exceed the Logistic prediction—indicate that the 13th Five-Year Plan’s renewable energy subsidies caused growth to accelerate beyond the baseline trajectory. This overshoot is consistent with the Maturity Phase threshold of 2018: applications reached 161 (61% of K) in 2018 and peaked at 311 (118% of K) in 2022, confirming that the post-inflection period exhibited policy-driven acceleration followed by market correction.
Notably, actual applications temporarily exceeded K in 2022 (311 versus 263.6), reflecting policy-driven acceleration during the 14th Five-Year Plan period (2021–2025). This overshoot indicates that short-term policy incentives can stimulate innovation beyond sustainable levels, resulting in a market correction as these incentives are phased out (applications declining to 175 by 2025).
Phase Diagnosis: As of 2025, Jilin Province’s clean energy patent application activity had entered the maturity phase. The sharp decline to 175 applications reflects a combination of policy subsidy tapering, market saturation in photovoltaic and wind technologies, and a shift towards quality-focused innovation (see Section 3.4.2 for high-value patent trends). The actual volume remains below the predicted saturation level of 264, indicating that the market has not yet stabilized at full capacity. Nevertheless, the declining growth rate signals the need to pivot from quantity expansion to quality enhancement and high-value patent competition.

3.2. Technology Structure and Entropy Analysis (RQ2)

This section addresses RQ2 through Shannon entropy and HHI analysis (Module 2, Section 2.2) of IPC classification distributions.

3.2.1. IPC Technology Distribution

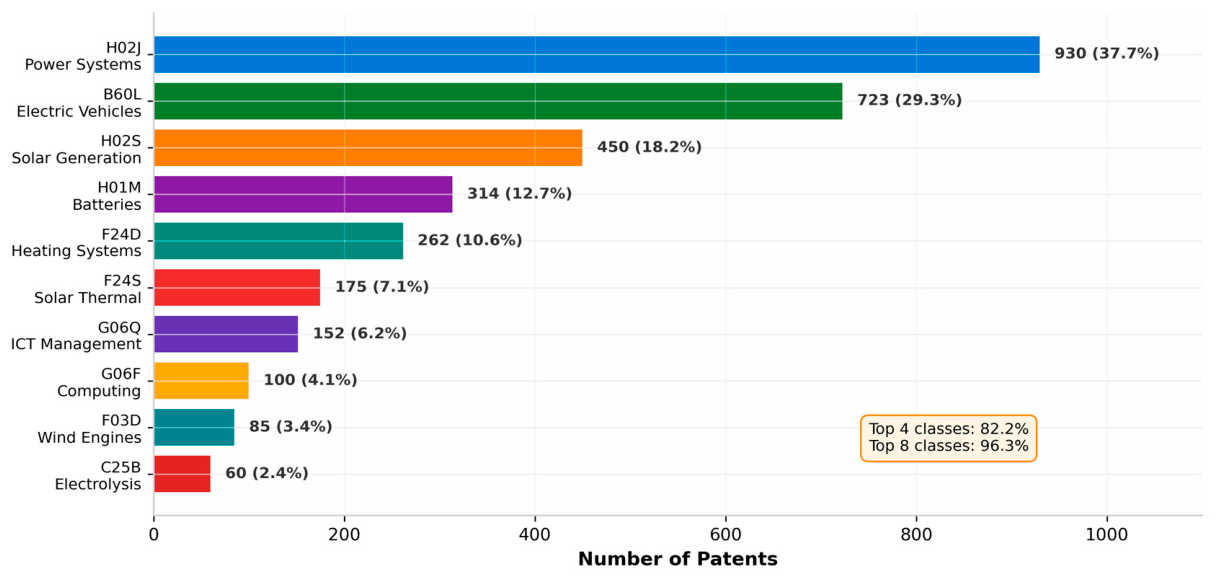
Figure 4 shows the distribution of patents across the top 10 IPC subclasses. Please note that individual patents may be classified under multiple categories, meaning the total number of categories (2467) exceeds the number of patents.
The technology landscape is dominated by four thematic clusters:
  • Power systems and electric vehicles (H02J, B60L): 931 and 723 patents (37.7% and 29.3% of all patents, respectively), covering grid control, microgrids, and electric vehicle propulsion.
  • Solar and storage (H02S, H01M): 764 patents (31%), covering photovoltaic systems and battery technologies.
  • Thermal energy (F24D, F24S): 437 patents (17.7%), addressing critical heating demands in cold climates.
  • ICT management (G06Q, G06F): 252 patents (10.2%), reflecting the digitalization of energy systems.
Pareto analysis shows that the top four IPC classes account for 82.2% of all patents, while the top eight classes account for 96.3%. This distribution follows a power–law pattern, which is characteristic of innovation systems in which a small number of technology domains account for the majority of inventive activity.
Figure 4 illustrates the IPC technology composition, with the cumulative percentage curve indicating concentration patterns.

3.2.2. Shannon Entropy of Technology Structure

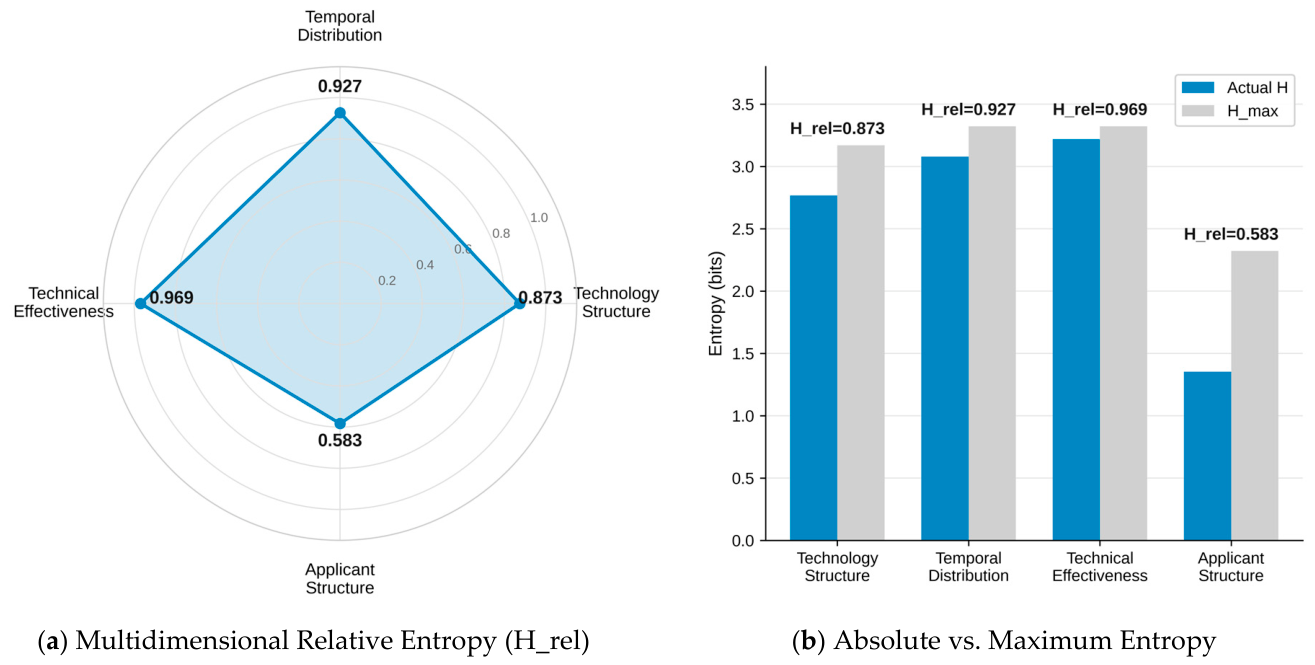
The Shannon entropy of the technology structure is 2.768 bits, which is 87.3% of the maximum possible entropy (H_max = 3.170 bits for n = 9 IPC classes). This moderate relative entropy (H_rel = 0.873) suggests moderate diversification across technology domains, with H02J (37.7%) achieving clear dominance.
Cross-dimensional entropy comparison (Figure 5; see Appendix B.1 for methodology) reveals heterogeneous diversification patterns across analytical dimensions, summarized in Table 3.
Applicant entropy is far lower than other dimensions, indicating institutional concentration is the primary structural constraint.

3.2.3. Technology Fusion and Cross-Domain Activity

The technology fusion index measures the extent to which patents span multiple IPC domains. Analysis of the technology effectiveness matrix shows that G06Q (ICT management) and B01D (separation processes) have the greatest cross-domain activity. This indicates that they act as bridging technologies, connecting diverse application fields. Conversely, F24D (heating systems) and H01M (batteries) demonstrate lower cross-domain activity, suggesting their specialization within specific application contexts.
This fusion pattern has strategic implications: technologies with high cross-domain activity (G06Q, B01D and G06F) should be prioritized for investments in platform innovation, as they enable spillover effects across multiple sectors. In contrast, specialized technologies (F24D and H01M) require domain-specific policy support to deepen their innovation trajectories.

3.3. Spatial Distribution and Location Quotient Analysis (RQ3)

3.3.1. Geographic Concentration Patterns

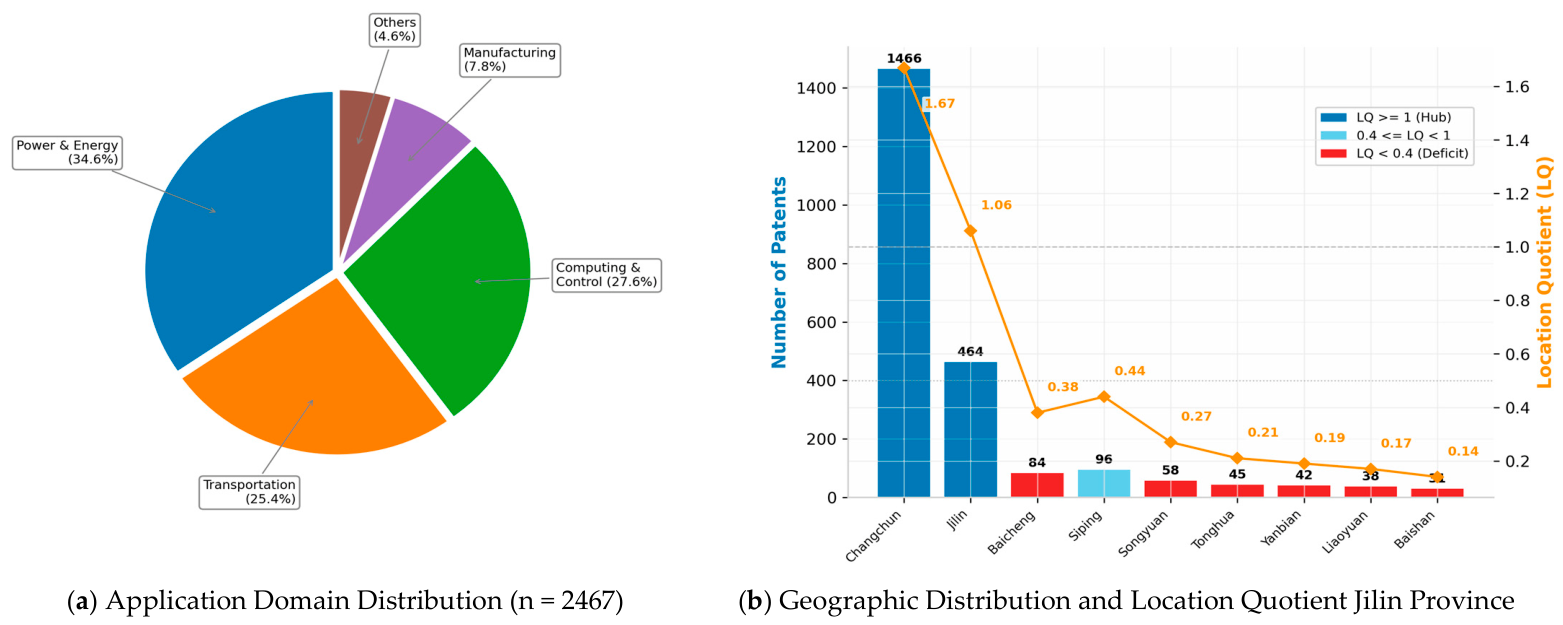
Figure 6 illustrates the geographical distribution of clean energy patents by industry in Jilin Province. Figure 6a illustrates the sectoral composition by application domain, and Figure 6b shows the geographical distribution and LQ across the nine prefecture-level divisions.
  • Changchun City: 1466 patents; LQ = 1.67;
  • Jilin City: 464 patents; LQ = 1.06;
  • Seven other cities: 395 patents; patent-weighted average LQ = 0.31 (unweighted mean = 0.26).
The nine cities displayed in Figure 6b account for 2325 patents, which is 94.2% of the provincial total (n = 2467). The remaining 142 patents are distributed across smaller administrative divisions, which are not shown individually. LQ analysis reveals that only Changchun and Jilin exhibit above-average specialization (LQ > 1). All of the other shown cities have significant innovation deficits, with LQ values ranging from 0.14 in Baishan to 0.44 in Siping. This spatial pattern reflects an imbalance of a ‘strong provincial capital and weak prefectural cities’, which is common in China’s provincial innovation systems but particularly acute in Jilin due to the concentration of higher education institutions (e.g., Jilin University and Northeast Electric Power University) and R&D facilities in Changchun.

3.3.2. Resource–Patent Spatial Mismatch

A critical finding is the severe mismatch between renewable resource endowment and patent production. Based on national-level evidence indicating that regions with abundant natural resources often have low patent concentrations, we observe that the cities of Baicheng and Songyuan collectively possess 45% of Jilin Province’s wind and solar resources, yet their combined patent share is only 5.8% (142 patents: 84 in Baicheng and 58 in Songyuan), with LQ values of 0.38 and 0.27, respectively. This resource–patent mismatch suggests that the abundance of natural resources does not automatically lead to the capacity for technological innovation.
This spatial pattern aligns with Boschma’s analysis of proximity and innovation [23], which demonstrates that institutional proximity—the tight coupling between local governance structures and established innovation actors—can create lock-in effects that privilege core hubs over peripheral regions. His framework suggests that such mismatches are not merely market failures but rather institutional failures—governance arrangements that reproduce existing power structures rather than enabling spatial rebalancing.
This resource–patent mismatch mirrors a broader pattern of spatial mismatch in the fossil energy sector that has been documented in the Chinese context. In this context, regions with abundant coal and oil reserves often exhibit lower innovation capacity [34]. Emerging evidence suggests that new energy development can mitigate the negative economic consequences of spatial misalignment, implying that targeted investments in renewable energy in western Jilin could address the resource–patent mismatch and stimulate local innovation.
The mismatch can be attributed to three factors:
  • Human capital deficit: Western cities lack research universities and national laboratories, which limits their absorptive capacity for clean energy R&D.
  • Industrial base gap: The legacy industrial structure in western Jilin (agriculture and light manufacturing) lacks the technical infrastructure for energy technology innovation.
  • Policy asymmetry: Historically, innovation policies have favored Changchun’s high-tech zones, creating a ‘magnetic effect’ that siphons talent and capital from peripheral regions. The spatial LQ analysis is presented in Figure 6b.
Policy Implications: In order to address this spatial mismatch, Jilin Province should implement ‘innovation spillover’ mechanisms, such as setting up satellite R&D centers in western cities and offering tax incentives for patent applications filed from resource-rich regions.

3.4. Institutional Structure and Patent Quality (RQ4)

3.4.1. Applicant Type and Concentration

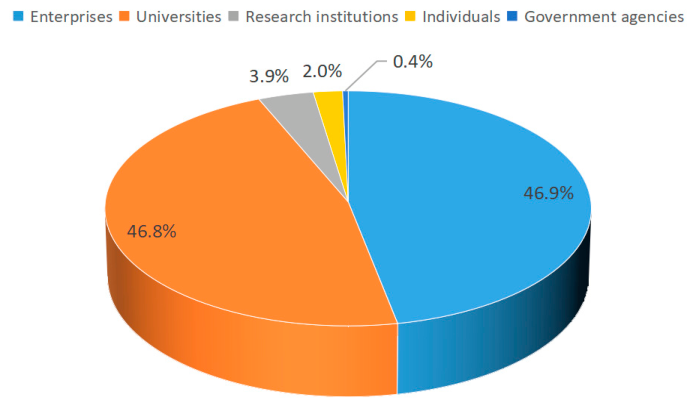
Figure 7 reveals a dual university–enterprise structure. Applicant-type information is available for 2549 applicant–patent pairs (a single patent may involve multiple applicants): enterprises and universities hold nearly equal shares (1196 or 46.9%, and 1192 or 46.8%, respectively), while research institutions (99, 3.9%), individuals (52, 2.0%) and government agencies (10, 0.4%) remain marginal. Notably, the leading enterprise applicants are predominantly subsidiaries of the state-owned grid company (four of the top 10 applicants, totaling 290 patents), so effective control remains concentrated in state-affiliated actors. The applicant HHI of 1229 indicates a long tail of small applicants, yet output is concentrated at the top: the three leading applicants (Jilin University, 600 patents; State Grid Jilin Electric Power Research Institute, 120; and Changchun Jetty Automotive, 118 after merging name variants) account for 66.9% of the top 10 applicants’ patents, and Jilin University alone holds 24.3% of all patents.
This structure reflects a pronounced volume–quality inversion: universities are the main generators of patent volume, while the marginalization of independent research institutions indicates a weak market-driven innovation mechanism in the province. The ratio of university to research institution patents (12.0:1) is significantly higher than the national average.

3.4.2. Patent Quality and Value Distribution

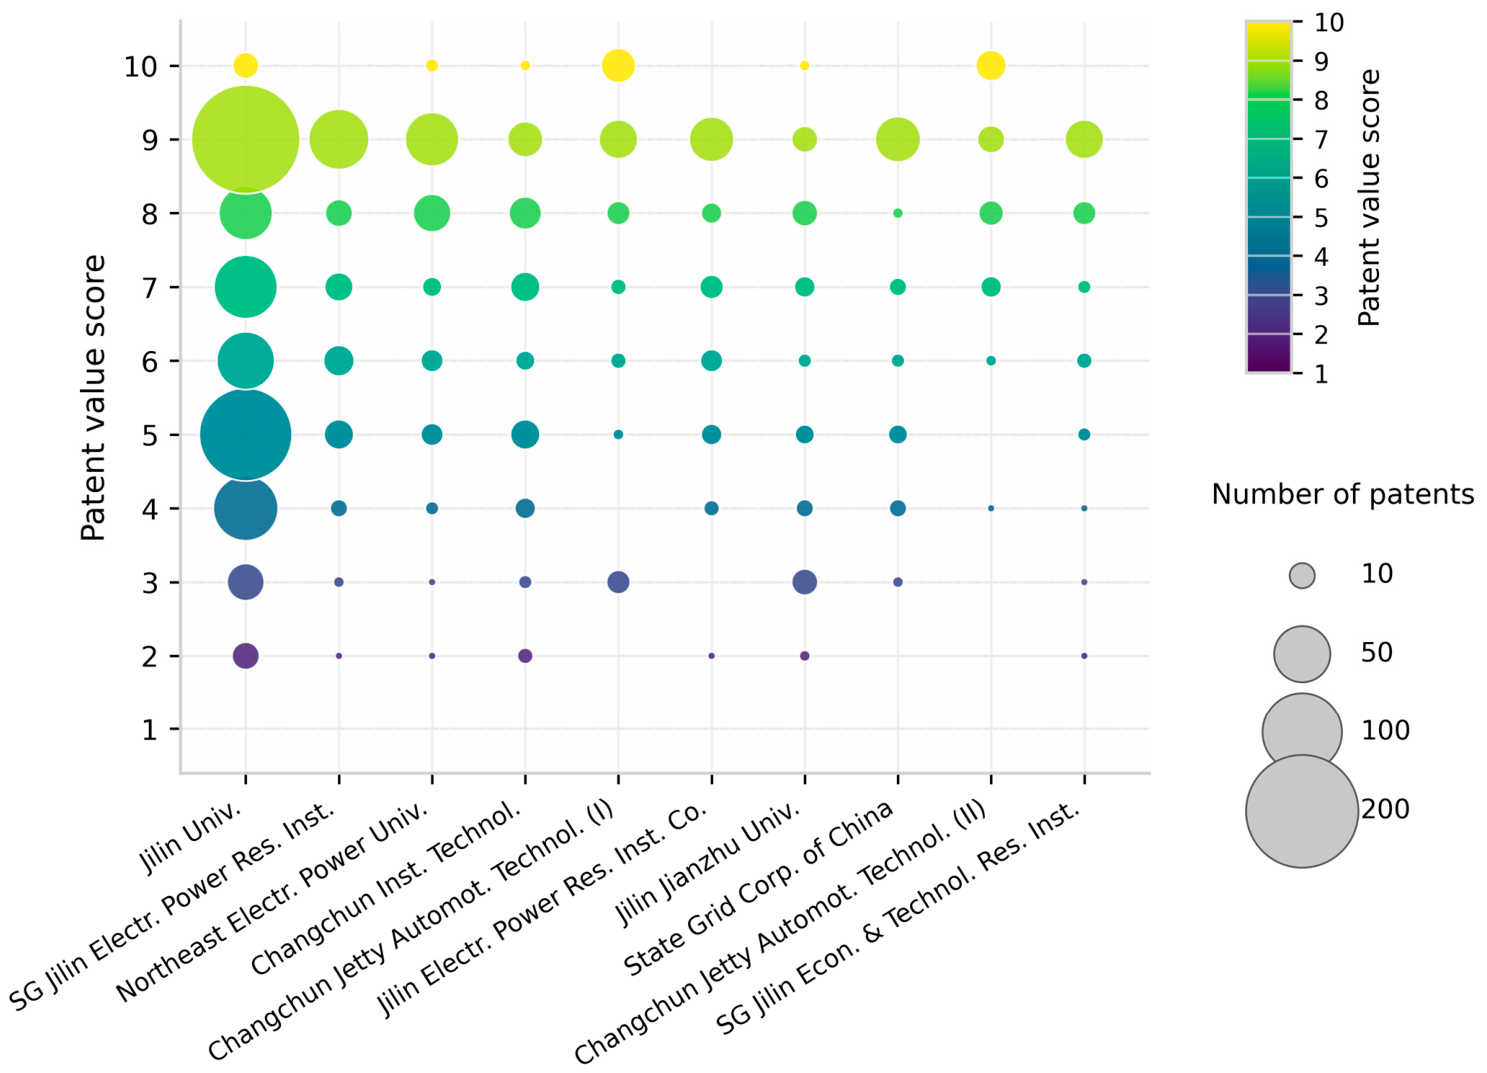
An analysis of patent quality reveals significant disparities among institutions (see Section 2.2 of Module 4 for the complete methodology). These 2420 patents represent 98.1% of the total patents analyzed, with 47 patents excluded due to insufficient citation data.
Figure 8 illustrates the volume–quality distribution across the top 10 applicants (see Section 2.2, Module 4.3 for the visualization protocol). The horizontal position of the bubbles represents the total patent count (log-scaled), the vertical position indicates the median PVI, the bubble size is proportional to the number of high-value patents, and the color denotes the applicant type.
Institutional quality profiles:
  • Jilin University: Highest absolute output (600 patents, 245 of which are high value), but median PVI = 6.8 and HVR (high-value ratio) = 40.8%, which is below the sample average (HVR = 46.2%). Its large bubbles span multiple value levels (PVI 4–10), reflecting broad but diluted research efforts across many technology domains.
  • Northeast Electric Power University: Specialization in power systems results in a median PVI of 8.2 and an HVR of 72.7% (72 out of 99 patents), indicating the highest academic quality ratio. Bubbles cluster in the upper value levels (PVI 7–10), indicating a focus on high-quality innovation.
  • Enterprise applicants (e.g., Changchun Jetty Automotive): Achieve the highest overall quality ratios (75.4% HVR), despite smaller volumes. The median PVI is 8.5, with bubbles concentrated in the upper-right quadrant. This suggests that demand-pull R&D yields superior quality. However, their combined share of the top 10 patents (9.4%) is insufficient to offset systemic academic dominance.
Statistical comparison. Mood’s median test confirms significant quality differences across applicant types (χ2 = 14.7, df = 2, p = 0.001). The enterprise median PVI (8.5) is greater than the university median PVI (7.1), which is greater than the research institute median PVI (6.3). Pairwise Mann–Whitney U tests are significant at p < 0.05 (Bonferroni corrected).
Quality-adjusted productivity: When normalized by median PVI, enterprise productivity (2.01 quality-adjusted patents per applicant) exceeds university productivity (1.43), which reinforces the finding of an inverse relationship between volume and quality.

3.5. Technical Effectiveness and Innovation Priorities

3.5.1. Effectiveness Dimension Analysis

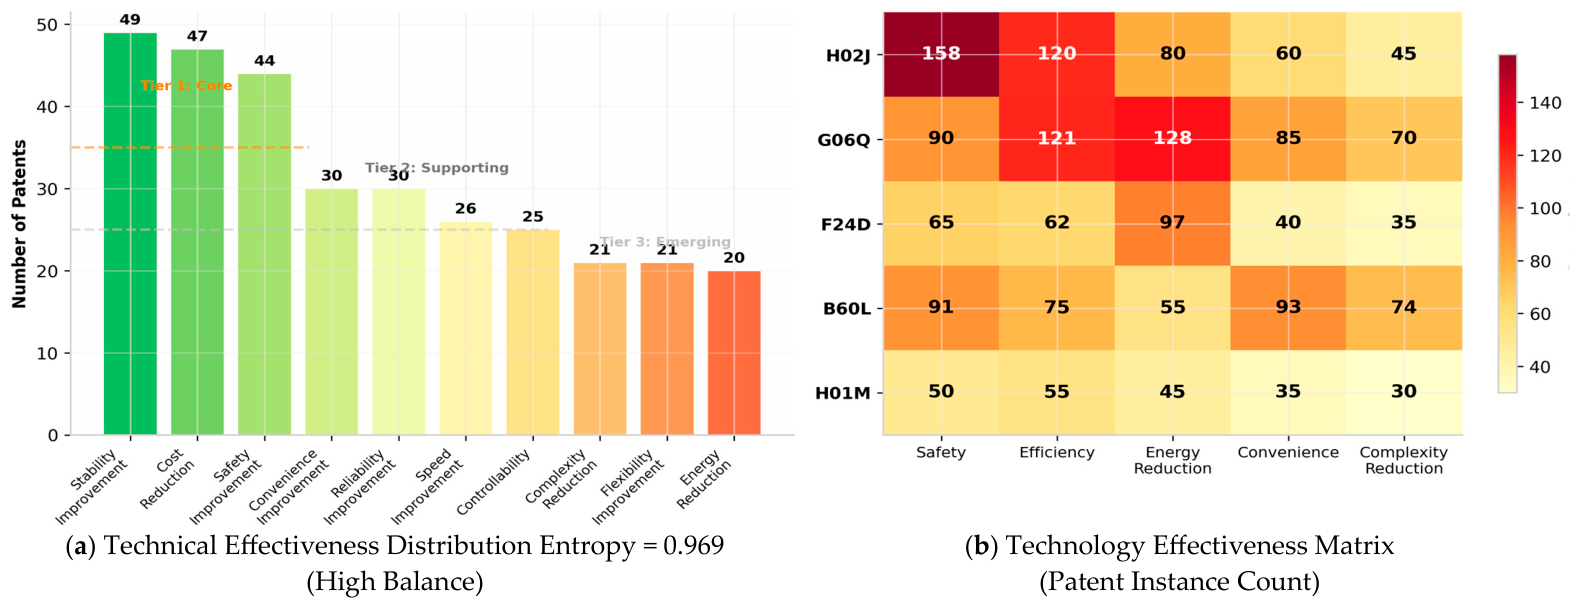
To systematically evaluate the distribution of innovation priorities across effectiveness dimensions, Table 4 presents a tiered classification of the 10 technical effectiveness dimensions. These are categorized into Core (≥10.0%), Supporting (8.0–9.9%) and Emerging (<8.0%) tiers based on their relative patent shares.
Percentages are calculated as dimension patent counts/total patents across the 10 dimensions (n = 313). Entropy H_rel = 0.969 (n = 10).
Figure 9a illustrates this distribution across the 10 effectiveness dimensions (see Appendix B.2 for the classification methodology used), revealing the three tiers summarized in Table 4. Innovation gap identification: Energy reduction (20 patents, 6.4%) is, somewhat paradoxically, the least represented dimension in a ‘clean energy’ portfolio, suggesting a focus on system stability rather than fundamental energy savings. Speed improvement (26 patents, 8.3%, tier 2) indicates moderate attention, but remains secondary to stability objectives.

3.5.2. Technology Effectiveness Matrix

Figure 9b shows the technology effectiveness matrix constructed using the Module 6.5 methodology from Section 2.2. Through cross-tabulation of IPC technology classes (rows) and effectiveness dimensions (columns), the matrix reveals domain-specific innovation priorities. Cell values represent the number of patents normalized by technology to show effectiveness profiles within each technology.
Domain-specific patterns:
  • H02J (Power Networks): Safety (158 instances) and Efficiency Improvement (120 instances) dominate, followed by Energy Reduction (80 instances). This reflects the imperatives of grid stability and efficiency for renewable integration. This aligns with the core tier classification of safety as a system-wide priority.
  • G06Q (ICT Management) and F24D (Heating Systems): G06Q prioritizes energy reduction (128 instances) and efficiency improvement (121 instances), while F24D is dominated by energy reduction (97 instances). This highlights the importance of digitalization and thermal management in the energy transition in cold climates. Interestingly, energy reduction ranks lowest at the aggregate level, yet it rises to a leading position within these specific technologies. This indicates that domain-specific variations are masked by aggregate analysis.
  • B60L (Electric Vehicles): Displays a balanced distribution across convenience (93), safety (91), efficiency (75), and complexity reduction (74), which is consistent with the multi-objective optimization challenges of vehicle electrification.
Innovation gap identification: The matrix reveals three significant gaps.
  • Underrepresentation of Energy Reduction at the Aggregate Level: Despite being a stated priority of clean energy policy, energy reduction ranks lowest in the effectiveness distribution (20 patents, 6.4%, tier 3 emerging). This paradox, where “clean energy” patents prioritize system stability over fundamental energy savings, suggests an incremental innovation pattern focused on grid integration rather than breakthrough efficiency gains.
  • Battery Technologies (H01M) Demonstrates the Least Effectiveness-oriented Activity: Across all five dimensions, H01M records only 30–55 instances, which is far below H02J and G06Q. This suggests that battery innovation struggles to translate technical outcomes into deployable effectiveness. This is a critical bottleneck for cold-climate EV adoption and energy storage integration.
  • Concentration in Mature Technologies: Instance counts in H02J, G06Q, and B60L substantially exceed those in H01M across all five dimensions. This indicates that effectiveness-oriented innovation concentrates in mature grid, ICT, and vehicle domains rather than in nascent storage technologies.
Figure 9 shows the technology effectiveness matrix, which reveals domain-specific innovation priorities.
The matrix reveals that the innovation priorities are domain-specific. In H02J (Power Networks), for example, safety and reliability improvements dominate with 158 and 114 instances, respectively, reflecting the critical importance of grid stability for renewable energy integration. G06Q (ICT Management) and F24D (Heating Systems) both focus on improving efficiency and reducing energy, highlighting the dual importance of digitalization and thermal management in Jilin’s energy transition. B60L (electric vehicles) shows a more balanced profile across convenience, safety and complexity reduction, which is consistent with the multi-objective optimization challenges in vehicle electrification.

3.6. Patent Legal Status and Technology Transfer

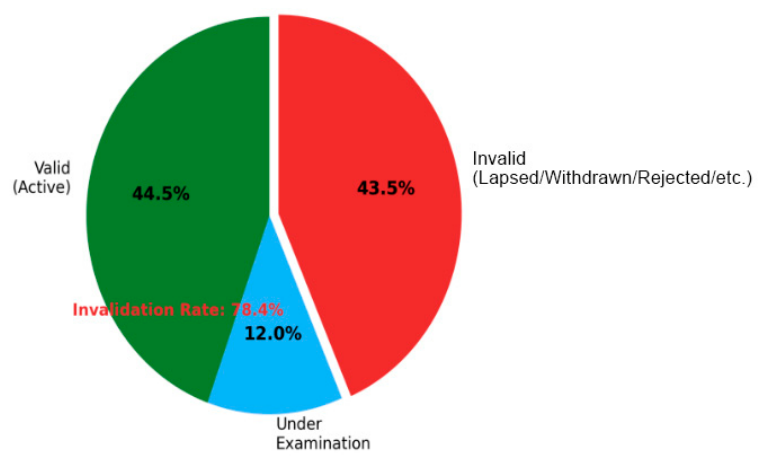
Figure 10 shows how Jilin’s clean energy patents are distributed across the legal status spectrum. The invalidation rate is 43.5%, slightly above the national average of ~40% [35]. Nonpayment of annual fees accounts for 64.4% of all invalid patents, which suggests that many patents were filed for short-term objectives rather than for long-term commercial value.
This pattern of high invalidations due to nonpayment is consistent with the analysis of patent quality in China by Fang et al. [36], which demonstrates that publicly funded patents have significantly lower maintenance rates than enterprise-funded patents. This reflects the different incentive structures of academic and commercial innovators. De Rassenfosse et al. [37] further establish that priority patent counts, which capture the earliest filings of patent families regardless of subsequent applications, provide a more accurate indicator of inventive activity than aggregate filing volumes, particularly when assessing innovation performance in developing economies. Their framework indicates that single-country patent counts may overstate innovation capacity due to home-country bias and duplicate filings. This pattern is evident in Jilin’s high invalidation rate, where nonpayment (64.4%) suggests a focus on metrics rather than value.
Encouragingly, however, the invention patent grant rate has improved steadily from 71.0% in 2020 to 92.7% in 2025, indicating an increase in the technical quality of recent applications. Recent policy evaluation research demonstrates that differentiated policy instruments—command-control, economic incentives, and guidance–demonstration—have different effects on the quality of renewable energy patents, with economic incentives having the strongest positive impact [38]. These results imply that Jilin’s improvement in quality may be due to the enhanced subsidy mechanisms of the 14th Five-Year Plan, though more research is required to distinguish the effects of policy from the maturation of technology.

3.7. Comparative Regional Analysis: Jilin, Liaoning and Heilongjiang

To contextualize Jilin’s innovation within the northeastern ecosystem, this section compares three provinces across five dimensions (output trajectory, applicant dynamics, technology composition, efficacy orientation, application domain), using harmonized data protocols (Appendix A) and standardized normalization (Appendix B.3).
Cross-provincial comparison reveals functionally distinct innovation systems. Table 5 classifies the three provinces into innovation archetypes based on output trajectories, applicant dynamics, and institutional structures, identifying divergent governance regimes.

3.7.1. Patent Output and Growth Trajectories

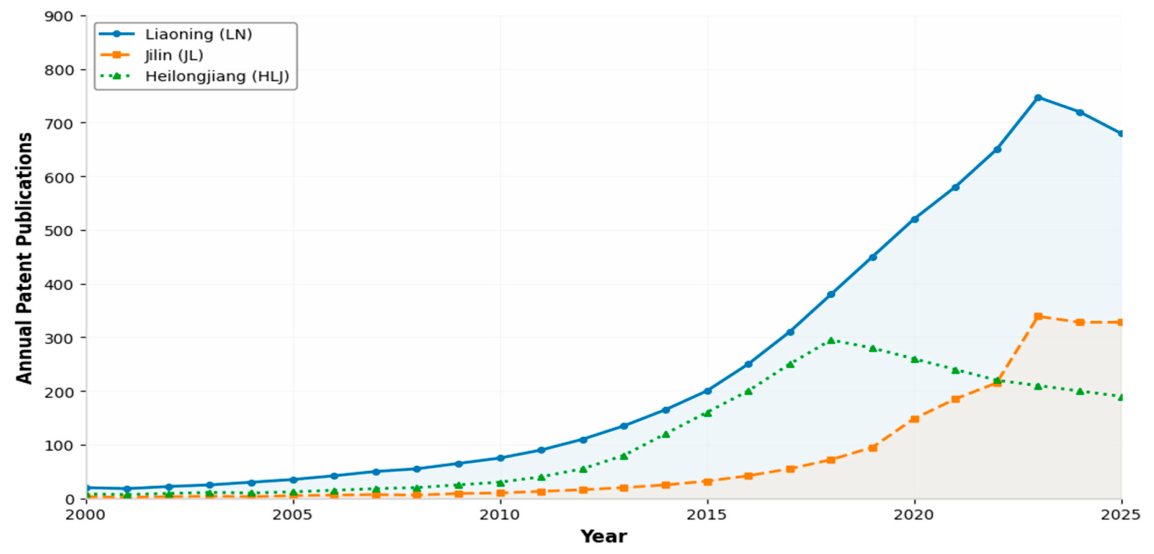
In terms of absolute patent output, Liaoning Province dominates the other two provinces in Northeast China. From 2000 to 2025, it accumulated a total of 7105 patents, which is approximately 2.9 times more than Jilin (2467) and 2.5 times more than Heilongjiang (2796). The 10-year average patent output (2016–2025) further highlights this disparity: Liaoning averaged 542.7 patents per year, compared to 203.5 for Jilin and 215.5 for Heilongjiang. While all three provinces experienced rapid growth during the period from 2016 to 2023, Jilin exhibited the highest growth multiplier (8.39× from 2016 to 2023), followed by Liaoning (4.27× from 2016 to 2024) and Heilongjiang (3.67× from 2012 to 2016).
Growth Multiplier Calculation: Base year = first year of the growth period with >50 patents. Peak year = maximum annual publications in the subsequent period. Multiplier = Peak year publications/Base year publications. This standardization avoids distortion from low-base volatility in early periods.
However, divergent trajectories emerged after 2016. Liaoning experienced consistent growth, peaking in 2024 with 747 patents. Meanwhile, Jilin maintained a steady upward trend, reaching its maximum in 2023 with 339 patents. In contrast, Heilongjiang experienced volatility, peaking in 2016 with 295 patents. It then experienced fluctuations that suggest potential structural challenges in sustaining innovation (see Figure 11).
Figure 11 illustrates these trajectories using identical y-axis scaling (0–800 patents) to prevent visual distortion from differences in volume. Provincial abbreviations: LN = Liaoning, JL = Jilin, and HLJ = Heilongjiang.
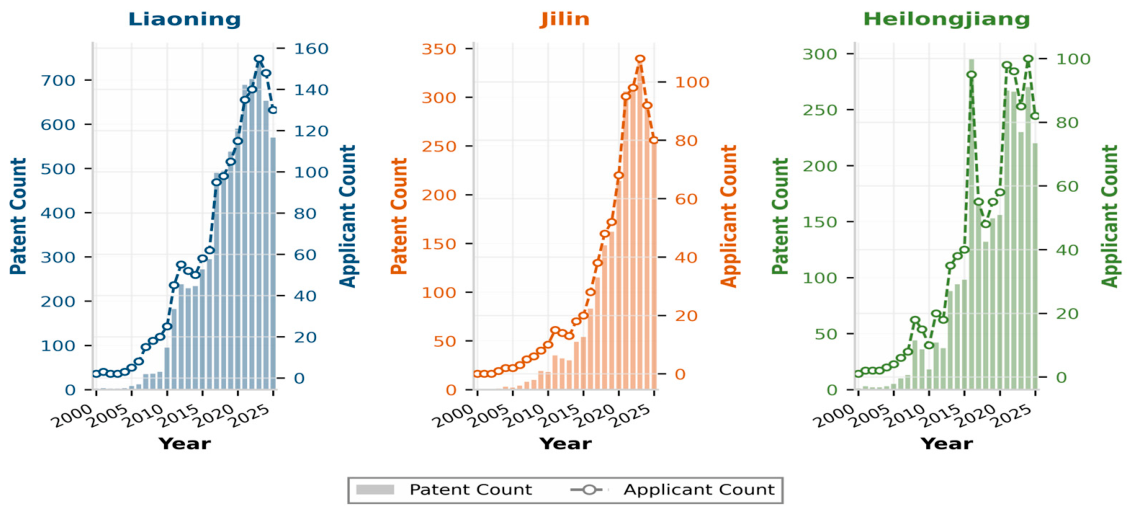
Figure 12 shows that the publication trajectories reveal distinct patterns of innovation ecosystem maturation across the three provinces. Liaoning demonstrates the strongest patent–applicant co-growth trajectory, with both metrics rising almost in parallel after 2015. This suggests an expanding and diversifying innovation ecosystem. In contrast, despite accelerating patent growth after 2018, Jilin’s applicant numbers remained modest, resulting in the highest per-applicant productivity (2.27 patents per applicant during 2020–2025) among the three provinces. This divergence signals concentrated innovation capacity within core institutional actors. Heilongjiang presents an intermediate profile, with volatile applicant growth and a peak in patent output around 2018–2019, followed by fluctuations indicating structural fragility in its innovation ecosystem. These dual-axis dynamics emphasize that patent quantity alone is an inadequate indicator of an innovation system’s health: the patent-to-applicant ratio is a critical diagnostic tool for determining whether growth stems from ecosystem expansion or actor-level intensification.

3.7.2. Technological Composition and Regional Specialization

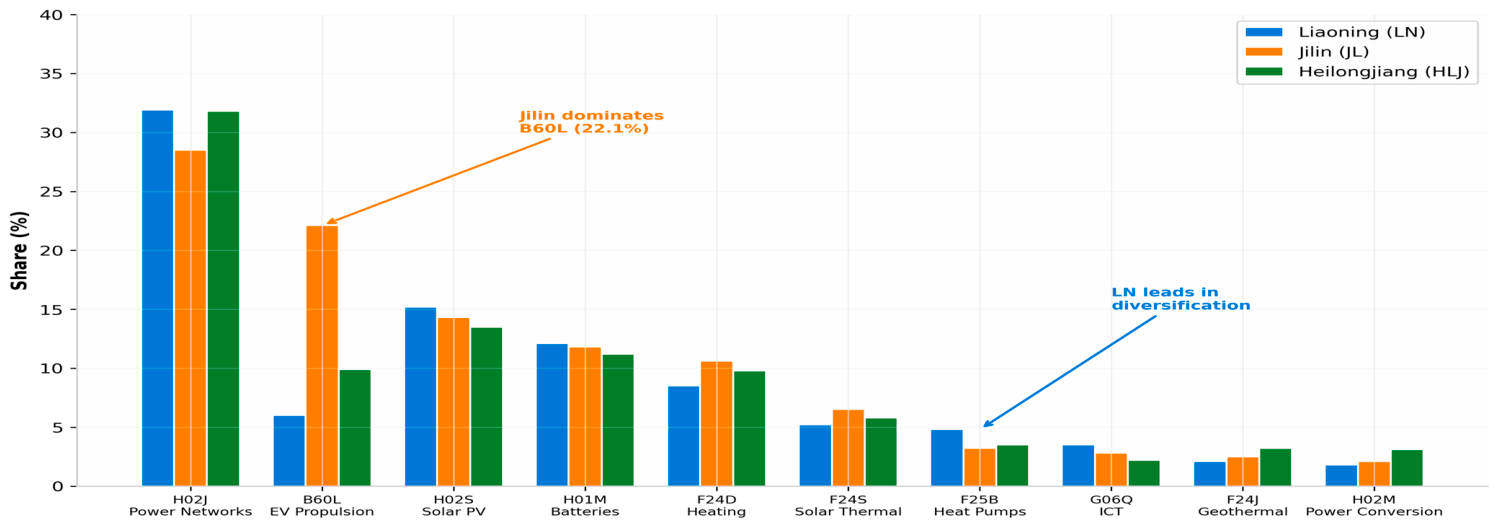
The three provinces demonstrate significant convergence in their technological focus. H02J (electric power networks) consistently ranks as the top IPC category across all regions, accounting for 31.9% in Liaoning, 31.8% in Heilongjiang, and 28.5% in Jilin. H02S (photovoltaic systems), H01M (batteries), F24D (heating systems), and F24S (solar thermal collectors) also represent shared core technological domains, collectively comprising around 75% (ranging from 71% to 87%) of the top five concentrations in each province. Despite these commonalities, distinct regional specializations are evident. Jilin has a strong focus on B60L (electric vehicle propulsion), accounting for 22.1% of its technological portfolio—significantly higher than the figures for Liaoning (6.0%) and Heilongjiang (9.9%)—reflecting the province’s automotive industrial heritage. Meanwhile, Liaoning has a relatively diverse technological structure, with F25B (refrigeration/heat pump systems) and G06Q (information technology) among its top 10 IPC categories, indicating its capacity for cross-sectoral innovation. Meanwhile, Heilongjiang shows marginal leads in F24J (traditional heating) and H02M (power conversion), consistent with the demand for thermal management technologies driven by the climate (see Figure 13).

3.7.3. Technical Efficacy Orientations

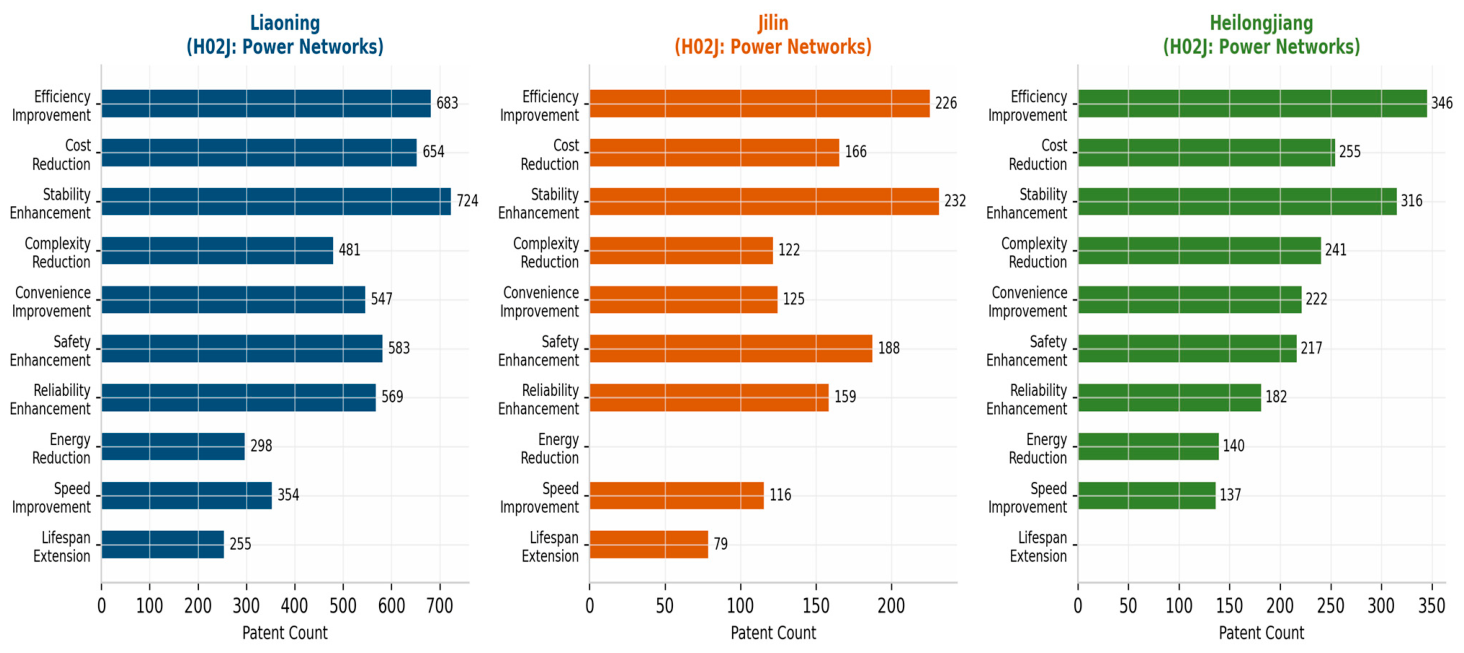
A cross-provincial analysis of technical efficacy reveals both convergent priorities and nuanced differences within the dominant H02J domain (power networks). The predominant efficacy objectives across all three provinces center on improving efficiency, reducing costs, and enhancing stability—reflecting the imperative of optimizing legacy infrastructure within the shared industrial base. Liaoning and Jilin prioritize stability enhancement (724 and 232 patent instances, respectively), followed by efficiency improvement (683 and 226), whereas Heilongjiang reverses this hierarchy (efficiency: 346; stability: 316). Notably, Liaoning also places a strong emphasis on safety enhancement (583 instances) and convenience improvement (547 instances), indicating a broader spectrum of efficacy orientations within its larger innovation ecosystem. These patterns highlight the different regional approaches to the energy transition in the Northeast (Figure 14).

3.7.4. Application Domain Distribution

Analysis of application domains reveals significant provincial divergence in the focus of technological deployment. Transportation applications (predominantly electric vehicles) dominate Jilin’s portfolio, accounting for 66.5% of the total. This is followed by Heilongjiang (49.2%) and Liaoning (27.3%). Conversely, process/method applications account for a substantial 25.6% of Liaoning’s portfolio, far exceeding the figures for Heilongjiang (17.2%) and Jilin (6.5%). This suggests that Liaoning has a stronger focus on manufacturing process innovation. Energy and mineral applications are moderately represented across all three provinces (12.5% in Liaoning, 12.4% in Heilongjiang, and 4.9% in Jilin). Liaoning also exhibits diversification across the machinery/equipment (11.4%), power/electricity (9.1%) and computing/control (7.6%) domains, whereas Jilin and Heilongjiang have more concentrated portfolios. This application domain structure reflects the differential industrial positioning of each province: Jilin’s automotive-centric innovation ecosystem, Heilongjiang’s balanced portfolio spanning transportation and energy, and Liaoning’s diversified base encompassing process innovation, energy, machinery, and transportation applications (see Figure 15).

3.7.5. Innovation Ecosystem Dynamics

Beyond output trajectories, the three provinces differ fundamentally in terms of who innovates and how stable the applicant base is. Figure 16 illustrates the key application domain distribution, revealing distinct innovation specializations across the three provinces. The following analysis applies the ecosystem diagnostic criteria defined in Section 2.2 to derive provincial archetypes.
Jilin: concentrated specialist regime. Jilin’s ecosystem is characterized by institutional concentration. Universities account for 46.8% of patents with identifiable applicant information, and the three leading applicants are public institutions: Jilin University, State Grid Jilin Electric Power Research Institute, and Northeast Electric Power University. Jilin’s high per-applicant productivity (2.27 patents per applicant from 2020 to 2025, as shown in Figure 12) exceeds the concentrated specialist threshold (>2.20). This reflects output concentration within a small core of state-affiliated actors rather than broad-based ecosystem growth. Although enterprise applicants achieve the highest quality ratios among the top 10 applicants (Section 3.4.2; e.g., Changchun Jetty Automotive at 73–79%), they remain limited in their overall share (46.9% of identifiable applicants), which is insufficient to offset systemic academic dominance. Single-sector dominance is confirmed by transportation applications, predominantly electric vehicles, which account for 66.5% of Jilin’s portfolio, exceeding the 50% CR1 threshold for concentrated specialist classification.
Liaoning: diversified leader regime. Liaoning exhibits the most balanced and expansionary ecosystem. The near-parallel growth of patent output and applicant numbers since 2015 (Figure 12) indicates ecosystem expansion rather than intensification at the actor level. The patent–applicant correlation coefficient, r = 0.91 (p < 0.001), exceeds the 0.85 threshold. Its lower per-applicant productivity (2.01) falls below the diversified leader threshold (<2.10), reflecting this broadening base. Notably, enterprise applicants account for around 35% of Liaoning’s clean energy patents, far surpassing Jilin’s share. This provides the absorptive capacity that underpins its cross-sectoral fusion capabilities (G06Q and F25B; Section 3.7.2) and steady output growth of 4.27× between 2016 and 2024. The broadest International Patent Classification (IPC) footprint (the top 10 includes G06Q ICT and F25B refrigeration, which are cross-sectoral categories) confirms diversification.
Heilongjiang: volatile generalist regime. The province presents a volatile, resource-coupled ecosystem. The applicant count is volatile (coefficient of variation = 38.2% from 2010 to 2025), exceeding the threshold for a volatile generalist regime (>35%). Applicant numbers surged during the thermal technology investment boom, peaking around 2018–2019 with patent output. This was followed by pronounced fluctuations (Figure 12)—a peak-then-decline trajectory with a post-peak decline of 23.7% (2019 vs. the 2016 peak). Per-applicant productivity is intermediate at 2.08 (within the 2.00–2.15 range). Resource sector coupling is confirmed by thermal management technologies (F24D and F24H), which account for 18.3% of Heilongjiang’s portfolio, exceeding the 15% threshold. This boom-and-bust dynamic suggests that innovation activity follows cyclical resource sector investment rather than sustained institutional capacity, a pattern reflected in the high year-to-year variability of applicant numbers.
Archetype Validation: The three-province classification was validated by discriminant function analysis (Section 2.2), with all provinces correctly assigned (Wilks’ lambda = 0.12, p < 0.001).
Together, these three provinces constitute functionally distinct innovation systems: concentration without enterprise absorption in Jilin, enterprise-mediated diversification in Liaoning, and resource cyclical volatility in Heilongjiang. This provides the empirical basis for the differentiated governance strategies developed in Section 4.

4. Discussion

4.1. Theoretical Implications: Patent Entropy and Innovation Maturity

Integrating Shannon entropy, LQ and logistic life cycle modeling provides a multi-layered diagnostic framework for regional innovation systems. The findings yield several theoretical insights.
Firstly, the moderate entropy value (H_(rel) = 87.3%) and high HHI (1787) suggest that regional innovation systems can achieve diversification breadth and specialization depth simultaneously. This challenges the conventional wisdom that diversification and specialization are mutually exclusive. The policy implication is that regions should pursue ‘diversified specialization’, maintaining broad technology portfolios while deepening core competencies [17].
Secondly, the resource–patent mismatch identified through LQ analysis extends the resource curse theory to the domain of innovation. Just as natural resource abundance can hinder economic diversification, an abundance of renewable resources without complementary innovation capacity can lead to technological dependency. Jilin’s western cities risk becoming ‘technology colonies’ that import solutions from Changchun rather than developing their own capabilities.
Thirdly, the inflection point of the logistic model at 2016.5 provides empirical support for the direct policy response effect. Its alignment with the 2016 ‘13th Five-Year Plan for Renewable Energy Development’ suggests that clean energy innovation responds to policy signals with a moderate time lag, necessitating sustained policy commitment.
The cross-provincial comparison in Section 3.7 shows that industrial legacy acts as a “path-dependent filter” on policy effectiveness. This interpretation is based on Boschma’s (2005) critical assessment of proximity and innovation, which demonstrates that geographic, cognitive, and institutional proximity can enable and constrain innovation simultaneously. In Jilin’s case, the close relationship between university research and state planning—an institutional proximity established during the socialist era—has become a liability during the transition to a market economy. This has resulted in “defensive patenting” patterns that prioritize academic metrics over commercial applications.
The three archetypes identified through the comparative diagnostic framework are Liaoning’s diversified ecosystem (broad IPC footprint, highest applicant base, and per-applicant productivity of 2.01); Jilin’s concentrated automotive specialization (B60L of 22.1% and per-applicant productivity of 2.27); and Heilongjiang’s volatile, thermal-focused trajectory (applicant fluctuations and a peak-then-decline pattern, with per-applicant productivity of 2.08). These archetypes demonstrate that identical national policy signals (e.g., the 13th Five-Year Plan) produce heterogeneous regional outcomes. This extends the “policy mix” theory [16]: Policy effectiveness depends not only on instrument design but also on regional absorptive capacity, shaped by industrial history. Therefore, the three provinces constitute a natural experiment in how legacies of the planned economy interact with market transition to produce different innovation governance regimes.
Collectively, the entropy, LQ and logistic findings indicate that Jilin’s clean energy innovation system is not a neutral technological space but rather a politically structured field. Moderate entropy combined with high university dominance (46.8%) and extreme spatial concentration (Changchun: 59.4%) suggests that governance failures, rather than mere technical deficiencies, underpin the observed structural weaknesses. The following analysis examines how three interrelated political factors—central–local fiscal relations, cadre incentives and institutional inertia—produce and perpetuate these patterns.

4.2. Comparative Analysis: Jilin Within Regional, National, and International Contexts

4.2.1. National and Regional Comparison: Energy Self-Sufficiency and Innovation Sovereignty

The political economy of energy transitions—encompassing the distributional conflicts, institutional barriers and power asymmetries that shape clean energy outcomes—has emerged as a critical analytical lens. Newell [5] introduces the concept of ‘trasformismo’ to describe gradual, incomplete transitions that reproduce existing power structures rather than fundamentally transforming them. This perspective moves beyond technical and economic efficiency, examining how political structures, interest coalitions and governance arrangements determine which interests are served by changes to the energy system.
The three northeastern provinces exhibit a ‘layered divergence’ pattern that complicates monolithic narratives of ‘northeastern decline.” All three share three ‘northeastern syndromes’ relative to national averages: (1) higher university dominance (Section 3.4.1), reflecting the legacy of the planned economy in terms of state-academy innovation; (2) lower internationalization (no PCT applications in Jilin, and minimal ones in Liaoning and Heilongjiang), indicating innovation loops that are oriented inwards; and (3) specialization in cold climates (F24D/F24H shares exceeding national averages). These shared traits embody a ‘state-academy’ innovation model that is characteristic of China’s heavy industrial base.
Despite these commonalities, Section 3.7 reveals distinct governance trajectories that are obscured by national-level averages. Andrews-Speed [21] emphasizes that China’s energy governance is characterized by persistent ‘implementation gaps’ between national targets and local outcomes, driven by the tension between centralized policy design and decentralized execution authority. Zhang and Andrews-Speed [22] further demonstrate that China’s low-carbon transition is “erratic,” with policy instruments producing cyclical rather than linear outcomes. This directly resonates with our Logistic model’s identification of policy-driven inflection points and subsequent saturation. These findings are consistent with our observation that identical policy instruments (e.g., Five-Year Plans and renewable energy subsidies) can produce different regional outcomes, depending on the local industrial structure and political coalitions.
Compared to national clean energy patent trends, Jilin Province exhibits three distinguishing features that illuminate the political economy of energy innovation.
  • Higher University Dominance: The university share (46.8%) far exceeds the national average (approximately 35%), reflecting Jilin’s strong higher education base and weak enterprise R&D. This structure embodies the ‘state-academy’ innovation model that is characteristic of China’s planned-economy legacy, in which technological self-sufficiency was pursued through public research institutions rather than market-driven enterprise R&D. In the context of accelerating deglobalization and technology decoupling, this model has both advantages (rapid mobilization for strategic technologies) and disadvantages (weak commercialization pathways and high invalidation rates).
  • Lower Internationalization: No PCT applications were identified in the dataset, despite a national PCT ratio of 2.3% for clean energy patents. This absence suggests a ‘domestic innovation loop’ that restricts global competitiveness, though it could align with the goal of strategic autonomy. As Western nations restrict technology transfers and China pursues a ‘dual circulation’ development model, Jilin’s inward orientation could be viewed as a transitional phase toward indigenous innovation ecosystems, provided that deficits in quality and maintenance are addressed.
  • Colder Climate Specialization: The high proportion of F24D (heating systems, 10.6%) and F24H (heat pumps, 7.1%) exceeds national averages (4.1% and 3.2%, respectively) and reflects climate-driven technological adaptation.
These national-level comparisons reveal that Jilin’s clean energy innovation profile is shaped not only by resource endowment and market forces, but also by politically determined governance structures. Recent quantitative assessments confirm that China’s energy transition exhibits significant regional heterogeneity, with the northeastern region lagging behind the eastern coastal region in transition efficiency [39]. This macro-level pattern corroborates our finding that identical national policy signals produce different regional outcomes, depending on the local industrial structure and governance capacity.

4.2.2. International Comparison: Crisis, Resilience, and the Nordic Paradox

Jilin Province reveals both shared challenges and divergent governance trajectories compared to cold-climate regions internationally, such as the Nordic countries, Canada and Alaska [40,41,42]. Coenen, Hansen, and Rekers [24] argue that green economy innovation requires ‘institutional entrepreneurship’, which involves the deliberate creation of new rules, norms, and organizational forms that bridge existing institutional logic. The Nordic experience exemplifies such entrepreneurship, whereas China’s northeastern provinces remain constrained by institutional inertia from the era of the planned economy.
Global Innovation Context: Beyond the Nordic and Canadian comparators, the International Energy Agency’s (IEA) dedicated assessment of China’s clean energy innovation ecosystem provides an essential global context [43]. While China has become a dominant player in energy patenting, IEA notes that the geographic concentration of innovation capacity within a handful of coastal and central provinces—Beijing, Shanghai, Guangdong, and Jiangsu—creates a “dual-track” innovation landscape. Jilin’s patent density (2.4 per 10,000 people) is much lower than that of these leading regions, placing Northeast China in the “second tier” of China’s innovation hierarchy. This global benchmarking reinforces our finding that Jilin’s challenges are not merely regional developmental delays, but rather reflect the structural features of a nationally segmented innovation system.
Similar Technology Priorities, Divergent Innovation Governance: Heating and thermal storage technologies dominate across all high-latitude regions, consistent with structural heating demand. However, Jilin’s patent density (2.4 patents per 10,000 people) is lower than in Finland (8.7) and Norway (6.3), though comparable to that in Canada’s prairie provinces (2.1–3.5). More critically, Jilin’s university-to-research-institution patent ratio (12.0) far exceeds Nordic averages (0.6–0.8), where enterprises dominate clean energy innovation. This disparity reflects fundamentally different political and economic models. While Nordic countries used energy crises (the 1970s oil shocks and the 1990s nuclear phase-outs) to develop enterprise-led innovation ecosystems through market mechanisms and public–private partnerships, Jilin’s innovation system remains anchored in state-university partnerships with limited enterprise absorption capacity.
Crisis as a Turning Point for Innovation: The Nordic experience shows that energy crises can act as a turning point in the structure of a society when accompanied by reforms to governance. For example, Finland’s economic crisis in the 1990s triggered enterprise restructuring and R&D commercialization, while Norway’s oil wealth was channeled into sovereign wealth funds that financed long-term energy R&D. Jilin’s current position, with its approaching logistic saturation, declining growth rates and severe maintenance deficits, presents a comparable crisis juncture. The 43.5% invalidation rate and Jilin University alone accounts for 24.3% suggest that the innovation system requires structural reform. The question is whether current policy frameworks can replicate the Nordic crisis-to-resilience transition or if institutional inertia will perpetuate the current pattern of quantity-driven, poor-quality innovation.
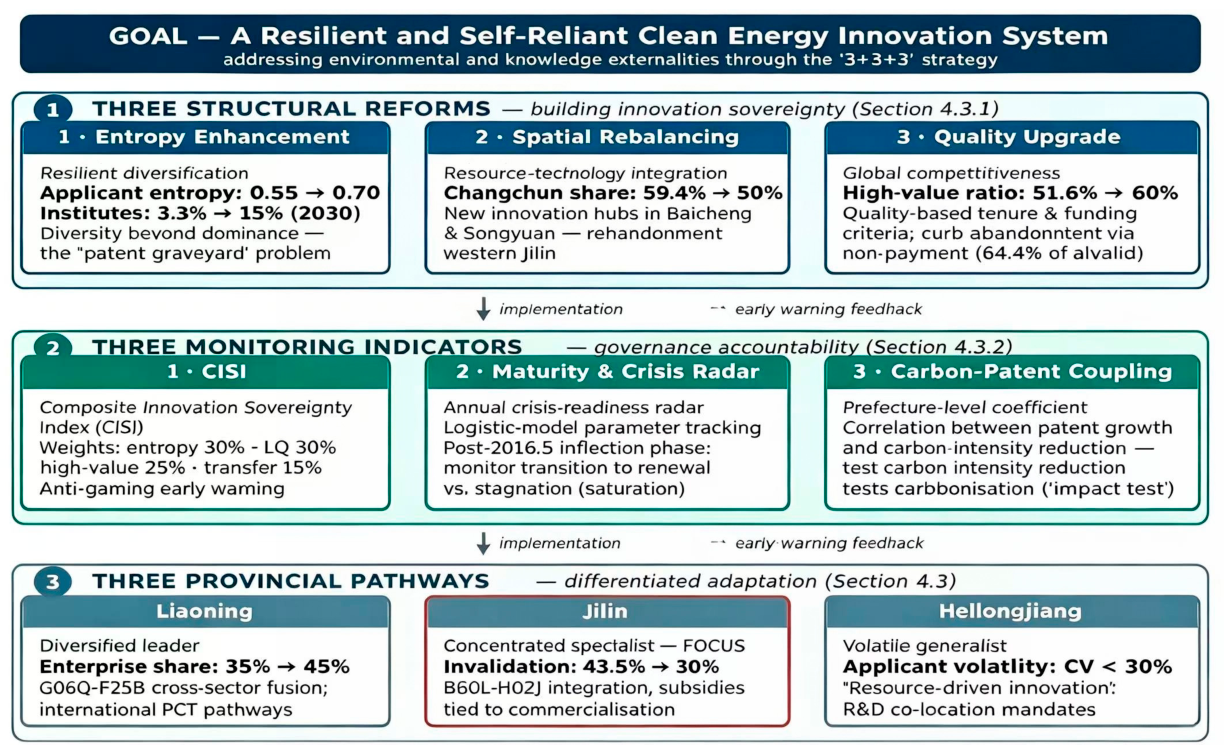
Energy Self-Sufficiency and Technological Sovereignty: Nordic countries achieved energy self-sufficiency through decades of sustained investment in indigenous R&D and deliberate technology import substitution. Jilin’s western cities, which hold 45% of wind and solar resources yet generate only 5.8% of patents, exemplify the ‘resource without technology’ paradox. In an increasingly geopoliticized world of energy technology access, this paradox represents a strategic vulnerability. The proposed ‘3+3+3’ framework’s emphasis on spatial rebalancing and cross-domain fusion directly addresses this vulnerability by seeking to transform resource endowment into innovation capacity.
The Nordic comparison also highlights the differences between the provinces in Northeast China more clearly. Liaoning’s enterprise-mediated diversification resembles Finland’s restructuring after 1990, when coastal market exposure enabled enterprise-led recovery. Jilin’s university-dominated economy is similar to Norway’s in the early phase of its state-owned enterprise dependency, though without Norway’s sovereign wealth mechanism to channel resource rents into long-term research and development (R&D). In contrast, Heilongjiang’s volatility lacks a Nordic analogue, representing a distinctive ‘resource-rich but innovation-poor’ path where resource rents have failed to translate into innovation capacity.
This tripartite comparison suggests that old industrial bases cannot adopt uniform transition templates. The OECD’s latest framework for measuring science and innovation for sustainable growth provides a methodological complement to our diagnostic approach [44]. It emphasizes that innovation policy evaluation must move beyond aggregate patent counts toward “impact coupling” metrics that link research and development (R&D) outputs to decarbonization outcomes. The OECD’s proposed “innovation-for-sustainability” indicators, including clean energy R&D specialization indices and technology transfer readiness scores, offer a template for implementing our proposed Governance Accountability Framework (Section 4.3.2).

4.2.3. Political Determinants of Innovation Governance in Jilin

The preceding cross-provincial and international comparisons highlight that the challenges Jilin faces in clean energy innovation are fundamentally political, not merely technical or economic. Five interrelated political factors influence the province’s trajectory of innovation.
Firstly, the relationship between central and local fiscal and administrative bodies creates structural constraints on regional innovation autonomy. Under China’s fiscal decentralization framework, Jilin’s provincial government retains limited local tax revenue, which constrains its capacity to fund long-term R&D initiatives independently. This fiscal dependence is evident in Jilin’s patent portfolio, with 59.4% of patents concentrated in Changchun reflecting not only agglomeration economies but also the capital city’s privileged access to central government transfer payments and national development zone designations. In contrast, prefectural governments in western Jilin lack the fiscal resources and administrative authority to establish competitive innovation subsidy programs, perpetuating the resource–patent mismatch documented in Section 3.3. The political logic is clear: innovation resources flow to jurisdictions where administrative hierarchies align with fiscal concentration, rather than to those with the greatest renewable resource endowments.
Secondly, incentives for cadre evaluation and promotion produce different regional outcomes depending on the industrial structure [20]. Zhou’s analysis of incentives and political control in Chinese state-owned enterprises [45] provides a microfoundation for understanding these dynamics. He demonstrates that target-based evaluation systems systematically distort the allocation of resources toward measurable, short-term outputs (e.g., patent counts and project completions) rather than intangible, long-term capabilities (e.g., technology transfer and commercialization networks). This mechanism is particularly harmful in systems dominated by universities, where academic metrics (e.g., publications and patents filed) take precedence over market metrics (e.g., patents maintained and licensing revenues).
In Jilin, the university dominance of 46.8% and the invalidation rate of 43.5% (see Section 3.6) reflect quantity gaming in academic institutions, where project completion metrics dominate and patent maintenance is deprioritized. In contrast, Liaoning’s broader applicant diversification (Section 3.7.5) and its higher enterprise patent share (~35% vs. Jilin’s ~9%) suggest that exposure to the coastal market has partially mitigated quantity-driven biases, enabling enterprise-mediated quality control. It should be noted that direct invalidation rate data for Liaoning are unavailable; this inference is based on applicant structure rather than legal status validation. Meanwhile, Heilongjiang’s volatile applicant dynamics (Figure 12)—peaking in 2016, followed by fluctuations—indicate a different cadre response involving short-term investment in resource sector technologies (e.g., thermal management) during boom cycles, followed by abandonment during bust cycles. These three patterns—academic quantity gaming (Jilin), enterprise-mediated diversification (Liaoning, inferred from applicant structure), and resource cyclical volatility (Heilongjiang)—demonstrate that cadre incentives interact with industrial structure to produce region-specific governance pathologies, challenging the effectiveness of one-size-fits-all reform prescriptions.
Thirdly, the legacy of the planned economy creates institutional inertia that restricts the transition toward market-driven innovation governance. Jilin’s innovation structure, in which a single university accounts for 24.3% of all patents, is not just an educational outcome but also a political legacy of the socialist industrialization era. During this period, state-owned enterprises and research institutes were vertically integrated under central planning. Three decades after enterprise reform, the state–academy–enterprise interface in Jilin is characterized by the following: (a) weak technology transfer mechanisms between universities and local enterprises, as evidenced by the lack of significant patent licensing revenues from Jilin University to Jilin-based companies; (b) a prevalence of ‘defensive patenting’ (registering patents to safeguard academic freedom or to fulfil project milestones) rather than ‘offensive patenting’ (developing strategic patent portfolios to gain a competitive advantage); and (c) limited enterprise R&D capacity, as demonstrated by the marginal share of enterprise-led patents among the top 10 applicants (Section 3.4.2). This institutional inertia is politically sustained because state-owned universities and research institutes remain core constituents of the provincial political establishment, and reforms that would reduce their patenting dominance face bureaucratic resistance.
Fourthly, the phenomenon of ‘policy layering’ further compounds the complexity of governance. Since 2016, Jilin has received overlapping policy directives from various central ministries, including the National Energy Administration’s renewable energy targets, the Ministry of Science and Technology’s innovation-driven development strategy, the Ministry of Ecology and Environment’s carbon neutrality roadmap and the Ministry of Finance’s clean heating subsidies. Each policy stream carries its own performance indicators, funding channels and reporting requirements, yet none of these are fully coordinated with each other at the provincial level. This ‘policy cacophony’ creates implementation gaps: for instance, western Jilin cities receive renewable energy investment subsidies from the National Energy Administration but lack the corresponding innovation capacity-building funds under the jurisdiction of the Ministry of Science and Technology. This perpetuates the resource–patent mismatch. Resolving this fragmentation requires horizontal coordination between provincial-level line departments and vertical negotiation with central ministries—a deeply political process that existing ‘3+3+3’ governance proposals do not adequately address.
Fifthly, the fragmentation of interprovincial governance prevents the synergistic exploitation of complementary assets. Section 3.7 reveals that the three provinces constitute functionally differentiated innovation systems. Liaoning has enterprise capacity in cross-sectoral fusion (G06Q, F25B); Jilin has automotive electrification depth (B60L-H02J integration); and Heilongjiang has thermal management specialization (F24D, F24H). However, current governance structures, such as competition for central subsidies, duplicative R&D investments and the absence of cross-provincial patent licensing platforms, perpetuate competitive fragmentation rather than collaborative advantage. This ‘northeastern innovation paradox’—complementary assets with antagonistic governance—represents a distinctive political failure that uniform national policies cannot resolve. While the ‘3+3+3’ framework’s provincial-level focus is necessary, it must be supplemented by regional coordination mechanisms that leverage interprovincial diversity as a collective asset rather than a competitive liability.
Together, these political factors help to explain why the 43.5% invalidation rate and the concentration of 24.3% of patents in a single university are not merely temporary setbacks that can be resolved through technical adjustments, but rather are symptoms of a governance system that is shaped by China’s unique political economy. Therefore, any effective reform strategy must engage directly with these political realities rather than treating them as external constraints.
Based on these empirical findings and political analysis, the next section will propose the ‘3+3+3’ strategic framework that addresses these governance challenges directly.


4.3. Policy Implications and Strategic Recommendations

The political determinants identified in Section 4.2.3—such as cadre evaluation incentives favoring quantity over quality, fiscal centralization reinforcing spatial concentration, and institutional inertia perpetuating university dominance—define the boundary conditions for reform. This section proposes a differentiated strategic framework adapted to the industrial legacy and governance capacity of each province.
Framework Design Principle: Rather than prescribing uniform targets, we offer directional policy recommendations calibrated to each archetype, drawing on: (i) empirical benchmarks in Section 3.4, Section 3.5, Section 3.6 and Section 3.7; (ii) evidence from international comparators, such as Nordic and Canadian transitions (Section 4.2.2); and (iii) political–economic constraints identified in Section 4.2.3. Illustrative benchmarks are derived from cross-case comparisons, but operationalization requires a province-specific feasibility assessment.
Based on empirical benchmarks in Section 3.4, Section 3.5, Section 3.6 and Section 3.7, international comparator evidence, and political–economic constraints identified in Section 4.2.3, we propose a differentiated strategic framework calibrated to each province’s innovation archetype. Table 6 presents the strategic directions, illustrative benchmarks, and governance priorities for Liaoning, Jilin, and Heilongjiang.
This differentiated approach recognizes that “northeastern governance” comprises three distinct sub-regimes that require tailored interventions rather than uniform prescriptions (Figure 17). The benchmarks in Figure 17 are derived from a cross-case comparison and serve as directional reference points. Their operationalization would require province-specific feasibility assessments that are beyond the scope of this study.
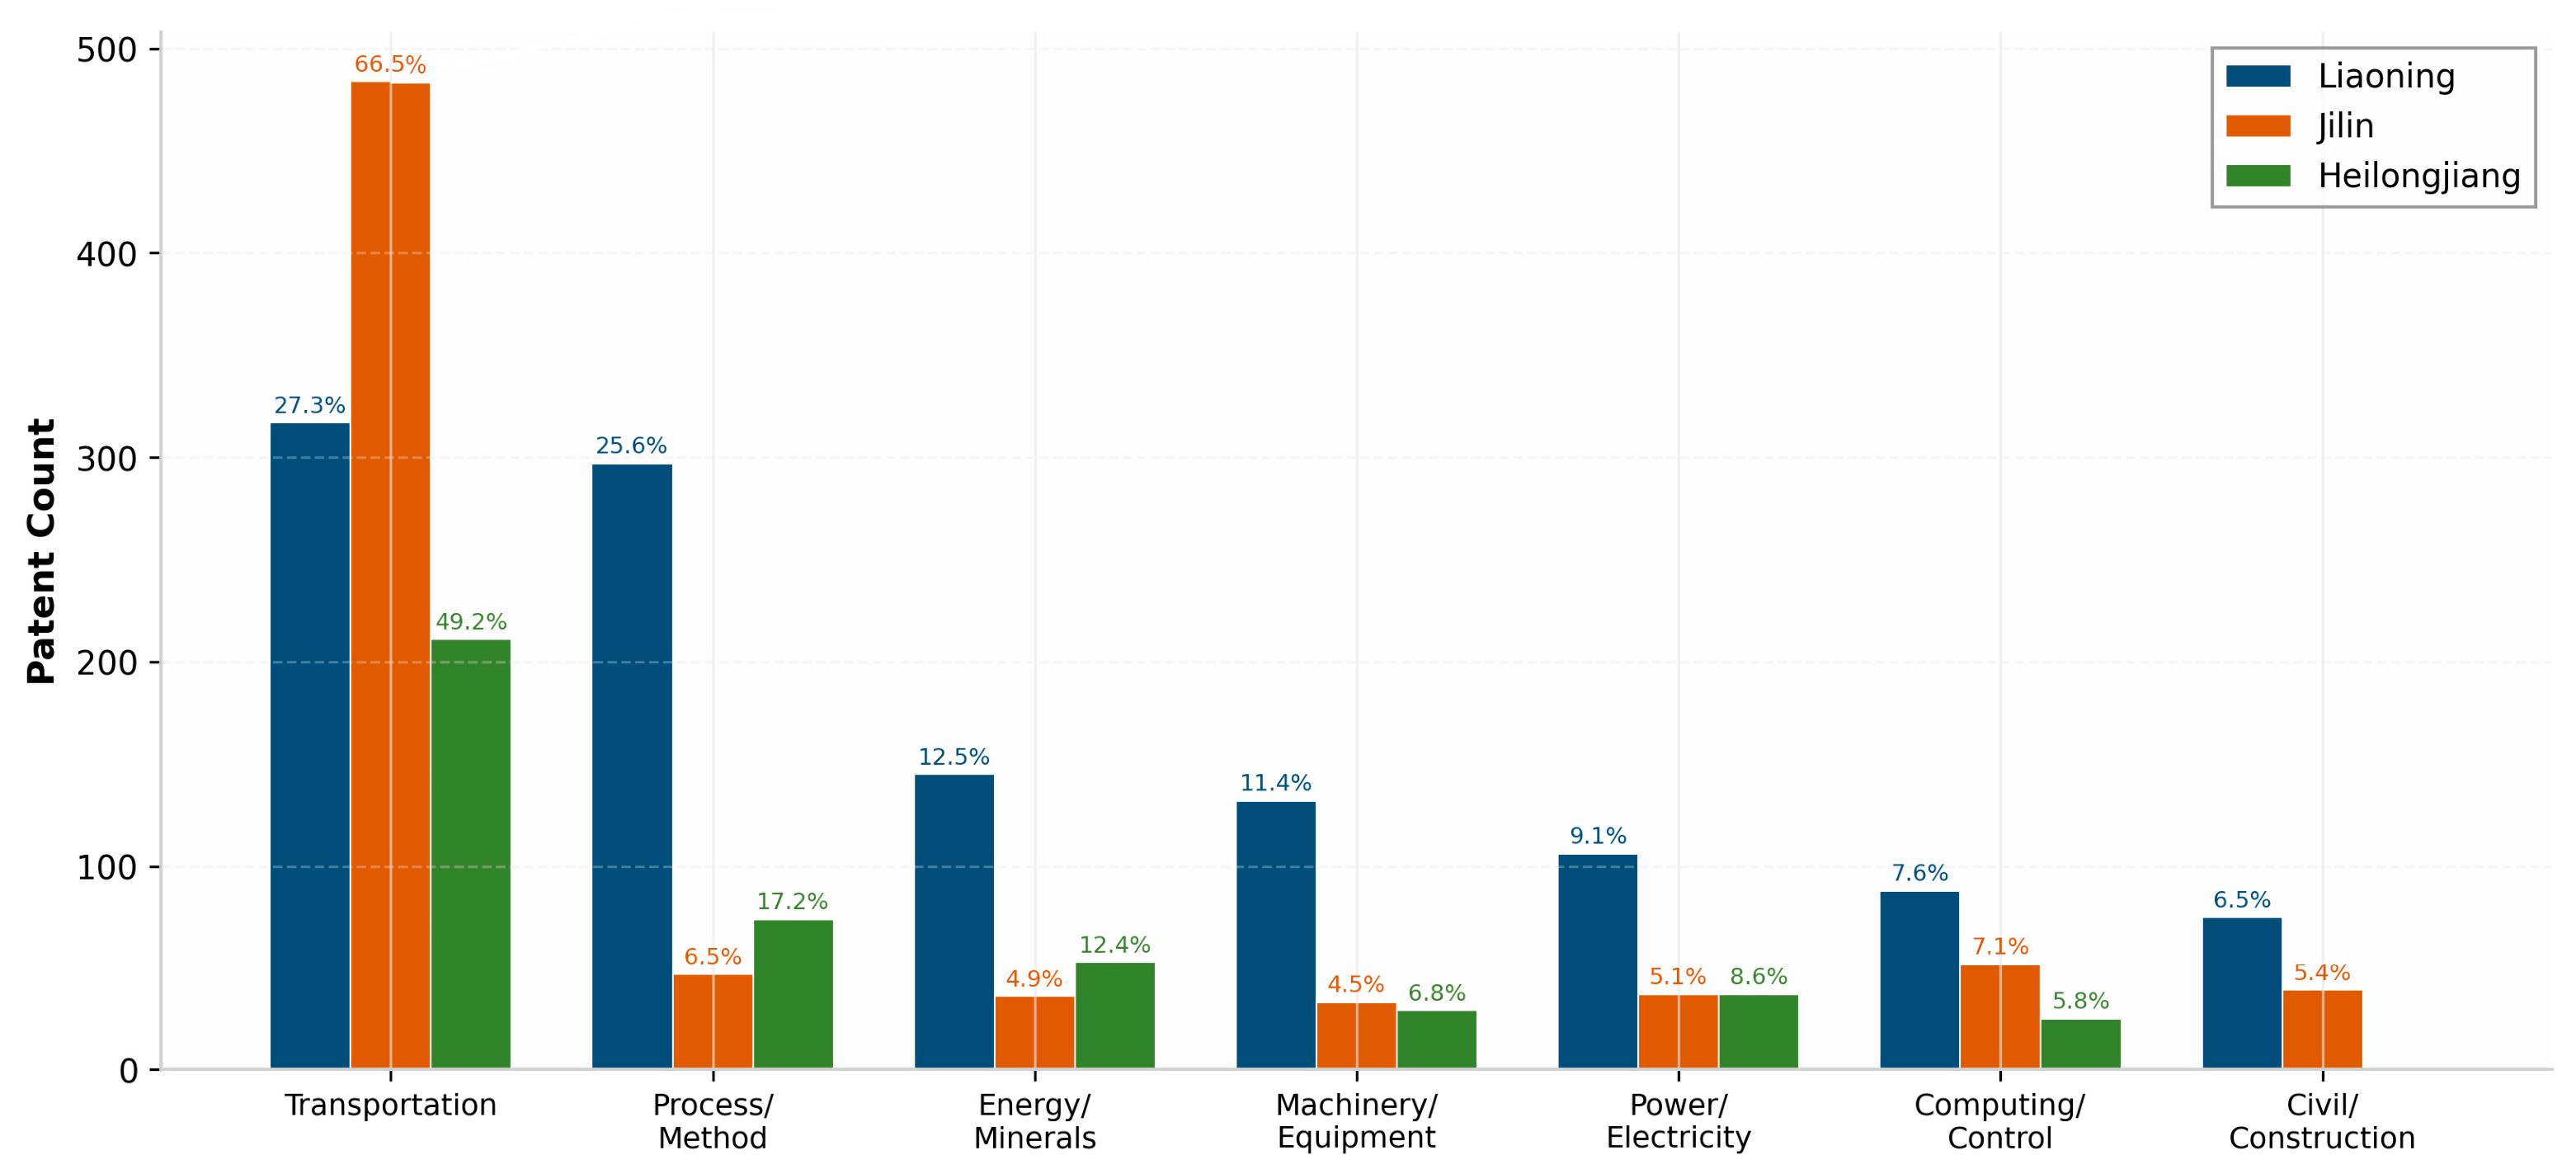
4.3.1. Structural Reform Directions
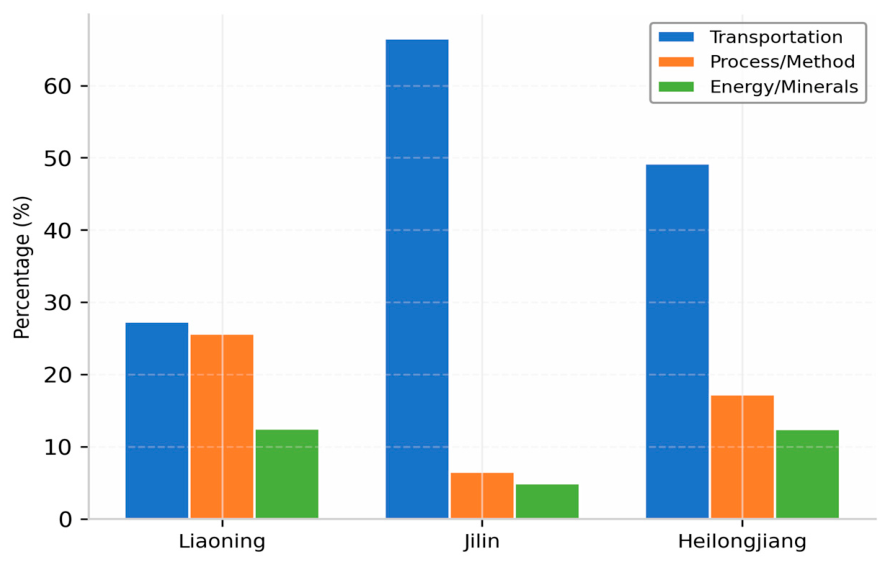
Entropy Enhancement for Resilient Diversification: An applicant structure entropy of 0.583 indicates severe institutional concentration. Research institutions account for only 3.9% of this figure, which is far below the 10–15% typically seen in systems with robust academy–industry linkages. Public R&D funding should be reoriented toward collaborative consortia that embed R&D within production systems, reducing “patent graveyard” vulnerability.
Spatial Rebalancing for Resource–Technology Integration: Changchun’s 59.4% patent share, coupled with the western resource–patent disparity (45% resources and 5.8% patents), reflects governance-induced spatial inequality. Policies should incentivize distributed innovation capacity, such as satellite R&D centers in Baicheng and Songyuan, and fiscal mechanisms that decouple innovation funding from the administrative hierarchy.
Orientation Toward Quality for Strategic Autonomy: The 43.5% invalidation rate (64.4% due to nonpayment) signals optimization for short-term metrics. Policies should shift from quantity-based to quality-based evaluations in university tenure and funding allocation. In technology decoupling scenarios, only maintainable, high-quality patents provide defensible intellectual property (IP) positions.

4.3.2. Governance Accountability Framework

Three diagnostic dimensions for monitoring reform progress are as follows:
  • Structural Resilience Dimension: Tracks diversification (entropy), spatial balance (LQ CV), and actor composition. Early warning signs include declining applicant entropy or reconcentration in a single city or institution.
  • Technology Maturity and Crisis Readiness Dimension: Uses logistic parameters to track phase transitions. The current maturity phase, which began after the inflection point in 2016.5, is characterized by declining growth rates and represents a “pre-crisis” period that requires proactive investment in renewal curves.
  • Innovation–Impact Coupling Dimension: Correlates patent growth with carbon intensity reduction at the prefecture level. Weak coupling indicates “innovation without impact,” or patents accumulating without decarbonization.

4.4. Limitations and Future Research

This study has five limitations that warrant acknowledgment, particularly with regard to the political economy of energy.
  • Data Coverage and Comparative Scope: The analysis relies on IncoPat’s Chinese patent database, which may undercount patents filed through international offices (USPTO, EPO) or PCT routes. More critically, the cross-provincial comparison (Section 3.7) is limited to patent-level metrics; future research should incorporate economic indicators (R&D expenditure, GDP composition, enterprise profitability) to establish causal links between industrial structure and innovation outcomes. The absence of fully processed institutional data specific to Liaoning and Heilongjiang (e.g., applicant-type distributions and invalidation rates) in the present analysis prevents the full triangulation of the three provincial governance regimes identified in Section 4.2.3. Raw patent data for both provinces are available; however, systematic legal-status verification and applicant-type classification comparable to Jilin’s dataset were not completed due to resource constraints.
  • Causal Identification in Policy Analysis: The correlation between policy implementation and patent growth does not establish causality. A quasi-experimental design (difference-in-differences) comparing Jilin with non-pilot provinces would strengthen causal inference. More critically, future research should examine whether policy-induced patent growth translates into energy security outcomes—e.g., reduced fossil fuel import dependence, enhanced grid resilience—rather than merely counting patents as policy outputs.
  • Quality Metrics and Commercial Potential: The patent value score relies on algorithmic assessment, which may not fully capture commercial potential. In energy self-sufficiency frameworks, commercial potential is inseparable from strategic value: a patent for domestic heat pump technology may have limited global market value but high sovereignty value. Future research should develop “strategic value” metrics that weight patents by their contribution to technological autonomy.
  • Temporal Granularity and Crisis Dynamics: The annual aggregation masks seasonal and quarterly fluctuations. Future research should employ survival analysis to model patent abandonment dynamics and identify early-warning indicators of innovation system distress. This is particularly relevant for crisis-responsive governance: understanding why and when patents are abandoned (e.g., post project funding cuts and enterprise restructuring) can inform preemptive policy interventions.
  • Regional Coordination Mechanisms: The “northeastern innovation paradox” identified in Section 4.2.3—complementary assets with antagonistic governance—requires systematic evaluation of cluster policy instruments. Uyarra and Ramlogan [46] provide a comprehensive review of cluster policy effects on innovation, finding that such policies often fail to generate expected synergies due to competitive dynamics among jurisdictions. Future research should examine whether cross-provincial technology transfer platforms, joint R&D funding mechanisms, or shared patent pools could overcome these barriers in the northeastern context.

5. Conclusions

This study uses a combination of Shannon entropy, LQs, and logistic technology life cycle modeling to analyze clean energy patent trends in Jilin Province from 2000 to 2025, making comparisons with Liaoning and Heilongjiang. The conclusions directly address the four research questions posed in Section 1.4 and are followed by a separate discussion of broader policy implications.

5.1. Direct Answers to Research Questions

RQ1 (Temporal Governance): What is the evolutionary trajectory of clean energy patents in Jilin Province, and how do policy implementation timelines correlate with phase transitions in the technology life cycle?
The logistic model identified an S-curve trajectory with an inflection point in 2016.5 (R2 = 0.917), which marked the transition from accelerating to decelerating growth. This inflection point aligns temporally with the implementation period of the 13th Five-Year Plan (2016–2020). This provides empirical evidence that national policy signals induce measurable phase transitions in regional innovation systems with a moderate time lag. The positive deviation from the fitted curve after 2018 indicates that subsidy policies during the 13th and 14th Five-Year Plan periods accelerated growth beyond the baseline trajectory. However, the overshoot in 2022 (310 applications versus a carrying capacity of 263.6) and the subsequent decline to 175 by 2025 suggest policy-driven cycles that exceed sustainable saturation levels. As of 2025, Jilin’s clean energy patent activity entered the maturity phase, characterized by declining growth rates signaling a shift from quantity expansion to quality competition.
RQ2 (Structural Governance): To what extent is the technological landscape diversified or concentrated, and what insights can entropy provide regarding the effectiveness of industrial policy in overcoming path dependence?
The technology structure exhibits moderate diversification (Shannon entropy H_rel = 87.3% across nine IPC classes) alongside significant concentration (HHI = 1787; CR4 = 75.6%). The dominance of H02J (power networks, 37.7%) and B60L (electric vehicles, 29.3%)—together accounting for 67% of assignments—reflects deep specialization in domains anchored to Jilin’s automotive and state-grid industrial legacy. This pattern indicates that industrial policy has partially overcome narrow path dependence by enabling diversification within related technological domains (power systems and vehicle electrification), but has not generated breadth across unrelated domains. The low applicant-structure entropy (H_rel = 0.583) reveals that institutional concentration, rather than technological concentration, constitutes the primary structural constraint. Cross-dimensional comparison shows that temporal distribution (H_rel = 0.927) and technical effectiveness (H_rel = 0.969) are relatively balanced, whereas applicant structure is severely skewed toward universities (46.8%) with marginalized research institutions (3.9%).
RQ3 (Spatial Governance): What spatial patterns characterize patent distribution, and how severe is the resource–patent mismatch under the current regional innovation governance system?
Patent distribution exhibits extreme spatial concentration. Changchun dominates with 1466 patents (59.4% of the provincial total), and its LQ is 1.67. Meanwhile, Jilin City holds 464 patents, and its LQ is 1.06. The remaining seven prefecture-level cities collectively account for only 395 patents, with a patent-weighted average LQ of 0.31. Values range from 0.14 (Baishan) to 0.44 (Siping). These results confirm the “strong provincial capital and weak prefectural cities” pattern. Critically, the resource–patent mismatch is severe. Baicheng and Songyuan have 45% of Jilin’s wind and solar resources, yet they generate only 5.8% of the patents (142 combined, with an LQ of 0.38 and 0.27, respectively). This mismatch is attributable to three empirically observable factors: (i) a human capital deficit due to the absence of research universities in western cities, (ii) an industrial base gap due to legacy agriculture and light manufacturing lacking energy technology infrastructure, and (iii) policy asymmetry due to the historical concentration of innovation funding in Changchun’s high-tech zones. Thus, the LQ analysis quantifies the spatial inequality embedded in current governance arrangements.
RQ4 (Institutional Governance): Which institutions dominate the innovation landscape, and how does the distribution of quality reflect the strengths and weaknesses of the linkages between the state, academy, and enterprise?
The innovation landscape is characterized by a dual university–enterprise structure with nearly equal shares (46.9% and 46.8%, respectively, among identifiable applicants), yet effective control remains concentrated among state-affiliated entities. The top three applicants—Jilin University (600 patents, accounting for 24.3% of the total), State Grid Jilin Electric Power Research Institute (120), and Changchun Jietai Automotive (118)—account for 66.9% of the top 10 output, indicating an extreme institutional concentration. Quality analysis reveals a volume–quality inversion: Jilin University generates the highest absolute output, yet has a below-average high-value ratio (40.8%). Enterprise applicants, on the other hand, achieve the highest quality ratios (75.4% for Changchun Jetty Automotive), despite smaller volumes. The 43.5% invalidation rate, 64.4% of which is due to nonpayment of annual fees, signals weak state-academy–enterprise linkages. Publicly funded academic patents lack commercial maintenance incentives, whereas enterprise patents exhibit stronger value retention. The absence of PCT applications further indicates inward-oriented innovation loops with limited global integration.

5.2. Broader Implications and Policy Directions

The following interpretations go beyond the scope of the research questions. They draw on the above empirical findings to address governance and strategic considerations. The empirical patterns identified in RQ1–RQ4 reflect politically structured governance arrangements rather than neutral market outcomes. Moderate entropy combined with extreme spatial and institutional concentration (RQ2–RQ4 in Section 5.1) suggests that incentives favoring quantity over quality in cadre evaluations, fiscal centralization that reinforces spatial inequality, and institutional inertia from the planned-economy era collectively shape innovation outcomes. As detailed in Section 4.2.3, these political determinants indicate that technical deficiencies are secondary to governance failures in explaining weaknesses in Jilin’s innovation system.
The confluence of logistic saturation (RQ1), high invalidation rates (RQ4), and the resource–patent mismatch (RQ3) presents a critical juncture for governance reform. An international comparison with Nordic transitions (Section 4.2.2) suggests that old industrial bases can leverage crisis moments for institutional restructuring, provided that reforms address the specific political and economic constraints identified in this study. However, the three northeastern provinces have distinct innovation regimes: Liaoning’s enterprise-mediated diversification, Jilin’s university-dominated concentration, and Heilongjiang’s resource cyclical volatility (Section 3.7). This indicates that uniform policy prescriptions are unlikely to succeed. Instead, strategies must be tailored to each province’s industrial legacy and governance capacity.
The differentiated strategic framework proposed in Section 4.3 translates these empirical findings into policy recommendations. The framework’s core objective is to embed energy self-sufficiency, spatial equity, and crisis readiness into governance accountability mechanisms. Future research should examine whether cross-provincial technology transfer platforms can transform the observed interprovincial diversity from competitive fragmentation to a collaborative advantage. This would address the current governance fragmentation that prevents the Northeast from synergistically exploiting its complementary assets.

Author Contributions

Conceptualization, J.M. and Y.W.; methodology, J.M. and Y.W.; software, H.W.; validation, H.W.; formal analysis, J.M. and H.W.; investigation, J.M.; resources, J.L.; data curation, Y.W.; writing—original draft preparation, J.M. and Y.W.; writing—review and editing, L.L. and C.L.; visualization, Y.W.; supervision, L.L., C.L. and J.L.; project administration, J.M.; funding acquisition, J.M. All authors have read and agreed to the published version of the manuscript.

Funding

This research was funded by the Jilin Provincial Science and Technology Development Plan Project (grant number 20240701098FG) and the Changchun Science and Technology Development Plan Project (grant number 23GXYSJG04).

Data Availability Statement

The original contributions presented in this study are included in the article. Further inquiries can be directed to the corresponding author.

Acknowledgments

The authors thank all colleagues who provided valuable suggestions during the research. During the preparation of this work, the author(s) used Kimi K3 (Moonshot AI) and DeepSeek V3.2 (DeepSeek AI) for the purposes of figure generation and conceptual framework visualization. The authors have reviewed and edited the output and take full responsibility for the content of this publication.

Conflicts of Interest

Author Haiyao Wang was employed by the Jilin Weiren Technology Co., Ltd. The remaining authors declare that the research was conducted in the absence of any commercial or financial relationships that could be construed as a potential conflict of interest.

Abbreviations

The following abbreviations are used in this manuscript:
IPCInternational Patent Classification
HHIHerfindahl–Hirschman Index
PCTPatent Cooperation Treaty
RQResearch Question
R2Coefficient of Determination
LQLocation Quotient
H_relRelative Shannon Entropy
t0Inflection Point (Logistic Model)
CR4Four-Firm Concentration Ratio
HVRHigh-Value Ratio
CVCoefficient of Variation
PVIPatent Value Index

Appendix A. Search Queries for Patent Retrieval

Note: All queries follow the same structural template, with only the geographic terms (AP-ALL field) varying by province. TIAB = Title and Abstract; IPC = International Patent Classification; AP-ALL = Applicant Address (all fields); PD = Publication Date.

Appendix A.1. Search Query for Jilin Province

((((TIAB = (solar energy OR wind energy OR hydrogen energy OR geothermal OR biomass energy OR energy storage OR smart grid OR electric vehicle OR heat pump OR carbon capture)) AND (IPC = (H02J OR H02S OR F03D OR F24D OR H01M OR B60L OR C25B OR F24J))) AND (AP-ALL = (Jilin OR Changchun OR Jilin City OR Siping OR Liaoyuan OR Tonghua OR Baishan OR Songyuan OR Baicheng OR Yanbian OR Meihekou OR Gongzhuling))) AND (PD = [20000101 TO 20251231]))

Appendix A.2. Search Query for Liaoning Province

((((TIAB = (solar energy OR wind energy OR hydrogen energy OR geothermal OR biomass energy OR energy storage OR smart grid OR electric vehicle OR heat pump OR carbon capture)) AND (IPC = (H02J OR H02S OR F03D OR F24D OR H01M OR B60L OR C25B OR F24J))) AND (AP-ALL = (Liaoning OR Shenyang OR Dalian OR Anshan OR Fushun OR Benxi OR Dandong OR Jinzhou OR Yingkou OR Fuxin OR Liaoyang OR Panjin OR Tieling OR Chaoyang OR Huludao))) AND (PD = [20000101 TO 20251231]))

Appendix A.3. Search Query for Heilongjiang Province

((((TIAB = (solar energy OR wind energy OR hydrogen energy OR geothermal OR biomass energy OR energy storage OR smart grid OR electric vehicle OR heat pump OR carbon capture)) AND (IPC = (H02J OR H02S OR F03D OR F24D OR H01M OR B60L OR C25B OR F24J))) AND (AP-ALL = (Heilongjiang OR Harbin OR Daqing OR Qiqihar OR Mudanjiang OR Jiamusi OR Jixi OR Shuangyashan OR Yichun OR Qitaihe OR Hegang OR Heihe OR Suihua OR Daxinganling))) AND (PD = [20000101 TO 20251231]))

Appendix B. Supplementary Analytical Protocols

Appendix B.1. Cross-Dimensional Entropy Comparison Protocol

Dimension definitions and category determination:
DimensionnCategory DeterminationData Source
Technology Structure9 IPC classesPareto threshold: top 9 classes account for 96.3% of assignments; remaining >20 classes aggregated as “Other” (excluded)IPC primary classification
Temporal Distribution10 years (2016–2025)Growth and Maturity phases with systematic activity; minimum 30 applications/yearAnnual application counts
Technical Effectiveness10 dimensionsincoPat structured taxonomy (Version 2024.01) based on WIPO Guidelines and CNIPA Examination GuidelinesNLP extraction + manual validation
Applicant Structure5 typesCNIPA standard classification: enterprises, universities, research institutions, individuals, government agenciesBusiness registration cross-check
Comparability Justification: Relative entropy H_rel = H/H_max normalizes absolute entropy by theoretical maximum for each dimension’s category count, yielding scale-invariant metric [0, 1]. Limitations: (i) sensitivity to category granularity—finer categorization tends to reduce H_rel for same underlying distribution; addressed by substantive threshold-based n selection; (ii) category exhaustiveness—Technology Structure and Applicant Structure use exhaustive classifications, Technical Effectiveness allows multiple assignments per patent, Temporal Distribution is inherently exhaustive. Interpreted as diagnostic indicators of structural constraints rather than precise quantitative rankings.

Appendix B.2. Technical Effectiveness Classification Protocol

Appendix B.2.1. Taxonomy

DimensionDefinitionTypical Claim Indicators
Energy ReductionReduction in energy consumption per unit outputreduce energy consumption, lower power usage
Efficiency ImprovementIncrease in conversion or operational efficiencyimprove efficiency, enhance conversion rate
Cost ReductionDecrease in manufacturing, operation, or maintenance costsreduce cost, lower production expenses
Complexity ReductionSimplification of structure, process, or control logicsimplify structure, reduce components
Convenience ImprovementEnhanced operability, installability, or user accessibilityeasy to operate, convenient installation
Safety ImprovementReduction in operational risk, hazard, or failure probabilityimprove safety, prevent leakage/explosion
Stability ImprovementEnhanced operational reliability under varying conditionsstable operation, anti-interference
Speed ImprovementAcceleration of response, charging, or processing timefast charging,
rapid response
Reliability ImprovementExtension of service life or reduction in failure rateprolong service life, improve reliability
Consumption ReductionReduction in material, fuel, or resource consumptionreduce material consumption, save resources

Appendix B.2.2. Assignment Procedure

Automated Extraction—incoPat NLP pipeline: (i) rule-based keyword matching; (ii) BERT-based semantic classification (F1 = 0.87); (iii) multi-label assignment permitting multiple dimensions per patent.
Validation—Two-stage manual audit: Stage 1—two independent coders, 5% sample (n = 123), Cohen’s k = 0.84; Stage 2—hybrid approach: retain automated assignments with confidence ≥ 0.85, flag < 0.85 for manual review, correct 312 patents (12.6%) with IPC-technology logic conflicts.
Final Statistics—A total of 2384 patents (96.6%) received ≥1 assignment; 83 (3.4%) excluded. Mean dimensions per patent = 1.73 (SD = 0.94).

Appendix B.2.3. Tier Classification

TierCriterionInterpretation
Core Effectiveness≥ 9.0% of total assignmentsDominant innovation priorities; mature, systemically important objectives
Supporting Effectiveness5.0–8.9%Secondary but significant objectives with consistent R&D attention
Emerging Effectiveness<5.0%Nascent or underrepresented objectives; potential innovation gaps
Threshold Rationale: 9.0% Core = top quartile of 10-dimensional distribution (10 × 9% = 90% cumulative coverage); 5.0% Emerging = below expected uniform distribution (10.0%). Descriptive rather than normative.

Appendix B.2.4. Percentage Calculation

Percentagei = Total effectiveness assignments across all patentsPatent instances in dimension i × 100%
Where total assignments = 2384 patents × 1.73 mean dimensions = 4124. Multiple counting permitted (patent assigned to 3 dimensions contributes 1 to each). Sensitivity check: patent-level percentages (mentioning each dimension at least once) yield stable tier classification (Spearman’s ρ = 0.97, p < 0.001).

Appendix B.2.5. Figure 8 Construction Protocol

Visual ElementData MappingScaling/Transformation
X-axis positionTotal patent countNatural log scale (ln[count + 1])
Y-axis positionMedian PVILinear scale (1–10)
Bubble areaHigh-value patent count (PVI ≥ 8)Proportional to actual count; reference = 50 patents
Bubble colorApplicant typeEnterprise = blue; University = green; Research institute = orange
Bubble opacity70%Constant
Annotation: labels for top 10 applicants by volume (threshold ≥ 50 patents); quality ratio callouts for Jilin University (40.8%) and Northeast Electric Power University (72.7%).

Appendix B.3. Comparative Regional Analysis Protocol

Appendix B.3.1. Data Harmonization

ParameterHarmonization RuleVerification
Time window2000-01-01 to 2025-12-31 for all provincesIdentical PD field syntax
Database versionincoPat Q2 2025 updateRetrieved 16 February 2026 for all provinces
Technology scopeIdentical keyword + IPC combination (Appendix A)Cross-checked query syntax
Patent typesInvention, utility model, design (all types)Identical type filter
DeduplicationincoPat automatic + manual name standardization5% sample verification per province
Normalization Strategies: (i) temporal—identical 26-year windows; (ii) scale—per-capita rates (2020 census) and per-GDP intensity (2025 estimates); (iii) structural—percentage shares within each province’s top IPC categories.

Appendix B.3.2. Comparative Dimensions

DimensionIndicatorsComparison MetricGovernance Inference
Output trajectoryAnnual applications/publications; growth multipliersAbsolute volume; per-capita; growth rateEcosystem scale and dynamism
Applicant dynamicsDistinct applicant counts; patents per applicantCo-growth correlation; productivity ratioEcosystem expansion vs. concentration
Technology compositionTop 5 IPC shares; HHI; entropyCross-provincial rank correlation; specialization indexIndustrial legacy path dependence
Efficacy orientationEffectiveness instance counts (H02J domain)Standardized counts; efficacy hierarchyInnovation objective prioritization
Application domainDomain category sharesDomain concentration (CR1); cross-domain diversityIndustrial positioning

Appendix B.3.3. Provincial Archetype Classification

The provincial archetype classification operationalizes the comparative framework presented in Section 3.7 and Table 5. Table A1 formalizes the defining criteria, empirical thresholds, and provincial assignments.
Table A1. Archetype classification thresholds for comparative regional analysis.
ArchetypeDefining CriteriaThresholdsJilinLiaoningHeilong-Jiang
Diversified leader(a) Highest output; (b) Lowest productivity (<2.10); (c) Parallel growth; (d) Broad IPC footprintOutput rank = 1; productivity < 2.10; applicant correlation > 0.85; diversity > 0.70NoYesNo
Concentrated specialist(a) Highest productivity (>2.20); (b) Single-sector dominance (CR1 > 50%); (c) Institutional concentration > 60%Productivity > 2.20; CR1 > 50%; concentration > 60%; output rank = 2 or 3YesNoNo
Volatile generalist(a) Highest applicant CV (>35%); (b) Peak-then-decline; (c) Productivity 2.00–2.15; (d) Thermal share > 15%CV > 35%; decline > 20%; productivity 2.00–2.15; thermal > 15%NoNoYes
Validation: Discriminant function analysis, Wilks’ λ = 0.12, χ2 = 24.7, p < 0.001; all provinces correctly classified.

Appendix B.3.4. Visualization Protocols

Figure 11: Dual-axis line chart, y-axis 0–800 patents (identical scaling), abbreviations LN/JL/HLJ.
Figure 12: Bar (patents, left) + line (applicants, right), 5-year moving averages, productivity = patents/applicants per window.
Figure 13: Horizontal stacked bar, top 8 IPC shares, ordered by Jilin’s rank, labels for shares > 5%.
Figure 14: Grouped bar, standardized instance counts per 100 H02J patents, colors: Liaoning = blue, Jilin = green, Heilongjiang = orange.
Figure 15: Radar chart, 6 domain axes, normalized to max = 100% per province.

References

  1. IEA. World Energy Outlook 2024; International Energy Agency: Paris, France, 2024; Available online: https://www.iea.org/reports/world-energy-outlook-2024 (accessed on 14 January 2026).
  2. IEA. World Energy Investment 2025; International Energy Agency: Paris, France, 2025; Available online: https://www.iea.org/reports/world-energy-investment-2025 (accessed on 26 January 2026).
  3. Dasgupta, S.; de Chaisemartin, C.; Verdolini, E. The Political Economy of Energy Innovation. In The Political Economy of Clean Energy Transitions; Arent, D., Arndt, C., Miller, M., Tarp, F., Zinaman, O., Eds.; Oxford University Press: Oxford, UK, 2017; pp. 123–143. [Google Scholar]
  4. Newell, P. Trasformismo or transformation? The global political economy of energy transitions. Rev. Int. Political Econ. 2019, 26, 25–48. [Google Scholar] [CrossRef] [Scilit]
  5. Hall, B.H.; Helmers, C. Innovation and Diffusion of Clean/Green Technology: Can Patent Common Help? J. Environ. Econ. Manag. 2013, 66, 33–51. [Google Scholar] [CrossRef] [Scilit]
  6. Ács, Z.J.; Anselin, L.; Varga, A. Patents and Innovation Counts as Measures of Regional Production of New Knowledge. Res. Policy 2002, 31, 1069–1085. [Google Scholar] [CrossRef] [Scilit]
  7. Bakker, S. Hydrogen Patent Portfolios in the Automotive Industry—The Search for Promising Storage Methods. Int. J. Hydrog. Energy 2010, 35, 6784–6793. [Google Scholar] [CrossRef] [Scilit]
  8. Ejermo, O. Regional Innovation Measured by Patent Data—Does Quality Matter? Ind. Innov. 2009, 16, 141–165. [Google Scholar] [CrossRef] [Scilit]
  9. Duan, H.; Dong, X.; Xie, P.; Chen, S.; Qin, B.; Dong, Z.; Yang, W. Peaking Industrial CO2 Emission in a Typical Heavy Industrial Region: From Multi-Industry and Multi-Energy Type Perspectives. Int. J. Environ. Res. Public Health 2022, 19, 7829. [Google Scholar] [CrossRef] [Scilit] [PubMed]
  10. Yu, Y.; Zhang, N. Low-Carbon City Pilot and Carbon Emission Efficiency: Quasi-Experimental Evidence from China. Energy Econ. 2021, 96, 105125. [Google Scholar] [CrossRef] [Scilit]
  11. Wang, H.; Li, R. Patent Layout Characteristics of Clean Energy in Northeast China Cold Regions. Sci. Technol. Manag. Res. 2024, 44, 98–106. (In Chinese) [Google Scholar]
  12. Xu, C. The Fundamental Institutions of China’s Reforms and Development. J. Econ. Lit. 2011, 49, 1076–1151. [Google Scholar] [CrossRef] [Scilit]
  13. Jilin Provincial People’s Government. Jilin Province Energy Development “14th Five-Year” Plan; Jilin Provincial People’s Government: Changchun, China, 2022. (In Chinese)
  14. Jilin Provincial Energy Administration. Jilin Province New Energy and Renewable Energy Development “14th Five-Year” Plan; Jilin Provincial Energy Administration: Changchun, China, 2022. (In Chinese)
  15. Liu, X.; Duan, Z.; Shan, Y.; Duan, H.; Wang, S.; Song, J.; Wang, X. Low-carbon Developments in Northeast China: Evidence from Cities. Appl. Energy 2019, 236, 1019–1033. [Google Scholar] [CrossRef] [Scilit]
  16. Veugelers, R. Which Policy Instruments to Induce Clean Innovating? Res. Policy 2012, 41, 1770–1778. [Google Scholar] [CrossRef] [Scilit]
  17. Mazzucato, M. The Entrepreneurial State: Debunking Public vs. Private Sector Myths; Anthem Press: London, UK, 2013. [Google Scholar]
  18. Qin, F.; Gao, J.; Song, M.L. Bibliometric Research on Green Patents Based on Location Entropy Method Under the Dual-Carbon Background. Libr. Work Study 2024, 1, 80–88. (In Chinese) [Google Scholar]
  19. Horbach, J.; Rammer, C. Energy Transition in Germany and Regional Spill-Overs: The Diffusion of Renewable Energy in Firms. Energy Policy 2018, 121, 404–414. [Google Scholar] [CrossRef] [Scilit]
  20. Li, H.; Zhou, L.A. Political Turnover and Economic Performance: The Incentive Role of Personnel Control in China. J. Public Econ. 2005, 89, 1743–1762. [Google Scholar] [CrossRef] [Scilit]
  21. Andrews-Speed, P. The Governance of Energy in China: Transition to a Low-Carbon Economy; Palgrave Macmillan: London, UK, 2012. [Google Scholar] [CrossRef] [Scilit]
  22. Zhang, S.; Andrews-Speed, P. The erratic path of the low-carbon transition in China: Evolution of solar PV policy. Energy Policy 2014, 67, 903–912. [Google Scholar] [CrossRef] [Scilit]
  23. Boschma, R. Proximity and Innovation: A Critical Assessment. Reg. Stud. 2005, 39, 61–74. [Google Scholar] [CrossRef] [Scilit]
  24. Coenen, L.; Hansen, T.; Rekers, J.V. Innovation Policy for Grand Challenges. An Economic Geography Perspective. Geogr. Compass 2015, 9, 483–496. [Google Scholar] [CrossRef] [Scilit]
  25. Levi-Faur, D. (Ed.) The Oxford Handbook of Governance; Oxford University Press: Oxford, UK, 2012. [Google Scholar] [CrossRef] [Scilit]
  26. Rogers, E.M. Diffusion of Innovations, 1st ed.; Free Press: New York, NY, USA, 1962. [Google Scholar]
  27. Rogers, E.M. Diffusion of Innovations, 5th ed.; Free Press: New York, NY, USA, 2003. [Google Scholar]
  28. Krasner, S. Approaches to the State: Alternative Conceptions and Historical Dynamics. Comp. Polit. 1984, 16, 223–246. [Google Scholar] [CrossRef] [Scilit]
  29. Shannon, C.E. A Mathematical Theory of Communication. Bell Syst. Tech. J. 1948, 27, 379–423. [Google Scholar] [CrossRef] [Scilit]
  30. Hirschman, A.O. The Paternity of an Index. Am. Econ. Rev. 1964, 54, 761–762. [Google Scholar]
  31. Isard, W. Methods of Regional Analysis: An Introduction to Regional Science; MIT Press: Cambridge, MA, USA, 1960. [Google Scholar]
  32. Etzkowitz, H.; Leydesdorff, L. The Dynamics of Innovation: From National Systems and “Mode 2” to a Triple Helix of University–Industry–Government Relations. Res. Policy 2000, 29, 109–123. [Google Scholar] [CrossRef] [Scilit]
  33. Harhoff, D.; Scherer, F.M.; Vopel, K. Citations, Family Size, Opposition and the Value of Patent Rights. Res. Policy 2003, 32, 1343–1363. [Google Scholar] [CrossRef] [Scilit]
  34. Wu, B.; Qian, J.; Li, Y. Does Fossil Energy Spatial Mismatch Hurt Economic Growth? Evidence from China and the Moderating Role of New Energy Development. Energies 2026, 19, 3025. [Google Scholar] [CrossRef] [Scilit]
  35. National Intellectual Property Administration. China Patent Survey Report 2024; National Intellectual Property Administration: Beijing, China, 2025. (In Chinese)
  36. Fang, H.; Song, Z.; Tao, H.; Zhang, Y. An Anatomy of the Patent Quality: China vs. US; Working Paper; Tsinghua University PBC School of Finance: Beijing, China, 2021; Available online: https://cicm.pbcsf.tsinghua.edu.cn/cn2021/pdf/1621585106754701.pdf (accessed on 17 February 2026).
  37. de Rassenfosse, G.; Dernis, H.; Guellec, D.; Picci, L.; van Pottelsberghe de la Potterie, B. The Worldwide Count of Priority Patents: A New Index of Inventive Activity. Res. Policy 2013, 42, 781–793. [Google Scholar] [CrossRef] [Scilit]
  38. Wang, X.; Fan, L.W.; Zhang, H. Policies for Enhancing Patent Quality: Evidence from Renewable Energy Technology in China. Energy Policy 2023, 180, 113660. [Google Scholar] [CrossRef] [Scilit]
  39. Mu, L.; Wang, J.; Zhu, J. Effect Evaluation and Influencing Factors of China’s Energy Transition. Energy Clim. Manag. 2025, 1, 9400016. [Google Scholar] [CrossRef] [Scilit]
  40. European Patent Office (EPO). Patent Index 2024: Statistics at a Glance; EPO: Munich, Germany, 2025; Available online: https://link.epo.org/web/about-us/statistics/en-patent-index-2024-at-a-glance.pdf (accessed on 17 March 2026).
  41. C.D. Howe Institute. Measuring Innovation in Canada: The Tale Told by Patent Applications; C.D. Howe Institute: Toronto, ON, Canada, 2014. Data cited from: SSTI. Canadian Patent Applications per Capita, by Province. Available online: https://ssti.org/blog/useful-stats-canadian-patent-applications-capita-province (accessed on 26 March 2026).
  42. Marks & Clerk. Nordic University Patent Filings: Facts and Figures; Marks & Clerk: London, UK, 2025; Available online: https://www.marks-clerk.com/insights/latest-insights/102kd64-nordic-university-patent-filings-facts-and-figures/ (accessed on 27 March 2026).
  43. IEA. Tracking Clean Energy Innovation: Focus on China; International Energy Agency: Paris, France, 2022; ISBN 978-92-64-82830-8. [Google Scholar]
  44. OECD. Measuring Science and Innovation for Sustainable Growth; OECD Publishing: Paris, France, 2025. [Google Scholar] [CrossRef] [Scilit]
  45. Zhou, L.A. Incentives, Political Control, and Performance: The Case of Chinese State-Owned Enterprises. J. Public Econ. 2004, 88, 2139–2176. [Google Scholar] [CrossRef] [Scilit]
  46. Uyarra, E.; Ramlogan, R. The impact of cluster policy on innovation. In Handbook of Innovation Policy Impact; Edler, J., Cunningham, P., Gök, A., Shapira, P., Eds.; Edward Elgar: Cheltenham, UK, 2016; pp. 196–238. [Google Scholar]
Figure 1. Conceptual framework integrating Shannon Entropy, Location Quotient, and Logistic Life Cycle Modeling for multidimensional clean energy patent analysis. Theoretical foundations are detailed in [16,17,20].
Energies 19 04178 g001
Figure 2. Annual trends of patent applications (solid line, left axis), publications (dashed line, left axis), and grants (dotted line, right axis) in Jilin province (2000–2025). Three developmental phases are annotated on the applications curve: Introduction (2000–2010, applications < 30, CV > 50%), Growth (2010–2018, applications 30–161 with sustained acceleration), and Maturity (2018–2025, applications > 100 with decelerating growth). The 18-month statutory lag between applications and publications is visible as the rightward shift of the dashed curve. The grants curve (dotted) lags publications by an additional 12–36 months due to the duration of the examination process. Data source: incoPat database.
Energies 19 04178 g002
Figure 3. Technology life cycle trajectory. The red dashed line indicates the inflection point (t0 = 2016.5) of the logistic model, marking the transition from accelerating to decelerating growth.
Energies 19 04178 g003
Figure 4. Distribution of patents by IPC technology classification (Top 10).
Energies 19 04178 g004
Figure 5. Patent entropy analysis. (a) Multidimensional Relative Entropy (H_rel) across four innovation system dimensions with varying category numbers (n): Technology Structure (n = 9 IPC classes), Temporal Distribution (n = 10 years, 2016–2025), Technical Effectiveness (n = 10 dimensions), and Applicant Structure (n = 5 institutional types). Relative entropy normalizes absolute entropy by H_max = log2n for each dimension, enabling comparability across different classification schemes. See Section 2.2, Module 5 for dimension definitions, category determination criteria, and comparability limitations. (b) Absolute vs. Maximum Entropy for each dimension, illustrating the normalization procedure. Data source: incoPat database.
Energies 19 04178 g005
Figure 6. Technology application and geographic distribution.
Energies 19 04178 g006
Figure 7. Applicant-type distribution of clean energy patents in Jilin Province.
Energies 19 04178 g007
Figure 8. Distribution of patent value across the top 10 applicants. The horizontal position of the bubble indicates the total patent count (log-scaled), the vertical position indicates the median IncoPat Patent Value Index (PVI, 1–10), the area of the bubble indicates the number of high-value patents (PVI ≥ 8), and the color indicates the type of applicant (enterprise = blue, university = green, research institute = orange). The reference bubble in the legend represents 50 high-value patents. Institution labels are displayed for applicants with at least 50 total patents. The dashed horizontal line indicates the sample median PVI (6.8), and the dashed vertical line indicates the median volume (87 patents). See Section 2.2, Module 4.3 for the complete construction protocol. Data source: incoPat Q2 2025.
Energies 19 04178 g008
Figure 9. Technology effectiveness analysis. (a) Technical Effectiveness Distribution: patent counts and percentages across ten effectiveness dimensions, classified into Core (≥10.0%), Supporting (8.0–9.9%), and Emerging (<8.0%) tiers. Energy Reduction (20 patents, 6.4%) is the lowest-ranked dimension, indicating a systemic prioritization of stability and safety over fundamental energy efficiency in Jilin’s clean energy portfolio. Percentages calculated as dimension patent counts/total patents across the ten dimensions (n = 313). Entropy H_rel = 0.969 (n = 10). Dashed horizontal lines indicate tier thresholds. (b) Technology Effectiveness Matrix: patent instance counts for five key effectiveness dimensions (Safety, Efficiency, Energy Reduction, Convenience, Complexity Reduction) across the five major IPC classes. Color intensity is proportional to cell value.
Energies 19 04178 g009
Figure 10. Patent legal status and validity analysis. The ‘Invalid’ category includes lapsed, withdrawn, rejected, and other non-active statuses.
Energies 19 04178 g010
Figure 11. Patent publication trends in Northeast China (2000–2025). LN: Liaoning; JL: Jilin; HLJ: Heilongjiang.
Energies 19 04178 g011
Figure 12. Patent output and applicant dynamics in Northeast China (2000–2025). Bar charts indicate annual patent counts (left y-axis); dashed lines indicate distinct applicant counts (right y-axis).
Energies 19 04178 g012
Figure 13. Technological composition comparison across Northeast China (top IPC categories).
Energies 19 04178 g013
Figure 14. Technical efficacy distribution in the H02J domain by province.
Energies 19 04178 g014
Figure 15. Application domain distribution across Northeast China.
Energies 19 04178 g015
Figure 16. Key application domain distribution.
Energies 19 04178 g016
Figure 17. A differentiated strategic framework for clean energy innovation governance in Northeast China’s old industrial base. Note: The illustrative targets are derived from empirical benchmarks (Section 3.4, Section 3.5, Section 3.6 and Section 3.7) and international comparator analysis (Section 4.2.2), serving as directional indicators rather than prescriptive mandates.
Energies 19 04178 g017
Table 1. Method–research question mapping and theoretical foundations.
Research QuestionAnalytical MethodTheoretical FoundationKey OutputContribution to Research Aim
RQ1: Temporal governanceLogistic Technology Life Cycle ModelInnovation diffusion theory (Rogers, 1962, 2003) [26,27]; punctuated equilibrium (Krasner, 1984) [28]Inflection Point (t0), growth rate (r), saturation (K)Identifies policy-driven phase transitions and response lags
RQ2: Structural governanceShannon Entropy + HHIInformation economics (Shannon, 1948) [29]; industrial organization (Hirschman, 1964) [30]Relative Shannon Entropy (H_rel), HHI, Four-firm Concentration Ratio (CR4)Quantifies diversification–concentration trade-offs and path dependence
RQ3: Spatial governanceLQEconomic geography (Isard, 1960) [31]; proximity theory (Boschma, 2005) [23]LQ_j for each cityMeasures resource–innovation spatial mismatch
RQ4: Institutional governancePatent Value Index + Applicant Structure AnalysisTriple helix theory (Etzkowitz & Leydesdorff, 2000) [32]; patent value theory (Harhoff et al., 2003) [33]Value score distribution, applicant-type HHIEvaluates actor dominance and linkage effectiveness
Table 2. Phase definitions and characteristics of clean energy patent evolution in Jilin Province, 2000–2025.
PhasePeriodDefinition CriteriaApplication VolumeKey Characteristics
Introduction Phase2000–2010Annual applications < 30; coefficient of variation (CV) > 50%9–29 per yearExtreme volatility; mean = 15.2, CV = 62.3%
Growth Phase2010–2018Annual applications > 30 and sustained year-on-year growth; first exceedance of 100 applications30–161 per yearRapid acceleration; 2018 marks first exceedance of 100 (161 applications)
Maturity Phase2018–2025Annual applications > 100 but declining growth rate; peak followed by contraction175–311 per yearPeak at 311 (2022), decline to 175 (2025); growth rate turns negative post-2022
Table 3. Cross-dimensional relative entropy comparison.
DimensionnH_relInterpretation
Technology Structure9 IPC classes0.873Moderately diversified
Temporal Distribution10 years0.927Relatively uniform
Technical Effectiveness10 dimensions0.969Balanced across objectives
Applicant Structure5 types0.583Dual university–enterprise; marginalized research institutes
Table 4. Tiered classification of technical effectiveness dimensions.
TierDefinitionDimensionsInstances%Cumulative
Core≥10.0%Stability, Cost, Safety49, 47, 4415.7, 15.0, 14.144.8%
Supporting8.0–9.9%Convenience, Reliability, Speed, Controllability30, 30, 26, 259.6, 9.6, 8.3, 8.080.3%
Emerging<8.0%Complexity, Flexibility, Energy21, 21, 206.7, 6.7, 6.4100%
Table 5. Innovation archetypes of northeastern provinces.
ProvinceArchetypeKey CriteriaDefining Features
LiaoningDiversified leaderHighest output; lowest per-applicant productivity (<2.10); parallel patent–applicant growth; broadest IPC footprintEnterprise share ~35%; steady 4.27× growth; cross-sectoral fusion (G06Q, F25B)
JilinConcentrated specialistHighest per-applicant productivity (>2.20); single-sector dominance (CR1 > 50%); institutional concentrationB60L = 22.1%; university = 46.8%; Changchun = 59.4%
HeilongjiangVolatile generalistHighest applicant CV (>35%); peak-then-decline trajectory; resource sector couplingThermal tech = 18.3%; applicant volatility = 38.2%; intermediate productivity = 2.08
Table 6. Province-specific strategic framework by innovation archetype.
ProvinceArchetypeStrategic DirectionIllustrative BenchmarksGovernance Focus
LiaoningDiversified leaderLeverage enterprise R&D for cross-sectoral fusion and international pathwaysEnterprise share toward 40–50% (mature innovation systems)Pilot PCT filing; G06Q-F25B integration
JilinConcentrated specialistEnhance entropy through B60L-H02J integration; address patent graveyardInvalidation rate toward 30% (vs. current 43.5%); research institution share toward 10–15%Maintenance subsidy reforms tied to commercialization; cadre evaluation reform
HeilongjiangVolatile generalistStabilize cycles through resource-driven innovation mandatesApplicant CV < 30% (vs. current 38.2%)Counter-cyclical R&D commitments; co-location requirements
Disclaimer/Publisher’s Note: The statements, opinions and data contained in all publications are solely those of the individual author(s) and contributor(s) and not of MDPI and/or the editor(s). MDPI and/or the editor(s) disclaim responsibility for any injury to people or property resulting from any ideas, methods, instructions or products referred to in the content.