Valorization of Fish Waste via Anaerobic Digestion: A Systematic Literature Review and Future Research Agenda



Abstract
1. Introduction
2. Materials and Methods
2.1. Search Strategy, Eligibility Criteria and Study Selection
2.2. Bibliometric Analysis
2.3. Methodological Limitations
3. Results
3.1. Performance Analysis and Science Mapping
3.1.1. Publication and Citation Dynamics
3.1.2. Country and Institutional Footprint
3.1.3. High-Impact Works and Journals Overview
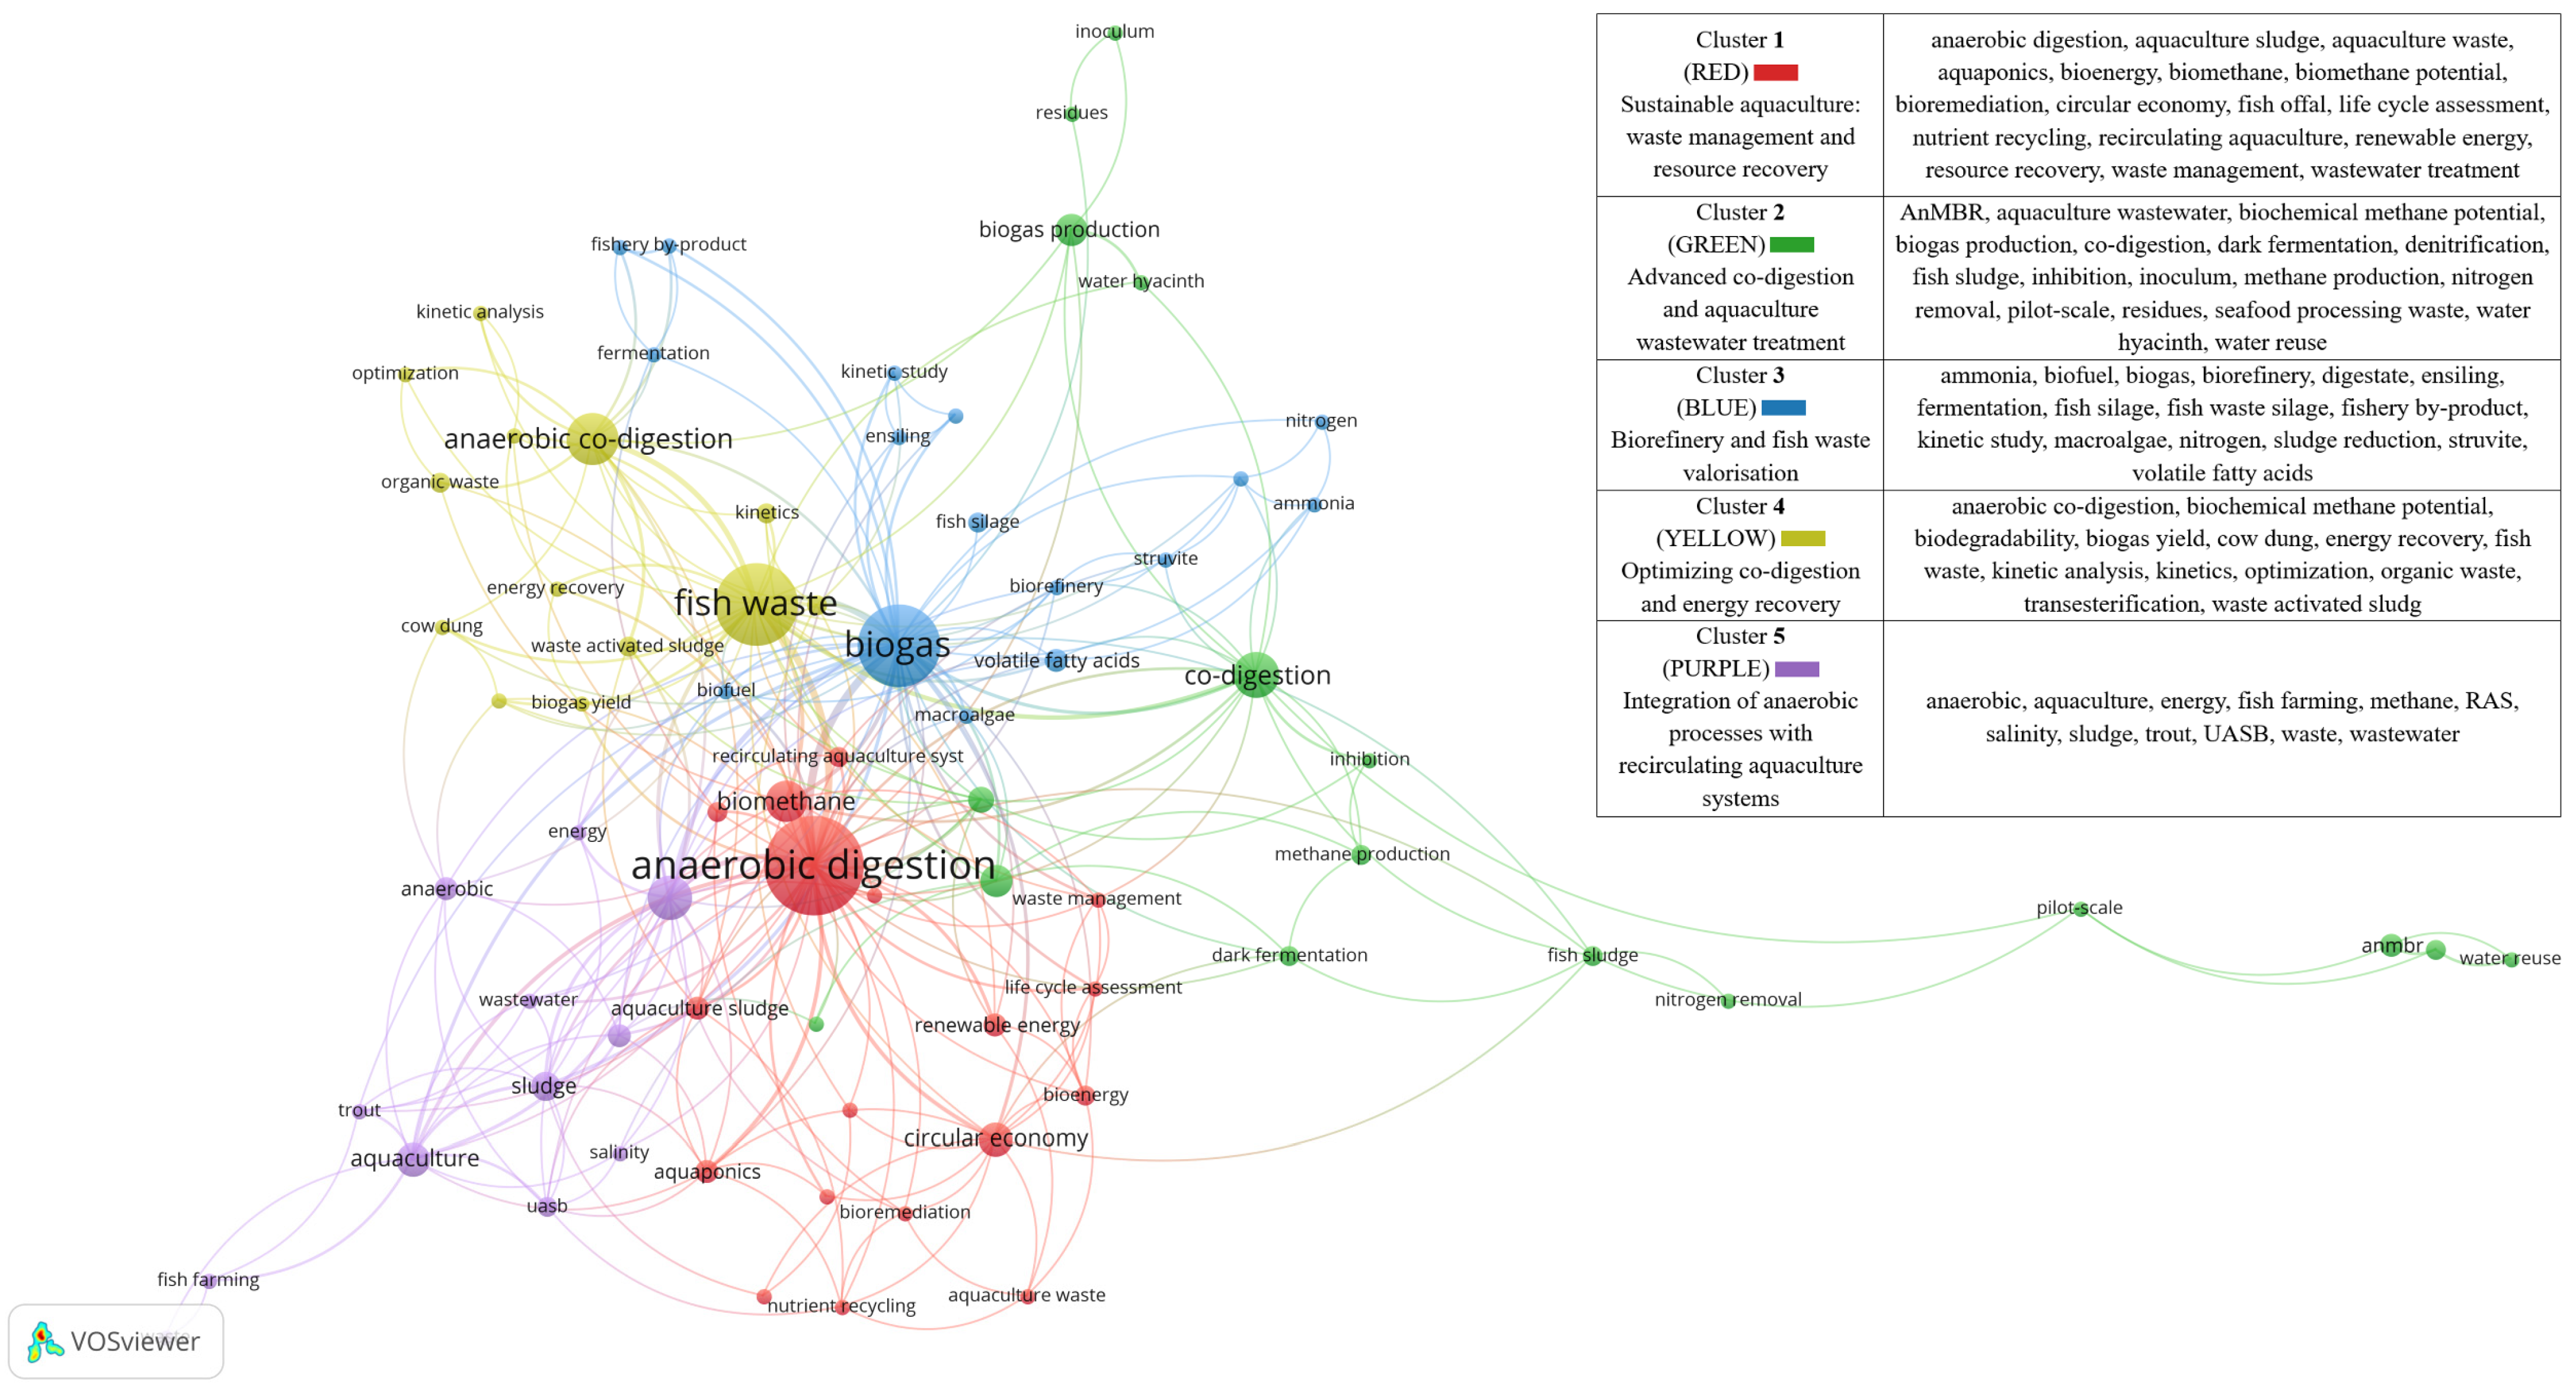
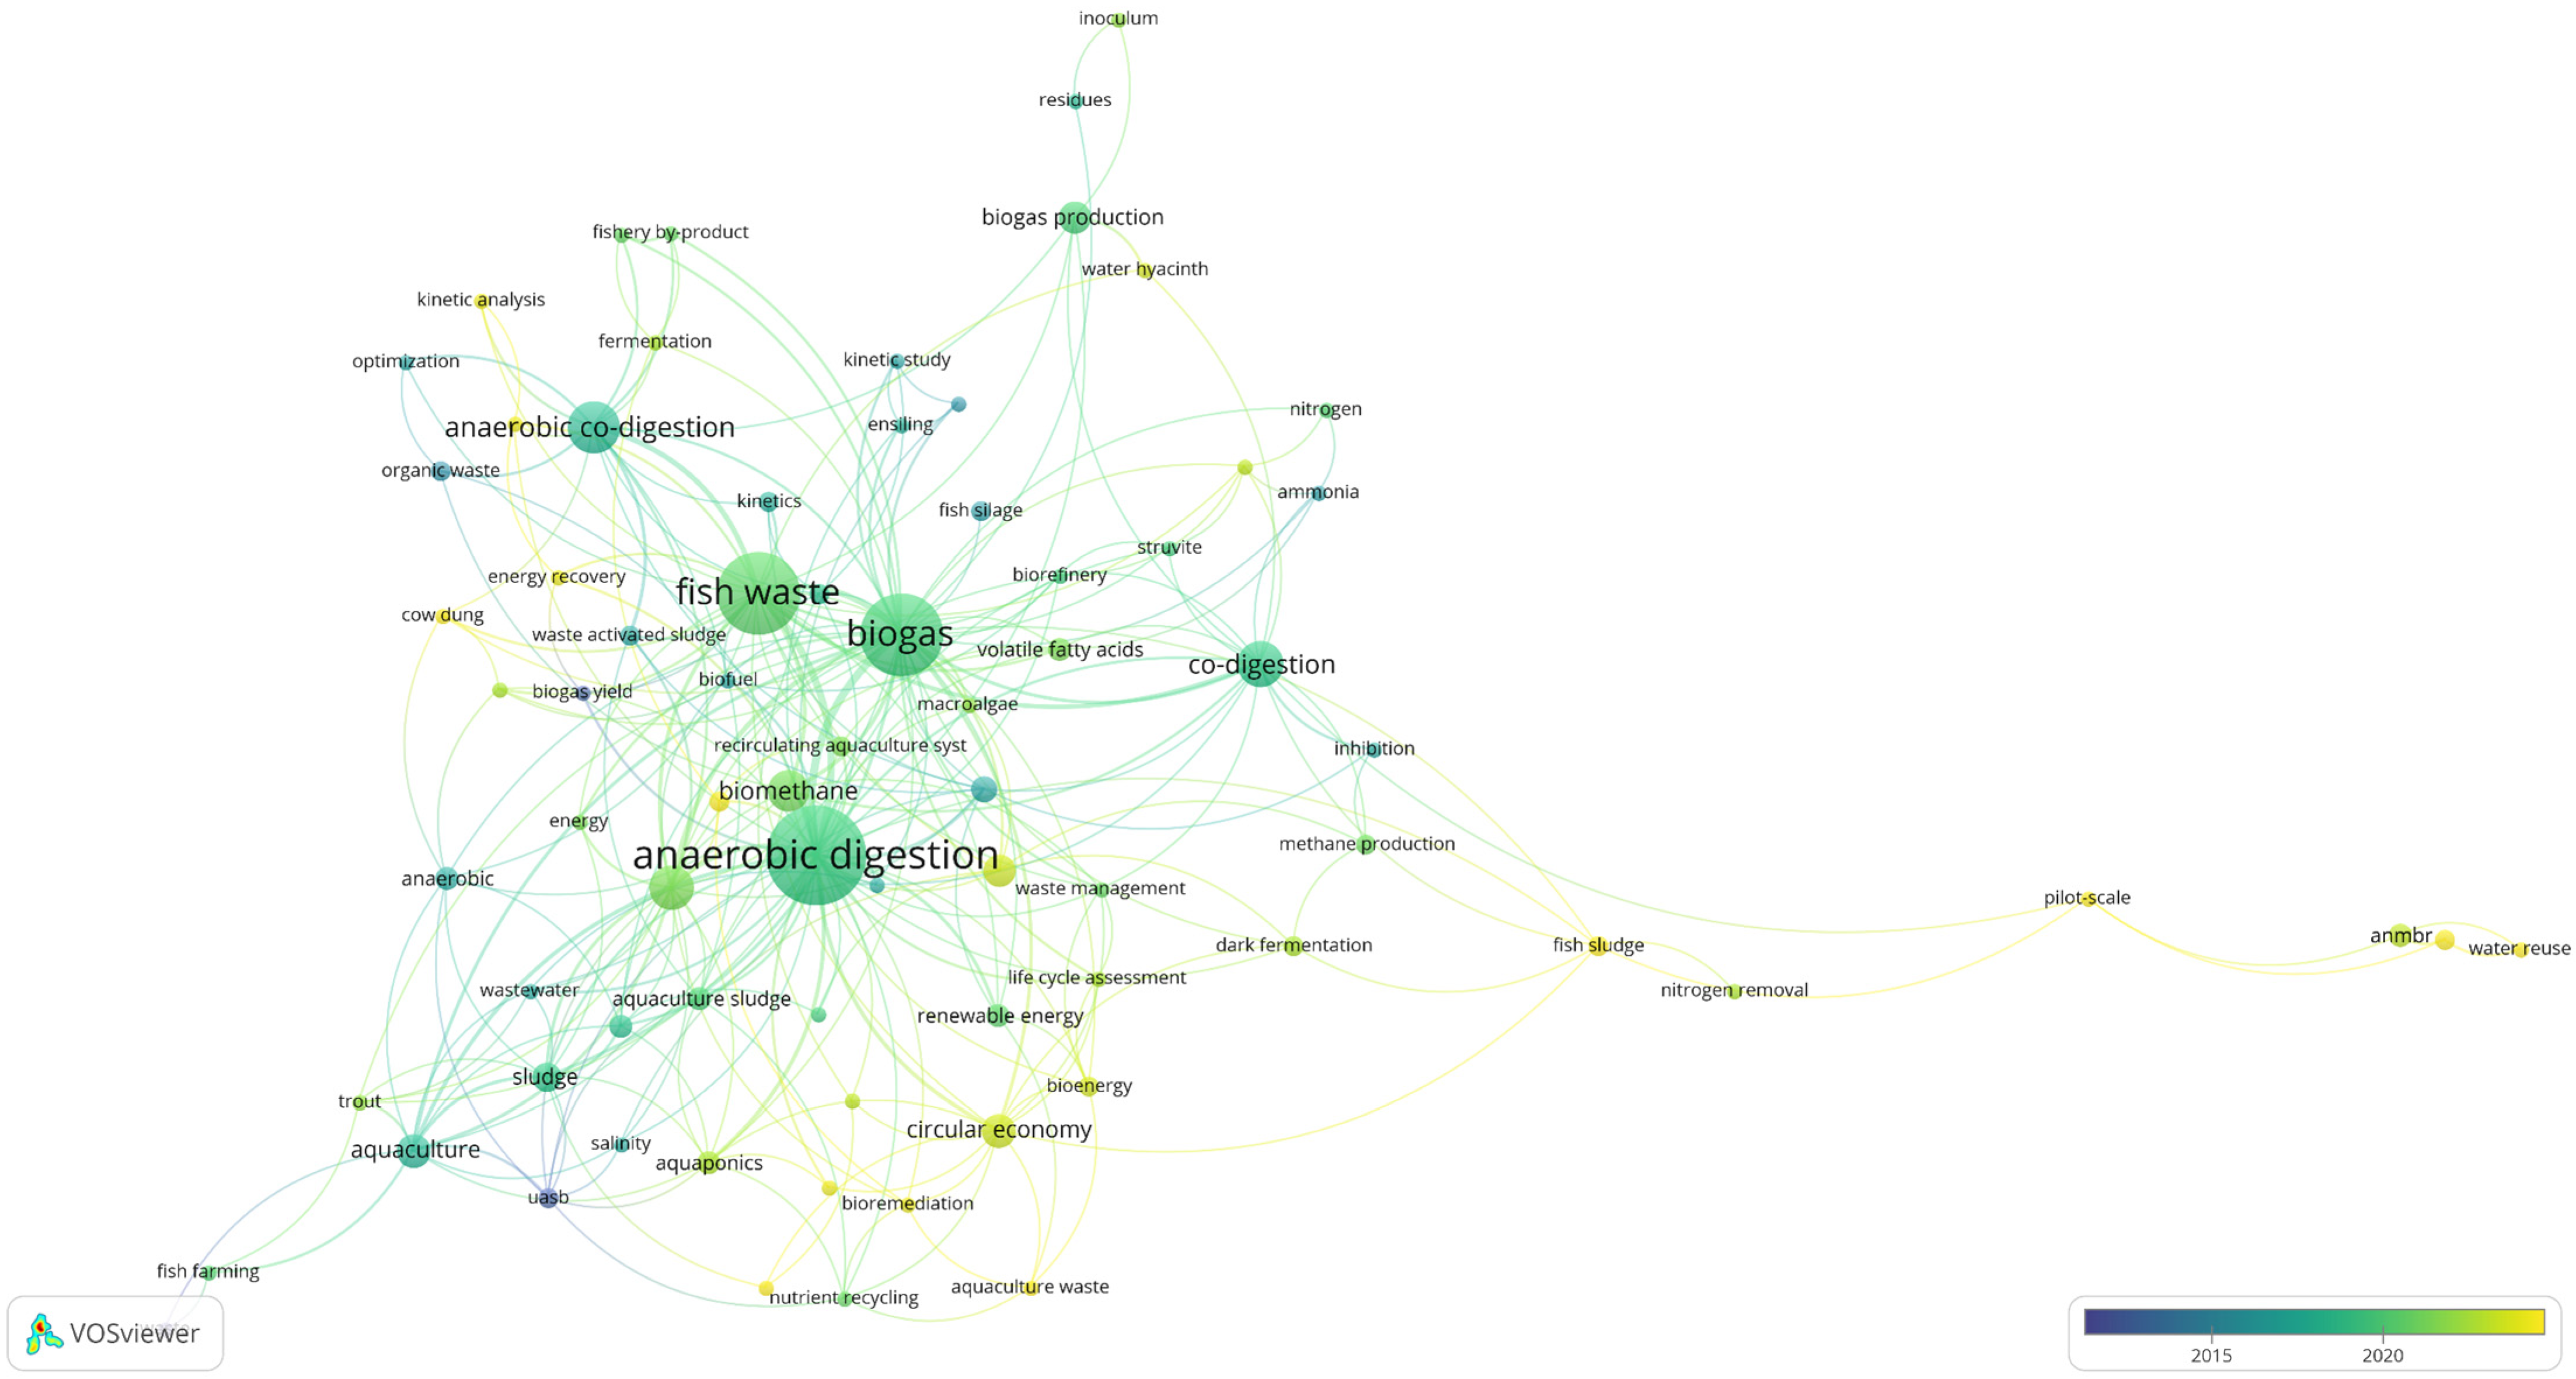
3.1.4. Keyword Co-Occurrence Mapping

| Rank | Article | Literature | Journal | Total Citations | Citations per Year | Normalized Total Citations | Open Access Article (Yes/No) |
|---|---|---|---|---|---|---|---|
| 1 | Improvement of fruit and vegetable waste anaerobic digestion performance and stability with co-substrates addition | [55] | Journal of Environmental Management | 306 | 18.00 | 2.76 | No |
| 2 | Anaerobic batch co-digestion of sisal pulp and fish wastes | [10] | Bioresource Technology | 270 | 12.27 | 1.00 | No |
| 3 | A methodology for optimising feed composition for anaerobic co-digestion of agro-industrial wastes | [56] | Bioresource Technology | 247 | 15.44 | 1.00 | No |
| 4 | Ensiling of fish industry waste for biogas production: A lab scale evaluation of biochemical methane potential (BMP) and kinetics | [17] | Bioresource Technology | 235 | 18.08 | 3.25 | No |
| 5 | A metagenomic study of the microbial communities in four parallel biogas reactors | [57] | Biotechnology for Biofuels (Biotechnology for Biofuels and Bioproducts) | 131 | 10.92 | 3.76 | Yes |
| 6 | Synergistic effects of anaerobic co-digestion of whey, manure and fish ensilage | [58] | Bioresource Technology | 102 | 12.75 | 2.59 | No |
| 7 | Nutrient mineralization and organic matter reduction performance of RAS-based sludge in sequential UASB-EGSB reactors | [59] | Aquacultural Engineering | 96 | 12.00 | 2.44 | No |
| 8 | Fish waste: An efficient alternative to biogas and methane production in an anaerobic mono-digestion system | [3] | Renewable Energy | 82 | 13.67 | 2.94 | No |
| 9 | Nitrogen and carbon balance in a novel near-zero water exchange saline recirculating aquaculture system | [60] | Aquaculture | 77 | 8.56 | 2.57 | No |
| 10 | Improved utilization of fish waste by anaerobic digestion following omega-3 fatty acids extraction | [61] | Journal of Environmental Management | 75 | 5.36 | 1.99 | No |
| Top five references most frequently cited by research articles in the corpus, 2000–2025 | |||||||
| Rank | Document title | Literature | Document type | Publisher | Local citations | ||
| 1 | Standard Methods for the Examination of Water and Wastewater | [52,53] | Technical standards/reference book | APHA Press, Washington DC | 17 | ||
| 2 | Inhibition of anaerobic digestion process: A review | [54] | Review article | Bioresource Technology | 16 | ||
| 3 | Fish waste: An efficient alternative to biogas and methane production in an anaerobic mono-digestion system | [3] | Research article | Renewable Energy | 10 | ||
| 4 | Defining the biomethane potential (BMP) of solid organic wastes and energy crops: a proposed protocol for batch assays | [51] | Research article | Water Science and Technology | 9 | ||
| 5 | Co-digestion of waste organic solids: batch studies | [62] | Research article | Bioresource Technology | 8 | ||
3.2. Fish Waste and By-Products
3.2.1. Classification of Fish-Derived Feedstocks, Co-Substrates and Inoculum
3.2.2. Biogas and Biomethane Yield from Fish Waste
3.2.3. Kinetic and Mechanistic Modeling of Gas Production During Anaerobic Digestion of Fish Waste
3.2.4. Stability and Inhibition Mechanisms in the Anaerobic Digestion of Fish Waste
3.2.5. Microbial Communities During Anaerobic Digestion of Fish Waste
3.2.6. Dark Fermentation of Fish-Derived and Related Seafood Residues Highlighted by Bibliometric Analysis
3.3. Economic Feasibility and Life Cycle Assessment
3.4. Database Coverage Sensitivity Analysis
4. Future Research Directions
5. Conclusions
Supplementary Materials
Author Contributions
Funding
Data Availability Statement
Conflicts of Interest
Abbreviations
| AD | anaerobic digestion |
| AD-BES | anaerobic digestion bioelectrochemical system |
| ADM1 | Anaerobic Digestion Model No. 1 |
| ADM1-R3 | reduced, mass-based variant of Anaerobic Digestion Model No. 1 |
| AHFW | acid-hydrolyzed fish waste |
| AIC | Akaike information criterion |
| AnMBR | anaerobic membrane bioreactor |
| ASBR | anaerobic sequencing batch reactor |
| BA | bibliometric analysis |
| BIC | Bayesian information criterion |
| BMP | biochemical methane potential |
| B-SLR | bibliometric systematic literature review |
| C/N | carbon to nitrogen ratio |
| COD | chemical oxygen demand |
| CSV | comma-separated values |
| CSTR | continuous stirred-tank reactor |
| DF | dark fermentation |
| DNA | deoxyribonucleic acid |
| DOI | digital object identifier |
| EGSB | expanded granular sludge bed |
| EU | European Union |
| FAO | Food and Agriculture Organization of the United Nations |
| Feammox | anaerobic ammonium oxidation coupled to Fe(III) reduction |
| FVW | fruit and vegetable waste |
| HRT | hydraulic retention time |
| IC | internal circulation reactor |
| I/S | inoculum-to-substrate ratio |
| ITS | internal transcribed spacer |
| LCFA | Long-chain fatty acid |
| LC-HRMS | liquid chromatography coupled to high-resolution mass spectrometry |
| MCCA | medium chain carboxylic acid |
| MFVW | model fruit and vegetable waste |
| MWWTP | municipal wastewater treatment plant |
| OLR | organic loading rate |
| PRISMA | Preferred Reporting Items for Systematic Reviews and Meta-Analyses |
| qPCR | quantitative polymerase chain reaction |
| RAS | recirculating aquaculture system |
| RMSE | root mean square error |
| RNA | ribonucleic acid |
| rRNA | ribosomal ribonucleic acid |
| SA-ABR | self-agitated anaerobic baffled reactor |
| SAOB | syntrophic acetate-oxidizing bacteria |
| S-CSTR | semi-continuous stirred-tank reactor |
| SLR | systematic literature review |
| STR | stirred-tank reactor |
| TS | total solids |
| UASB | upflow anaerobic sludge blanket |
| VFA | volatile fatty acid |
| VS | volatile solids |
| WWTP | wastewater treatment plant |
Appendix A
| Final core corpus |
| TITLE-ABS-KEY(“fish waste*” OR “finfish waste*” OR “fish by-product*” OR “fish byproduct*” OR “fish offal” OR “fish viscera” OR “fish silage” OR “fish ensilage” OR “ensiled fish” OR “stick water” OR “stickwater” OR “press cake” OR “presscake” OR “surimi wash water” OR “fish processing waste*” OR “fish processing wastewater” OR “fish processing effluent” OR “fishmeal plant effluent” OR “fish cannery wastewater” OR “seafood waste” OR “seafood processing waste*” OR “seafood processing wastewater” OR “seafood processing effluent” OR “aquaculture sludge” OR “fish sludge” OR “aquaculture effluent” OR “aquaculture wastewater” OR “recirculating aquaculture system” OR “RAS sludge” OR “RAS backwash” OR “drum filter backwash” OR “rest raw material”) AND TITLE-ABS-KEY(“anaerobic digest*” OR “methane ferment*” OR biogas OR biomethane OR methanogenesis OR “biogas production” OR “biogas yield” OR “specific biogas production” OR “cumulative biogas production” OR “methane production” OR “methane yield” OR “specific methane production” OR “specific methane yield” OR “ultimate methane yield” OR “cumulative methane production” OR “biochemical methane potential” OR BMP OR codigestion OR “co-digestion” OR “co digestion” OR “anaerobic co-digestion” OR AcoD OR “two-stage anaerobic digestion” OR “two stage anaerobic digestion” OR “two-phase anaerobic digestion” OR “two phase anaerobic digestion” OR “anaerobic membrane bioreactor” OR AnMBR OR “dark ferment*” OR biohydrogen OR “bio-hydrogen” OR “bio h2” OR bioH2 OR “H2 production” OR “H2 yield” OR “CH4 production” OR “CH4 yield” OR “hydrogen production” OR “hydrogen yield” OR “hydrogen production rate” OR HPR OR “hydrogen evolution rate” OR HER OR “specific hydrogen production rate” OR SHPR OR “biochemical hydrogen potential” OR BHP OR “bioCH4” OR “bio-CH4”) |
| Final core corpus |
| TS=(“fish waste*” OR “finfish waste*” OR “fish by-product*” OR “fish byproduct*” OR “fish offal” OR “fish viscera” OR “fish silage” OR “fish ensilage” OR “ensiled fish” OR “stick water” OR “stickwater” OR “press cake” OR “presscake” OR “surimi wash water” OR “fish processing waste*” OR “fish processing wastewater” OR “fish processing effluent” OR “fishmeal plant effluent” OR “fish cannery wastewater” OR “seafood waste” OR “seafood processing waste*” OR “seafood processing wastewater” OR “seafood processing effluent” OR “aquaculture sludge” OR “fish sludge” OR “aquaculture effluent” OR “aquaculture wastewater” OR “recirculating aquaculture system” OR “RAS sludge” OR “RAS backwash” OR “drum filter backwash” OR “rest raw material”) AND TS=(“anaerobic digest*” OR “methane ferment*” OR biogas OR biomethane OR methanogenesis OR “biogas production” OR “biogas yield” OR “specific biogas production” OR “cumulative biogas production” OR “methane production” OR “methane yield” OR “specific methane production” OR “specific methane yield” OR “ultimate methane yield” OR “cumulative methane production” OR “biochemical methane potential” OR BMP OR codigestion OR “co-digestion” OR “co digestion” OR “anaerobic co-digestion” OR AcoD OR “two-stage anaerobic digestion” OR “two stage anaerobic digestion” OR “two-phase anaerobic digestion” OR “two phase anaerobic digestion” OR “anaerobic membrane bioreactor” OR AnMBR OR “dark ferment*” OR biohydrogen OR “bio-hydrogen” OR “bio h2” OR bioH2 OR “H2 production” OR “H2 yield” OR “CH4 production” OR “CH4 yield” OR “hydrogen production” OR “hydrogen yield” OR “hydrogen production rate” OR HPR OR “hydrogen evolution rate” OR HER OR “specific hydrogen production rate” OR SHPR OR “biochemical hydrogen potential” OR BHP OR “bioCH4” OR “bio-CH4”) |
| Feedstock | Inoculum Source | Digestion Mode | Test Type and Reactor Configuration | Temperature | Reported Biogas/Methane Outcome (as Reported) | References |
|---|---|---|---|---|---|---|
| Fish waste (offal) | Municipal anaerobic digester sludge | Mono-digestion | Batch (500 mL) | Mesophilic 37 ± 1 °C | 433.4 mL biogas g−1 VS (73.34% CH4) | [18] |
| Fish waste (offal) (75%) with bagasse (25%) | Municipal anaerobic digester sludge | Co-digestion | Batch (500 mL) | Mesophilic 37 ± 1 °C | 409.5 mL biogas g−1 VS (78.46% CH4) | [18] |
| Fish processing waste (offal) | Sisal wastewater sludge | Mono-digestion | Batch (600 mL) | Mesophilic-low 27 ± 1 °C | 0.39 m3 CH4 kg−1 VS | [10] |
| Fish waste (offal) (33%) with sisal pulp (67%) | Sisal wastewater sludge | Co-digestion | Batch (600 mL) | Mesophilic-low 27 ± 1 °C | 0.62 m3 CH4 kg−1 VS | [10] |
| Fish waste (10%) with fruit and vegetable waste (90%) | Mesophilic sludge from an FVW digester | Co-digestion | Batch (ASBR) (2 L) | Mesophilic 35 °C | 0.436 L biogas g−1 VS removed | [55] |
| Fish waste (offal) (5%) with biodiesel waste (11%) and pig manure (84%) | Granular biomass from a pilot hybrid reactor treating wine waste and from an IC reactor treating brewery wastewater | Co-digestion | Batch (500 mL) | Mesophilic 35 °C | 320.6 L CH4 kg−1 COD (62.8 L CH4 kg−1 wet wt) | [56] |
| Fish viscera | Digested sludge from biogas plant | Mono-digestion | Batch (285 mL) | Mesophilic 35 °C | 127 ± 20 mL CH4 g−1 VS | [16] |
| Fish waste (tuna, sardine, needle fish) | Municipal WWTP sludge | Mono-digestion | Batch (in glass vials) | Mesophilic 37 °C | 0.47 g COD-CH4 g−1 COD (0.26 L CH4 g−1 VS) | [11] |
| Fish waste (mackerel) | Municipal WWTP sludge | Mono-digestion | Batch (in glass vials) | Mesophilic 37 °C | 0.59 g COD-CH4 g−1 COD (0.35 L CH4 g−1 VS) | [11] |
| Fish waste (10%) with pig manure (90%) | Granular sludge from brewery IC reactor | Co-digestion | CSTR (9.2 L) | Mesophilic 35 °C | 0.43 L biogas L−1 d−1 (57.0% CH4) | [81] |
| Fish waste (5%) with pig manure (95%) | Granular sludge from brewery IC reactor | Co-digestion | CSTR (9.2 L) | Mesophilic 35 °C | 0.59 L biogas L−1 d−1 (59.0% CH4) | [81] |
| Salmon fish waste heads | Full-scale food waste digester effluent | Mono-digestion | Batch (300 mL) | Mesophilic 37 °C | 828 ± 15 m3 CH4 t−1 VS (294 m3 CH4 t−1 wet) | [61] |
| Fish sludge (after ω-3 and protein extraction) | Full-scale food waste digester effluent | Mono-digestion | Batch (300 mL) | Mesophilic 37 °C | 742 ± 17 m3 CH4 t−1 VS (234 m3 CH4 t−1 wet) | [61] |
| Fish waste with bread waste silage—ensiled mix | Swine manure digester sludge | Mono-digestion | Batch (2.0 L) | Mesophilic 36.5 °C | 482 mL CH4 g−1 VS | [17] |
| Pacific saury and mackerel and cuttlefish waste | Swine manure digester sludge | Mono-digestion | Batch (1.3 L) | Mesophilic 36.5 °C | 435–543 mL CH4 g−1 VS | [17] |
| Fish canning waste (20%) with strawberry extrudate (80%) | Granular brewery sludge, sewage-sludge hydrolytic biomass | Co-digestion | Batch (1 L) | Mesophilic 35 °C | 120 mL CH4 g−1 VS | [82] |
| Fish by-product (20%) with steam exploded Salix (40%) and cow manure (40%) | Farm digester slurry already adapted to fish silage | Co-digestion | CSTR (10 L) | Mesophilic 37 ± 1 °C | 191.3 mL CH4 g−1 VS | [84] |
| Fish waste silage with cow manure | Pilot-plant culture | Co-digestion | S-CSTR (8 L) | Mesophilic 37 °C | 0.400 L CH4 g−1 VS per day | [68] |
| Fish silage with farm slurry | Same farm digestate | Co-digestion | CSTR (320 m3) | Mesophilic 37 °C | 742.0 L CH4 kg−1 VS degraded | [95] |
| Fish waste silage (3–16%) with cow manure | Digestate from a lab CSTR treating the same mix | Co-digestion | CSTR (8 L) | Mesophilic 37 °C | 0.20–0.30 L CH4 g−1 VS (the higher at 16% fish waste silage) | [57] |
| Fish waste (5%) with strawberry extrudate (54%) and crude glycerol (41%) | Mesophilic digester sludge (municipal) | Co-digestion | Batch (1 L) | Mesophilic 35 °C | 308 L CH4 kg−1 VS | [89] |
| Greenlandic halibut offal with blackwater | Digested sewage sludge | Co-digestion | Batch (1 L) | Mesophilic 37 °C | 619.7 mL CH4 g−1 VS | [92] |
| Shrimp offal with blackwater | Digested sewage sludge | Co-digestion | Batch (1 L) | Mesophilic 37 °C | 346.4 mL CH4 g−1 VS | [92] |
| Saline sludge from recirculating aquaculture | Adapted mixed sludge in ASBR | Mono-digestion | Anaerobic sequencing batch reactor (3 L) | Mesophilic 35 ± 1 °C | 0.08 g COD L−1 day−1 | [101] |
| Marine fish waste sludge | Halotolerant consortium enriched from RAS sludge | Mono-digestion | Batch (500 mL) | Mesophilic 26–35°C | 428 mmol CH4 kg−1 COD day−1 | [72] |
| Mixed municipal, industrial and agricultural wastes including fish | Full scale plant mixed sludge | Co-digestion | CSTR (n.s.) | Mesophilic (n.s.) | 3 695.78 Nm3 CH4 d−1 (1035 day) | [83] |
| Fish viscera round goby intestines | Waste water treatment sewage sludge | Mono-digestion | Batch (100 mL) | Mesophilic 23 and 35 °C | 887 L CH4 kg−1 VS at 35 °C and 853 L CH4 kg−1 VS at 23 °C | [98] |
| Fish waste mixed fraction (heads, skin, bone, intestines) | Waste water treatment sewage sludge | Mono-digestion | Batch (100 mL) | Mesophilic 23 and 35 °C | 660 L CH4 kg−1 VS the average of both temperatures | [98] |
| Fish ensilage | Diluted mixed sludge from food waste and cow manure digester | Mono-digestion | Batch (555 mL) | Mesophilic 37 °C | 691 mL CH4 g−1 VS | [58] |
| Fish ensilage (85%) with cow manure (15%) | Diluted mixed sludge from food waste and cow manure digester | Co-digestion | Batch (555 mL) | Mesophilic 37 °C | 729 mL CH4 g−1 VS | [58] |
| Salmon fish waste silage (13%) with cow manure | Slurry from pilot CSTR treating | Co-digestion | CSTR (8 L) | Mesophilic 37 °C | 0.253–0.312 L CH4 g−1 VS | [69] |
| Fish processing waste | Food and kitchen waste digestate sludge | Mono-digestion | Batch (500 mL) | Mesophilic 37 °C | 178 mL biogas g−1 VS and 97 mL CH4 g−1 VS (54.2% CH4) | [94] |
| Fish processing waste with bamboo hydrochar (1:2) | Food and kitchen waste digestate sludge | Mono-digestion | Batch (500 mL) | Mesophilic 37 °C | 292 mL biogas g−1 VS and 219 mL CH4 g−1 VS (74.9% CH4) | [94] |
| Fish processing waste | Food and kitchen waste digestate sludge | Mono-digestion | Batch (500 mL) | Mesophilic 37 °C | 142 mL CH4 g−1 VS (61% CH4) | [93] |
| Fish processing waste (75%) with liquid fraction of hydrochar (25%) | Food and kitchen waste digestate sludge | Co-digestion | Batch (500 mL) | Mesophilic 37 °C | 133 mL CH4 g−1 VS | [93] |
| Fish waste mixed with vegetable market waste (1:1) | Adapted food waste digester sludge | Co-digestion | Batch (125 mL) | Mesophilic (n.s.) | 463 mL CH4 g−1 VSfed | [107] |
| Fish ensilage with soap stock | Degassed sludge | Co-digestion | Batch (500 mL) | Mesophilic 39 ± 1 °C | 775 mL biogas g−1 TS (61% CH4) | [91] |
| Fish offal (50%) with river tamarind (50%) | Lab anaerobic sludge | Co-digestion | Batch (50 mL) | Mesophilic (n.s.) | 330 NmL CH4 g−1 oDM (76% CH4) | [85] |
| Concentrated effluent from a trout farm after microfiltration and settling | Recirculated mesophilic digestate from the pilot plant | Mono-digestion | CSTR (280 L) | Mesophilic 38 °C | 648.8 NL CH4 kg−1 VS | [134] |
| Fish processing wastewater | Seed sludge from a mesophilic digester and granular sludge from a slaughterhouse UASB reactor | Mono-digestion | Self-agitated anaerobic baffled reactor (SA-ABR) (15.4 L) | Mesophilic 35 ± 1 °C | 1.35 L biogas L−1 reactor d−1 (75% CH4) | [78] |
| Acidogenic fermented fish by-product with rice bran (30%) with sewage sludge (70%) | Lab anaerobic sludge | Co-digestion | Batch (10 L) | Mesophilic 35 ± 1 °C | 0.57 m3 CH4 kg−1 VS | [108] |
| Salmon backbones with cattle manure (5:1) | Cattle manure digestate circulated at the farm | Co-digestion | CSTR (2300 m3) | Mesophilic 38 ± 1 °C | 88 Nm3 biogas t−1 (65% CH4) per wet mixture | [96] |
| Anchovy sludge after limonene oil extraction | Mesophilic agro-industrial digestate | Mono-digestion | Batch (1.1 L) | Mesophilic 35 ± 0.5 °C | 0.28 m3 CH4 kg−1 VS | [109] |
| Squid guts (10%) with mixed dead fish (80%) and soy (10%) and sesame | Sludge from a full-scale digester that treats livestock manure, food waste and food wastewater | Mono-digestion | Batch (1.2 L) | Mesophilic 37 °C | 350.5 mL CH4 g−1 VS | [110] |
| Fish waste slurry (1% vol) with sludge and food waste (5:5) | Mixed sludge digestate | Co-digestion | Batch (80 mL) | Mesophilic 37 °C | 0.27 L CH4 g−1 COD added | [118] |
| Fish waste slurry (5% vol) with sludge and food waste (5:5) | Mixed sludge digestate | Co-digestion | Batch (80 mL) | Mesophilic 37 °C | 0.32 L CH4 g−1 COD added | [118] |
| Fish sludge (catfish RAS) | Granular sludge developing in UASB | Mono-digestion | UASB (1300 L) | Mesophilic 26–35 °C | 0.93 m3 biogas kg−1 VS (74.5% CH4) | [74] |
| Fish silage | Mesophilic digestate from biogas plant | Mono-digestion | Batch (500 mL) | Mesophilic 40 °C | 683 mL CH4 g−1 VS | [99] |
| Thickened RAS fish sludge (3.5% TS) | Dairy manure digester effluent | Mono-digestion | Batch (300 mL) | Mesophilic 35 °C | 519 mL CH4 g−1 VS | [102] |
| Mixed by-products of farmed rainbow trout (offal) | Municipal WWTP sludge | Mono-digestion | CSTR (1 L) | Mesophilic 37 °C | 206.68 NmL CH4 g−1 | [112] |
| Saline RAS solids | Full-scale mesophilic digester sludge | Mono-digestion | Batch (1 L) | Mesophilic low 28 °C | 0.08–0.25 NL CH4 g−1 VS | [103] |
| Fish waste (25 vol%) with pig slurry (80%) and orange pomace pulp (20%) | Mesophilic agro-industrial digestate | Co-digestion | Batch (350 mL) | Mesophilic 37 ± 0.5 °C | 627.23 mL CH4 g−1 VS added | [12] |
| Fish waste (50 vol%) with pig slurry (80%) and orange pomace pulp (20%) | Mesophilic agro-industrial digestate | Co-digestion | Batch (350 mL) | Mesophilic 37 ± 0.5 °C | 669.68 mL CH4 g−1 VS added | [12] |
| African catfish RAS sludge | Digested sewage sludge | Mono-digestion | Batch (32.7 L) | Mesophilic 38 °C | 229 NL CH4 kg−1 VS | [73] |
| African catfish RAS sludge with cucumber residues (25%) | Agricultural biogas plant digestate | Co-digestion | CSTR (10 L) | Mesophilic 38 °C | 381 NL CH4 kg−1 VS | [73] |
| Raw tuna viscera (thermal pretreatment) | Acidogenic reactor sludge | Mono-digestion | Batch (50 mL) | Mesophilic 37 °C | 0.27 g COD-CH4 g−1 CODadded | [66] |
| Raw tuna viscera (cooked) (50%) with fat waste (50%) | Acidogenic reactor sludge | Co-digestion | Batch (50 mL) | Mesophilic 37 °C | 0.87 g COD-CH4 g−1 CODadded | [66] |
| Aquaculture wastewater with cow manure | Partially digested cow manure | Co-digestion | CSTR (45 L) | Thermophilic 54 °C | 0.45 m3 CH4 kg−1 VS | [97] |
| Mixed fish waste | Vegetable market waste digester sludge | Mono-digestion | Batch (650 mL) | Mesophilic 37 ± 2 °C | 0.289 L biogas g−1 VS | [90] |
| Mixed fish waste with vegetable market waste (1:3) | Vegetable market waste digester sludge | Co-digestion | Batch (650 mL) | Mesophilic 37 ± 2 °C | 0.489 L biogas g−1 VS | [90] |
| Fish sludge (20 vol%) with residue biomass coming from MCCA production | Full scale biogas plant sludge | Co-digestion | Batch (400 mL) | Thermophilic 50 °C | 375–445 L CH4 kg−1 VS | [77] |
| Fishery processing industrial wastewater | Adapted anaerobic community in AD-BES | Mono-digestion | AD-BES (7.5 L) | Mesophilic 35 °C | 200–600 L CH4 kg−1 COD | [100] |
| Recirculating aquaculture fish sludge (63%) with food (18%), fruit and vegetable waste (19%) | Dedicated mixed food waste digester slurry | Co-digestion | Batch (35 L) | Mesophilic 37 °C | 401 mL CH4 g−1 VS | [104] |
| Recirculating aquaculture fish sludge | Dedicated mixed food waste digester slurry | Mono-digestion | Batch (35 L) | Mesophilic 37 °C | 48.94 mL CH4 g−1 VS | [104] |
| Sardine processing waste with no pretreatment | Municipal MWWTP sludge | Mono-digestion | Batch (1 L) | Mesophilic 37 °C | 1174 mL CH4 g−1 VS | [111] |
| Sardine processing waste with S. cerevisiae pretreatment | Municipal MWWTP sludge | Mono-digestion | Batch (1 L) | Mesophilic 37 °C | 821.5 mL CH4 g−1 VS | [111] |
| Sardine processing waste with Bacillus sp. pretreatment | Municipal MWWTP sludge | Mono-digestion | Batch (1 L) | Mesophilic 37 °C | 260 mL CH4 g−1 VS | [111] |
| Fish waste (gills and viscera) | Cow dung | Mono-digestion | Batch (500 mL) | Mesophilic 37 °C | 970 mL biogas g−1 VS including 610 mL CH4 g−1 VS | [88] |
| Fish waste (gills and viscera) with water hyacinth (1:1) | Cow dung | Co-digestion | Batch (500 mL) | Mesophilic 37 °C | 1655 mL biogas g−1 VS including 890 mL CH4 g−1 VS | [88] |
| Fish waste (offal) | Cow dung | Co-digestion | Anaerobic baffled biodigester (n.s.) | Mesophilic 27 °C | 69% CH4 of biogas | [135] |
| Fish waste (offal) (12%) with primary sludge (88%) | Preincubated anaerobic sludge from municipal PS digesters | Co-digestion | Batch (285 mL) | Mesophilic 35 °C | 459 mL CH4 g−1 VS added | [19] |
| Fish waste | Cow manure slurry | Mono-digestion | Batch (230 L) | Mesophilic low 21 °C | 248.5 L biogas kg−1 TS (74% CH4) | [136] |
| Shrimp pond bottom sludge with Sarcodia residuals (1:1) | Preincubated anaerobic inoculum | Co-digestion | Batch (750 L) | Mesophilic 37 °C | 478.06 L CH4 kg−1 VS d−1 (62.9% CH4) | [137] |
| Fish waste (offal) (33%) with olive mill wastewater (33%) and fruit, vegetable waste (33%) | Cow dung | Co-digestion | Batch (400 mL) | Mesophilic 37 °C | 132.2 NmL CH4 g−1 VS | [15] |
| Fish processing wastewater | Mixed halotolerant consortium and manure sludge | Mono-digestion | SA-ABR (10.4 L) | Mesophilic 35 ± 1 °C | 0.39–0.45 L biogas g−1 COD (74% CH4) | [78] |
| Fish waste (offal) | Acclimated biogas plant sludge | Mono-digestion | Batch (2 L) | Mesophilic 35 °C | 540.5 ml CH4 g−1 VS | [3] |
| Fish crude oil waste | Acclimated biogas plant sludge | Mono-digestion | Batch (2 L) | Mesophilic 35 °C | 426.3 ml CH4 g−1 VS | [3] |
| Fish waste (offal) | UASB sludge from slaughterhouse wastewater | Mono-digestion | Batch (250 mL) | Mesophilic 37 ± 2 °C | 464.5 mL CH4 g−1 VS | [4] |
| Raw tuna waste (30%) with onion stalks (70%) | Full-scale agro-waste digester sludge | Co-digestion | Semi continuous reactor (2 L) | Mesophilic 35 °C | 0.24 NL CH4 g−1 VS loaded | [2] |
Appendix B
| No. | Feedstock | Process | Reference |
|---|---|---|---|
| 1 | Fish waste and sisal pulp | Batch anaerobic mono-digestion and co-digestion | [10] |
| 2 | Fish waste and bagasse | Batch anaerobic mono-digestion and co-digestion | [18] |
| 3 | Pig manure, tuna fish waste and biodiesel waste | Batch anaerobic co-digestion with feed optimization | [56] |
| 4 | Fruit and vegetable waste with fish waste, abattoir wastewater and waste activated sludge | Mesophilic anaerobic co-digestion in sequencing batch reactors | [55] |
| 5 | Tuna, sardines, mackerel and needlefish waste with gorse | Batch anaerobic mono-digestion and co-digestion | [11] |
| 6 | Seaweed, brown algae, green algae and fish viscera | Batch anaerobic mono-digestion | [16] |
| 7 | Salmon fish waste, fish sludge and Jerusalem artichoke | Batch anaerobic mono-digestion and co-digestion after oil extraction | [61] |
| 8 | Pig manure, fish waste and biodiesel waste | Continuous mesophilic anaerobic co-digestion | [81] |
| 9 | Fish waste, bread waste, brewery grain waste and fish waste silages | Ensiling followed by batch anaerobic digestion | [17] |
| 10 | Fish by-product, steam-exploded Salix and cow manure | Mesophilic semi-continuous anaerobic co-digestion | [84] |
| 11 | Fish waste and residual strawberry extrudate | Mesophilic batch anaerobic co-digestion | [82] |
| 12 | Fish waste silage and cow manure | Mesophilic semi-continuous anaerobic co-digestion | [68] |
| 13 | Saline sludge from brackish aquaculture recirculation system | Batch anaerobic digestion with compatible solute addition | [71] |
| 14 | Fish waste silage and cow manure | Mesophilic continuous anaerobic co-digestion with metagenomic analysis | [57] |
| 15 | Dairy cow slurry and fish silage | Farm-scale mesophilic anaerobic co-digestion with energy balance | [95] |
| 16 | Blackwater with Greenlandic halibut offal and shrimp offal | Mesophilic batch anaerobic co-digestion compared with aerobic storage | [92] |
| 17 | Strawberry extrudate, fish waste and crude glycerol | Mesophilic lab-scale anaerobic co-digestion | [89] |
| 18 | Microalgal bacterial flocs from pikeperch aquaculture wastewater | Batch anaerobic digestion with pretreatment screening | [138] |
| 19 | Saline aquaculture sludge from a recirculating aquaculture system | Mesophilic ASBR anaerobic digestion with carbohydrate addition and ultrasonication pretreatment | [101] |
| 20 | Primary and secondary rainbow trout sludge | Anaerobic acidogenic digestion with indigenous Alcaligenes faecalis | [139] |
| 21 | Marine fish waste sludge from a recirculating aquaculture system | Anaerobic biomethane conversion with a halotolerant microbial consortium | [72] |
| 22 | Manure, straw, bagasse, fish processing wastewater, alcohol waste, food waste and human excrement | Industrial anaerobic co-digestion for bioCNG production with efficiency modeling | [83] |
| 23 | Digestates from food waste, sewage sludge, animal manure, whey permeates and fish ensilage | Digestate soil application and metal leaching assessment | [140] |
| 24 | Round goby heads, intestines, skin and bone residues with sewage sludge | Batch anaerobic co-digestion | [98] |
| 25 | Fish sludge and dairy manure | Drying and anaerobic co-digestion followed by fertilizer and logistics assessment | [76] |
| 26 | Fish waste and organic material from stranded beach debris | BMP assays for anaerobic digestion potential and residue valorization assessment | [141] |
| 27 | Whey, manure and fish ensilage | Batch BMP anaerobic mono-digestion and co-digestion | [58] |
| 28 | Tilapia and African catfish RAS sludge | Sequential UASB-EGSB anaerobic digestion with aerobic and anaerobic batch controls | [59] |
| 29 | Fish waste silage and cow manure | Semi-continuous CSTR anaerobic co-digestion with HRT and microbial analysis | [69] |
| 30 | Wastewater sludge with garden grass or fish waste | Anaerobic co-digestion blend optimization | [142] |
| 31 | Goat dung, chicken dung, fish waste, rice waste, POME and sewage sludge | Mesophilic BMP anaerobic digestion with inoculum comparison | [143] |
| 32 | Fish processing waste and liquid fraction from hydrothermal carbonization of bamboo residues | Batch anaerobic co-digestion with HTC liquid fraction addition | [93] |
| 33 | Fish processing waste with bamboo hydrochar | Batch anaerobic digestion with hydrochar addition | [94] |
| 34 | Fish ensilage, soapstock, alkaline fish glycerine and ethyl monoesters | Batch BMP anaerobic co-digestion | [91] |
| 35 | Fish waste and vegetable waste | Batch anaerobic mono-digestion and co-digestion | [107] |
| 36 | Tilapia head, carcass, viscera, fin, skin, scale and mixed residues | Batch BMP anaerobic digestion of separate waste fractions | [144] |
| 37 | Dolphin fish offal and river tamarind | Batch BMP anaerobic co-digestion with mixing ratio optimization | [85] |
| 38 | Fish processing wastewater | Batch and continuous mesophilic anaerobic digestion in a SA-ABR with calcium, cobalt and iron supplementation | [78] |
| 39 | Trout aquaculture sludge | Mesophilic anaerobic digestion in conventional and hybrid fixed bed reactors | [134] |
| 40 | Fishery by-products, rice bran and sewage sludge | Acidogenic fermentation followed by batch anaerobic co-digestion | [108] |
| 41 | Fish waste, sewage sludge and grass | Lab-scale anaerobic co-digestion with microbial and metabolomic analysis | [119] |
| 42 | Anchovy processing waste after fish oil extraction | Batch BMP anaerobic digestion after limonene extraction | [109] |
| 43 | Salmon filleting co-streams and cattle manure | Modeled mesophilic anaerobic co-digestion for biogas and fertilizer production | [96] |
| 44 | Sisal waste with marine fish processing waste and other co-substrates | LCA-based anaerobic co-digestion scenario with bioenergy co-production | [127] |
| 45 | Viscera from Argentine hake, Brazilian flathead, Brazilian codling and stripped weakfish | Digestive proteinase extraction and characterization | [145] |
| 46 | Dewatered fish sludge and manure solids | Phosphorus fertilizer assessment after drying, composting, separation or pyrolysis | [75] |
| 47 | Salicornia europaea and Salicornia ramosissima plant material | Batch BMP anaerobic digestion of halophyte biomass | [146] |
| 48 | Fish processing effluent | Anaerobic treatment in ABR followed by anaerobic filter | [79] |
| 49 | Fish solid waste and plant waste from aquaponics | Onsite anaerobic digestion in UASB and plant waste digester | [74] |
| 50 | Fish waste powder | Mesophilic batch anaerobic digestion with microbial seed comparison | [110] |
| 51 | Sewage sludge, food waste and fish waste | Semi-continuous anaerobic co-digestion with repeated fish waste spikes | [118] |
| 52 | Cod processing fish waste and manure residues | LCA and cost scenario for anaerobic co-digestion with CHP energy recovery | [122] |
| 53 | Fish silage | Batch anaerobic digestion with FeCl3 addition and magnetic field exposure | [99] |
| 54 | Fish intestines | Feedstock characterization and methane content analysis for biogas production | [147] |
| 55 | Farmed rainbow trout by-products | Mesophilic batch anaerobic mono-digestion with kinetic modeling | [112] |
| 56 | Aquaculture solids from rainbow trout RAS | Continuous anaerobic digestion with iron supplementation in freshwater and saline conditions | [103] |
| 57 | Fish sludge from Atlantic salmon and rainbow trout RAS | Batch anaerobic mono-digestion with varying initial solids concentration | [102] |
| 58 | Anchovy fillet leftovers | LimoFish valorization with anaerobic digestion option and LCA | [126] |
| 59 | Fish waste and anaerobic sewage sludge | Batch anaerobic co-digestion with sewage sludge to fish waste ratio optimization | [67] |
| 60 | Fish sludge and dead fish from sea trout production | Consequential LCA with anaerobic digestion valorization | [125] |
| 61 | Pig slurry, orange pomace and fish waste | Batch anaerobic co-digestion with fish waste incorporation | [12] |
| 62 | Fish waste and water hyacinth | Batch anaerobic co-digestion with RSM optimization | [87] |
| 63 | Fish waste and water hyacinth | Mesophilic batch anaerobic co-digestion with substrate ratio, inoculum and dilution testing | [86] |
| 64 | Raw and cooked tuna viscera with fat waste, dairy wastewater and secondary sludge | Batch anaerobic mono-digestion with thermal pretreatment and co-digestion tests | [66] |
| 65 | African catfish RAS sludge and greenhouse plant residues | Batch, semi-continuous CSTR and UASB anaerobic digestion with mono-fermentation and co-fermentation | [73] |
| 66 | Aquaculture wastewater and digested cow manure | Thermophilic pilot-scale anaerobic co-digestion with fertilizer recovery | [97] |
| 67 | Food waste residue from MCCA production and RAS fish sludge | Thermophilic batch anaerobic digestion and co-digestion followed by plant growth testing | [77] |
| 68 | Mixed fish waste and vegetable market waste | Mesophilic batch anaerobic co-digestion with kinetic modeling | [90] |
| 69 | RAS fish sludge, food waste and fruit and vegetable waste | Mesophilic BMP, batch pilot and semi-continuous anaerobic co-digestion | [104] |
| 70 | Fishery processing wastewater | Bioelectrochemically improved anaerobic digestion in AD-BES system | [100] |
| 71 | Sardine processing waste | Single-stage and two-stage anaerobic digestion with microbial pretreatment | [111] |
| 72 | Fish sludge from aquaponics | Coupled aquaponics with onsite UASB anaerobic digestion for nutrient recovery | [148] |
| 73 | Fish waste, water hyacinth and cow dung | Mesophilic batch anaerobic mono-digestion and co-digestion with ratio optimization | [88] |
| 74 | European seabass fecal waste from different aquafeeds | Anoxic batch anaerobic digestion for organic acid production and nutrient solubilization | [120] |
| 75 | Potato waste, leftover cooked food and fish waste | Batch anaerobic mono-digestion in small-scale floating-drum digester | [136] |
| 76 | Fish waste and primary sludge | BMP anaerobic co-digestion with mixing ratio and kinetic analysis | [19] |
| 77 | Sarcodia residuals and shrimp pond bottom sludge | Anaerobic digestion within zero waste aquaculture valorization | [137] |
| 78 | Fish waste and cow dung | Anaerobic digestion for biogas and transesterification for biodiesel | [135] |
| 79 | Brackish aquaculture sludge from RAS | UASB anaerobic digestion | [149] |
| 80 | Freshwater RAS sludge | Mesophilic ASBR anaerobic digestion with saline adaptation | [150] |
| 81 | Brackish aquaculture sludge from three RAS | Sludge characterization and UASB anaerobic digestion for methane production | [151] |
| 82 | Raw chitin from crab shells | Fungal prehydrolysis followed by dark fermentation and anaerobic digestion | [65] |
| 83 | Salmon fish sludge from land-based RAS | Batch dark fermentation for hydrogen and volatile fatty acid production | [64] |
| 84 | Model fruit and vegetable waste with acid-hydrolyzed fish waste | Hyperthermophilic dark fermentation co-digestion for hydrogen production | [63] |
| 85 | Fish waste and cow dung | Techno-economic biorefinery model with anaerobic co-fermentation and fertilizer recovery | [124] |
| 86 | UASB sludge from marine RAS with Cryptocaryon irritans life stages | Parasite survival testing under anaerobic sludge conditions | [152] |
| 87 | Seafood processing wastewater | Pilot-scale AnMBR treatment in real-time mode | [80] |
| 88 | Fish sludge | Batch SMFD anaerobic treatment with electron shuttles | [117] |
| 89 | Fish waste | Techno-economic modeling of hydrolysis and anaerobic digestion valorization routes | [5] |
| 90 | Mechanical filter wash water sludge from Clarias gariepinus RAS | Two-stage sedimentation for sludge concentration and further biogas use | [153] |
| 91 | Fish silage and cattle manure | Model-based low-solids anaerobic co-digestion with effluent recirculation and separation | [70] |
| 92 | Fish sludge and aquaculture effluent water from salmon RAS | LCA of anaerobic digestion and microalgae cultivation for nutrient and energy recovery | [123] |
| 93 | RAS sludge from Atlantic salmon fed two diets | Batch anaerobic mono-digestion with fish diet comparison | [13] |
| 94 | Dairy manure and aquaculture sludge | Batch anaerobic co-digestion with mixing ratio and HRT optimization | [14] |
| 95 | Olive mill wastewater, cow dung, fruit and vegetable waste and fish waste | Mesophilic batch anaerobic co-digestion with kinetic modeling | [15] |
| 96 | Artisanal fish waste from Tumaco | Mesophilic batch anaerobic mono-digestion with TS concentration testing | [4] |
| 97 | Fish waste and fish crude oil waste from carp viscera | Mesophilic batch anaerobic mono-digestion with microbial community analysis | [3] |
| 98 | Tilapia and Clarias filleting by-products from RAS | LCA of RAS farming with by-products used for biogas production | [154] |
| 99 | Raw and deoiled tuna waste with onion stalks | Semi-continuous anaerobic co-digestion with fish oil extraction and fertilizer recovery | [2] |
| 100 | Nile perch waste and cow rumen cud | Anaerobic co-digestion for biogas production | [155] |
| 101 | Nile perch heads, skin, offal and skeleton | Anaerobic digestion with fish waste fraction comparison | [156] |
| 102 | Fish processing wastewater | Continuous upflow aged refuse packed bioreactor treatment with methane recovery | [157] |
| 103 | Fish sludge | Anaerobic digestion with iron-sludge addition and intermittent aeration | [158] |
| 104 | Dead fish waste | Repeated-batch anaerobic digestion start-up with feeding strategy comparison | [159] |
| 105 | Brackish aquaculture sludge | Mesophilic batch and continuous anaerobic digestion | [160] |
| 106 | Olive flounder and starry flounder fractions | Mesophilic BMP anaerobic mono-digestion | [161] |
| 107 | Waste activated sludge and fish waste | Mesophilic batch anaerobic co-digestion | [162] |
| 108 | Saline fish wastewater and cow manure | BMP anaerobic co-digestion with salinity toxicity assessment | [163] |
| 109 | Fish processing wastewater | Continuous mesophilic anaerobic digestion | [164] |
| 110 | Waste activated sludge and aquaculture sludge | Mesophilic batch anaerobic co-digestion | [165] |
| 111 | Sewage sludge and acid-fermented fish by-product broth | Anaerobic co-digestion | [166] |
| 112 | Saline tuna processing wastewater | Continuous anaerobic digestion | [167] |
| 113 | Saline fish evisceration wastewater | Batch anaerobic digestion at different feed-to-microorganism ratios and salinities | [168] |
| 114 | Fish waste and seagrass with macroalgae | Batch anaerobic mono-digestion and co-digestion | [169] |
| 115 | Tilapia and sturgeon processing fractions and water treatment sludge | Batch anaerobic mono-digestion with first-order kinetic modeling | [170] |
| 116 | Fish waste and strawberry extrudate | Anaerobic co-digestion at different mixing ratios | [171] |
| 117 | Aquaculture wastewater sediment | Anaerobic mono-digestion with biomethane yield modeling | [172] |
| 118 | Trout processing by-products | Anaerobic mono-digestion at different organic matter loads | [173] |
| 119 | Brackish aquaculture sludge | Anaerobic mono-digestion under different electron-acceptor conditions | [174] |
| 120 | Biologically pretreated Nile perch solid waste with fish scales as a biofilm carrier | Anaerobic digestion in packed-bed bioreactors with different biofilm carriers | [175] |
Appendix C
| Section and Topic | Item # | Checklist Item | Location Where Item is Reported |
|---|---|---|---|
| Title | |||
| Title | 1 | Identify the report as a systematic review. | Title page |
| Abstract | |||
| Abstract | 2 | See the PRISMA 2020 for Abstracts checklist. | Abstract |
| Introduction | |||
| Rationale | 3 | Describe the rationale for the review in the context of existing knowledge. | Section 1 |
| Objectives | 4 | Provide an explicit statement of the objective(s) or question(s) the review addresses. | Section 1 |
| Methods | |||
| Eligibility criteria | 5 | Specify the inclusion and exclusion criteria for the review and how studies were grouped for the syntheses. | Section 2.1; Supplementary Text S1 |
| Information sources | 6 | Specify all databases, registers, websites, organisations, reference lists and other sources searched or consulted to identify studies. Specify the date when each source was last searched or consulted. | Section 2 and Section 2.1 |
| Search strategy | 7 | Present the full search strategies for all databases, registers and websites, including any filters and limits used. | Section 2.1; Appendix A, Table A1 (Scopus) and Table A2 (Web of Science) |
| Selection process | 8 | Specify the methods used to decide whether a study met the inclusion criteria of the review, including how many reviewers screened each record and each report retrieved, whether they worked independently and if applicable, details of automation tools used in the process. | Section 2.1; Supplementary Text S1 |
| Data collection process | 9 | Specify the methods used to collect data from reports, including how many reviewers collected data from each report, whether they worked independently, any processes for obtaining or confirming data from study investigators and if applicable, details of automation tools used in the process. | Supplementary Text S1 |
| Data items | 10a | List and define all outcomes for which data were sought. Specify whether all results that were compatible with each outcome domain in each study were sought (e.g., for all measures, time points, analyses) and if not, the methods used to decide which results to collect. | Supplementary Text S1 |
| 10b | List and define all other variables for which data were sought (e.g., participant and intervention characteristics, funding sources). Describe any assumptions made about any missing or unclear information. | Supplementary Text S1 | |
| Study risk of bias assessment | 11 | Specify the methods used to assess risk of bias in the included studies, including details of the tool(s) used, how many reviewers assessed each study and whether they worked independently and if applicable, details of automation tools used in the process. | Supplementary Text S1 (methodological reporting quality appraisal; no formal risk-of-bias assessment) |
| Effect measures | 12 | Specify for each outcome the effect measure(s) (e.g., risk ratio, mean difference) used in the synthesis or presentation of results. | Supplementary Text S1 |
| Synthesis methods | 13a | Describe the processes used to decide which studies were eligible for each synthesis (e.g., tabulating the study intervention characteristics and comparing against the planned groups for each synthesis (item #5)). | Supplementary Text S1 |
| 13b | Describe any methods required to prepare the data for presentation or synthesis, such as handling of missing summary statistics, or data conversions. | Supplementary Text S1 | |
| 13c | Describe any methods used to tabulate or visually display results of individual studies and syntheses. | Section 2.2; Supplementary Text S1 | |
| 13d | Describe any methods used to synthesize results and provide a rationale for the choice(s). If meta-analysis was performed, describe the model(s), method(s) to identify the presence and extent of statistical heterogeneity and software package(s) used. | Supplementary Text S1 | |
| 13e | Describe any methods used to explore possible causes of heterogeneity among study results (e.g., subgroup analysis, meta-regression). | Supplementary Text S1 (no subgroup meta-analysis or meta-regression) | |
| 13f | Describe any sensitivity analyses conducted to assess robustness of the synthesized results. | Section 2.1 and Section 3.4 | |
| Reporting bias assessment | 14 | Describe any methods used to assess risk of bias due to missing results in a synthesis (arising from reporting biases). | Supplementary Text S1 (no formal reporting-bias assessment) |
| Certainty assessment | 15 | Describe any methods used to assess certainty (or confidence) in the body of evidence for an outcome. | Supplementary Text S1 (no formal certainty assessment) |
| Results | |||
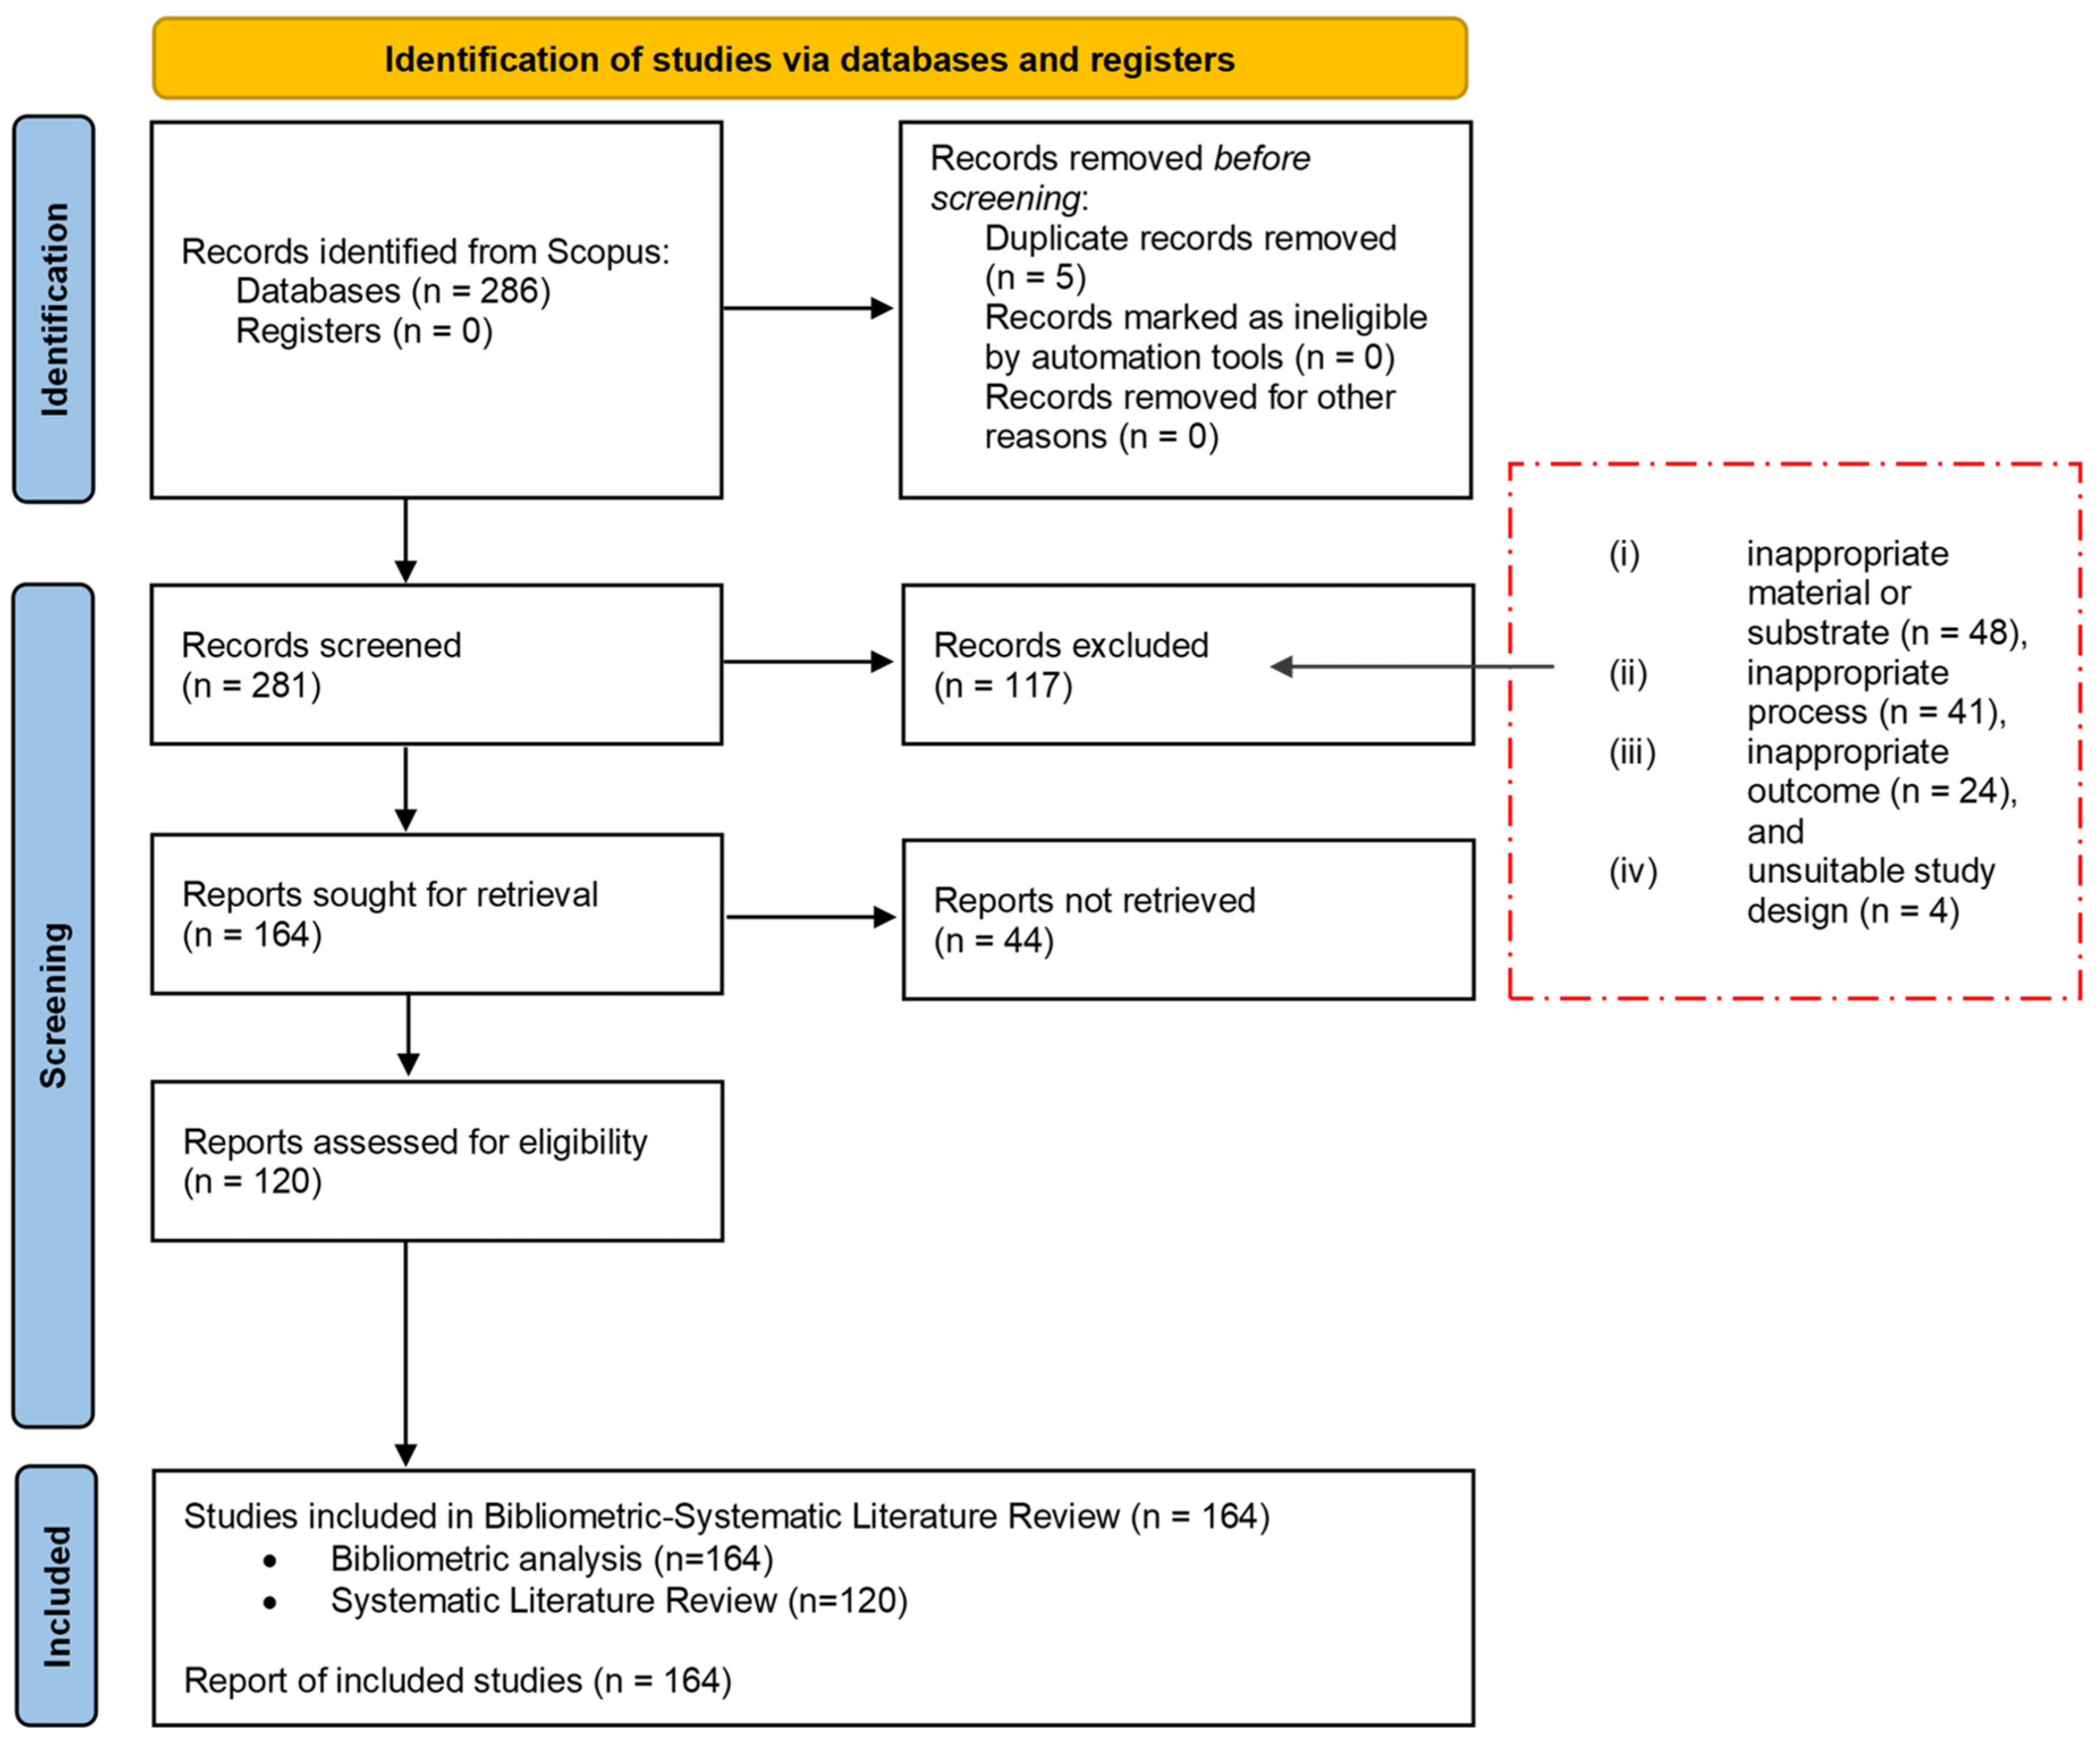
| Study selection | 16a | Describe the results of the search and selection process, from the number of records identified in the search to the number of studies included in the review, ideally using a flow diagram. | Section 2.1 and Figure 2 (primary Scopus search); Section 3.4 (database-coverage sensitivity analysis) |
| 16b | Cite studies that might appear to meet the inclusion criteria, but which were excluded and explain why they were excluded. | Section 2.1; Supplementary Text S1 | |
| Study characteristics | 17 | Cite each included study and present its characteristics. | Section 3.2.1, Section 3.2.2, Section 3.2.3, Section 3.2.4, Section 3.2.5 and Section 3.2.6; Table 2, Table 3, Table 4, Table A3 and Table A4 |
| Risk of bias in studies | 18 | Present assessments of risk of bias for each included study. | Supplementary Text S1 |
| Results of individual studies | 19 | For all outcomes, present, for each study: (a) summary statistics for each group (where appropriate) and (b) an effect estimate and its precision (e.g., confidence/credible interval), ideally using structured tables or plots. | Section 3.2.2, Section 3.2.3, Section 3.2.4, Section 3.2.5 and Section 3.2.6; Table 2, Table 3, Table 4 and Table A3 |
| Results of syntheses | 20a | For each synthesis, briefly summarise the characteristics and risk of bias among contributing studies. | Section 3.2.1, Section 3.2.2, Section 3.2.3, Section 3.2.4, Section 3.2.5 and Section 3.2.6; Table 3, Table 4 and Table A3 |
| 20b | Present results of all statistical syntheses conducted. If meta-analysis was done, present for each the summary estimate and its precision (e.g., confidence/credible interval) and measures of statistical heterogeneity. If comparing groups, describe the direction of the effect. | Narrative synthesis: Section 3.2.1, Section 3.2.2, Section 3.2.3, Section 3.2.4, Section 3.2.5 and Section 3.2.6; Supplementary Text S1 | |
| 20c | Present results of all investigations of possible causes of heterogeneity among study results. | Possible sources of heterogeneity were explored narratively in Section 3.2.2, Section 3.2.3, Section 3.2.4, Section 3.2.5 and Section 3.2.6 | |
| 20d | Present results of all sensitivity analyses conducted to assess the robustness of the synthesized results. | Section 3.4 | |
| Reporting biases | 21 | Present assessments of risk of bias due to missing results (arising from reporting biases) for each synthesis assessed. | N/A |
| Certainty of evidence | 22 | Present assessments of certainty (or confidence) in the body of evidence for each outcome assessed. | N/A |
| Discussion | |||
| Discussion | 23a | Provide a general interpretation of the results in the context of other evidence. | Section 3.1, Section 3.2, Section 3.3, Section 3.4 and Section 5 |
| 23b | Discuss any limitations of the evidence included in the review. | Section 2.3; Section 3.2.2, Section 3.2.3 and Section 3.2.4; Section 5 | |
| 23c | Discuss any limitations of the review processes used. | Section 2.3 | |
| 23d | Discuss implications of the results for practice, policy and future research. | Section 4 and Section 5 | |
| Other information | |||
| Registration and protocol | 24a | Provide registration information for the review, including register name and registration number, or state that the review was not registered. | Section 2.1; Section 2.3; Data Availability Statement |
| 24b | Indicate where the review protocol can be accessed, or state that a protocol was not prepared. | Retrospective OSF methodological record is identified Section 2.1; Supplementary Text S1; Data Availability Statement | |
| 24c | Describe and explain any amendments to information provided at registration or in the protocol. | N/A | |
| Support | 25 | Describe sources of financial or non-financial support for the review and the role of the funders or sponsors in the review. | Funding statement |
| Competing interests | 26 | Declare any competing interests of review authors. | Conflicts of Interest statement |
| Availability of data, code and other materials | 27 | Report which of the following are publicly available and where they can be found: template data collection forms; data extracted from included studies; data used for all analyses; analytic code; any other materials used in the review. | Data Availability Statement (the study selection datasets and bibliometric corpus are available via OSF) |
References
- Food and Agriculture Organization of the United Nations. The State of World Fisheries and Aquaculture 2026; FAO: Rome, Italy, 2026. [Google Scholar]
- Pedullà, A.; Bonaccorsi, L.M.; Limonti, C.; Paone, E.; Siciliano, A.; Calabrò, P.S. Advancing the Circular Economy: A Zero-Waste Valorisation Approach for the de-Oiled Fish Waste through Anaerobic Co-Digestion and Fertilisers Production. J. Environ. Chem. Eng. 2025, 13, 117322. [Google Scholar] [CrossRef] [Scilit]
- Bücker, F.; Marder, M.; Peiter, M.R.; Lehn, D.N.; Esquerdo, V.M.; Antonio de Almeida Pinto, L.; Konrad, O. Fish Waste: An Efficient Alternative to Biogas and Methane Production in an Anaerobic Mono-Digestion System. Renew. Energy 2020, 147, 798–805. [Google Scholar] [CrossRef] [Scilit]
- Cadavid-Rodríguez, L.S.; Vargas-Muñoz, M.A.; Plácido, J. Biomethane from Fish Waste as a Source of Renewable Energy for Artisanal Fishing Communities. Sustain. Energy Technol. Assess. 2019, 34, 110–115. [Google Scholar] [CrossRef] [Scilit]
- Okoro, O.V.; Nie, L.; Denayer, J.F.M.; Karimi, K.; Shavandi, A. Analysis of the Technical and Economic Viability of Upcycling Sustainable Fish Waste for Bioproduct Production. Circ. Econ. Sustain. 2025, 5, 2387–2405. [Google Scholar] [CrossRef] [Scilit]
- Kruijssen, F.; Tedesco, I.; Ward, A.; Pincus, L.; Love, D.; Thorne-Lyman, A.L. Loss and Waste in Fish Value Chains: A Review of the Evidence from Low and Middle-Income Countries. Glob. Food Sec. 2020, 26, 100434. [Google Scholar] [CrossRef] [Scilit]
- FAO. In Brief to The State of World Fisheries and Aquaculture 2024; FAO: Rome, Italy, 2024; Volume 35. [Google Scholar]
- Benato, A.; Macor, A. Italian Biogas Plants: Trend, Subsidies, Cost, Biogas Composition and Engine Emissions. Energies 2019, 12, 979. [Google Scholar] [CrossRef] [Scilit]
- Łukomska, A.; Witaszek, K.; Dach, J. Current State of Development of Demand-Driven Biogas Plants in Poland. Processes 2025, 13, 2369. [Google Scholar] [CrossRef] [Scilit]
- Mshandete, A.; Kivaisi, A.; Rubindamayugi, M.; Mattiasson, B. Anaerobic Batch Co-Digestion of Sisal Pulp and Fish Wastes. Bioresour. Technol. 2004, 95, 19–24. [Google Scholar] [CrossRef] [Scilit]
- Eiroa, M.; Costa, J.C.; Alves, M.M.; Kennes, C.; Veiga, M.C. Evaluation of the Biomethane Potential of Solid Fish Waste. Waste Manag. 2012, 32, 1347–1352. [Google Scholar] [CrossRef] [Scilit]
- Silva, J.; Fragoso, R. Enhanced Biomethanation: The Impact of Incorporating Fish Waste on the Co-Digestion of Pig Slurry and Orange Pomace. Energies 2023, 16, 5860. [Google Scholar] [CrossRef] [Scilit]
- Choudhury, A.; Lepine, C.; Hersom, M.; Good, C. Characteristics of Aquaculture Sludge Produced from Two Different Fish Diets and Its Impact on Biogas Production. Aquac. Eng. 2025, 111, 102597. [Google Scholar] [CrossRef] [Scilit]
- Rana, M.S.; Nandi, R.; Brown, P.B.; Huang, J.Y.; Ni, J.Q. Optimizing Feedstocks Mixing Ratio and Hydraulic Retention Time for Biogas Production From Anaerobic Codigestion of Dairy Manure and Aquaculture Sludge. GCB Bioenergy 2025, 17, e70079. [Google Scholar] [CrossRef] [Scilit]
- Erraji, H.; Abdessadek, E.; Tallou, A.; Asehraou, A. Enhanced Biomethane Production from Olive Mill Wastewater via Co-Digestion with Cow Dung, Fruit, Vegetable, and Fish Wastes: An Experimental and Kinetic Study. Waste Biomass Valorization 2025, 16, 6289–6300. [Google Scholar] [CrossRef] [Scilit]
- Gurung, A.; Van Ginkel, S.W.; Kang, W.C.; Qambrani, N.A.; Oh, S.E. Evaluation of Marine Biomass as a Source of Methane in Batch Tests: A Lab-Scale Study. Energy 2012, 43, 396–401. [Google Scholar] [CrossRef] [Scilit]
- Kafle, G.K.; Kim, S.H.; Sung, K.I. Ensiling of Fish Industry Waste for Biogas Production: A Lab Scale Evaluation of Biochemical Methane Potential (BMP) and Kinetics. Bioresour. Technol. 2013, 127, 326–336. [Google Scholar] [CrossRef] [Scilit]
- Xu, J.; Mustafa, A.M.; Sheng, K. Effects of Inoculum to Substrate Ratio and Co-Digestion with Bagasse on Biogas Production of Fish Waste. Environ. Technol. 2017, 38, 2517–2522. [Google Scholar] [CrossRef] [Scilit]
- Noh, E.J.; Shin, S.G.; Cheon, J.L.; Ahn, J.H. Anaerobic Co-Digestion of Fish Waste and Primary Sludge: Biochemical Methane Potential and Mixing Ratio. Waste Biomass Valorization 2025, 17, 3835–3843. [Google Scholar] [CrossRef] [Scilit]
- Hassan, W.; Duarte, A.E. Bibliometric Analysis: A Few Suggestions. Curr. Probl. Cardiol. 2024, 49, 102640. [Google Scholar] [CrossRef] [Scilit]
- Lim, W.M.; Kumar, S.; Donthu, N. How to Combine and Clean Bibliometric Data and Use Bibliometric Tools Synergistically: Guidelines Using Metaverse Research. J. Bus. Res. 2024, 182, 114760. [Google Scholar] [CrossRef] [Scilit]
- Donthu, N.; Kumar, S.; Mukherjee, D.; Pandey, N.; Lim, W.M. How to Conduct a Bibliometric Analysis: An Overview and Guidelines. J. Bus. Res. 2021, 133, 285–296. [Google Scholar] [CrossRef] [Scilit]
- Passas, I. Bibliometric Analysis: The Main Steps. Encyclopedia 2024, 4, 1014–1025. [Google Scholar] [CrossRef] [Scilit]
- Marzi, G.; Balzano, M.; Caputo, A.; Pellegrini, M.M. Guidelines for Bibliometric-Systematic Literature Reviews: 10 Steps to Combine Analysis, Synthesis and Theory Development. Int. J. Manag. Rev. 2025, 27, 81–103. [Google Scholar] [CrossRef] [Scilit]
- Azarian, M.; Yu, H.; Shiferaw, A.T.; Stevik, T.K. Do We Perform Systematic Literature Review Right? A Scientific Mapping and Methodological Assessment. Logistics 2023, 7, 89. [Google Scholar] [CrossRef] [Scilit]
- Mohammed, M.A.; De-Pablos-Heredero, C.; Montes Botella, J.L. A Systematic Literature Review on the Revolutionary Impact of Blockchain in Modern Business. Appl. Sci. 2024, 14, 11077. [Google Scholar] [CrossRef] [Scilit]
- Page, M.J.; McKenzie, J.E.; Bossuyt, P.M.; Boutron, I.; Hoffmann, T.C.; Mulrow, C.D.; Shamseer, L.; Tetzlaff, J.M.; Akl, E.A.; Brennan, S.E.; et al. The PRISMA 2020 Statement: An Updated Guideline for Reporting Systematic Reviews. BMJ 2021, 372, n71. [Google Scholar] [CrossRef] [Scilit]
- De Cassai, A.; Dost, B.; Tulgar, S.; Boscolo, A. Methodological Standards for Conducting High-Quality Systematic Reviews. Biology 2025, 14, 973. [Google Scholar] [CrossRef] [Scilit]
- Snyder, H. Literature Review as a Research Methodology: An Overview and Guidelines. J. Bus. Res. 2019, 104, 333–339. [Google Scholar] [CrossRef] [Scilit]
- Paul, J.; Criado, A.R. The Art of Writing Literature Review: What Do We Know and What Do We Need to Know? Int. Bus. Rev. 2020, 29, 101717. [Google Scholar] [CrossRef] [Scilit]
- Aria, M.; Cuccurullo, C. Bibliometrix: An R-Tool for Comprehensive Science Mapping Analysis. J. Informetr. 2017, 11, 959–975. [Google Scholar] [CrossRef] [Scilit]
- van Eck, N.J.; Waltman, L. Visualizing Bibliometric Networks. In Measuring Scholarly Impact; Springer International Publishing: Cham, Switzerland, 2014. [Google Scholar]
- Khalil, H.; Peters, M.D.J.; McInerney, P.A.; Godfrey, C.M.; Alexander, L.; Evans, C.; Pieper, D.; Moraes, E.B.; Tricco, A.C.; Munn, Z.; et al. The Role of Scoping Reviews in Reducing Research Waste. J. Clin. Epidemiol. 2022, 152, 30–35. [Google Scholar] [CrossRef] [Scilit]
- Ahuja, I.; Dauksas, E.; Remme, J.F.; Richardsen, R.; Løes, A.K. Fish and Fish Waste-Based Fertilizers in Organic Farming–With Status in Norway: A Review. Waste Manag. 2020, 115, 95–112. [Google Scholar] [CrossRef] [Scilit]
- Arvanitoyannis, I.S.; Kassaveti, A. Fish Industry Waste: Treatments, Environmental Impacts, Current and Potential Uses. Int. J. Food Sci. Technol. 2008, 43, 726–745. [Google Scholar] [CrossRef] [Scilit]
- Anu Prasanna, V.; Chandrasekhar, T.; Riazunnisa, K.; Kumar, P.R.; Teja, S.V.R.; Rajeswari, D.; Reddy, M.C.; Wee, Y.J.; Lebaka, V.R. Fish Waste: A Potential Source of Biodiesel. Fermentation 2023, 9, 861. [Google Scholar] [CrossRef] [Scilit]
- Gill, J.M.; Hussain, S.M.; Ali, S.; Ghafoor, A.; Adrees, M.; Nazish, N.; Naeem, A.; Naeem, E.; Alshehri, M.A.; Rashid, E. Fish Waste Biorefinery: A Novel Approach to Promote Industrial Sustainability. Bioresour. Technol. 2025, 419, 132050. [Google Scholar] [CrossRef] [Scilit]
- Sultan, F.A.; Routroy, S.; Thakur, M. Understanding Fish Waste Management Using Bibliometric Analysis: A Supply Chain Perspective. Waste Manag. Res. 2023, 41, 531–553. [Google Scholar] [CrossRef] [Scilit]
- Stahlschmidt, S.; Stephen, D. Comparison of Web of Science, Scopus and Dimensions Databases. In Comparison of Web of Science, Scopus and Dimensions Databases-KB Forschungspoolprojekt 2020; German Centre for Higher Education Research and Science Studies: Hannover, Germany, 2020. [Google Scholar]
- Pranckutė, R. Web of Science (WoS) and Scopus: The Titans of Bibliographic Information in Today’s Academic World. Publications 2021, 9, 12. [Google Scholar] [CrossRef] [Scilit]
- Krippendorff, K. Content Analysis An Introduction to Its Methodology Fourth Edition Content Analysis, 4th ed.; SAGE Publications: Thousand Oaks, CA, USA, 2019. [Google Scholar]
- Pettitt, A.N. A Non-Parametric Approach to the Change-Point Problem. Appl. Stat. 1979, 28, 126–135. [Google Scholar] [CrossRef] [Scilit]
- Scarlat, N.; Dallemand, J.F.; Fahl, F. Biogas: Developments and Perspectives in Europe. Renew. Energy 2018, 129, 457–472. [Google Scholar] [CrossRef] [Scilit]
- Kardung, M.; Cingiz, K.; Costenoble, O.; Delahaye, R.; Heijman, W.; Lovrić, M.; van Leeuwen, M.; M’barek, R.; van Meijl, H.; Piotrowski, S.; et al. Development of the Circular Bioeconomy: Drivers and Indicators. Sustainability 2021, 13, 413. [Google Scholar] [CrossRef] [Scilit]
- Li, S. Incorporation of Fisheries Policy into Regional Blocs?—Lessons from the EU’s Common Fisheries Policy. Fishes 2022, 7, 102. [Google Scholar] [CrossRef] [Scilit]
- European Parliament and Council of the European Union. Regulation (EU) No 1380/2013 of the European Parliament and of the Council of 11 December 2013 on the Common Fisheries Policy, Amending Council Regulations (EC) No 1954/2003 and (EC) No 1224/2009 and Repealing Council Regulations (EC) No 2371/2002 and (EC) No 639/2004 and Council Decision 2004/585/EC; Official Journal of the European Union: Luxembourg, 2013; pp. 22–61. [Google Scholar]
- Barrutia, J.M.; Echebarria, C.; Paredes, M.R.; Hartmann, P.; Apaolaza, V. From Rio to Rio+20: Twenty Years of Participatory, Long Term Oriented and Monitored Local Planning? Proc. J. Clean. Prod. 2015, 106, 594–607. [Google Scholar] [CrossRef] [Scilit]
- Liobikienė, G.; Miceikienė, A. Contribution of the European Bioeconomy Strategy to the Green Deal Policy: Challenges and Opportunities in Implementing These Policies. Sustainability 2023, 15, 7139. [Google Scholar] [CrossRef] [Scilit]
- Ferreira, V.; Fabregat-Aibar, L.; Pié, L.; Terceño, A. Research Trends and Hotspots in Bioeconomy Impact Analysis: A Study of Economic, Social and Environmental Impacts. Environ. Impact Assess. Rev. 2022, 96, 106842. [Google Scholar] [CrossRef] [Scilit]
- Food and Agriculture Organization of the United Nations. FAO Report: Global Fisheries and Aquaculture Production Reaches a New Record High; Food and Agriculture Organization of the United Nations: Rome, Italy, 2024. [Google Scholar]
- Angelidaki, I.; Alves, M.; Bolzonella, D.; Borzacconi, L.; Campos, J.L.; Guwy, A.J.; Kalyuzhnyi, S.; Jenicek, P.; Van Lier, J.B. Defining the Biomethane Potential (BMP) of Solid Organic Wastes and Energy Crops: A Proposed Protocol for Batch Assays. Water Sci. Technol. 2009, 59, 927–934. [Google Scholar] [CrossRef] [Scilit] [PubMed]
- Bridgewater, L. Standard Methods for the Examination of Water and Wastewater; The American Public Health Association: Washington, DC, USA, 2023. [Google Scholar]
- Rice, E.W.; Baird, R.B.; Eaton, E.A.D. Standard Methods for the Examination of Water and Wastewater. In American Public Health Association, American Water Works Association, Water Environment Federation; American Public Health Association: Washington, DC, USA, 2017. [Google Scholar]
- Chen, Y.; Cheng, J.J.; Creamer, K.S. Inhibition of Anaerobic Digestion Process: A Review. Bioresour. Technol. 2008, 99, 4044–4064. [Google Scholar] [CrossRef] [Scilit]
- Bouallagui, H.; Lahdheb, H.; Ben Romdan, E.; Rachdi, B.; Hamdi, M. Improvement of Fruit and Vegetable Waste Anaerobic Digestion Performance and Stability with Co-Substrates Addition. J. Environ. Manag. 2009, 90, 1844–1849. [Google Scholar] [CrossRef] [Scilit]
- Álvarez, J.A.; Otero, L.; Lema, J.M. A Methodology for Optimising Feed Composition for Anaerobic Co-Digestion of Agro-Industrial Wastes. Bioresour. Technol. 2010, 101, 1153–1158. [Google Scholar] [CrossRef] [Scilit]
- Solli, L.; Håvelsrud, O.E.; Horn, S.J.; Rike, A.G. A Metagenomic Study of the Microbial Communities in Four Parallel Biogas Reactors. Biotechnol. Biofuels 2014, 7, 146. [Google Scholar] [CrossRef] [Scilit]
- Vivekanand, V.; Mulat, D.G.; Eijsink, V.G.H.; Horn, S.J. Synergistic Effects of Anaerobic Co-Digestion of Whey, Manure and Fish Ensilage. Bioresour. Technol. 2018, 249, 35–41. [Google Scholar] [CrossRef] [Scilit]
- Goddek, S.; Delaide, B.P.L.; Joyce, A.; Wuertz, S.; Jijakli, M.H.; Gross, A.; Eding, E.H.; Bläser, I.; Reuter, M.; Keizer, L.C.P.; et al. Nutrient Mineralization and Organic Matter Reduction Performance of RAS-Based Sludge in Sequential UASB-EGSB Reactors. Aquac. Eng. 2018, 83, 10–19. [Google Scholar] [CrossRef] [Scilit]
- Yogev, U.; Sowers, K.R.; Mozes, N.; Gross, A. Nitrogen and Carbon Balance in a Novel Near-Zero Water Exchange Saline Recirculating Aquaculture System. Aquaculture 2017, 467, 118–126. [Google Scholar] [CrossRef] [Scilit]
- Nges, I.A.; Mbatia, B.; Björnsson, L. Improved Utilization of Fish Waste by Anaerobic Digestion Following Omega-3 Fatty Acids Extraction. J. Environ. Manag. 2012, 110, 159–165. [Google Scholar] [CrossRef] [Scilit]
- Callaghan, F.J.; Wase, D.A.J.; Thayanithy, K.; Forster, C.F. Co-Digestion of Waste Organic Solids: Batch Studies. Bioresour. Technol. 1999, 67, 117–122. [Google Scholar] [CrossRef] [Scilit]
- Saidi, R.; Liebgott, P.P.; Hamdi, M.; Auria, R.; Bouallagui, H. Enhancement of Fermentative Hydrogen Production by Thermotoga Maritima through Hyperthermophilic Anaerobic Co-Digestion of Fruit-Vegetable and Fish Wastes. Int. J. Hydrogen Energy 2018, 43, 23168–23177. [Google Scholar] [CrossRef] [Scilit]
- An-Stepec, B.A.; Andrews, M.; Kedir, A.; Schindler, N.; Dopffel, N. Sludge-to-Gas: Aquaculture Fish Sludge Shows Varying Hydrogen Production Potential over the Lifetime of a Fish. J. Appl. Microbiol. 2025, 136, lxaf188. [Google Scholar] [CrossRef] [Scilit]
- Gorrasi, S.; Izzo, G.; Massini, G.; Signorini, A.; Barghini, P.; Fenice, M. From Polluting Seafood Wastes to Energy. Production of Hydrogen and Methane from Raw Chitin Material by a Two-Phase Process. J. Environ. Prot. Ecol. 2014, 15, 526–536. [Google Scholar]
- Bermúdez-Penabad, N.; Rodríguez-Montes, A.; Alves, M.; Kennes, C.; Veiga, M.C. Optimization of Methane Production from Solid Tuna Waste: Thermal Pretreatment and Co-Digestion. Waste Manag. 2024, 177, 203–210. [Google Scholar] [CrossRef] [Scilit]
- Da Silva, D.M.S.; Cavalcanti, J.V.F.L.; Júnior, A.D.N.F.; Peres, S.; Alves, M.M.; Benachour, M. Biogas Production and Greenhouse Gas Mitigation Using Fish Waste from Bragança/Brazil. Chem. Ind. Chem. Eng. Q. 2023, 29, 319–331. [Google Scholar] [CrossRef] [Scilit]
- Solli, L.; Bergersen, O.; Sørheim, R.; Briseid, T. Effects of a Gradually Increased Load of Fish Waste Silage in Co-Digestion with Cow Manure on Methane Production. Waste Manag. 2014, 34, 1553–1559. [Google Scholar] [CrossRef] [Scilit]
- Solli, L.; Schnürer, A.; Horn, S.J. Process Performance and Population Dynamics of Ammonium Tolerant Microorganisms during Co-Digestion of Fish Waste and Manure. Renew. Energy 2018, 125, 529–536. [Google Scholar] [CrossRef] [Scilit]
- Xu, M.; Moe, S.T.; Aasen, I.M.; Hillestad, M. Design Optimization of Low-Solids Anaerobic Digestion: Increasing Solids Retention Time through Effluent Recirculation. Bioresour. Technol. Rep. 2025, 31, 102209. [Google Scholar] [CrossRef] [Scilit]
- Zhang, X.; Ferreira, R.B.; Hu, J.; Spanjers, H.; van Lier, J.B. Improving Methane Production and Phosphorus Release in Anaerobic Digestion of Particulate Saline Sludge from a Brackish Aquaculture Recirculation System. Bioresour. Technol. 2014, 162, 384–388. [Google Scholar] [CrossRef] [Scilit]
- Quinn, B.M.; Apolinario, E.A.; Gross, A.; Sowers, K.R. Characterization of a Microbial Consortium That Converts Mariculture Fish Waste to Biomethane. Aquaculture 2016, 453, 154–162. [Google Scholar] [CrossRef] [Scilit]
- Klein, J.; Schüch, A.; Foth, S.; Sprafke, J.; Bischoff, A.; Nelles, M.; Palm, H.W. Enhancing Energy Recovery from Aquaculture Residual Materials: A Focus on Anaerobic Digestion of African Catfish (Clarias gariepinus) Sediment Sludge. Front. Sustain. Food Syst. 2024, 8, 1397491. [Google Scholar] [CrossRef] [Scilit]
- Zhu, Z.; Yogev, U.; Goddek, S.; Yang, F.; Keesman, K.J.; Gross, A. Carbon Dynamics and Energy Recovery in a Novel Near-Zero Waste Aquaponics System with Onsite Anaerobic Treatment. Sci. Total Environ. 2022, 833, 155245. [Google Scholar] [CrossRef] [Scilit]
- Brod, E.; Øgaard, A.F. Closing Global P Cycles: The Effect of Dewatered Fish Sludge and Manure Solids as P Fertiliser. Waste Manag. 2021, 135, 190–198. [Google Scholar] [CrossRef] [Scilit]
- Brod, E.; Oppen, J.; Kristoffersen, A.Ø.; Haraldsen, T.K.; Krogstad, T. Drying or Anaerobic Digestion of Fish Sludge: Nitrogen Fertilisation Effects and Logistics. Ambio 2017, 46, 852–864. [Google Scholar] [CrossRef] [Scilit]
- Cichy, P.; Tomczak-Wandzel, R.; Szatkowska, B.; Kalka, J.; Yadav, R.S. Closing the Loop: Can Anaerobic Digestates from Food Waste Be Universal Source of Nutrients for Plant Growth? Sustainability 2024, 16, 6171. [Google Scholar] [CrossRef] [Scilit]
- Sanjaya, E.H.; Cheng, H.; Qin, Y.; Kubota, K.; Li, Y.Y. The Impact of Calcium Supplementation on Methane Fermentation and Ammonia Inhibition of Fish Processing Wastewater. Bioresour. Technol. 2021, 337, 125471. [Google Scholar] [CrossRef] [Scilit]
- Sousa, S.R.; Rodrigues, L.S.; Sampaio, R.R.; Dutra, J.C.F.; Silva, I.J. Efficiency of the Anaerobic Baffled Reactor Followed by Anaerobic Filter in the Removal of Nutrients and Pathogenic Organisms in Fish Processing Effluents. Arq. Bras. Med. Vet. Zootec. 2022, 74, 892–900. [Google Scholar] [CrossRef] [Scilit]
- Hang, T.T.T.; Phat, V.V.; Dao, N.A.; Hanh, H.H.; Thoai, N.N.; Hung, P.T.; Van Tri, D.; Luu, T.L.; Thuan, T.H.; Van Tuyen, N.; et al. Green Chemistry Treatment of Seafood Processing Wastewater Using Pilot Scale Anaerobic Membrane Bioreactor (AnMBR) in a Realtime Mode. Green Anal. Chem. 2025, 12, 100189. [Google Scholar] [CrossRef] [Scilit]
- Regueiro, L.; Carballa, M.; Álvarez, J.A.; Lema, J.M. Enhanced Methane Production from Pig Manure Anaerobic Digestion Using Fish and Biodiesel Wastes as Co-Substrates. Bioresour. Technol. 2012, 123, 507–513. [Google Scholar] [CrossRef] [Scilit]
- Serrano, A.; Siles, J.A.; Chica, A.F.; Martín, M.Á. Agri-Food Waste Valorization through Anaerobic Co-Digestion: Fish and Strawberry Residues. J. Clean. Prod. 2013, 54, 125–132. [Google Scholar] [CrossRef] [Scilit]
- De Clercq, D.; Wen, Z.; Caicedo, L.; Cao, X.; Fan, F.; Xu, R. Application of DEA and Statistical Inference to Model the Determinants of Biomethane Production Efficiency: A Case Study in South China. Appl. Energy 2017, 205, 1231–1243. [Google Scholar] [CrossRef] [Scilit]
- Estevez, M.M.; Sapci, Z.; Linjordet, R.; Morken, J. Incorporation of Fish By-Product into the Semi-Continuous Anaerobic Co-Digestion of Pre-Treated Lignocellulose and Cow Manure, with Recovery of Digestate’s Nutrients. Renew. Energy 2014, 66, 550–558. [Google Scholar] [CrossRef] [Scilit]
- Holder, N.; Mota-Meira, M.; Born, J.; Sutrina, S.L. Bio-Methane Production via Anaerobic Co-Digestion by Optimizing the Mixing Ratios of River Tamarind (Leucaena Leucocephala) and Dolphin Fish (Coryphaena Hippurus) Offal. Processes 2020, 8, 934. [Google Scholar] [CrossRef] [Scilit]
- Hortence, I.; Maurice, T.; Arimi, M. Effect of Co-Digestion with Water Hyacinth, Inoculum Concentration and Dilution on Biogas Production of Fish Waste. Energy Rep. 2023, 10, 4819–4823. [Google Scholar] [CrossRef] [Scilit]
- Ingabire, H.; M’arimi, M.M.; Kiriamiti, K.H.; Ntambara, B. Optimization of Biogas Production from Anaerobic Co-Digestion of Fish Waste and Water Hyacinth. Biotechnol. Biofuels Bioprod. 2023, 16, 110. [Google Scholar] [CrossRef] [Scilit]
- Nahar, G.; Koley, A.; Garai, S.; Balachandran, S.; Ross, A.B. Enhancing Biogas Production Through the Co-Digestion of Fish Waste (FW) and Water Hyacinth (WH) Using Cow Dung as an Inoculum: Effect of FW/WH Ratio. Appl. Sci. 2024, 14, 9880. [Google Scholar] [CrossRef] [Scilit]
- Serrano, A.; Siles, J.A.; Chica, A.F.; Martin, M.A. Improvement of Mesophilic Anaerobic Co-Digestion of Agri-Food Waste by Addition of Glycerol. J. Environ. Manag. 2014, 140, 76–82. [Google Scholar] [CrossRef] [Scilit]
- Rajendiran, N.; Ganesan, S.; Velmurugan, N.; Venkatachalam, S.S. Synergistic Effect of Biogas Production from Co-Digestion of Fish and Vegetable Market Wastes and Kinetic Modelling. Biomass Convers. Biorefin. 2024, 14, 12329–12341. [Google Scholar] [CrossRef] [Scilit]
- Sarker, S. By-Products of Fish-Oil Refinery as Potential Substrates for Biogas Production in Norway: A Preliminary Study. Results Eng. 2020, 6, 100137. [Google Scholar] [CrossRef] [Scilit]
- Gunnarsdóttir, R.; Heiske, S.; Jensen, P.E.; Schmidt, J.E.; Villumsen, A.; Jenssen, P.D. Effect of Anaerobiosis on Indigenous Microorganisms in Blackwater with Fish Offal as Co-Substrate. Water Res. 2014, 63, 1–9. [Google Scholar] [CrossRef] [Scilit]
- Choe, U.; Mustafa, A.M.; Lin, H.; Choe, U.; Sheng, K. Anaerobic Co-Digestion of Fish Processing Waste with a Liquid Fraction of Hydrothermal Carbonization of Bamboo Residue. Bioresour. Technol. 2020, 297, 122542. [Google Scholar] [CrossRef] [Scilit]
- Choe, U.; Mustafa, A.M.; Lin, H.; Xu, J.; Sheng, K. Effect of Bamboo Hydrochar on Anaerobic Digestion of Fish Processing Waste for Biogas Production. Bioresour. Technol. 2019, 283, 340–349. [Google Scholar] [CrossRef] [Scilit]
- Fjørtoft, K.; Morken, J.; Hanssen, J.F.; Briseid, T. Methane Production and Energy Evaluation of a Farm Scaled Biogas Plant in Cold Climate Area. Bioresour. Technol. 2014, 169, 72–79. [Google Scholar] [CrossRef] [Scilit]
- Venslauskas, K.; Navickas, K.; Nappa, M.; Kangas, P.; Mozūraitytė, R.; Šližytė, R.; Župerka, V. Energetic and Economic Evaluation of Zero-Waste Fish Co-Stream Processing. Int. J. Environ. Res. Public Health 2021, 18, 2358. [Google Scholar] [CrossRef] [Scilit]
- Siddique, M.N.I.; Khalid, Z.; Ali, N.; Ismail, S.; Adhikary, S.K.; Ibrahim, M.Z. Improvement of Aquaculture Wastewater Co-digestion Performance by Cattle Dung Using A Thermophilic Pilot Reactor And Fertiliser Recovery. J. Sustain. Sci. Manag. 2024, 19, 4. [Google Scholar] [CrossRef] [Scilit]
- Gruduls, A.; Balina, K.; Ivanovs, K.; Romagnoli, F. Low Temperature BMP Tests Using Fish Waste from Invasive Round Goby of the Baltic Sea. Agron. Res. 2018, 16, 398–409. [Google Scholar] [CrossRef]
- Hashemi, B.; Horn, S.J.; Lamb, J.J.; Lien, K.M. Potential Role of Sulfide Precipitates in Direct Interspecies Electron Transfer Facilitation during Anaerobic Digestion of Fish Silage. Bioresour. Technol. Rep. 2022, 20, 101264. [Google Scholar] [CrossRef] [Scilit]
- Colantoni, S.; Molognoni, D.; Sánchez-Cueto, P.; De Soto, C.; Bosch-Jimenez, P.; Ghemis, R.; Borràs, E. Bioelectrochemically-Improved Anaerobic Digestion of Fishery Processing Industrial Wastewater. J. Water Process Eng. 2024, 65, 105848. [Google Scholar] [CrossRef] [Scilit]
- Luo, G.Z.; Ma, N.; Li, P.; Tan, H.X.; Liu, W. Enhancement of Anaerobic Digestion to Treat Saline Sludge from Recirculating Aquaculture Systems. Sci. World J. 2015, 2015, 479101. [Google Scholar] [CrossRef] [Scilit]
- Choudhury, A.; Lepine, C.; Good, C. Methane and Hydrogen Sulfide Production from the Anaerobic Digestion of Fish Sludge from Recirculating Aquaculture Systems: Effect of Varying Initial Solid Concentrations. Fermentation 2023, 9, 94. [Google Scholar] [CrossRef] [Scilit]
- Lobanov, V.; De Vrieze, J.; Joyce, A. Simultaneous Biomethane Production and Nutrient Remineralization from Aquaculture Solids. Aquac. Eng. 2023, 101, 102328. [Google Scholar] [CrossRef] [Scilit]
- Netshivhumbe, R.; Faloye, F.; Tolessa, A.; Görgens, J.; Goosen, N. Anaerobic Co-Digestion of Fish Sludge Originating from a Recirculating Aquaculture System. Waste Biomass Valorization 2024, 15, 5589–5605. [Google Scholar] [CrossRef] [Scilit]
- Guo, X.; Wang, J. Kinetic Models in Anaerobic Digestion Process: Solving Methods, Applications, and Potential Integration with Machine Learning. ACS ES T Water 2025, 5, 7119–7130. [Google Scholar] [CrossRef] [Scilit]
- Wu, G.; Chang, H.; Du, B. Kinetic Modelling of Typical Biological Reactions During Anaerobic Digestion. In Green Energy and Technology; 2024; Volume Part F3474. [Google Scholar]
- Akshaya, N.B.; Jacob, S. Unification of Waste Management from Fish and Vegetable Markets Through Anaerobic Co-Digestion. Waste Biomass Valorization 2020, 11, 1941–1951. [Google Scholar] [CrossRef] [Scilit]
- Choi, H.J. Influence of Acidogenic Fermented Fish By-Products with Rice Bran for Sludge Reduction and Biogas Recovery in Anaerobic Co-Digestion. Environ. Eng. Res. 2021, 26, 190409. [Google Scholar] [CrossRef] [Scilit]
- Paone, E.; Fazzino, F.; Pizzone, D.M.; Scurria, A.; Pagliaro, M.; Ciriminna, R.; Calabrò, P.S. Towards the Anchovy Biorefinery: Biogas Production from Anchovy Processing Waste after Fish Oil Extraction with Biobased Limonene. Sustainability 2021, 13, 2428. [Google Scholar] [CrossRef] [Scilit]
- Abu Hanifa Jannat, M.; Hyeok Park, S.; Chairattanawat, C.; Yulisa, A.; Hwang, S. Effect of Different Microbial Seeds on Batch Anaerobic Digestion of Fish Waste. Bioresour. Technol. 2022, 349, 126834. [Google Scholar] [CrossRef] [Scilit]
- Ziagova, M.G.; Tzekaki, E.E.; Avgoulas, D.I.; Tsiridis, V.; Karali, E.; Pantazaki, A.A.; Petala, M. Sardine Processing Waste: Biological Treatment Strategies and Their Implications. Processes 2024, 12, 2160. [Google Scholar] [CrossRef] [Scilit]
- Essalhi, F.; Bengueddour, R. Methane Production from Farmed Rainbow Trout Byproducts by Anaerobic Digestion in Morocco. Ecol. Eng. Environ. Technol. 2023, 24, 45–54. [Google Scholar] [CrossRef] [Scilit]
- Weinrich, S.; Nelles, M. Systematic Simplification of the Anaerobic Digestion Model No. 1 (ADM1)–Model Development and Stoichiometric Analysis. Bioresour. Technol. 2021, 333, 125124. [Google Scholar] [CrossRef] [Scilit]
- Batstone, D.J.; Keller, J.; Angelidaki, I.; Kalyuzhnyi, S.V.; Pavlostathis, S.G.; Rozzi, A.; Sanders, W.T.; Siegrist, H.; Vavilin, V.A. The IWA Anaerobic Digestion Model No 1 (ADM1). Water Sci. Technol. 2002, 45, 65–73. [Google Scholar] [CrossRef] [Scilit]
- Tian, H.; Karachalios, P.; Angelidaki, I.; Fotidis, I.A. A Proposed Mechanism for the Ammonia-LCFA Synergetic Co-Inhibition Effect on Anaerobic Digestion Process. Chem. Eng. J. 2018, 349, 574–580. [Google Scholar] [CrossRef] [Scilit]
- Yang, J.; Zhang, J.; Du, X.; Gao, T.; Cheng, Z.; Fu, W.; Wang, S. Ammonia Inhibition in Anaerobic Digestion of Organic Waste: A Review. Int. J. Environ. Sci. Technol. 2025, 22, 3927–3942. [Google Scholar] [CrossRef] [Scilit]
- Xia, Q.; Cheng, J.; Yang, F.; Yi, X.; Huang, W.; Lei, Z.; Wang, D.; Huang, W. Activated Carbon and Anthraquinone-2,6-Disulfonate as Electron Shuttles for Enhancing Carbon and Nitrogen Removal from Simultaneous Methanogenesis, Feammox and Denitrification System. Bioresour. Technol. 2025, 418, 131975. [Google Scholar] [CrossRef] [Scilit]
- Chairattanawat, C.; Yulisa, A.; Hwang, S. Effect of Fish Waste Augmentation on Anaerobic Co-Digestion of Sludge with Food Waste. Bioresour. Technol. 2022, 361, 127731. [Google Scholar] [CrossRef] [Scilit]
- Chapleur, O.; Cardona, L.; LěCao, K.A.; Puig-Castellví, F.; Bureau, C.; Madigou, C.; Mazeas, L. Integrative Analyses to Investigate the Link between Microbial Activity and Metabolite Degradation during Anaerobic Digestion. J. Proteome Res. 2020, 19, 3981–3992. [Google Scholar] [CrossRef] [Scilit]
- Syropoulou, E.; Sipkema, D.; Smit, S.E.; Schrama, J.W.; Kokou, F. Aquaculture Faecal Waste Generates Different Products during Anaerobic Digestion Depending on Nutrient Composition. J. Environ. Manag. 2024, 370, 122826. [Google Scholar] [CrossRef] [Scilit]
- Rahman, M.M.; Oni, A.O.; Gemechu, E.; Kumar, A. Assessment of Energy Storage Technologies: A Review. Energy Convers. Manag. 2020, 223, 113295. [Google Scholar] [CrossRef] [Scilit]
- Diaz, F.; Koiro, L.; Romagnoli, F. Environmental and Economic Life Cycle Evaluation of Potential Energy Efficiency Measures on Latvian Fish Supply Chain. Future Foods 2022, 6, 100203. [Google Scholar] [CrossRef] [Scilit]
- Böpple, H.; Brussino, G.; Engel, A.; Breuhaus, P.; Dopffel, N.; An-Stepec, B.A.; Kleinegris, D.M.M.; Slegers, P.M. Utilization of Fish Sludge and Aquaculture Effluent Water from Norway for Nutrient and Energy Recovery. Resour. Conserv. Recycl. Adv. 2025, 27, 200256. [Google Scholar] [CrossRef] [Scilit]
- Kratky, L.; Zamazal, P. Economic Feasibility and Sensitivity Analysis of Fish Waste Processing Biorefinery. J. Clean. Prod. 2020, 243, 118677. [Google Scholar] [CrossRef] [Scilit]
- Jouannais, P.; Gibertoni, P.P.; Bartoli, M.; Pizzol, M. LCA to Evaluate the Environmental Opportunity Cost of Biological Performances in Finfish Farming. Int. J. Life Cycle Assess. 2023, 28, 1286–1301. [Google Scholar] [CrossRef] [Scilit]
- Arfelli, F.; Maria Pizzone, D.; Cespi, D.; Ciacci, L.; Ciriminna, R.; Salvatore Calabrò, P.; Pagliaro, M.; Mauriello, F.; Passarini, F. Prospective Life Cycle Assessment for the Full Valorization of Anchovy Fillet Leftovers: The LimoFish Process. Waste Manag. 2023, 168, 156–166. [Google Scholar] [CrossRef] [Scilit]
- Colley, T.A.; Valerian, J.; Hauschild, M.Z.; Olsen, S.I.; Birkved, M. Addressing Nutrient Depletion in Tanzanian Sisal Fiber Production Using Life Cycle Assessment and Circular Economy Principles, with Bioenergy Co-Production. Sustainability 2021, 13, 8881. [Google Scholar] [CrossRef] [Scilit]
- Martinez, A.; Vernieres-Hassimi, L.; Abdelouahed, L.; Taouk, B.; Mohabeer, C.; Estel, L. Modelling of an Anaerobic Digester: Identification of the Main Parameters Influencing the Production of Methane Using the Sobol Method. Fuels 2022, 3, 436–448. [Google Scholar] [CrossRef] [Scilit]
- Mannacharaju, M.; Kannan Villalan, A.; Shenbagam, B.; Karmegam, P.M.; Natarajan, P.; Somasundaram, S.; Arumugam, G.; Ganesan, S. Towards Sustainable System Configuration for the Treatment of Fish Processing Wastewater Using Bioreactors. Environ. Sci. Pollut. Res. 2020, 27, 353–365. [Google Scholar] [CrossRef] [Scilit]
- Essalhi, F.; Naourani, A.; Essadek, A.; Bengueddour, R. Agronomic and Energy Value of Digestate from Anaerobic Digestion of Trout Byproducts: Contribution to the Autonomy of Freshwater Farms in Morocco. Results Eng. 2024, 23, 102508. [Google Scholar] [CrossRef] [Scilit]
- da Borso, F.; Chiumenti, A.; Fait, G.; Mainardis, M.; Goi, D. Biomethane Potential of Sludges from a Brackish Water Fish Hatchery. Appl. Sci. 2021, 11, 552. [Google Scholar] [CrossRef] [Scilit]
- Dey, A.; Thomson, R.C. The Biomethane Generation Potential of Wastes and Wastewaters from the Sericulture, Fisheries, and Agro-Industrial Sectors in India. Energy Sustain. Dev. 2023, 75, 40–59. [Google Scholar] [CrossRef] [Scilit]
- Emebu, S.; Pecha, J.; Janáčová, D. Review on Anaerobic Digestion Models: Model Classification & Elaboration of Process Phenomena. Renew. Sustain. Energy Rev. 2022, 160, 112288. [Google Scholar] [CrossRef] [Scilit]
- Chiumenti, A.; Fait, G.; Limina, S.; da Borso, F. Performances of Conventional and Hybrid Fixed Bed Anaerobic Reactors for the Treatment of Aquaculture Sludge. Bioengineering 2020, 7, 63. [Google Scholar] [CrossRef] [Scilit]
- Akonnor Osei, C.; Tulashie, S.K.; Opoku Boateng, O.; Olayemi Olorunyomi, M.; Gyan Turkson, P.K.; Nyansah, D.; Quaicoe, S.; Karim Mahama, A. Valorization of Fish Waste for Sustainable Biofuel Production: A Case Study in Ghana. Biofuels 2025, 16, 205–220. [Google Scholar] [CrossRef] [Scilit]
- Shehata, M.; Elsayed, Y.; Mohamed, A.M.I.; Ismail, M.S.; Walker, M.; Ibrahim, I.A. Biogas Production from Different Food Waste Using Small-Scale Floating-Drum-Type Anaerobic Digester. Bioprocess Biosyst. Eng. 2025, 49, 69–80. [Google Scholar] [CrossRef] [Scilit]
- Chen, T.Y.; Zheng, Y.Y.; Wang, Y.H.; Yeh, C.C.; Liao, C.H.; Lee, T.M. A Zero-Waste Approach to Sarcodia Suiae Valorization: Recycling Aquaculture Wastes and Carbon Dioxide for Biostimulant, Biofertilizer, and Bioenergy Production. Bioresour. Technol. 2025, 418, 131929. [Google Scholar] [CrossRef] [Scilit]
- Van Den Hende, S.; Laurent, C.; Bégué, M. Anaerobic Digestion of Microalgal Bacterial Flocs from a Raceway Pond Treating Aquaculture Wastewater: Need for a Biorefinery. Bioresour. Technol. 2015, 196, 184–193. [Google Scholar] [CrossRef] [Scilit]
- Matokwe, T.B.; Jung, H.Y.; Kang, K.H.; Do Jeong, H.; Kim, J.K. Characterization of Acidogenesis Occurring on Rainbow Trout (Oncorhynchus mykiss) Sludge by Indigenous Alcaligenes Faecalis. Biotechnol. Bioprocess Eng. 2016, 21, 794–803. [Google Scholar] [CrossRef] [Scilit]
- Dragicevic, I.; Eich-Greatorex, S.; Sogn, T.A.; Linjordet, R.; Krogstad, T. Fate of Copper, Nickel and Zinc after Biogas Digestate Application to Three Different Soil Types. Environ. Sci. Pollut. Res. 2017, 24, 13095–13106. [Google Scholar] [CrossRef] [Scilit]
- Greggio, N.; Carlini, C.; Contin, A.; Soldano, M.; Marazza, D. Exploitable Fish Waste and Stranded Beach Debris in the Emilia-Romagna Region (Italy). Waste Manag. 2018, 78, 566–575. [Google Scholar] [CrossRef] [Scilit]
- Cardona, L.; Levrard, C.; Guenne, A.; Chapleur, O.; Mazéas, L. Co-Digestion of Wastewater Sludge: Choosing the Optimal Blend. Waste Manag. 2019, 87, 772–781. [Google Scholar] [CrossRef] [Scilit]
- Abdul Aziz, N.I.H.; Hanafiah, M.M.; Mohamed Ali, M.Y. Sustainable Biogas Production from Agrowaste and Effluents—A Promising Step for Small-Scale Industry Income. Renew. Energy 2019, 132, 363–369. [Google Scholar] [CrossRef] [Scilit]
- Fonseca, C.; Frare, L.M.; D’avila, L.; Edwiges, T. Influence of Different Waste Compositions from Tilapia Fish on Methane Production. J. Clean. Prod. 2020, 265, 121795. [Google Scholar] [CrossRef] [Scilit]
- Friedman, I.S.; Behrens, L.A.; Pereira, N.d.L.A.; Contreras, E.M.; Fernández-Gimenez, A.V. Digestive Proteinases from the Marine Fish Processing Wastes of the South-West Atlantic Ocean: Their Partial Characterization and Comparison. J. Fish Biol. 2022, 100, 150–160. [Google Scholar] [CrossRef] [Scilit]
- Cayenne, A.; Turcios, A.E.; Thomsen, M.H.; Rocha, R.M.; Papenbrock, J.; Uellendahl, H. Halophytes as Feedstock for Biogas Production: Composition Analysis and Biomethane Potential of Salicornia Spp. Plant Material from Hydroponic and Seawater Irrigation Systems. Fermentation 2022, 8, 189. [Google Scholar] [CrossRef] [Scilit]
- Ingabire, H.; Ntambara, B.; Mazimpaka, E. Characterization and Analysis of Fish Waste as Feedstock for Biogas Production. Int. J. Low-Carbon Technol. 2023, 18, 212–217. [Google Scholar] [CrossRef] [Scilit]
- Zhu, Z.; Yogev, U.; Keesman, K.J.; Gross, A. Promoting Circular Economy: Comparison of Novel Coupled Aquaponics with Anaerobic Digestion and Conventional Aquaponic Systems on Nutrient Dynamics and Sustainability. Resour. Conserv. Recycl. 2024, 208, 107716. [Google Scholar] [CrossRef] [Scilit]
- Mirzoyan, N.; Gross, A. Use of UASB Reactors for Brackish Aquaculture Sludge Digestion under Different Conditions. Water Res. 2013, 47, 2843–2850. [Google Scholar] [CrossRef] [Scilit]
- Luo, G.Z.; Li, P.; Tan, H.X.; Du, J.; Liang, W.Y. The Start-up and Saline Adaptation of Mesophilic Anaerobic Sequencing Batch Reactor Treating Sludge from Recirculating Aquaculture Systems. Aquac. Eng. 2013, 54, 9–15. [Google Scholar] [CrossRef] [Scilit]
- Mirzoyan, N.; Parnes, S.; Singer, A.; Tal, Y.; Sowers, K.; Gross, A. Quality of Brackish Aquaculture Sludge and Its Suitability for Anaerobic Digestion and Methane Production in an Upflow Anaerobic Sludge Blanket (UASB) Reactor. Aquaculture 2008, 279, 35–41. [Google Scholar] [CrossRef] [Scilit]
- Standing, D.; Brunner, T.; Aruety, T.; Ronen, Z.; Gross, A.; Zilberg, D. Mortality of Cryptocaryon Irritans in Sludge from a Digester of a Marine Recirculating Aquaculture System. Aquaculture 2017, 467, 134–137. [Google Scholar] [CrossRef] [Scilit]
- Golub, G.; Yaremenko, O.; Marus, O.; Tsyvenkova, N.; Chetveryk, H. Sedimentation Properties of Aquaculture Wastewater Sludge During the Cultivation of Clarias Gariepinus. Vidnovluvana Energ. 2025, 1, 148–158. [Google Scholar] [CrossRef] [Scilit]
- Bergman, K.; Henriksson, P.J.G.; Hornborg, S.; Troell, M.; Borthwick, L.; Jonell, M.; Philis, G.; Ziegler, F. Recirculating Aquaculture Is Possible without Major Energy Tradeoff: Life Cycle Assessment of Warmwater Fish Farming in Sweden. Environ. Sci. Technol. 2020, 54, 16062–16070. [Google Scholar] [CrossRef] [Scilit]
- Mpokera, N.; Gervas, J.; Mtashobya, L.; Emmanuel, J. Valorization of Nile Perch Wastes and Cow Rumen Cud for Biogas Production through Anaerobic Co-Digestion. Biofuels 2025, 16, 929–936. [Google Scholar] [CrossRef] [Scilit]
- Mpokera, N.; Gervas, J.; Mtashobya, L.; Emmanuel, J. Exploring Biogas Production from Nile Perch (Lates Niloticus) Fish Byproducts. Biofuels 2025, 16, 717–723. [Google Scholar] [CrossRef] [Scilit]
- Ramírez-Galdámez, R.C.; Villalobos-Maldonado, J.J.; Cruz-Salomón, A.; Castañon-González, J.H.; Enciso-Sáenz, S.; Sanchez-Albores, R.M.; Reyes-Vallejo, O.; Santiago-Martínez, M.G. Efficient Bioreactor System for Biological Treatment and Methane Production from Fish Processing Wastewater. J. Water Process Eng. 2024, 68, 106476. [Google Scholar] [CrossRef] [Scilit]
- Xia, Q.; Liu, F.; Sun, S.; Huang, W.; Zhao, Z.; Yang, F.; Lei, Z.; Huang, W.; Yi, X. Coupling Iron Sludge Addition and Intermittent Aeration for Achieving Simultaneous Methanogenesis, Feammox, and Denitrification in a Single Reactor Treating Fish Sludge. Environ. Sci. Technol. 2023, 57, 15065–15075. [Google Scholar] [CrossRef] [Scilit]
- Yulisa, A.; Park, S.H.; Chairattanawat, C.; Hwang, S. Effect of Feeding Strategies on the Start-up of Anaerobic Digestion of Fish Waste. Energy 2023, 280, 128199. [Google Scholar] [CrossRef] [Scilit]
- Chiumenti, A.; Owono, B.O.; Fait, G.; Da Borso, F. Upflow Anaerobic Floating Filter (Uaff) Improved the Performance of the Anaerobic Treatment of Brackish Aquaculture Waste. Appl. Eng. Agric. 2023, 39, 657–661. [Google Scholar] [CrossRef] [Scilit]
- Chairattanawat, C.; Yulisa, A.; Park, S.H.; Jannat, M.A.H.; Hwang, S. Physicochemical Characteristics and Biogas Production Potentials of Olive Flounder and Starry Flounder Wastes. Biotechnol. Bioprocess Eng. 2022, 27, 678–686. [Google Scholar] [CrossRef] [Scilit]
- Wu, Y.; Song, K. Anaerobic Co-Digestion of Waste Activated Sludge and Fish Waste: Methane Production Performance and Mechanism Analysis. J. Clean. Prod. 2021, 279, 123678. [Google Scholar] [CrossRef] [Scilit]
- Letelier-Gordo, C.O.; Mancini, E.; Pedersen, P.B.; Angelidaki, I.; Fotidis, I.A. Saline Fish Wastewater in Biogas Plants-Biomethanation Toxicity and Safe Use. J. Environ. Manag. 2020, 275, 111233. [Google Scholar] [CrossRef] [Scilit]
- Sanjaya, E.H.; Cheng, H.; Li, Y.Y. Mesophilic Methane Fermentation Performance and Ammonia Inhibition of Fish Processing Wastewater Treatment Using a Self-Agitated Anaerobic Baffled Reactor. Bioresour. Technol. 2020, 313, 123644. [Google Scholar] [CrossRef] [Scilit]
- Wu, Y.; Song, K. Process Performance of Anaerobic Co-Digestion of Waste Activated Sludge and Aquaculture Sludge. Aquac. Eng. 2020, 90, 102090. [Google Scholar] [CrossRef] [Scilit]
- Choi, H.J. Acid-Fermented Fish by-Products Broth: An Influence to Sludge Reduction and Biogas Production in an Anaerobic Co-Digestion. J. Environ. Manag. 2020, 262, 110305. [Google Scholar] [CrossRef] [Scilit]
- Jeddi, M.; Karray, F.; Loukil, S.; Mhiri, N.; Ben Abdallah, M.; Sayadi, S. Anaerobic Biological Treatment of Industrial Saline Wastewater: Fixed Bed Reactor Performance and Analysis of the Microbial Community Structure and Abundance. Environ. Technol. 2020, 41, 1715–1725. [Google Scholar] [CrossRef] [Scilit]
- Picos-Benítez, A.R.; Peralta-Hernández, J.M.; López-Hincapié, J.D.; Rodríguez-García, A. Biogas Production from Saline Wastewater of the Evisceration Process of the Fish Processing Industry. J. Water Process Eng. 2019, 32, 100933. [Google Scholar] [CrossRef] [Scilit]
- Nazurally, N. Anaerobic Digestion of Fish Waste and Seagrass/Macroalgae: Potential Sustainable Waste Management for Tropical Small Island Developing States. J. Mater. Cycles Waste Manag. 2018, 20, 1724–1735. [Google Scholar] [CrossRef] [Scilit]
- Donoso-Bravo, A.; Bindels, F.; Gerin, P.A.; Vande Wouwer, A. Anaerobic Biodegradability of Fish Remains: Experimental Investigation and Parameter Estimation. Water Sci. Technol. 2015, 71, 922–928. [Google Scholar] [CrossRef] [Scilit]
- Serrano, A.; Siles, J.A.; Gutiérrez, M.C.; Martín, M.Á. Optimization of Anaerobic Co-Digestion of Strawberry and Fish Waste. Appl. Biochem. Biotechnol. 2014, 173, 1391–1404. [Google Scholar] [CrossRef] [Scilit]
- Golub, G.; Yaremenko, O.; Kucheruk, P.; Marus, O.; Tsyvenkova, N.; Nadykto, V.; Chuba, V.; Yarosh, Y. Defining Indicators for the Anaerobic Fermentation Process of Aquaculture Wastewater Sediments. East.-Eur. J. Enterp. Technol. 2024, 6, 66–78. [Google Scholar] [CrossRef] [Scilit]
- Albuzio, A.; Durigon, V.; Provenzano, M.R. Anaerobic Digestion of Trout By-Products. Waste Biomass Valorization 2011, 2, 127–131. [Google Scholar] [CrossRef] [Scilit]
- Mirzoyan, N.; Gross, A. Electron-Acceptor Utilization and Methanogenesis in Brackish Aquaculture Sludge. Aquac. Eng. 2015, 67, 32–38. [Google Scholar] [CrossRef] [Scilit]
- Kassuwi, S.A.A.; Mshandete, A.M.; Kivaisi, A.K. Nile Perch Fish Scales a Novel Biofilm Carrier in the Anaerobic Digestion of Biological Pre-Treated Nile Perch Fish Solid Waste. ARPN J. Eng. Appl. Sci. 2013, 8, 117–127. [Google Scholar]


| Substrate | Process | Total C [%] | Total N [%] | C/N Ratio | TS [%] | VS [%] | Ref. |
|---|---|---|---|---|---|---|---|
| Guts, digestive tracts, viscera | batch BMP | 50.59 b | 8.84 b | 5.7 | 25.2 e | 88.9 f | [4] |
| Common carp viscera | batch BMP | 52.6 a | 8.1 a | 6.5 | 29.1 e | 89 f | [3] |
| Fish head, internal organs, fish fat, bladder | batch | 54.2 c | 5.06 c | 10.72 | 43.5 e | 39.2 e | [94] |
| Fish gills and viscera | batch | n.a. | n.a. | 8.69 | 25.9 e | 20.7 e | [88] |
| Viscera, gills and scales of bighead fish | batch | n.a. | n.a. | 8 | 38.1 e | 93.7 f | [18] |
| Offal, scales, gills and washing water | batch | 51 c | 5.85 c | 9 | 32.2 e | 55.3 f | [10] |
| Fish by-product (oil fraction removed) | semi-continuous | 53.6 c | 9.8 c | 5.5 | 25.6 e | 96 f | [84] |
| Fish wastes | ASBR | 48.2 b | 5.4 b | 8.8 | 19.6 e | 60.2 f | [55] |
| Aquaculture sludge | batch BMP | 52.51 d | 7.27 d | 8.43 g | n.a. | 67.3 f | [14] |
| Substrate | Process and Microbial Sampling | Microbial Analysis | Observation | Ref. |
|---|---|---|---|---|
| Fish waste and fish crude oil extraction waste from common carp viscera | Batch; 35 °C End of digestion after 14 and 17 days, respectively | 16S rRNA gene sequencing for Bacteria and Archaea and ITS1/2 sequencing for Fungi using Illumina MiSeq | Clostridia-dominated fish waste at 67.5%, whereas Gammaproteobacteria-dominated fish crude oil waste at approximately 40%. Ascomycota was the most abundant fungal phylum in both substrates. | [3] |
| Fish sludge from a commercial tilapia farm | Batch; 35 °C End of the 40-day experiment | 16S rRNA gene amplicon sequencing of the V3 and V4 regions for Bacteria and the V4 and V5 regions for Archaea using Illumina MiSeq | Methanobacterium, Methanosarcina and Methanothrix were the dominant archaeal groups. Electron shuttles increased the total abundance of iron-reducing bacteria from 8.2% to 13.4%. | [117] |
| Fish waste and primary sludge | Batch; 35 °C End of the 53-day digestion | 16S rRNA gene amplicon sequencing for Bacteria and Archaea using Illumina iSeq 100 | Increasing fish waste shifted the community toward Methanospirillum and Syntrophomonas, which increased from 20.5% to 85.2% and from 0.6% to 7.4%, respectively, whereas Candidatus Cloacamonas decreased from 19.2% to 4.9%. | [19] |
| Fish silage | Batch; 40 °C Days 1 and 65 | 16S rRNA gene amplicon sequencing of the V4 region for Bacteria and Archaea using Illumina MiSeq | Fish silage digestion was dominated by hydrogenotrophic Methanobacterium, representing 87.2–94.8% of Archaea. The bacterial community included protein-degrading Lutispora and Proteiniboraceae as well as long-chain-fatty-acid-degrading Cloacimonadota W27. | [99] |
| Fish waste with primary sludge, secondary sludge and food waste | Semi-continuous; 37 °C During stabilization and 15 spike cycles | 16S rRNA gene sequencing of bacterial V4 and archaeal V5 and V6 regions using Illumina iSeq 100 and qPCR for total Archaea | A 1% addition of fish waste had little effect on the bacterial community, whereas repeated 5% additions of this material increased Proteiniphilum, Sedimentibacter and Guggenheimella. Methanospirillum became dominant after the eighth spike, reaching 68% of abundance by the fifteenth spike. | [118] |
| Fish waste powder | Batch; 37 °C Initial and endpoint samples | 16S rRNA gene sequencing of bacterial V4 and archaeal V5 and V6 regions using Illumina iSeq 100 and microbial network analysis | Fish waste degradation increased Proteiniphilum, Aminobacterium, dgA-11 gut group and Syntrophomonas abundance. The seeds from a digester that co-digested livestock manure, food waste and food wastewater retained Methanosaeta as the dominant methanogen by the end of the process. | [110] |
| Fish waste, wastewater sludge and grass | Batch; 35 °C Days 21 and 28 | Sequencing of reverse-transcribed bacterial and archaeal 16S rRNA V4 and V5 regions and untargeted metabolomics using LC-HRMS | Increasing the fish waste proportion reduced bacterial and archaeal diversity. Clostridiales represented more than 90% of the bacterial community during the fish waste mono-digestion. | [119] |
| Fish waste silage and cow manure | Semi-continuous; 37 °C End of each hydraulic retention period | qPCR targeting SAOB, as well as the Methanosarcinaceae, Methanomicrobiales and Methanosaetaceae families | Increased fish waste loading led to higher levels of ammonium tolerant, SAOB and Methanomicrobiales. The loss of Tepidanaerobacter acetatoxydans at 16% and 19% fish waste coincided with process failure. | [69] |
| Substrate | Inoculum | Pretreatment | Reactor | Main Operating Conditions | Reported Hydrogen Outcome | Principal Finding | Ref. |
|---|---|---|---|---|---|---|---|
| Commercial crab-shell chitin (5 g/L) with yeast extract (5 g/L) | F210 bacterial consortium (20% v/v) and methanogenic digestate for the second stage | Aerobic fungal prehydrolysis with L. muscarium (2 weeks) | Serum bottles (20 mL) in batch DF followed by AD | DF: 37 °C, 120 rpm, 30 days; AD: up to 83 days | 147 mL H2/L | Although sequential recovery from hydrogen to methane was feasible, shorter pretreatment and further optimization of the hydrogen production stage were required. However, the study did not include a control in which chitin was subjected to dark fermentation without fungal prehydrolysis. | [65] |
| MFVW (100 mL) in seawater without AHFW; C/N 47 | T. maritima DSM 3109 (10% v/v) | n.a. | STR (1.1 L) in batch | 80 °C, pH 7.0, 150 rpm with NH4Cl and cysteine HCl added | 109 mmol H2/L and 3.24 mol H2/mol hexose | MFVW as control sample provided the baseline H2 production used to evaluate the effect of adding AHFW. | [63] |
| MFVW (300 mL) and AHFW prepared from whole sardines (400 mL) in seawater; C/N 22 | Grinding and two-step thermal-acid hydrolysis of sardines | 80 °C, pH 7.0, 150 rpm without NH4Cl and cysteine HCl added | 285 mmol H2/L and 3.86 mol H2/mol hexose | The highest hydrogen production and maximum productivity were achieved with a C/N ratio of 22 effectively doubling the peak hydrogen productivity. | |||
| Dewatered salmon RAS sludge from freshwater, brackish-water and seawater stages (5–50% w/v) | Native sludge microbiota and no external inoculum | Only dewatering | Serum bottles (110 mL) in batch | 37 °C, dark, no mixing or pH control, 30 days | 24.5 ± 17.5 mL H2/g dry sludge | Untreated freshwater sludge showed the highest hydrogen potential, whereas no detectable hydrogen was produced by seawater sludge and methane was not detected. | [64] |
Disclaimer/Publisher’s Note: The statements, opinions and data contained in all publications are solely those of the individual author(s) and contributor(s) and not of MDPI and/or the editor(s). MDPI and/or the editor(s) disclaim responsibility for any injury to people or property resulting from any ideas, methods, instructions or products referred to in the content. |
© 2026 by the authors. Licensee MDPI, Basel, Switzerland. This article is an open access article distributed under the terms and conditions of the Creative Commons Attribution (CC BY) license.
Share and Cite
Gosławski, S.; Borowski, S. Valorization of Fish Waste via Anaerobic Digestion: A Systematic Literature Review and Future Research Agenda. Energies 2026, 19, 4077. https://doi.org/10.3390/en19174077
Gosławski S, Borowski S. Valorization of Fish Waste via Anaerobic Digestion: A Systematic Literature Review and Future Research Agenda. Energies. 2026; 19(17):4077. https://doi.org/10.3390/en19174077
Chicago/Turabian StyleGosławski, Sebastian, and Sebastian Borowski. 2026. "Valorization of Fish Waste via Anaerobic Digestion: A Systematic Literature Review and Future Research Agenda" Energies 19, no. 17: 4077. https://doi.org/10.3390/en19174077
APA StyleGosławski, S., & Borowski, S. (2026). Valorization of Fish Waste via Anaerobic Digestion: A Systematic Literature Review and Future Research Agenda. Energies, 19(17), 4077. https://doi.org/10.3390/en19174077