Article

Spatial Inequalities in Grid Connection Capacity for Renewable Energy Sources: Evidence from Polish Distribution Network Data


Department of Land Management, Faculty of Geoengineering, University of Warmia and Mazury in Olsztyn, Prawocheńskiego 15, 10-720 Olsztyn, Poland
*
Author to whom correspondence should be addressed.
Energies 2026, 19(17), 4039; https://doi.org/10.3390/en19174039
Submission received: 5 July 2026 / Revised: 13 August 2026 / Accepted: 17 August 2026 / Published: 28 August 2026

Abstract

Poland’s rapid expansion of renewable energy sources (RES) and of distributed photovoltaics (PVs) in particular has increasingly collided with a finite and unevenly distributed resource: available capacity in the electricity distribution grid. This paper examines grid-connection capacity as a spatial constraint on RES development in Poland, combining a national overview of grid congestion (2023–2026) with a quantitative case study of the 52 coherent 110 kV node groups administered by ENERGA-OPERATOR S.A. under the statutory reporting regime of Article 7(8l) of the Polish Energy Law. The node-group figures are not an observed annual series: the operator’s disclosure gives the capacity available in the base year of 2018, together with the capacity it planned to make available in each year up to 2023, so the analysis characterises the spatial distribution implied by the operator’s own five-year development plan rather than realised outcomes. Using descriptive statistics, a Gini coefficient, Lorenz curve analysis, and an original growth index (the ENERGA Grid-Connection Growth Index, EGCI) developed for this study, we show that available connection capacity is markedly unequally distributed across node groups (Gini = 0.48 in 2018, rising to 0.51 by the 2023 planning horizon) and that this inequality has a distinct regional pattern: the Olsztyn branch, corresponding to the Warmia–Mazury region (Warmińsko-mazurskie voivodeship), more than doubles its share of the operator’s total available capacity under the plan (from 12.4% to 29.3%, or from 75 MW to 365 MW in absolute terms), moving from the third-lowest to the highest planned capacity among the operator’s six branches, while two of its nine node groups—including the regional capital’s own—receive no increase at all under the plan. A voivodeship-level spatial analysis, mapped using verified administrative boundary data, shows a pattern consistent with this at a national scale: Warmia–Mazury has the second-lowest installed generation capacity of Poland’s 16 voivodeships despite favourable land and irradiation conditions for photovoltaic development. Bootstrap analysis confirms this robust level of inequality while indicating that, with 52 units, the five-year increase is best read as a consistent tendency rather than as a statistically established widening; the operator-level values are specific to ENERGA-OPERATOR and are not numerically generalisable to Poland’s other four operators. We discuss the implications of these findings for grid-investment planning, RES-integration policy (cable pooling, storage co-location, curtailment reduction), and the energy-security dimension of an increasingly decentralised, weather-dependent generation system, and we identify concrete directions for future quantitative and spatial research.

1. Introduction

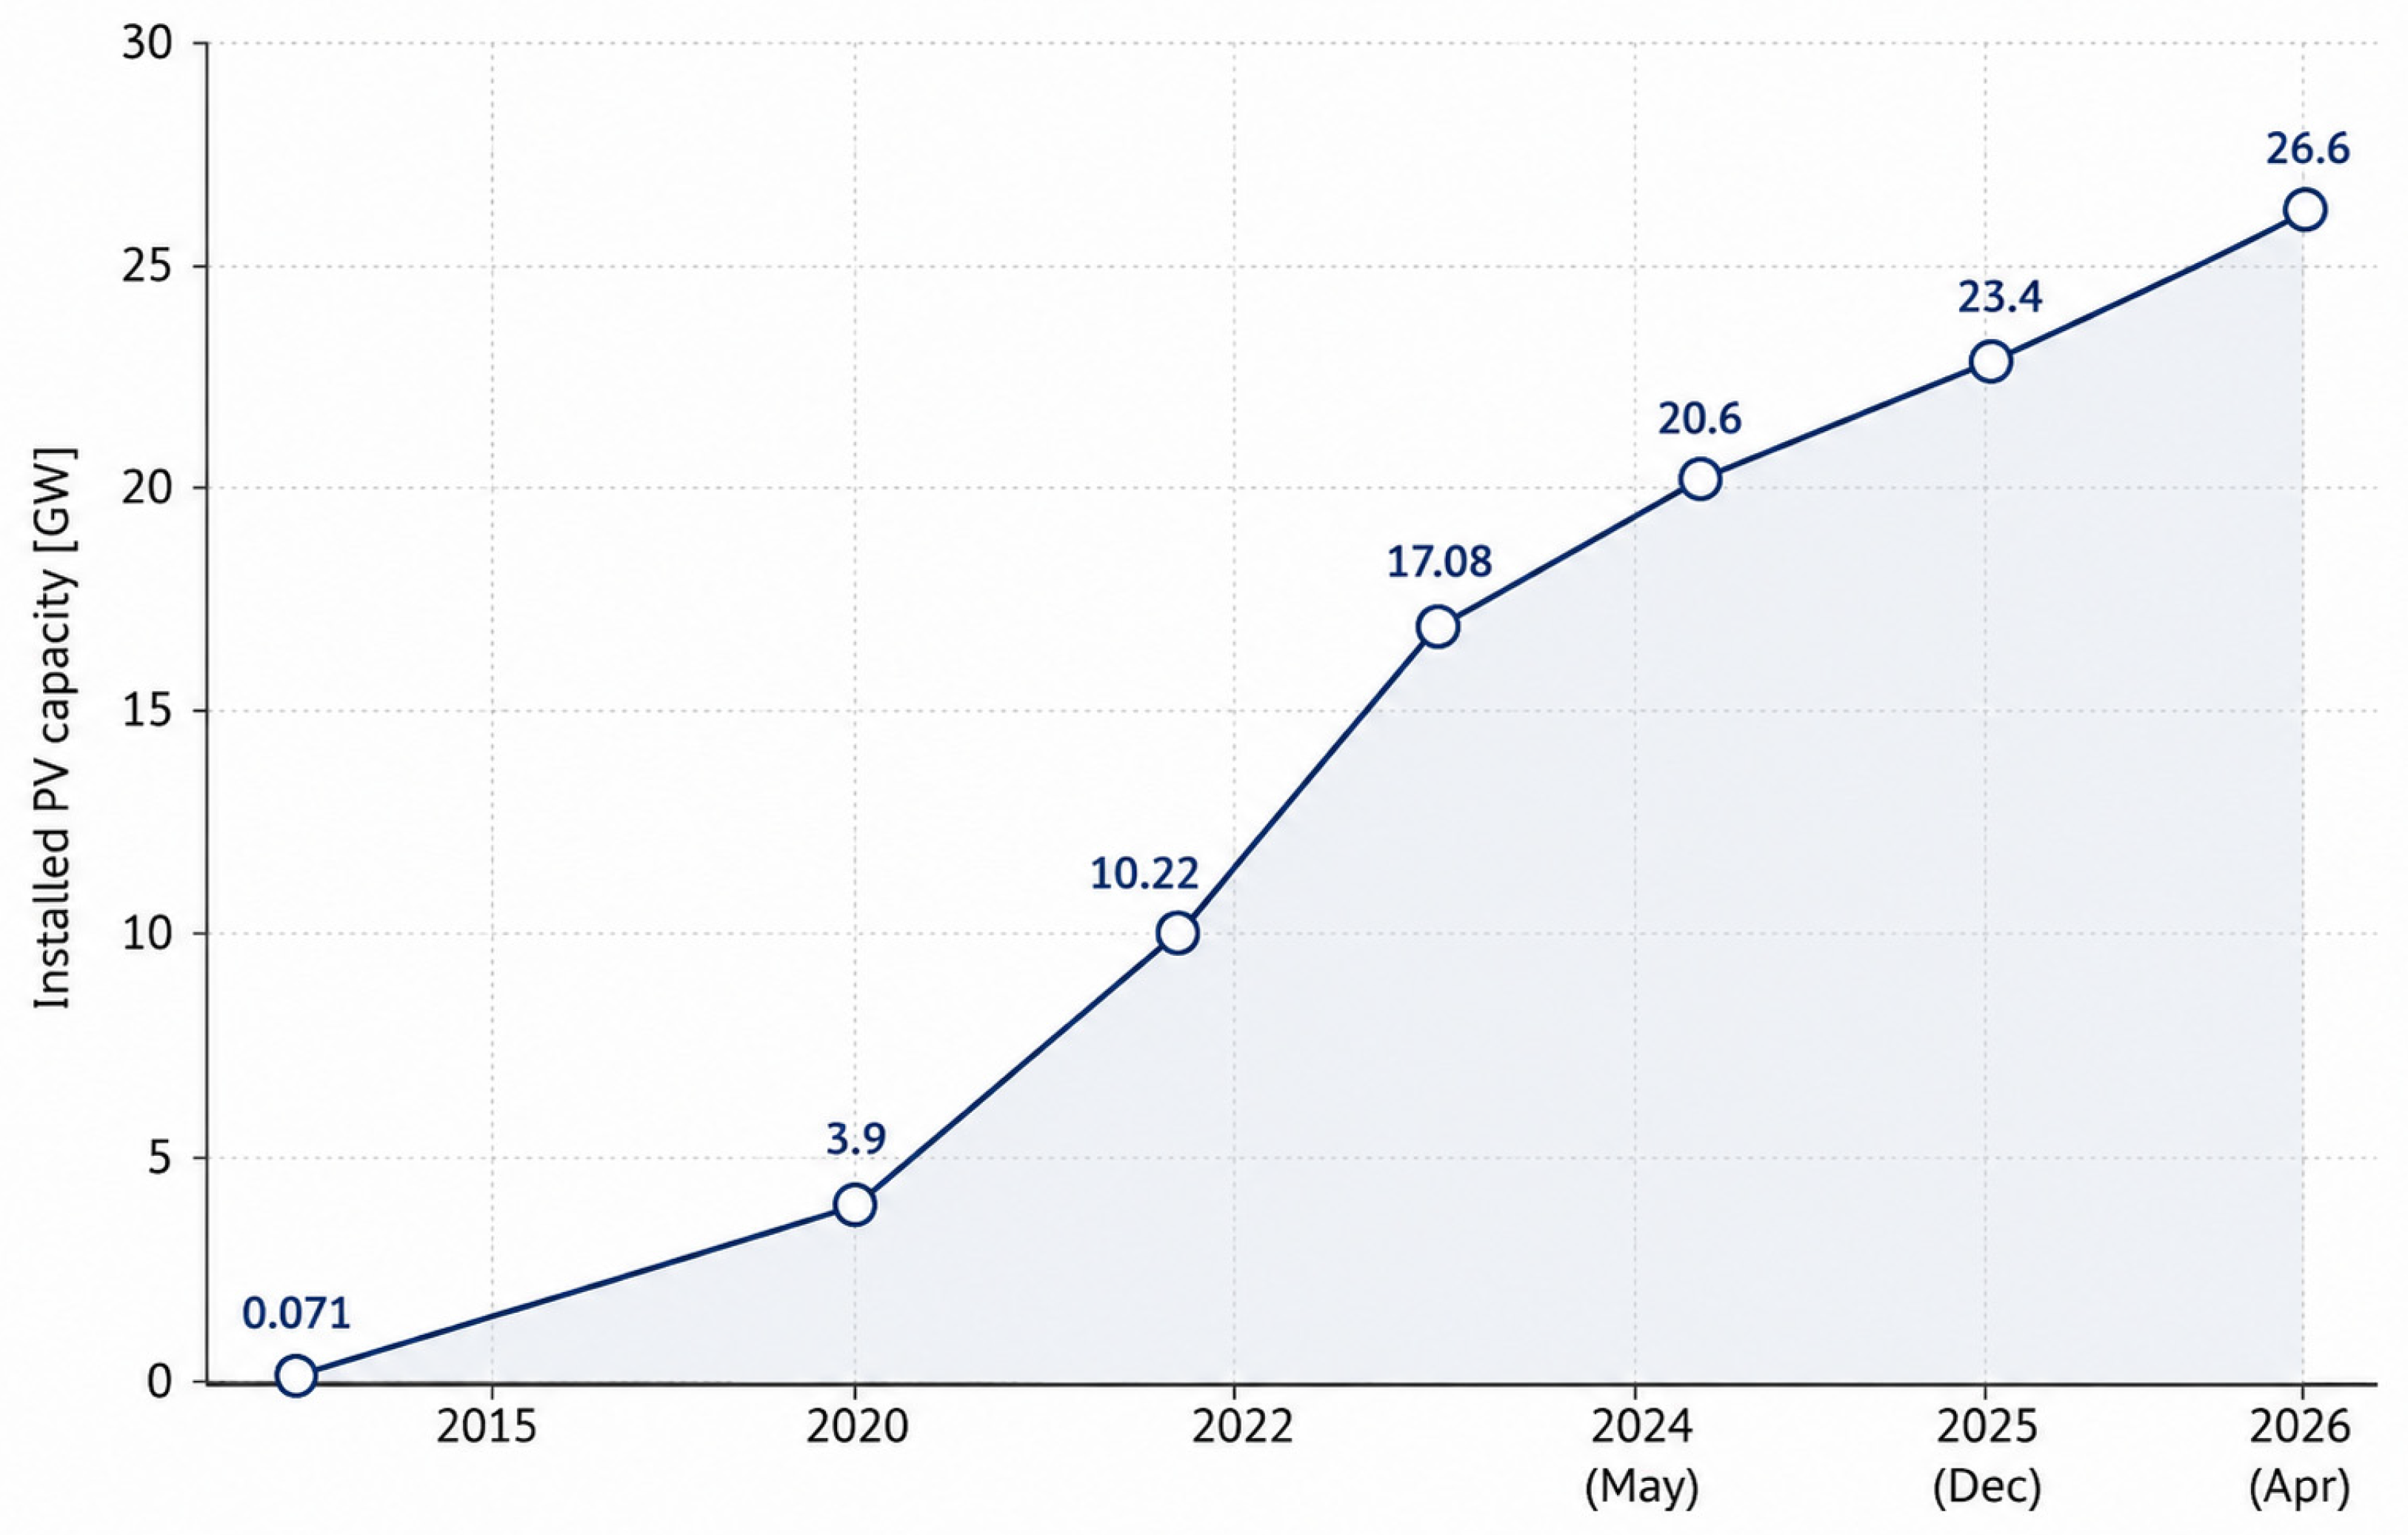
Over the past decade, Poland has undergone one of the most rapid renewable-energy expansions in the European Union, driven overwhelmingly by photovoltaics (PVs). National installed PV capacity rose from a negligible 71 MW in 2015 to roughly 17.1 GW at the end of 2023 and approximately 26.6 GW by April 2026 [1,2], achieved mainly through net-metering/net-billing rules for household “prosumers”, the “Mój Prąd” subsidy programme, and, since 2022, a growing segment of medium- and large-scale ground-mounted PV farms and hybrid installations. This expansion has taken place against the backdrop of the European Green Deal and the “Fit for 55” package [3,4,5], which set the overarching decarbonisation targets that Member States, including Poland, are expected to meet, primarily through renewable electricity, as reflected domestically in Poland’s Energy Policy until 2040 (PEP2040) [6].
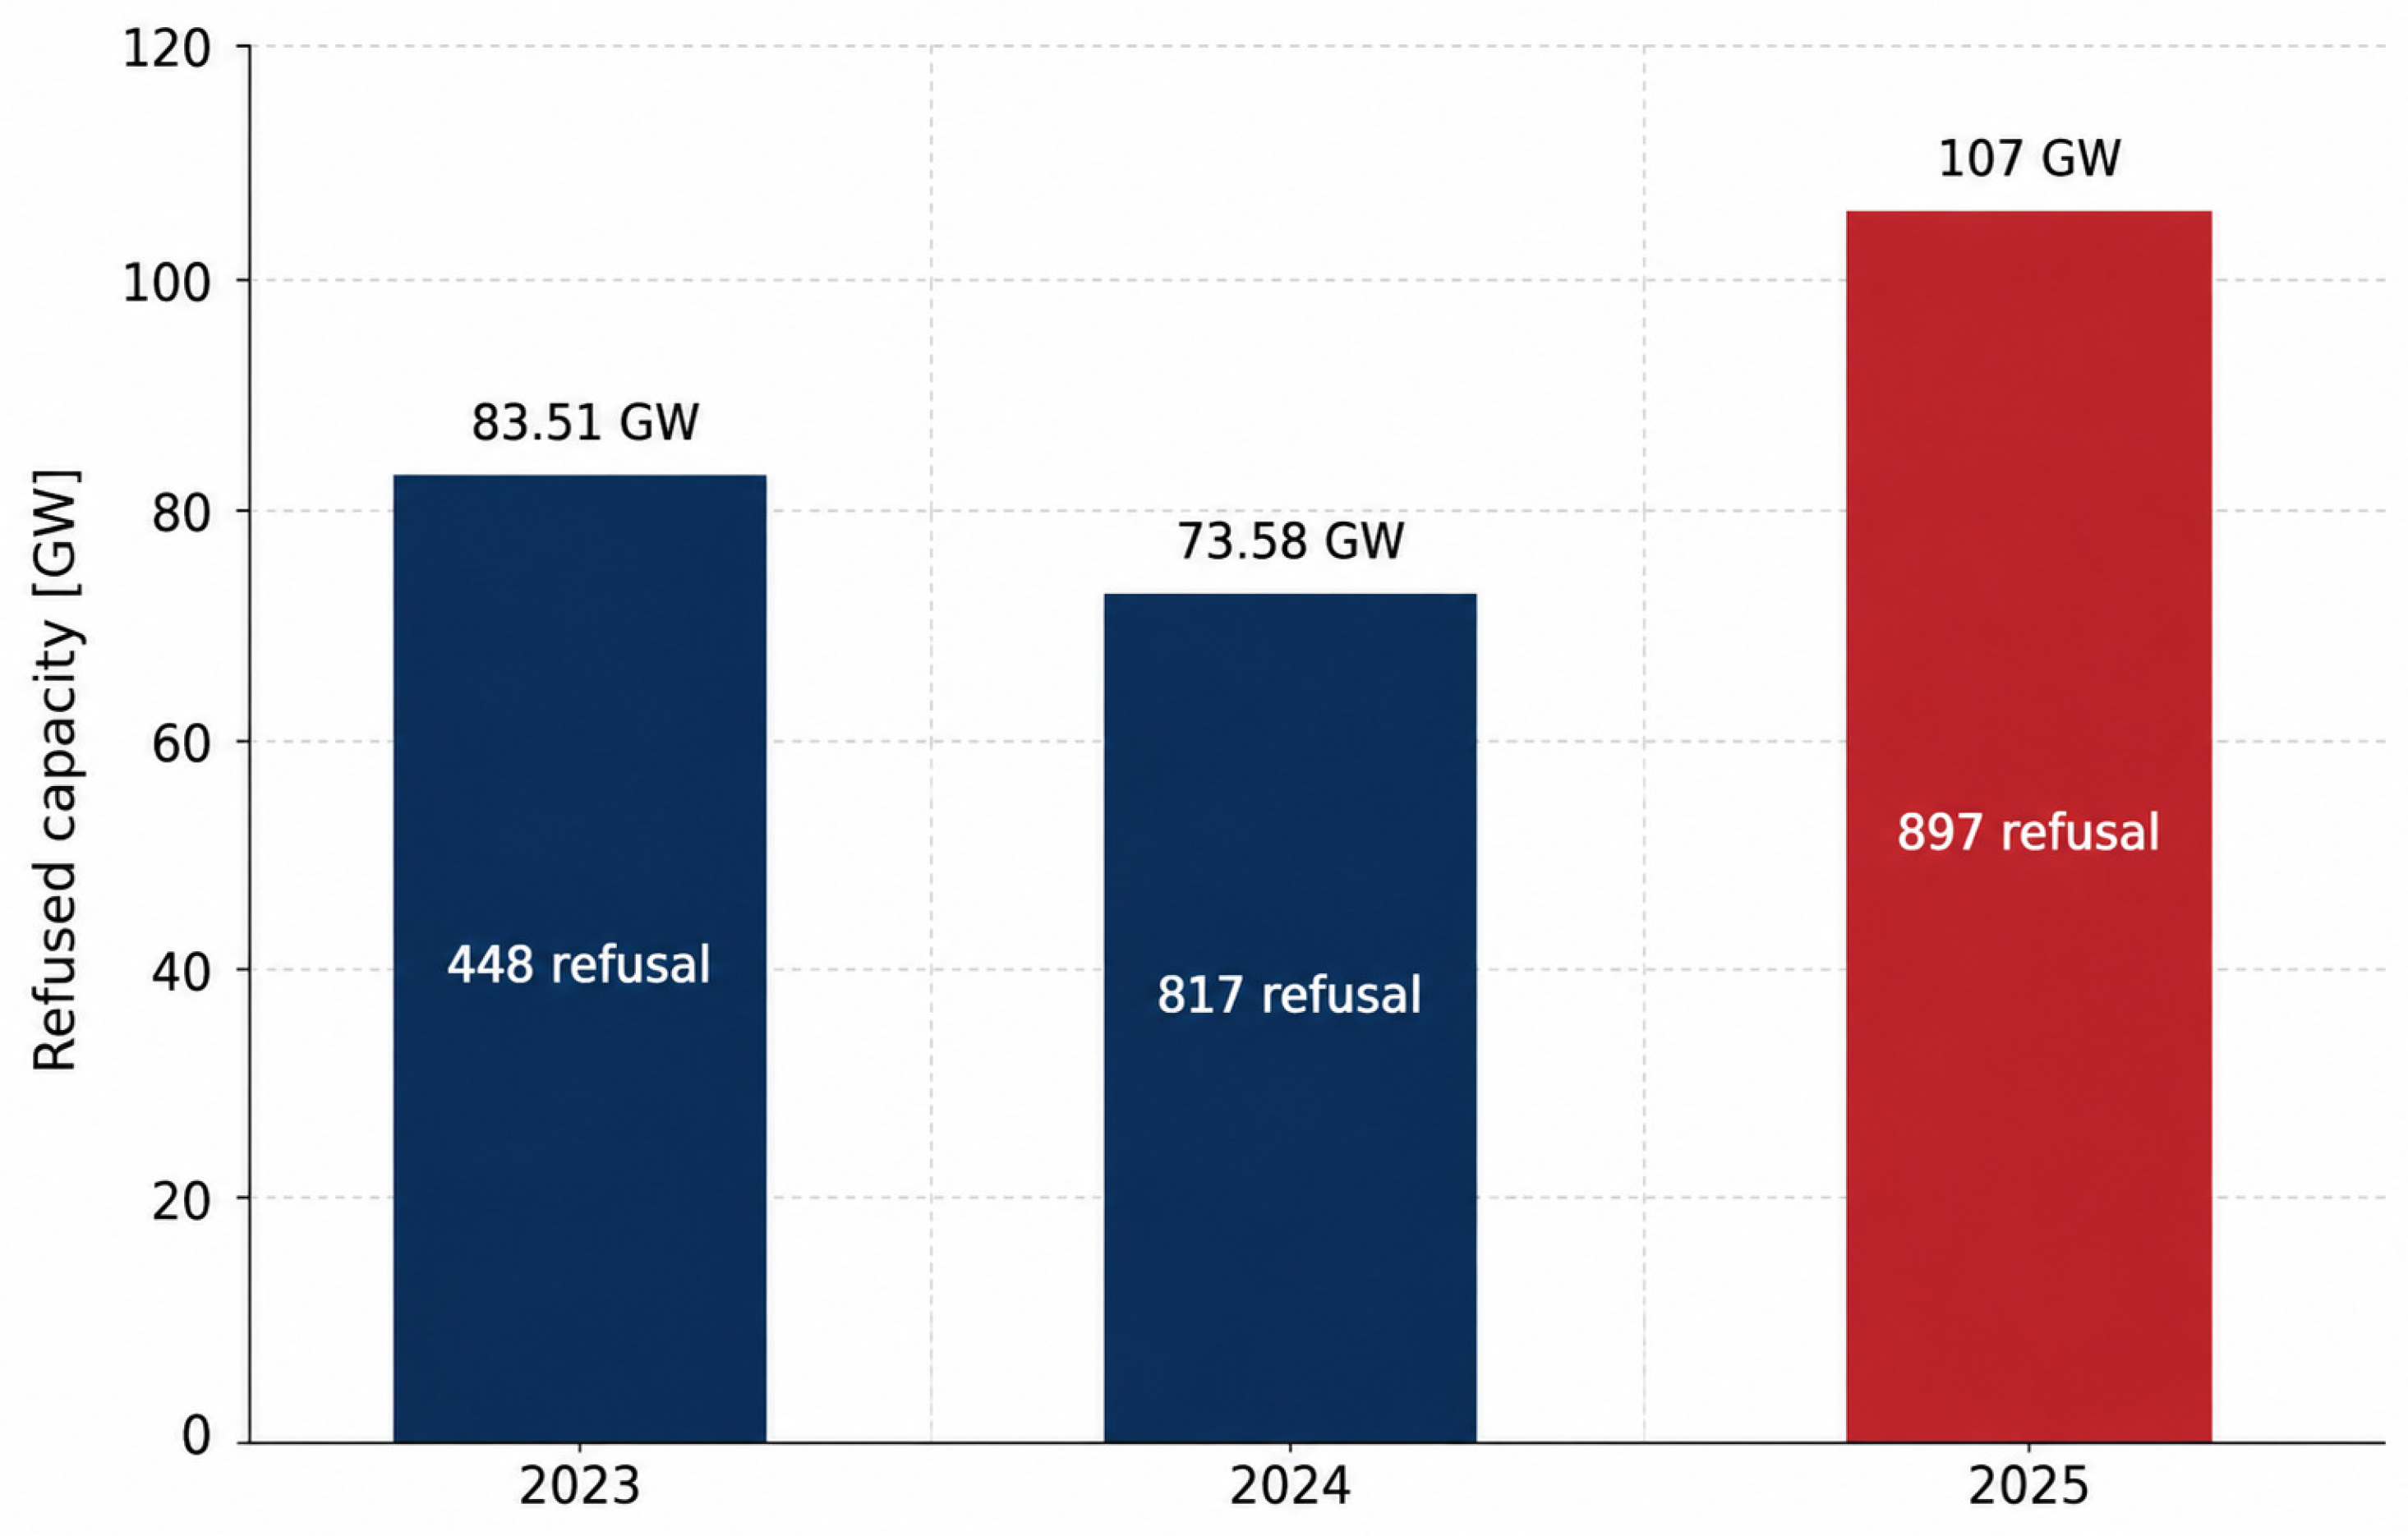
Yet, the diffusion of RES in Poland has not proceeded smoothly across space. A growing body of evidence—much of it produced not by academic research but by the energy regulator (Urząd Regulacji Energetyki, URE), the transmission system operator (Polskie Sieci Elektroenergetyczne, PSE), and industry associations—points to a structural bottleneck: the capacity of the electricity grid, at both the distribution (>1 kV, 110 kV) and transmission level, to physically accommodate new generation. In 2025 alone, Polish network operators refused new connection applications amounting to a cumulative 107 GW of capacity—a record, and an increase from 73.6 GW in 2024 and 83.5 GW in 2023 [7,8,9]. At the same time, roughly 240 GW of formally valid “connection conditions” are estimated to be outstanding across the country (approximately 150 GW of RES and 90 GW of storage), of which perhaps 100 GW is considered “dead” capacity unlikely ever to be realised [10,11]. The mismatch between the scale of RES ambitions and the physical and administrative capacity of the grid to absorb them has become severe enough that, since the period of 2023–2024, Polish transmission and distribution operators have resorted to non-market curtailment (“redysponowanie nierynkowe”) of already-connected PV and wind installations on an increasing scale—from around 40 GWh in 2023 to roughly 1320 GWh in 2025—and negative wholesale electricity prices occurred for 362 h in 2025 alone [12,13,14,15].
This situation has an inherently geographical character. Available connection capacity is not evenly distributed; it is calculated separately for each of several dozen “coherent node groups” within the service territory of each of Poland’s five main distribution system operators (TAURON Dystrybucja, PGE Dystrybucja, ENERGA-OPERATOR, ENEA Operator, and Stoen Operator), whose historical service areas—legacies of the pre-1990 state energy monopoly and its subsequent corporatisation and partial privatisation—only loosely correspond to the administrative boundaries (voivodeships, powiats, and municipalities) that structure Polish spatial planning [16,17]. Two municipalities with comparable solar irradiation, land availability, and investor interest may face radically different prospects for RES development depending on which side of an invisible, utility-defined boundary they happen to sit—a form of infrastructure-mediated spatial inequality that, we argue, deserves systematic quantitative documentation rather than the largely qualitative or case-study treatment it has received to date, both in the Polish-language policy literature and in the considerably larger international literature on “hosting capacity” [18,19,20,21,22].
This paper provides a quantitative, spatially explicit treatment. It (i) situates Poland’s current grid-congestion problem within its national regulatory and market context (2023–2026); (ii) uses inequality and growth-typology indices—including an original index developed for this study—to quantify how unevenly available grid-connection capacity is distributed and how it has changed over time, using the complete panel of 52 coherent 110 kV node groups reported by ENERGA-OPERATOR S.A.; (iii) maps the resulting regional pattern, with a detailed case study of the Warmia–Mazury region; and (iv) discusses the implications of these findings for grid-investment planning, RES-integration policy, and energy security.
Specifically, the paper addresses three research questions. RQ1: How unequally is the available grid-connection capacity distributed across a distribution system operator’s coherent node groups, and how does that distribution change between the base year and the end of the operator’s own five-year plan? RQ2: Do peripheral, rural branches exhibit a systematically different capacity trajectory from core, urbanised branches, and if so, in what direction? RQ3: What are the implications of the observed spatial and distributional pattern for national grid-planning priorities, RES-integration policy instruments (cable pooling, storage co-location, curtailment management) and energy security? Correspondingly, we test three hypotheses: H1, that available connection capacity is unequally distributed across node groups (Gini coefficient materially above zero) and that the operator’s plan does not reduce this inequality over the reporting horizon; H2, that the peripheral, predominantly rural Olsztyn branch (Warmia–Mazury) shows a distinct trajectory—combining a low absolute capacity base with a comparatively high concentration of “high-growth” node groups—relative to the operator’s more urbanised branches; and H3, framed explicitly as an exploratory comparison rather than as a confirmatory test, that a similar peripherality pattern is visible at the national and voivodeship levels. We label H3 exploratory because the national data measure installed generation capacity while the operator panel measures available connection capacity; the two are related but not interchangeable, and a voivodeship may hold little installed capacity for historical, economic or demand-related reasons while retaining connection headroom, or the reverse. A confirmatory national test would require node-group panels from all five operators, which do not exist in comparable published form.
The remainder of the paper proceeds as follows. Section 2 reviews the relevant literature at the intersection of energy geography and grid hosting-capacity research. Section 3 describes the legal–institutional framework governing RES grid connections in Poland. Section 4 presents data and methods, including the formal definitions of the inequality and growth indices used. Section 5 reports results. Section 6 discusses the findings—spatially, for grid-planning practice, for energy security, and in terms of the determinants that could plausibly have produced the observed pattern—and acknowledges the study’s limitations. Section 7 concludes and outlines directions for future research.

2. Theoretical Background and the Literature Review

2.1. Geographies of the Energy Transition

Energy geography has re-emerged over the past fifteen years as a distinct and rapidly growing subfield, positioned explicitly at the intersection of economic, social and political geography [23,24,25]. Bridge et al. [23] and Bridge and Gailing [24] argue that the shift from centralised, large-scale fossil-fuel generation to distributed, spatially diffuse renewable generation is not merely a technological substitution but a fundamental reconfiguration of the “geography of energy” itself. Calvert [25] similarly calls for a move from a singular “energy geography” toward plural “energy geographies”, attentive to the specific spatial logics of different energy sources and technologies; this call resonates with parallel reviews of distributed-energy-system classification and policy [26].
Within this broader field, a substantial literature has developed around energy justice and energy poverty, much of it with a strong empirical focus on Central and Eastern Europe (CEE), including Poland [27,28,29,30,31,32,33,34]. Bouzarovski et al. [27,28,31] have shown that the transition away from centrally planned, heavily subsidised heat and power provision in post-socialist CEE produced new, spatially concentrated forms of energy vulnerability. Karpińska and Śmiech [33] and a regional energy-poverty mapping exercise for Poland [34] extend this line of enquiry specifically to the Polish case. The literature establishes that access to energy infrastructure and services in Poland is geographically and socially uneven—a precedent this paper extends from energy consumption to energy production and from largely qualitative description to explicit quantitative measurement of inequality.
A second, more policy-oriented strand of the literature addresses Poland’s energy transition directly. Mrozowska et al. [35] identify path dependency on coal, fragmented governance, and infrastructural inertia as principal structural barriers—a diagnosis consistent with the broader review of barriers to, and prospects for, RES development in Poland during the 2022 energy crisis by Kryszk et al. [36], which the present paper extends by focusing specifically on the grid-connection-capacity dimension—a framing that also resonates with earlier analyses of the regional dimension of Polish renewable-energy policy [37]. Frankowski and Tirado Herrero [38] examine the socio-economic “co-benefits” of household-level energy-transition measures in Poland. At a broader regional scale, Santa et al. [39,40] and the edited volume by Mišík and Oravcová [41] situate the Polish case within the wider transformation trajectories of Central and Eastern Europe, while Verma et al. [42] examine local resilience strategies for the low-carbon transition.
Finally, a growing and directly relevant strand of the Poland-focused literature addresses the spatial siting of photovoltaic installations. Kurowska et al. [1] identify insufficient grid hosting capacity as one of the principal locational constraints on PV power stations in Poland. Stala-Szlugaj et al. [43] and Kowalczyk and Czyża [44] develop GIS-based multi-criteria methodologies for PV farm siting. Hołuj et al. [45] examine the potential for PV development on land affected by urban sprawl, while a study on “Regional Interferences to Photovoltaic Development” [46] catalogues eleven categories of siting barriers in Poland. Cieślak and Eźlakowski [47] develop a GIS-based decision-support methodology for siting rooftop solar PV using the Mrągowo municipality (Warmia–Mazury) as a case study, and Brodziński et al. [48] analyse the economic efficiency of PV farm investments in northeastern Poland. Szuta et al. [49] analyse the treatment of PV farms in local spatial development plans across forty Pomeranian municipalities. Complementary evidence on the diffusion of household PV adoption [50] and on the broader spatial distribution of renewable power plants in Poland [51,52] reinforces the case for a geographical reading of RES development, while comparable siting-constraint analyses exist for wind energy, including studies of environmental siting limits [53] and optimisation-based site selection for the Gdańsk region [54]. This body of work establishes siting suitability (land, irradiation, and land-use conflict) as a well-studied barrier; the grid-capacity constraint and its quantifiable spatial inequality are the specific focus of the present paper.

2.2. Grid Hosting/Connection Capacity as a Spatial–Technical Barrier

The international engineering and energy-systems literature on “hosting capacity”—the maximum amount of distributed generation that a given point or area of the network can accommodate without violating technical limits—is considerably larger and more mature than the geographical literature on the same phenomenon. Qamar et al. [18] provide a comprehensive review of hosting-capacity definitions, performance indices and enhancement techniques; Suchithra et al. [19] review voltage-control and reinforcement-learning approaches; and further studies address specific technical enhancement strategies, from export constraints [20] to temporal load-generation coordination [21] and market-based bilevel optimisation of hosting capacity in transmission networks [22]. Umoh et al. [55] review hosting-capacity determination methods for PV and electric-vehicle integration in low-voltage networks.
What is largely absent from the technical literature is a systematic treatment of hosting/connection capacity as an unevenly distributed resource whose statistical distribution—not merely its average level—has consequences for regional development. Standard inequality-measurement tools from regional and welfare economics, such as the Gini coefficient and the associated Lorenz curve [56], are routinely applied to income, land, and infrastructure distributions but have not, to our knowledge, been applied to grid-connection capacity in the Polish (or wider Central European) context. This is the specific methodological gap the present paper addresses, by bringing standard inequality-measurement tools together with an original, purpose-built growth index (Section 4) to the empirical study of grid-connection capacity.

3. Legal and Institutional Framework for Grid Connection in Poland

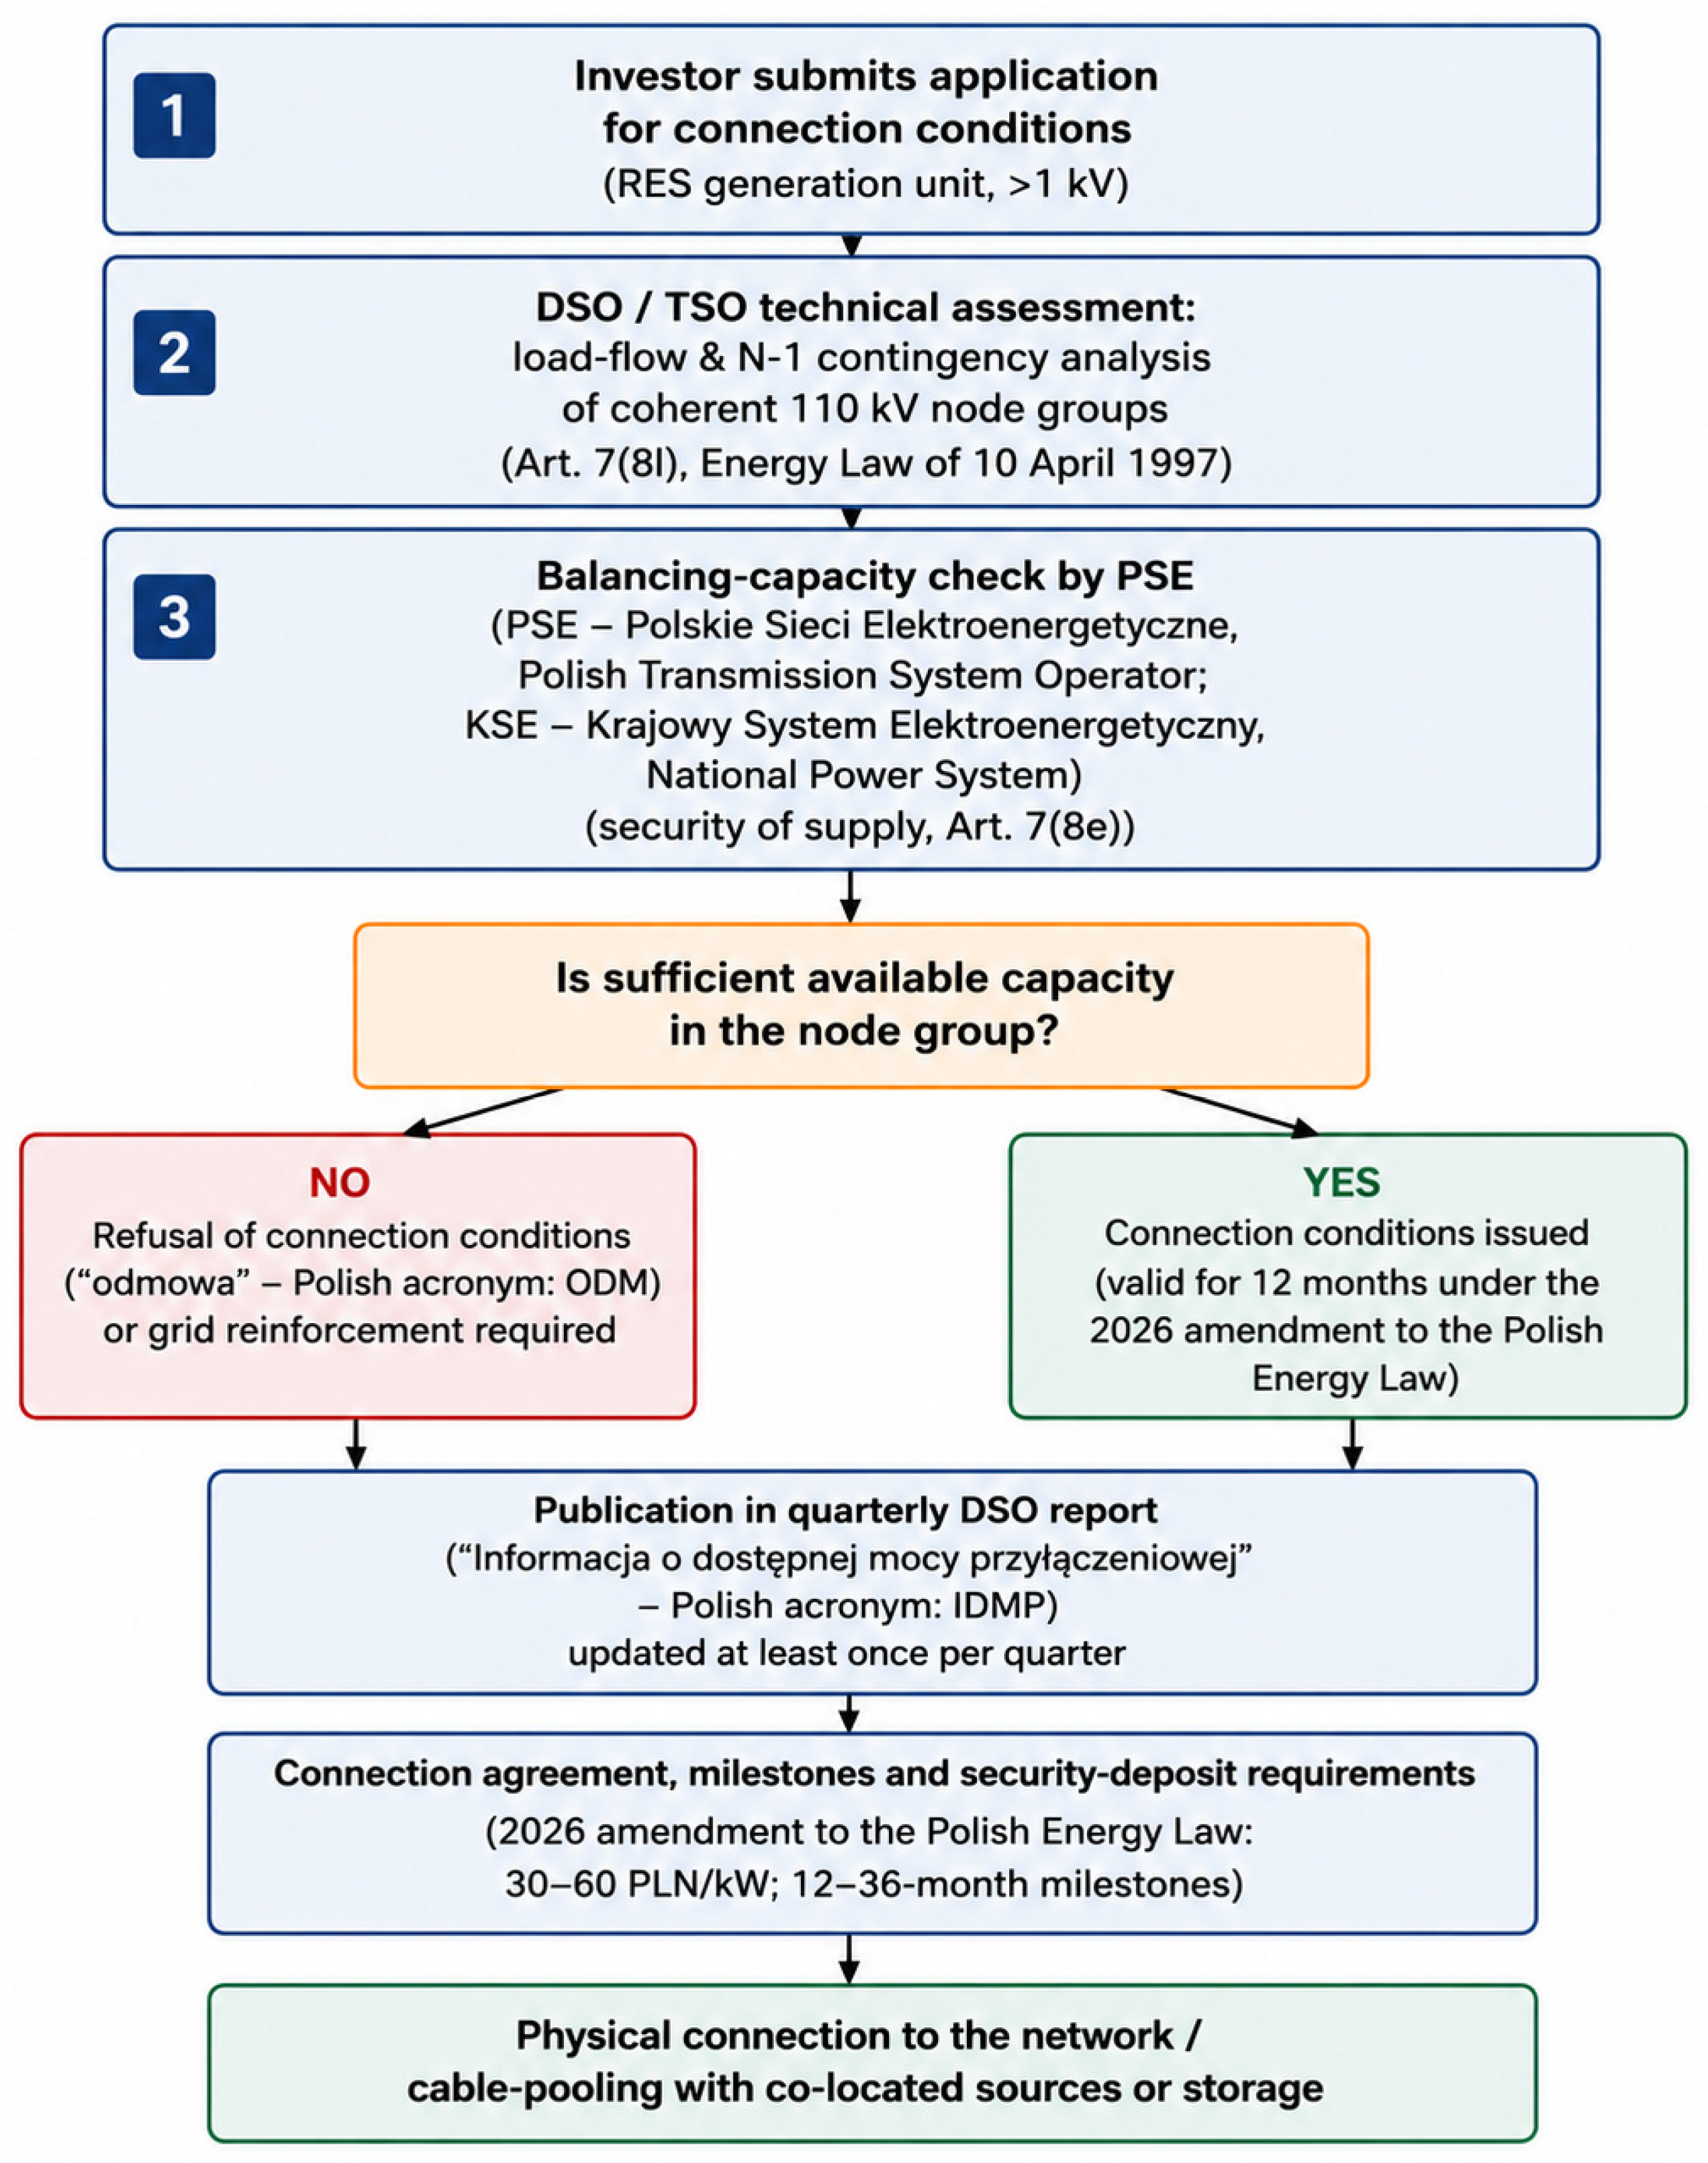
The legal obligation underlying most of the empirical material used in this paper dates to the Act of 19 August 2011 amending the Energy Law (Journal of Laws 2011, No. 205, item 1208), which inserted what is now Article 7(8l) into the Polish Energy Law on the 10th of April 1997. This provision obliges every enterprise engaged in the transmission or distribution of electricity to prepare and publish, for its entire network above 1 kV, information on the total available connection capacity for generation sources, broken down by electricity substation or group of substations belonging to the 110 kV-and-above network, together with the planned evolution of that capacity over the following five years. Distribution system operators (DSOs) have been required to comply since 27 January 2012 and to update the resulting reports at least once per quarter.
The technical methodology underlying these reports—described explicitly in the ENERGA-OPERATOR and PGE Dystrybucja documents examined for this study—proceeds in two steps. First, using load-flow sensitivity coefficients and node-correlation indices, the operator’s network model is partitioned into “coherent node groups”: sets of electrical substations whose loading responds in a correlated way to new generation connected at any point within the group. Second, for each coherent node group and for each of the following five calendar years, the operator determines the available connection capacity as the maximum additional generation that can be added uniformly across the group’s nodes before either (i) a network overload appears under normal operation or under any single-contingency (N-1) outage (“network factor”), or (ii) the transmission system operator PSE S.A. determines, in a parallel balancing-capacity assessment under Article 7(8e) of the Energy Law, that the addition would compromise the security of the National Power System (“balancing factor”). Reported values are typically rounded to 5 MW at the group level. Generation units above 2 MW must additionally commission a dedicated impact study (“ekspertyza”), meaning published figures are explicitly advisory rather than a guarantee of connectability.
Since 2023, this framework has been substantially amended. The Act of 17 August 2023 (in force from 31 August 2023) introduced “cable pooling”—the legal possibility for multiple generation sources (and, from 2026, energy storage) located close to one another to share a single grid-connection point—although uptake was initially modest (130 applications, c. 1.6 GW combined, in 2024) [57,58]. More far-reaching reform followed with so-called “Grid Act”, signed into law in March 2026 and largely in effect from 30 April 2026, whose stated purpose is to “unblock” a substantial share of the roughly 240 GW of formally issued but only partially utilised connection conditions nationally. Its principal mechanisms include: shortening the validity of newly issued connection conditions from 24 to 12 months; a mandatory financial security deposit (30 PLN/kW up to 100 MW, 60 PLN/kW above); binding development milestones (24 months for PV/storage, 36 months for wind); broadening cable pooling to storage and mixed-technology configurations; and new application and connection-advance fees [10,59,60]. The Ministry of Climate and Environment estimates these measures could release up to 150 GW of grid headroom nationally. Figure 1 summarises the resulting connection procedure end-to-end, and Table 1 lists the principal legal milestones.

4. Data and Methods

4.1. Data Sources

This study combines four categories of empirical material. First, it uses primary regulatory documents: six quarterly “available connection capacity” reports published by three of Poland’s five main DSOs under Art. 7(8l)—ENERGA-OPERATOR S.A. (state as of 30 December 2018), TAURON Dystrybucja S.A. (two reports, 2018) and PGE Dystrybucja S.A. (Q3 2018 and Q4 2018/2019)—obtained directly from operator websites. Second, it contains national-level current data (2023–2026) on RES capacity, grid congestion, curtailment, and regulatory reform, compiled from URE, PSE, Statistics Poland (GUS Local Data Bank, CC-BY 4.0), the Journal of Laws, ministerial publications and operator reports, supplemented where no official publication exists by specialist Polish energy-sector outlets, individually attributed throughout. Official sources take precedence wherever they are available: the legal provisions in Section 3 are cited to the Journal of Laws, the installed-capacity and land-area data in Section 5.7 to GUS, the transmission-development figures in Section 5.8 to PSE’s published plan, and the node-group panel to the operator’s own Article 7(8l) disclosure. The residual reliance on specialist media concerns a small number of 2025–2026 aggregates—refusal volumes, curtailment totals, and the estimated stock of unrealised connection conditions—for which the regulator and the transmission operator had not, at the time of writing, published an equivalent consolidated figure. Those instances are flagged in Section 6.5. Third, we utilized the narrative literature review of approximately 80 independently verifiable sources (via DOI or stable publisher URL); we describe it as narrative rather than structured or systematic because it followed no pre-registered protocol, search string or screening procedure, and we make no completeness claim for it. Fourth, the study combines administrative boundary geodata for Poland’s 16 voivodeships (NUTS-2 level), obtained from the Highcharts Maps Collection (CC BY 4.0), used together with the GUS capacity data to compute a spatial density index (Section 4.3) and to produce genuine, boundary-accurate choropleth maps (Section 5.7) rather than schematic sketches.
Of the six primary DSO reports, the ENERGA-OPERATOR document was selected for the detailed quantitative panel analysis (Section 5.3, Section 5.4, Section 5.5 and Section 5.6) because it is the only one of the six that reports in a single consistent tabular format with the available connection capacity (MW) of all 52 identified coherent 110 kV node groups across all six of the operator’s regional branches (Koszalin, Gdańsk, Olsztyn, Toruń, Płock, and Kalisz) for each year of a complete five-year panel (2018–2023). The TAURON and PGE reports, whose node-group tables use different internal formats and update cycles, do not permit an equivalent panel construction without extensive additional reconciliation; they are used instead for qualitative, illustrative comparison (Section 5.6). We regard the use of a single operator’s complete panel as preferable, for a first quantitative treatment of this kind, to a partial, non-comparable multi-operator dataset: the resulting statistics (Section 4.2) are internally consistent and fully reproducible (Appendix A), whereas pooling incompatible reporting formats across operators would introduce measurement error that could not be transparently quantified.
One property of this source governs how every subsequent result must be read, and we state it before presenting any statistics. The ENERGA-OPERATOR document was prepared with effect from 30 December 2018. Its first column reports the capacity and then available resources; the five subsequent columns report the capacity the operator planned to make available in each year to 2023 under its approved network development plan. The 2019–2023 values are therefore projections, not observations, and the six columns are not an observed annual panel. Throughout this paper we accordingly analyse the spatial distribution implied by a five-year development plan, and we use “planned”, “projected” and “under the plan” rather than “grew”, “rose” or “was recorded” whenever the 2019–2023 columns are involved. Where a statement concerns the 2018 base year alone, it refers to an observed value and is described as such. This distinction matters for interpretation: a node group we classify as stagnant is one for which the operator scheduled no capacity-relevant reinforcement, which is a statement about planning intent rather than about a realised outcome, and a comparison of planned against realised 2023 capacity—which would require a 2023-vintage report in the same tabular form, not currently obtainable—is set out in Section 7 as the natural extension of this work.
We use the 2018 (“base-year”) and 2023 (five-year planning horizon) columns of the ENERGA-OPERATOR panel as the core analytical window for two reasons. First, this is the horizon the operator itself analysed and published, reflecting its own approved network development plan rather than an externally imposed forecast. Second, this is, to our knowledge, the only publicly available disaggregated node-group panel of its kind for any Polish DSO with a complete, stable five-year run; the DSOs’ current (2025/2026) reporting has migrated toward interactive web map/dashboard formats (e.g., TAURON’s dostepnemoce.tauron-dystrybucja.pl portal and ENEA Operator’s interactive coverage maps) that do not, at the time of writing, expose the underlying node-group time series in a form suitable for the same panel-statistical treatment. Section 5.2, therefore, supplies the current (2023–2026) national picture from aggregate regulatory and market data, while Section 5.3, Section 5.4, Section 5.5 and Section 5.6 supply the fine-grained spatial and distributional detail that only the 2018–2023 panel makes possible. We treat the resulting two-tier evidence base—aggregate/current and disaggregated/historical—as complementary rather than as a weakness to be concealed and return to this point in Section 6.5.

4.2. Descriptive and Inequality Statistics

For the 52 node-group values in 2018 and again in 2023, we compute the minimum, first quartile (Q1), median, third quartile (Q3), maximum, arithmetic mean, standard deviation and coefficient of variation (CV = standard deviation/mean), reported in Section 5.4. To quantify the degree of inequality in the distribution of available capacity across node groups—analogous to income or land-distribution inequality in regional economics—we compute the Gini coefficient G for both years:
G = [n + 1 − 2·(Σ(ni + 1)·xi)/(Σxi)]/n, for values xi sorted in ascending order, i = 1,…,n, n = 52
with G = 0 indicating perfectly equal distribution of capacity across all 52 node groups and G = 1 indicating maximal concentration in a single group. We additionally construct the associated Lorenz curve, plotting the cumulative share of node groups against the cumulative share of available capacity they hold [56]. Because the Gini coefficient and Lorenz curve are standard, well-documented inequality-measurement tools, no fabricated or estimated values are involved: both statistics are computed directly and reproducibly (Appendix A) from the transcribed report data.

4.3. Original Indices: The ENERGA Grid-Connection Growth Index (Egci) and the Installed Generation-Capacity Density Index (Igcdi)

To characterise how each node group’s capacity trajectory evolved between 2018 and 2023—rather than only its level in either year—we develop an original growth index, the ENERGA Grid-Connection Growth Index (EGCI), defined for node group i as
EGCIi = (C2023,iC2018,i)/(C2018,i + k), with smoothing constant k = 5 MW
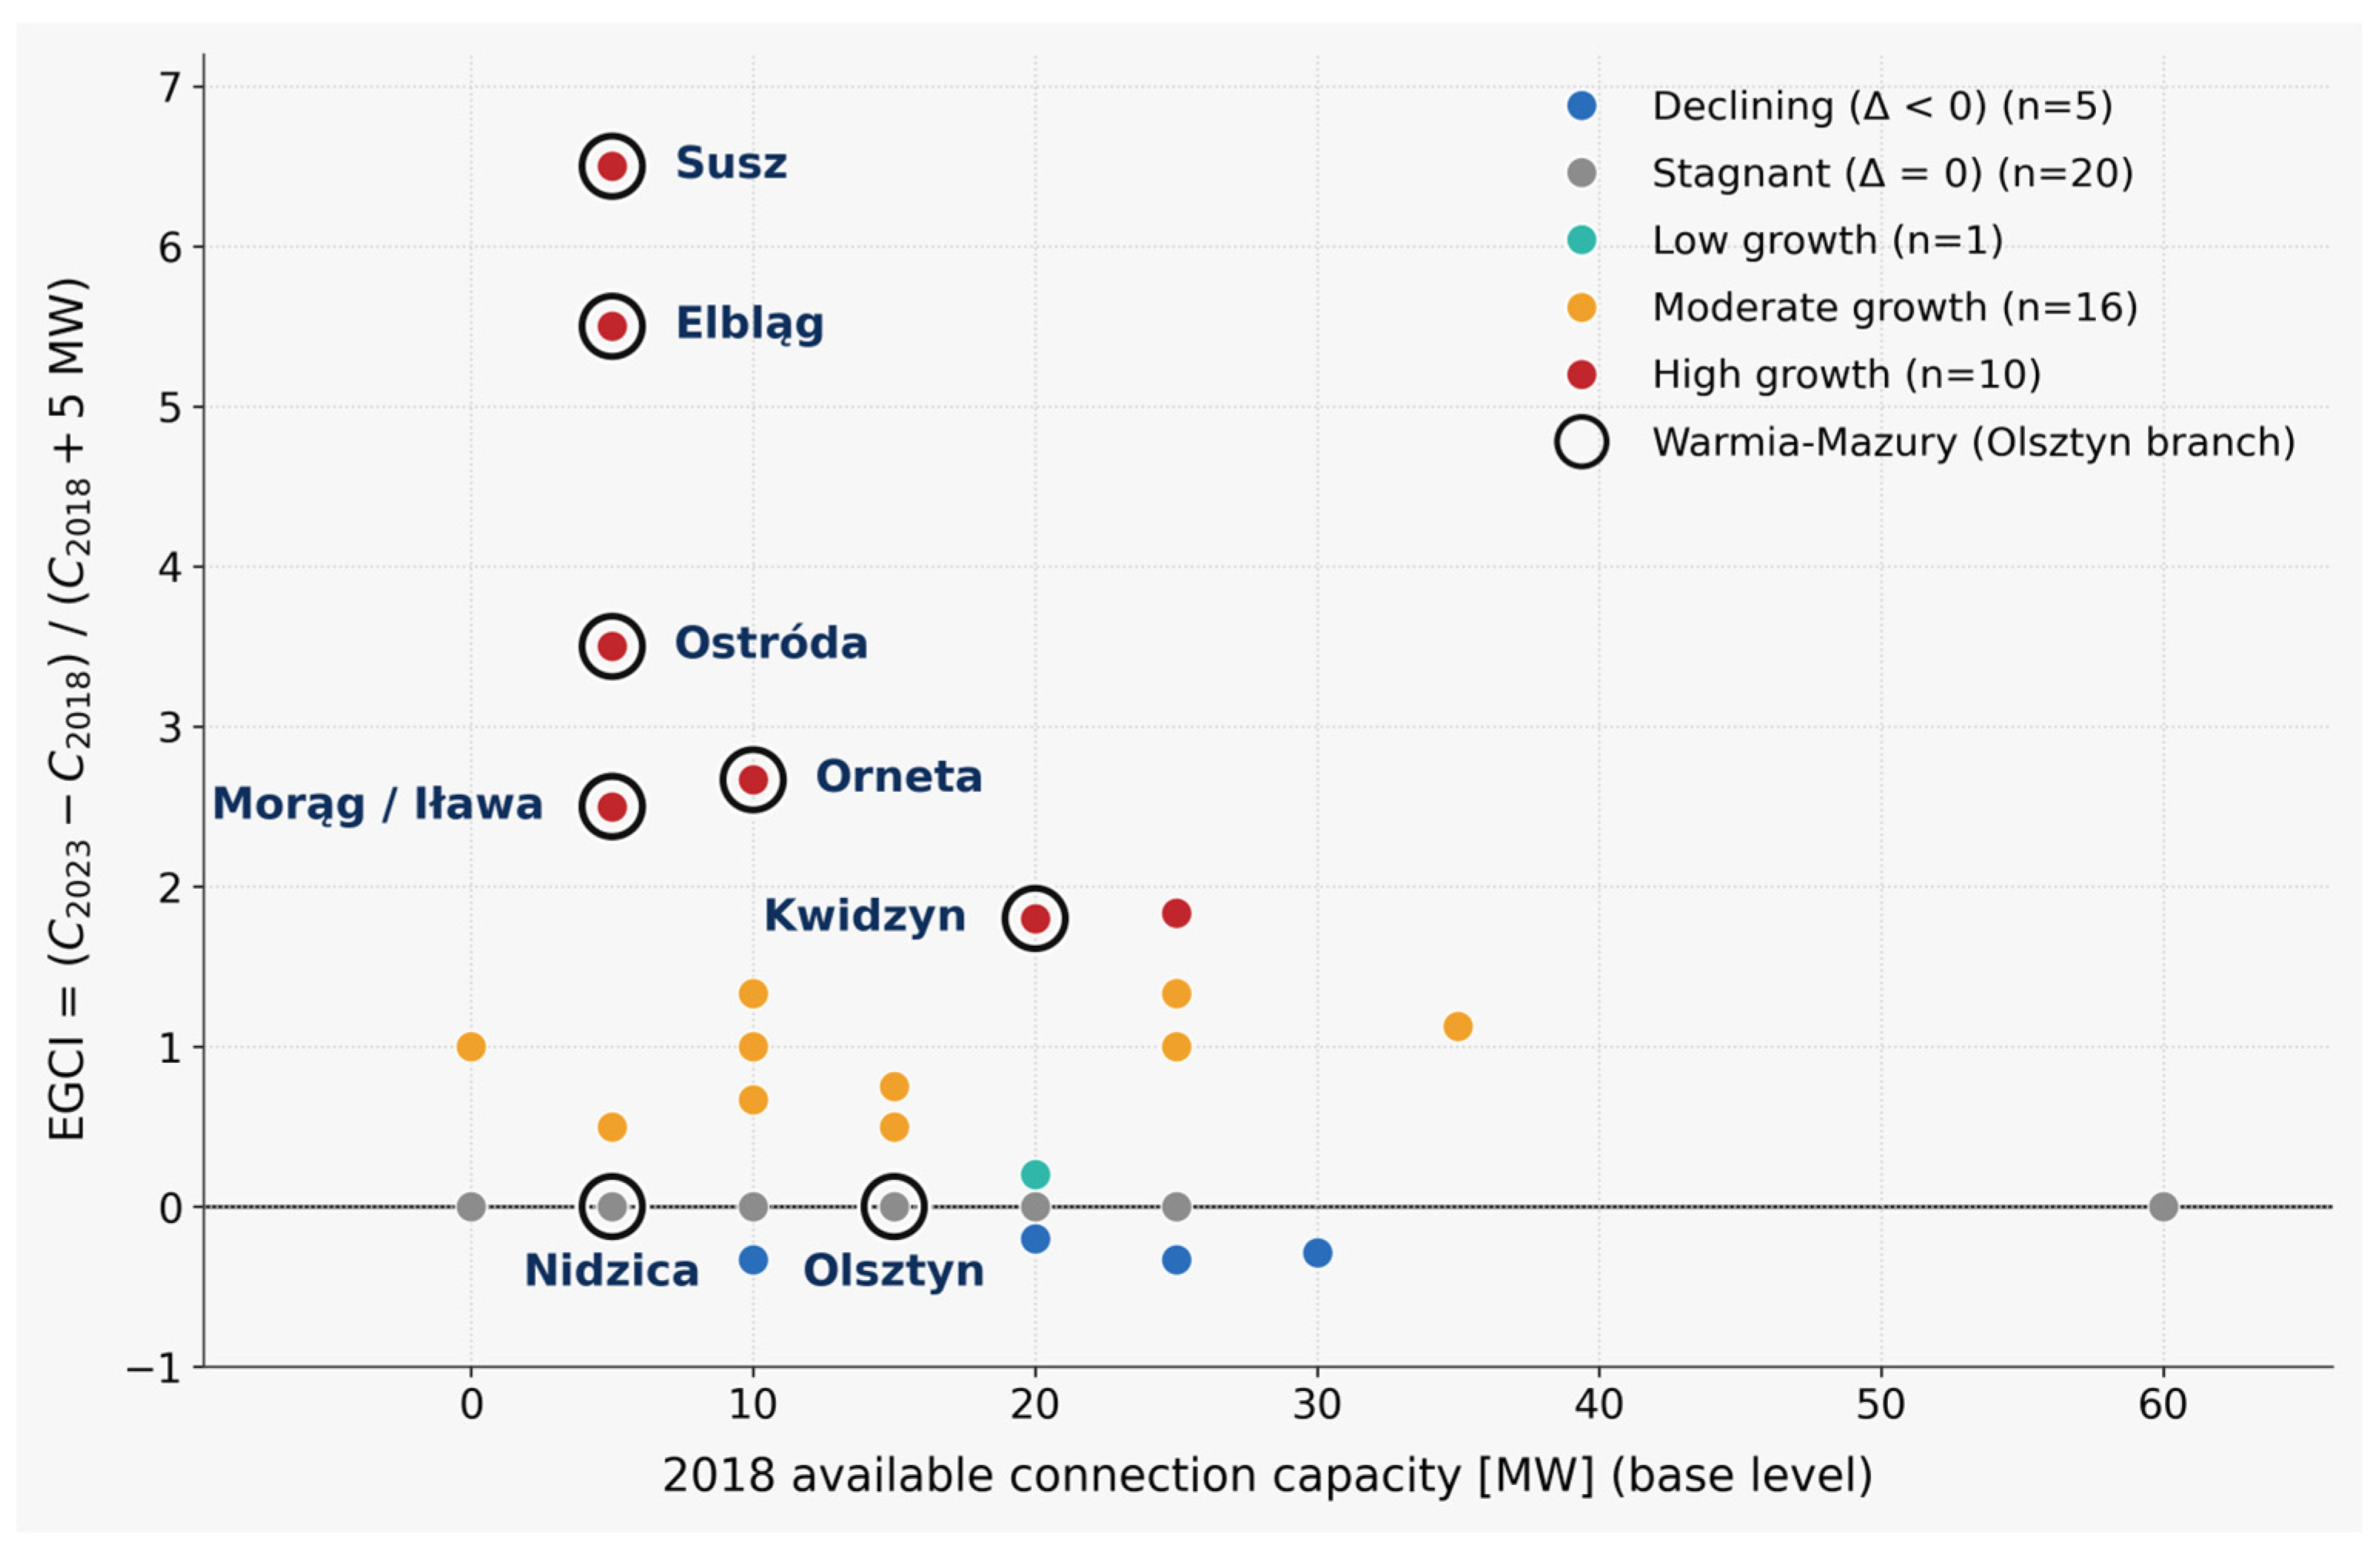
where C2018,i and C2023,i are the 2018 and 2023 available capacity values for group i. A simple percentage-growth rate, (C2023 − C2018)/C2018, is undefined for the seven node groups that reported zero available capacity in 2018 and produces extreme, not meaningfully comparable values for groups with a very small non-zero base (e.g., a group moving from 5 to 60 MW would register as a nominal +1100% “growth” driven almost entirely by the small denominator). The additive smoothing constant k = 5 MW—chosen to match the reports’ own minimum reporting increment—is a standard remedy for this small-base problem in growth-rate construction and yields an index that remains well defined at zero and is not dominated by denominator artefacts. Two clarifications about the index’s status are warranted, and we set them out explicitly because the index is presented here as an original contribution. First, its novelty does not lie in the functional form: additive smoothing of a ratio’s denominator is a long-standing device, familiar from Laplace-type smoothing of rate estimators and from the treatment of small-base growth rates in regional statistics. What is new is the calibration of that device to the specific reporting properties of Article 7(8l) data and its use to build a planning-relevant typology of network trajectories rather than a continuous growth measure. Second, k is not a free parameter chosen for convenience. Operators report available capacity rounded to 5 MW at the node-group level (Section 3), so 5 MW is the measurement resolution of the panel, and no change smaller than k is observable at all; setting k equal to that resolution makes the index treat a one-increment gain from the smallest observable base as growth of order one rather than as an unbounded percentage. The value also sits at the scale of a typical node group rather than of the largest ones: it equals the 2018 first quartile and is of the same order as the 2018 median of 7.5 MW. Section 5.9 reports a formal sensitivity analysis over k ∈ {1, 2.5, 5, 10, 20} MW. We classify node groups into five trajectory types using fixed, substantively interpretable thresholds rather than data-driven quantiles (Section 5.5): “stagnant” groups are scheduled for no absolute MW change at all over the five-year horizon (a meaningful real-world category in its own right, since it identifies locations with no planned reinforcement whatsoever); “declining” groups are those for which the plan reduces available capacity outright (absolute change < 0 MW), a category we report separately because a planned reduction is substantively different from slow growth; “low growth” groups have 0 < EGCI < 0.5; “moderate growth” groups have 0.5 ≤ EGCI < 1.5; and “high growth” groups have EGCI ≥ 1.5.
To extend the analysis beyond a single operator’s territory, we additionally construct an Installed Generation-Capacity Density Index (IGCDI) at the voivodeship level. We name it for the quantity it actually normalises—installed generation capacity, not connection or hosting capacity—and define it as installed generation capacity (GUS, 2024, MW) divided by land area (in thousands of km2):
IGCDIj = Capacityj/(Areaj/1000), for voivodeship j
where Areaj is the official land area of the voivodeship as published by Statistics Poland, in square kilometres. Published land areas are used in preference to areas derived from boundary-polygon geometry because they are exact, require no reprojection, and are trivially auditable. Capacity, area and the resulting index are tabulated for all sixteen voivodeships in Section 5.7, and the calculation is included in the Supplementary Code File S1 (Section 4.5). Unlike raw installed-capacity totals (Section 5.7), which mechanically favour large voivodeships, IGCDI expresses capacity per unit of territory and is, therefore, a more appropriate basis for comparing the generation endowment of large, sparsely built regions such as Warmia–Mazury against smaller, denser, industrial ones (Section 5.7). Three clarifications are needed about what this index is and is not, because the quantity it normalises is easily confused with hosting capacity. First, IGCDI normalises installed generation capacity, not available connection capacity: it measures a region’s generation endowment relative to its territory and is not an engineering estimate of how much further generation the network there could absorb. Second, it is, accordingly, not a substitute for the structural quantities that actually bound hosting capacity—circuit-kilometres of 110 kV line, transformer ratings, thermal limits and voltage-stability margins—none of which scale with geographic surface area, and we draw no engineering conclusion from it. It is used only as a regional-development descriptor at a spatial scale for which node-group data do not exist. Third, the structurally appropriate normaliser would indeed be network extent rather than surface area; Polish distribution system operators do not publish circuit-kilometres of 110 kV line, transformer ratings or substation counts disaggregated by voivodeship, so that index cannot presently be constructed from public data. Section 5.9 therefore reports the one structural normalisation that the ENERGA panel does support—available capacity per coherent node group—as a check on the conclusions the area-normalised index is used to support.

4.4. Spatial Mapping

Choropleth maps (Section 5.7) were produced in Python 3.12.7 (geopandas 1.1) using the verified, CC-BY-4.0-licenced NUTS-2 (voivodeship) boundary polygons distributed in the Highcharts Maps Collection, joined to the GUS capacity data and the IGCDI values computed as above. A third, categorical map assigns each voivodeship to its primary DSO based on the operators’ own published coverage statements; several border voivodeships have a genuine, legacy partial overlap between two operators, which we flag explicitly in the map caption rather than resolving arbitrarily, since no single authoritative vector dataset of exact historical utility-territory boundaries (as opposed to present-day voivodeship administrative boundaries) could be identified in the course of this research.

4.5. Reproducibility

The complete transcribed dataset underlying Section 5.3, Section 5.4, Section 5.5 and Section 5.6—available connection capacity, in MW, for all 52 ENERGA-OPERATOR node groups and all six reported years (2018–2023)—is reproduced in full in Appendix A, together with the derived EGCI value and trajectory classification for every group, so that all statistics reported in Section 5 can be independently recomputed. To remove any remaining ambiguity, the complete calculation is also provided as a Supplementary Code File S1. It contains the transcribed node-group panel; the Gini, Theil and CR10 computations; the bootstrap procedure and its seed; the EGCI values, the five-category classification and the sensitivity analyses over k and over the classification thresholds; the Wilcoxon and Spearman tests; the voivodeship capacity, area and IGCDI table; the allocation-rule computation underlying Section 5.10; and the code that generates figures (all graphs) presented in the Results section. Running the file reproduces every numerical value reported in this paper.

5. Results

5.1. Current State of Res and Photovoltaic Development in Poland

Installed PV capacity in Poland has grown from 71 MW in 2015 to approximately 10.2 GW in May 2022, 17.1 GW at the end of 2023, and roughly 25.6–26.6 GW between February and April 2026 (Figure 2) [1,7,61,62]. As of early 2026, prosumer micro-installations accounted for roughly 13.3–13.9 GW, slightly over half of total installed PV capacity, which now represents an estimated 65.85% of RES output at peak. Total installed generation capacity across all technologies in the National Power System (KSE) reached approximately 75.5 GW by the end of 2025—more than double the system’s peak demand of roughly 30 GW recorded in early 2026.

5.2. National Grid Congestion, Curtailment and the Connection Queue, 2023–2025

Polish network operators refused new connection-condition applications amounting to a cumulative 83.5 GW of requested capacity in 2023, 73.6 GW in 2024, and a record 107 GW in 2025 (Figure 3; Table 2), even as the number of individual refusals fell from 7448 in 2023 to 4897 in 2025, after a peak of 7817 in 2024—implying that an increasing share of refusals now concerns very large, industrial-scale projects [7,8,9]. Market estimates place the stock of formally valid but as-yet-unrealised connection conditions nationally at approximately 240 GW (about 150 GW RES, 90 GW storage), of which perhaps 100 GW is regarded as speculative “dead” capacity [10,11]. Non-market curtailment rose from roughly 40 GWh in 2023 to approximately 597 GWh (PV) plus 125 GWh (wind) in 2024, and to approximately 1320 GWh of combined wind-and-PV curtailment in 2025 [13,15]. These are national figures, and the institutional route by which they arise matters for their interpretation. Non-market redispatch in Poland is ordered by the transmission system operator, PSE, for the National Power System as a whole; for units connected to distribution networks the order is passed to the relevant DSO, which executes it. PSE does not publish redispatched volumes disaggregated by DSO service area, so the 1320 GWh cannot be attributed to ENERGA-OPERATOR’s territory specifically, and we do not attempt to do so. The institutional split is itself informative for the argument of this paper: connection capacity is assessed at the distribution level under Article 7(8l) and at the transmission level under Article 7(8e) (Section 3), while the curtailment that follows from an imbalance between them is dispatched centrally. Congestion in Poland is, therefore, neither purely a local distribution constraint nor purely a national transmission one—the two interact, which is why Section 5.2 reports the system-level consequence while Section 5.3, Section 5.4, Section 5.5 and Section 5.6 examine capacity at the level at which connections are actually granted or refused. Negative day-ahead wholesale electricity prices occurred on 362 h in 2025 (up from 203 in 2024), triggering, since April 2025, a mechanism obliging RES producers to forfeit certificates of origin for output generated during qualifying negative-price periods [14].

5.3. The ENERGA-OPERATOR Case: 52 Coherent Node Groups, 2018–2023

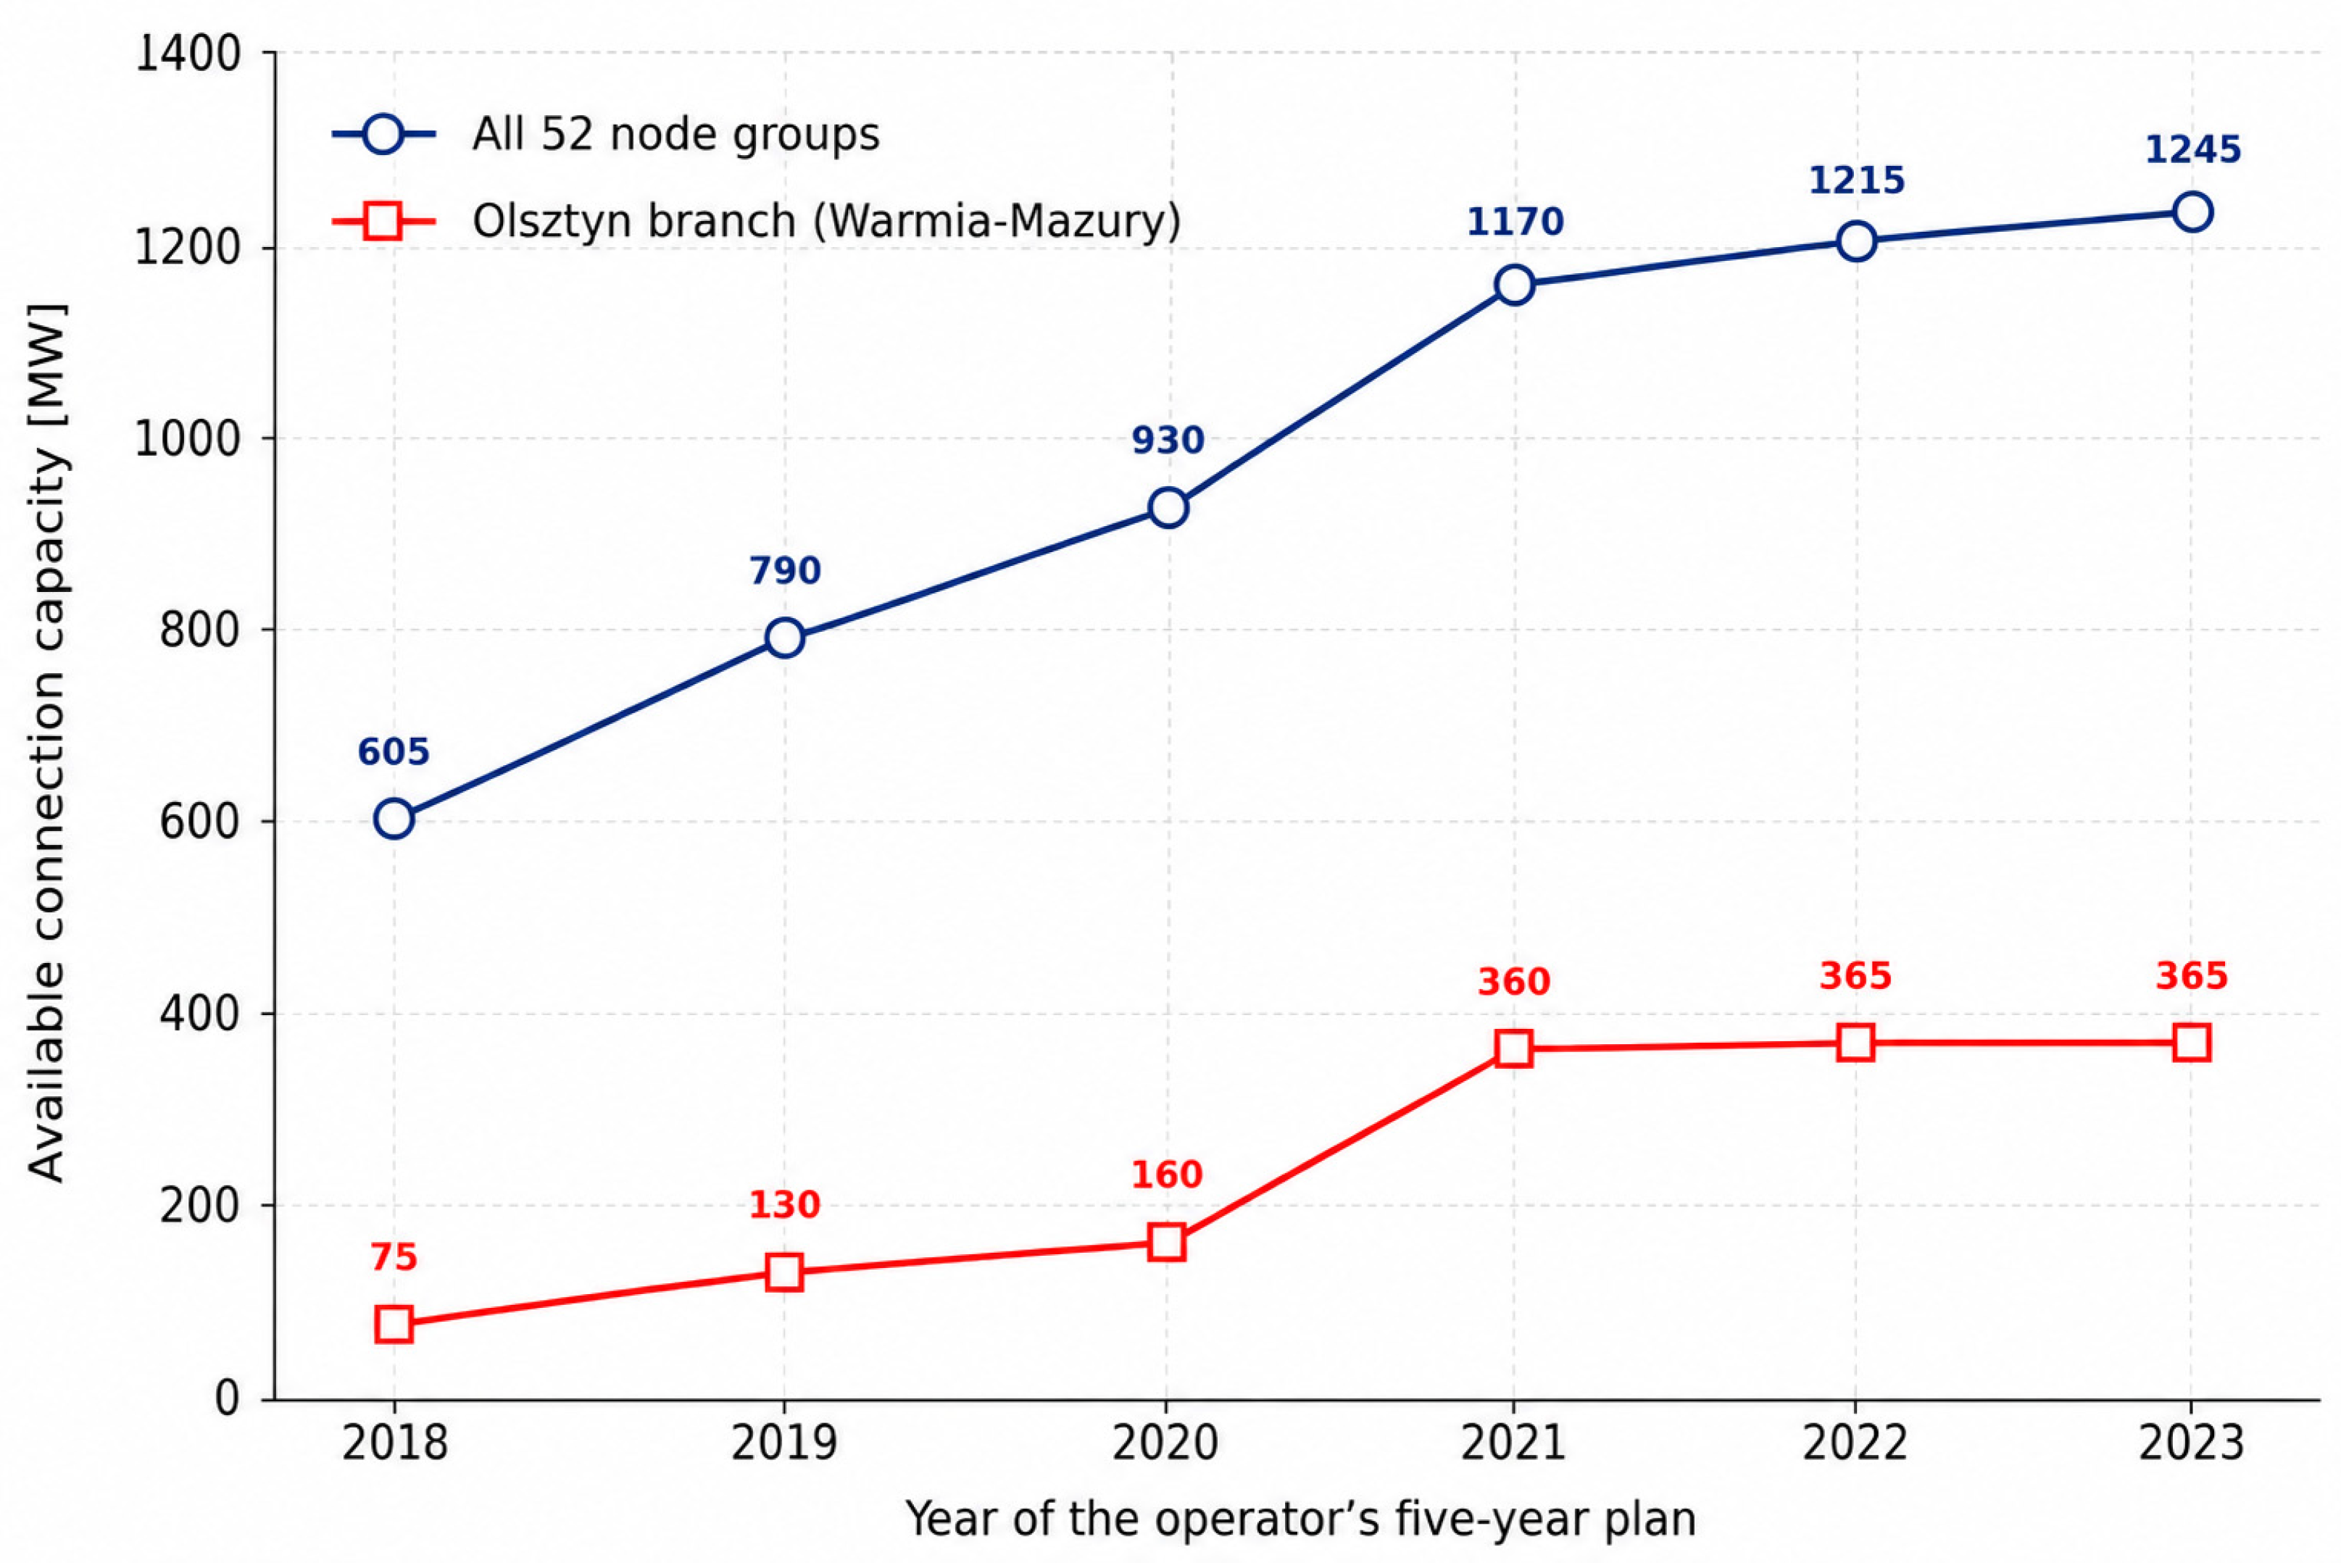
The ENERGA-OPERATOR report identified 52 coherent 110 kV node groups across the operator’s six regional branches, with individual groups ranging in reported 2018 available capacity from 0 MW (e.g., Wicko, Mława, Kutno-1, indicating complete local saturation) to 60 MW (Ostrzeszów, Kalisz branch). Summed across all 52 groups, total reported available connection capacity under the network-factor scenario rises, under the plan, from 605 MW in the 2018 base year to 1245 MW in 2023—a 106% increase over the five-year planning horizon (Figure 4). As detailed quantitatively in Section 5.4 and Section 5.5, this aggregate growth conceals substantial, and increasing, spatial inequality.

5.4. Distributional Inequality in Available Connection Capacity

Table 3 reports the full descriptive statistics for the 52-node-group distribution in 2018 and 2023.
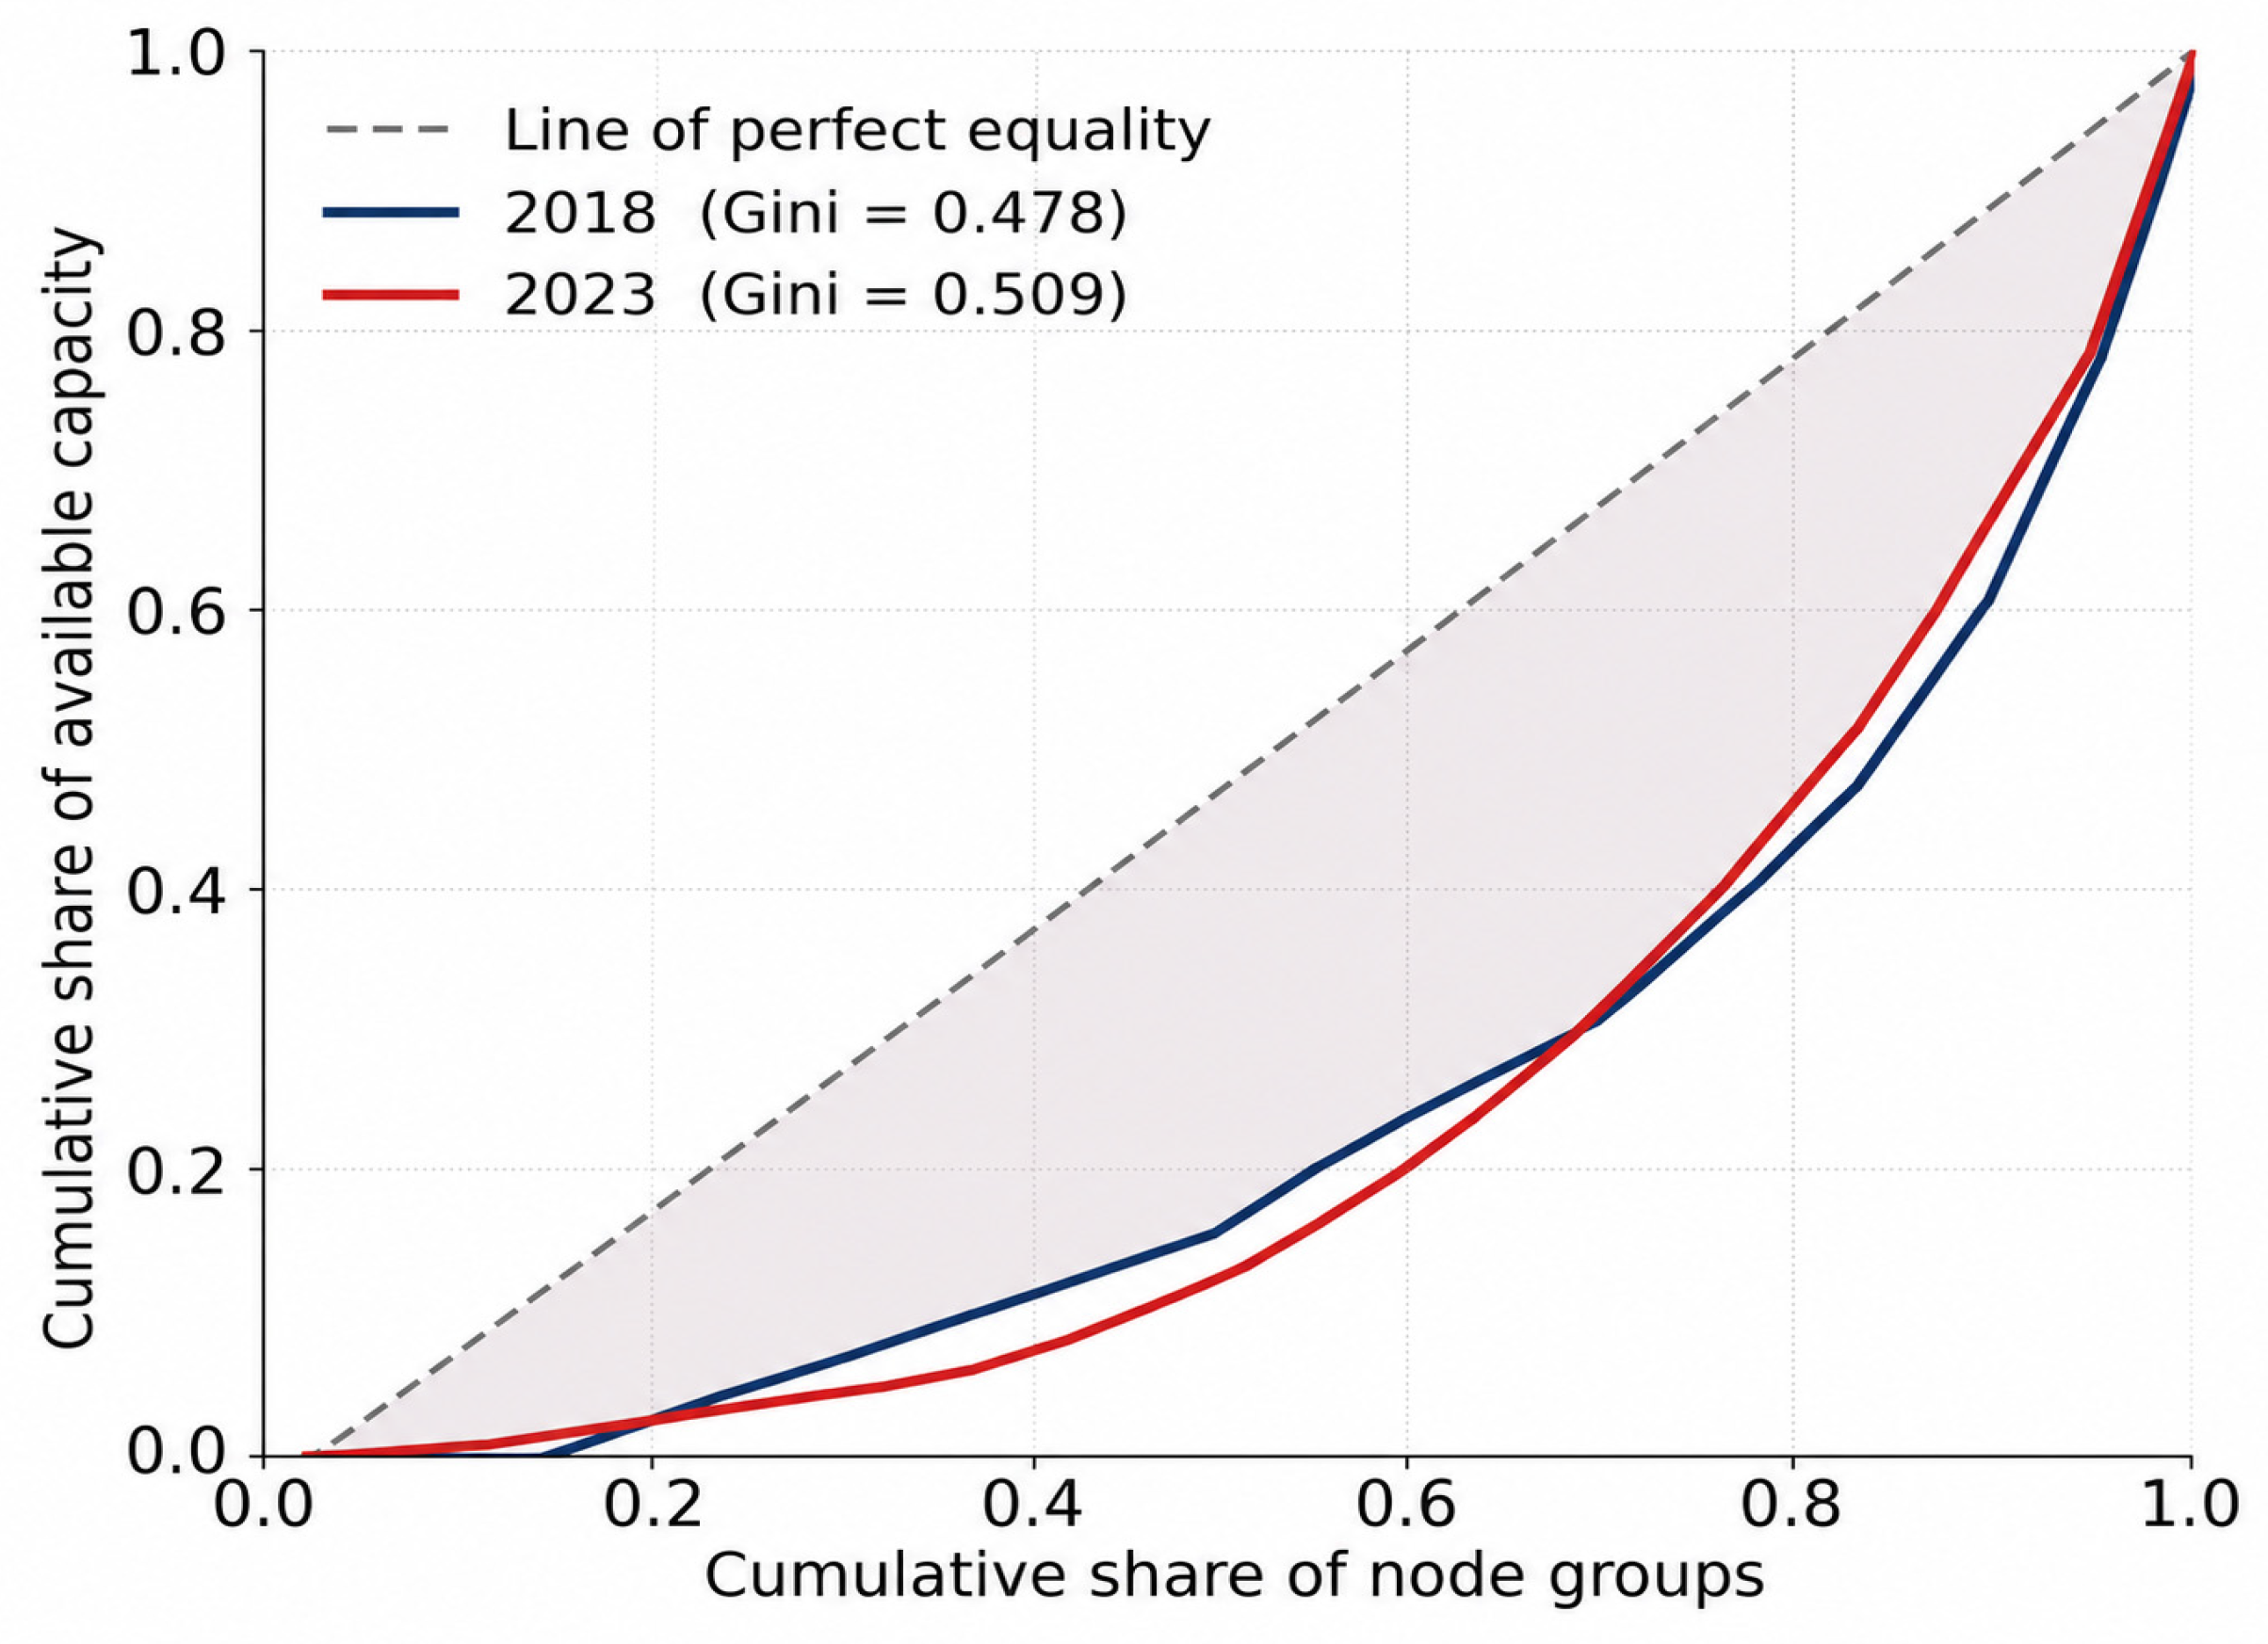
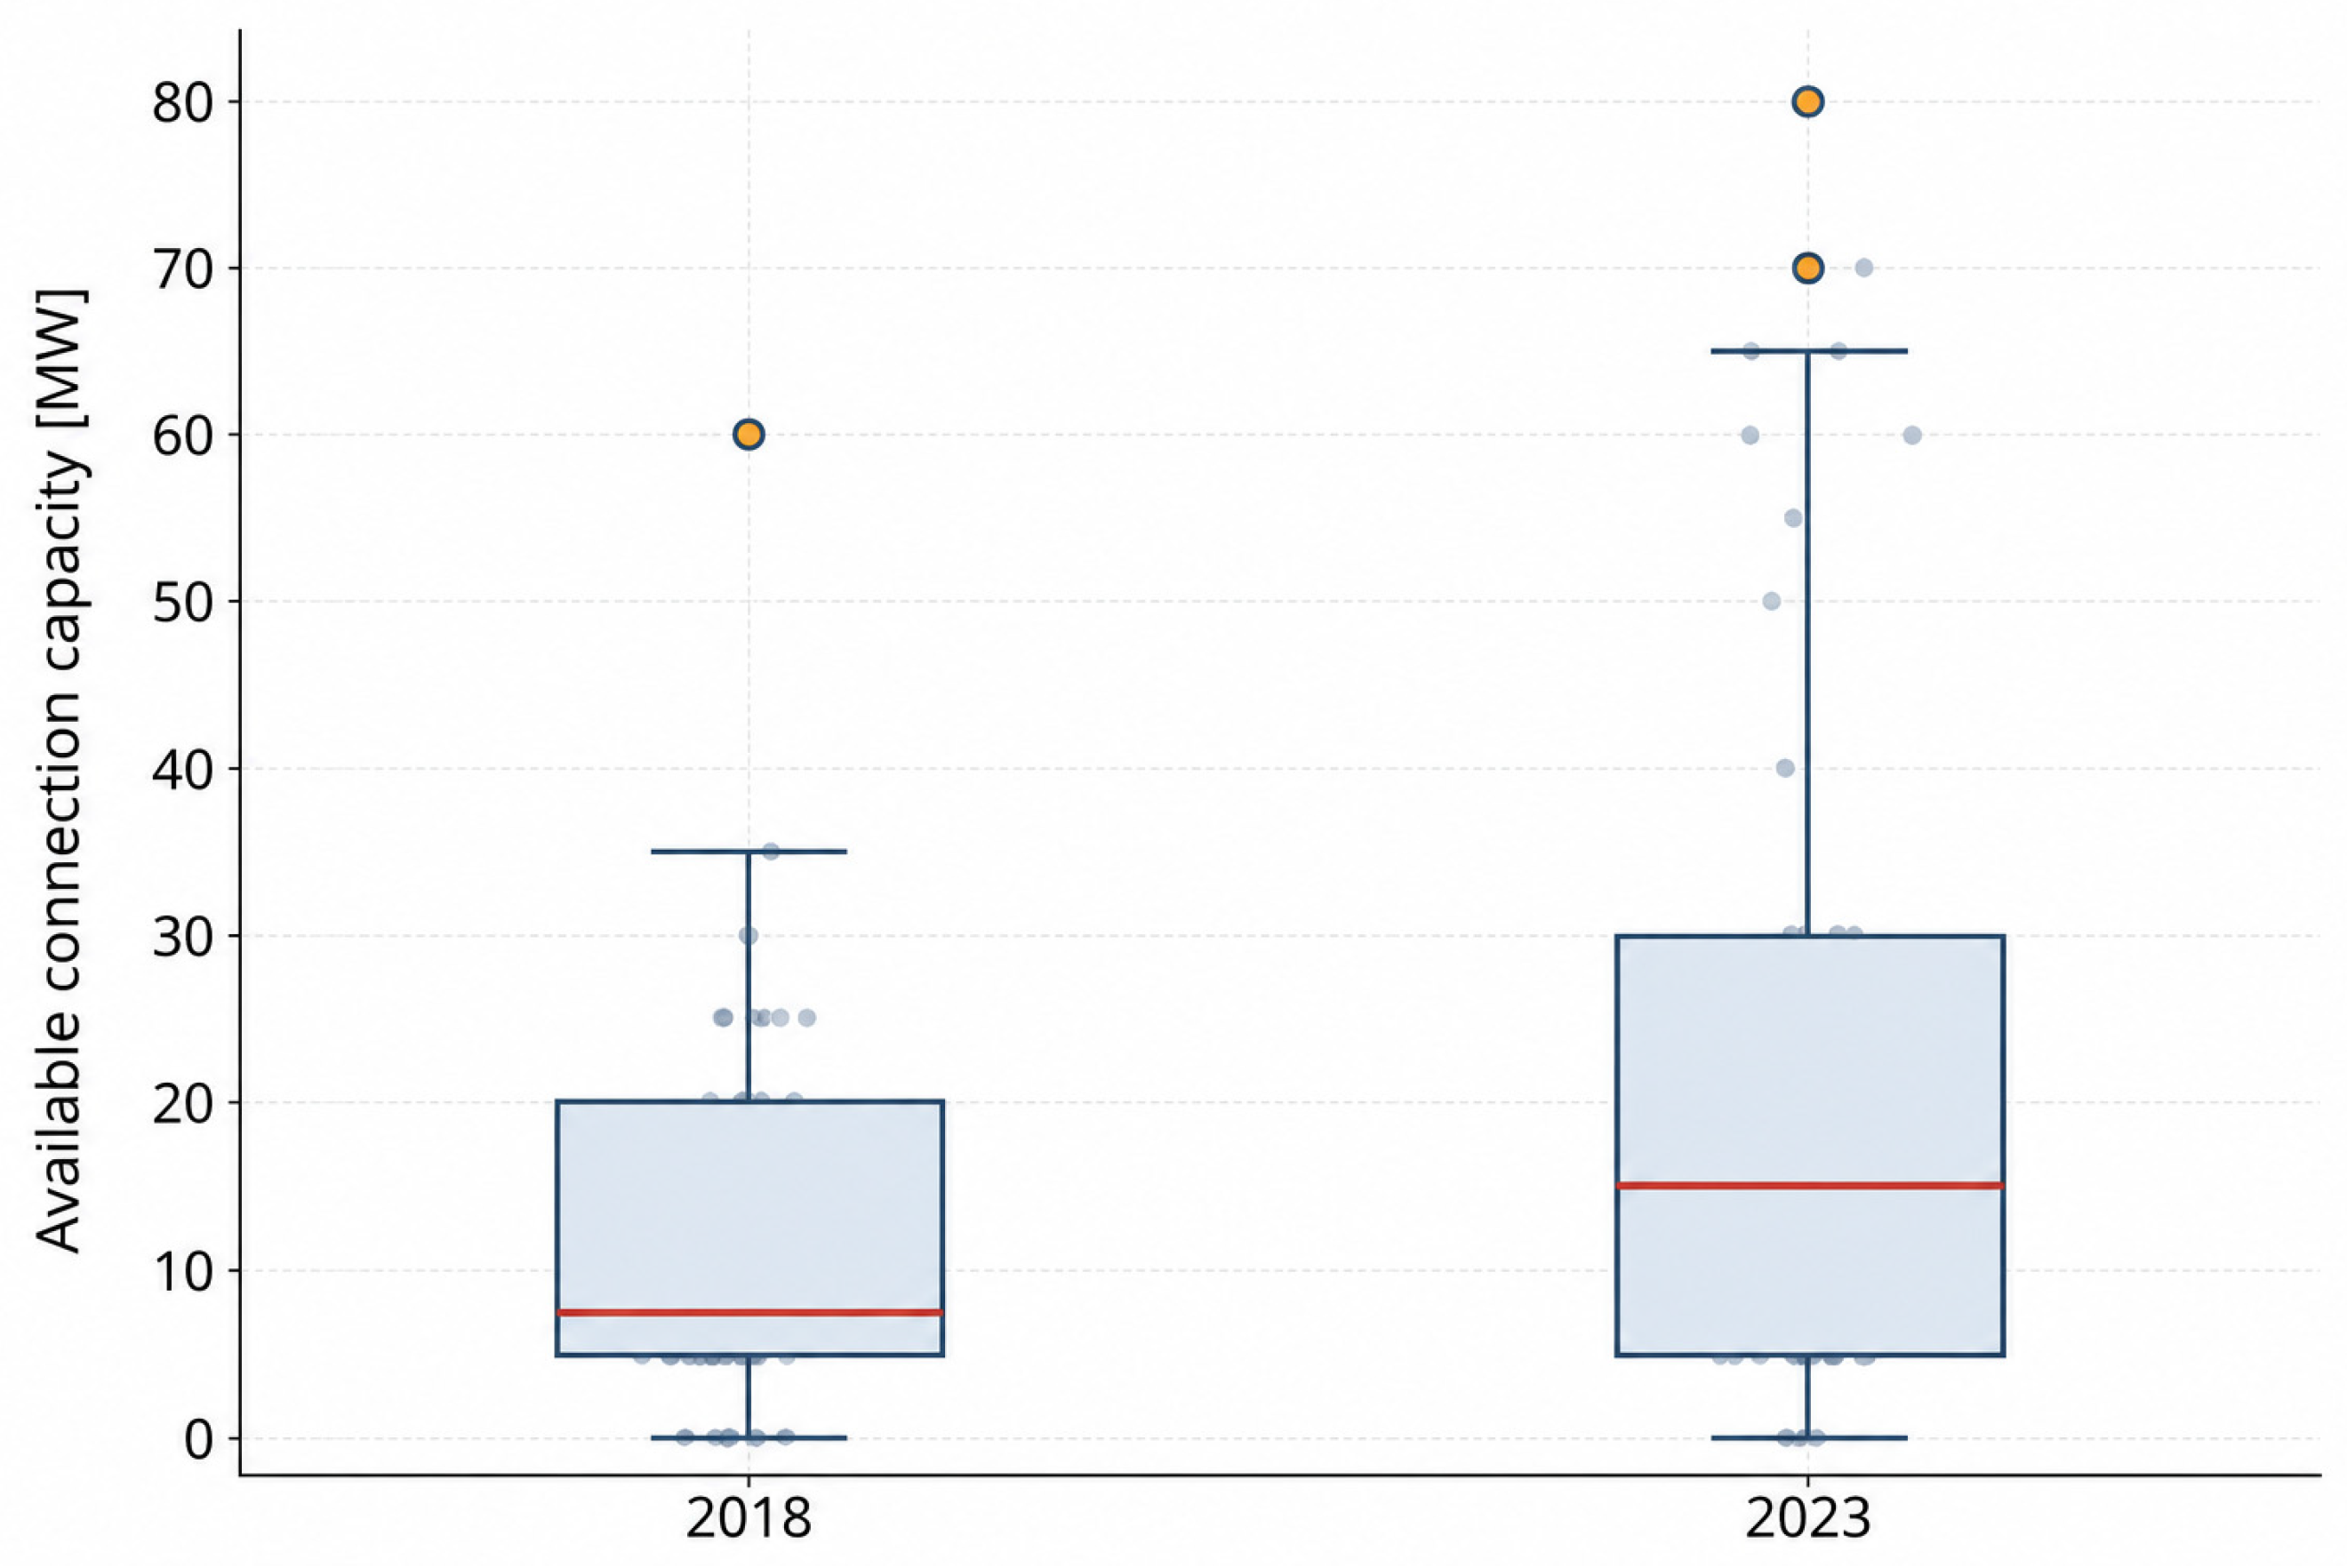
The median planned capacity doubles across the plan (7.5 to 15.0 MW), but the spread of the distribution widens faster still: the standard deviation rises from 11.3 to 23.5 MW under the plan and the coefficient of variation increases slightly (0.97 to 0.98), indicating that dispersion is projected to widen essentially in proportion to the mean. More directly, the Gini coefficient rises from 0.478 in the 2018 base year to 0.509 at the 2023 planning horizon (Table 3, Figure 5)—an increase in the point estimate over just five planned years, and one indicating that a doubling of aggregate capacity did not narrow the gap between well-served and poorly served node groups. Two qualifications, developed in Section 5.9, apply to this result and should be read alongside it. First, with 52 units the increase in the Gini coefficient—although reproduced by two further inequality measures—is better described as a consistent tendency than as a statistically established widening; what the panel establishes with precision is the persistence of a high level of inequality. Second, the mechanism is not preferential allocation to the already well-endowed—five-year increments are, in rank terms, uncorrelated with the 2018 base level—but a bifurcation between a minority of node groups selected for substantial reinforcement and a plurality receiving none.
In Figure 5, the dashed diagonal represents the line of perfect equality, while the blue and red curves represent the distributions in 2018 and 2023, respectively. The shaded area highlights the deviation of the observed distributions from perfect equality.
Figure 6 visualises the widening spread using a boxplot of the raw distribution; Figure 6 presents the corresponding Lorenz curves, in which the 2023 curve lies visibly further from the line of perfect equality than the 2018 curve across almost the entire range. This supports the first clause of hypothesis H1—that available capacity is unequally distributed, with a Gini coefficient far above zero—and supports the second clause, that the inequality did not decrease over the reporting horizon, with the qualification that at this sample size the upward movement is a consistent tendency rather than a statistically established increase (Section 5.9).
One interpretative caution belongs here rather than in the discussion because it conditions how every figure in this section should be read. A Gini coefficient measures concentration; it does not measure unfairness. Node groups differ in network size, substation count, local demand, existing generation, connection-application volume, renewable resource and technical topology, and an allocation that is unequal across such heterogeneous units may be efficient, technically necessary, or both. Nothing in the present data allows us to distinguish a concentration that reflects binding physical constraints from one that reflects planning priorities, because the covariates that would separate them are not published at the node-group level (Section 6.4). We therefore report concentration as a measured property of the distribution and reserve normative language: where this paper speaks of regional equity, it does so to identify a question that the measured concentration raises for spatial planning, not to assert that the operator’s allocation is unjust.

5.5. Typology of Planned Node-Group Capacity Trajectories, 2018–2023

Applying the EGCI-based classification defined in Section 4.3 to all 52 node groups yields the distribution shown in Table 4 and Figure 7: 20 groups (38%) were classified as stagnant, carrying no planned change in available capacity across the five-year horizon; 5 (10%) as declining, meaning that the plan reduces their available capacity outright—Kościerzyna (20 to 15 MW), Starogard (10 to 5 MW), Wąbrzeźno (25 to 15 MW), Toruń (30 to 20 MW), and Pątnów (20 to 15 MW); a single group (Grudziądz, 20 to 25 MW) as low growth; 16 (31%) as moderate growth; and 10 (19%) as high growth. Taken together, the declining and stagnant classes cover 25 of the 52 node groups, or 48% of the panel: for almost half of the operator’s 110 kV network the five-year plan schedules no additional connection capacity, and for five node groups it schedules less than exists today. The separation of declining from low-growth groups matters for that reading since the two carry opposite planning signals. The near-40% stagnation share is itself a notable finding: it indicates that a large share of ENERGA-OPERATOR’s 110 kV network was, at the time of reporting, not scheduled for any capacity-relevant reinforcement at all over the operator’s own five-year planning window, independent of local demand for connections.

5.6. The Warmia–Mazury Case: The Olsztyn Branch in Regional Context

The nine node groups constituting ENERGA-OPERATOR’s Olsztyn branch—corresponding closely to the Warmia–Mazury voivodeship—rise, under the operator’s plan, from a combined 75 MW in the 2018 base year to 365 MW in 2023 (Table 5), raising the branch’s share of the operator-wide total from 12.4% to 29.3%—a little more than double in relative terms and a 4.9-fold increase in absolute terms, two changes we now distinguish carefully. By the end of the plan the branch holds the largest planned capacity of the operator’s six branches, having held the third-smallest in 2018; the sense in which Warmia–Mazury remains disadvantaged is therefore internal to the branch and is developed below, not a matter of its aggregate total. Two points of geographic precision should also be recorded: the Olsztyn branch corresponds to the Warmia–Mazury voivodeship only approximately—the Kwidzyn node group, for instance, lies in Pomorskie—and coherent node groups are defined by electrical rather than administrative criteria, so no branch maps exactly onto a voivodeship. Applying the typology of Section 5.5 to this subset reveals a striking bimodal pattern, directly supporting hypothesis H2: seven of the nine groups (Elbląg, Orneta, Morąg, Ostróda, Iława, Susz, and Kwidzyn) are classified as high growth—a far higher concentration than the operator-wide rate of 19%—while the remaining two (the regional capital Olsztyn itself and Nidzica) are classified as stagnant, with zero change over the entire horizon. In other words, the Warmia–Mazury case does not show uniformly slow or uniformly fast growth, but a sharp bifurcation between a small number of node groups selected for substantial reinforcement and others, including the regional capital’s own node group, left entirely unchanged.
For qualitative comparison, the TAURON Dystrybucja and PGE Dystrybucja reports examined show similarly heterogeneous, and in places static, patterns elsewhere in the country (Table 6). In TAURON’s Jelenia Góra branch (south-western Poland), the “Mikułowa” node group remained fixed at 10 MW throughout 2018–2023, while the neighbouring “Cieplice” group (eight substations, including the city of Jelenia Góra) offered only 5 MW. In PGE Dystrybucja’s territory, the “Otwock” and “Babice” node groups in the Warsaw metropolitan periphery remained fixed at 100 MW and 115 MW, respectively—a comparatively high absolute figure, but static—whereas the “Karczew” group, also in the Warsaw periphery, is planned to grow from 75 to 105 MW.

5.7. Regional and Institutional Geography of Grid-Connected Generation Capacity

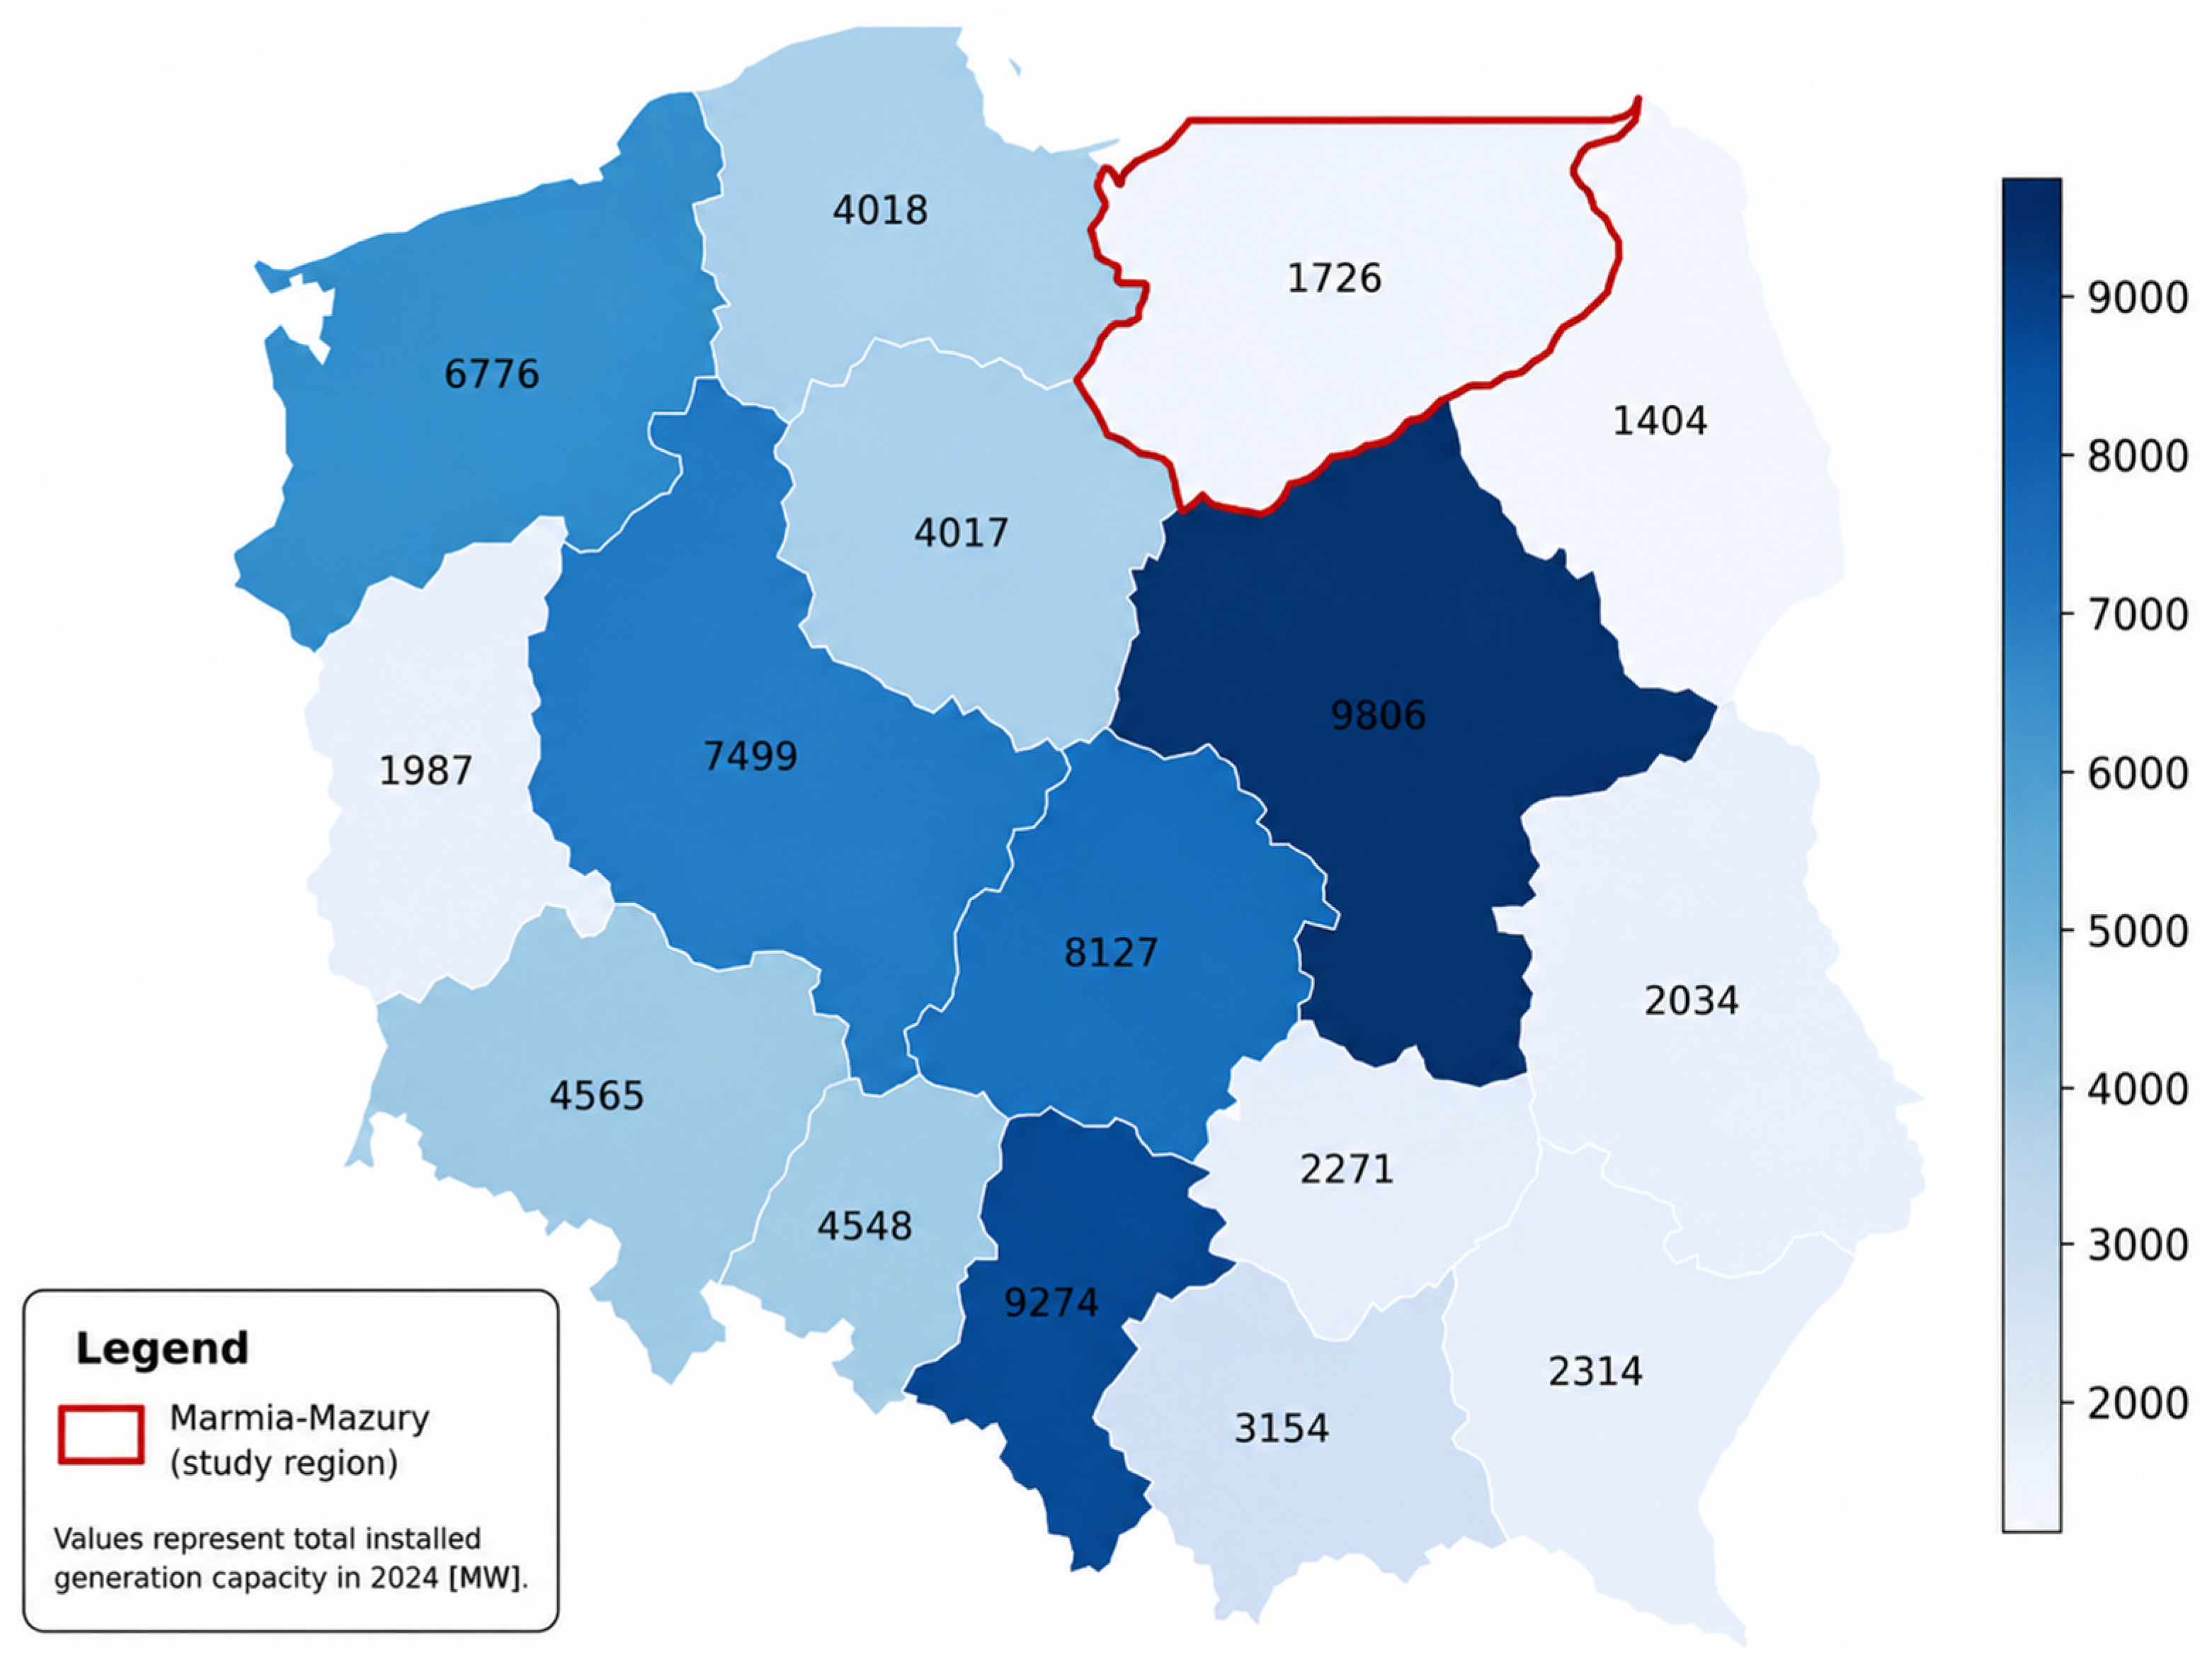
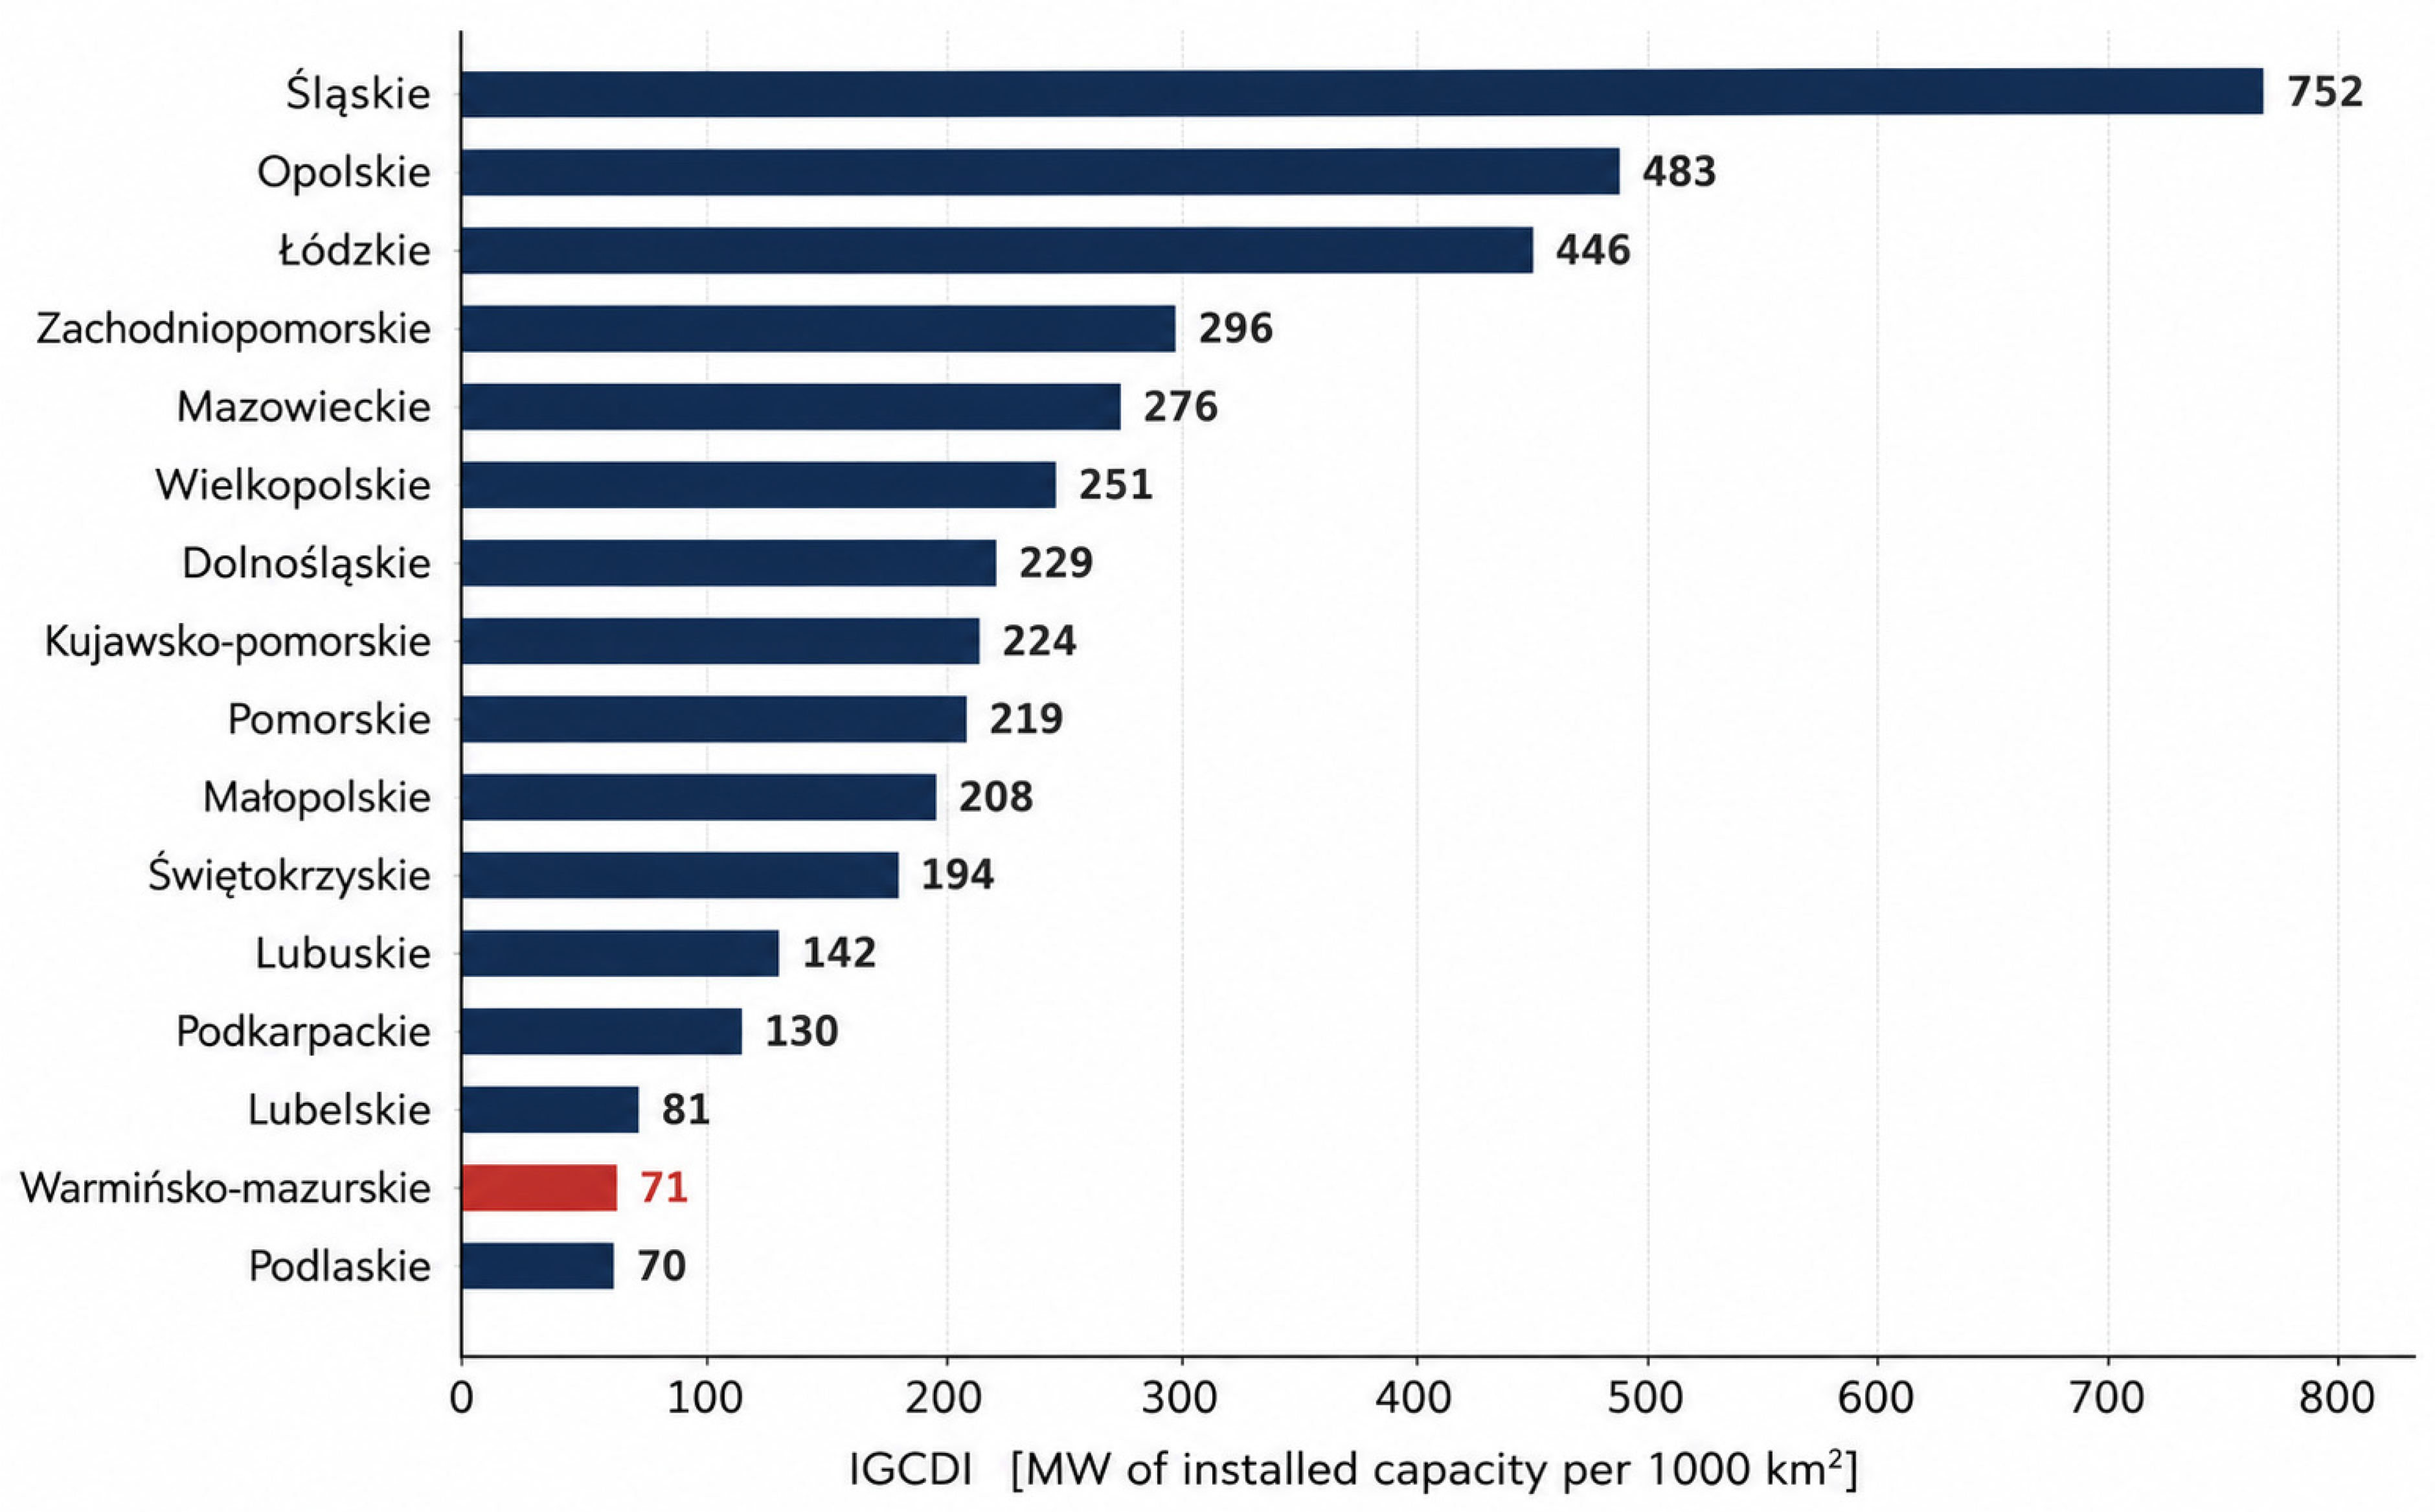
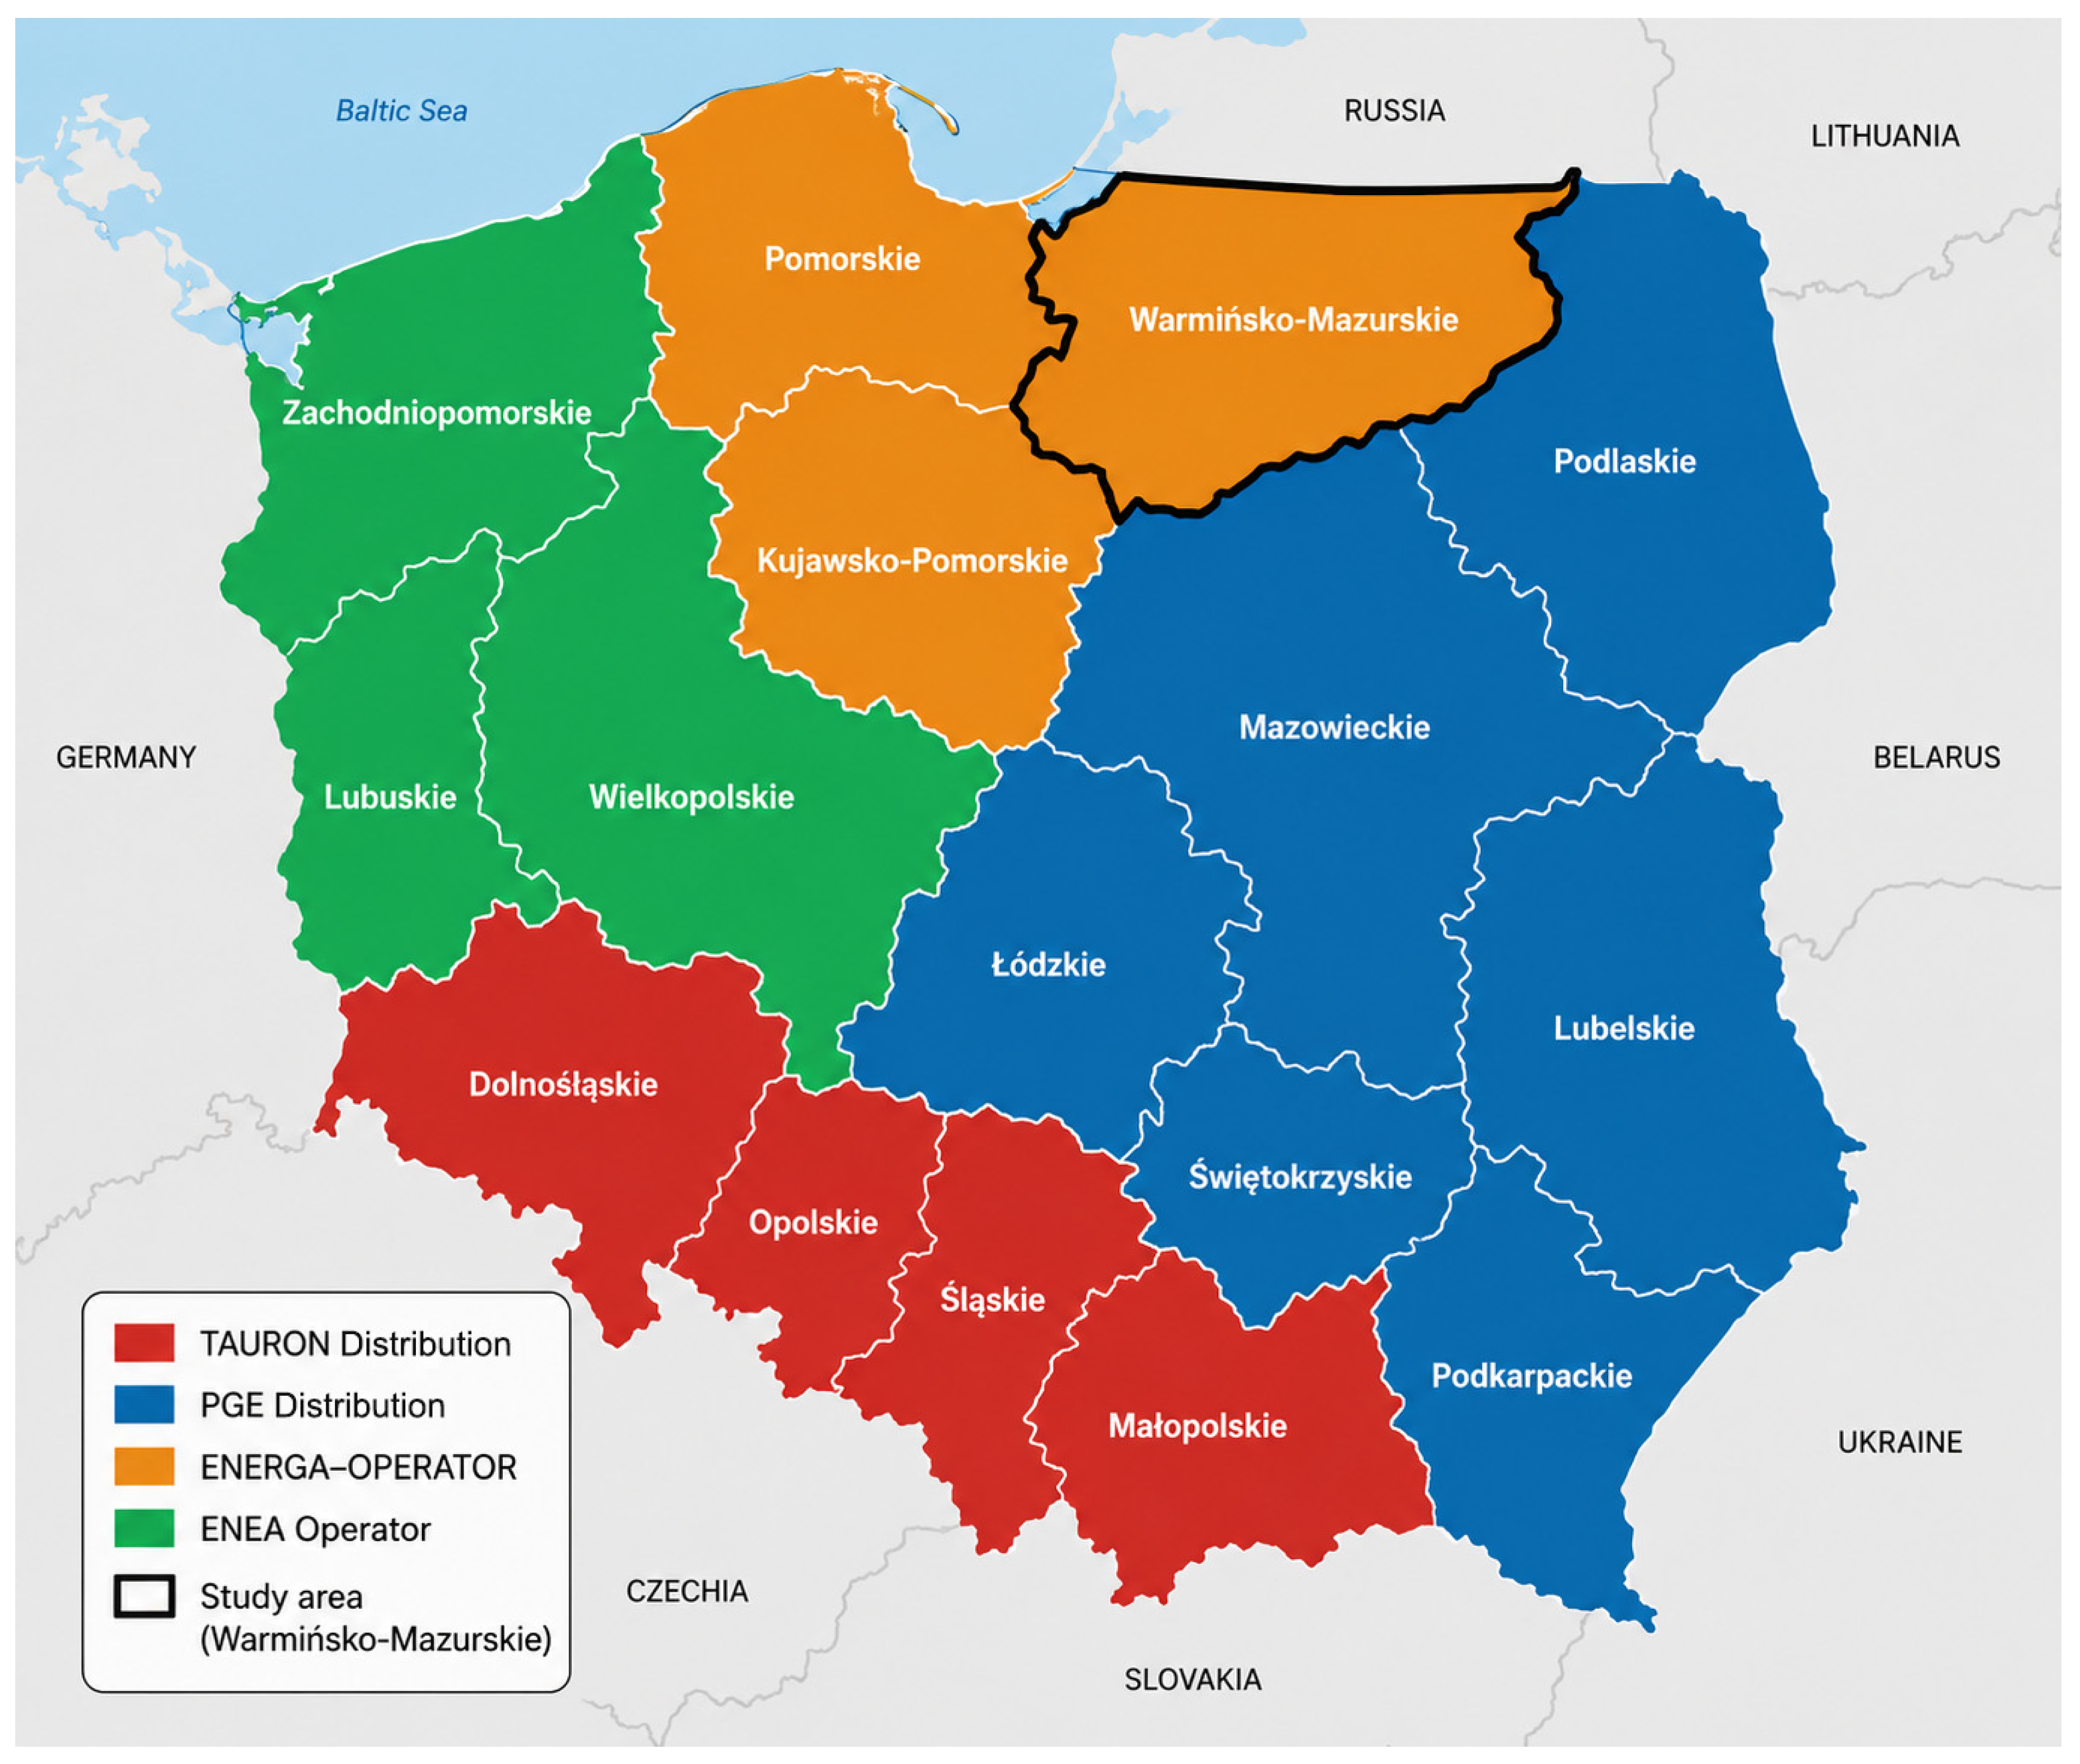
Figure 8 maps Statistics Poland’s voivodeship-level data on total installed electricity generation capacity (all technologies, 2024) using verified administrative boundaries. Mazowieckie (9806 MW), Śląskie (9275 MW), and Łódzkie (8127 MW)—voivodeships combining large metropolitan demand centres, historical heavy industry, and/or major conventional power stations—report by far the highest installed capacity. Warmia–Mazury reports only 1726 MW, the second-lowest of Poland’s 16 voivodeships (ahead only of Podlaskie, 1404 MW), despite being one of Poland’s largest voivodeships by land area. Figure 9 expresses the same underlying capacity data as the Installed Generation-Capacity Density Index (IGCDI, Section 4.3)—installed capacity per unit of land area—which sharpens rather than dissolves this pattern: because Warmia–Mazury is large in area as well as low in absolute capacity, its density value of 71 MW per 1000 km2 is the second-lowest of the sixteen voivodeships, ahead only of Podlaskie at 70 (Table 7), confirming that the low-capacity finding is not merely an artefact of the voivodeship’s size, subject to the qualifications set out in Section 4.3 concerning what an area-normalised index of installed capacity can and cannot establish, and to the structural cross-check reported in Section 5.9. We stress that this national-scale evidence measures a different quantity from the operator panel—installed generation capacity rather than available connection capacity—and therefore corroborates the peripherality pattern by analogy rather than replicating the node-group result directly. Figure 10 shows the simplified primary-DSO territorial map: Warmia–Mazury falls within ENERGA-OPERATOR’s territory, alongside Pomorskie and Kujawsko-Pomorskie, a grouping that is institutionally coherent (one operator, one reporting cycle) but does not correspond to any single spatial-planning or regional-development jurisdiction, a point developed further in Section 6.1. We emphasise once more that Figure 8 and Figure 9 are contextual: they establish that Warmia–Mazury is a low-generation, low-density region, which is consistent with the operator-level finding but does not test it, because neither figure measures available connection capacity.

5.8. Regulatory Response: The 2026 Grid Act and the PSE Transmission Development Plan

The PSE transmission grid development plan for 2025–2034 envisages 4700 km of new 400 kV transmission lines and 28 new plus 110 modernised substations, at a total investment exceeding 64 billion PLN—building on the operator’s earlier development plan [63]—explicitly designed to bring the KSE to a state capable of accommodating 110 GW of RES capacity, 24 GW of energy storage and 5.3 GW of nuclear generation [64,65]. Whether this investment and the capacity-unlocking mechanisms of the 2026 Grid Act (Section 3) will be spatially allocated in a way that closes the gaps documented in Section 5.4, Section 5.5, Section 5.6 and Section 5.7—or whether it will continue to concentrate in already better-connected metropolitan and industrial regions—is, at the time of writing, not resolved in publicly available planning documents, and is addressed directly in Section 6.2.

5.9. Robustness Checks and Sensitivity Analysis

The distributional result in Section 5.4 rests on a single inequality statistic computed over a modest number of units, and the typology in Section 5.5 depends on a parameter we chose. This section subjects both to explicit checks.
First, the direction of travel does not depend on the choice of inequality index or on the choice of endpoints. Two alternative measures move the same way over the same window: the Theil T index rises from 0.416 to 0.441, and the share of total available capacity held by the ten best-endowed node groups (CR10) rises from 48.8% to 53.4%. Computed for every intermediate year of the panel rather than only for the endpoints, the Gini coefficient traces 0.478, 0.494, 0.506, 0.501, 0.508 and 0.509 (Table 8): it rises over the first three years of the plan and is essentially flat thereafter, so the endpoint comparison does not conceal a non-monotonic path.
Second, we quantify the sampling uncertainty attached to the change itself, which the descriptive statistics of Section 5.4 do not convey. A non-parametric bootstrap resampling the 52 node groups with replacement (20,000 replications) yields 95% percentile intervals of [0.391, 0.551] for the 2018 Gini coefficient and [0.436, 0.562] for the 2023 value, and of [−0.043, +0.102] for their difference. The observed increase of +0.031, therefore, sits inside the interval that sampling variation alone could produce (bootstrap p ≈ 0.19 against the one-sided null of no increase). The appropriate reading is that the panel measures the level of inequality precisely and its five-year direction only indicatively. What it establishes firmly is that the level is high—a Gini coefficient of roughly 0.5, comparable to income inequality in a highly unequal economy—and that five years of planned network expansion did not reduce it on any of the three measures used. The upward movement common to all three is a consistent tendency, and we describe it as such throughout rather than as a statistically established widening. The growth in the aggregate, by contrast, is unambiguous: a Wilcoxon signed-rank test on the 52 paired node-group values rejects the null of no increase at p < 0.001, with 32 groups changing and 27 of those gaining capacity.
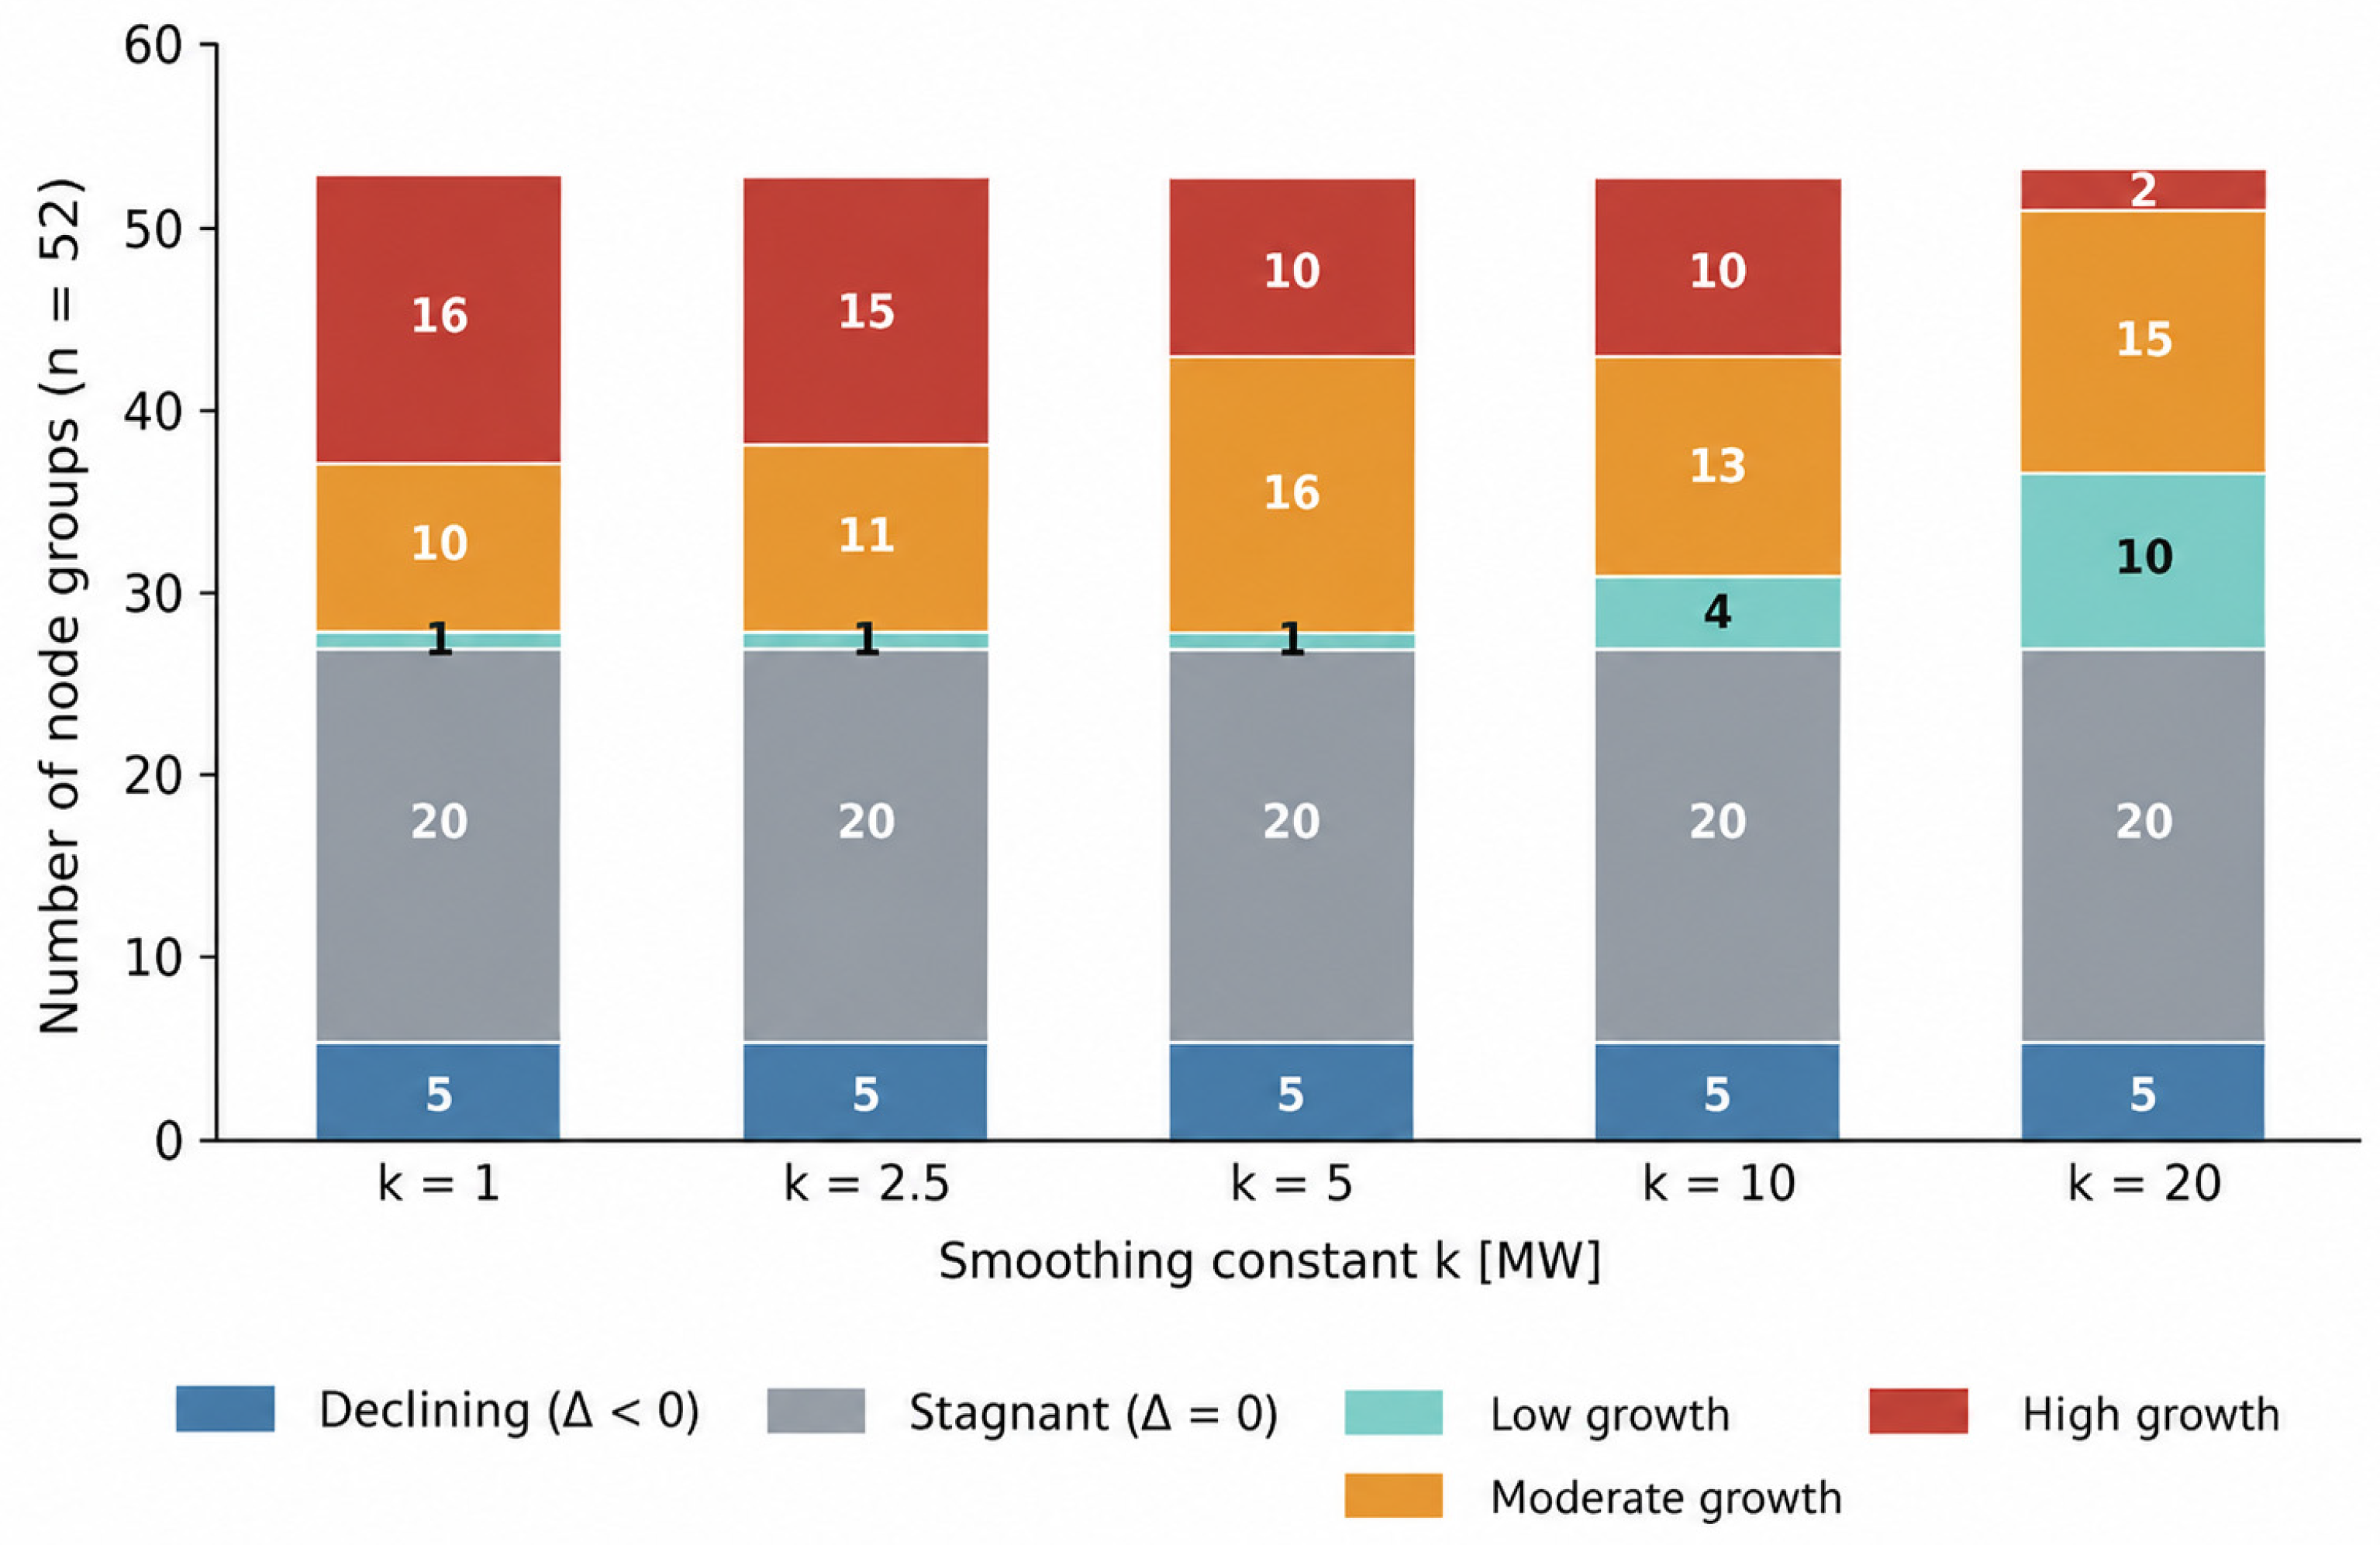
Third, we test whether the typology depends on the smoothing constant k. Table 9 and Figure 11 report the classification obtained for k ∈ {1, 2.5, 5, 10, 20} MW. The 20 stagnant groups are unaffected by construction since they are defined on the absolute change. Across k = 1 to k = 10 MW—a tenfold range spanning the reporting increment—between 88% and 94% of node groups retain their k = 5 classification, and the rank ordering of the index itself is very nearly invariant (Spearman ρ ≥ 0.96 against the k = 5 values throughout). The Warmia–Mazury result is unchanged over this entire range: seven of the branch’s nine node groups are classified as high growth for every k ≤ 10 MW. Only at k = 20 MW—four times the reporting increment and close to the 2023 third quartile—does the index lose discriminatory power, collapsing the high-growth class from ten groups to two. We therefore regard the typology as robust to the choice of k within any defensible range, and we do not regard Section 5.6 finding as an artefact of that choice.
The classification thresholds themselves were also chosen rather than estimated, and we test them in the same way. Holding k at 5 MW and shifting the pair of cut-points from (0.5, 1.5) to (0.25, 1.0), (0.75, 2.0) and (1.0, 2.5) leaves the declining and stagnant classes untouched by construction and moves node groups only between the three growth classes: the high-growth class ranges from 21 groups at the loosest cut-points to 7 at the tightest, while the Warmia–Mazury result varies between seven and six of nine. The substantive claims of Section 5.5 and Section 5.6—that almost half the network carries no planned increase and that the Olsztyn branch combines a concentration of the fastest-growing node groups with two that are left unchanged—therefore do not depend on the particular cut-points used. The thresholds affect how finely growth is graded, not whether the bifurcation exists.
Fourth, we test the mechanism generating the observed concentration. A natural reading of Section 5.4 would be that planned reinforcement is allocated preferentially to node groups that already hold the most capacity—a cumulative-advantage account. The panel gives that reading little support. The Spearman rank correlation between 2018 available capacity and the absolute five-year increment is 0.08 (p = 0.59), and between 2018 capacity and the EGCI it is −0.07 (p = 0.62); in rank terms, increments are essentially unrelated to the starting level. Inequality stays high not because the best-endowed groups are planned to grow fastest, but because reinforcement is concentrated under the plan in a minority of node groups irrespective of their starting position, while 25 groups—20 stagnant and five declining, 48% of the panel—received nothing or lost capacity. This is a bifurcation mechanism rather than a cumulative-advantage one, and the two carry different policy implications (Section 6.2 and Section 6.4).
Fifth, we check whether the branch-level conclusions depend on normalising by geographic area, which is the basis of the IGCDI and, as Section 4.3 notes, is not a structural property of the network. Within the ENERGA panel, one structural normaliser is available: available capacity per coherent 110 kV node group, the node group being the unit over which the operator itself computes capacity, defined by electrical rather than administrative criteria. On this measure the Olsztyn branch moves from 8.3 MW per node group in 2018—the third-lowest of the operator’s six branches—to 40.6 MW in 2023, the highest of the six, against operator-wide means of 11.6 and 23.9 MW, respectively; the Płock branch is the only one to decline, from 7.2 to 6.7 MW per node group. This does not contradict the absolute and density findings of Section 5.6 and Section 5.7, but it qualifies them in a way we regard as important: Warmia–Mazury’s disadvantage is not that its node groups are uniformly small, but that a majority of them received no reinforcement at all while a minority received large increments (Table 5). We report both normalisations deliberately because they answer different questions—capacity per unit of territory, which is a regional-development question, and capacity per unit of network, which is closer to an engineering one—and because the two give different answers are themselves a result.

5.10. Ex Ante Sensitivity of the Distribution to the 2026 Grid Act

Section 4.1 explains why the disaggregated panel ends at the 2023 planning horizon: node-group reporting has since migrated to interactive formats that do not expose a comparable time series. That leaves an evident question, which the 2026 Grid Act (Section 3) makes pressing—could the regulatory shift now under way already have reversed the distributional pattern documented above? A direct empirical answer is not available, and not only because of data access. The Act entered into force on 30 April 2026, and its principal mechanisms—twelve-month validity for newly issued connection conditions, security deposits of 30–60 PLN/kW and binding development milestones of 24 to 36 months—operate on conditions whose validity periods have not yet elapsed. No post-Act reporting cycle had completed at the time of writing, so no observation of a post-Act distribution exists against which the 2018–2023 panel could be compared.
What can be established is what the Act would have to do in order to change the picture. Its stated purpose is to release capacity currently locked in valid but unrealised connection conditions—up to 150 GW nationally on the Ministry of Climate and Environment’s estimate. Because it is nowhere published where those conditions sit at node-group level, we bracket the outcome rather than forecast it, applying four allocation rules to the 2023 ENERGA distribution and recomputing the Gini coefficient for release volumes equal to 25%, 50% and 100% of the operator’s 2023 total available capacity (Table 10). The rules are: pro-rata release, in proportion to each node group’s existing capacity; uniform release, equal in MW to every group; concentrated release, confined to the ten best-endowed groups; and shortfall-weighted release, proportional to each group’s distance from the operator maximum.
One result is unambiguous. Pro-rata release leaves the Gini coefficient at 0.509 for any release volume because the coefficient is invariant to proportional scaling. This is not a technicality. Releasing “dead” capacity returns it to the nodes at which the corresponding conditions were originally issued, so the first-order effect of the mechanism is approximately pro-rata, and distributional neutrality is its default outcome rather than a worst case. Uniform release would reduce the coefficient substantially—to 0.407 at a release of 25% of the 2023 total and to 0.255 at 100%—and shortfall-weighted release would reduce it further, to 0.146 at the largest volume modelled; concentrated release would raise it to 0.659. Since the Act contains no spatial-equity or peripherality criterion, and since none appears in the PSE transmission grid development plan either (Section 5.8), the pattern documented in Section 5.4, Section 5.5 and Section 5.6 would not, on this analysis, be expected to reverse under the new regime unless released capacity happens to fall disproportionately in currently underserved node groups—an outcome the legislation neither requires, incentivises nor measures. We present this as a bounding exercise, not a prediction, and Section 6.5 records replication on post-2026 reporting as the first priority for subsequent work.

6. Discussion

6.1. Spatial and Socio-Economic Interpretation

The quantitative results reported in Section 5 support a central argument: that grid-connection capacity in Poland is not merely limited in aggregate but is unequally distributed across space in a way that is measurable, persistent, and, on the evidence of the 2018–2023 ENERGA-OPERATOR panel, widening rather than narrowing. This reframes a set of questions so far treated largely as engineering or firm-level investment problems as questions of regional equity, squarely within the tradition established by the energy-poverty and the energy-vulnerability literature on post-socialist Central and Eastern Europe [27,28,29,30,31,32,33,34]. If, as the literature has shown, access to affordable and reliable energy consumption is geographically and socially uneven in Poland, our findings suggest that access to the opportunity to produce and sell renewable energy is uneven in an analogous, and independently measurable, way (H1).
The Warmia–Mazury case (Section 5.6) gives this argument a concrete spatial referent and supports H2. Its interest lies less in the branch’s gain in relative share than in the bifurcation underlying it, which shows that a region can be simultaneously among the fastest-growing and among the least-capacitated. This finding directly complements the local land-use-conflict evidence reported for the neighbouring Pomeranian region by Szuta et al. [49], the economic-efficiency analysis of northeastern Polish PV investment by Brodziński et al. [48], and the wider body of UWM-affiliated spatial-analysis work on land-use and urbanisation dynamics in the Olsztyn area [66,67,68,69]: land-use suitability and economic viability, however favourable, cannot translate into realised RES capacity if the grid connection is administratively unavailable, and these locally rooted conflicts also echo the broader international literature on social acceptance and siting opposition for renewable-energy infrastructure [70,71,72], aligning with Rochmińska’s [73] documentation of analogous socio-spatial conflicts around wind-energy infrastructure elsewhere in Poland.
This has a second, institutional–geographical dimension. DSO service-area boundaries, which determine which coherent-node-group methodology and reporting cycle governs a given location, do not correspond to voivodeship, powiat or gmina boundaries (Figure 10), and were not designed with regional development planning in mind. A single voivodeship’s spatial development plan, and the regional authority responsible for it, can only very indirectly influence the pace and location of grid reinforcement within its own territory, since that reinforcement is planned and financed at the level of an operator whose territory extends across, and is governed independently of, the voivodeship’s own administrative geography (H3: the national voivodeship-level map, Figure 8, reproduces the same low-capacity, peripheral pattern found within a single operator’s internal geography, Section 5.6).
Setting these results against the international literature clarifies what is and is not new here. The technical hosting-capacity studies reviewed in Section 2.2 [18,19,20,21,22,55] treat capacity as a quantity to be maximised at a given node or feeder, whether through voltage control, export constraints, temporal coordination or market-based optimisation; the distributional question—how the resulting capacity is spread across the units of a territory and whether that spread is stable over a planning horizon—is generally not posed because the unit of analysis is the network rather than the region. Chatzistylianos et al. [20] and Mousavi et al. [22], for example, evaluate enhancement measures at the export-constraint and market levels, respectively, without reporting any cross-node distribution of the capacity they unlock. In the opposite direction, the regional-development literature has applied Lorenz and Gini machinery to transport, broadband and water infrastructure, but very rarely to electricity hosting capacity, and to our knowledge, never to a complete operator panel of coherent node groups. The present paper sits at that intersection, and its principal comparative finding is a negative one: five years of the kind of network expansion the technical literature would count as successful—a 106% increase in aggregate available capacity—left the cross-sectional distribution as unequal as it began. That is a result about the spatial incidence of hosting-capacity enhancement, which the enhancement literature, by construction, does not report.

6.2. Implications for Grid Planning and Res Integration

For an Energies readership concerned primarily with system operation and planning rather than regional geography as such, the results in Section 5 suggest four implications. All four are, in the first instance, statements about ENERGA-OPERATOR’s territory: the industrialised, high-load areas served by TAURON and PGE operate under materially different load and network conditions, and nothing in the present evidence base licences transferring the specific findings to them. We present the implications as hypotheses about where planning attention might be directed rather than as demonstrated policy prescriptions: the analysis evaluates no counterfactual allocation of investment, simulates no alternative reinforcement strategy, and therefore cannot establish that acting on these suggestions would improve outcomes. First, the typology developed in Section 5.5 offers a low-cost screening heuristic for 110 kV reinforcement prioritisation: the 20 “stagnant” node groups identified within this single operator’s territory (38% of the total) are, by construction, locations where no capacity-relevant investment is currently scheduled, and cross-referencing this list against local RES-application volumes (already collected by DSOs under Art. 7(8l) but not, to our knowledge, routinely published in combined form) would allow planners to distinguish genuinely saturated nodes from merely deprioritised ones. Second, the IGCDI (Section 4.3, Figure 9) offers a simple, reproducible, land-area-normalised criterion for allocating new transmission investment (e.g., under the PSE PRSP 2025–2034, Section 5.8) that would not systematically favour already-dense, already-well-served regions, as raw installed-capacity rankings mechanically do. Third, the cable-pooling and storage-co-location provisions introduced by the 2023 RES Act amendment and expanded by the 2026 Grid Act (Section 3) are, on the evidence of Section 5.6, particularly well suited to “high-growth” node groups such as Susz or Elbląg, where new capacity is already being added and co-locating storage could further reduce curtailment (Section 5.2) at comparatively low incremental grid cost; by contrast, “stagnant” groups such as Olsztyn or Nidzica may require direct network reinforcement rather than pooling-based solutions, since there is no growing capacity margin to share. Fourth, rising curtailment (Section 5.2) is partly a symptom of capacity being added faster than the transmission-level balancing capability that PSE’s Article 7(8e) check is designed to safeguard. On that reading, reinforcement targeted at node groups combining high local RES demand with a stagnant or declining classification could allocate the PRSP’s planned 64 billion PLN investment more curtailment-efficiently than reinforcing already-fast-growing groups further. Whether it would in fact do so is an open question that the present data cannot answer.

6.3. Energy Security Implications

The grid-connection constraints documented in this paper also bear on energy security in the broader sense developed by Cherp and Jewell [74]—low vulnerability of vital energy-system functions, for specified actors, values and threats—and operationalised by the IEA’s framework of availability, accessibility, affordability and acceptability [75]. Three dimensions are particularly salient. First, system-stability security: the rising volume of non-market curtailment and negative-price hours documented in Section 5.2 is itself an energy-security-relevant symptom, since it indicates that installed weather-dependent capacity is, at times, exceeding the system’s real-time balancing capability—precisely the failure mode that Article 7(8e)’s balancing-capacity check (Section 3) is designed to prevent at the connection stage, and that a spatially better-targeted reinforcement strategy (Section 6.2) could help mitigate at the investment stage. Second, geopolitical security: Poland’s post-2022 acceleration of RES deployment is explicitly framed, domestically and in EU policy such as the REPowerEU plan [76], as a means of reducing dependence on imported fossil fuels and, implicitly, on Russian energy supply chains [77,78,79]; from this perspective, grid-connection capacity is not a narrow technical bottleneck but the binding constraint on how quickly this strategic diversification can actually be realised in practice—a domestic infrastructural limit on a geopolitical objective. Third, resilience and cybersecurity: the shift from a small number of large, centrally monitored power stations toward tens of thousands of small, networked PV installations, which this paper’s own data illustrate (Section 5.1), multiplies the number of physical and digital assets that must be secured, a challenge documented in recent reviews of distributed-energy-resource cybersecurity [80] and PV-system-specific cyber-threats [81]; at the same time, this same decentralisation can improve resilience against the loss of any single large asset, so the net security effect of decentralisation depends on how well monitoring, standardisation and cybersecurity investment keep pace with the connection growth documented in Section 5.4, Section 5.5 and Section 5.6—an empirical question this paper’s node-group-level data could help target in future work, but does not itself resolve.

6.4. Potential Determinants of the Observed Pattern

The analysis presented here documents a spatial pattern; it does not identify what produced it, and a descriptive panel design cannot do so. Since the determinants are of obvious interest, we set out which mechanisms could plausibly generate the observed distribution, what the present data can say about them, and what would be needed to test them properly.
Four classes of determinants are relevant. The first is demand and load structure: available capacity under the network-factor scenario is a function of the headroom between existing load and the thermal and voltage limits of the local network, so node groups serving large industrial or urban loads can show higher available capacity for reasons that have nothing to do with planning priorities. The second is network legacy and topology: the age, redundancy and single-contingency (N-1) structure of a 110 kV area determine how much generation it can absorb before a contingency violation appears, and these properties are inherited from pre-1990 investment decisions rather than chosen by the present operator. The third is investment scheduling: reinforcement is planned and financed under the operator’s own approved development plan within a tariff-regulated capital envelope, so the timing of individual projects reflects internal prioritisation whose criteria the Article 7(8l) reports do not disclose. The fourth is connection demand: the number and size of connection applications at each node group determine where scarcity actually binds, and these data are collected by DSOs but are not published at the node-group level. Their absence is, in our assessment, the single most important data gap for causal work in this area.
Two further factors frequently invoked in the energy–geography literature warrant comment. Regional economic activity and population density are, we would expect, largely channelled through the first and third mechanisms above rather than acting independently on hosting capacity. Renewable-resource potential is a weaker candidate still: horizontal irradiation varies by well under 20% across Poland, which cannot account for node-group-level variation in the magnitude reported in Section 5.4, and this is precisely why the siting literature reviewed in Section 2.1 finds favourable resource conditions in regions such as Warmia–Mazury that nonetheless show low realised capacity.
The panel supports one internal test, reported in Section 5.9: five-year increments are uncorrelated in rank with the 2018 base level. That result is inconsistent with a simple cumulative-advantage account in which the best-served node groups attract most of the reinforcement and points instead toward project-level scheduling decisions—the third mechanism—as the proximate driver. Discriminating among the remaining explanations would require node-group-level data on load, application volumes and planned project pipelines, matched to the capacity panel and ideally across more than one operator. We set out that research design in Section 7 as the natural next step, rather than presenting speculative associations that the published data cannot support.

6.5. Limitations

Several limitations should be acknowledged. First, the detailed quantitative panel (Section 5.3, Section 5.4, Section 5.5 and Section 5.6) is drawn from a single distribution system operator (ENERGA-OPERATOR); while this was a deliberate methodological choice justified in Section 4.1—favouring a complete, internally consistent, reproducible panel over an incomplete, non-comparable multi-operator pool—it means the precise Gini and EGCI values reported are specific to ENERGA-OPERATOR’s territory and cannot be assumed to generalise numerically to TAURON, PGE, ENEA or Stoen without independent recomputation from their own node-group data, which were not available in the same disaggregated, complete panel format at the time of this study. Second, the panel itself dates to 2018 with a forecast horizon to 2023; the national-level data in Section 5.2 confirm that grid congestion has, if anything, intensified since 2023, but a direct replication of the node-group-level analysis using the operators’ current (2025/2026) data was not possible within this study because that data is no longer published in a comparable static tabular format (Section 4.1)—future research should prioritise obtaining such data directly from operators to test whether the inequality and typology patterns reported here have persisted, widened or narrowed under the new regulatory regime. Third, the categorical DSO-territory map (Figure 10) necessarily simplifies genuine historical overlaps between neighbouring operators’ service areas; a fully accurate historical-boundary reconstruction was beyond the scope of this study. Fourth, a substantial share of the current (2023–2026) national-level data (Section 5.2) originates from specialist industry journalism and regulator communications rather than peer-reviewed sources, reflecting how quickly this policy area is moving; all such figures have been individually attributed and should be understood as the best currently available evidence rather than a claim of definitive academic verification. Fifth, the panel contains 52 units, which is sufficient to characterise the level of inequality precisely but leaves limited power to establish a change in it of the magnitude observed; the bootstrap interval reported in Section 5.9 is correspondingly wide, and the claims in Section 5.4 and Section 7 are phrased to reflect that. Sixth, the national-level test of H3 relies on installed generation capacity by voivodeship, which is a proxy for, and not a measurement of, available connection capacity; a direct national test would require node-group panels from all five operators, which do not currently exist in comparable form. Seventh, the study is descriptive: it documents a distribution and its evolution but does not identify the mechanisms that produced it, a limitation we address directly in Section 6.4. Eighth, the IGCDI normalises installed capacity by administrative surface area, which is not a structural property of the network; the engineering-appropriate denominators—circuit-kilometres of 110 kV line, transformer ratings, and substation density—are not published by voivodeship, and constructing a structurally normalised regional index would require access to operator asset registers. The index should be read as a regional-development descriptor only, and the structural cross-check in Section 5.9 as the closest available substitute. Ninth, the analysis of the 2026 Grid Act in Section 5.10 is an ex ante bounding exercise on published parameters, not an evaluation: no post-Act node-group reporting cycle had completed at the time of writing, and the actual distributional effect of the Act remains an empirical question that only post-2026 data can settle.

7. Conclusions

This paper set out to test whether available grid-connection capacity for renewable energy sources in Poland is unequally distributed across space, whether that inequality has a systematic regional pattern, and what this implies for grid planning and energy security. The evidence supports the two confirmatory hypotheses, H1 and H2, and is consistent with the exploratory expectation set out in H3. On H1, the Gini coefficient for available connection capacity across ENERGA-OPERATOR’s 52 coherent node groups was 0.478 in 2018 and 0.509 at the 2023 planning horizon, and the same direction of travel is indicated by two alternative measures (Theil T, CR10); a bootstrap over the 52 node groups shows that this level of inequality is estimated robustly, while the five-year change in it falls within the range sampling variation could produce, so the finding is best stated as a consistent upward tendency against a persistently high level. A doubling of aggregate available capacity left the distribution about as unequal as it found it; 38% of node groups are scheduled for no change in capacity at all over the entire five-year horizon. On H2, the Warmia–Mazury case shows a distinctive bifurcated trajectory—seven of nine node groups classified as high growth against an operator-wide rate of 19%, alongside two groups (including the regional capital) left entirely unchanged—that raised the region’s share of the operator’s total capacity from 12.4% to 29.3% and, in doing so, moved it from the third-lowest to the highest planned capacity among the operator’s six branches. The region’s disadvantage at the end of the plan is therefore not one of aggregate branch capacity but of internal distribution—two of nine node groups, including the regional capital’s own, receive nothing—together with its position in the national ranking of installed generation capacity, which measures a different quantity. On H3, treated throughout as exploratory rather than confirmatory, a similar low-capacity, peripheral pattern is visible at the national, voivodeship level (Warmia–Mazury: second-lowest installed capacity and the second-lowest value of the newly constructed Installed Generation-Capacity Density Index among all 16 voivodeships), which is consistent with the single-operator finding being part of a broader national pattern rather than an idiosyncrasy of ENERGA-OPERATOR’s internal planning. Because the national data measure is installed rather than available capacity, this is corroboration by analogy: the operator-level magnitudes reported here should not be read as national estimates.
These findings carry direct implications for practice. National grid-investment programmes such as the PSE transmission grid development plan 2025–2034 and the capacity-unlocking provisions of the 2026 Grid Act do not, on the evidence reviewed here, yet incorporate an explicit spatial-equity or peripherality criterion; the typology and density index developed in this paper offer one candidate, low-cost and reproducible way to introduce such a criterion into reinforcement-prioritisation and cable-pooling/storage-siting decisions (Section 6.2), although this study evaluates no counterfactual allocation and therefore cannot show what such a criterion would achieve, while the energy-security discussion (Section 6.3) situates these technical and spatial choices within the wider system-stability and geopolitical stakes of Poland’s energy transition. Future research should, first and foremost, match the capacity panel to node-group-level data on load, connection-application volumes and planned project pipelines, so that the determinants discussed in Section 6.4 can be identified rather than enumerated; extend the panel-based inequality and typology methodology developed here to the other four Polish DSOs as soon as comparable disaggregated data become available; replicate the analysis with post-2026 data, which the bounding exercise in Section 5.10 identifies as the decisive test—a release of locked capacity in proportion to existing conditions would leave the distribution exactly as unequal as it is now—so only an allocation weighted toward underserved node groups could change the picture, and neither the Grid Act nor the PSE development plan contains a criterion that would produce one; and examine the distributional effects of the 2026 Grid Act’s milestone and cable-pooling provisions on different categories of RES investor, from household prosumers and farmer-led energy cooperatives [82] to large commercial developers, particularly in peripheral, agriculturally dominant regions such as Warmia–Mazury.

Supplementary Materials

The following supporting information can be downloaded at https://www.mdpi.com/article/10.3390/en19174039/s1. Supplementary Code File S1: Python code reproducing all numerical results reported in the paper and regenerating Figure 4, Figure 5, Figure 6, Figure 7, Figure 9 and Figure 11.

Author Contributions

Conceptualization, H.K. and K.K.; Methodology, H.K. and K.K.; Formal Analysis, H.K.; Investigation, H.K. and K.K.; Resources, H.K.; Data Curation, H.K.; Writing—Original Draft, H.K.; Writing—Review and Editing, H.K. and K.K.; Visualisation, H.K.; Supervision, K.K.; Project Administration, H.K. All authors have read and agreed to the published version of the manuscript.

Funding

This research received no external funding.

Data Availability Statement

The original contributions presented in this study are included in the article/Supplementary Materials. Further inquiries can be directed to the corresponding author.

Conflicts of Interest

The authors declare no conflicts of interest.

Appendix A

Available connection capacity [MW] for all 52 coherent 110 kV node groups, ENERGA-OPERATOR S.A., network-factor scenario, as reported in the source document (state as of 30 December 2018), Table A1 provided in full for reproducibility of all statistics reported in Section 5.
Table A1. Full ENERGA-OPERATOR Node-Group Dataset (2018–2023)
No.Node Group201820192020202120222023
1Dunowo555555
2Świdwin555555
3Szczecinek101515152525
4Koszalin555555
5Słupsk Wierzbięcino555555
6Słupsk Poznańska51010303030
7Człuchów055555
8Lębork101010101010
9Wicko000000
10Żarnowiec101010101010
11Gdynia354570808080
12Oliwa253555708080
13Gdańsk Błonia253560708080
14Kościerzyna202015151515
15Tczew51010101010
16Starogard10105555
17Elbląg51010606060
18Orneta104050505050
19Morąg52030303030
20Olsztyn151515151515
21Ostróda555404040
22Iława555303030
23Susz5515707070
24Kwidzyn202525606565
25Nidzica555555
26Grudziądz202525252525
27Brodnica555555
28Wąbrzeźno252525151515
29Toruń307070202020
30Włocławek104030252525
31Działdowo055555
32Mława000000
33Ciechanów555555
34Sierpc555555
35Płock202020202020
36Kutno 1000000
37Kutno 2555555
38Łęczyca555555
39Kłodawa555555
40Pątnów202020151515
41Ślesin151515303030
42Konin 1101010202030
43Konin 2101020202020
44Adamów151525252525
45Kalisz Północ252545506065
46Krotoszyn555101010
47Dobrzyca005555
48Jarocin005555
49Kalisz252525404055
50Ostrów101020252525
51Wieruszów252525252525
52Ostrzeszów606060606060

References

  1. Kurowska, K.; Kryszk, H.; Bielski, S. Location and Technical Requirements for Photovoltaic Power Stations in Poland. Energies 2022, 15, 2701. [Google Scholar] [CrossRef] [Scilit]
  2. Kowalak, R.; Kowalak, D.; Seklecki, K.; Litzbarski, L.S. Challenges in the Legal and Technical Integration of Photovoltaics in Multi-Family Buildings in the Polish Energy Grid. Energies 2026, 19, 474. [Google Scholar] [CrossRef] [Scilit]
  3. European Commission. Communication from the Commission to the European Parliament, the European Council, the Council, the European Economic and Social Committee and the Committee of the Regions: The European Green Deal; COM(2019) 640 Final; European Commission: Brussels, Belgium, 2019.
  4. European Parliament and Council. Regulation (EU) 2022/869 of 30 May 2022 on Guidelines for Trans-European Energy Infrastructure. Off. J. Eur. Union 2022, L152, 45–102. [Google Scholar]
  5. IEA. Poland 2022: Energy Policy Review; International Energy Agency: Paris, France, 2022.
  6. Ministry of Climate and Environment. Polityka Energetyczna Polski do 2040 r. (Energy Policy of Poland Until 2040, PEP2040); Council of Ministers Resolution, Monitor Polski 2021, Item 264; Ministry of Climate and Environment: Warsaw, Poland, 2021.
  7. rynekelektryczny.pl. Moc Zainstalowana Fotowoltaiki w Polsce [Installed PV Capacity in Poland]. Available online: https://www.rynekelektryczny.pl/moc-zainstalowana-fotowoltaiki-w-polsce/ (accessed on 5 July 2026).
  8. WysokieNapiecie.pl. Odmowy Przyłączeń Pobiły Rekord Przed Wejściem w Życie Sieciowej Rewolucji. 2026. Available online: https://wysokienapiecie.pl/118893-odmowy-przylaczen-pobily-rekord-przed-wejsciem-w-zycie-sieciowej-rewolucji/ (accessed on 5 July 2026).
  9. energia.rp.pl. Odmowy Przyłączeń OZE. Pod Warunkami URE Przypomina Zasady. Rzeczpospolita. 2025. Available online: https://energia.rp.pl/oze/art40059571-odmowy-przylaczen-oze-pod-warunkami-ure-przypomina-zasady (accessed on 5 July 2026).
  10. Gramwzielone.pl. Przyłączenia OZE: Liczba Odmów Spadla, Odrzucona Moc Wzrosła. 2026. Available online: https://www.gramwzielone.pl/trendy/20359525/przylaczenia-oze-liczba-odmow-spadla-odrzucona-moc-wzrosla (accessed on 5 July 2026).
  11. codozasady.pl. Nowa Ustawa Sieciowa Odblokuje Miejsca w Sieci dla Nowych Inwestycji OZE w Polsce. 2026. Available online: https://codozasady.pl/p/nowa-ustawa-sieciowa-odblokuje-miejsca-w-sieci-dla-nowych-inwestycji-oze-w-polsce (accessed on 5 July 2026).
  12. DNV. Grid Congestion in the Polish Power Grid; DNV: Arnhem, The Netherlands, 2024; Available online: https://www.dnv.com/article/grid-congestion-in-the-polish-power-grid/ (accessed on 5 July 2026).
  13. PSE, S.A. Redysponowanie Nierynkowe [Non-Market Redispatching]. Available online: https://www.pse.pl/redysponowanie-nierynkowe (accessed on 5 July 2026).
  14. Urząd Regulacji Energetyki (URE). Ceny Ujemne [Negative Prices]. Available online: https://www.ure.gov.pl/pl/oze/swiadectwa-pochodzenia/ceny-ujemne (accessed on 5 July 2026).
  15. Gramwzielone.pl. Ile Energii Zmarnowaliśmy? Redysponowanie OZE w Polsce w 2025. 2026. Available online: https://www.gramwzielone.pl/energia-sloneczna/20351434/ile-energii-zmarnowalismy-redysponowanie-oze-w-polsce-w-2025 (accessed on 5 July 2026).
  16. enerad.pl. OSD (Operator Systemu Dystrybucyjnego)-Dystrybutorzy Prądu. Available online: https://enerad.pl/osd-dystrybutorzy/ (accessed on 5 July 2026).
  17. Energy Regulatory Office (URE). Electricity Supply to Households. Available online: https://www.ure.gov.pl/pl/konsumenci/rachunki-pod-kontrola-konsumen/dostarczanie-energii-do-gospod/12780,dok.html (accessed on 5 July 2026).
  18. Qamar, N.; Arshad, A.; Mahmoud, K.; Lehtonen, M. Hosting Capacity in Distribution Grids: A Review of Definitions, Performance Indices, Determination Methodologies, and Enhancement Techniques. Energy Sci. Eng. 2023, 11, 1536–1559. [Google Scholar] [CrossRef] [Scilit]
  19. Suchithra, J.; Robinson, D.; Rajabi, A. Hosting Capacity Assessment Strategies and Reinforcement Learning Methods for Coordinated Voltage Control in Electricity Distribution Networks: A Review. Energies 2023, 16, 2371. [Google Scholar] [CrossRef] [Scilit]
  20. Chatzistylianos, E.S.; Psarros, G.N.; Papathanassiou, S.A. Export Constraints Applicable to Renewable Generation to Enhance Grid Hosting Capacity. Energies 2024, 17, 2588. [Google Scholar] [CrossRef] [Scilit]
  21. Du, N.; Tang, F.; Liao, Q.; Wang, C.; Gao, X.; Xie, J.; Zhang, J.; Lu, R. Hosting Capacity Assessment in Distribution Networks Considering Wind-Photovoltaic-Load Temporal Characteristics. Front. Energy Res. 2021, 9, 767610. [Google Scholar] [CrossRef] [Scilit]
  22. Mousavi, M.; Azarnia, M.; Zhong, J.; Rönnberg, S. Maximization of Renewable Generation Hosting Capacity in Power Transmission Grids Considering Participation in Energy and Flexibility Markets: A Bilevel Optimization Model. Sustain. Energy Grids Netw. 2025, 41, 101633. [Google Scholar] [CrossRef] [Scilit]
  23. Bridge, G.; Bouzarovski, S.; Bradshaw, M.; Eyre, N. Geographies of Energy Transition: Space, Place and the Low-Carbon Economy. Energy Policy 2013, 53, 331–340. [Google Scholar] [CrossRef] [Scilit]
  24. Bridge, G.; Gailing, L. New Energy Spaces: Towards a Geographical Political Economy of Energy Transition. Environ. Plan. A Econ. Space 2020, 52, 1037–1050. [Google Scholar] [CrossRef] [Scilit]
  25. Calvert, K. From ‘Energy Geography’ to ‘Energy Geographies’: Perspectives on a Fertile Academic Borderland. Prog. Hum. Geogr. 2016, 40, 105–125. [Google Scholar] [CrossRef] [Scilit]
  26. Nadeem, T.B.; Siddiqui, M.; Khalid, M.; Asif, M. Distributed Energy Systems: A Review of Classification, Technologies, Applications, and Policies. Energy Strategy Rev. 2023, 48, 101096. [Google Scholar] [CrossRef] [Scilit]
  27. Bouzarovski, S.; Tirado Herrero, S.; Petrova, S.; Frankowski, J.; Matousek, R.; Maltby, T. Multiple Transformations: Theorizing Energy Vulnerability as a Socio-Spatial Phenomenon. Geogr. Ann. Ser. B Hum. Geogr. 2017, 99, 20–41. [Google Scholar] [CrossRef] [Scilit]
  28. Bouzarovski, S.; Tirado Herrero, S. Geographies of Injustice: The Socio-Spatial Determinants of Energy Poverty in Poland, the Czech Republic and Hungary. Post-Communist Econ. 2017, 29, 27–50. [Google Scholar] [CrossRef] [Scilit]
  29. Sovacool, B.K.; Dworkin, M.H. Energy Justice: Conceptual Insights and Practical Applications. Appl. Energy 2015, 142, 435–444. [Google Scholar] [CrossRef] [Scilit]
  30. Sovacool, B.K.; Dworkin, M.H. Global Energy Justice: Problems, Principles, and Practices; Cambridge University Press: Cambridge, UK, 2014. [Google Scholar]
  31. Bouzarovski, S.; Petrova, S. A Global Perspective on Domestic Energy Deprivation: Overcoming the Energy Poverty-Fuel Poverty Binary. Energy Res. Soc. Sci. 2015, 10, 31–40. [Google Scholar] [CrossRef] [Scilit]
  32. Thomson, H.; Bouzarovski, S.; Snell, C. Rethinking the Measurement of Energy Poverty in Europe: A Critical Analysis of Indicators and Data. Indoor Built Environ. 2017, 26, 879–901. [Google Scholar] [CrossRef] [Scilit] [PubMed]
  33. Karpinska, L.; Śmiech, S. Conceptualising Housing Costs: The Hidden Face of Energy Poverty in Poland. Energy Policy 2020, 147, 111819. [Google Scholar] [CrossRef] [Scilit]
  34. Karpinska, L.; Śmiech, S.; Gouveia, J.P.; Palma, P. Mapping Regional Vulnerability to Energy Poverty in Poland. Sustainability 2021, 13, 10694. [Google Scholar] [CrossRef] [Scilit]
  35. Mrozowska, S.; Wendt, J.A.; Tomaszewski, K. The Challenges of Poland’s Energy Transition. Energies 2021, 14, 8165. [Google Scholar] [CrossRef] [Scilit]
  36. Kryszk, H.; Kurowska, K.; Marks-Bielska, R.; Bielski, S.; Eżlakowski, B. Barriers and Prospects for the Development of Renewable Energy Sources in Poland during the Energy Crisis. Energies 2023, 16, 1724. [Google Scholar] [CrossRef] [Scilit]
  37. Graczyk, A. Rozwój Odnawialnych Źródeł Energii w Polskiej Polityce Regionalnej [Development of Renewable Energy Sources in Polish Regional Policy]. Barom. Reg. 2017, 15, 55–59. [Google Scholar]
  38. Frankowski, J.; Tirado Herrero, S. What Is in It for Me? A People-Centered Account of Household Energy Transition Co-Benefits in Poland. Energy Res. Soc. Sci. 2021, 71, 101787. [Google Scholar] [CrossRef] [Scilit]
  39. Santa, R.; Bosnjakovic, M.; Rajcsanyi-Molnar, M.; Andras, I. Energy Systems in Transition: A Regional Analysis of Eastern Europe’s Energy Challenges. Clean Technol. 2025, 7, 84. [Google Scholar] [CrossRef] [Scilit]
  40. Kowalska, M.; Chomać-Pierzecka, E.; Kuboń, M.; Bogusz, M. The Social Aspects of Energy System Transformation in Light of Climate Change-A Case Study of South-Eastern Poland in the Context of Current Challenges and Findings to Date. Energies 2026, 19, 286. [Google Scholar] [CrossRef] [Scilit]
  41. Misik, M.; Oravcova, V. (Eds.) From Economic to Energy Transition: Three Decades of Transitions in Central and Eastern Europe; Springer Nature: Cham, Switzerland, 2021. [Google Scholar]
  42. Verma, P.; Chodkowska-Miszczuk, J.; Lewandowska, A.; Wiśniewski, L. Local Resilience for Low-Carbon Transition in Poland: Frameworks, Conditions and Opportunities for Central European Countries. Sustain. Dev. 2023, 31, 1278–1295. [Google Scholar] [CrossRef] [Scilit]
  43. Stala-Szlugaj, K.; Olczak, P.; Kulpa, J.; Soltysik, M. Methodology for Selecting a Location for a Photovoltaic Farm on the Example of Poland. Energies 2024, 17, 2394. [Google Scholar] [CrossRef] [Scilit]
  44. Kowalczyk, A.M.; Czyza, S. Optimising Photovoltaic Farm Location Using a Capabilities Matrix and GIS. Energies 2022, 15, 6693. [Google Scholar] [CrossRef] [Scilit]
  45. Hołuj, A.; Ilba, M.; Lityński, P.; Majewski, K.; Semczuk, M.; Serafin, P. Photovoltaic Solar Energy from Urban Sprawl: Potential for Poland. Energies 2021, 14, 8576. [Google Scholar] [CrossRef] [Scilit]
  46. Kocur-Bera, K. Regional Interferences to Photovoltaic Development: A Polish Perspective. Energies 2024, 17, 3484. [Google Scholar] [CrossRef] [Scilit]
  47. Cieślak, I.; Eżlakowski, B. The Use of GIS Tools for Decision-Making Support in Sustainable Energy Generation on the Example of the Solar Photovoltaic Technology. Bull. Geogr. Socio-Econ. Ser. 2023, 60, 157–171. [Google Scholar] [CrossRef] [Scilit]
  48. Brodzinski, Z.; Brodzińska, K.; Szadziun, M. Photovoltaic Farms-Economic Efficiency of Investments in North-East Poland. Energies 2021, 14, 2087. [Google Scholar] [CrossRef] [Scilit]
  49. Szuta, A.; Makowski, K.; Szczepańska, A. Implementing Agrivoltaics in Poland: Policy and Impact of Photovoltaic Farms on Rural Landscapes. Landsc. Online 2025, 100, 1132. [Google Scholar] [CrossRef] [Scilit]
  50. Sokolowski, J. Peer Effects on Photovoltaics (PV) Adoption and Air Quality Spillovers in Poland. Energy Econ. 2023, 125, 106889. [Google Scholar] [CrossRef] [Scilit]
  51. Pelczar, S. Understanding the Spatial Distribution of Renewable Power Plants for Predicting Future Cumulative Impact on the Environment: Case Study of Photovoltaic and Wind Power Plants in Poland. Renew. Energy 2025. [Google Scholar] [CrossRef] [Scilit]
  52. Igliński, B.; Piechota, G.; Kiełkowska, U.; Kujawski, W.; Pietrzak, M.B.; Skrzatek, M. The Assessment of Solar Photovoltaic in Poland: The Photovoltaics Potential, Perspectives and Development. Clean Technol. Environ. Policy 2023, 25, 281–298. [Google Scholar] [CrossRef] [Scilit] [PubMed]
  53. Hajto, M.; Cichocki, Z.; Bidlasik, M.; Borzyszkowski, J.; Kuśmierz, A. Constraints on Development of Wind Energy in Poland due to Environmental Objectives. Environ. Manag. 2016, 59, 204–217. [Google Scholar] [CrossRef] [Scilit] [PubMed]
  54. Aydin, O.; Igliński, B.; Krukowski, K.; Siemieński, M. Analyzing Wind Energy Potential Using Efficient Global Optimization: A Case Study for the City of Gdansk in Poland. Energies 2022, 15, 3159. [Google Scholar] [CrossRef] [Scilit]
  55. Umoh, V.; Davidson, I.; Adebiyi, A.; Ekpe, U. Methods and Tools for PV and EV Hosting Capacity Determination in Low Voltage Distribution Networks-A Review. Energies 2023, 16, 3609. [Google Scholar] [CrossRef] [Scilit]
  56. Cowell, F.A. Measuring Inequality, 3rd ed.; LSE Perspectives in Economic Analysis; Oxford University Press: Oxford, UK, 2011. [Google Scholar]
  57. teraz-srodowisko.pl. W Polsce Powstaje Pierwszy Projekt Hybrydowy OZE w Formule Cable Poolingu. Available online: https://www.teraz-srodowisko.pl/aktualnosci/Polska-powstaje-projekt-hybrydowy-OZE-cable-pooling-13849.html (accessed on 5 July 2026).
  58. Gramwzielone.pl. Jak Sprawdza się Cable Pooling w Polsce po Dwóch Latach od Wdrożenia? 2026. Available online: https://www.gramwzielone.pl/trendy/20337990/jak-sprawdza-sie-cable-pooling-w-polsce-po-dwoch-latach-od-wdrozenia (accessed on 5 July 2026).
  59. Baker McKenzie. Poland: Grid Act to Change RES and BESS Grid Connection Rules. 2026. Available online: https://www.bakermckenzie.com/en/insight/publications/2026/03/poland-grid-act-to-change-res-and-bess-grid-connection-rules (accessed on 5 July 2026).
  60. energetyka24.com. Prezydent Podpisał Ustawę Sieciową o Przyłączeniach. 2026. Available online: https://energetyka24.com/energetyka/elektroenergetyka/prezydent-podpisal-ustawe-sieciowa-o-przylaczeniach (accessed on 5 July 2026).
  61. IRENA. Renewable Capacity Statistics 2024; International Renewable Energy Agency: Abu Dhabi, United Arab Emirates, 2024.
  62. IRENA. World Energy Transitions Outlook 2024: 1.5 Degree C Pathway; International Renewable Energy Agency: Abu Dhabi, United Arab Emirates, 2024.
  63. Polskie Sieci Elektroenergetyczne S.A. (PSE). Plan Rozwoju w Zakresie Zaspokojenia Obecnego i Przyszłego Zapotrzebowania na Energie Elektryczna na Lata 2025–2034; PSE S.A.: Konstancin-Jeziorna, Poland, 2024.
  64. Polskie Sieci Elektroenergetyczne S.A. (PSE). Projekt Nowego Planu Rozwoju Sieci Przesyłowej na Lata 2025–2034. Available online: https://www.pse.pl/-/projekt-nowego-planu-rozwoju-sieci-przesylowej-na-lata-2025-2034 (accessed on 5 July 2026).
  65. enerad.pl. PSE Opracowało Plan Rozwoju Sieci Przesylowej na Lata 2025–2034. Available online: https://enerad.pl/pse-opracowalo-plan-rozwoju-sieci-przesylowej-na-lata-2025-2034/ (accessed on 5 July 2026).
  66. Cieślak, I.; Biłozor, A.; Szuniewicz, K. The Use of the CORINE Land Cover (CLC) Database for Analyzing Urban Sprawl. Remote Sens. 2020, 12, 282. [Google Scholar] [CrossRef] [Scilit]
  67. Biłozor, A.; Cieślak, I.; Czyża, S. An Analysis of Urbanisation Dynamics with the Use of the Fuzzy Set Theory-A Case Study of the City of Olsztyn. Remote Sens. 2020, 12, 1784. [Google Scholar] [CrossRef] [Scilit]
  68. Cieślak, I.; Górecka, K. An Evaluation of Urbanisation Processes in Suburban Zones Using Land-Cover Data and Fuzzy Set Theory. Bull. Geogr. Socio-Econ. Ser. 2021, 54, 49–62. [Google Scholar] [CrossRef] [Scilit]
  69. Cieślak, I.; Biłozor, A. Land-Use Change Dynamics in Areas Subjected to Direct Urbanization Pressure: A Case Study of the City of Olsztyn. Sustainability 2024, 16, 2923. [Google Scholar] [CrossRef] [Scilit]
  70. Devine-Wright, P. Beyond NIMBYism: Towards an Integrated Framework for Understanding Public Perceptions of Wind Energy. Wind Energy 2005, 8, 125–139. [Google Scholar] [CrossRef] [Scilit]
  71. Wolsink, M. Wind Power Implementation: The Nature of Public Attitudes: Equity and Fairness Instead of ‘Backyard Motives’. Renew. Sustain. Energy Rev. 2007, 11, 1188–1207. [Google Scholar] [CrossRef] [Scilit]
  72. Van der Horst, D. NIMBY or Not? Exploring the Relevance of Location and the Politics of Voiced Opinions in Renewable Energy Siting Controversies. Energy Policy 2007, 35, 2705–2714. [Google Scholar] [CrossRef] [Scilit]
  73. Rochmińska, A. Wind Energy Infrastructure and Socio-Spatial Conflicts: The Case of Poland. Energies 2023, 16, 1032. [Google Scholar] [CrossRef] [Scilit]
  74. Cherp, A.; Jewell, J. The Concept of Energy Security: Beyond the Four As. Energy Policy 2014, 75, 415–421. [Google Scholar] [CrossRef] [Scilit]
  75. IEA. Energy Security; International Energy Agency: Paris, France, 2022. Available online: https://www.iea.org/topics/energy-security (accessed on 5 July 2026).
  76. European Commission. REPowerEU Plan; Communication COM(2022) 230 Final; European Commission: Brussels, Belgium, 2022.
  77. Szulecki, K. Securitization and State Encroachment on the Energy Sector: Politics of Exception in Poland’s Energy Governance. Energy Policy 2020, 136, 111066. [Google Scholar] [CrossRef] [Scilit]
  78. Zuk, P.; Buzogany, A.; Misik, M.; Osicka, J.; Szulecki, K. Semi-Peripheries in the World-System? The Visegrad Group Countries in the Geopolitical Order of Energy and Raw Materials after the War in Ukraine. Resour. Policy 2023, 85, 104046. [Google Scholar] [CrossRef] [Scilit]
  79. Cernoch, F.; Lehotsky, L.; Konvalinova, A. Navigating Russia’s War and Energy Transition: Poland’s Coal Challenge. Energy Res. Soc. Sci. 2024, 113, 103548. [Google Scholar] [CrossRef] [Scilit]
  80. Chen, J.; Yan, J.; Kemmeugne, A.; Kassouf, M.; Debbabi, M. Cybersecurity of Distributed Energy Resource Systems in the Smart Grid: A Survey. Appl. Energy 2025, 384, 125364. [Google Scholar] [CrossRef] [Scilit]
  81. Harrou, F.; Taghezouit, B.; Bouyeddou, B.; Sun, Y. Cybersecurity of Photovoltaic Systems: Challenges, Threats, and Mitigation Strategies: A Short Survey. Front. Energy Res. 2023, 11, 1274451. [Google Scholar] [CrossRef] [Scilit]
  82. Brodzińska, K.; Błażejowska, M.; Brodziński, Z.; Łącka, I.; Stolarska, A. Energy Cooperatives as an Instrument for Stimulating Distributed Renewable Energy in Poland. Energies 2025, 18, 838. [Google Scholar] [CrossRef] [Scilit]
Figure 1. Procedure for connecting a renewable energy source to the Polish electricity grid (>1 kV).
Energies 19 04039 g001
Figure 2. Growth of installed photovoltaic capacity in Poland, 2015–2026 (selected verified data points).
Energies 19 04039 g002
Figure 3. Cumulative capacity of refused grid-connection applications in Poland, 2023–2025.
Energies 19 04039 g003
Figure 4. ENERGA-OPERATOR total available grid-connection capacity across 52 coherent node groups, 2018–2023, with the Olsztyn branch (Warmia–Mazury) shown separately.
Energies 19 04039 g004
Figure 5. Lorenz curve: concentration of available connection capacity across node groups, 2018 vs. 2023.
Energies 19 04039 g005
Figure 6. Distribution of available connection capacity across 52 ENERGA-OPERATOR node groups, 2018 vs. 2023. Note: Boxes represent the interquartile range (Q1–Q3), red horizontal lines indicate the median, whiskers show the range excluding outliers, grey dots represent individual node-group observations, and highlighted points indicate outliers.
Energies 19 04039 g006
Figure 7. Typology of node-group capacity trajectories, 2018–2023 (circled markers = Warmia–Mazury/Olsztyn branch).
Energies 19 04039 g007
Figure 8. Total installed electricity generation capacity by voivodeship, Poland, 2024 (all technologies).
Energies 19 04039 g008
Figure 9. Installed Generation-Capacity Density Index (IGCDI) by voivodeship, Poland, 2024, ranked (Warmia–Mazury highlighted).
Energies 19 04039 g009
Figure 10. Primary distribution system operator (DSO) by voivodeship, Poland (simplified; see caption for genuine overlap areas).
Energies 19 04039 g010
Figure 11. Sensitivity of the EGCI typology to the smoothing constant k, 52 ENERGA-OPERATOR node groups, 2018–2023.
Energies 19 04039 g011
Table 1. Timeline of the principal legal and regulatory milestones governing RES grid connection in Poland, 2011–2026.
DateLegal Act/InstrumentKey Provision
19 August 2011 (in force 30 Oct 2011)Act amending the Energy LawIntroduced Art. 7(8l): DSOs/TSOs must publish available connection capacity by node group, updated ≥ 1×/quarter
27 January 2012Compliance DeadlineReporting obligation takes effect for all DSOs
(pre-existing) Art. 7(8e)Energy LawMandatory KSE balancing-capacity/security check by PSE for units > 2 MW
17 August 2023 (in force 31 August 2023)Act Amending the Energy Law/RES ActIntroduced “cable pooling” for co-located sources sharing one connection point
1 August 2025PSE Procedural ReformStreamlined processing of connection-condition applications
13 March 2026 (in force 30 April 2026)“Ustawa sieciowa” (Grid Act)12-month validity of conditions; security deposits (30–60 PLN/kW); binding milestones; cable pooling extended to storage
2025–2034PSE Transmission Grid Development Plan (PRSP)4700 km of new 400 kV lines; 28 new + 110 modernised substations; targets 110 GW RES/24 GW storage/5.3 GW nuclear accommodation
Table 2. National grid-connection refusal statistics, Poland, 2023–2025.
YearNumber of RefusalsCumulative Refused Capacity [GW]
2023744883.51
2024781773.58
20254897107.0
Table 3. Descriptive statistics and Gini coefficient, available connection capacity across 52 ENERGA-OPERATOR node groups, 2018 vs. 2023.
Statistic20182023
Minimum [MW]00
1st quartile (Q1) [MW]55
Median [MW]7.515.0
3rd quartile (Q3) [MW]2030
Maximum [MW]6080
Mean [MW]11.623.9
Standard deviation [MW]11.323.5
Coefficient of variation (CV)0.970.98
Gini coefficient0.4780.509
Table 4. Typology classification of ENERGA-OPERATOR node-group capacity trajectories, 2018–2023 (n = 52).
CategoryDefinition (EGCI)n
Stagnant (no change)Absolute change = 0 MW20
Declining (negative change)Absolute change < 0 MW5
Low growth0 < EGCI < 0.51
Moderate growth0.5 ≤ EGCI < 1.516
High growthEGCI ≥ 1.510
Table 5. Available connection capacity in the Olsztyn branch (Warmia–Mazury), by node group, 2018 vs. 2023, with EGCI-based trajectory classification.
Node Group2018 (MW)2023 (MW)EGCITypology/Share
Elbląg5605.50High growth
Orneta10502.67High growth
Morąg5302.50High growth
Olsztyn15150.00Stagnant (no change)
Ostróda5403.50High growth
Iława5302.50High growth
Susz5706.50High growth
Kwidzyn20651.80High growth
Nidzica550.00Stagnant (no change)
Olsztyn branch total7536512.4% → 29.3% of ENERGA total
Table 6. Illustrative comparison of available connection capacity (MW) across selected node groups, three Polish DSOs, 2018 vs. 2023.
OperatorBranch/RegionNode Group2018 (MW)2023 (MW)Change
ENERGA-OPERATOROlsztyn (Warmia–Mazury)Susz570+1300%
ENERGA-OPERATORGdańskGdynia3580+129%
TAURON DystrybucjaJelenia GóraMikułowa10100%
TAURON DystrybucjaJelenia GóraCieplice550%
PGE DystrybucjaWarsaw peripheryOtwock1001000%
PGE DystrybucjaWarsaw peripheryBabice1151150%
PGE DystrybucjaWarsaw peripheryKarczew75105+40%
Table 7. Installed generation capacity, land area and the Installed Generation-Capacity Density Index (IGCDI) by voivodeship, Poland, 2024.
VoivodeshipInstalled Capacity [MW]Land Area [km2]IGCDI [MW/1000 km2]
Śląskie927412,333752
Opolskie45489412483
Łódzkie812718,219446
Zachodniopomorskie677622,905296
Mazowieckie980635,559276
Wielkopolskie749929,826251
Dolnośląskie456519,947229
Kujawsko-pomorskie401717,972224
Pomorskie401818,323219
Małopolskie315415,183208
Świętokrzyskie227111,711194
Lubuskie198713,988142
Podkarpackie231417,846130
Lubelskie203425,12381
Warmińsko-mazurskie172624,17371
Podlaskie140420,18770
Note: installed generation capacity, all technologies, Statistics Poland (GUS) Local Data Bank, 2024; land area, GUS. Rows are ordered by IGCDI. The sixteen areas sum to 312,707 km2, matching the published national total. The calculation is included in the Supplementary Code File S1 (Section 4.5).
Table 8. Three inequality measures for available connection capacity across 52 ENERGA-OPERATOR node groups, by year of the operator’s five-year plan.
Measure201820192020202120222023
Total capacity [MW]605790930117012151245
Gini coefficient0.4780.4940.5060.5010.5080.509
Theil T index0.4160.4280.4430.4250.4390.411
CR10 (top-10 share)48.8%50.6%53.2%52.1%53.1%53.4%
Note: the corresponding 2023 values are 1245 MW, 0.509, 0.441 and 53.4%. Bootstrap 95% intervals (20,000 replications): Gini 2018 (Figure 5) [0.391, 0.551]; Gini 2023 (Figure 5) [0.436, 0.562]; difference [−0.043, +0.102].
Table 9. Sensitivity of the EGCI typology to the smoothing constant k (n = 52 node groups).
k [MW]StagnantDecliningLow GrowthModerate GrowthHigh GrowthAgreement with k = 5
1.02051101688.5%
2.52051111590.4%
5.0 (adopted)20511610100%
10.02054131094.2%
20.02051015267.3%
Note: the Spearman rank correlation between the index computed at each k and the index at k = 5 MW never falls below 0.96. Seven of the nine Warmia–Mazury node groups are classified as high growth for every k ≤ 10 MW.
Table 10. Ex ante bounding analysis: Gini coefficient of available connection capacity across 52 ENERGA-OPERATOR node groups after a hypothetical capacity release under four allocation rules.
Released Volume (Share of 2023 Total)Pro-RataUniformConcentrated in Top 10Shortfall-Weighted
0% (observed 2023)0.5090.5090.5090.509
25% (311 MW)0.5090.4070.5690.364
50% (622 MW)0.5090.3400.6090.267
100% (1245 MW)0.5090.2550.6590.146
Note: computed from the Appendix A panel. The pro-rata column is constant by construction, since the Gini coefficient is invariant to multiplication of all values by a common factor.
Disclaimer/Publisher’s Note: The statements, opinions and data contained in all publications are solely those of the individual author(s) and contributor(s) and not of MDPI and/or the editor(s). MDPI and/or the editor(s) disclaim responsibility for any injury to people or property resulting from any ideas, methods, instructions or products referred to in the content.