1. Introduction
CO
2 water-alternating-gas (CO
2-WAG) flooding effectively improves the mobility ratio, enhances volumetric sweep efficiency, and simultaneously delivers both CO
2-enhanced oil recovery (CO
2-EOR) and geological carbon sequestration. This technology offers distinct technical and economic advantages amid global efforts toward carbon neutrality [
1,
2,
3]. After three decades of worldwide field experience, CO
2-EOR remains the only proven, large-scale, and economically sustainable option for CO
2 storage—and is likely to maintain this status for the foreseeable future [
4]. In this context, CO
2-WAG serves as a key injection strategy for integrating enhanced oil recovery with long-term subsurface carbon storage [
5,
6]. While miscible CO
2 flooding achieves substantially higher oil displacement efficiency than conventional waterflooding, the significant density contrast between injected gas and crude oil drives upward gravity override during gas migration in ultra-thick reservoirs. This phenomenon induces severe vertical sweep inefficiency and premature gas breakthrough, which represent major barriers to further improvements in oil recovery [
7,
8,
9]. Among the multiple factors governing gravity override, geological parameters typically exert a more pronounced control. However, field development for a given reservoir is conducted under fixed geological conditions, with optimization efforts focused on adjustable operational variables. Accordingly, elucidating the impacts of development-related factors is essential for maximizing oil recovery in such reservoirs [
10,
11,
12,
13].
Previous investigations have explored the operational controls on gravity override during WAG flooding, with representative studies summarized below. Pritchard and Nieman [
14] optimized WAG cycle duration and WAG ratios for override in miscible WAG flooding. Their results showed that high injection rates with low WAG ratios improved performance in the early flooding stage. Faisal et al. [
15] used a series of gas–water relative permeability models to study override in 1D and 2D numerical simulations, confirming that foam WAG had greater injectivity than simultaneous WAG due to the much lower mobility of foam. Chen and Reynolds [
16] optimized WAG cycle durations for CO
2–WAG processes affected by gravitational segregation, high-permeability layer thrust, and viscous fingering, which caused poor sweep efficiency. Their study indicated that shorter cycle times minimized gravitational segregation effects, but residual oil in upper layers remained lower than in lower layers regardless of cycle numbers. Khan and Mandal [
17,
18] derived analytical models to explore how parameter variations affect WAG performance in stratified heterogeneous reservoirs. Their findings indicate that gravity override is more severe in homogeneous reservoirs with large well spacing, while the opposite trend is observed at small well spacing; moreover, reducing the WAG ratio yields incremental oil recovery gains. Gao et al. [
19] used XGBoost for proxy prediction and optimization of CO
2-WAG cumulative oil production, showing that the injection rate is a key development factor. Li and Gao [
20] introduced a structured “adjustment toolkit” of 19 operational methods, and their research results showed that optimizing the WAG injection strategy and injection cycle can reduce gas channeling and expand the affected volume.
Despite these advances, notable research gaps persist (as outlined in
Table 1). First, prior studies have largely focused on reservoirs with thicknesses below 100 m, leaving the gravity override behavior in ultra-thick reservoirs (thickness >100 m) poorly understood. Second, few investigations have examined the controlling WAG factors from the perspective of quantitative gravity override characterization.
In this work, a three-dimensional synthetic heterogeneous dipping mechanistic reservoir model is constructed. Building on a quantitative evaluation index for the gravity override index developed by the authors of WAG flooding in heterogeneous reservoirs [
8], we systematically analyze the gravity override patterns associated with six key operational factors using the univariate analysis method. Furthermore, by integrating multiple performance metrics such as oil recovery factor, gas–oil ratio (GOR), and gravity override index, we elucidate the formation mechanism of the gravity–viscous force counterbalance effect. The eXtreme Gradient Boosting (XGBoost) machine learning algorithm is then employed to objectively quantify the relative importance of these factors and identify the dominant operational controls.
This study makes two key contributions to the existing literature. First, it delineates the gravity override patterns in ultra-thick reservoirs exceeding 100 m in thickness through a rigorous quantitative characterization approach. Second, it adopts the XGBoost algorithm for dominant factor analysis, enabling objective, data-driven quantification of the relative influence of each controlling parameter.
2. Methods
2.1. Quantitative Evaluation Index
Existing gravity override evaluation methods are mostly applicable to pure gas flooding in homogeneous reservoirs. In this work, we employ a quantitative gravity override index originally developed for water-alternating-gas flooding in heterogeneous reservoirs in our prior study [
8] to perform quantitative characterization of gravity override behavior. The calculation formula is expressed as follows:
where
denotes the gravity override index, with a value ranging from
to
. A value closer to 1 indicates that the gas phase is more concentrated at the top of the reservoir, corresponding to more severe gravity override; a value closer to −1 indicates that the gas phase is distributed near the bottom of the reservoir, which occurs when supercritical CO
2 has a higher density than crude oil; a value less than or equal to 0 means no upward gas migration occurs, i.e., no gravity override phenomenon is observed.
: Number of gas-swept grids in the k-th layer.
: Total number of vertical grids in the reservoir before gas breakthrough.
: Number of farthest gas-swept grids in the horizontal direction.
: Override judgment coefficient.
This index quantifies the proportion of the unswept area by injected gas and comprehensively incorporates the vertical gas sweep position and gas front location, enabling effective characterization of the contribution of gravity to vertical gas sweep performance.
In our prior work [
8], the proposed index was systematically compared with several conventional numerical simulation-based evaluation methods under WAG flooding in heterogeneous reservoirs, and the results demonstrated that those methods are unsuitable for quantitatively characterizing gravity override in such scenarios. Furthermore, compared with the widely used gravity number, the present index incorporates layer-dependent override weights and an override judgment coefficient, enabling it to isolate gravity effects from permeability-induced fingering and to quantify override severity at any simulation time step. This makes it a more accurate and physically meaningful tool for evaluating gravity override in heterogeneous reservoirs under WAG flooding. The composite permeability rhythm adopted in this study is one of the four stratigraphic patterns validated in that work, confirming the index’s applicability to the present reservoir conditions.
2.2. Numerical Model Construction
The target, Reservoir B, is a deep-water ultra-thick carbonate reservoir. The average pay zone thickness is 200 m, and the average structural dip angle is 6°. The average porosity is 12.5%, and the average permeability is 309 mD, with significant areal heterogeneity. The average vertical-to-horizontal permeability ratio (Kv/Kh) is 0.3. The reservoir exhibits a composite permeability rhythm, where the permeability first increases and then decreases with increasing depth, representing the dominant stratigraphic pattern. The reservoir temperature is 91.1 °C, and the initial formation pressure is 62.8 MPa at a depth of 5548 m. The injected fluid is associated gas with high CO2 content, and the measured minimum miscibility pressure (MMP) is 42.2 MPa, well below the initial formation pressure, ensuring miscible flooding conditions throughout the production process. The field is developed with bottom injection and top production wells under the WAG flooding scheme.
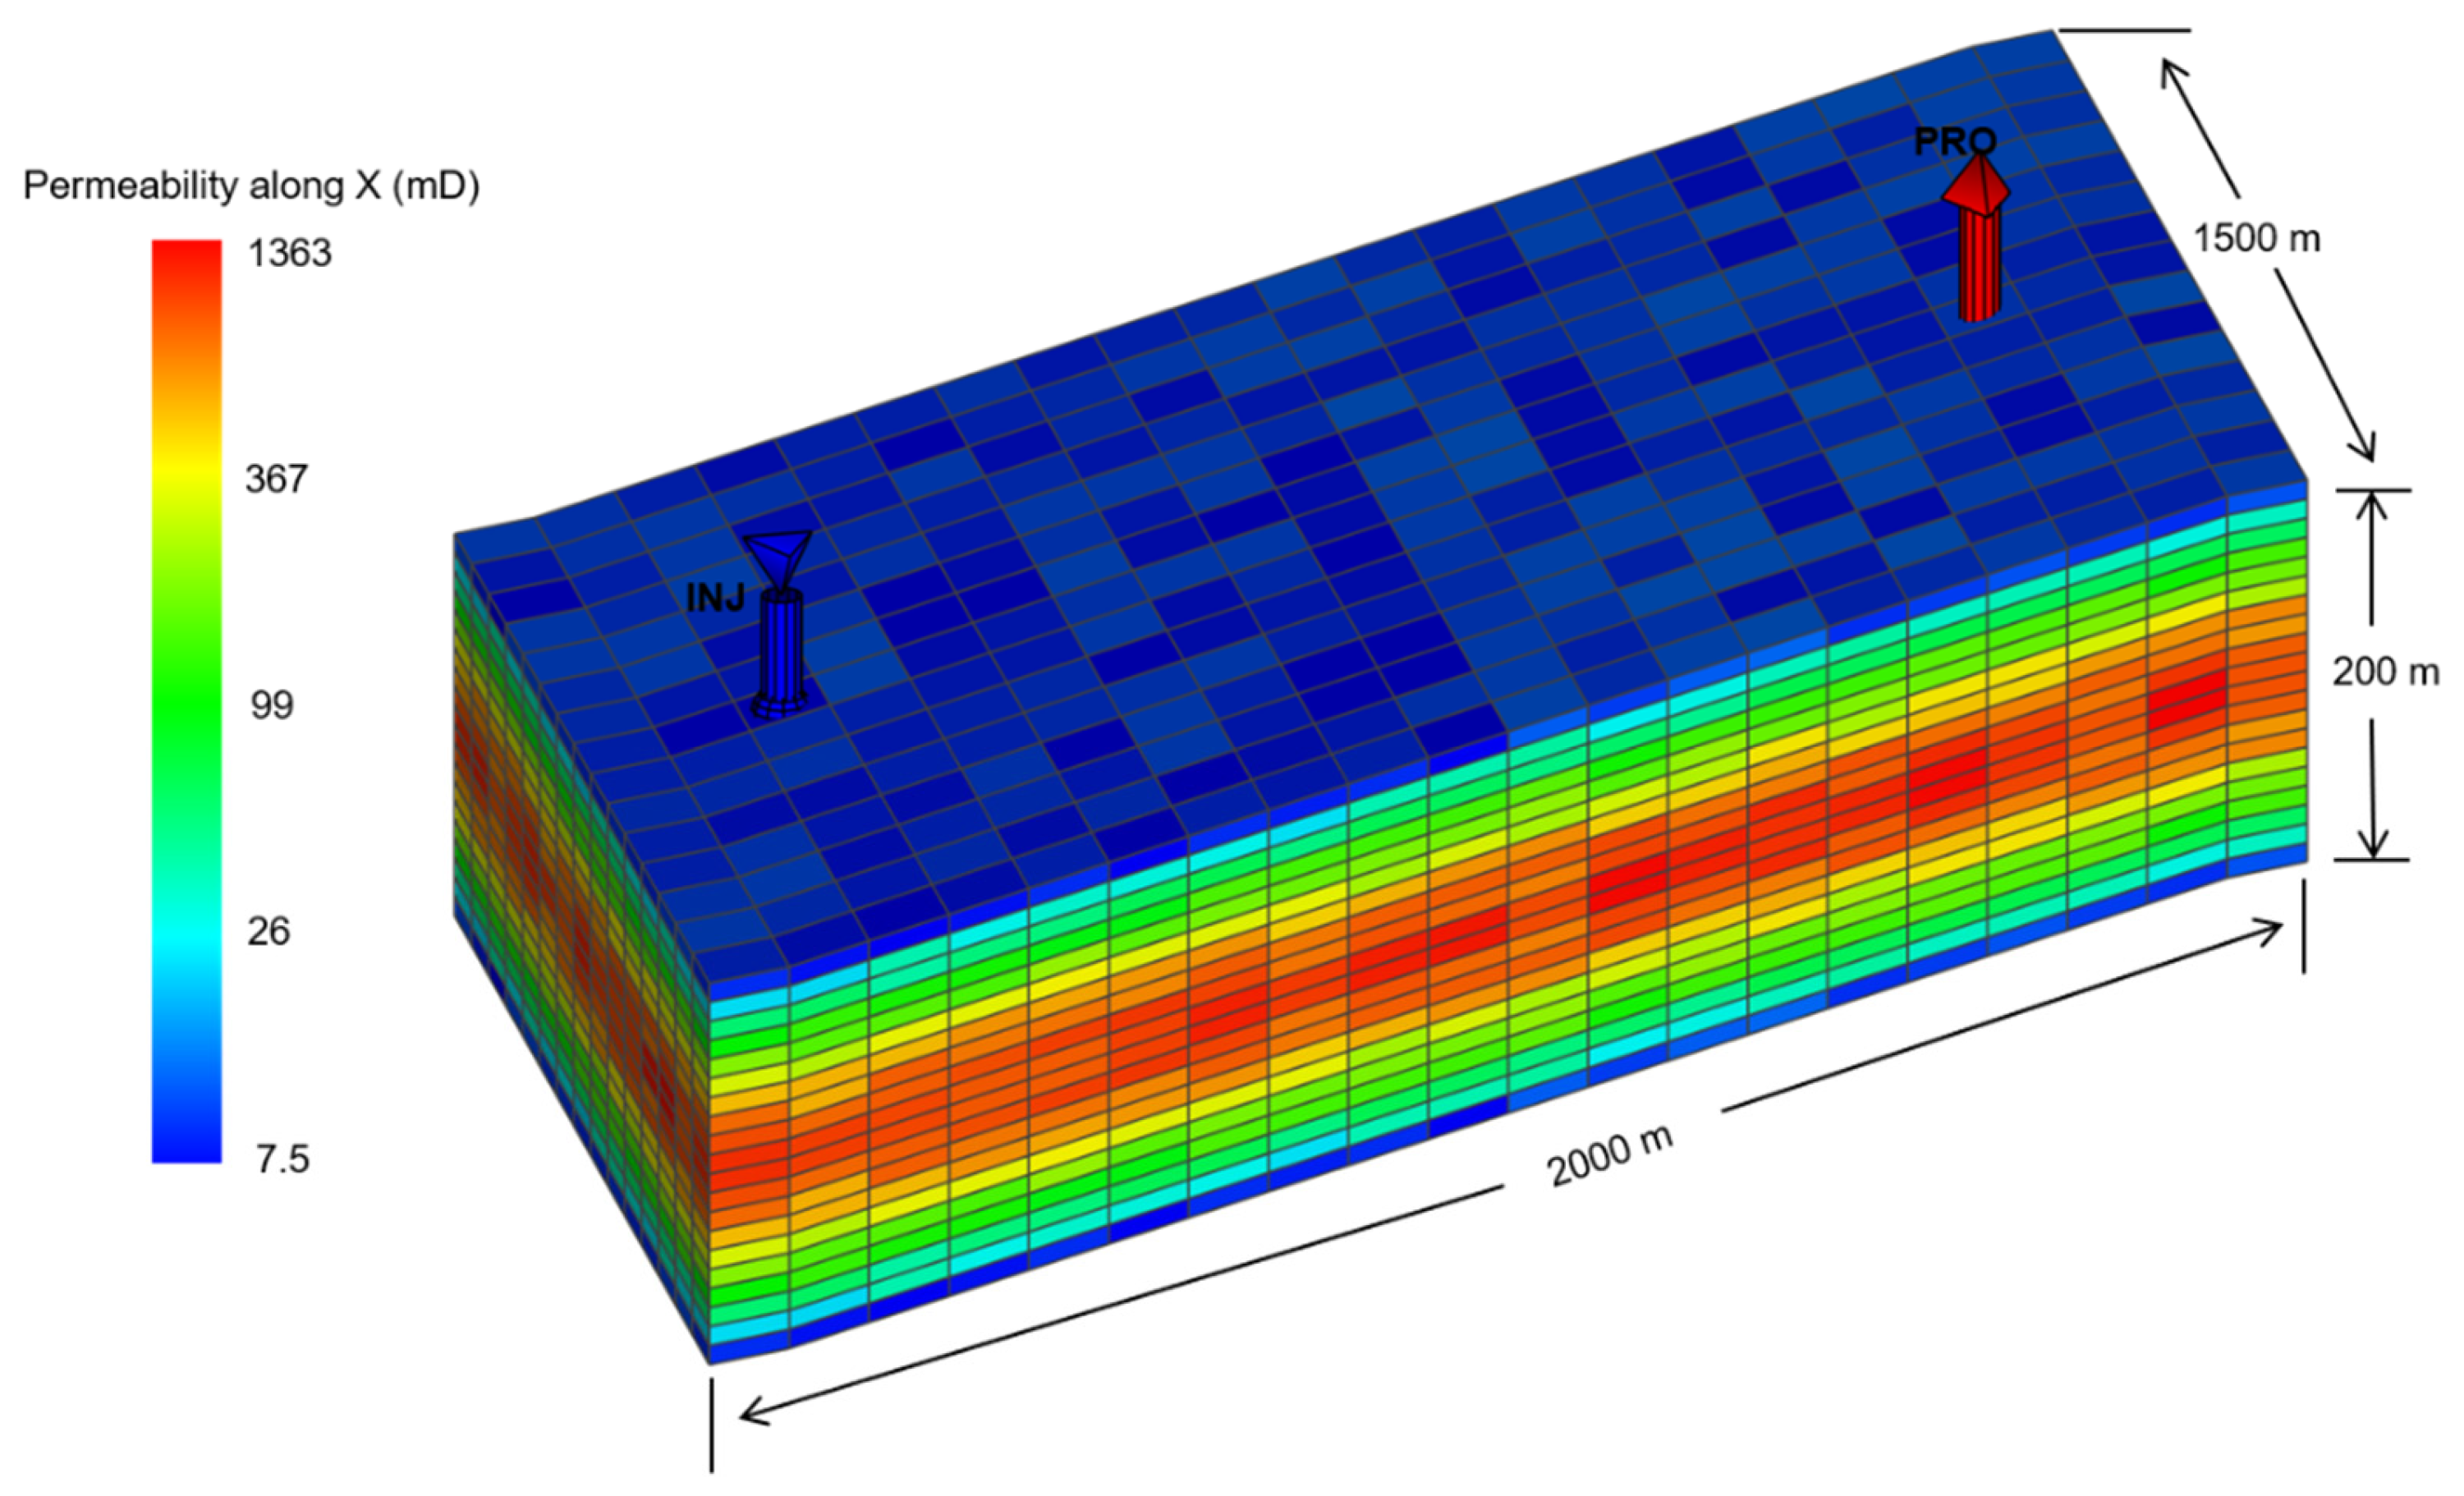
Based on these geological characteristics, a three-dimensional mechanistic reservoir model with one injector and one producer was constructed. The model adopts an aerial grid size of 100 m
100 m and a vertical grid size of 10 m, resulting in a total of 20
15
20
6000 grid blocks. The above reservoir geometry, petrophysical properties, and fluid characteristics are assigned to the model accordingly. The permeability first increases and then decreases with increasing depth, while the areal permeability of each layer is randomly generated within a specified range to replicate the vertical and areal heterogeneity of actual reservoirs, as illustrated in
Figure 1. A compositional fluid model (Peng-Robinson) is employed in the simulation. To align with the universal practical field deployment, the injector is placed at the structurally lower position and the producer at the structurally higher position. The voidage replacement ratio (VRR) is fixed at 1.0 to maintain injection–production equilibrium and eliminate VRR variation as a confounding factor. The VRR of 1.0 ensures that the formation pressure remains above the MMP throughout the production process, maintaining stable miscible flooding conditions. The oil production rate is defined as a fraction of the original oil in place, such that the injection and production volumes scale proportionally with reservoir volume across different well spacing cases. This control variable design ensures that observed differences in development performance can be attributed solely to changes in the target operational parameter, rather than to injection–production imbalance.
2.3. Study Scheme Design
The univariate analysis method is adopted to sequentially investigate the impacts of six key operational factors on gravity override index, GOR, and oil recovery factor: WAG injection strategy, well spacing, oil production rate, WAG slug duration, top perforation avoidance ratio, and perforation adjustment timing. The specific parameter settings are listed as follows:
WAG injection strategy: Five representative WAG schemes are compared in this study, with distinct injection mechanisms:
Conventional WAG: Standard water-alternating-gas injection with cyclic alternation of gas and water slugs at a fixed ratio.
HWAG (Hybrid Water-Alternating-Gas): A hybrid scheme with an initial continuous gas injection stage, which switches to conventional WAG operation after a preset period.
SWAG (Simultaneous Water and Gas Injection): A co-injection scheme where gas and water are injected simultaneously at a constant ratio throughout the entire injection process.
TWAG (Tapered Water-Alternating-Gas): A tapered injection scheme with progressively increasing water slug volume and decreasing gas slug volume over successive injection cycles.
ICV-WAG (Inflow Control Valve WAG): An intelligent zonal injection scheme that dynamically adjusts the vertical injection profile via downhole inflow control valves. Specifically, the valve opening of each pay zone is adjusted according to the gas intake profile of each interval, to optimize the vertical distribution of injected gas.
Well spacing: 500 m, 1000 m, 1500 m, 2000 m, 2500 m.
Oil production rate (annual oil production as a percentage of original oil in place): 1%, 1.5%, 2%, 2.5%, 3%.
WAG slug duration (injection duration of each single water/gas slug within one cycle): 3 months, 6 months, 9 months, 12 months, 15 months.
Top perforation avoidance ratio (ratio of the unperforated interval at the top of the production well to the total reservoir thickness): 0%, 10%, 20%, 30%, 40%.
Perforation adjustment timing (the top 20% of the perforated interval is shut in when the producing GOR reaches a preset threshold): 300, 600, 900, 1200, 1500 m3/m3.
2.4. XGBoost Machine Learning Method
XGBoost is an ensemble learning algorithm built on gradient-boosted decision trees. It features high prediction accuracy, strong robustness against overfitting, and superior capability in handling nonlinear relationships, and is therefore widely applied in feature importance analysis. By calculating the information gain contributed by each feature during tree splitting, XGBoost quantifies the influence of each input factor on model prediction outputs, thereby evaluating the relative importance of controlling factors.
In this study, two XGBoost regression models are established, with the six aforementioned operational factors (WAG injection strategy, well spacing, oil production rate, WAG slug duration, top perforation avoidance ratio, and perforation adjustment timing) as input features, and gravity override index and oil recovery factor as the respective output targets. The dataset, consisting of 30 samples in total, is generated from the univariate numerical simulation results. Due to the small sample size, 5-fold cross-validation was used for verification.
For the hyperparameters of the XGBoost model, we optimized them via grid search combined with cross-validation, adapting to the small sample size and avoiding overfitting. The key hyperparameters of the two models are as follows: max_depth = 4, n_estimators = 80, learning_rate = 0.1, reg_lambda = 1.
Prior to model training, data standardization is performed to eliminate the influence of dimensional differences among variables. The standardization formula is given as follows:
where
denotes the standardized data,
denotes the raw data,
denotes the mean value of the dataset, and
denotes the standard deviation.
The fitting performance of the models is evaluated using the coefficient of determination (R2) and root mean square error (RMSE). The influence weight of each factor is derived from the feature gain values output by the trained models.
R
2, defined in Equation (3), measures the proportion of variance in the target variable explained by the model.
where
denotes the true values,
denotes the corresponding predicted values, and
denotes the mean of the true values. R
2 ranges from (−∞,1], representing the proportion of total variance explained by the model. It provides an intuitive measure of overall model performance: the closer R
2 is to 1, the better the model fits the data.
RMSE, defined in Equation (4), quantifies the overall deviation between predicted and observed values and is sensitive to outliers in the dataset. A smaller RMSE indicates higher prediction accuracy of the model.
where
denotes the true values,
denotes the model predictions, and
denotes the number of observations.
3. Results
3.1. Analysis of Gravity Override Behavior Under Different Factors
3.1.1. WAG Injection Strategy
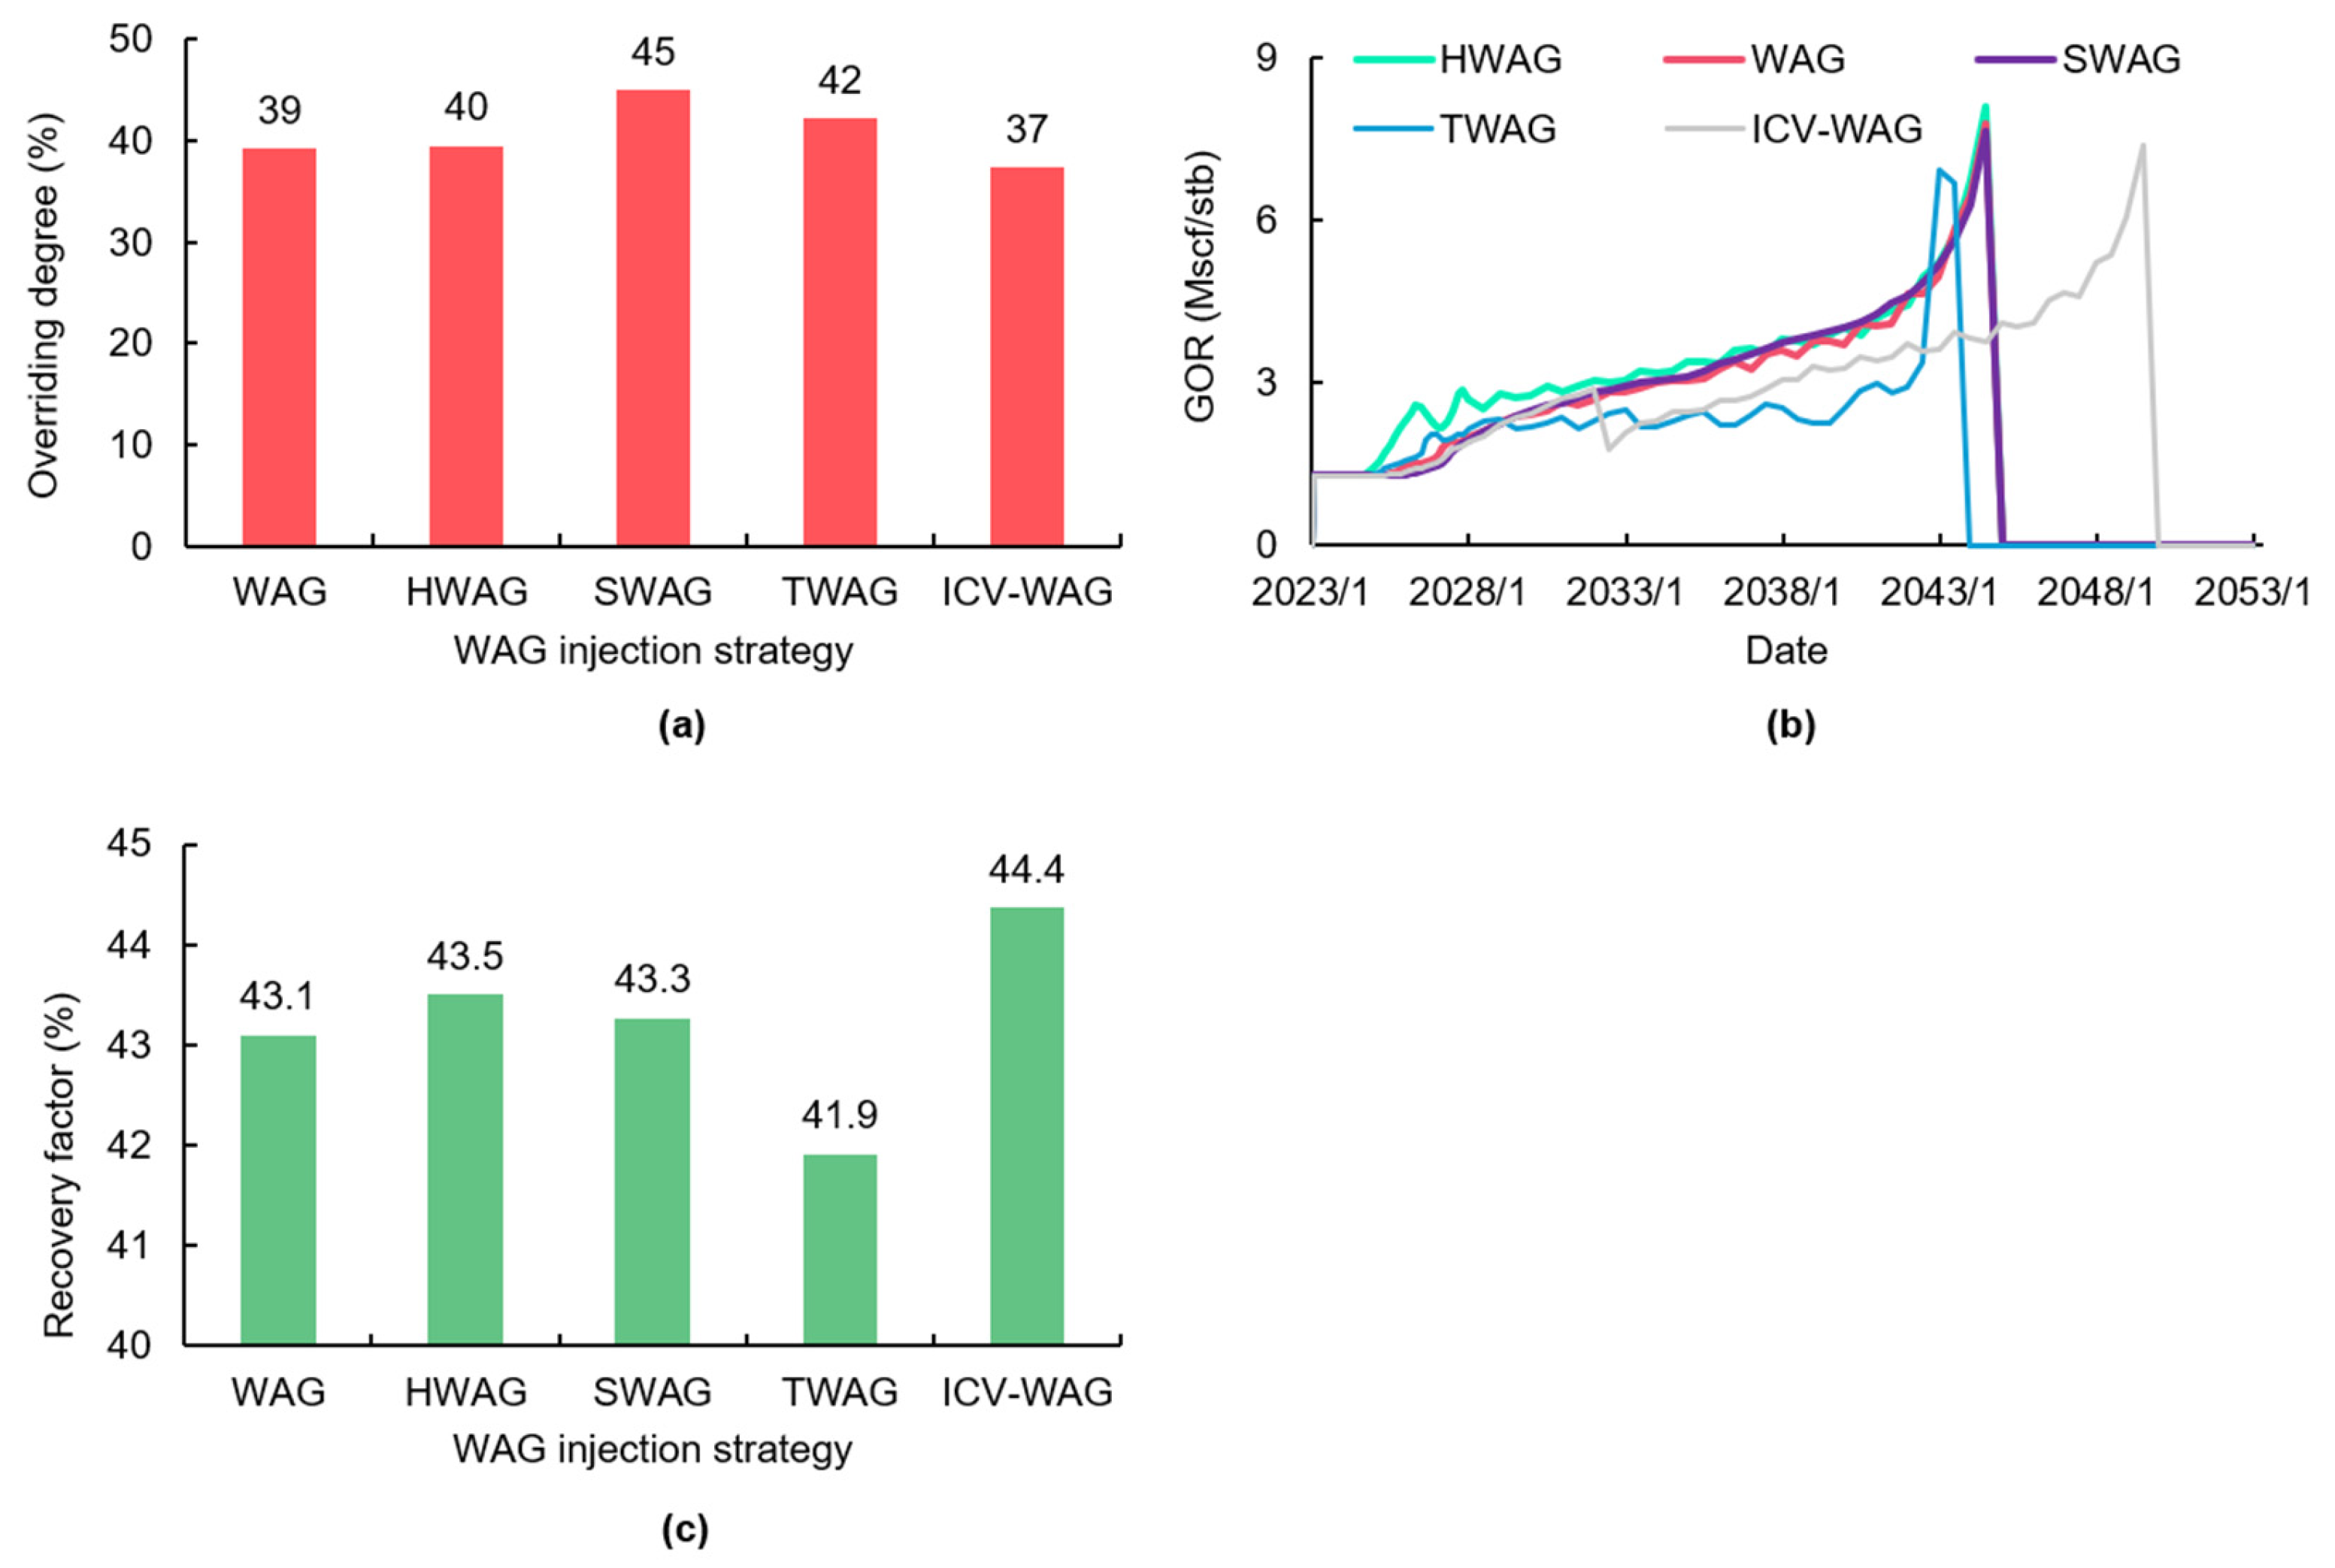
As shown in
Figure 2a, the gravity override index varies notably across different WAG injection strategies. Specifically, ICV-WAG yields the lowest gravity override index (37%), while SWAG results in the highest value (45%).
Figure 2b presents the evolution of gas–oil ratio (GOR) over production time for each strategy. Three key observations can be drawn:
ICV-WAG outperforms the other schemes in suppressing GOR rise throughout the production period.
HWAG exhibits a rapid GOR increase in the early stage due to two years of continuous gas injection; after switching to conventional WAG operation, its GOR profile converges with those of conventional WAG and SWAG.
TWAG delivers favorable GOR suppression performance in the first 18 years of development, but accelerated water cut rise after 18 years triggers a sharp decline in oil production, which in turn causes a drastic GOR surge at the end of the production period.
As depicted in
Figure 2c, the oil recovery factor also differs significantly among strategies. ICV-WAG achieves the highest oil recovery of 44.4%, as it adjusts the vertical injection profile via zonal injection, thereby mitigating gravity override and expanding gas sweep efficiency. In contrast, TWAG yields a relatively lower recovery of 41.9%; although enhanced water injection suppresses gas channeling, it fails to fully exploit the high displacement efficiency of gas flooding, resulting in compromised overall recovery performance.
3.1.2. Well Spacing
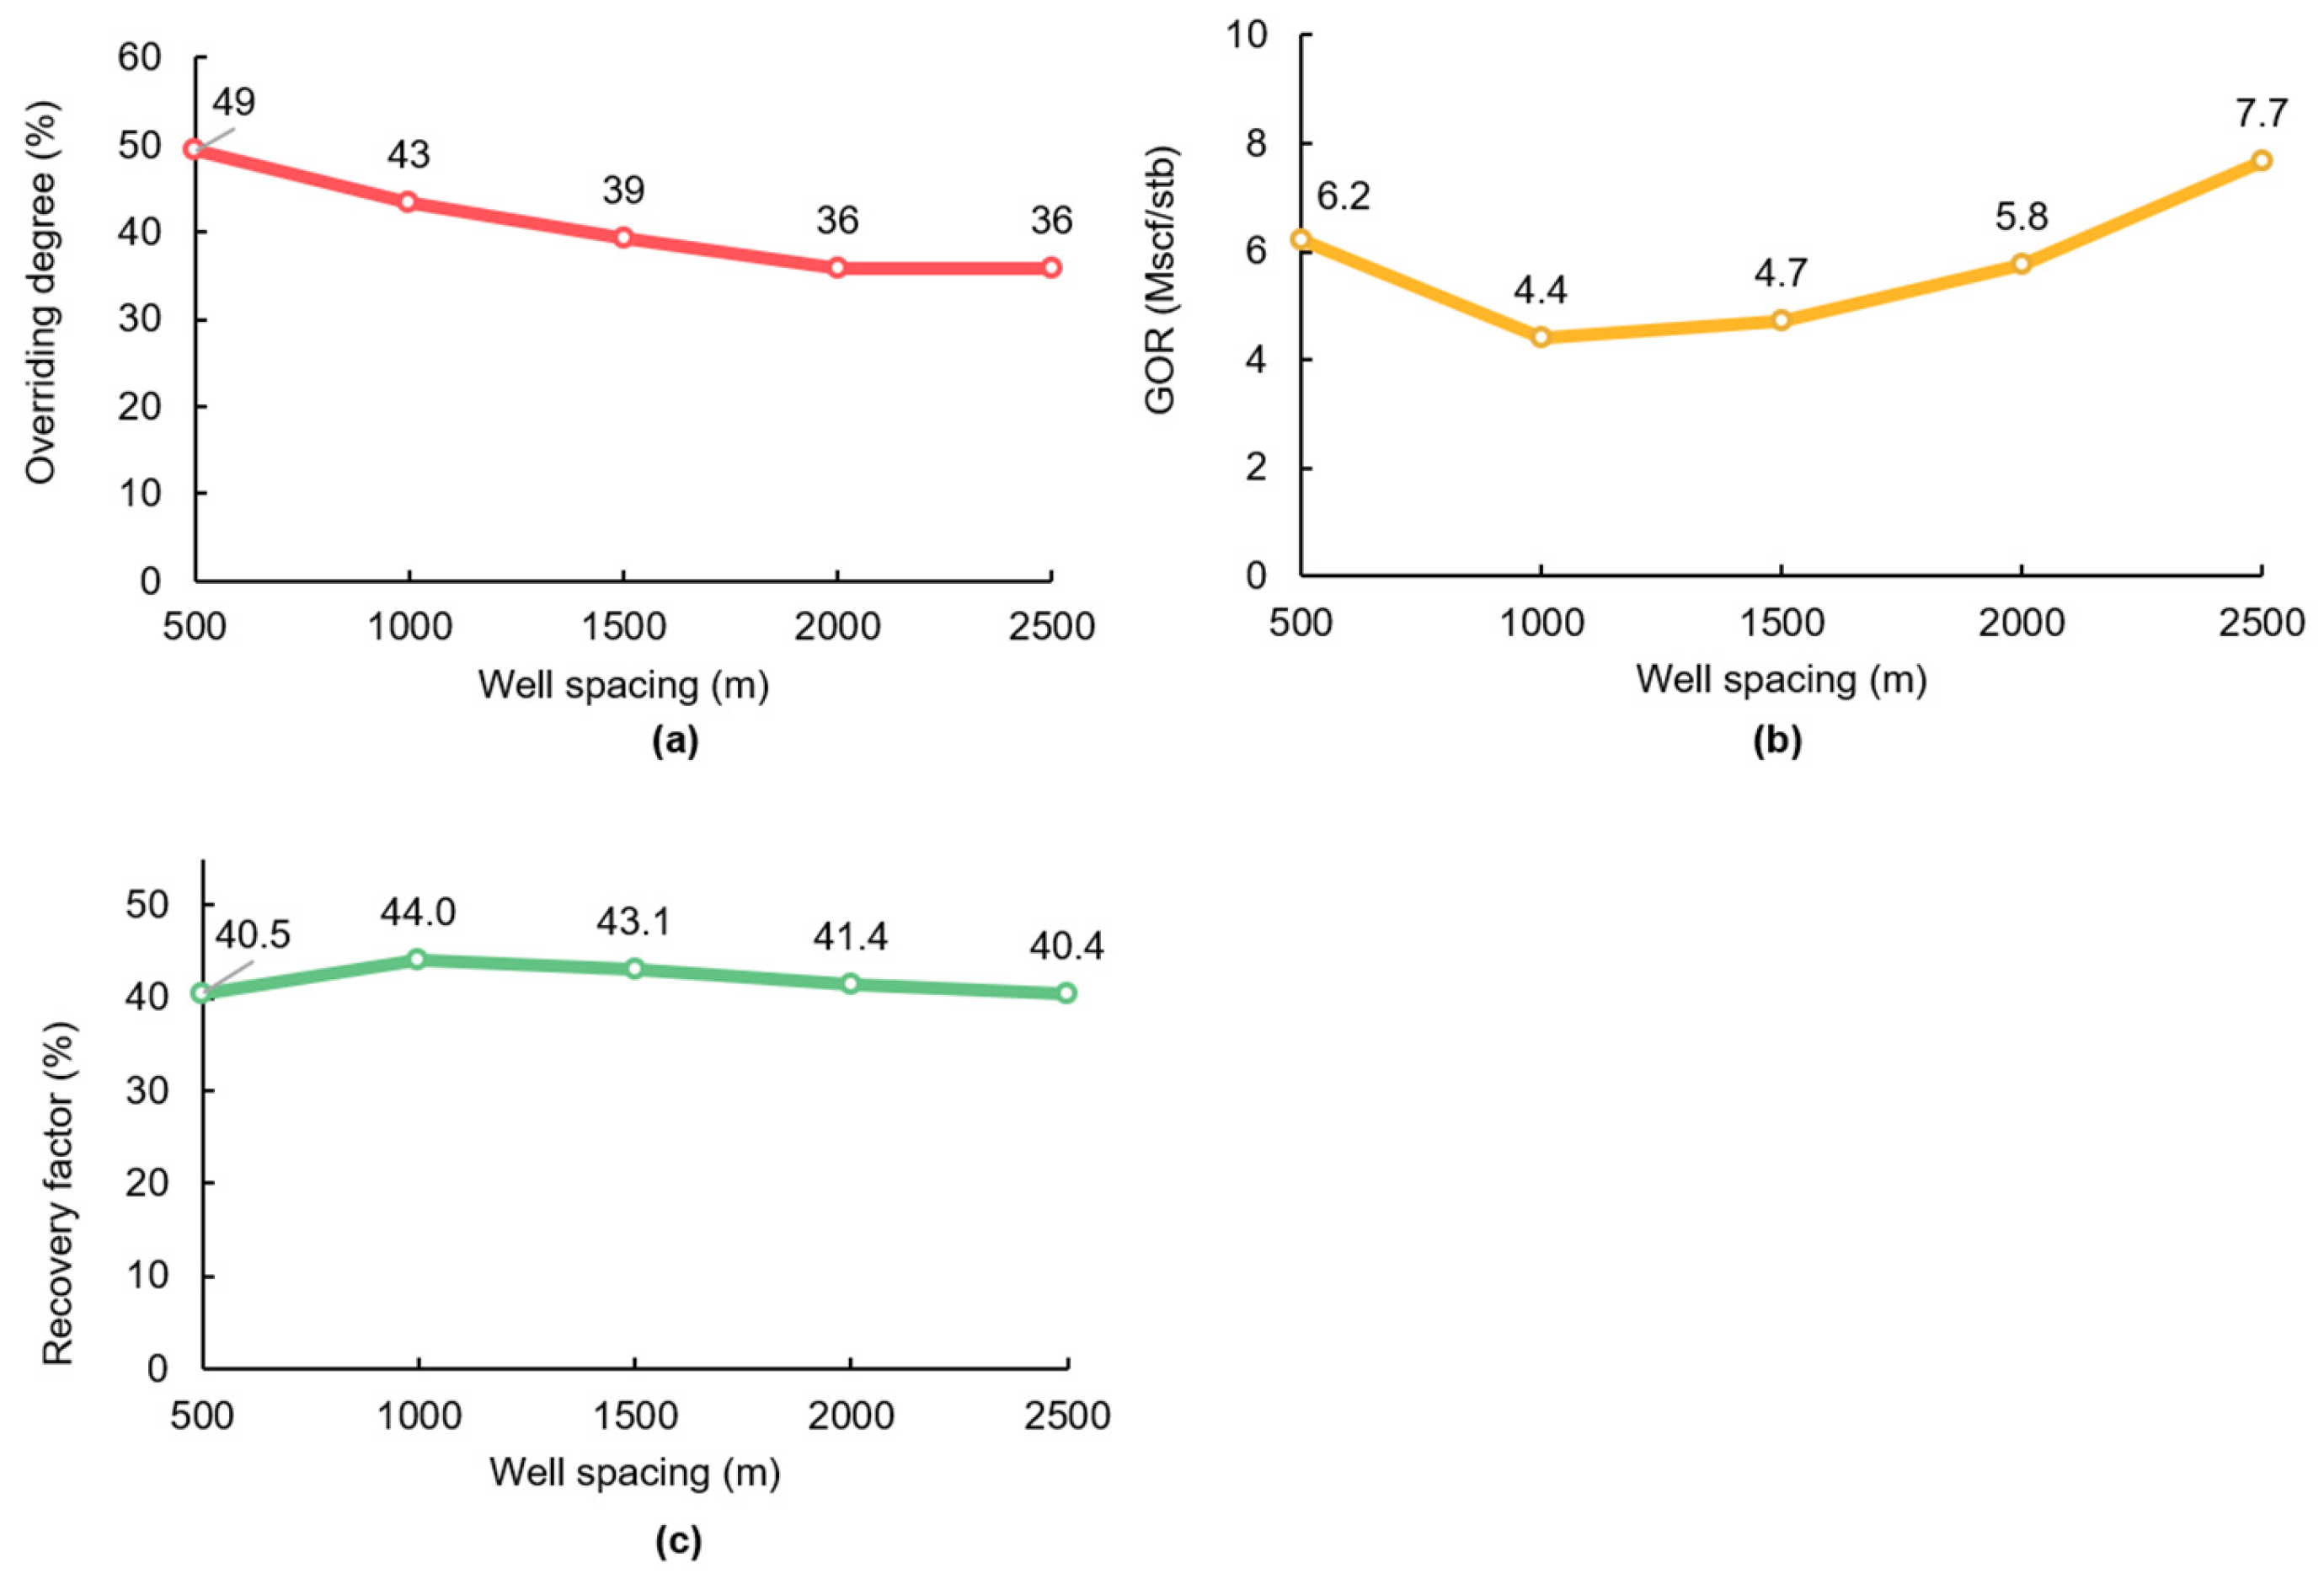
Figure 3a illustrates the variation in gravity override index under different well spacing conditions. It is observed that the gravity override index decreases with increasing well spacing. This phenomenon arises from the balance between two competing effects on vertical gas distribution under the composite permeability rhythm condition: as well spacing increases, the channeling effect along high-permeability layers gradually dominates, driving gas to deviate from the top of the reservoir and thus reducing the overall gravity override index.
As shown in
Figure 3b, the GOR at 20 years of production exhibits an inflection point at a well spacing of 1000 m, with GOR first decreasing and then increasing as well spacing enlarges. A consistent trend is observed for oil recovery factor in
Figure 3c, where recovery first rises and then falls with increasing well spacing, also featuring an inflection point at 1000 m.
The above analysis indicates that for dipping reservoirs with composite permeability rhythm under bottom injection and top production mode, gravitational force dominates when well spacing is less than 1000 m, leading to rapid gas breakthrough. As well spacing increases to 1000 m, the channeling effect along high-permeability layers strengthens gradually, offsetting part of the adverse impacts of gravity override. This balance maximizes vertical gas sweep efficiency and thus yields the highest oil recovery. When well spacing further exceeds 1000 m, gas channeling along high-permeability layers intensifies, causing a decline in the oil recovery factor.
3.1.3. Oil Production Rate
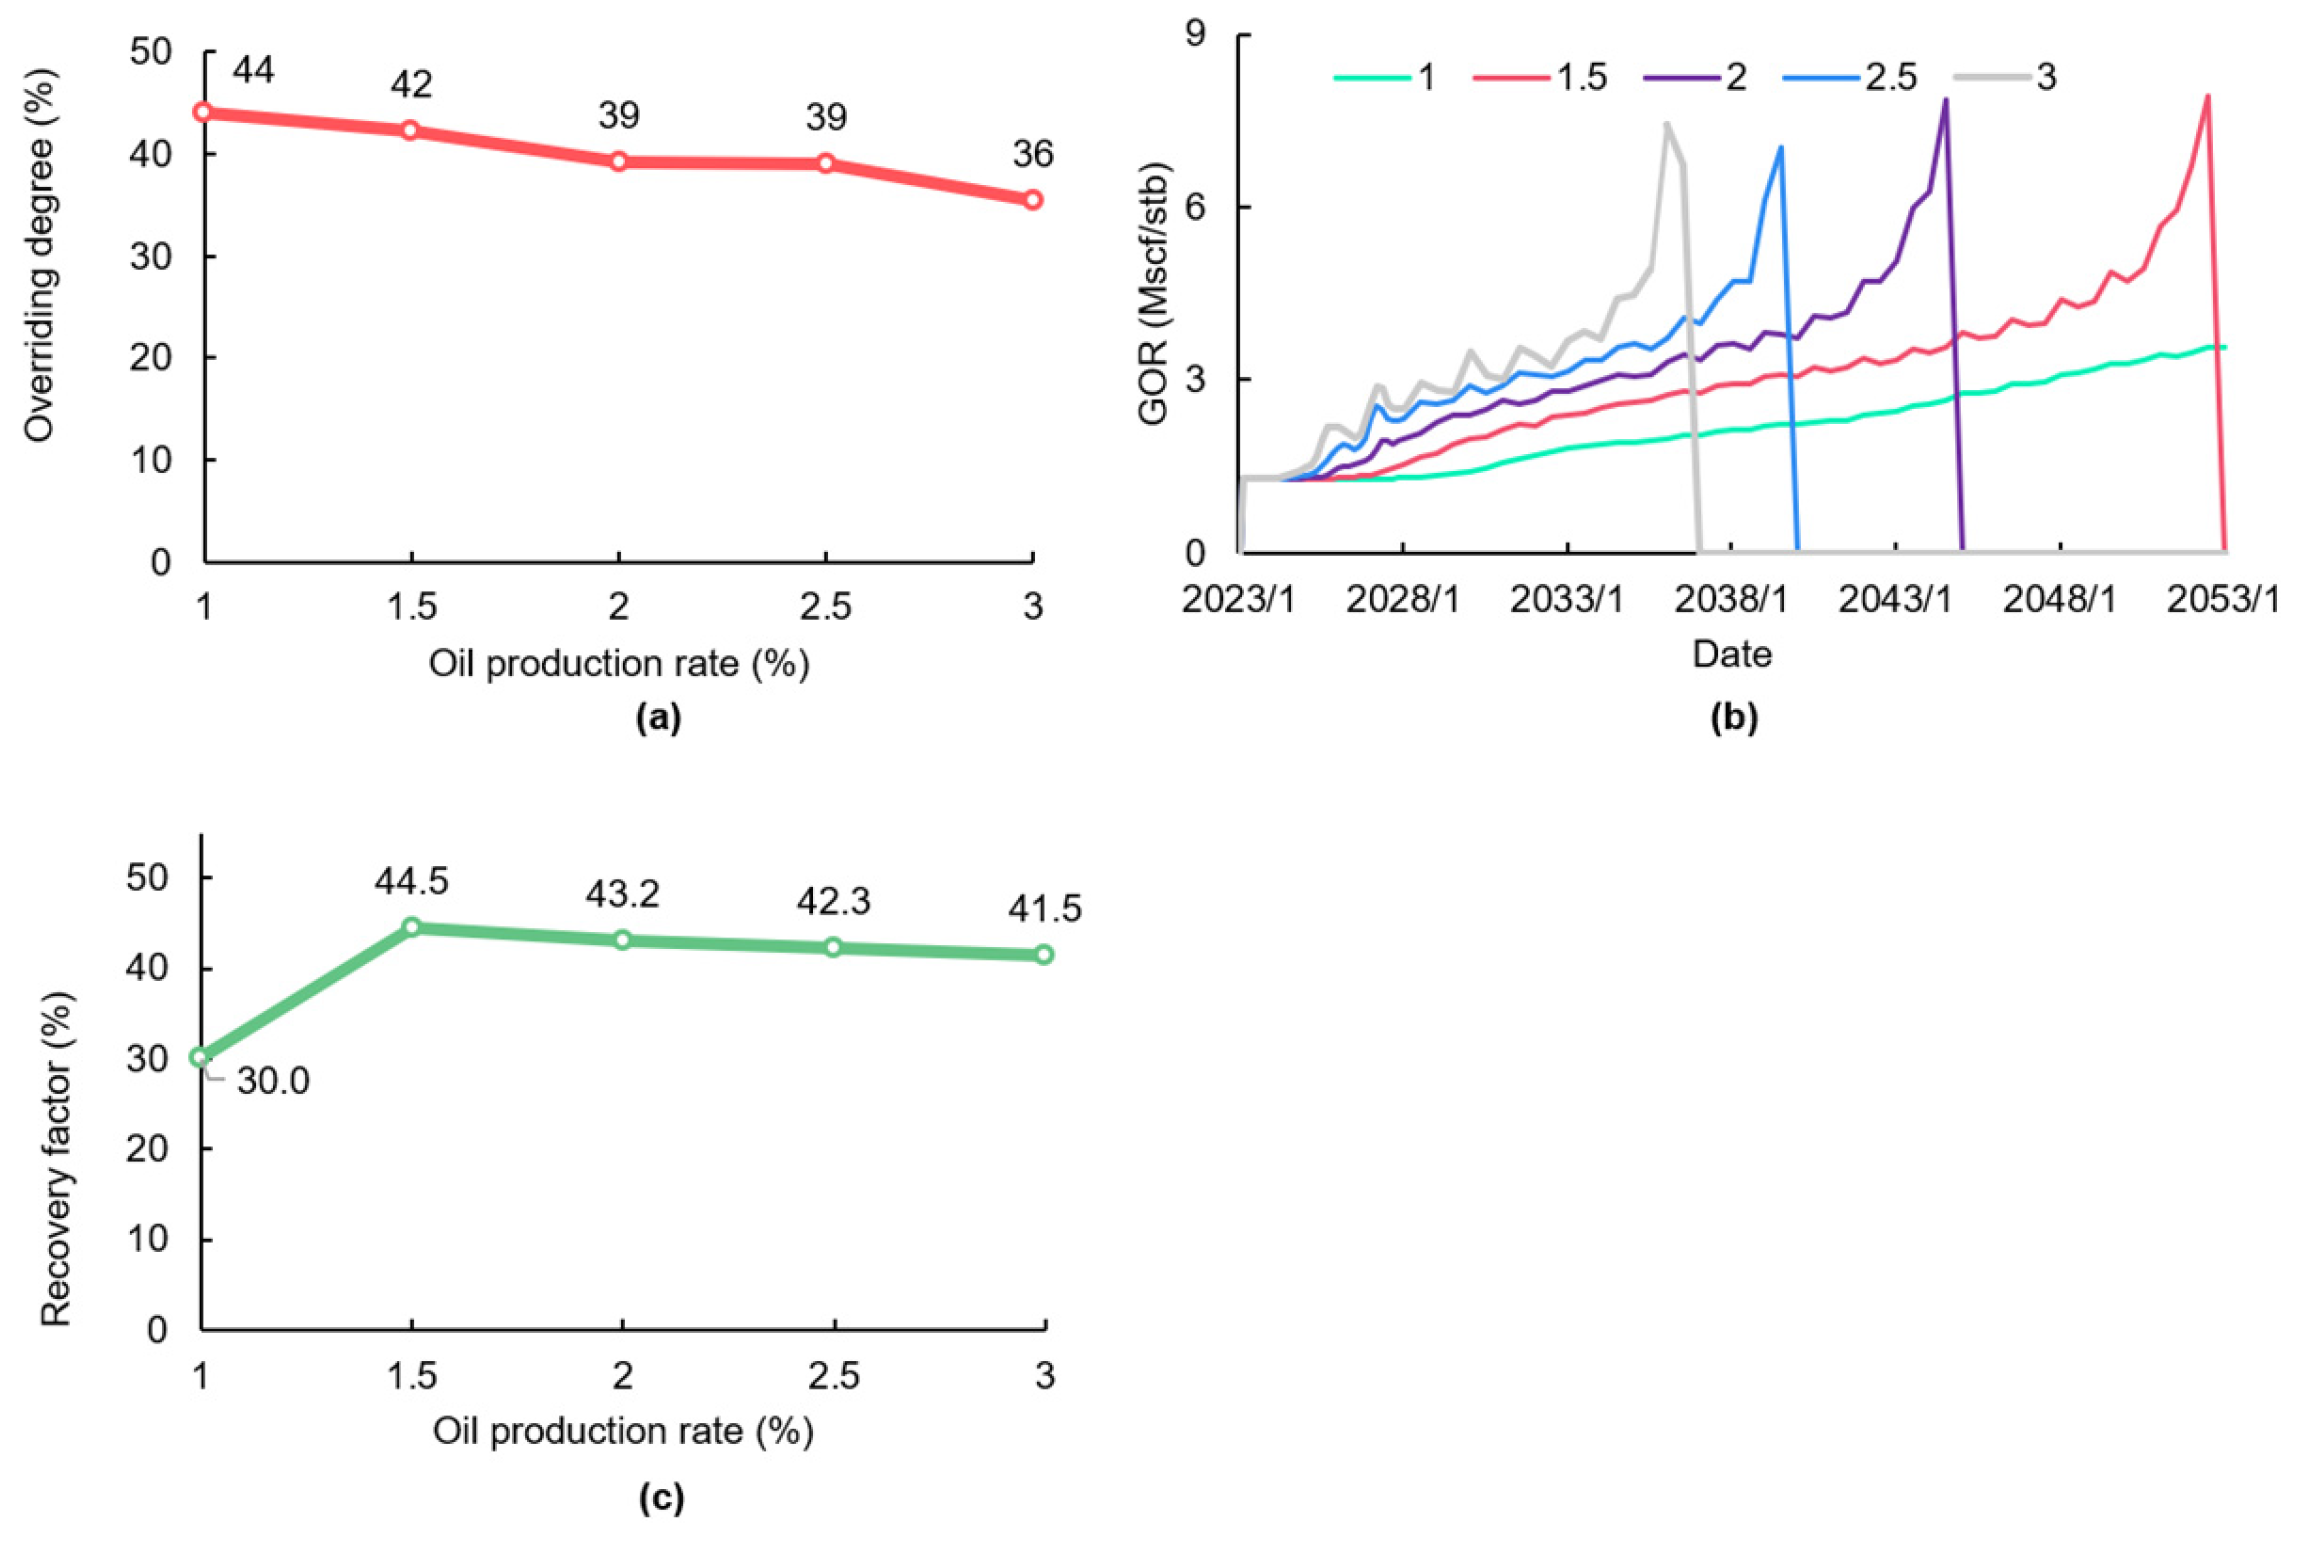
As presented in
Figure 4a, the gravity override index decreases with increasing oil production rate. This is because gravity override is a manifestation of vertical gravitational force; as oil production rate rises, the horizontal driving force is enhanced, promoting preferential horizontal migration of gas and thereby weakening gravity override.
Figure 4b shows the GOR profiles under different oil production rates. It is evident that higher oil production rates correspond to faster gas breakthrough. As shown in
Figure 4c, the oil recovery factor first increases and then decreases with the rising oil production rate, with an inflection point at 1.5%. At this critical rate, the adverse effects of gravitational and viscous forces counterbalance each other, resulting in the maximum oil recovery.
3.1.4. WAG Slug Duration
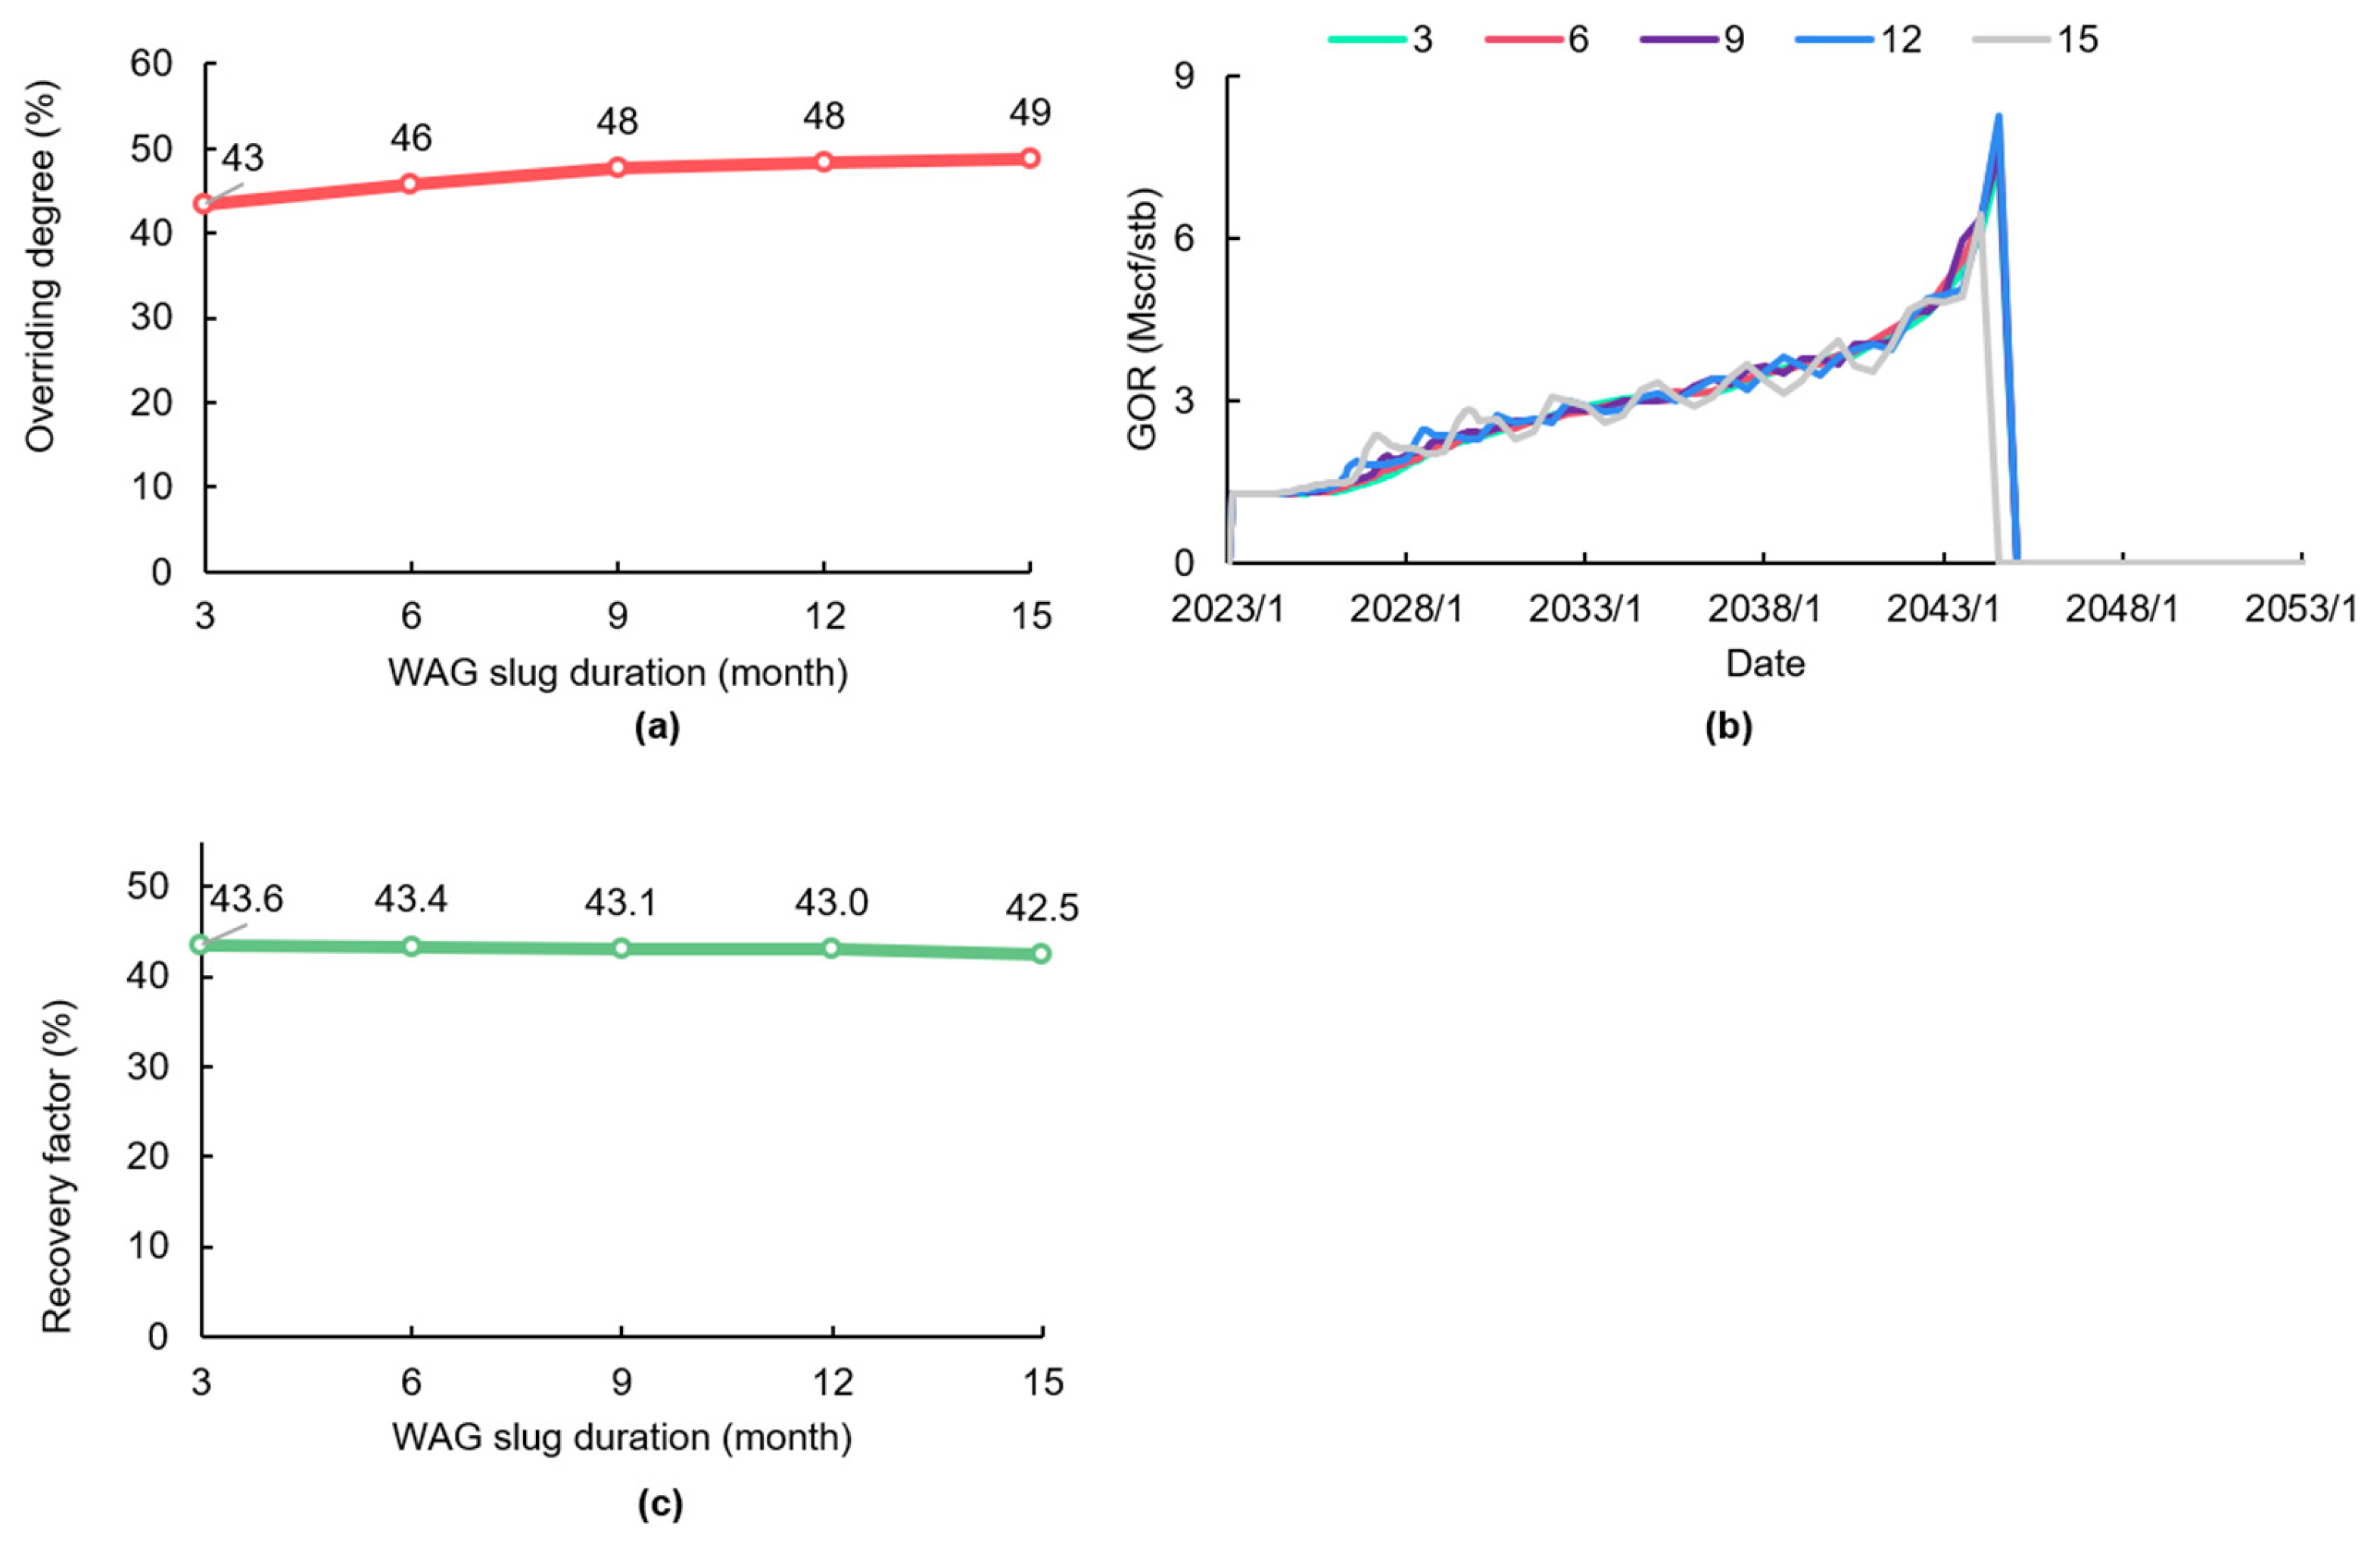
As illustrated in
Figure 5, the gravity override index increases with the extension of the WAG slug duration, while the oil recovery factor exhibits a consistent decreasing trend. It can be observed that the timing of gas breakthrough is relatively close across all slug duration scenarios. However, shorter alternating cycles effectively mitigate gravity override and expand vertical gas sweep efficiency, resulting in higher final oil recovery.
This trend is driven by the gravity segregation process. Longer gas slugs provide sufficient time for gas to accumulate at the top of the reservoir under gravitational force, aggravating gravity override. When injection switches from gas slug to water slug, the gas retained in the reservoir loses the horizontal driving force from the injection well and continues updip migration toward the production well along the upper formation under gravity dominance. Shorter WAG cycles, by contrast, deliver more frequent water slug injection to interrupt the vertical gravity segregation of gas, thus alleviating override and improving sweep performance.
3.1.5. Top Perforation Avoidance Ratio
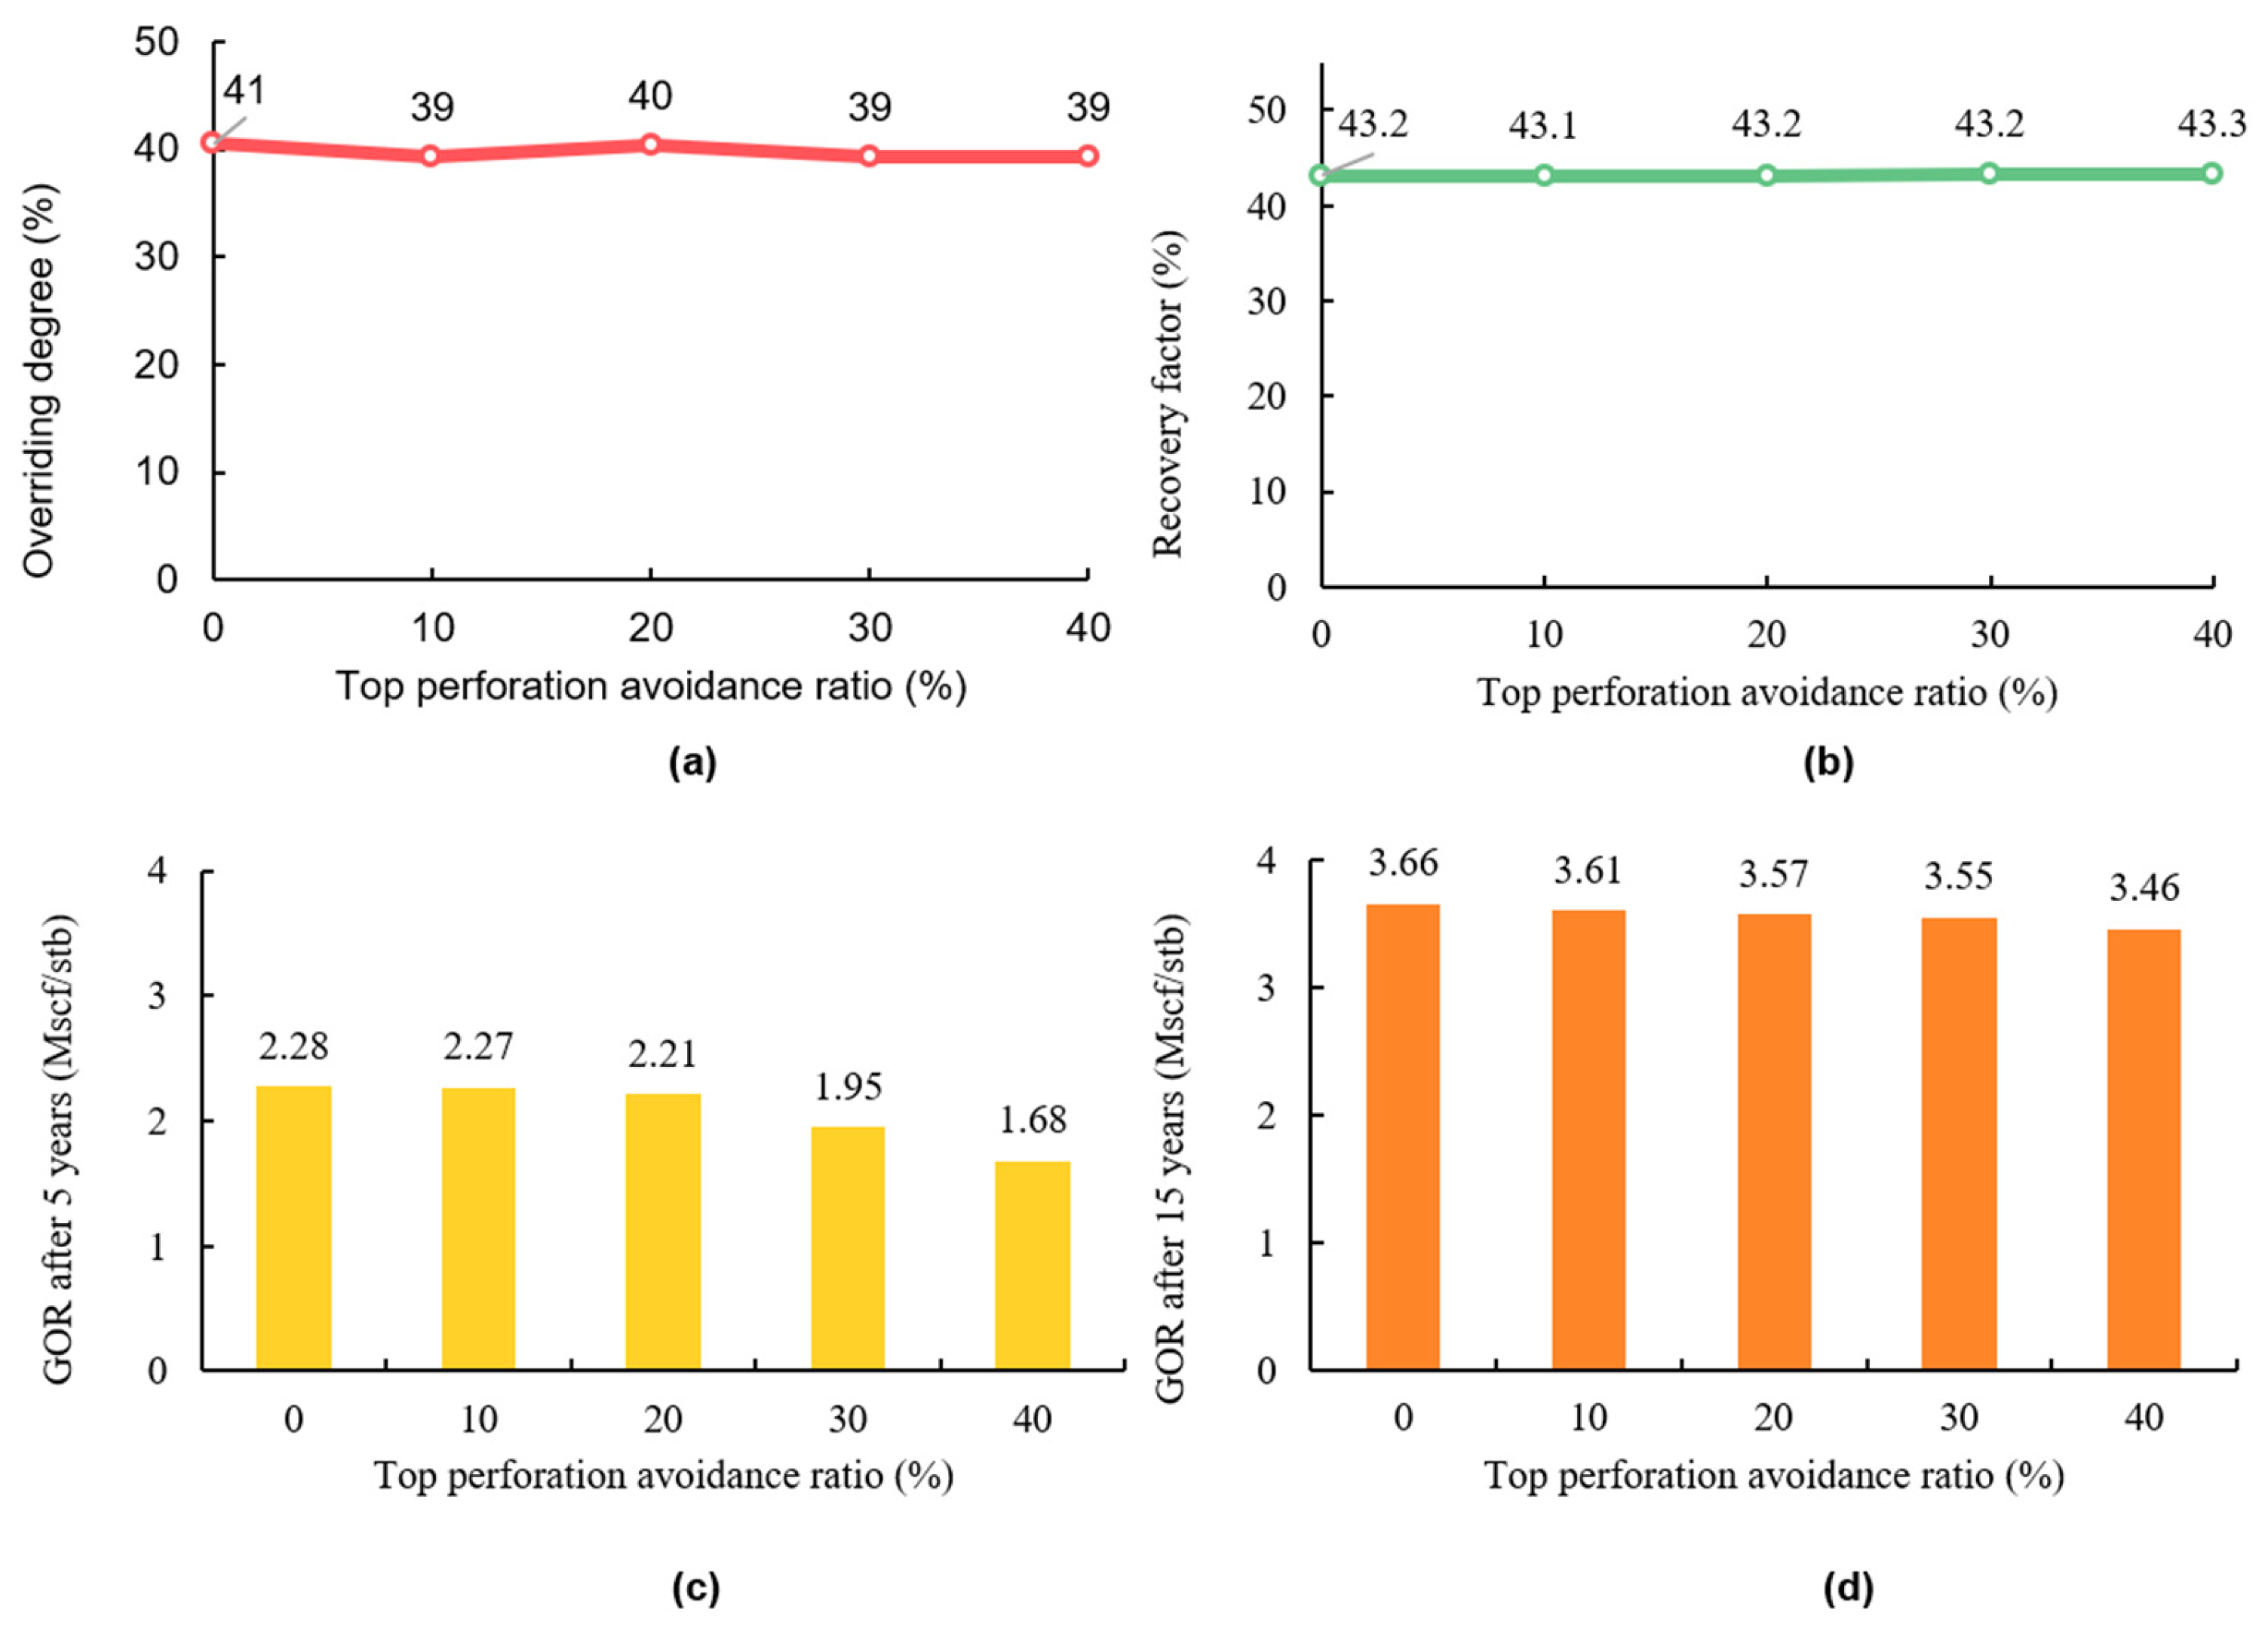
As shown in
Figure 6, variations in top perforation avoidance ratio exert minimal impacts on both gravity override index (
Figure 6a) and oil recovery factor (
Figure 6b). However, comparison of the GOR profiles at 5 years (
Figure 6c) and 15 years (
Figure 6d) of production reveals that a higher top perforation avoidance ratio can suppress rapid GOR rise in the early development stage. Specifically, the 40% perforation avoidance scheme reduces GOR by 26.3% compared with the 0% scheme at 5 years. Nevertheless, this suppression effect diminishes gradually with extended production time: the GOR reduction drops to only 5.5% at 15 years of production.
3.1.6. Perforation Adjustment Timing
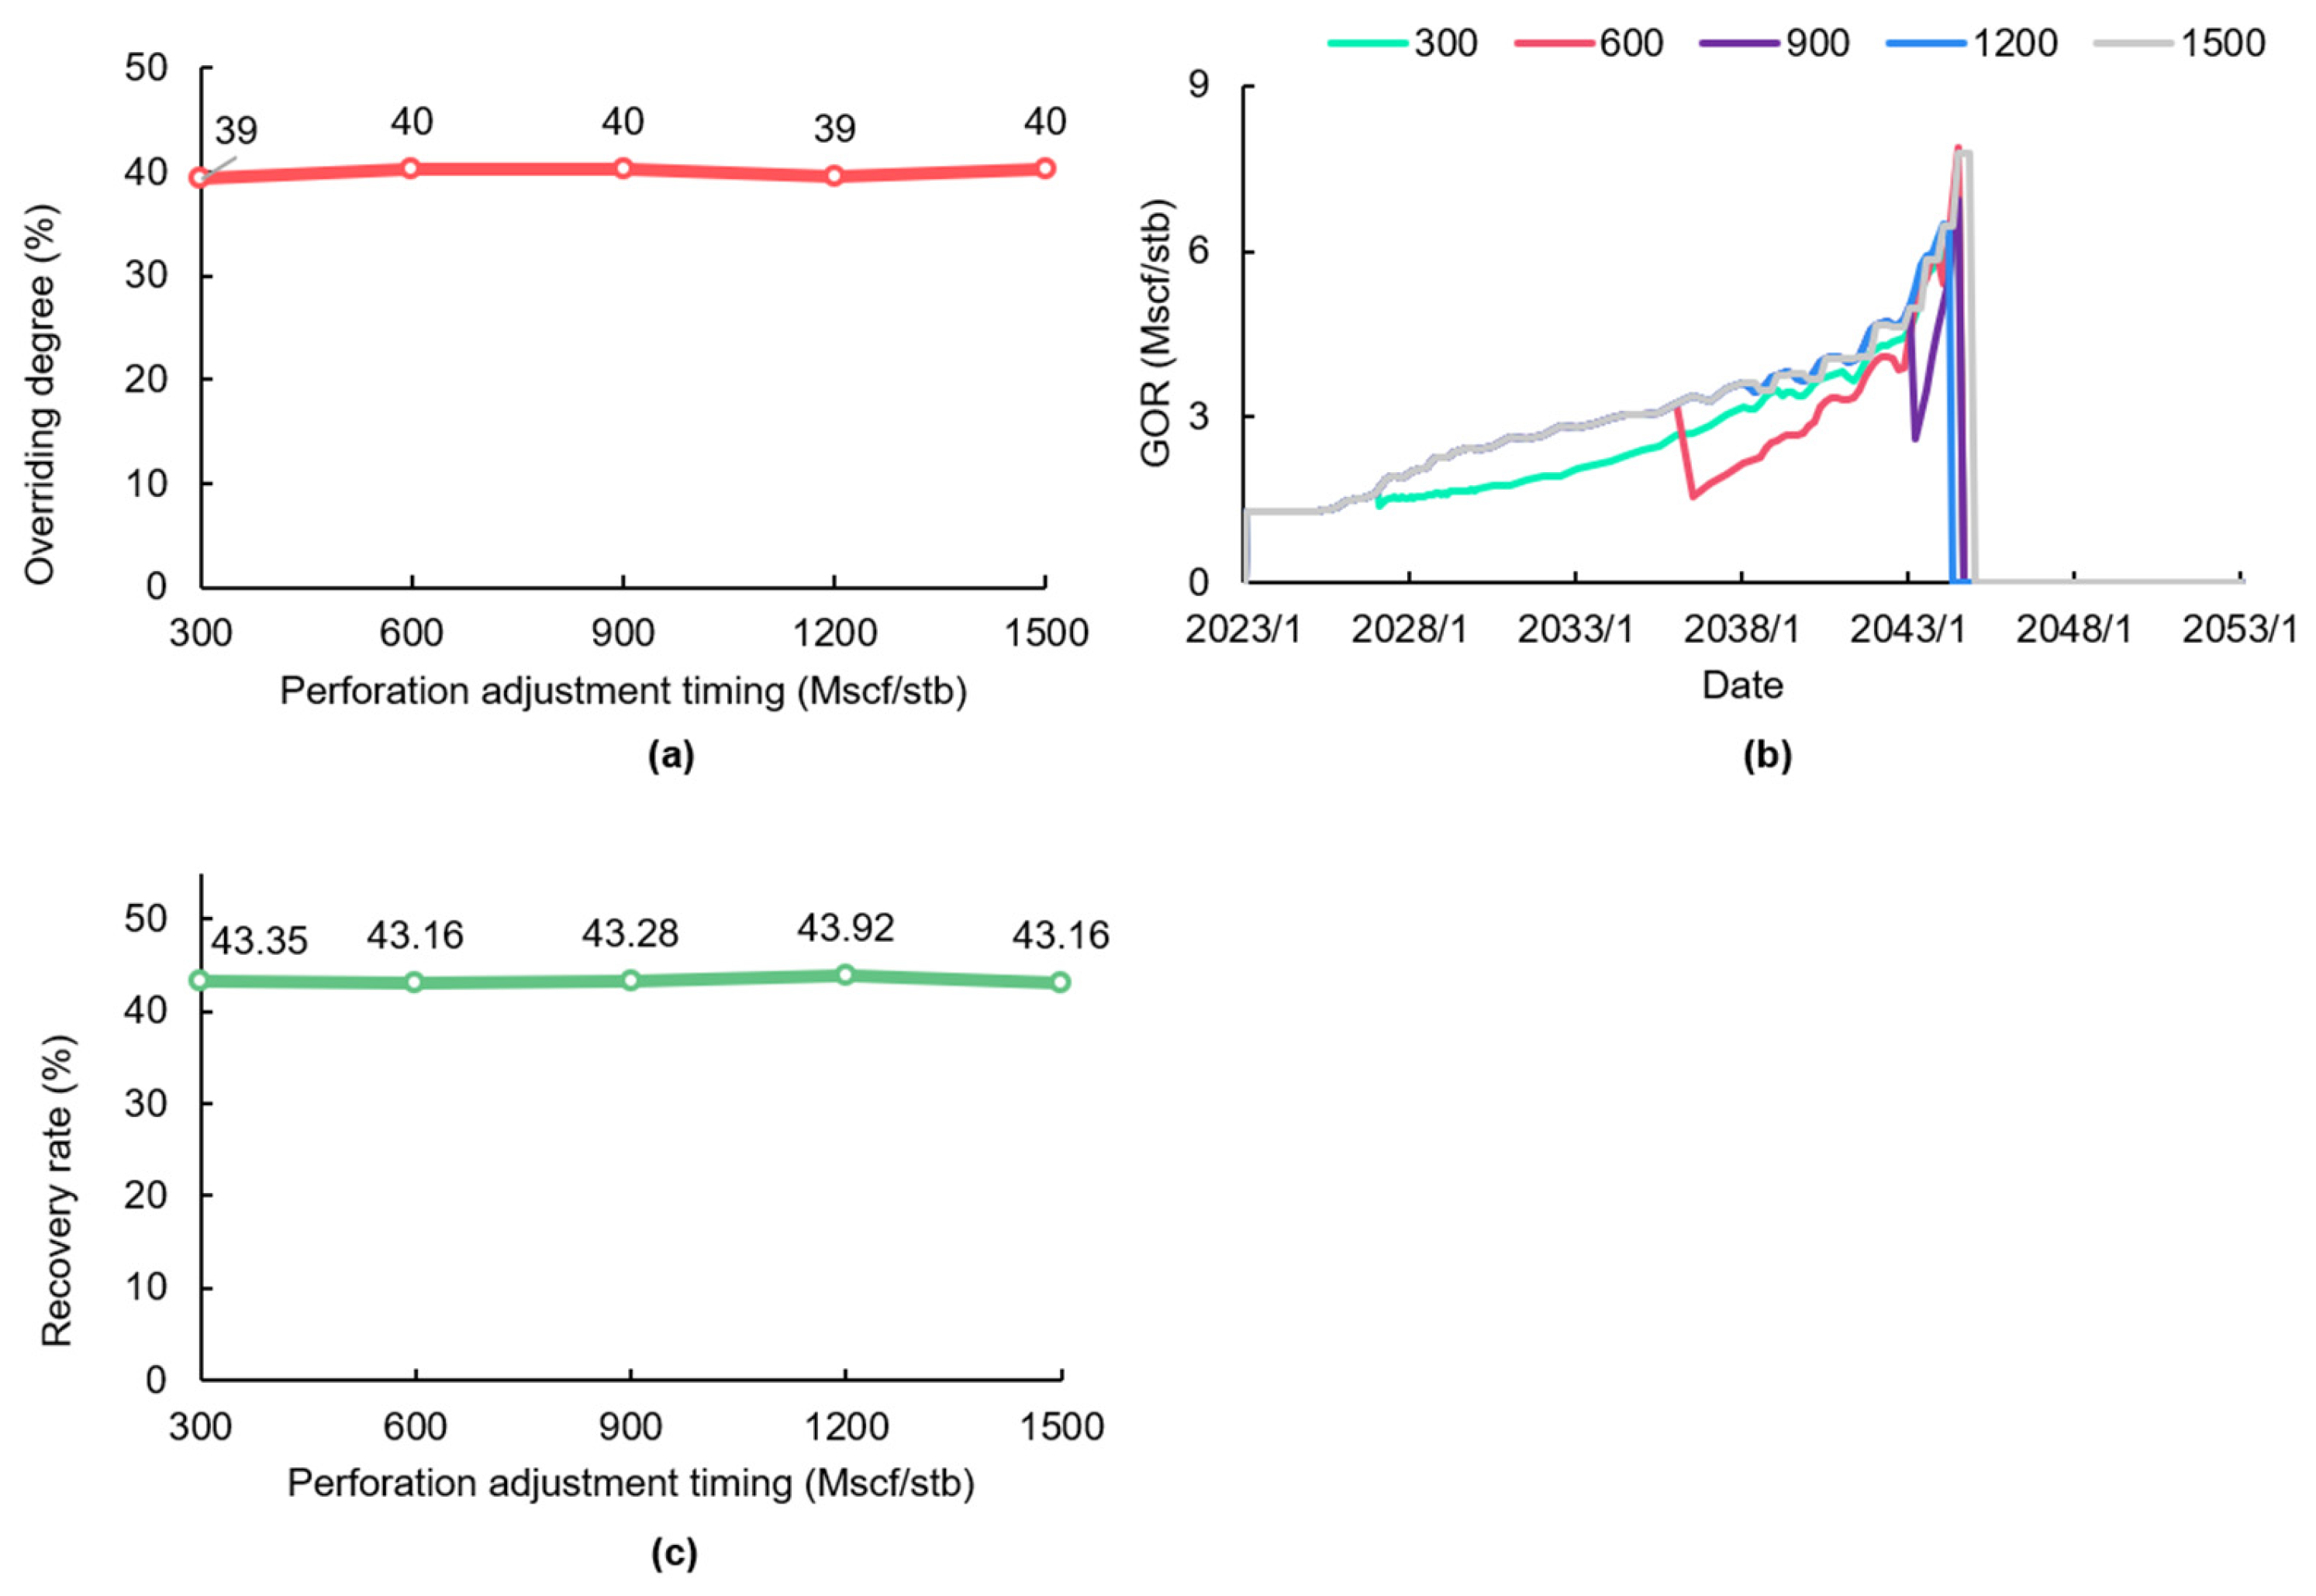
As depicted in
Figure 7, different perforation adjustment timings have negligible effects on the gravity override index (
Figure 7a) and oil recovery factor (
Figure 7c). The GOR curves (
Figure 7b) indicate that various perforation adjustment timings can cause a substantial GOR drop during the middle production stage, but the final GOR values are broadly similar across all scenarios. This is because GOR rebounds significantly after the top perforation interval is shut in.
3.2. Quantification of Influence Weights
Two XGBoost regression models were constructed with gravity override index and oil recovery factor as the respective output targets to quantify the influence weights of six operational factors and identify the dominant controlling parameters. The XGBoost models achieved in-sample fitting performance for both gravity override index and oil recovery factor, with coefficients of determination (R
2) of 0.9779 for the gravity override index and 0.9796 for the oil recovery factor, and root mean square error (RMSE) values of 0.0362 and 0.0298, respectively. To further verify the robustness of the model and rule out potential overfitting concerns, 5-fold cross-validation was performed on the dataset. The results show that the average out-of-sample R
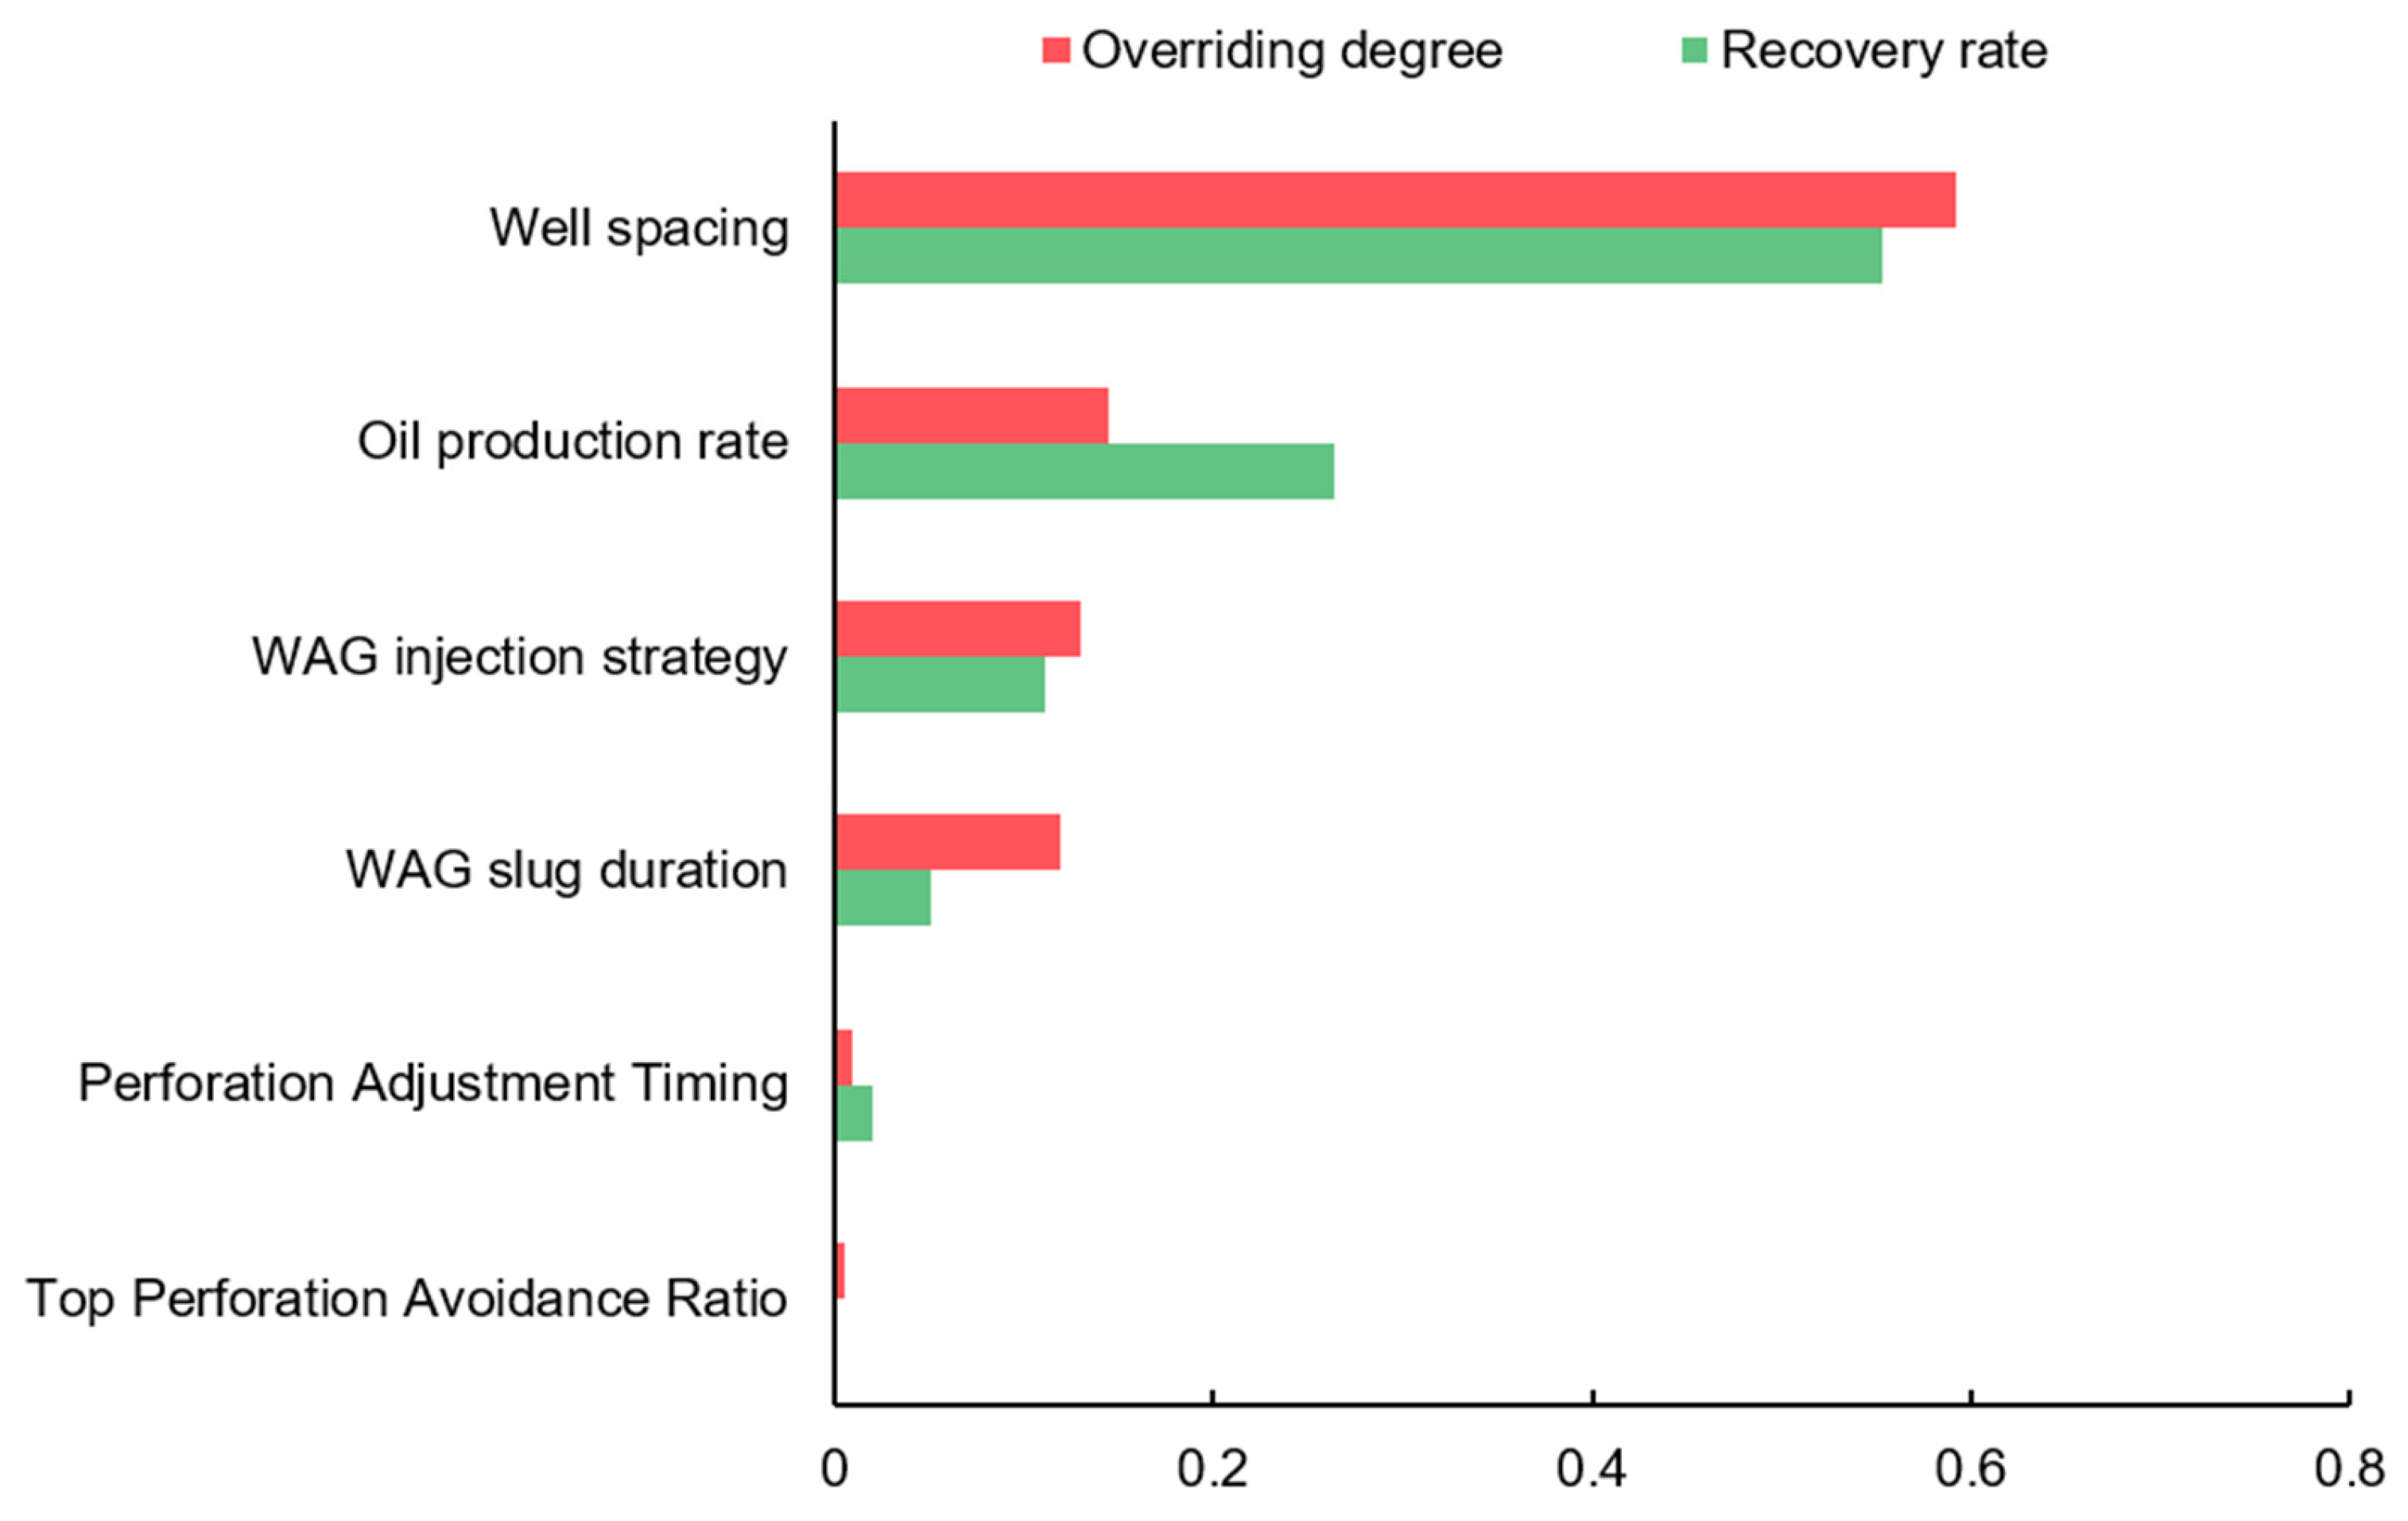
2 is 0.8525 for the gravity override index and 0.8690 for the oil recovery factor, respectively, indicating the strong generalizability of the model. Moreover, the relative ranking of feature importance remains completely consistent across all folds, confirming the high stability and reliability of the derived influence weight results. These results confirm that the models can accurately capture the nonlinear relationships between the controlling factors and the target variables, and that the calculated influence weights are therefore reliable. The weight ranking results for both indicators are presented in
Figure 8.
For the gravity override index, well spacing (0.59) is the absolutely dominant factor, followed by the oil production rate (0.14), WAG injection strategy (0.13), and WAG slug duration (0.12) as secondary dominant factors with comparable weight levels. The combined weight of these four factors exceeds 98%, indicating that they constitute the main controlling parameters of gravity override behavior in WAG flooding under the bottom injection and top production mode in ultra-thick heterogeneous reservoirs. The weights of the top perforation avoidance ratio and perforation adjustment timing are both less than 0.01, suggesting their negligible influence on the gravity override index.
For the oil recovery factor, the ranking of influence weights is generally consistent with that for the gravity override index: well spacing (0.55) remains the most dominant factor, followed by the oil production rate (0.26), WAG injection strategy (0.11), and WAG slug duration (0.05). The top perforation avoidance ratio and perforation adjustment timing still exhibit negligible weights.
The consistent weight ranking further corroborates that gravity is the core mechanism dominating the development performance of WAG flooding in ultra-thick reservoirs. For ultra-thick reservoirs with a bottom injection and top production pattern, the significant density difference between injected gas and crude oil drives strong gravity segregation: gas migrates upward and forms dominant gas channeling pathways, which not only reduces the overall vertical sweep volume but also leads to a low producing degree of remaining oil in the middle and lower layers (the lower intervals are mainly swept by water with low displacement efficiency). The weight distribution of each factor is highly consistent with this physical law, as factors directly related to gravity override (well spacing, Oil production rate) account for the highest proportion of influence weights. Meanwhile, the differences in weight magnitudes reflect that oil recovery is jointly governed by multiple displacement mechanisms: gravity override plays a decisive role, and the viscous force effect represented by the oil production rate also exerts a non-negligible supplementary impact.
4. Discussion
CCUS-EOR technologies have garnered extensive research attention in recent years, among which CO
2 water-alternating-gas (CO
2-WAG) flooding delivers prominent technical and economic advantages against the backdrop of carbon neutrality [
1,
2,
3,
21,
22]. Owing to the presence of the aqueous phase, gravity override behavior in WAG processes is inherently more complex than that in conventional pure gas flooding. Compared with recent studies on WAG flooding in carbonate reservoirs, the present work offers several distinct contributions. Previous investigations have primarily focused on reservoirs with thicknesses below 100 m [
14,
15,
16,
17,
18], whereas this study systematically examines gravity override behavior in an ultra-thick carbonate reservoir (200 m), where the vertical migration distance of injected gas is substantially larger and the override patterns are more pronounced. Furthermore, while existing studies on WAG optimization in carbonate reservoirs [
19,
20] have employed machine learning methods for proxy modeling and parameter optimization, they have not approached the problem from the perspective of quantitative gravity override characterization. By integrating a dedicated gravity override index with XGBoost-based feature importance analysis, this work provides a more mechanistic understanding of the interplay between gravitational and viscous forces, which has not been systematically addressed in prior carbonate reservoir WAG studies. To fill these research gaps, this study systematically analyzes the gravity override patterns of WAG flooding using the proposed quantitative gravity override index. Furthermore, the XGBoost algorithm is adopted to objectively quantify the influence weights of different controlling factors, and the dominant operational parameters for WAG flooding in ultra-thick reservoirs are identified.
Nevertheless, this study presents certain limitations. First, this study focuses on dipping reservoirs with composite permeability rhythm under the bottom injection and top production mode, which represents the actual geological configuration of Reservoir B. The conclusions are therefore valid and directly applicable to this reservoir type. It should be noted that under other heterogeneity conditions (e.g., different permeability rhythms or fractured systems), as well as different dip angles or reservoir thicknesses, the gravity override patterns and dominant controlling factors may vary. Future work will extend the analysis to a broader range of geological and structural conditions. Second, the current simulation cases are designed based on univariate analysis, and we have observed the gravity–viscous force counterbalance phenomenon (a typical interaction effect) during the analysis of single-factor variation laws. However, limited by the univariate experimental design, we cannot systematically decouple the independent contribution of multi-factor interaction effects. The XGBoost-derived influence weights reflect the relative importance of each factor under the current design, which is the combined result of main effects and potential interactions. In future work, we will adopt multivariate experimental designs such as Latin hypercube sampling to expand the dataset, quantitatively separate the contribution of factor interactions, and further improve the accuracy of dominant factor identification. Third, the current 30 simulation cases are designed based on univariate analysis. The limited sample size is insufficient for the high-precision prediction of development performance and cannot support systematic uncertainty quantification of influence weights. The reliability of the conclusions still needs to be further verified with a larger sample size. In future work, we will expand the dataset through multivariate experimental design, further improve the accuracy of factor importance analysis, and carry out in-depth uncertainty quantification research. Additionally, the results presented in this study are derived entirely from numerical simulations and have not been validated against laboratory experiments or field-scale data. Future work will consider incorporating experimental measurements or field monitoring data to further verify the proposed gravity override index and the identified dominant factor rankings.