Article

When a Good Photovoltaic Location Is Not Enough: Spatial–Economic Vulnerability of a 1 MW Solar Farm to Non-Market Curtailment—A Case Study from Poland


Department of Land Management, Faculty of Geoengineering, University of Warmia and Mazury in Olsztyn, 15 Prawocheńskiego St., 10-720 Olsztyn, Poland
*
Author to whom correspondence should be addressed.
Energies 2026, 19(15), 3642; https://doi.org/10.3390/en19153642
Submission received: 5 July 2026 / Revised: 26 July 2026 / Accepted: 29 July 2026 / Published: 3 August 2026
(This article belongs to the Section B: Energy and Environment)

Abstract

The rapid expansion of photovoltaic capacity in Poland has exposed distribution-grid constraints and increased the incidence of non-market curtailment. This paper examines a 1 MW ground-mounted photovoltaic plant in Zalesie, north-eastern Poland, using complete documentation. The study combines a spatial multi-criteria site-suitability assessment based on the Weighted Sum Model, a sensitivity analysis of criteria weights, an analysis of 28 curtailment compensation applications, and a transparently parameterised LCOE/NPV/IRR model under four curtailment-severity scenarios. The results indicate a high and weight-robust site-suitability score (S = 4.45/5.00; sensitivity range 4.35–4.55), with curtailment concentrated in spring: 68% in April and May. Economic modelling shows that, under merchant market conditions and without support schemes, profitability is already constrained in the baseline case (IRR 4.2–6.4%), while increasing the share of unsold energy from 0% to 10% raises LCOE by approximately 3–11% and deepens the already negative NPV by a further PLN 0.09–0.36 million. A Monte Carlo simulation confirms that the NPV stays negative across the whole plausible parameter range. This case study demonstrates that classical spatial suitability may be a necessary but insufficient condition for the economic security of PV investments unless grid-related and regulatory risks are incorporated into the planning stage.

1. Introduction

The past decade has brought an unprecedented increase in installed photovoltaic capacity in Poland: according to a report by the Institute for Renewable Energy (IEO), installed capacity reached approximately 21.16 GW by the end of 2024, placing Poland fifth in the EU in terms of new connections that year [1]. While favourable from a climate and energy-policy perspective, this dynamic has exposed the limits of grid infrastructure and of market mechanisms designed for a much smaller share of variable generation. Since 2023, the transmission system operator (Polskie Sieci Elektroenergetyczne S.A., hereafter PSE) has applied so-called non-market curtailment of photovoltaic installations at scale—administrative orders to reduce electricity generation, issued under Article 9c(7a) of the Energy Law [2]. These measures are implemented within the regulatory framework established by Regulation (EU) 2019/943 governing the internal electricity market [3]. According to an industry report of the Polish PV Association (PSF), the total volume of curtailed energy in 2024 may have risen from roughly 400 GWh to as much as 1 TWh, which—while a relatively small share of total RES generation—can reach up to 15% of the annual generation potential of large-scale PV and wind installations specifically (combined capacity exceeding 5 GW) [4].
From the perspective of spatial economy and socio-economic geography, this phenomenon carries significant implications: siting decisions for RES investments, often based on technical, environmental and cost criteria, do not fully account for the risk associated with a given grid node’s limited hosting capacity. A growing body of work on mapping grid hosting capacity [5,6,7,8] shows that such information is increasingly available technically, yet still rarely integrated into conventional RES siting procedures. As a result, assessing the profitability of a photovoltaic investment today requires combining spatial (locational) analysis with financial modelling that accounts for regulatory and grid-related risk. The specific research problem addressed here can be stated as follows: conventional site-suitability assessments certify a location as favourable on physical and infrastructural grounds, yet convey no information on the location-specific, post-connection economic risk created by non-market curtailment. To the best of the authors’ knowledge, no previous study has combined a formal spatial-suitability assessment, empirical curtailment data for an individual operating facility, and a transparent profitability model within a single analytical framework; closing this gap is the scientific contribution of the present paper.

Aim, Scope and Contribution of the Study

The aims of this paper are: (1) to conduct a spatial, multi-criteria assessment of the site suitability of a specific, operating 1 MW photovoltaic plant, together with a sensitivity analysis of the result to the adopted criteria weights; (2) to quantify the scale and temporal pattern of non-market curtailment affecting this installation, based on official settlement documentation; and (3) to estimate, within a transparently parameterised model, the impact of this phenomenon on investment profitability across four curtailment-severity scenarios.
This paper contributes to the literature in three ways. First, it links site-suitability assessment with grid-curtailment risk—two strands of research that have so far developed largely independently of one another [9,10,11,12,13,14,15,16] versus [5,17,18,19,20,21]. Second, it draws on primary documentation of compensation applications filed by the owner of an operating 1 MW installation—a type of data rarely available to researchers since non-market curtailment is most often described in the literature at the system or national level [4,5,19] rather than at the level of a single facility. Third, the paper quantifies the economic sensitivity of an unsupported (merchant) PV investment to curtailment within a transparently parameterised LCOE/NPV/IRR model, with an explicitly stated assumptions table, allowing for direct comparison with analogous international analyses [18,19]. The contribution of this paper is to integrate, for the first time, a detailed site-suitability assessment with an empirical analysis of actual curtailment events and their economic consequences within a single, transparent case-study framework.
The limitations of this study—a single facility, a partial observation period, and a modelled rather than fully metered estimate of curtailed energy—are discussed in detail in Section 6.3.

2. Literature Review

The siting of photovoltaic farms has been the subject of extensive research based on multi-criteria decision analysis (MCDA) and GIS. Under Polish conditions, the key siting criteria—distance to medium-voltage lines, soil bonitation class, absence of conflict with protected areas, and road accessibility—were identified by Kurowska et al. [9], while a formalised site-selection procedure was proposed by Stala-Szlugaj et al. [10]. In the international literature, GIS-AHP approaches have been applied in Turkey and Iraq, among other countries [11], and in Bangladesh [12], Nigeria [13] and Saudi Arabia [14], while the question of spatial conflict between solar energy and agriculture—including the potential of agrivoltaics as a mitigating solution—has been addressed in research on Great Britain [15] and in a review of geospatial planning methods for agrivoltaic systems [16]. A common feature of these studies, however, is a focus on physical, environmental and infrastructural criteria, with limited attention to risk arising from operational grid constraints that emerge only after an installation has been connected.
The economic dimension of PV operation under Polish conditions was examined by Neugebauer et al. [22] and by Ross, Matuszewska and Olczak [23], who point to the growing role of energy storage as a tool for mitigating revenue risk. Consistent conclusions, at an international scale, are drawn in studies on the techno-economic analysis of energy storage as a curtailment–mitigation tool [21,24]. The phenomenon of non-market curtailment of RES has been formally addressed in the literature by Frew et al. [18], who described the so-called curtailment paradox in the transition to high-solar-share power systems, and in more recent work on the economic implications of curtailment for delivered costs [19] and its assessment as a systemic problem or opportunity [5]. The legal framework for the compensation mechanism is set out in Article 13(7) of Regulation (EU) 2019/943 [3] and in domestic operational announcements issued by PSE [4,25]; the broader European context of redispatch costs and congestion management is presented in reports by CEER [26], JRC [27] and ACER [28], which point to an EU-wide cost of managing grid congestion on the order of several billion euros per year.
The scale and temporal pattern of non-market curtailment in Poland in 2024 was documented in an industry report of the PSF [4,29]. An analogous phenomenon in Germany—a sharp, 97% year-on-year increase in curtailed solar energy in 2024 (to 1389 GWh) and a more than one-hundred-fold increase in the number of hours with negative prices—is described in a Fraunhofer ISE report [30], indicating that the phenomenon under study is not a Polish peculiarity but part of a broader European pattern linked to the so-called cannibalisation of solar electricity prices during midday production peaks [1,30]. This paper draws on all of the above strands of the literature, integrating them at the level of a single, real research object.

3. Study Area and Data

The subject of the analysis is the ground-mounted photovoltaic plant Zalesie 1, with an installed capacity of up to 1 MW, located on cadastral plot No. 137 in the village of Zalesie (Nurzec-Stacja municipality, Siemiatycze County, Podlaskie Voivodeship, Poland). The total plot area is 3.13 ha, of which up to 2.61 ha in the central and southern part of the property was allocated to the PV installation. The site is not covered by a local zoning plan—the investment was implemented on the basis of a final zoning-conditions decision (WZ) and a final environmental-conditions decision (DS).
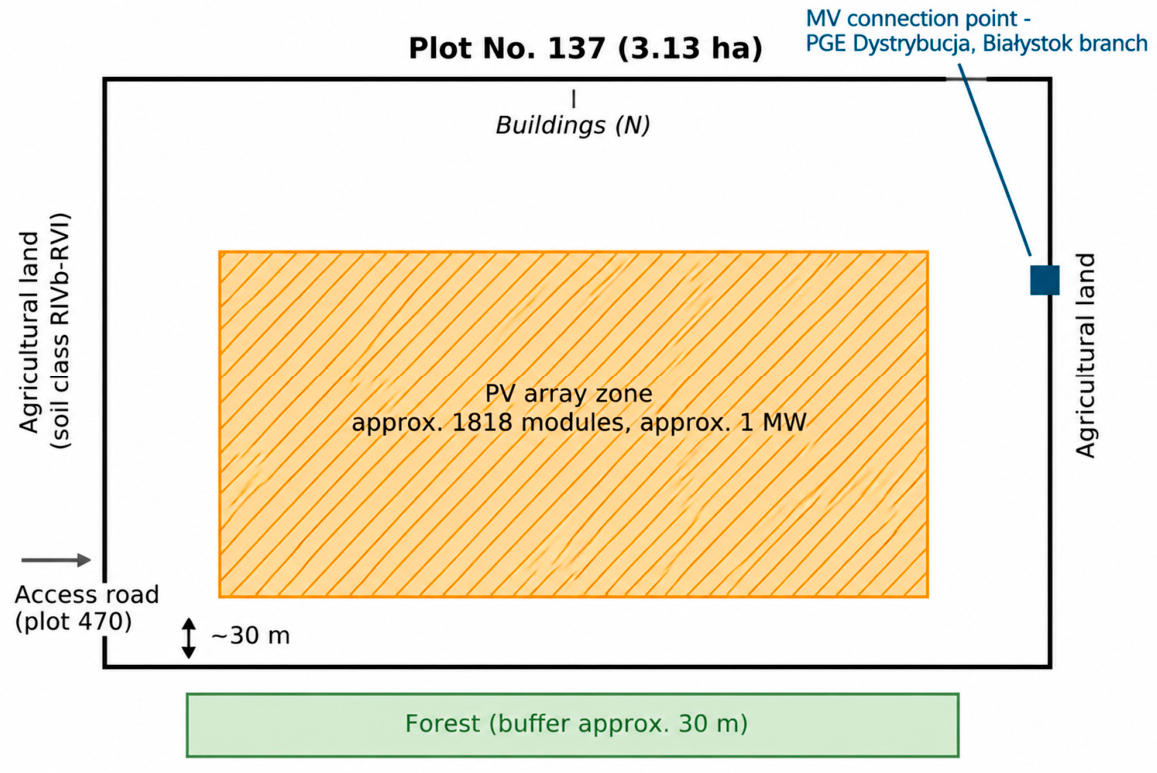
The land had previously been used for agriculture, with soils classified as bonitation classes RIVb, RV and RVI—i.e., soils of low agricultural suitability—a fact of importance for minimising the spatial conflict between agricultural and energy production, consistent with criteria favoured in the literature on PV and agrivoltaic siting [9,15,16]. As present Figure 1 the nearest forest complex lies approximately 30 m from the southern boundary of the plot; the site is not covered by any form of nature protection. It should nonetheless be noted that, although the installation occupies low-bonitation land and was authorised through a valid zoning-conditions (WZ) and environmental decision without recorded community objections, land-use conflict and social acceptance remain significant non-technical barriers to PV deployment; the favourable land status of this particular site therefore cannot be generalised to all locations.
The installation comprises 1818 bifacial monocrystalline photovoltaic modules (999.9 kWp DC/801 kW AC, DC/AC ratio approx. 1.25); the principal technical and investment characteristics of the facility are summarised in Table 1. Grid connection was implemented under conditions set by PGE Dystrybucja S.A., Bialystok Branch, at the medium-voltage level. Construction works (turnkey EPC contract) were carried out under a lump-sum net contract value of PLN 3,039,800.00 (approx. PLN 3040/kWp net). All electricity generated is sold on market terms (day-ahead market, DAM), without any support scheme—the installation benefits from neither the auction system nor certificates of origin, meaning its revenues are fully exposed to market-price risk and to the risk of non-market curtailment.
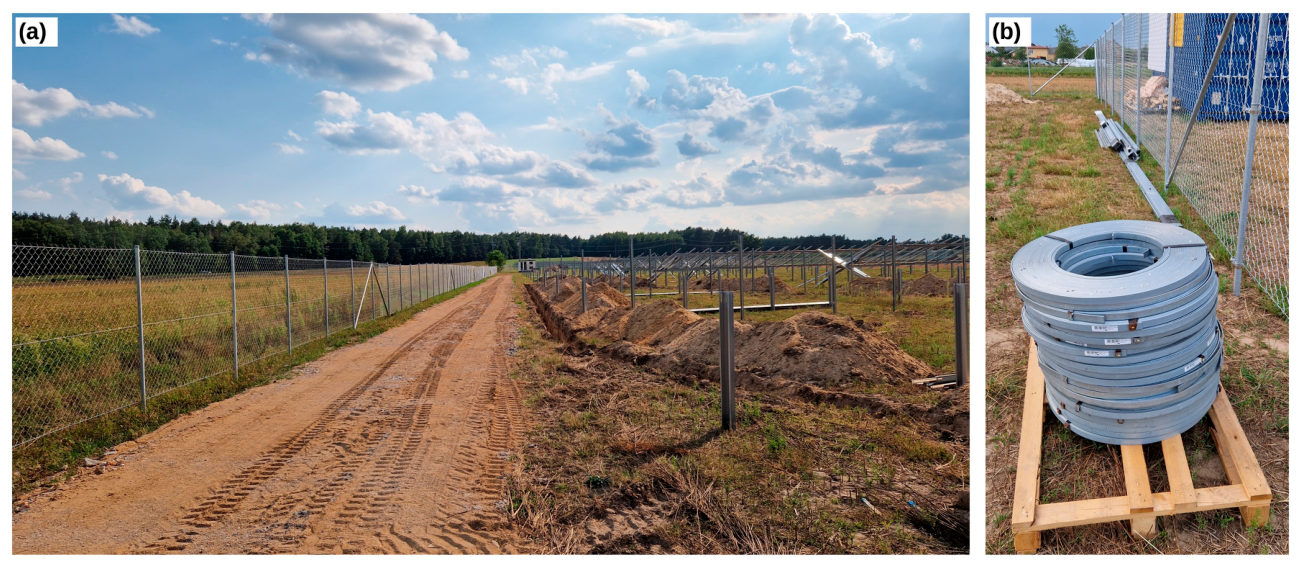
A more detailed technical description of the plant is as follows. The generator is built from 1818 bifacial monocrystalline PERC modules (Ulica Solar UL-550M-144HV, 550 Wp, manufactured by Ningbo Ulica Solar Science & Technology Co., Ltd., Ningbo, China); their main electrical and thermal parameters are given in Table 2. Direct current is converted by three transformerless multi-MPPT string inverters (SungrowPower Supply Co., Ltd., Hefei, China, 2 × SG333HX and 1 × SG125HX; Table 3), providing a combined nominal AC power of 791 kW—the value of about 800 kW used elsewhere in this paper denotes the plant’s design AC capacity, consistent with the DC/AC ratio of approximately 1.25 in Table 1. The array is a fixed-tilt, south-oriented ground-mounted system on driven-pile steel structures (maximum height 4 m), configured as three sub-arrays, each connected to one inverter, and operating at a 1500 V DC system voltage. The plant is connected to the medium-voltage grid through a 1000 kVA oil-immersed transformer (15.75/0.8 kV, vector group Dyn5). Representative photographs of the installation are shown in Figure 2.
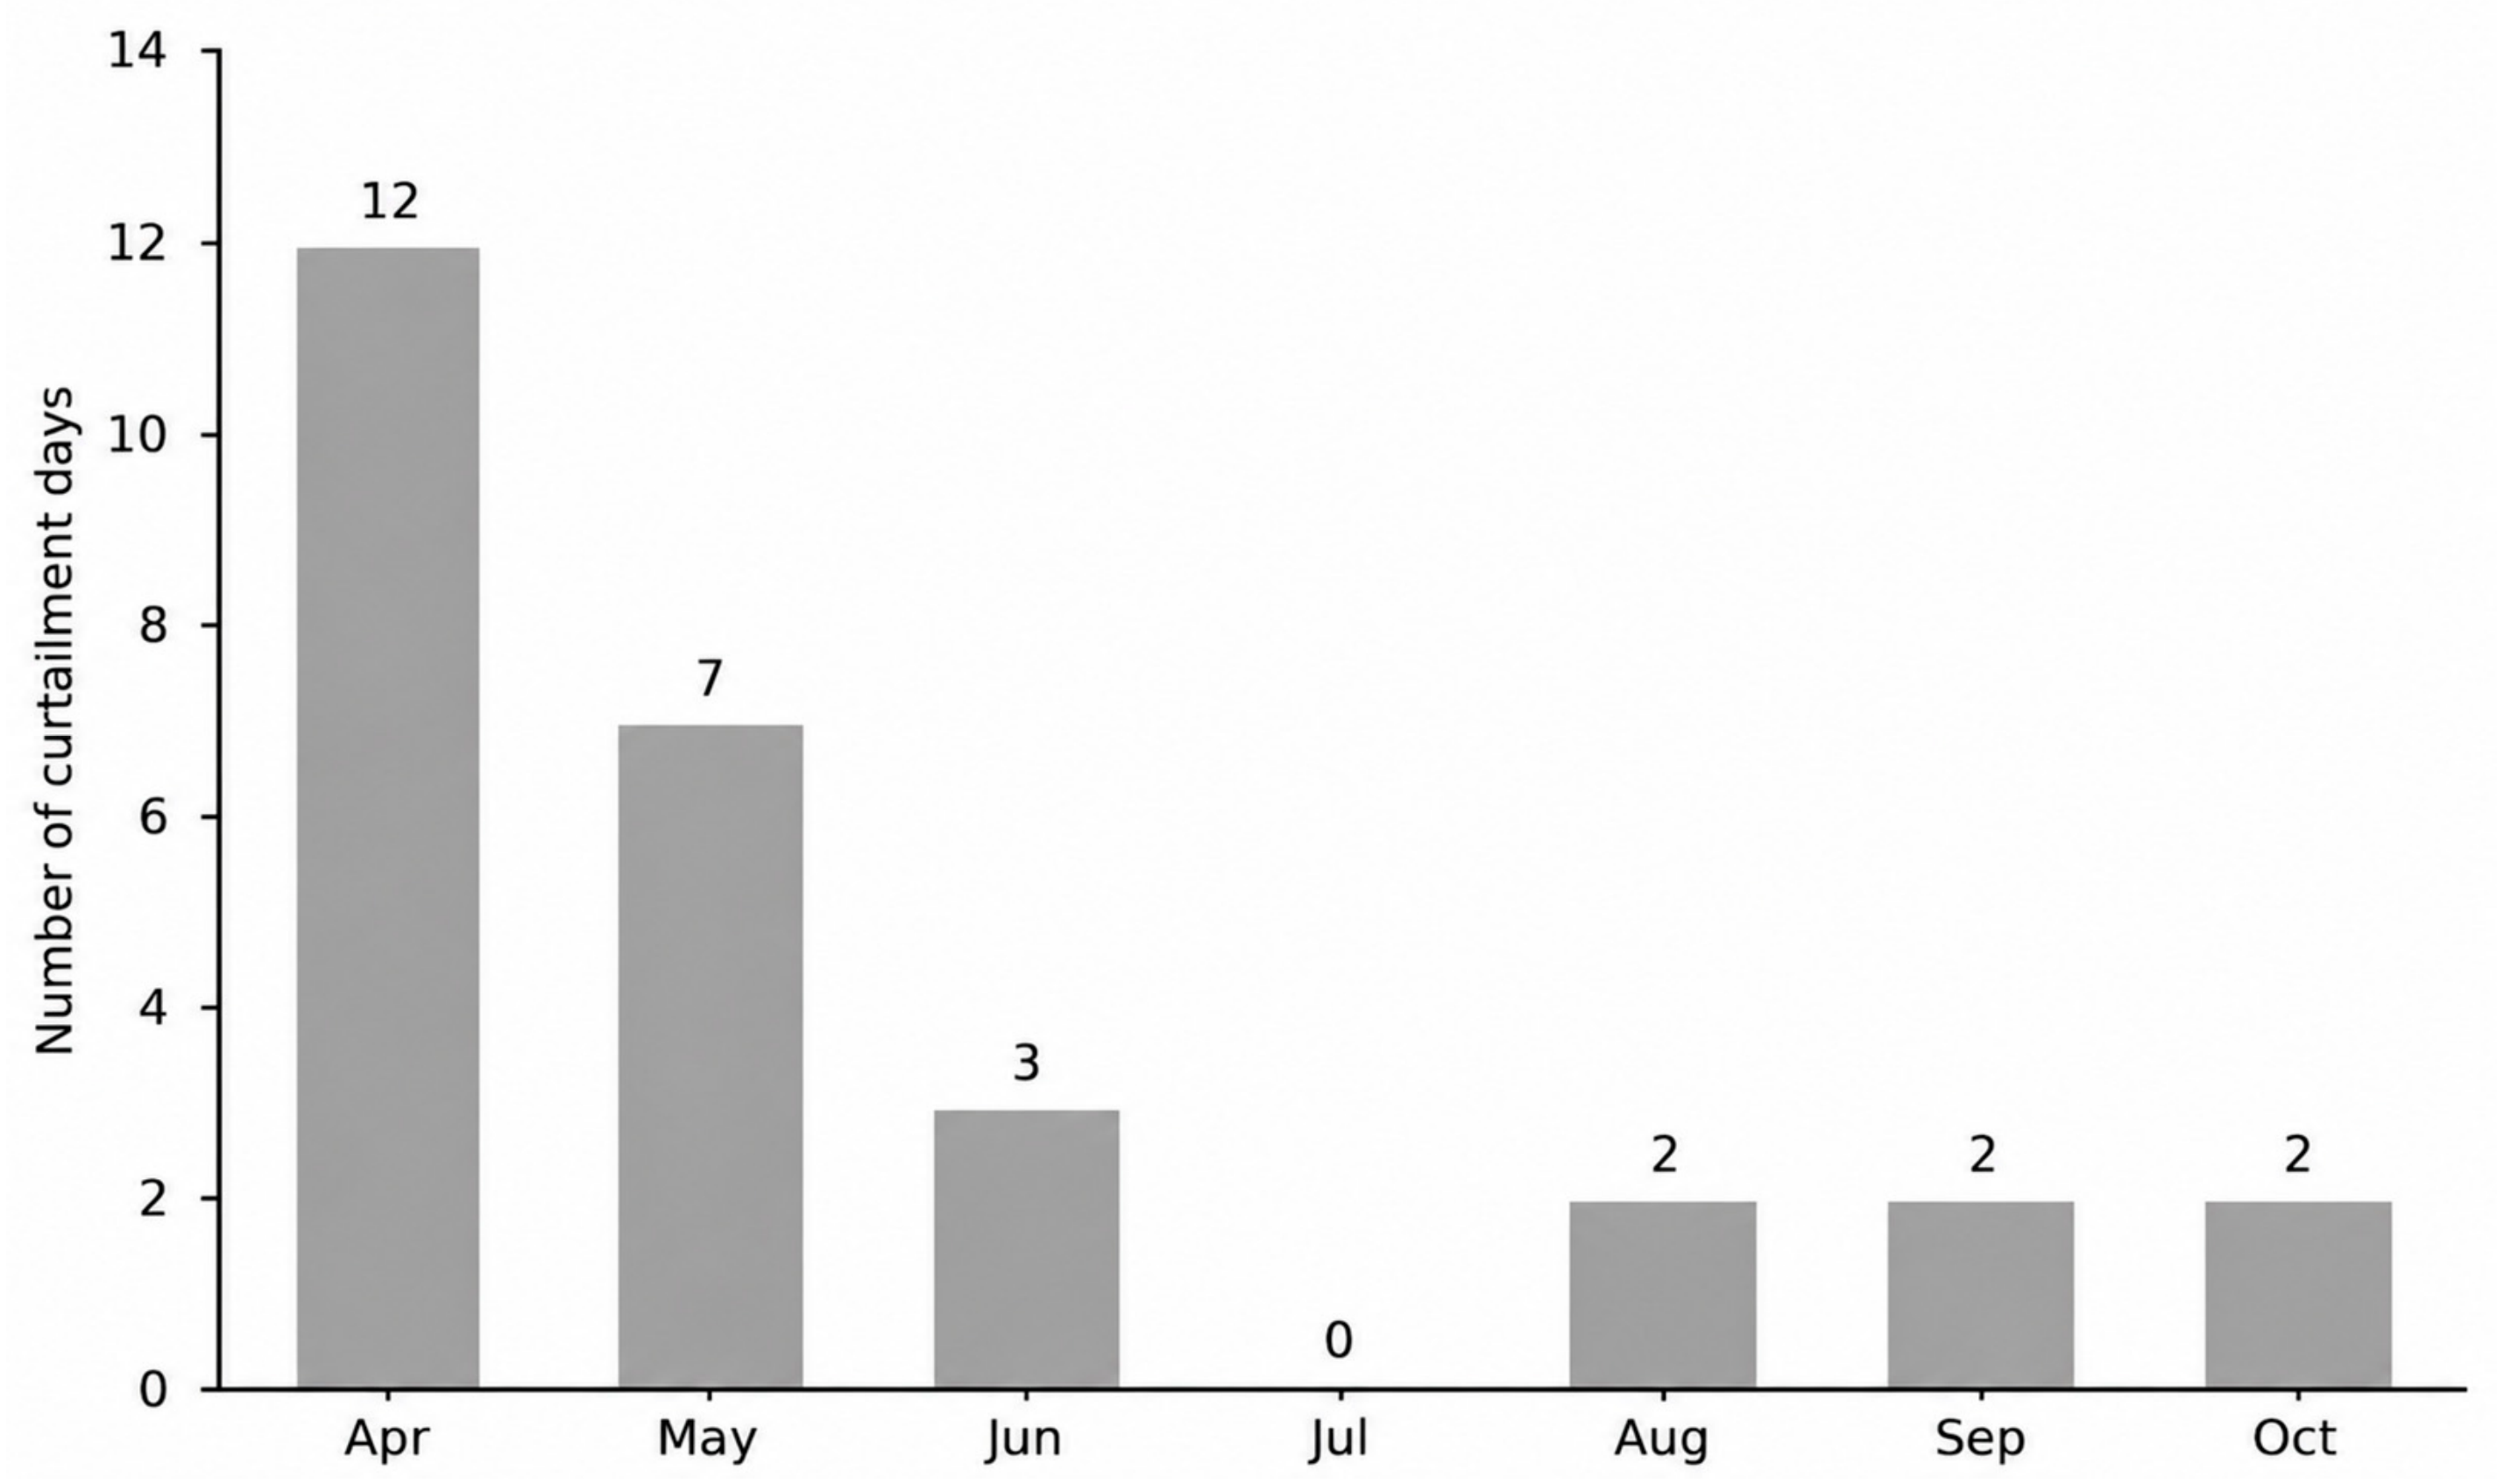
The principal data source on non-market curtailment is a set of 28 compensation applications filed with PSE between 1 April and 17 October 2024. Each application contains confirmed data on installed capacity (DC and AC) at 15 min resolution and, where available, solar irradiance measurements. Personal and identifying data of the applicant were excluded from the analysis in accordance with the principle of data minimisation. It should be stated clearly: this documentation confirms the fact and date of curtailment but does not contain a directly metered value of energy not generated—that figure is calculated centrally by the Settlement Administrator from DSO telemetry data not fully disclosed to the generator. The implications of this data limitation for the adopted methodology are discussed in Section 4.3. The principal characteristics of the non-market curtailment dataset are summarised in Table 4.
Table 4. Number of non-market curtailment days for the Zalesie 1 installation, by month (April–October 2024). Percentage and cumulative shares of the 28 recorded events are reported to provide information complementary to Figure 3.
MonthAprilMayJuneJulyAugustSeptemberOctober
Curtailment days12730222
Share of events [%]42.925.010.70.07.17.17.1
Cumulative share [%]42.967.978.678.685.792.9100.0

4. Methods

4.1. Spatial Multi-Criteria Site-Suitability Assessment (WSM) and Sensitivity Analysis

Site suitability was assessed using the Weighted Sum Model (WSM), widely applied in RES siting studies [9,10,11,12,13,14]:
S = i = 1 n w i x i ,     i = 1 n w i = 1
where wi is the weight of criterion i, xi is the partial score on an ordinal 1–5 scale, and n is the number of criteria (n = 5, Table 5). The set of criteria and their weights follows the established Polish PV-siting literature [9,10] combined with expert judgment: soil bonitation is assigned the highest weight because, under Polish permitting conditions, it is decisive for the scale of land-use conflict, while distance to the medium-voltage grid ranks second owing to its direct bearing on connection cost and technical feasibility.
In methodological terms, each criterion i is first scored on a common ordinal scale from 1 (least favourable) to 5 (most favourable), so that criteria originally expressed in different physical units (e.g., metres of grid distance, soil bonitation class, degrees of orientation) are mapped onto a single, dimensionless preference scale; this ordinal scoring constitutes the normalisation step of the procedure. The partial scores are then aggregated by the additive (compensatory) rule of Equation (1)—a weighted linear combination in which the weights are non-negative and constrained to sum to unity. Because the aggregate is a convex combination of scores bounded on the 1–5 scale, the overall index S is itself bounded on the same scale and remains directly comparable across sites and weighting schemes; a high score on one criterion can partially compensate a low score on another, which is the defining property of the Weighted Sum Model.
The provenance of the criteria and weights is threefold. The criteria set reflects, first, the statutory and regulatory framework governing PV siting in Poland (protection of higher-class agricultural soils, connection conditions issued by the distribution system operator, and environmental and road-access decisions); second, the peer-reviewed siting literature [9,10,11,12,13,14]; and third, the documented physical characteristics of the study area. Within these bounds the numerical weights were assigned by expert judgment and then stress-tested through the weight-sensitivity and leave-one-out analyses reported in Section 5.1 (Table 6), which confirm that the ranking is robust to the precise weight values.
For transparency and reproducibility, the ordinal 1–5 score of each criterion is assigned according to explicit rules (Table 7) rather than by unconstrained judgment.
The sensitivity of the result to the scores themselves was also examined. A ±1 change applied to any single criterion score keeps S within 4.15–4.30, and a simultaneous −1 shift of all five scores lowers S only to 3.45, still above the midpoint of the scale; the high suitability of the site is therefore not an artefact of the exact scores. A formal weight-elicitation procedure such as the Analytic Hierarchy Process (AHP) would be a natural refinement of the expert weighting used here; given that the weight-sensitivity analysis (Table 6), the leave-one-out test (Section 5.1) and the score-perturbation test above all leave the ranking in the upper part of the scale, the substitution of AHP for the present weights would be unlikely to change the qualitative conclusion.
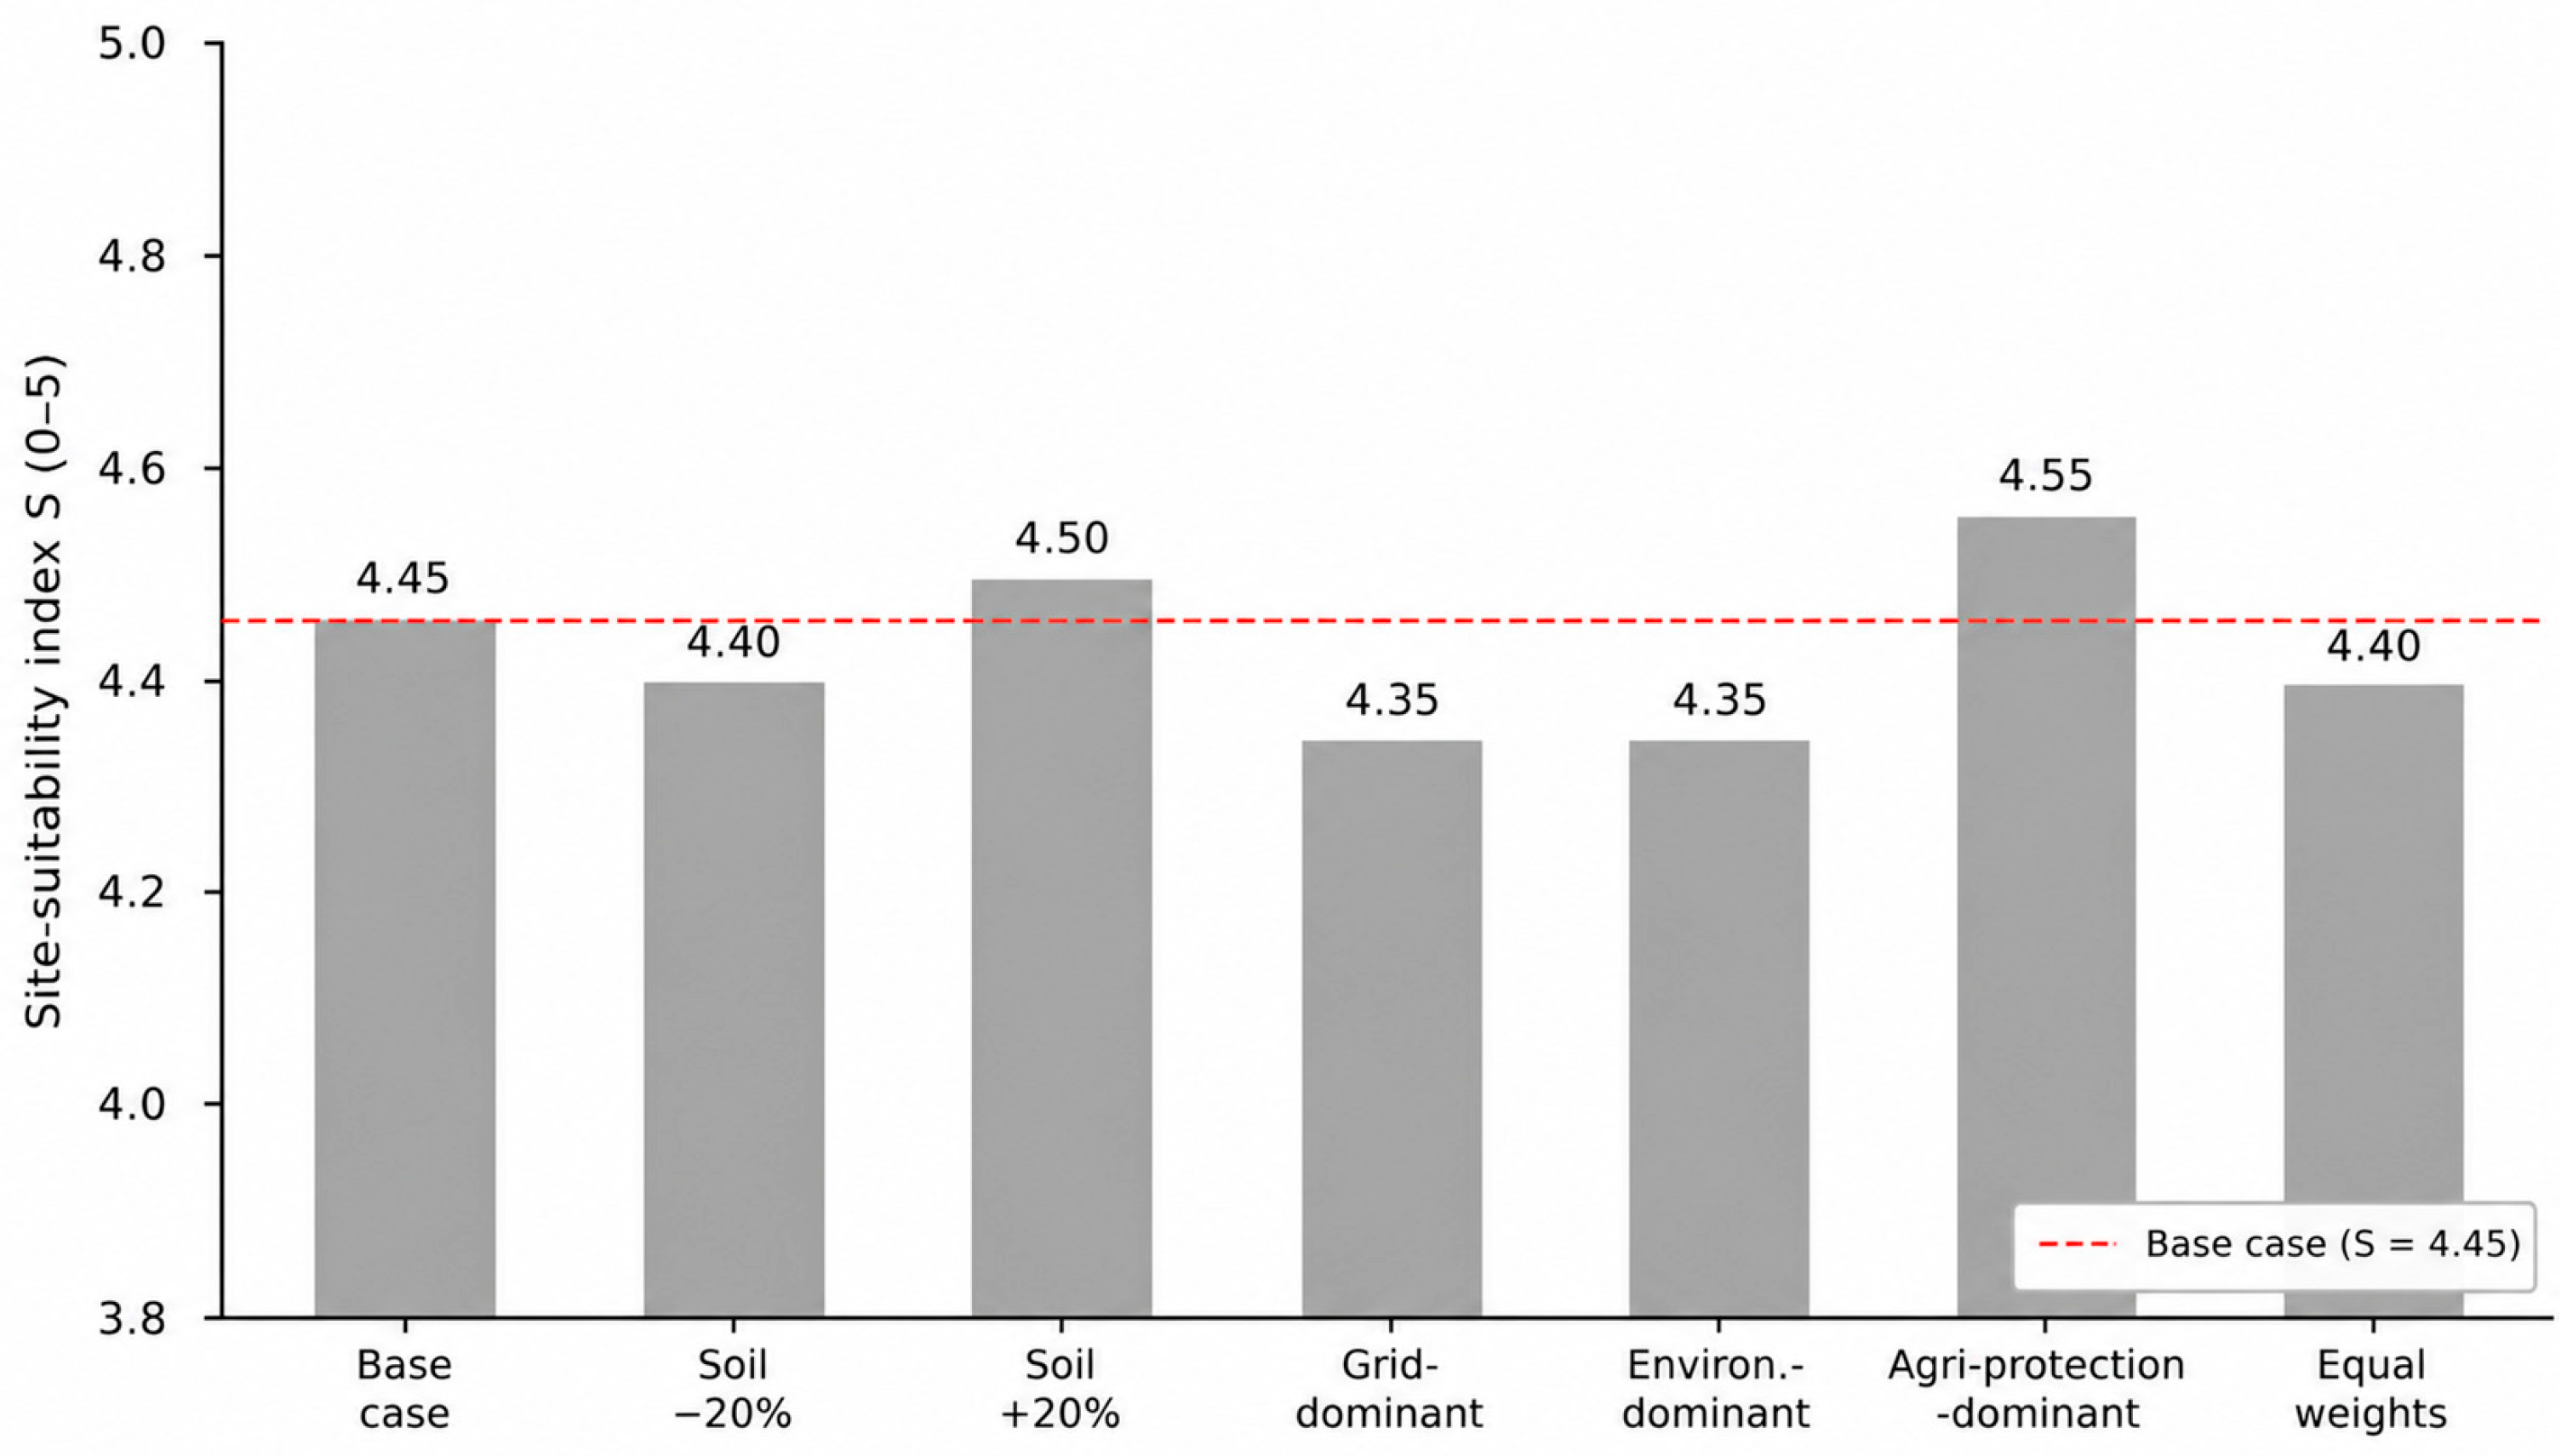
Because weight assignment is inherently expert-based and may be criticised as potentially arbitrary, a sensitivity analysis of S was carried out with respect to: (a) a +/−20% change in the weight of the strongest criterion (soil quality), with proportional redistribution of the remaining weights, and (b) four alternative, qualitatively distinct weighting schemes—grid-dominant, environment-dominant, agricultural-land-protection-oriented, and equal weights.

4.2. Energy Production Model and Capacity Factor

C F = E A C , y e a r P A C · 8760
In the absence of a complete annual metered production dataset, a value of CF = 11.0% was adopted for economic modelling purposes—the midpoint of the 10.5–11.5% range reported for ground-mounted farms under the climatic conditions of north-eastern Poland [22,23]. This value is consistent with PVGIS-class estimates for the site’s location (a specific yield of the order of 950–1050 kWh/kWp per year for a fixed, south-oriented array, i.e., a capacity factor of about 11–12%) [31], and it is treated as an uncertain parameter in the Monte Carlo analysis of Section 5.4, so that plausible year-to-year variability is reflected in the reported NPV and IRR distributions.

4.3. Quantifying Non-Market Curtailment—Model and Data Limitations

It should be emphasised at the outset that the four curtailment variants presented in this section constitute a bounded sensitivity analysis, calibrated against independent reference points, and not a reconstruction of directly measured energy losses—such metered data were not available to the authors.
R c u r t = N c u r t N o b s
where N c u r t = 28, N o b s = 200 (1 April–17 October 2024), giving R c u r t approx. 0.140 (14.0%). This ratio describes the frequency of curtailment-affected days, not directly the share of energy not generated within annual output—these two measures are distinct and should not be conflated. Energy not generated within interval t was modelled as follows: a direct examination of the 28 compensation applications confirms that they contain only the installed DC/AC capacity per 15 min interval, with the irradiance fields left blank and without any metered generation or permitted-power ( k t ) values; the annual curtailed energy therefore cannot be reconstructed from this source, which is precisely why the central Settlement Administrator computes it from non-public DSO telemetry. A bounded physical conversion is used instead: if curtailment affects about 14% of days and, on those days, only the central production hours are reduced at partial depth, the resulting annual energy loss is of the order of a few per cent, a range that the 0–10% scenario band together with the Monte Carlo simulation of Section 5.4 is designed to span.
Δ E t = P A C · 1 k t · Δ t
where k t is the permitted share of available power, and Δ t = 15 min. Owing to the non-public nature of the detailed k t values applied by the DSO/Settlement Administrator for the Zalesie 1 installation, a scenario-based approach was adopted: the annual loss of saleable energy (ΔE/E1) is expressed across four variants—0% (baseline), 3% (low), 6% (medium) and 10% (high)—calibrated against two independent reference points: (i) the local incidence ratio R c u r t of approximately 14% of days, assuming that only part of the day (midday hours) is subject to a reduction in variable depth, and (ii) the national order of magnitude of curtailment for large-scale PV/wind installations, which, according to the PSF report, may reach up to 15% of that group’s annual generation [4]. The ‘high’ variant (10%) therefore represents a conservative approximation of the upper bound of the national pattern, not a value directly measured for the Zalesie 1 facility—this is an explicitly stated methodological limitation arising from the lack of access to the Settlement Administrator’s detailed settlement data.
Financial compensation is due to the generator under Article 13(7) of Regulation (EU) 2019/943 [3] and, in structural terms, corresponds to:
K = Δ E · p r e f Δ O P E X v a r
where p r e f is a reference energy price under the settlement operator’s methodology, and Δ O P E X v a r represents avoided variable costs. Equation (5) is presented in structural form, without substituting specific values, owing to the administrative, non-public nature of the exact algorithm used to determine p r e f .

4.4. Investment Profitability Model (LCOE, NPV, IRR)—Explicit Assumptions and Scenarios

L C O E = C A P E X · C R F + O P E X y e a r E y e a r
C R F = r ( 1 + r ) n ( 1 + r ) n 1
N P V = t = 1 n C F t ( 1 + r ) t C A P E X ,     C F t = E t · p O P E X y e a r
where E t accounts for annual module degradation (0.5%/yr). IRR was determined as the value of r for which NPV = 0 (bisection method). To ensure a transparent parameterisation of the results—a key methodological requirement relative to earlier, less formalised estimates—all numerical assumptions of the model are stated explicitly in Table 8, and LCOE/NPV/IRR/payback calculations were performed under two independent price assumptions: (A) the flat 2024 average day-ahead price (PLN 416/MWh, TGE [6,32]) and (B) a price adjusted for the documented cannibalisation of solar electricity prices during midday production peaks (15% discount, PLN 354/MWh), consistent with the mechanism described in [28,32] and with reports of a growing number of hours with negative day-ahead prices in Poland in 2024 (over 130 h) [6]. The adopted market assumptions are consistent with official statistics on the development of the Polish renewable-energy sector published by GUS and URE [33].

5. Results

5.1. Site Suitability and Its Robustness to Weight Assumptions

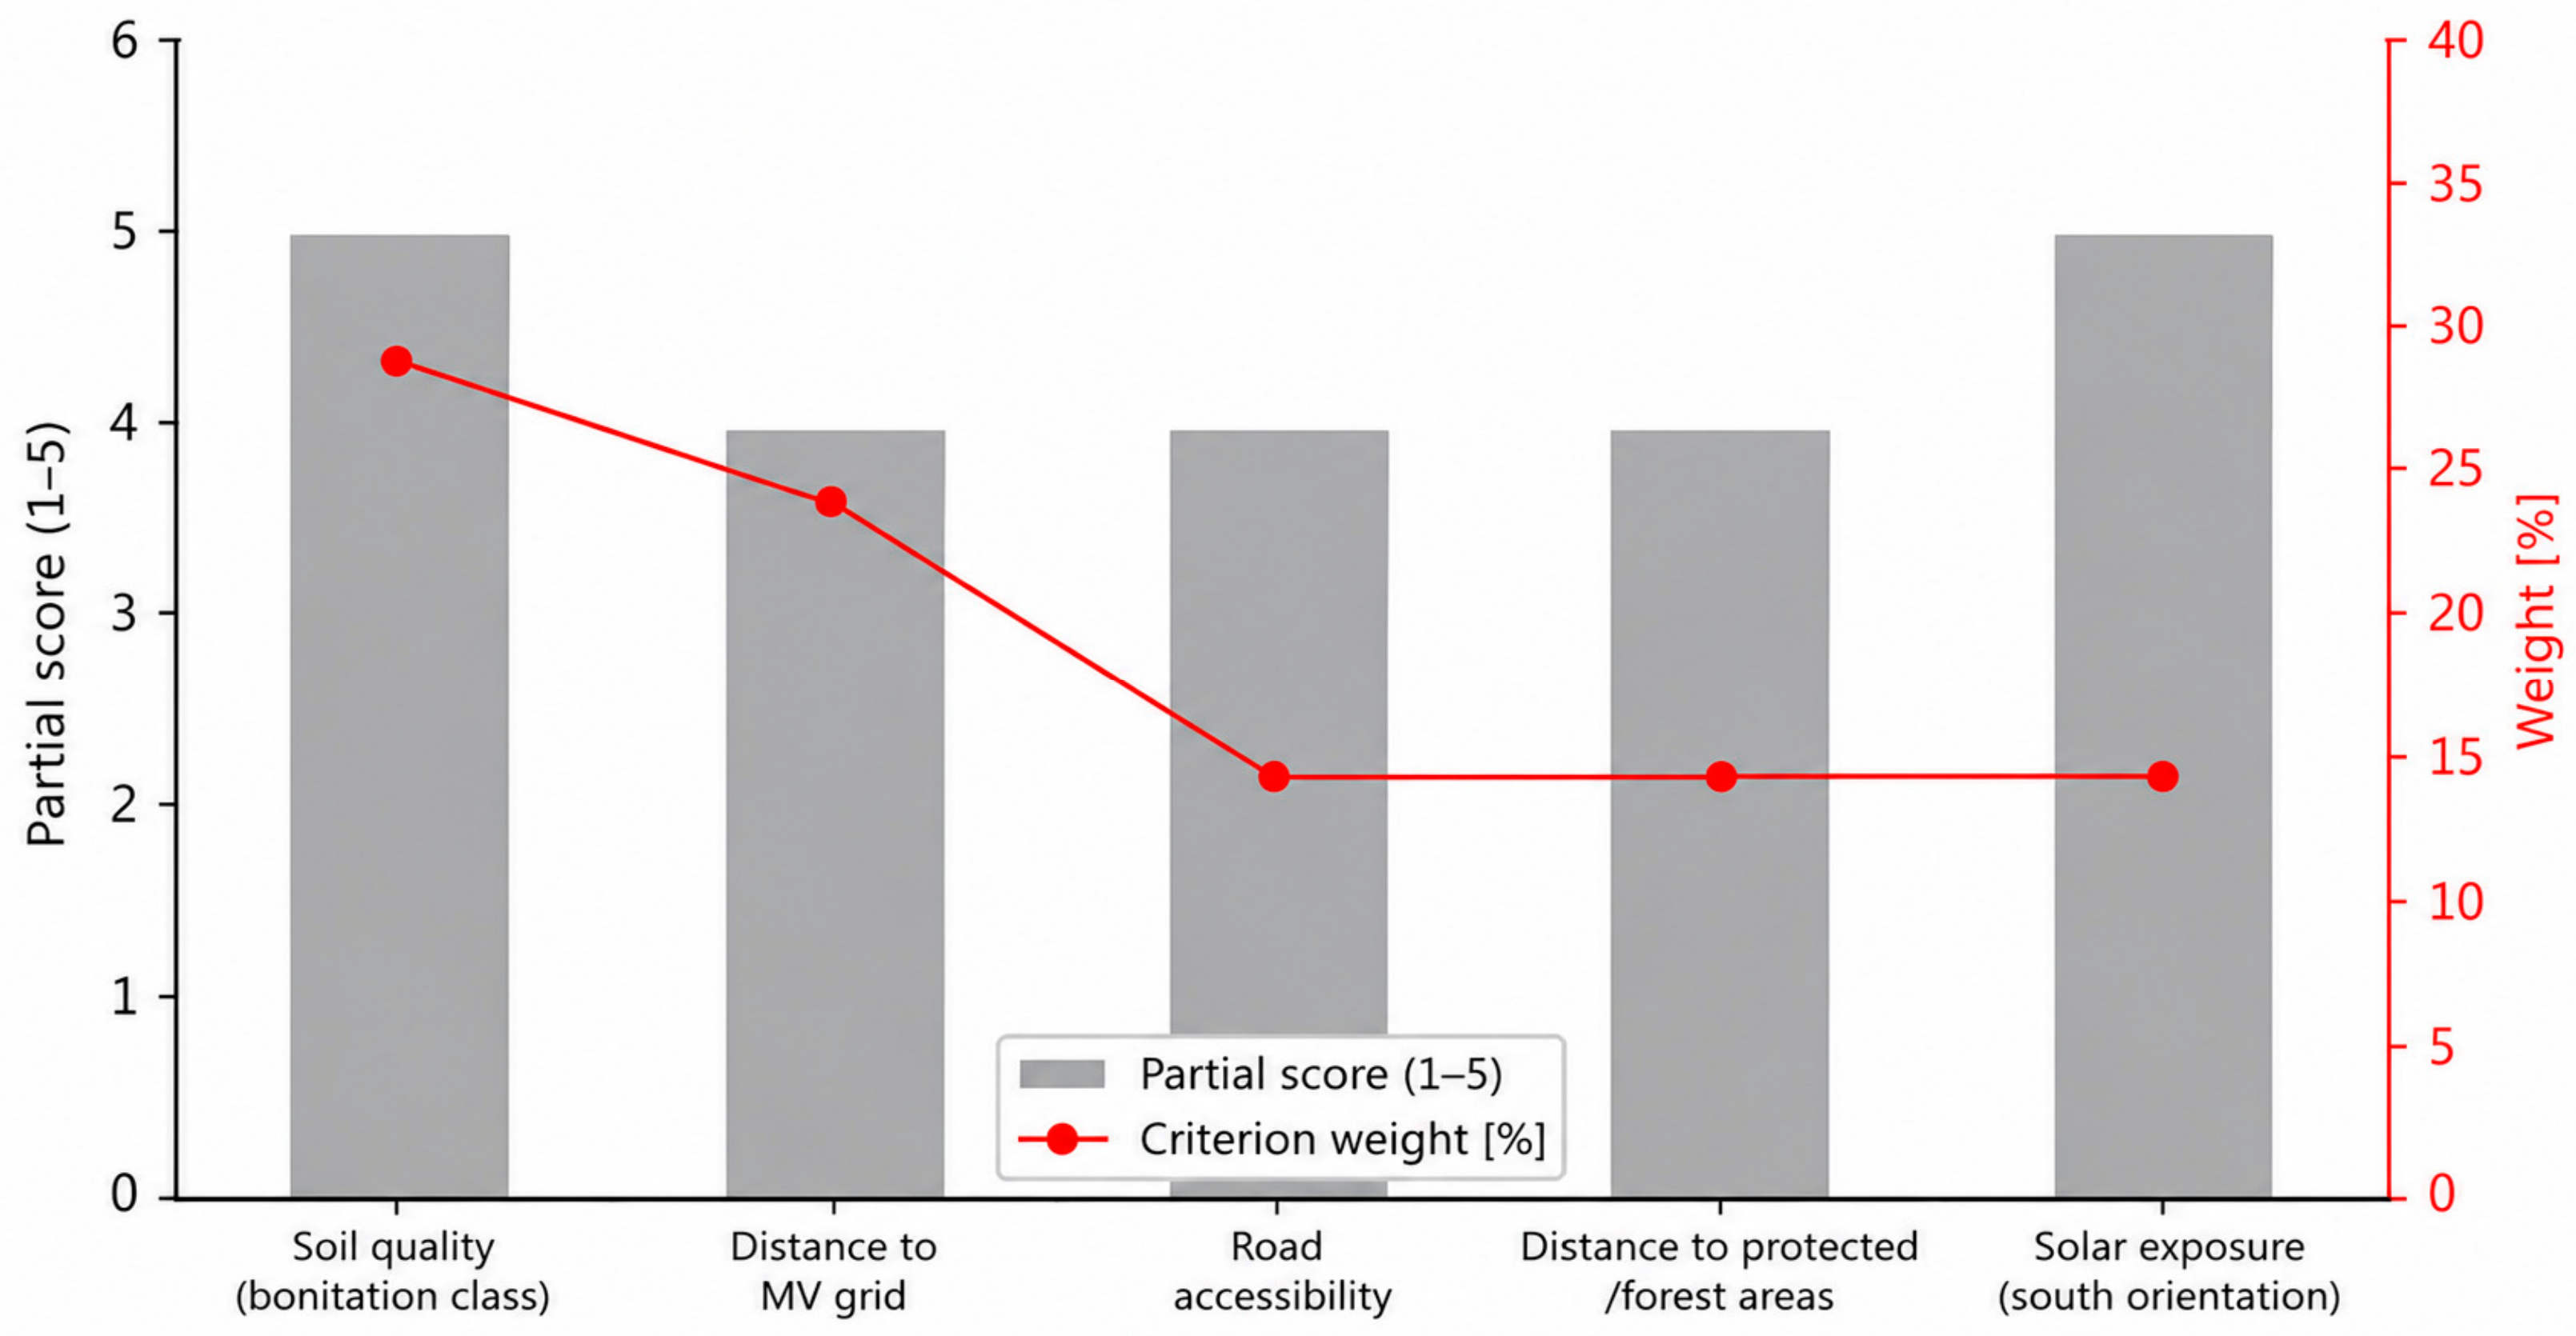
The base-case WSM assessment yields S = 4.45/5.00. The sensitivity analysis (Table 6, Figure 4) shows that this result is stable: across all eight tested weighting variants (+/−20% perturbations and four alternative schemes), S falls within a narrow range of 4.35–4.55, consistently in the upper part of the assessment scale. This indicates that the high site-suitability score of the Zalesie 1 facility is not an artefact of one particular, arbitrarily chosen set of weights but reflects a genuinely favourable combination of the site’s physical and infrastructural characteristics. The underlying partial scores and criterion weights are shown in Figure 5.
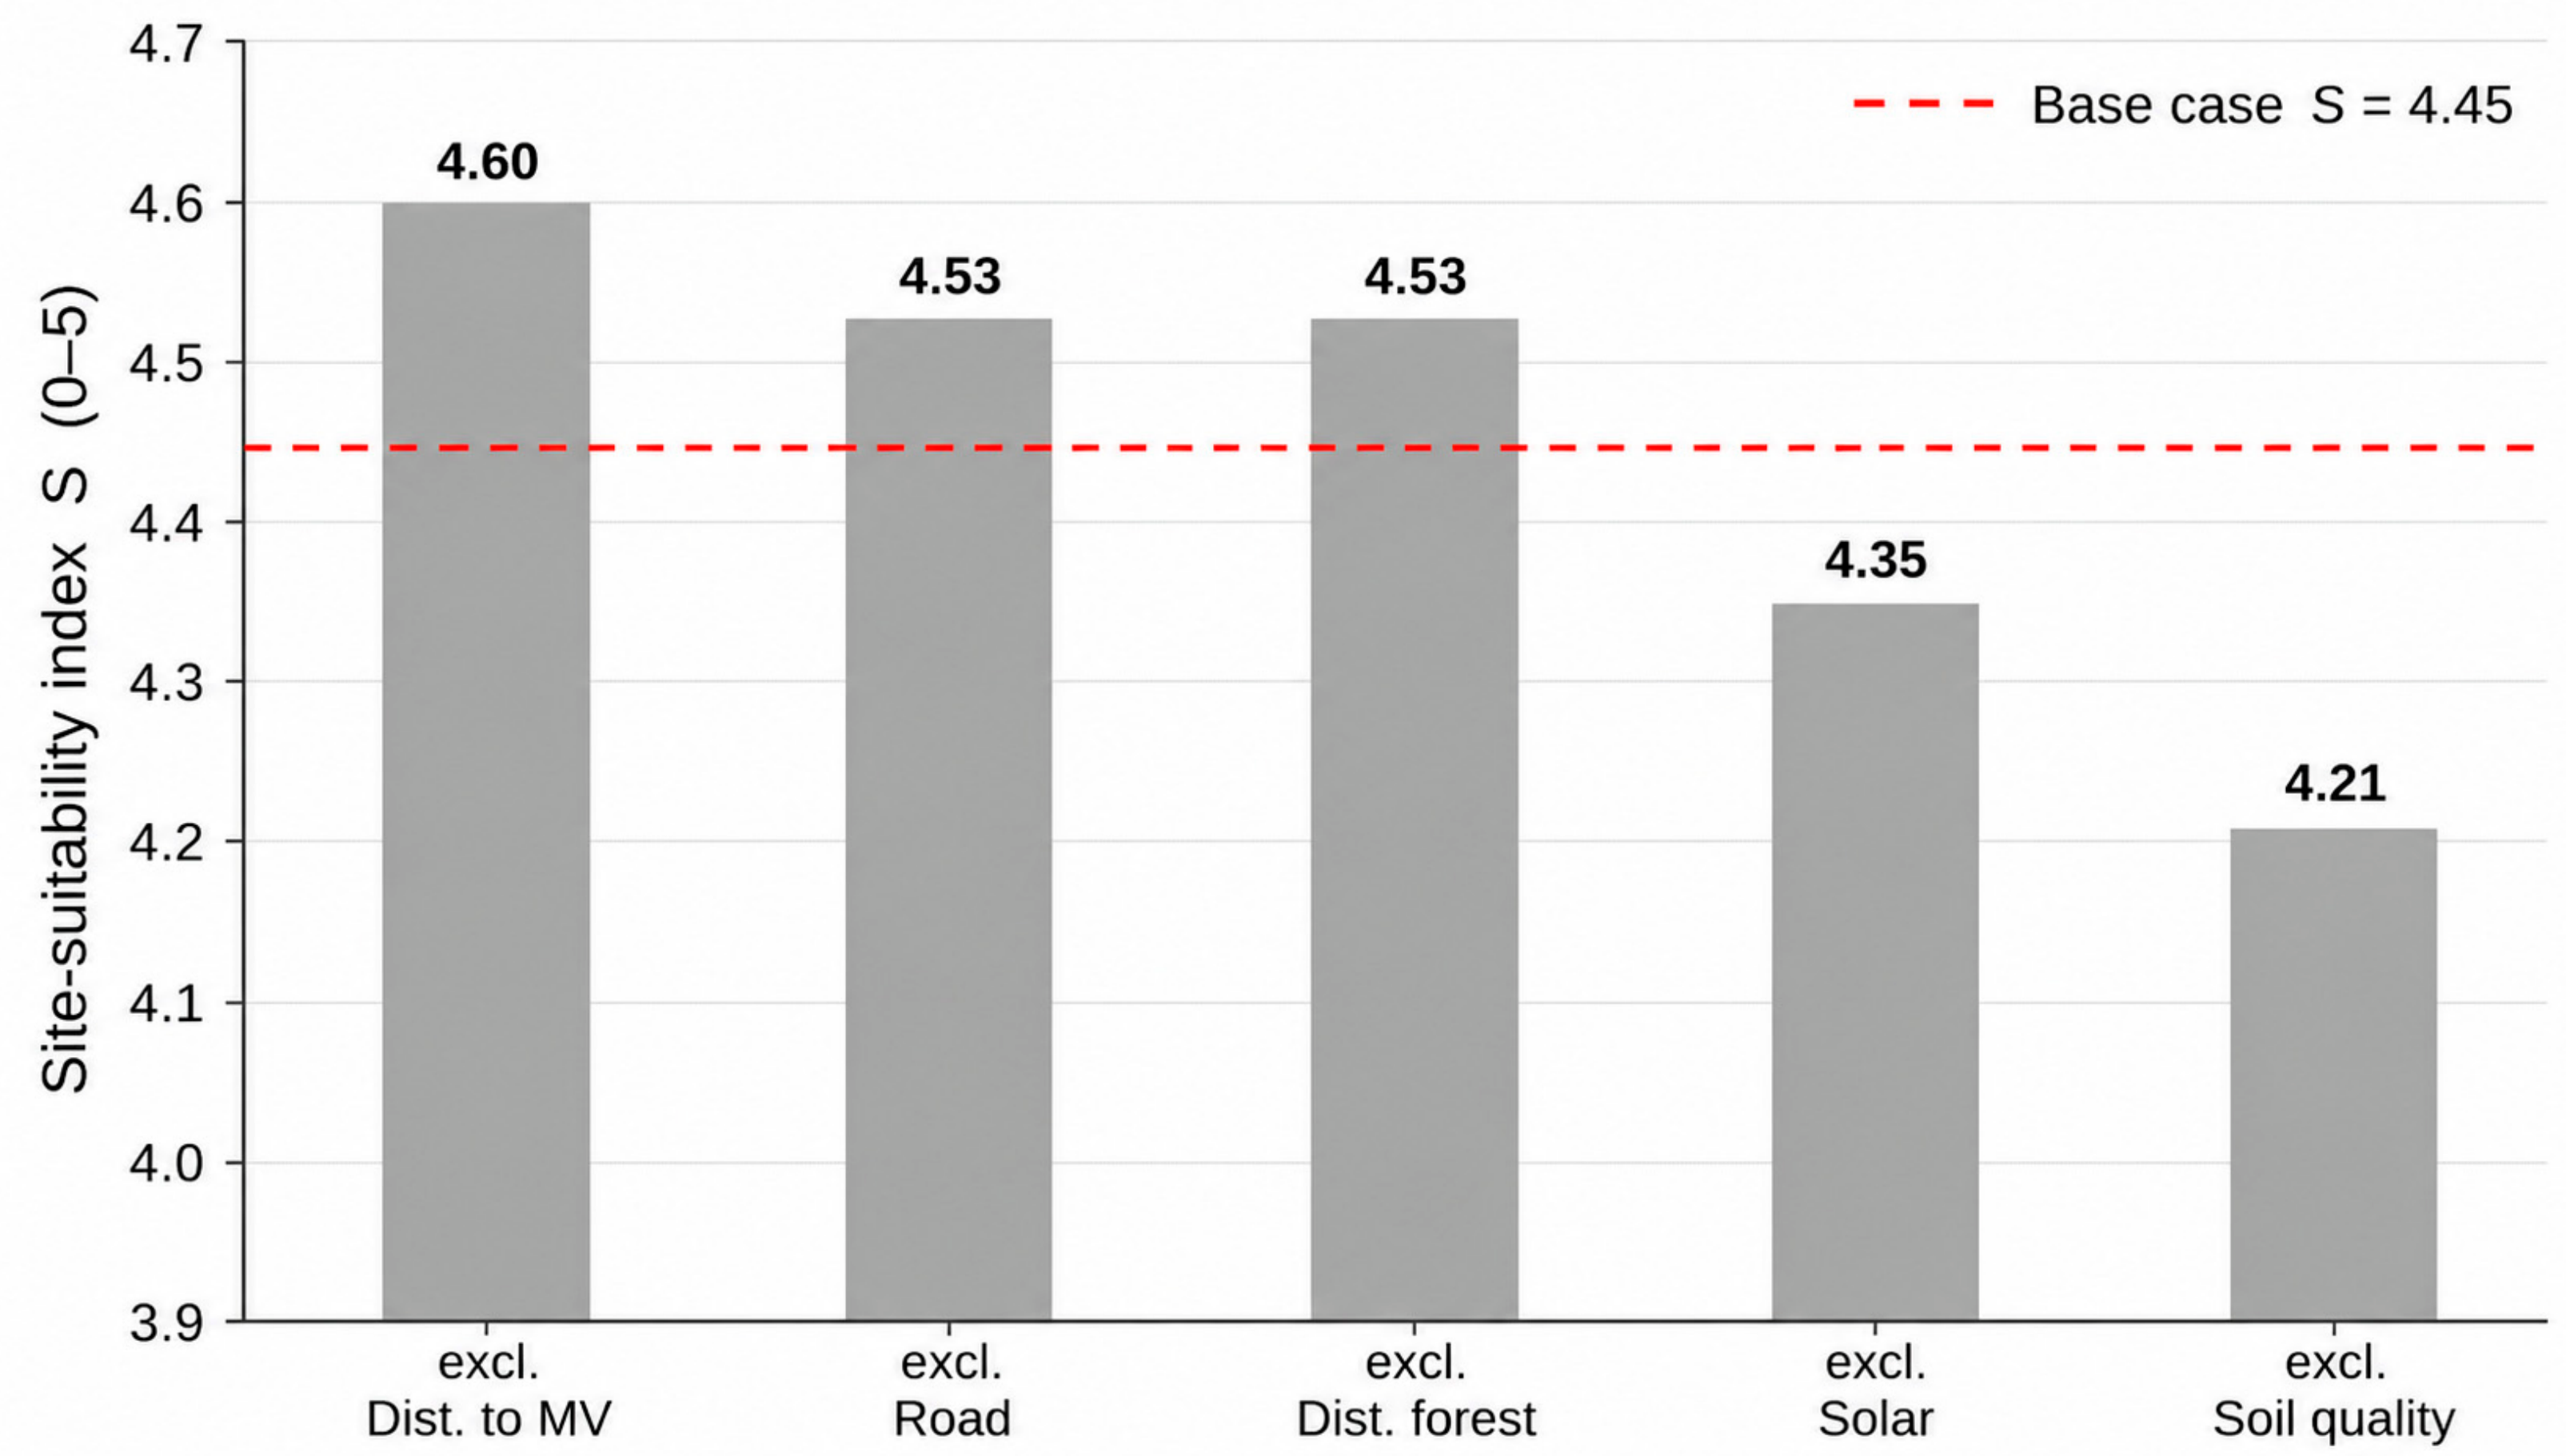
To probe the robustness of the ranking further, a leave-one-out test was carried out, in which the score S was recomputed with each of the five criteria removed in turn and the weights of the remaining criteria renormalised to unity (Figure 6). The score remains within the range 4.21–4.60 on the 0–5 scale—always in the upper part of the assessment scale—with the largest reduction (to 4.21) occurring when soil quality is excluded and the smallest change (to 4.60) when distance to the medium-voltage grid is excluded. This confirms that the high suitability of the Zalesie 1 site is not an artefact of any single criterion.

5.2. Frequency and Temporal Pattern of Non-Market Curtailment

In total, 68% of all recorded events (19 of 28 days) occurred in April and May 2024, consistent with the nationwide pattern described in the PSF report [29] and with the analogous seasonal phenomenon documented for Germany [1,30]. Event frequency declines markedly in the summer and autumn months. This spring concentration is consistent with the coincidence of rapidly rising solar output and still-low seasonal electricity demand, combined with the limited downward flexibility of conventional must-run units; together these factors drive midday oversupply and price cannibalisation, and the same seasonal mechanism has been reported for Germany [1,30]. The incidence ratio for the study period is Rcurt approx. 0.140. i.e., 14.0% of days—a figure of comparable order of magnitude (though methodologically distinct—see Section 4.3) to the national PSF estimate that curtailment of large-scale PV/wind installations may reach up to 15% of their annual generation [4].

5.3. Economic Results: LCOE/NPV/IRR Scenarios

Table 9, Table 10 and Table 11 present the full model results for both price assumptions (A—flat price of PLN 416/MWh; B—cannibalisation-adjusted price of PLN 354/MWh) across four curtailment variants.
Price scenario A (PLN 416/MWh)
Table 9. LCOE/NPV/IRR/payback model results—price scenario A (flat 2024 day-ahead price).
ScenarioNet E [MWh/yr]LCOE [PLN/MWh]NPV [PLN]IRR [%]Payback [yrs]
Baseline (0%)771.8416.7−163,0276.38%12.1
Low (3%)748.7429.6−270,5855.96%12.6
Medium (6%)725.5443.3−378,1435.54%13.1
High (10%)694.7463.0−521,5544.96%13.9
Price scenario B (PLN 354/MWh, with cannibalisation discount)
Table 10. LCOE/NPV/IRR/payback model results—price scenario B (cannibalisation-adjusted price).
ScenarioNet E [MWh/yr]LCOE [PLN/MWh]NPV [PLN]IRR [%]Payback [yrs]
Baseline (0%)771.8416.7−697,3704.23%15.0
Low (3%)748.7429.6−788,8973.84%15.6
Medium (6%)725.5443.3−880,4253.44%16.3
High (10%)694.7463.0−1,002,4622.90%17.3
Table 11. Incremental NPV deterioration relative to the no-curtailment baseline of the same price scenario (baseline |NPV0|: PLN 163,027 for A and PLN 697,370 for B). Absolute values in PLN; relative values use the baseline NPV magnitude as the denominator.
Curtailment ShareΔNPV, Scen. A [PLN]Rel. to |NPV0|, AΔNPV, Scen. B [PLN]Rel. to |NPV0|, B
3%−107,55866%−91,52813%
6%−215,116132%−183,05526%
10%−358,527220%−305,09244%
The results reveal two notable findings. First, even in the baseline scenario (no curtailment), a project selling electricity exclusively on market terms yields a negative NPV at the adopted 7% discount rate under both price assumptions, with a positive but low IRR (4.2–6.4%, depending on the price assumption)—below a typical cost of capital for this type of project. This is consistent with the pressure on margins of unsupported (merchant) PV investments signalled in the literature in connection with price cannibalisation [18,19,32]. Second, an increase in the share of energy not generated due to curtailment from 0% to 10% raises LCOE by approximately 11.1% and deepens the negative NPV by approximately 44% (scenario B)—directionally consistent with international findings, according to which the LCOE/NPV impact of high curtailment can be even more pronounced [18,19]. Non-market curtailment thus acts as a factor that deepens, rather than independently causes, the economic fragility of merchant PV under Polish conditions. To avoid ambiguity arising from the fact that the baseline NPV is already negative, the incremental effect of curtailment is reported here in absolute terms (PLN) and, where a relative figure is given, the denominator is stated explicitly as the baseline NPV magnitude of the same price scenario (Table 11): raising the unsold share from 0% to 10% deepens the negative NPV by PLN 358,527 under the flat price (scenario A) and by PLN 305,092 under the cannibalisation-adjusted price (scenario B).

5.4. Probabilistic Uncertainty Analysis (Monte Carlo Simulation)

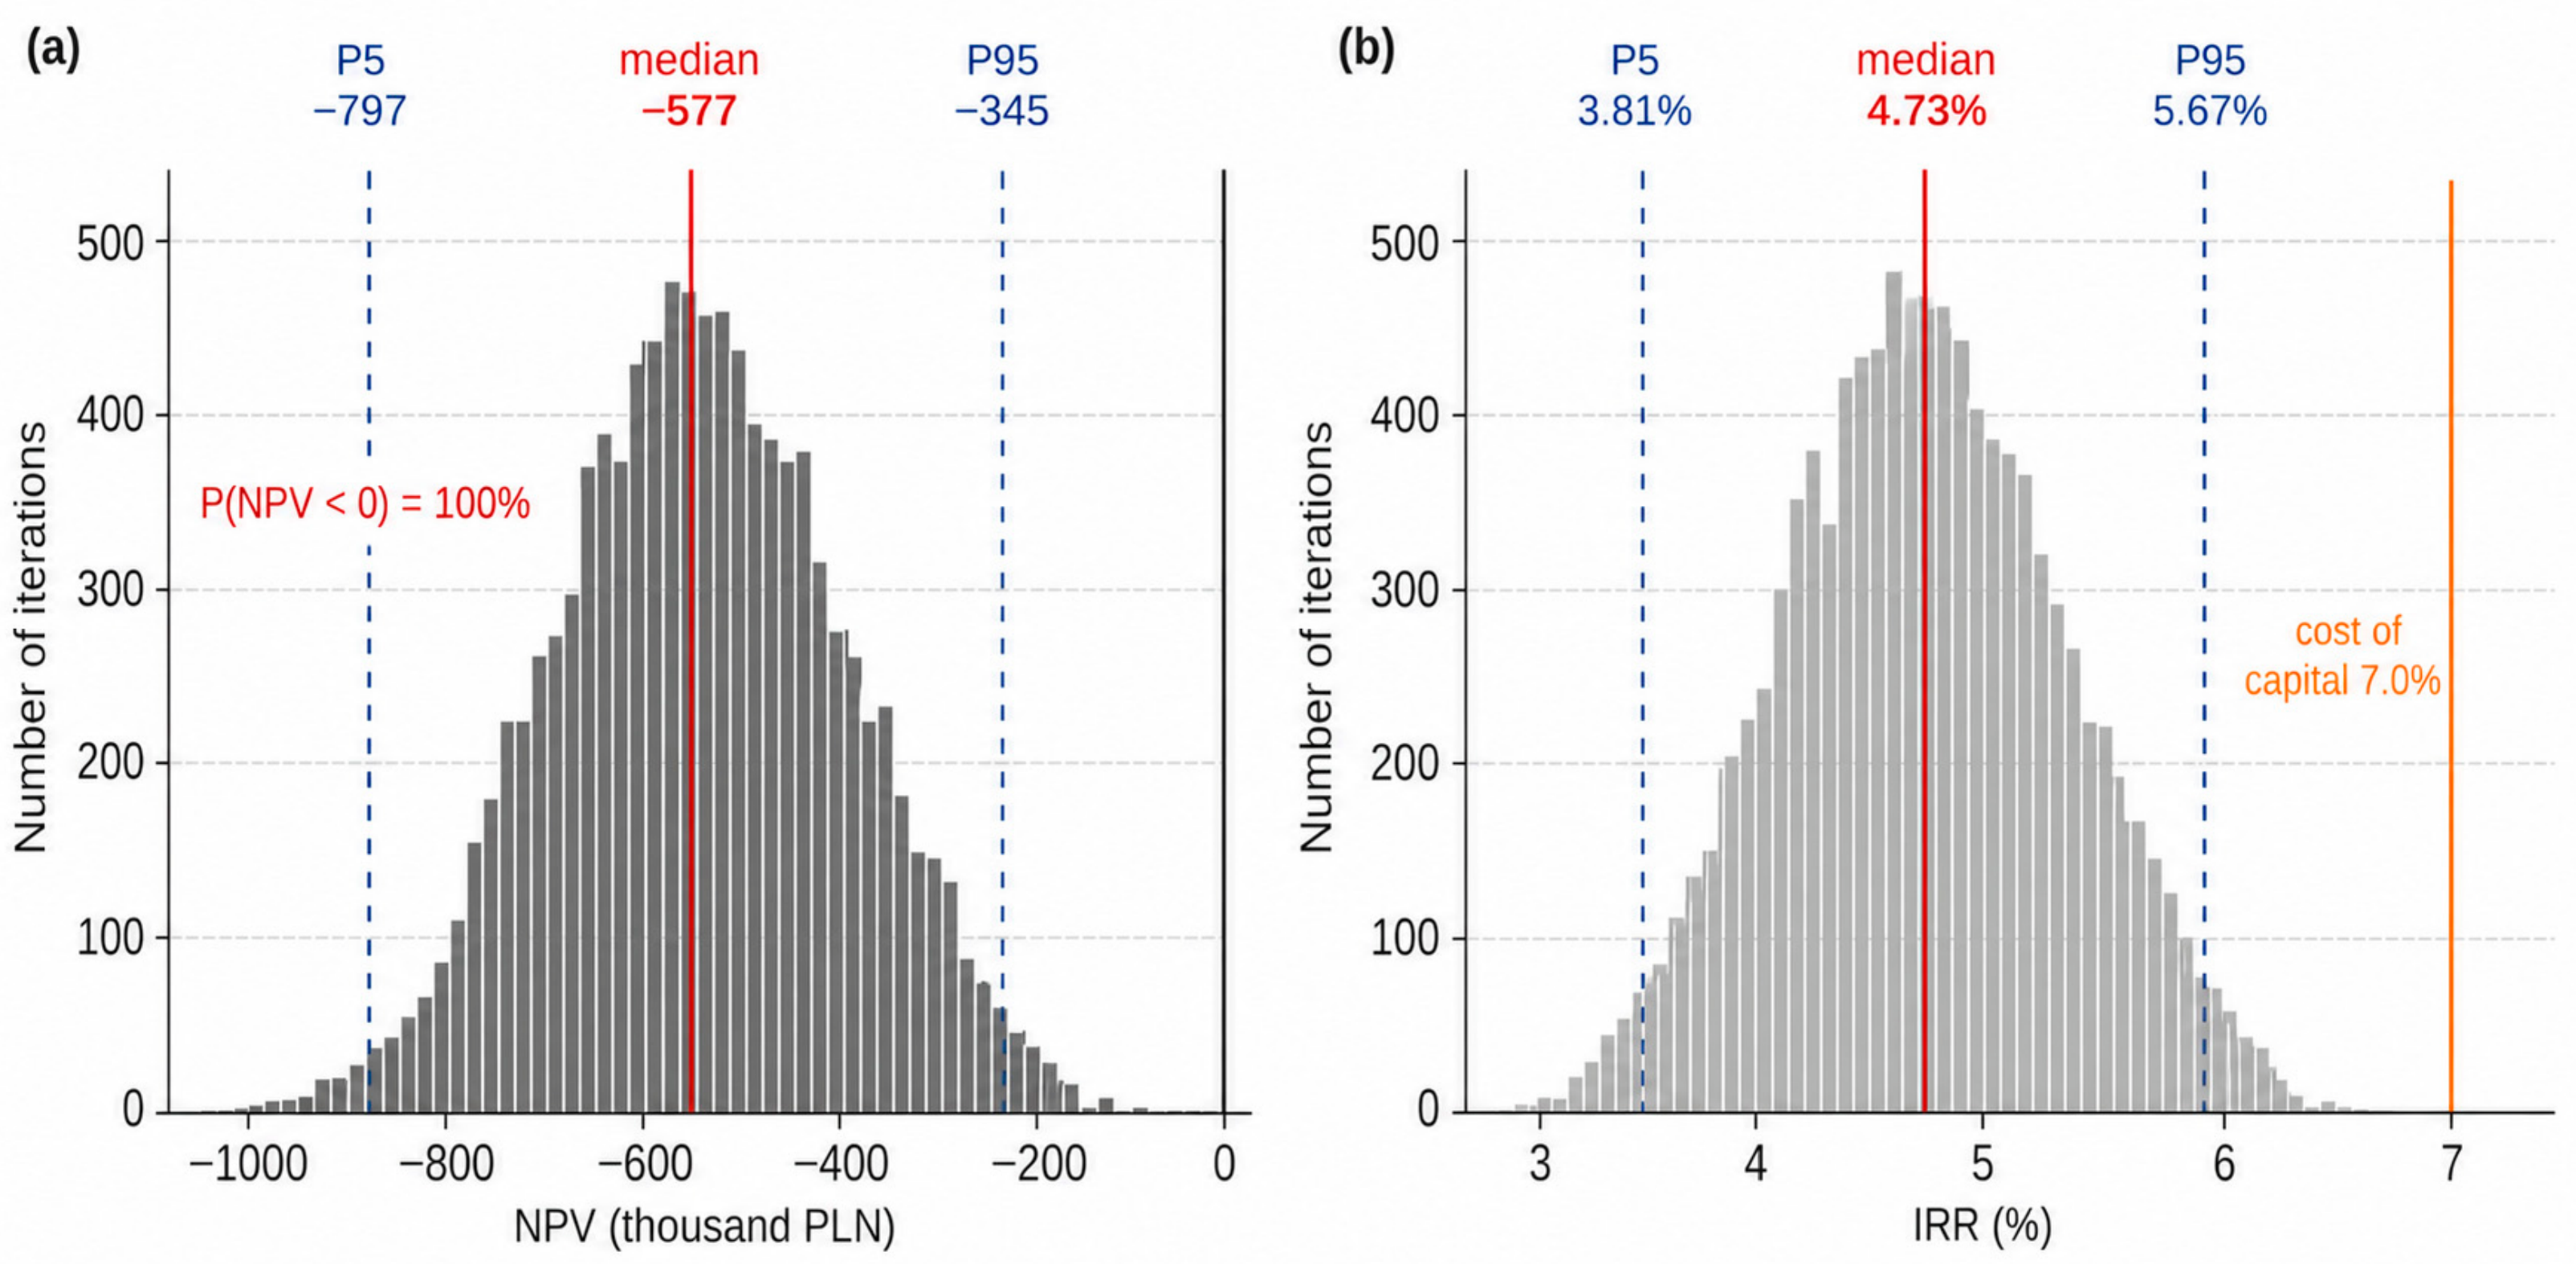
Because the scenario results in Section 5.3 depend on parameters that are themselves uncertain, a Monte Carlo simulation of 10,000 iterations was performed, in which the three key uncertain parameters were treated as random variables: the reference electricity price (triangular distribution over PLN 354–416/MWh, bounded by scenarios A and B, mode PLN 385), the capacity factor (triangular over the 10.5–11.5% range reported for NE Poland, mode 11.0%), and the curtailment share (triangular over the calibrated 0–10% range, mode 3%). Rather than point estimates, the resulting distributions of NPV and IRR are summarised below by their 5th, 50th and 95th percentiles (Table 12, Figure 7).
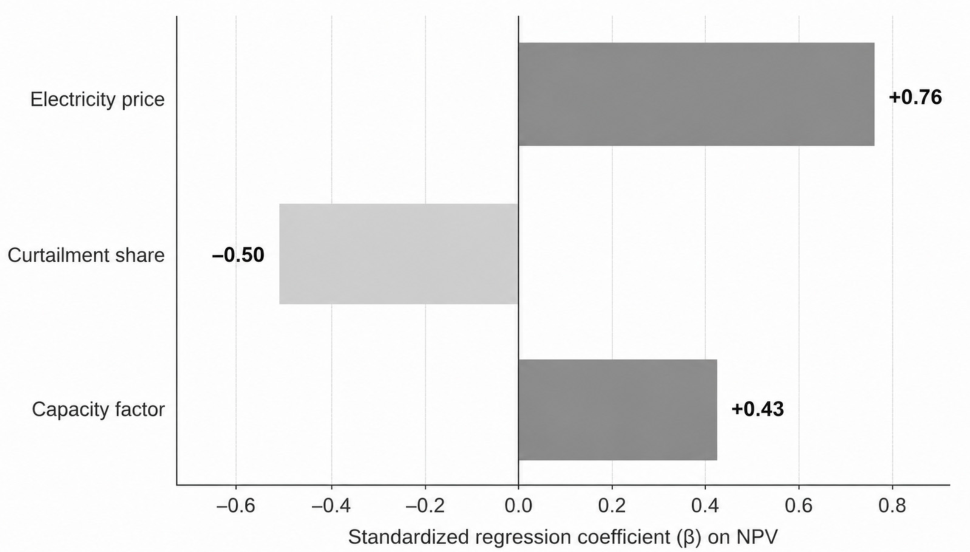
Across the entire simulated parameter space, the NPV is negative in 100% of iterations, and the IRR remains below the 7.0% cost of capital in 100% of iterations; even the optimistic P95 outcome (NPV approx. −PLN 345,000; IRR approx. 5.7%) does not reach break-even. A formal sensitivity analysis based on standardised regression coefficients (Figure 8) identifies the electricity price as the dominant driver of NPV variance (β = +0.76), followed by the curtailment share (β = −0.50) and the capacity factor (β = +0.43), with the linear model explaining R2 = 0.999 of the variance. Notably, the curtailment share is the second-strongest driver, ahead of the capacity factor, underlining the economic materiality of the phenomenon studied.

5.5. A Composite Grid-Aware Suitability Index (GASI)

The site-suitability assessment (Section 5.1) and the curtailment analysis (Section 5.2, Section 5.3 and Section 5.4) address two dimensions of the same siting decision but are, in the classical approach, evaluated separately. To integrate them, a composite Grid-Aware Suitability Index (GASI) is proposed, combining the normalised physical suitability score with a grid-constraint suitability score:
GASI = alpha × Snorm + (1 − alpha) × (1 − Rgrid),
where Snorm = S/5 is the normalised physical WSM score (0.89 for Zalesie 1), R_grid is a grid-constraint risk score derived from the local curtailment incidence (Rcurt approx. 0.14) and the hosting-capacity situation at the connection node, and α balances the two dimensions. With equal weighting (α = 0.5), the Zalesie 1 site scores GASI = 0.88—still high but visibly downgraded from its near-perfect classical score (Snorm = 0.89), precisely capturing the finding that a physically excellent site is only incompletely suitable once grid risk is considered. Because the index requires only a normalised suitability score and a grid-constraint score, it is transferable to any site for which hosting-capacity data are available, converting the present case study into a replicable framework.

5.6. Sensitivity to Financial Compensation and to the Capture Price of Curtailed Energy

The scenario results in Section 5.3 and Section 5.4 deliberately adopt a conservative stance in two respects that the present subsection relaxes. First, they attribute no financial compensation to the curtailed energy, although compensation is payable under Article 13(7) of Regulation (EU) 2019/943 (Equation (5)); second, they value the curtailed energy at the full average price, whereas non-market curtailment occurs during midday oversupply, when the capture price of that specific energy is low or even negative. Both simplifications overstate the financial damage of curtailment, so they are examined jointly here. Let s be the curtailed share, comp the fraction of the curtailed-energy value that is compensated, and dc the capture-price discount applied to the curtailed energy; the annual revenue then scales with the factor 1 − s·(1 − dc − comp), which reduces to the no-compensation, full-price case (1 − s) used earlier when comp = 0 and dc = 0, and to the no-damage case when dc + comp = 1.
Table 13 shows that the two corrections materially reduce—and can eliminate—the incremental damage of curtailment. Full compensation at the reference price restores the baseline NPV exactly (−163,027 PLN under scenario A), so that curtailment ceases to be an independent driver of unprofitability; a 50% compensation share halves the deterioration, and even without compensation, discounting the curtailed energy to a plausible midday capture price (e.g., 30–50%) roughly halves its modelled cost because the energy foregone is low-value energy. Settlement delays of the order of several months, discounted at the project rate, change these figures only marginally (well below one per cent of NPV). The central conclusion of the paper is reinforced rather than weakened: once compensation and capture-price effects are accounted for, the residual negative NPV is driven overwhelmingly by the structural merchant-and-cannibalisation problem of the baseline, not by curtailment itself, so that a physically excellent site can remain economically insecure for reasons that are invisible to a classical siting assessment.

6. Discussion

6.1. A Suitable Location, Incomplete Economic Security

The results confirm a high and weight-robust site suitability for the Zalesie 1 facility with respect to classical soil, environmental and infrastructural criteria [9,10,11,12,13,14,15,16]. This conclusion, however, should be stated precisely: the site is suitable in the classical sense, but this suitability is incomplete once grid-related risk is taken into account—exposure to non-market curtailment arises from constraints on the grid node’s connection capacity, not from the characteristics of the plot itself, and remains invisible at the stage of a conventional siting assessment. This finding aligns with a growing strand of the literature on integrating hosting-capacity maps into RES siting procedures [7,8,20].
The practical significance of this finding lies in what it implies for spatial-planning instruments. In Poland, siting decisions are taken through the zoning-conditions decision (WZ) or the local zoning plan (MPZP), neither of which currently requires any assessment of the hosting capacity of the target grid node; the same gap characterises the site-suitability frameworks of many other EU member states. The results reported here suggest that these instruments are, in their present form, inadequate to manage the grid-related risk they overlook. Two concrete reforms follow: (i) the mandatory inclusion of grid hosting-capacity maps in siting and zoning decisions, and (ii) the adoption of ‘grid-aware’ site-suitability assessment, operationalised through a composite indicator such as the GASI proposed in Section 5.5.
A further systemic implication concerns the environmental dimension of possible responses to curtailment. A common investor response is to co-locate battery storage with PV in order to shift generation away from curtailment windows; however, such storage carries its own environmental footprint, including impacts from mineral extraction, cell manufacturing and end-of-life management, and should therefore be treated as a systemic trade-off rather than a straightforward solution. More broadly, because curtailed generation reduces the avoided emissions per installed MW, the full climate benefit of a PV investment—both domestically and along an increasingly import-dependent supply chain—may be lower than assumed in conventional cost-benefit analyses; recent work on the accounting of non-CO2 greenhouse gases in the global PV trade highlights precisely these spatially decoupled, policy-relevant linkages [34].

6.2. Zalesie in the National and European Context

The local curtailment incidence ratio (Rcurt approx. 14% of days) and the strong concentration of events in April–May are of comparable order of magnitude to the national PSF estimate, which points to curtailment reaching up to 15% of annual generation for the large-scale PV/wind segment [29], and to the even more pronounced analogous trend recorded in Germany (a 97% year-on-year increase in PV curtailment in 2024, to 1389 GWh) [1]. It should be stressed that the compared metrics are not methodologically identical (frequency of days vs. share of energy)—the comparison is one of order of magnitude, not strict numerical equivalence.

6.3. Limitations and Directions for Further Research

The limitations of this study should be highlighted. First, the analysis covers a single facility and a partial calendar year (April–October 2024). Second, owing to the non-public nature of the Settlement Administrator’s detailed settlement algorithm, the exact volume of energy not generated due to curtailment could not be directly measured, but only estimated under four transparently defined scenario variants, calibrated against the local event frequency and the national order of magnitude of the phenomenon. Third, the economic model—despite its full, explicit parameterisation (Table 8)—relies on simplifications typical of LCOE/NPV analyses (constant real prices and costs, no tax modelling, and a single discount rate). The authors plan to extend the study with a full accounting year, directly metered production data, and a comparison with another, analogous site operated by the same investor in the region, which will allow these estimates to be verified and generalised.
A further limitation, and a direction for future work, concerns spatial scope: the present study evaluates a single, already-developed site rather than performing a GIS-based screening across candidate locations. The Grid-Aware Suitability Index introduced in Section 5.5 is formulated precisely so that it can be embedded in such a multi-site screening—overlaying grid-hosting-capacity, substation-congestion and curtailment-risk layers on the classical suitability surface—which the authors intend to pursue in subsequent work, and which would allow for a direct demonstration of how grid-aware indicators re-rank otherwise comparable sites.

6.4. Policy Implications

Translating these findings into practice yields recommendations for three audiences. For investors and financing institutions, pre-investment appraisal should explicitly incorporate grid-constraint risk and curtailment scenarios—as illustrated by the probabilistic analysis in Section 5.4—rather than relying on point estimates of yield. For grid operators and regulators, the transparent publication and regular updating of hosting-capacity maps and curtailment data would materially reduce the information asymmetry currently faced by generators. For municipal planners, embedding grid-awareness into WZ and MPZP procedures—for example by consulting a grid-constraint risk map before issuing siting decisions—would allow the risk identified in this study to be managed at the stage where it is least costly to address.

7. Conclusions

This case study has shown that: (1) the site of the Zalesie 1 photovoltaic plant exhibits a high and weight-robust WSM score (S = 4.45/5.00, range across variants 4.35–4.55); (2) the installation was subject to non-market curtailment on approximately 14% of days within the study period, with 68% of events concentrated in April and May, at an order of magnitude comparable to the national pattern for large-scale PV/wind installations; and (3) non-market curtailment risk deepens the already constrained profitability of an investment selling electricity exclusively on market terms: LCOE rises by 3–11% and the NPV deteriorates by a further PLN 0.09–0.36 million as the share of energy not generated increases from 0% to 10% (equivalently 13–44% of the baseline NPV magnitude under the cannibalisation-adjusted price, and a larger relative figure under the flat price, where the baseline NPV is smaller in magnitude). The key scientific conclusion is that classically defined site suitability may be a necessary but not sufficient condition for the economic security of a PV investment—it should be complemented by an explicit assessment of grid-related and regulatory risk already at the spatial-planning stage. From a practical standpoint, this study suggests that Polish municipalities and investors should incorporate local grid hosting-capacity data into their pre-investment site evaluations, potentially through a publicly accessible grid-constraint risk map.

Author Contributions

Conceptualization, H.K. and K.K.; Methodology, H.K. and K.K.; Formal analysis, H.K.; Investigation, K.K.; Data curation, H.K.; Writing—original draft, H.K. and K.K.; Writing—review & editing, H.K. and K.K.; Supervision, K.K. All authors have read and agreed to the published version of the manuscript.

Funding

This research received no external funding.

Data Availability Statement

The data presented in this study are available on request from the corresponding author. The data are not publicly available due to commercial confidentiality: the investment, technical and settlement documentation was made available by the plant operator solely for this study.

Conflicts of Interest

The authors declare no financial conflicts of interest. The operator of the analysed installation provided access to the underlying investment, technical and settlement documentation for research purposes only and had no role in the study design; in the collection, analyses or interpretation of the data; or in the decision to publish the results. No author received any financial benefit in connection with this work.

References

  1. Fraunhofer ISE. Recent Facts About Photovoltaics in Germany; Fraunhofer Institute for Solar Energy Systems: Freiburg, Germany, 2026. [Google Scholar]
  2. Act of 10 April 1997 on Energy Law (Journal of Laws 2026, Item 43, as Amended). Available online: https://isap.sejm.gov.pl/isap.nsf/DocDetails.xsp?id=WDU19970540348 (accessed on 20 June 2026).
  3. European Union. Regulation (EU) 2019/943 of the European Parliament and of the Council of 5 June 2019 on the internal market for electricity. Off. J. Eur. Union 2019, 14, 54–124. [Google Scholar]
  4. Polskie Sieci Elektroenergetyczne S.A. (PSE). Announcements Concerning Non-Market Curtailment of Photovoltaic Installations; PSE: Konstancin-Jeziorna, Poland, 2024. [Google Scholar]
  5. Laimon, M. Renewable energy curtailment: A problem or an opportunity? Energy Rep. 2025, 11, 1234–1245. [Google Scholar]
  6. Polish Power Exchange (TGE)/Energy Regulatory Office (URE). Day-Ahead Electricity Price Statistics, 2024–2025; TGE/URE: Warsaw, Poland, 2025.
  7. Interstate Renewable Energy Council (IREC). Hosting Capacity Analysis; IREC: Latham, NY, USA, 2024. [Google Scholar]
  8. U.S. Department of Energy. U.S. Atlas of Electric Distribution System Hosting Capacity Maps; U.S. Department of Energy: Washington, DC, USA, 2025.
  9. Kurowska, K.; Kryszk, H.; Bielski, S. Location and Technical Requirements for Photovoltaic Power Stations in Poland. Energies 2022, 15, 2701. [Google Scholar] [CrossRef] [Scilit]
  10. Stala-Szlugaj, K.; Olczak, P.; Kulpa, J.; Soltysik, M. Methodology for Selecting a Location for a Photovoltaic Farm on the Example of Poland. Energies 2024, 17, 2394. [Google Scholar] [CrossRef] [Scilit]
  11. Demir, A.; Dincer, A.E.; Yilmaz, K. A Novel Procedure for the AHP Method for the Site Selection of Solar PV Farms. Int. J. Energy Res. 2024, 2024, 5535398. [Google Scholar] [CrossRef] [Scilit]
  12. Islam, M.R.; Aziz, M.T.; Alauddin, M.; Kader, Z.; Islam, M.R. Site suitability assessment for solar power plants in Bangladesh: A GIS-based analytical hierarchy process (AHP) and multi-criteria decision analysis (MCDA) approach. Renew. Energy 2024, 220, 119595. [Google Scholar] [CrossRef] [Scilit]
  13. Onuoha, H.; Denwigwe, I.; Babatunde, O.; Abdulsalam, K.A.; Adebisi, J.; Emezirinwune, M.; Okharedia, T.; Akindayomi, A.; Adisa, K.; Hamam, Y. Integrating GIS and AHP for Photovoltaic Farm Site Selection: A Case Study of Ikorodu, Nigeria. Processes 2025, 13, 164. [Google Scholar] [CrossRef] [Scilit]
  14. Ouerghi, S.; Al Jadaani, N.; Mohieldeen, Y. GIS-based AHP multi-criteria mapping of potential solar PV power plant development: A case study in the vicinity of Holy Sites, Saudi Arabia. Sci. Rep. 2026, 16, 12345. [Google Scholar] [CrossRef] [Scilit] [PubMed]
  15. Neesham-McTiernan, T.H.; Randle-Boggis, R.J.; Buckley, A.R.; Hartley, S.E. The spatial potential for agrivoltaics to address energy-agriculture land use conflicts in Great Britain. Appl. Energy 2025, 385, 125527. [Google Scholar] [CrossRef] [Scilit]
  16. Khazael, S.M.; Maulud, K.N.A.; Karim, O.A. Geospatial planning strategies for agrivoltaic systems: A review of criteria, decision models and emerging challenges. Sustain. Energy Technol. Assess. 2025, 73, 103912. [Google Scholar]
  17. Dincer, A.E.; Demir, A.; Yilmaz, K. Enhanced Objectivity of AHP for More Reliable Solar Farm Site Selection. Energy Sci. Eng. 2025, 13, 567–580. [Google Scholar] [CrossRef] [Scilit]
  18. Frew, B.A.; Sergi, B.; Denholm, P.; Cole, W.; Gates, N.; Levie, D.; Margolis, R. The curtailment paradox in the transition to high solar power systems. iScience 2021, 5, 1143–1167. [Google Scholar] [CrossRef] [Scilit]
  19. Newbery, D.; Energy Policy Research Group. Implications of renewable electricity curtailment for delivered costs. Energy Econ. 2025, 145, 108472. [Google Scholar] [CrossRef] [Scilit]
  20. Salbanya, B.; Nin, J.; Gras Aloma, R. Harmonized geospatial data to evaluate the Electric Distribution Networks in the US Northeast. Sci. Data 2025, 12, 345. [Google Scholar] [CrossRef] [Scilit] [PubMed]
  21. Sevilla, F.R.S.; Parra, D.; Wyrsch, N.; Patel, M.K.; Kienzle, F.; Korba, P. Techno-economic analysis of battery storage and curtailment in a distribution grid with high PV penetration. J. Energy Storage 2018, 17, 73–83. [Google Scholar] [CrossRef] [Scilit]
  22. Neugebauer, M.; d’Obyrn, J.; Solowiej, P. Economic Analysis of Profitability of Using Energy Storage with Photovoltaic Installation in Conditions of Northeast Poland. Energies 2024, 17, 3075. [Google Scholar] [CrossRef] [Scilit]
  23. Ross, K.; Matuszewska, D.; Olczak, P. Analysis of Using Hybrid 1 MWp PV-Farm with Energy Storage in Poland. Energies 2023, 16, 7654. [Google Scholar] [CrossRef] [Scilit]
  24. Livera, A.; Herodotou, P.; Marangis, D.; Makrides, G.; Georghiou, G.E. Case Study of a Photovoltaic (PV)-Powered, Battery-Integrated System in Cyprus. Energies 2026, 19, 2402. [Google Scholar] [CrossRef] [Scilit]
  25. Act of 20 February 2015 on Renewable Energy Sources (Journal of Laws 2026, Item 68, as Amended). Available online: https://isap.sejm.gov.pl/isap.nsf/DocDetails.xsp?id=WDU20150000478 (accessed on 20 June 2026).
  26. Council of European Energy Regulators (CEER). Redispatching Arrangements in Europe Against the Backdrop of the Requirements of the Clean Energy Package; CEER Paper: Brussels, Belgium, 2024; Available online: https://www.ceer.eu/wp-content/uploads/2024/04/C21_FP_52_03_Paper_on_redispatching.pdf (accessed on 5 July 2026).
  27. European Commission, Joint Research Centre (JRC). Future-Proofing the European Power Market: Redispatch and Congestion Management; Publications Office of the EU: Luxembourg, 2024; Available online: https://publications.jrc.ec.europa.eu/repository/bitstream/JRC137685/JRC137685_01.pdf (accessed on 5 July 2026).
  28. Agency for the Cooperation of Energy Regulators (ACER). Market Monitoring Report-Electricity Wholesale Markets, Cross-Zonal Congestion Costs; ACER: Taipei City, Taiwan, 2024. [Google Scholar]
  29. Polish PV Association (PSF). Non-Market Redispatching of Photovoltaics in Poland in 2024; Industry Report: Warsaw, Poland, 2024; Available online: https://stowarzyszeniepv.pl/wp-content/uploads/2024/06/Raport_PSF_Nierynkowe_redysponowanie_fotowoltaiki_w_Polsce-1.pdf (accessed on 5 July 2026).
  30. Fraunhofer ISE. Levelized Cost of Electricity-Renewable Energy Technologies, 2024th ed.; Fraunhofer Institute for Solar Energy Systems: Freiburg, Germany, 2024. [Google Scholar]
  31. European Commission, Joint Research Centre. Photovoltaic Geographical Information System (PVGIS). Available online: https://re.jrc.ec.europa.eu/pvg_tools/ (accessed on 26 July 2026).
  32. EC BREC Institute for Renewable Energy (IEO). The Photovoltaic Market in Poland 2025; IEO: Warsaw, Poland, 2025. [Google Scholar]
  33. Statistics Poland (GUS)/Energy Regulatory Office (URE). Reports and Statistics on RES Installations, 2024–2025; GUS/URE: Warsaw, Poland, 2025.
  34. Zheng, S.; Ye, Z.; Lu, K.; He, T.; Liu, Y.; Zhang, L.; Hao, Y. Accounting for non-CO2 greenhouse gases in global PV trade: Implications for climate responsibility and policy. Sustain. Prod. Consum. 2025, 58, 123–134. [Google Scholar] [CrossRef] [Scilit]
Figure 1. Schematic site plan of the Zalesie 1 photovoltaic plant, prepared on the basis of the EIA screening report and the zoning-conditions decision. Source: own elaboration based on the facility’s investment documentation.
Energies 19 03642 g001
Figure 2. Photographs of the Zalesie 1 installation during construction (August 2023): (a) fixed-tilt driven-pile mounting structures and the array field; (b) mounting rails and DC cabling on site. Source: Own photographic documentation.
Energies 19 03642 g002
Figure 3. Monthly distribution of non-market curtailment days for the Zalesie 1 installation (April–October 2024). Source: Own elaboration based on 28 compensation applications filed with PSE.
Energies 19 03642 g003
Figure 4. Results of the sensitivity analysis of the WSM score to the adopted criteria weights.
Energies 19 03642 g004
Figure 5. Results of the multi-criteria site-suitability assessment (WSM) for the Zalesie 1 photovoltaic plant.
Energies 19 03642 g005
Figure 6. Leave-one-out sensitivity of the WSM site-suitability score S; each bar shows S recomputed with one criterion excluded and the remaining weights renormalised. All variants remain in the upper part of the 0–5 scale.
Energies 19 03642 g006
Figure 7. Monte Carlo distributions of (a) NPV and (b) IRR across 10,000 iterations. The entire NPV distribution lies below zero and the entire IRR distribution below the 7.0% cost of capital.
Energies 19 03642 g007
Figure 8. Tornado diagram of standardised regression coefficients of NPV on the three uncertain parameters.
Energies 19 03642 g008
Table 1. Basic technical and investment parameters of the Zalesie 1 facility.
ParameterValue
Installed capacity DC/AC999.9 kWp/801 kW (DC/AC ratio ~ 1.25)
Number of modules1818
Plot area/PV footprint3.13 ha/up to 2.61 ha
Soil bonitation classRIVb, RV, RVI
EPC contract value (net)PLN 3,039,800.00
Unit CAPEX (net)~PLN 3040/kWp (DC)
Distribution system operatorPGE Dystrybucja S.A., Bialystok Branch
Support schemeNone—merchant sale on day-ahead market (DAM)
Table 2. Main electrical and technical characteristics of the photovoltaic module (STC; manufacturer datasheet).
ParameterValue
Manufacturer/countryNingbo Ulica Solar Science & Technology Co., Ltd., Ningbo/China
ModelUL-550M-144HV
Cell technologyBifacial monocrystalline PERC; 144 half-cut 182 mm cells; multi-busbar; dual glass (2.0 + 2.0 mm)
Rated power, Pmax550 Wp (tolerance 0/+5 W)
Module efficiency21.28%
Voltage at Pmax, Vmp41.9 V
Current at Pmax, Imp13.13 A
Open-circuit voltage, Voc50.0 V
Short-circuit current, Isc13.75 A
Temp. coefficient of Pmax−0.360%/°C
Temp. coefficient of Voc−0.290%/°C
Temp. coefficient of Isc+0.049%/°C
NOCT43 ± 2 °C
Max. system voltage1500 V
Dimensions/weight2279 × 1134 × 35 mm/32 kg
Number of modules1818
Table 3. Main electrical and technical characteristics of the inverters (manufacturer datasheets).
ParameterSG333HX (×2)SG125HX (×1)
ManufacturerSungrow Power Supply Co., Ltd., Hefei, ChinaSungrow Power Supply Co., Ltd., Hefei, China
Rated AC power333 kVA (@ 35 °C)125 kVA (@ 40 °C)
Inverter topologyTransformerless multi-MPPT stringTransformerless multi-MPPT string
Number of MPPTs12 (up to 16)6
MPPT voltage range500–1500 V500–1500 V
Max. PV input current12 × 40 A6 × 30 A
Nominal AC voltage800 V (3/PE)800 V (3/PE)
Max. AC output current240.5 A90.2 A
Max./European efficiency99.02%/98.8%99.0%/98.7%
Number of units21
Table 5. Multi-criteria site-suitability assessment of the Zalesie 1 PV plant (WSM, base case).
CriterionWeight wiScore xi (1–5)wi × xiData Source
Soil quality (bonitation class)0.3051.50EIA screening report/land register
Distance to MV distribution grid0.2541.00PGE connection conditions
Road accessibility0.1540.60Access-road location decision
Distance to protected/forest areas0.1540.60EIA screening report
Solar exposure (south orientation)0.1550.75Building design documentation
Total (S)1.00-4.45-
Table 6. Sensitivity analysis of the WSM score (S) to criteria-weight assumptions.
Weighting VariantDescription of ChangeResult S (0–5)
Base caseWeights as in Table 54.45
Soil −20%Soil-quality weight reduced by 20%, proportional redistribution4.40
Soil +20%Soil-quality weight increased by 20%4.50
Grid-dominant schemeGrid-distance weight = 0.40 (highest)4.35
Environment-dominant schemeEnvironmental-criterion weight = 0.404.35
Agricultural-land-protection schemeSoil-quality weight = 0.454.55
Equal weightsAll criteria wi = 0.204.40
Table 7. Explicit scoring rules used to map each criterion onto the ordinal 1–5 scale, and the resulting score for the Zalesie 1 site.
CriterionScoring Rule (Ordinal 1–5 Scale)Site Value → Score
Soil quality (bonitation)5 = classes RVI-RIVb (marginal, minimal land-use conflict); 3 = RIIIb-RIIIa; 1 = RI-RII (prime farmland)RIVb/RV/RVI → 5
Distance to MV grid5 = <200 m; 4 = 0.2–1 km; 3 = 1–3 km; 2 = 3–10 km; 1 = >10 kmConnection at plot boundary, MV feeder adjacent → 4
Road accessibility5 = direct paved access; 4 = dedicated/public access road; 3 = shared field track; 1 = no legal accessdedicated access road (plot 470) → 4
Distance to protected/forest5 = >1 km, no conflict; 4 = 0.2–1 km or adjacent buffered forest, no protection; 2 = within a protected-area buffer; 1 = inside a protected areaForest ~ 30 m, no protection status → 4
Solar exposure (orientation)5 = unshaded, south; 3 = minor shading or azimuth deviation; 1 = strong shading/poor azimuthUnshaded, south-oriented → 5
Table 8. Assumptions of the LCOE/NPV/IRR economic model.
Model AssumptionAdopted Value/Source
CAPEX (net)PLN 3,039,800—EPC contract value (Table 2)
AC capacity801 kW
Capacity factor (CF), base scenario11.0%—Midpoint of the 10.5–11.5% range reported for NE Poland [22,23]
Annual output E1 (no curtailment)Approx. 771.8 MWh/yr (P_AC × CF × 8760)
Reference price A (flat)PLN 416/MWh—2024 average TGE day-ahead price [6]
Reference price B (cannibalisation-adjusted)PLN 354/MWh—15% discount vs. flat price, consistent with documented PV price cannibalisation at midday production peaks [6,19]
Annual OPEX (net)2.0% of CAPEX ~ PLN 60,796/yr—Typical range for ground-mounted farms [28]
Module degradation0.5%/yr (standard for silicon modules)
Discount rate r7.0% real, pre-tax—Indicative cost of capital for unsupported (merchant) PV projects in Poland, consistent with commercial financing conditions reported for the Polish PV market [32]; treated as an uncertain parameter in the Monte Carlo analysis (Section 5.4)
Project lifetime n25 years
Tax treatmentPre-tax cash flows (model simplification)
Table 12. Monte Carlo results (10,000 iterations): percentiles of NPV and IRR.
MetricP5P50 (Median)P95Mean
NPV [PLN]−796,780−577,302−345,201−574,701
IRR [%]3.814.735.674.74
Table 13. NPV [PLN] under price scenario A at 10% curtailment as a function of the compensation share (columns) and the capture-price discount applied to the curtailed energy (rows). The no-curtailment baseline NPV is −163,027 PLN; full compensation (comp = 100%, dc = 0%) restores it exactly.
Capture-Price Discount on Curtailed EnergyCompensation 0%Compensation 50%Compensation 100%
0% (valued at full flat price)−521,554−342,291−163,027
30%−413,996−234,733−55,470
50%−342,291−163,027+16,236
Disclaimer/Publisher’s Note: The statements, opinions and data contained in all publications are solely those of the individual author(s) and contributor(s) and not of MDPI and/or the editor(s). MDPI and/or the editor(s) disclaim responsibility for any injury to people or property resulting from any ideas, methods, instructions or products referred to in the content.