Article

Long-Term Climate Variability and Photovoltaic Energy Potential for Sustainable Hospital Infrastructure in Türkiye: A Multi-Method Assessment


by
Youssef Kassem
1,2,3,4,*,
Hüseyin Gökçekuş
2,3 and
Dündar Arif Ekinci
5
1
Department of Mechanical Engineering, Engineering Faculty, Near East University, (via Mersin 10, Türkiye), 99138 Nicosia, Cyprus
2
Department of Civil Engineering, Civil and Environmental Engineering Faculty, Near East University, (via Mersin 10, Türkiye), 99138 Nicosia, Cyprus
3
Energy, Environment, and Water Research Center, Near East University, (via Mersin 10, Türkiye), 99138 Nicosia, Cyprus
4
Research Center for Science, Technology, and Engineering (BILTEM), Near East University, (via Mersin 10, Türkiye), 99138 Nicosia, Cyprus
5
General Directorate of Health Investments, Ministry of Health of the Republic of Türkiye, Ankara 06420, Türkiye
*
Author to whom correspondence should be addressed.
Energies 2026, 19(15), 3589; https://doi.org/10.3390/en19153589
Submission received: 6 July 2026 / Revised: 22 July 2026 / Accepted: 27 July 2026 / Published: 30 July 2026
(This article belongs to the Topic Building Energy and Environment, 3rd Edition)

Abstract

The main objective of the current study is to assess the techno-economic feasibility, climate change adaptability, and sustainability of photovoltaic energy systems in six large hospitals in Turkey (Adana, Başakşehir, Bursa, Elazig, Gaziantep, and Yozgat) to achieve United Nations recommendations as Sustainable Development Goal 7 (affordable and clean energy) and Sustainable Development Goal 13 (climate action). This study aims to determine the impact of long-term climate change on the availability of photovoltaic (PV) energy resources. To achieve this goal, this research was conducted through a multi-step approach combining (1) the detection of long-term climate trends using linear regression on the TerraClimate database, (2) the spatial analysis of photovoltaic solar energy potential using high-resolution satellite imagery (Google Maps) for roof suitability and parking areas, (3) the estimation of photovoltaic electricity generation and the calculation of the capacity factor, (4) the application of the Response Surface Methodology (RSM) based on NASA Giovanni data to model the nonlinear reciprocal relationships between precipitation (R), aerosol optical thickness (AOT), photovoltaic solar energy production, and (5) the techno-economic analysis using the Levelized energy cost (LCOE), payback period, and CO2 emission reductions. The results show statistically consistent warming trends across all sites with trends for Tmax ranging from +0.0205 to +0.0268 °C/year and for Tmin from +0.0208 to +0.0300 °C/year. The temperature of PV cells increases at a rate of +0.0197 °C/year and the wind speed decreases by −0.0031 to −0.0149 m/s/year, which indicates a reduction in convective cooling. Solar radiation, on the other hand, is relatively constant with small trends ranging from +0.0002 to +0.0566 W/m2/year, and confirms the consistent solar resource availability. Seasonal PV resource potential varies from ~70–95 W/m2 in winter to 290–310 W/m2 in summer. Furthermore, the installed PV capacities are between 6 MW (Yozgat) and 47 MW (Başakşehir) with capacity factors of 17.0–19.7% and payback periods of 4.31–4.88 years. RSM models have high explanatory power (R2 = 0.57–0.74) with AOT as the most important negative driver of PV performance. Consequently, the results show that while the solar resource of Türkiye is stable and highly exploitable, PV efficiency is increasingly determined by climate-induced thermal stress and reduced wind cooling. The study highlights the economic viability, environmental advantages, and strategic relevance of PV systems at hospitals for resilient, low-carbon healthcare infrastructure in future climate scenarios.

1. Introduction

1.1. Background

Global electricity demand has grown steadily over the past decade, leading to increasing concerns about energy security and environmental sustainability issues [1]. The increasing global demand for energy is attributed to economic growth, urbanization, and population growth [2]. Energy demand is expected to increase significantly over the next few decades, which means additional challenges for existing energy systems and increased greenhouse gas emissions [3].
Hospitals are considered energy-intensive buildings because they must ensure they operate around the clock, every day, and meet the diverse requirements for building operation based on the nature of the medical practice being carried out and the building’s needs [4]. According to Fernández et al. [5], in terms of energy intensity, the healthcare sector ranks third among service industries, with office buildings and commercial buildings occupying the top spots ahead of the education and hospitality sectors. According to Papadakis and Katsaprakakis [6], the consumption of energy in hospitals is extremely complicated compared to that in regular public buildings. Moreover, the energy requirements of hospitals are affected by certain characteristics, such as size, occupancy level, specialized facilities, and energy-intensive departments [7,8]. In addition, climatic conditions and the heating and cooling systems used in hospitals affect the overall energy consumption of hospitals [7,9,10,11]. For instance, Bawaneh et al. [7] analyzed the energy consumption of healthcare systems for hospitals in the United States. The authors concluded that heating, ventilation, and air conditioning (HVAC) systems consume a large amount of energy, and that the total energy consumed varies according to the size, use, and location of the hospital. Cilibiu and Abrudan [9] found that adopting heat pumps instead of conventional heating systems would significantly reduce energy consumption and increase energy efficiency in healthcare facilities. Ma et al. [10] analyzed the impact of climate change on energy consumption in Australian hospitals. The results showed that rising temperatures due to climate change will lead to increased cooling energy consumption with a decreased need for heating. Nematchoua et al. [11] analyzed energy consumption in hospitals on six islands in the Indian Ocean. The results concluded that future climate change will lead to a decrease in heating demand, but an increase in cooling demand. Energy availability must be ensured because hospitals need electricity and thermal energy for heating and cooling spaces, ventilation, hot water, and lighting. In addition, hospitals need electrical power to operate medical devices and equipment. Hospitals are considered energy-intensive facilities due to population growth and the emergence of new diseases, which leads to the construction of more health facilities [12,13]. Dion et al. [12] concluded that hospitals are among the most energy-intensive types of buildings, given that they operate around the clock and require enormous amounts of energy to run medical equipment, heating, cooling, ventilation, and lighting systems to provide a safe and comfortable environment for patients. The importance of transformational management measures and energy-saving methods was also noted in this regard. Similarly, Wang et al. [13] explored the issue of energy efficiency in public hospitals in China and pointed to the obstacles, namely outdated technology, lack of financial incentives, and institutional constraints, while policies, innovations, and effective energy management were considered important motivating factors. Moreover, according to the previous studies [14,15], electricity consumption in hospitals is related to the use of medical equipment, lighting, and other electrical systems, while HVAC systems consume a significant portion of the building’s total energy consumption. Christiansen et al. [14] concluded that energy consumption in departments and by specialized medical devices is greatly affected by their functions and the scheduling of their use. In addition, Christiansen et al. [14] found that the main consumers of electricity in hospitals are diagnostic imaging devices and other high-power medical equipment, highlighting the need for effective energy monitoring and load management. Similarly, Dion et al. [15] found that hospitals use much electrical energy to sustain their clinical activities, lighting, HVAC systems, and specialized medical equipment.
In this modern era, the increasing environmental impact of traditional energy sources such as coal, gasoline and diesel, in addition to the past few decades which have seen a rise in the use of non-renewable energy sources, has led to environmental pollution [16]. Additionally, reliance on non-renewable energy sources has led to the depletion of natural resources, increased greenhouse gas emissions, and exacerbated environmental problems, necessitating the acceleration of the adoption of renewable energy systems [17,18]. For instance, Freedman et al. [17] identified the characteristics of renewable and non-renewable energy sources and noted the difference in their environmental impacts, particularly when comparing fossil fuels with forms of sustainable energy production. Additionally, Güney [18] explained the importance of increasing the use of renewable energy in achieving sustainability by reducing dependence on fossil fuels, reducing environmental degradation, and ensuring energy security. Therefore, controlling greenhouse gas emissions such as carbon dioxide (CO2) and nitrous oxide (N2O) has become a global goal. To solve this issue, solar energy is one of the most promising technologies that has gained considerable popularity due to its environmental benefits, economic viability, and availability [19,20]. This reduces reliance on fossil fuels while being consistent with key Sustainable Development Goals [21], including good health and well-being (Goal 3), access to clean energy (Goal 7), and climate action (Goal 13) as defined by the United Nations’ 2030 Agenda for Sustainable Development [22].
Globally, several recent studies have highlighted the potential role of solar energy systems within healthcare facilities in enhancing energy security, minimizing expenses, and achieving sustainability. Many studies have been conducted concerning the technical, economic, and environmental viability of photovoltaic (PV) systems, as well as hybrid renewable energy systems for hospitals. For instance, Woldegiyorgis et al. [23] analyzed the potential application of a hybrid renewable energy system within Boru Meda Hospital in Ethiopia and demonstrated that it had the capability of providing a sustainable energy supply in addition to reducing dependency on traditional energy sources. In another study, Refahi et al. [24] evaluated the feasibility of using solar photovoltaic (PV) technology for producing electricity within a six-story hospital building located in Qom, Iran, which has an area of 5000 m2 on its roof, taking into consideration the energy required for heating and cooling in that building per year. They found significant potential for photovoltaic energy production and energy saving. Additionally, Khamharnphol et al. [25] performed a techno-economic evaluation of rooftop PV systems for hospitals in Thailand and indicated favorable economic results along with considerable offset of grid electricity consumption. Alamoudi et al. [26] proposed the design of an optimum solar photovoltaic system for the generation of electricity for hospitals in Turkish climate conditions. The results showed that meeting the electricity needs of King Abdulaziz University Hospital is possible through a photovoltaic solar energy system with appropriate capacity according to its economic resources. In addition to stand-alone PV-based systems, other innovative renewable energy-based schemes for hospital use have also been considered by other scientists. Assareh et al. [27] presented a scheme that utilized the concept of cogeneration technology integrated with phase change materials, thus making it possible to make hospitals into nearly zero-energy buildings. Similarly, Izadi et al. [28] devised a scheme for a solar PV-hydrogen storage-based energy system capable of producing electricity as well as medical oxygen required for treating COVID-19 patients. The benefits of using solar energy for green electricity generation and production of medical oxygen were also discussed by Ngoh et al. [29].
Moreover, the application of renewable energy in Azad Jammu and Kashmir Hospital was examined by Naveed et al. [30]. Additionally, an increasing number of researchers have highlighted the potential role of solar energy in facilitating the development of sustainable healthcare infrastructure. The research studies carried out by Al-Rawi et al. [31], Soto et al. [32], Teklemariam et al. [33], and Osho and Sareen [34] on opportunities and challenges of solar energy in the healthcare industry have shown that solar energy technologies can contribute to enhancing energy access, reducing GHG emissions, and making healthcare systems more resilient. Ouedraogo et al. [35], Kassem et al. [36], Ossola et al. [37], and Kowsar et al. [38] have further demonstrated that solar PV technologies, alongside additional solutions like combined heat and power plants and heat pumps, may positively affect the energy efficiency of hospitals and facilitate the achievement of decarbonization goals. Overall, these findings support the notion that the application of solar energy is a promising strategy to address the rising energy needs of hospitals in a sustainable manner.
In general, the application of renewable energy, particularly solar energy systems, has recently been studied as an alternative energy source for power generation in hospitals in Türkiye. For instance, according to Paksoy et al. [39], the integration of solar energy and seasonal thermal energy storage in an aquifer into the hospital heating and cooling system led to a significant decline in the usage of traditional fuel types. Özden and Tarı [40] conducted a study on a hybrid solar–hydrogen power system used in the emergency department of a hospital in Ankara, Turkey, with an annual load of 37.23 MWh. However, recent studies have focused more on hybrid renewable energy systems based on photovoltaic cell technology. Pastakaya [41] studied the application of a solar-assisted absorption refrigeration and heating system on a one-story hospital with an area of 450 m2. This hospital was supposed to have a population of about 50 people, and the energy analysis took into account the features of the building, such as walls and windows. It has been shown that solar energy can meet the hospital’s thermal energy requirements, especially during times when energy demand is high, such as the COVID-19 period. Güven et al. [42] conducted an analytical study to improve grid-connected and off-grid hybrid renewable energy systems for a state hospital in Yalova, Türkiye. The case study focused on a hospital located on a landmass of 200 acres, having an indoor floor area of 105,000 m2 and a parking capacity of 800 cars. The results showed that combining a photovoltaic solar power system with battery storage and the electrical grid increases reliability, reduces energy costs, and lowers environmental impact. In particular, case studies of hospitals in Turkey have proven that renewable energy is economically and environmentally friendly to implement in healthcare facilities. For instance, Yorulmaz and Taş [43] found out that incorporating solar PV systems into the hospital sector can result in a 70% reduction in electricity costs and carbon footprint reductions, indicating the sustainability potential of solar PV systems.
Based on the above, Table 1 provides a summary of some of the most relevant previous studies to the research topic, and identifies the differences between their main features and limitations to illustrate the current state of the literature and highlight the current research gap. The comparison reveals that an in-depth analysis of grid-connected photovoltaic solar energy systems in Turkish hospitals is still insufficient.

1.2. Research Gap

Despite growing concern about integrating renewable energy technologies into healthcare institutions, available studies on photovoltaic-based systems for hospitals in Turkey are few, and these studies are limited to single cases and focus on estimating the size, feasibility, and cost-effectiveness of these systems. Most previous research assumed stable or simple climatic conditions and ignored the geographical and temporal variations in solar energy sources under changing climatic conditions. To the best of the authors’ knowledge, no current study has comprehensively assessed the effects of long-term climate change (1958–2024) on the electricity production capacity of photovoltaic power systems in hospitals in Türkiye.
Moreover, in previous studies, the technical, economic, and environmental feasibility of photovoltaic energy systems was analyzed separately without considering electricity demand forecasts, climate modeling of photovoltaic energy resources, analysis of the suitability of areas for installing photovoltaic energy systems, and technical, economic, and environmental analyses in a single study. In addition, the effect of variations in rainfall and optical aerosol thickness (AOT) on hospital photovoltaic electricity production has not yet been considered by any researcher, although it plays an important role in determining the solar radiation falling on photovoltaic cell modules, according to the authors’ review of the literature. Furthermore, previous research was conducted only based on current electricity demand and did not take into account future electricity demand forecasts for hospitals.
These research gaps indicate the need to develop a comprehensive approach that includes long-term climate-based modeling of photovoltaic systems, forecasting of future electricity demand, spatial analysis, technological and economic feasibility studies, environmental assessment, and climate sensitivity analysis. This will provide a better platform for planning sustainable solar photovoltaic energy systems in hospitals under current and future climatic conditions.

1.3. Research Aim

This research aims to comprehensively evaluate the feasibility and flexibility of solar photovoltaic power generation for hospitals in Türkiye, which is characterized by its diverse climate and has become more susceptible to climate fluctuations over time. This research explores the temporal-spatial dynamics of solar PV potential ( P V r e s ) across six key hospitals, namely, Adana Şehir Hospital, Bursa Şehir Hospital, Elazığ Şehir Hospital, Gaziantep Şehir Hospital, Yozgat Şehir Hospital, and Başakşehir Şehir Hospital, from 1958 until 2024 through the TerraClimate dataset. In addition, a forecasting-based approach is used to estimate energy demand in hospitals from 2026 to 2028, with 2025 being the base year.
Furthermore, spatial analysis was incorporated into the research to assess suitable areas for installing photovoltaic solar energy systems using Google Maps and satellite imagery. The spatial analysis will help in the quantification of suitable space that can be used for generating solar power. Using the measured surface area, the next step is to estimate the electricity production from photovoltaic solar energy using a mathematical model. The electricity produced from available solar energy resources, taking into account their fluctuations, is estimated using a mathematical model based on the defined surface area. To further analyze the effects of climate change, a decade-long study (1958–2024) was conducted to determine the impact of seasonal changes on electricity generation by photovoltaic systems. Afterward, techno-economic analysis was carried out using the Levelized cost of electricity (LCOE) and simple payback period to assess the feasibility of installing PVs on either rooftops or car parks under the Turkish electricity market conditions. Moreover, environmental impacts are assessed through carbon dioxide emission reductions due to PV electricity generation.
In addition, the effects of important climate variables such as rainfall variability and aerosol optical thickness (AOT) on the photovoltaic efficiency are determined through the use of Response Surface Methodology (RSM) based on satellite data from NASA’s Giovanni platform. The application of spatial modeling, energy modeling, economic analysis, and climate sensitivity allows for an integrated approach to assessing the feasibility of photovoltaic solar energy technology in a future hospital environment. The results are expected to be of great importance in providing insight into the sustainability of solar energy as a resource for hospitals in Türkiye and globally.
The key contributions of this research include: (1) the development of an integrated model framework, which includes spatial analysis, modeling of photovoltaic electricity generation based on climate, forecasting of electricity demand, techno-economic analysis, and environmental analysis for hospital buildings; (2) a comprehensive study of the variability of climatic conditions in the long-term period and the effects on the PV electricity generation for hospital buildings in Türkiye based on historical climate data (1958–2024); (3) investigation of the effects of rainfall and aerosol optical thickness (AOT) on PV electricity generation by means of Response Surface Methodology; and (4) comparison of the rooftop and car park PV systems in six city hospitals located in different climatic zones of Türkiye.
These contributions offer a comprehensive decision-making tool for the sustainable design of PV systems in healthcare facilities under the current and future climatic conditions.

2. Methodology

2.1. Case Study

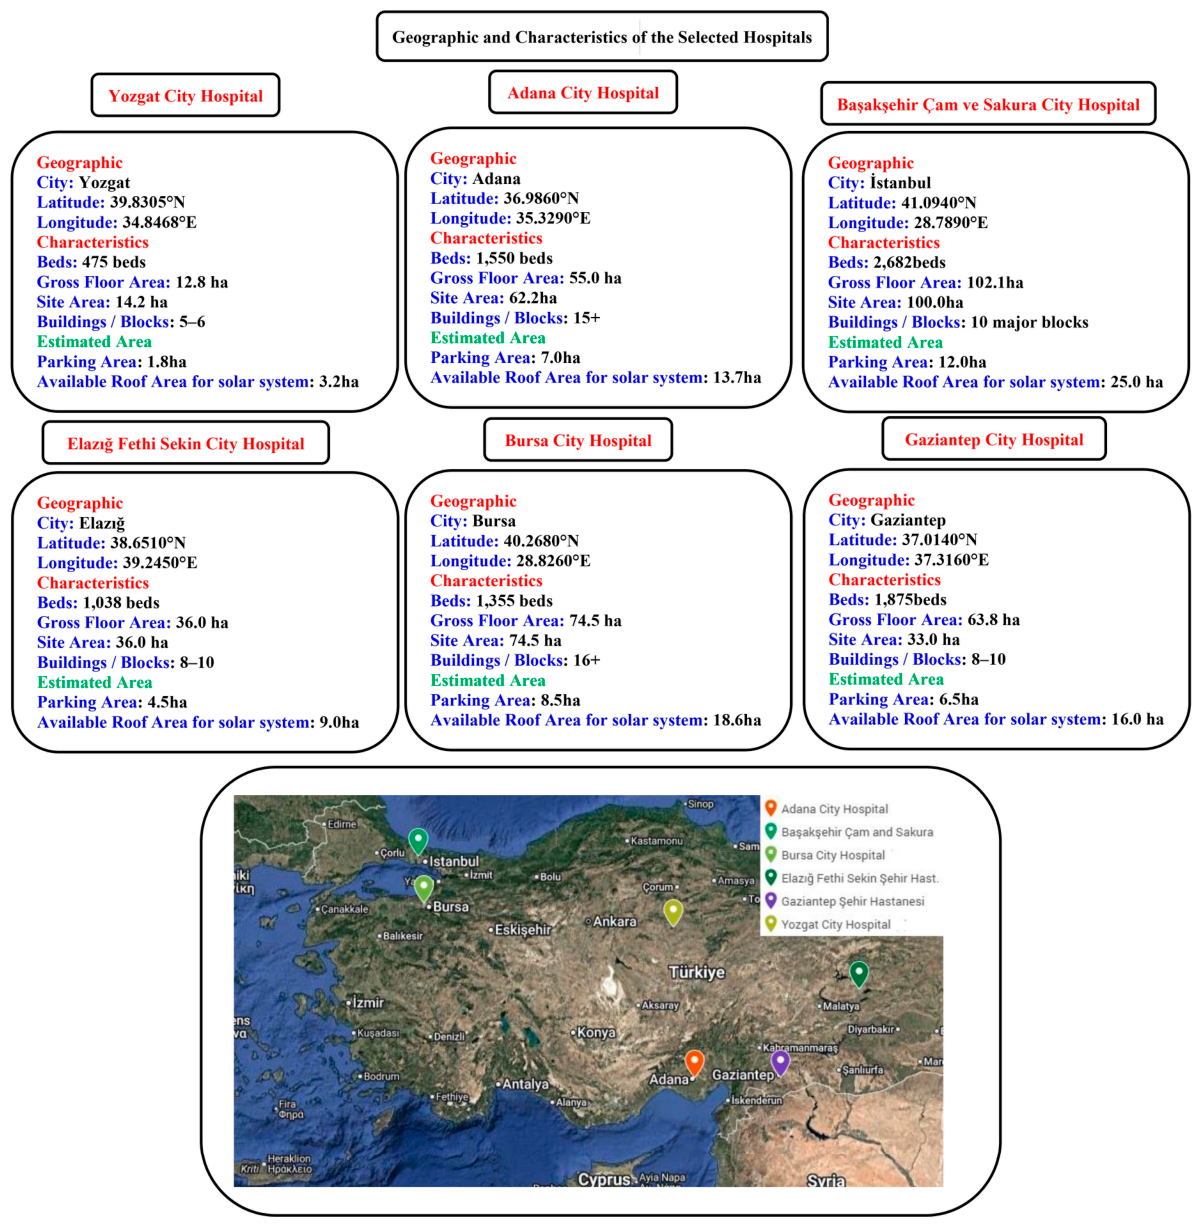
This study was conducted in six major urban hospitals located in different climatic regions of Türkiye: Yozgat, Adana, Elazığ, Bursa, Istanbul, and Gaziantep, taking into account the natural background aerosol conditions of Türkiye. Figure 1 shows the details of the selected hospitals. These climatic zones include the continental, Mediterranean, and transitional climates of the Marmara region and the southeastern semi-arid climate, providing a diverse pattern of solar radiation, thermal profile, and electrical needs that can be utilized in photovoltaic solar energy applications within hospitals. The hospitals selected for this study are among the largest hospital complexes in Türkiye, with bed capacities ranging from 475 to 2682 beds. These buildings provide ample space for rooftops, parking, and year-round electricity needs, making them ideal cases for analyzing the suitability of rooftop photovoltaic solar energy systems and efficiency measures. Annually, global horizontal solar radiation decreases from the northern and central parts to southern Türkiye, where Gaziantep and Adana have the highest solar energy potential.
Due to the limited availability of historical data, the scenario-based forecasting technique was considered. In this regard, the monthly electricity demand pattern for 2025 was used as the baseline load pattern, while the expected demand was determined by a deterministic measurement technique commonly used in many energy studies. These techniques have become widely used in forecasting electricity demand based on scenarios. The projected future demand was calculated based on a growth scenario, which takes into account the monthly electricity consumption pattern but assumes the likelihood of increased energy demand by hospitals. Equation (1) is used to estimate the monthly electricity demand during the period of 2026–2028
D m , t D m   ( 2025 ) 1 + r n
where D M denotes the forecasted demand for the electricity in month m for year t , D m   ( 2025 ) is the actual demand for the same month in year 2025, which is the base year, r stands for the demand growth rate per year, and n denotes the number of years from the base year.
Three cases of demand growth were taken into consideration for accommodating the future uncertainties: low-growth case ( r = 2%), the moderate-growth case ( r = 4%) and the high-growth case ( r = 6%). For the years 2026, 2027, and 2028, n values were 1, 2, and 3, respectively. This methodology ensures that the seasonality of the actual hospital load curve remains intact while allowing for prediction of the demand for the electricity in future under varying operational growths in line with the conventional practices in energy demand forecasts where historical data are limited [44,45].
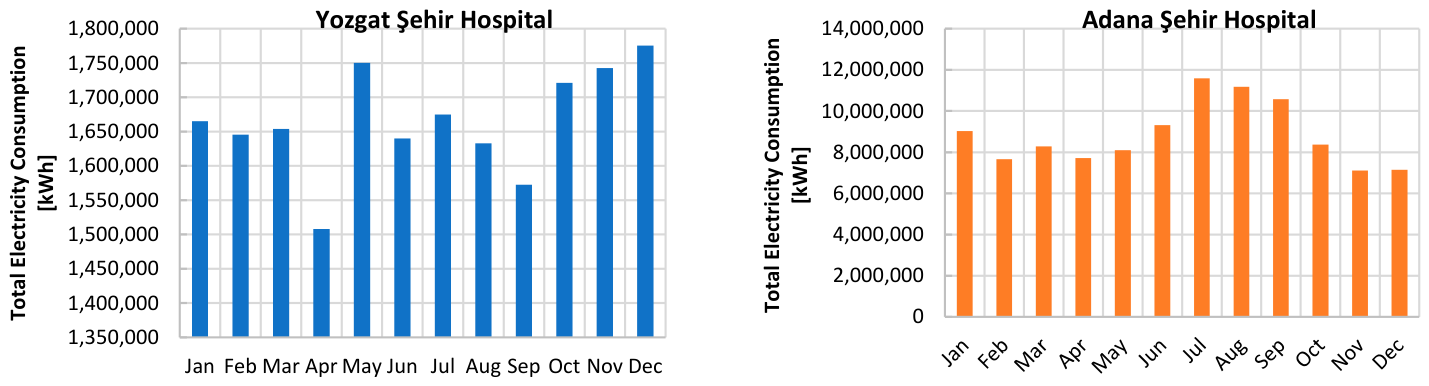
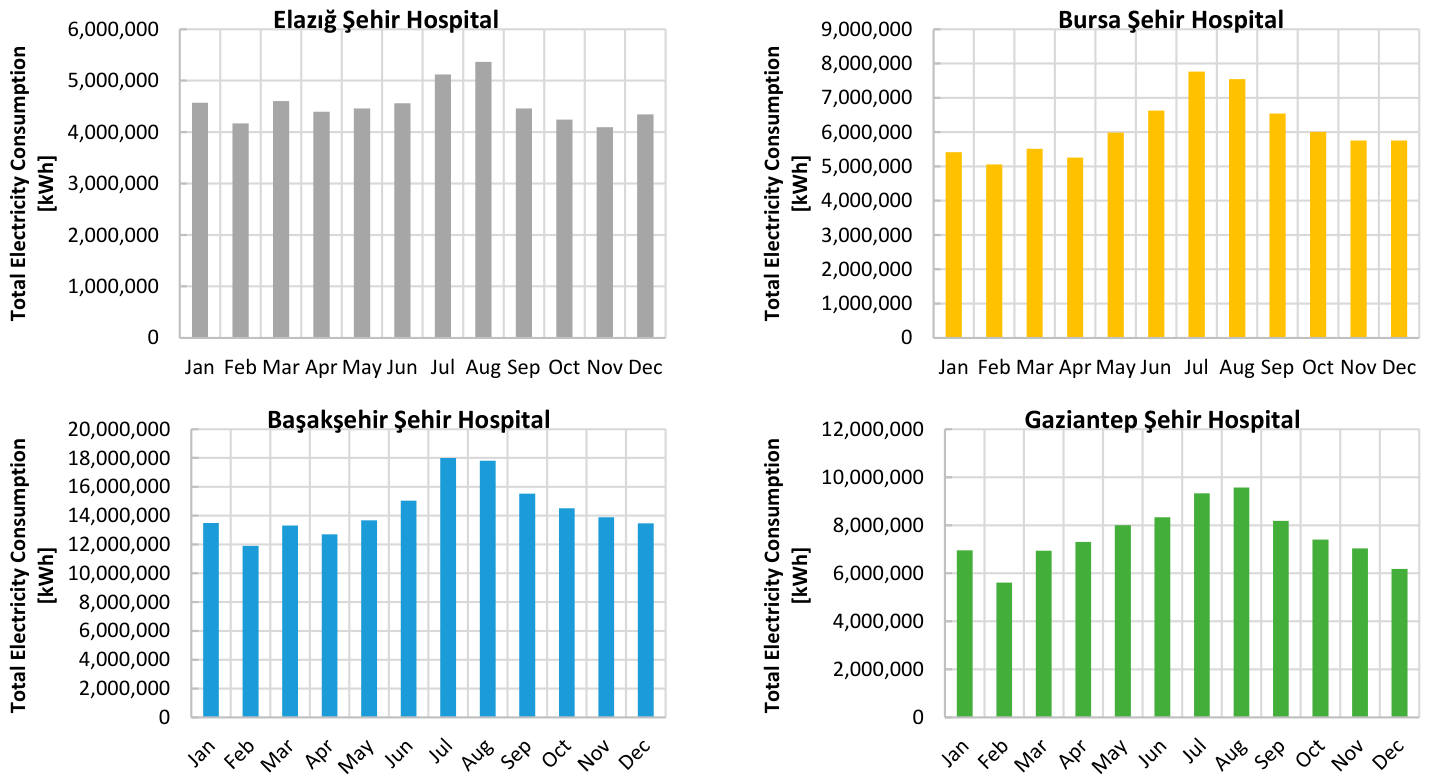
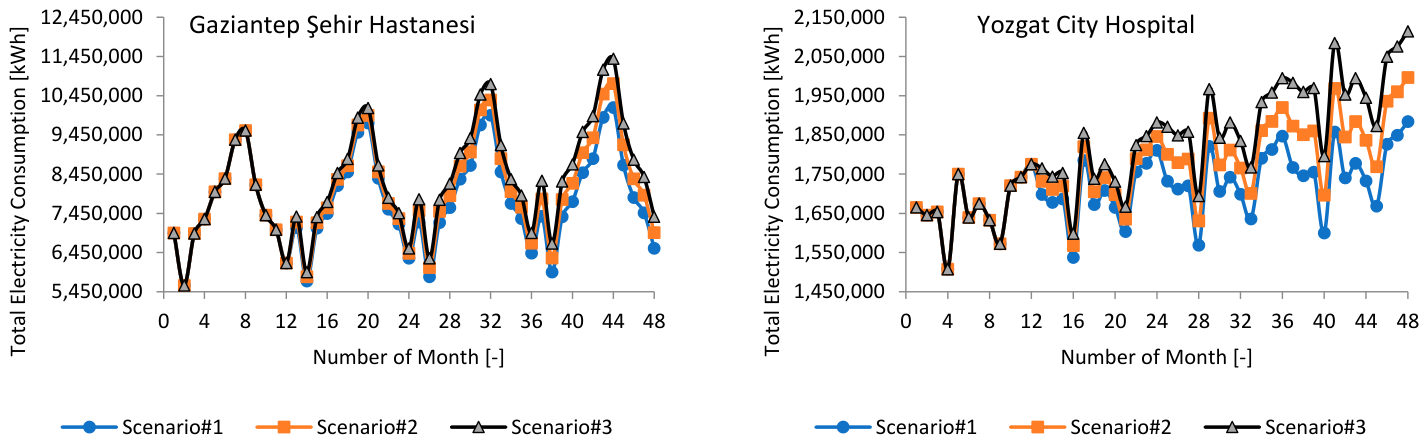
Figure 2 illustrates the monthly electricity consumption data of 2025 for the selected hospitals. It is found that the maximum and minimum values for the demand of electricity per month for each hospital have been found using the 2025 monthly consumption data.
It should be noted that the monthly electricity usage for the hospitals (Figure 2) was collected from the Ministry of Health of Türkiye. The recorded data (Figure 2) represents the actual electricity consumption in hospitals, which was measured by their own electricity meters without any simulation, estimation, or interpolation. The Yozgat City Hospital had the maximum consumption in December (1,775,428 kWh) and the minimum consumption in April (1,507,965 kWh). The Adana City Hospital had a very high cooling load, as indicated by the high value of maximum consumption in July (11,593,673 kWh) and the low value of minimum consumption in November (7,118,553 kWh). In the same way, Elazığ Fethi Sekin Şehir Hastanesi had the maximum consumption in August (5,368,009 kWh) and the minimum consumption in November (4,094,828 kWh). Bursa City Hospital had an obvious seasonal trend in demand for electricity per month as well, and the maximum consumption was in July (7,769,498 kWh) while the minimum consumption was in February (5,056,770 kWh). Finally, the most variable hospital among all was the Başakşehir Çam and Sakura City Hospital, which reached the maximum value of consumption in July (17,990,619 kWh) and the minimum consumption value in February (11,910,625 kWh).
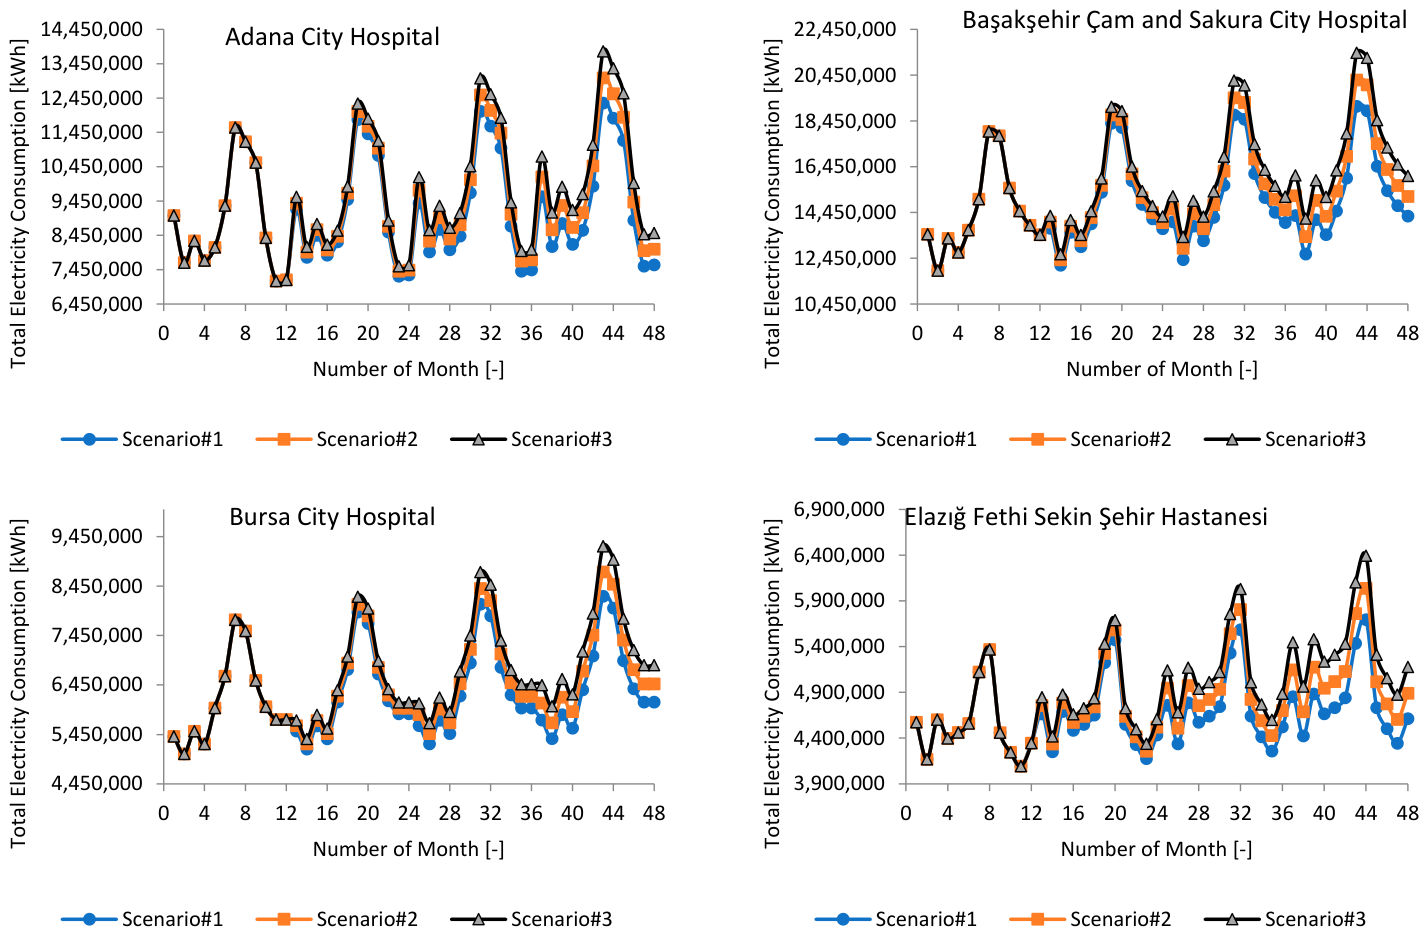
Generally, all the hospitals have significant seasonal features related to electricity consumption, with high peaks being observed mostly during the summer period because of higher cooling loads and low peaks seen during the winter period or in transitional periods. Figure 3 demonstrates the projected patterns of electricity consumption by all the hospitals for the years 2026 to 2028, obtained via the scenario-based growth model.

2.2. Dataset

2.2.1. TerraClimate Data

The long-term feasibility and appropriateness of using PV technology in response to future changes in climatic conditions can be assessed by examining the spatiotemporal variability of photovoltaic energy resources in the selected regions using high-resolution TerraClimate data [46]. Monthly climate information in TerraClimate is available at a spatial resolution of about 1/24° (~4 km), which helps to analyze climatic aspects associated with solar energy generation in detail [47,48]. High accuracy is extremely important for Turkey due to the varying climatic conditions in different regions. The dataset was used to identify long-term fluctuations in climatic factors affecting photovoltaic cell systems, such as solar radiation and air temperature [47]. Furthermore, the data were used to determine the power generation capacity of the photovoltaic cell systems and whether the grid-connected photovoltaic cell system was sufficient to cover the hospital’s projected power needs in the case study. Future climate changes have been taken into account in this regard to ensure sustainability.
The TerraClimate dataset consists of various datasets, including climatically average normal values provided by WorldClim v1.4 and v2.0 [49], monthly anomalies generated from the CRU TS v4.0 dataset [50], and JRA-55 (Japanese 55-year reanalysis) [51]. This approach makes it possible to obtain spatially and temporally consistent climatic layers for the period from 1958 to approximately the present time. In this particular analysis, the period 1958–2024 was considered in order to analyze trend patterns of maximum temperature (Tmax), minimum temperature (Tmin), near-surface wind speed (WS), and downwelling shortwave solar radiation ( R S D S ), as well as rainfall (R). Since there is no direct data on average air temperature (Tav) from TerraClimate, Tav was estimated using Tmax and Tmin. It should be noted that this approximation is commonly used in climatology research.

2.2.2. Dust Extinction Aerosol Optical Thickness (AOT) Data

Dust Extinction Aerosol Optical Thickness (AOT) is a dimensionless parameter that quantifies the attenuation of solar radiation due to scattering and absorption by dust particles in the atmosphere, thereby reducing the solar energy available at Earth’s surface [52,53]. Dust Extinction AOT was considered because dust particles in the atmosphere reduce the solar radiation available for photovoltaic applications [54]. The monthly values of the Dust Extinction Aerosol Optical Thickness (AOT) at 550 nm for the years between 1981 and 2024 were acquired from the NASA Giovanni online data analysis and visualization web portal. Dust Extinction AOT is an absolute measure that quantifies the reduction in the total incident solar radiation in the atmosphere due to scattering and absorption of sunlight by dust particles present in the atmosphere [55]. The area-averaged version of this variable was used, meaning that monthly Dust Extinction AOT values were averaged over the spatial extent of the region under study to reflect the atmospheric dust extinction properties of the region as a whole [56]. The NASA Giovanni web portal was chosen as the source of this dataset since it offers easy access to consistent atmospheric data generated by NASA Earth observation and atmospheric reanalysis products [57]. This particular atmospheric variable is especially useful in assessing PV power generation potential, since it quantifies the total impact of atmospheric dust on solar radiation availability.

2.3. Photovoltaic Resource Index

Photovoltaic (PV) power generation from a site depends on two criteria: (a) photovoltaic power generation potential ( P V o u t p u t ) and (b) installation capacity. P V o u t p u t is described in this research study as dimensionless, where the potential for photovoltaic power generation takes into account the performance of photovoltaic power based on the available conditions. Therefore, multiplying the P V o u t p u t by the nominal photovoltaic power installation capacity in watts will result in instantaneous photovoltaic power output. The potential for generating photovoltaic energy includes the amount of available resources, but it also takes into account the effects of other weather factors on the efficiency of photovoltaic cells, as the efficiency of these cells decreases with increasing temperature [58].
For the assessment of the potential for solar photovoltaic energy production, the photovoltaic resource index ( P V r e s ) was computed. This index considers the effect of heat losses and aerodynamic losses on the effectiveness of the PV cells [47]. The P V r e s is used as a measure of photovoltaic energy production potential that is affected by climate-related energy loss factors. From the literature, it can be represented as follows according to Jerez et al. [59,60]:
P V r e s = P R t × R S D S t R S D S S T C
P R t = 1 + γ T c e l l t T S T C
T c e l l t = c 1 + c 2 T A S t + c 3 R S D S t + c 4 W S t
where S T C refers to standard test conditions ( R S D S S T C = 1 kW/m2), P R is the performance ratio, T c e l l in the PV cell temperature, and T S T C   = 25 ° C and γ is taken here as −0.005 ° C 1 , considering the typical response of monocrystalline silicon solar panels according to Tonui and Tripanagnostopoulos [61], with c 1 = 4.3 °C, c 2 = 0.943, c 3 = 0.028 °C m2/W and c 4 = −1.528 °C s/m according to Chenni et al. [62], T A S is surface air temperature and W S   is surface wind velocity.

2.4. Energy Model

PV energy production potential in this research was estimated using climate-based modeling using TerraClimate data. The R S D S , T A S and W S were used to obtain the P V r e s , which takes into account any impact of temperature and winds on PV module efficiency. In estimating the energy production of the PV arrays, plane-of-array irradiance, which is obtained using R S D S , is the main parameter used. This irradiance is the radiation falling on the PV module surface. The rooftops and carports’ PV arrays were set at optimal orientation angles for maximum annual solar energy exposure.
The optimum values of orientation angles, including slopes and azimuths angles, obtained using the photovoltaic geographic information system (PVGIS) are listed in Table 2. It is important to emphasize that PVGIS is applied to find the optimum values of orientation angles according to the existing literature [63,64,65]. The tilt angles (31–34°) refer to the angles at which the photovoltaic cell arrays are tilted relative to the horizontal ground. These tilt angles are close to the latitude of the sites, which is an expected observation because the optimal tilt for photovoltaic arrays installed in the Northern Hemisphere should be close to the latitudes of the region, with possible variations due to seasonal and atmospheric factors. The optimum fixed tilt allows the achievement of balanced annual performance, since it maximizes solar energy input in both winter and summer seasons. An azimuth angle is an indicator of the horizontal orientation of the PV panels, assuming that 0° is directed south. Azimuths in your results vary from −1° to +8°, which means that all systems are installed southward with very slight errors. Minor deviations may be considered optimal for a particular area due to site-specific considerations, such as solar irradiance characteristics and weather conditions.
It should be noted that these orientation angles were used to determine the optimal configuration for mounting photovoltaic panels. In addition, the current study focuses on fixed-tilt PV systems, which are the most common configuration of PV systems used in rooftop and carport installations. Although sun-tracking systems are capable of increasing electricity production through continuous tracking of the sun’s movement, they require additional investment, space, and maintenance [66]. Thus, analysis of solar tracking systems is out of the scope of this study.
P V r e s output represents the efficient solar energy resource available for generating electricity from photovoltaic cell technology, which is climate-dependent. Electricity production ( E P ) was subsequently estimated based on the photovoltaic solar energy efficiency and system efficiency as Equation (5).
E P = P V r e s × η s y s × A × t
where η s y s is the overall system efficiency (including inverter, wiring, and mismatch losses), A is the installed PV area, and t is the time period.
The variable chosen for solar energy input is TerraClimate’s R S D S . Considering that RSDS is the measure of irradiance received on a horizontal surface, any transposition models (such as those for plane-of-array irradiance) were not employed. The installation of photovoltaic cell arrays was considered under ideal conditions of constant tilt and angle, whereby P V r e s can therefore be considered the maximum potential of photovoltaic energy resources derived from climatic influences.
Further, to study the effect of panel orientation on photovoltaic power generation estimation, monthly photovoltaic power generation values using the TerraClimate-based methodology were compared with corresponding PVGIS estimates. It should be noted that the PVGIS estimation takes into account the optimal module tilt and orientation due to the use of irradiance transposition models, while the proposed method uses RSDS on the horizontal plane. This comparison aimed to study the reliability of the proposed methodology and the effect of panel orientation on the estimation of monthly photovoltaic power generation.
Moreover, the capacity factor ( C F ) refers to the ratio between the actual electrical power generated by a photovoltaic solar power system and the maximum amount of electricity that could be produced if the photovoltaic solar power system operated at full capacity during a given period of time [67].
C F = E A C d P I C 1 T h
where T h is the total expected number of hours of operation in a given period.

2.5. Long-Term Climatic Changes in PV Electricity Generation

To analyze the impact of decades of climate variability on electricity production by photovoltaic units, a comparative decade analysis was performed using the calculated monthly values of photovoltaic electricity generation ( E P ). The comparative analysis is based on the historical data of the TerraClimate dataset for the period from 1958 to 2024. The comparative analysis is based on historical data from the TerraClimate dataset for the period from 1958 to 2024. The period under study has been divided into successive decades (1958–1967, 1968–1977, 1978–1987, 1988–1997, 1998–2007, 2008–2017, and 2018–2024). The average seasonal photovoltaic electricity generation was calculated to mitigate the impact of annual climate variations and identify long-term trends related to climatic conditions. Seasonal PV electricity generation was calculated using Equation (7).
E ¯ P s , i = k = 1 N E P s , k
where E ¯ P s , i is the average PV electricity generation for season (s) during period i , E P s , k is the seasonal PV electricity generation in year, ( k ) and N is the number of years within the considered period.
The percentage change ( ) in seasonal photovoltaic electricity generation from one decadal period to the next was evaluated using Equation (8).
E P , s = E ¯ P s , i + 1 E ¯ P s , i E ¯ P s , i × 100
where E P , s is the percentage change in seasonal photovoltaic electricity generation, E ¯ P s , i + 1 is the average seasonal PV electricity generation during the subsequent decadal period and E ¯ P s , i is the average seasonal PV electricity generation during the earlier decadal period.
It should be noted that positive E P , s values indicate an increase in the amount of photovoltaic electricity produced compared to the previous period. In contrast, negative values indicate a decrease in the amount of photovoltaic electricity generated.

2.6. Economic and Environmental Model

The economic feasibility of the proposed photovoltaic solar power installations was analyzed using the net present value (NPV) [68], return on investment (ROI), internal rate of return (IRR), simple payback period (SPP), Levelized energy cost (LCOE), and profitability index (PI), which are commonly used indicators in the evaluation of renewable energy projects [68,69,70,71,72]. Furthermore, the environmental impact of photovoltaic solar power installations was analyzed by estimating the following life-cycle assessment criteria: embodied greenhouse gas emissions, annual avoided CO2 emissions, carbon payback period, lifetime avoided CO2 emissions, and net lifetime CO2 benefit [73,74,75,76]. The mathematical expression for the economic feasibility indicators and life-cycle assessment criteria is shown in Table 3. The analyses were performed via MATLAB R2024a. The technical and economic analysis was conducted based on criteria representing large-scale photovoltaic power plants and the current economic conditions in Turkey. The solar system was designed using 560 W monocrystalline silicon photovoltaic panels, manufactured in Ankara, Turkey, with a project life cycle of 25 years, an average electricity tariff of 0.103 USD/kWh, a discount rate of 7%, an inflation rate of 15%, and an annual electricity price increase of 5%. Annual operating and maintenance costs were set at 1.5% of the initial cost, with the inverter to be replaced in the 13th year. The environmental assessment incorporated life-cycle greenhouse gas emissions of 520 kg CO2-eq kW−1 for PV module manufacturing, 25 kg CO2-eq kW−1 for transportation, and 125 kg CO2-eq kW−1 for mounting structures and inverter components [76]. These assumptions were used to estimate financial indicators and life-cycle assessment criteria.

2.7. Response Surface Methodology-Based Modeling of Nonlinear Reciprocal Relationships

The Response Surface Methodology (RSM) was applied to investigate the intricate, nonlinear relationships among precipitation (R), aerosol optical thickness (AOT), and photovoltaic solar energy generation (PV). The data for precipitation and aerosol optical thickness were collected from the NASA Giovanni database, whereas that of photovoltaic energy generation was computed from the datasets of solar radiation. RSM is an aggregate of statistical and mathematical methods for modeling and optimizing processes in which the output depends on multiple input factors. The purpose of applying the RSM in this work was to understand the interaction between rainfall and aerosol convection and the effect of their interaction on photovoltaic power generation.
A second-order polynomial model was selected due to the presence of nonlinearity and interactions. The general RSM formula can be written as [43]:
y i j k = β 0 + i = 1 k β j x j + j = 1 k β j j x j 2 + i < j β i j x i x j + ϵ i j k
where β 0 , β j ,   β j j , and β i j represent the overall mean effect, the effect of the j-th level of the row factor, the effect of the j -th level of column factor, and the effect of the interaction effect in the quadratic model, respectively. ϵ i j k is a random error component of a second-order RSM, where y i j k is the response and refers to the solar PV generation level in this study. x i and x j present the variables that are called factors.

3. Results

3.1. Climate Trends Threatening PV Efficiency

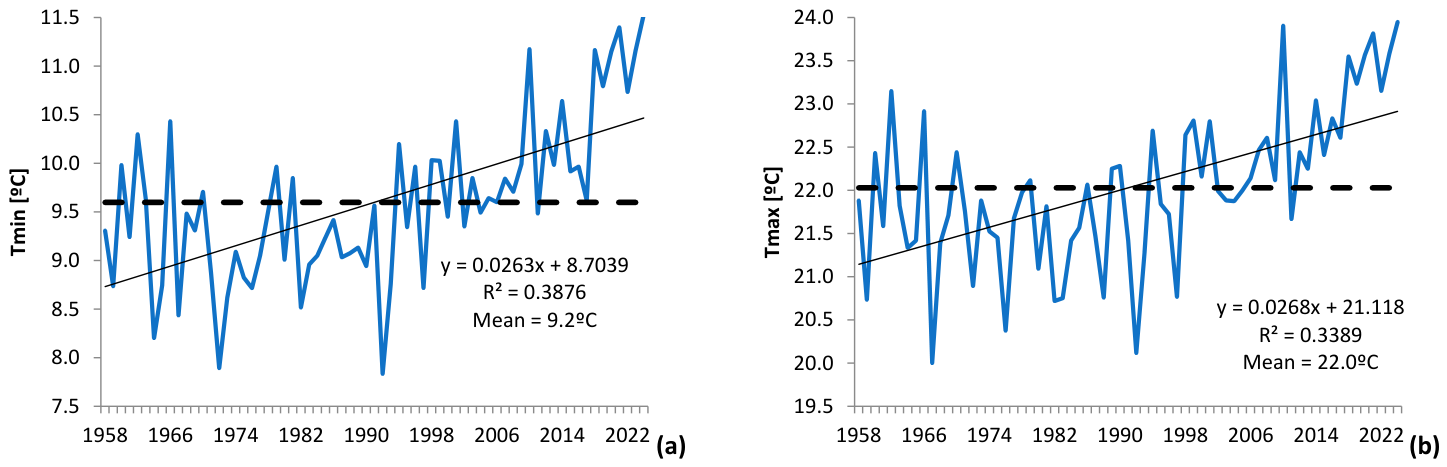
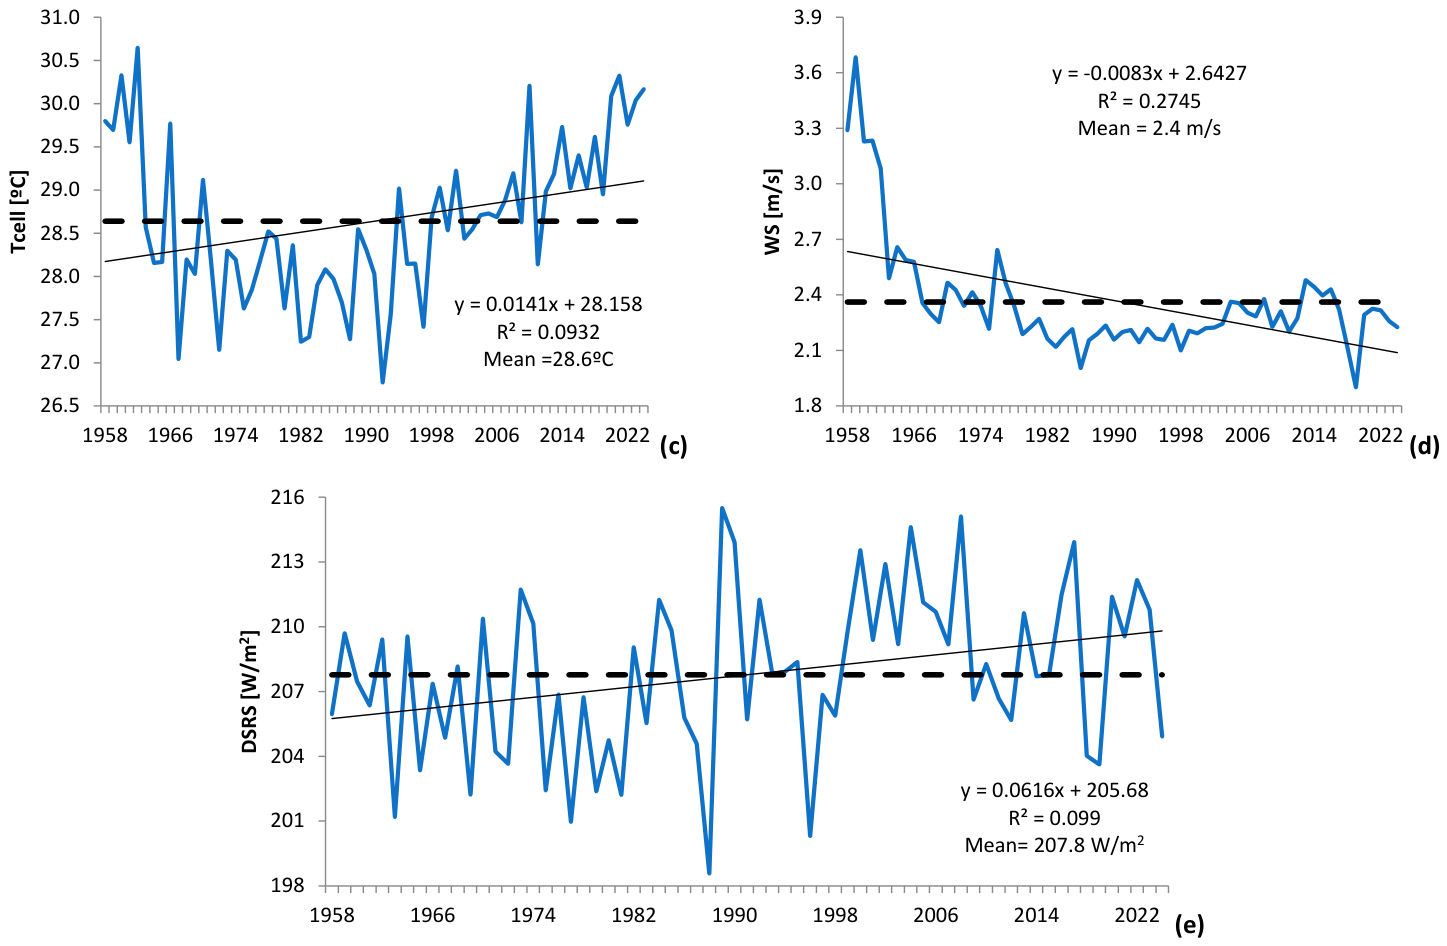
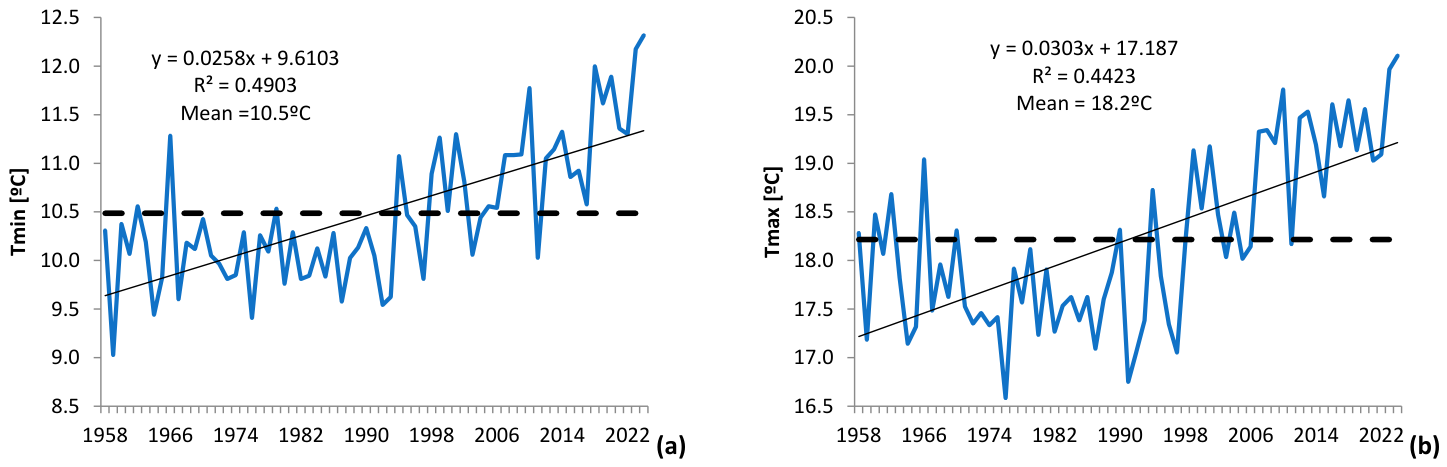
To determine the trend of climatic factors relevant to solar power generation over a long period of time at the test sites, an analysis was conducted of the annual trends of maximum temperature (Tmax), minimum temperature (Tmin), photovoltaic cell temperature (Tcell), wind speed (WS), and solar irradiance falling on the surface (DRSR). Linear regression analysis was used to determine trends in each case, and the coefficient of determination (R2) helped to measure the linearity of the relationship. These trends can provide insights into changes in local climatic conditions over six decades and their impact on hospital photovoltaic power generation, as illustrated in Figure 4 and Figure 5, as well as Figures S1–S4. These figures give the following:
  • Analysis of climate data in Gaziantep shows a clear trend towards rising temperatures for all three variables during the period 1958–2024 (Figure 4). The increase in the values of both Tmax and Tmin occurs at a rate of +0.0268 °C/year (R2 = 0.3076 and R2 = 0.3389, respectively). In addition, the unit temperature rises at a low rate of +0.0141 °C/year (R2 = 0.0932). Moreover, negative trends in wind speed were observed, with an average annual wind speed of 2.4 m/s and a direction of approximately −0.0031 m/s/year (R2 = 0.1416). Lower wind speeds can be linked to ground calmness and thus lead to a decrease in the natural cooling efficiency of photovoltaic cells. In addition, DSRS is characterized by an extremely low trend of +0.054 W/m2/year (R2 = 0.0309). With an annual average of 207.8 W/m2, solar radiation remains relatively constant during the studied time period, and temperature changes represent the main factor affecting the future performance of photovoltaic cell technology.
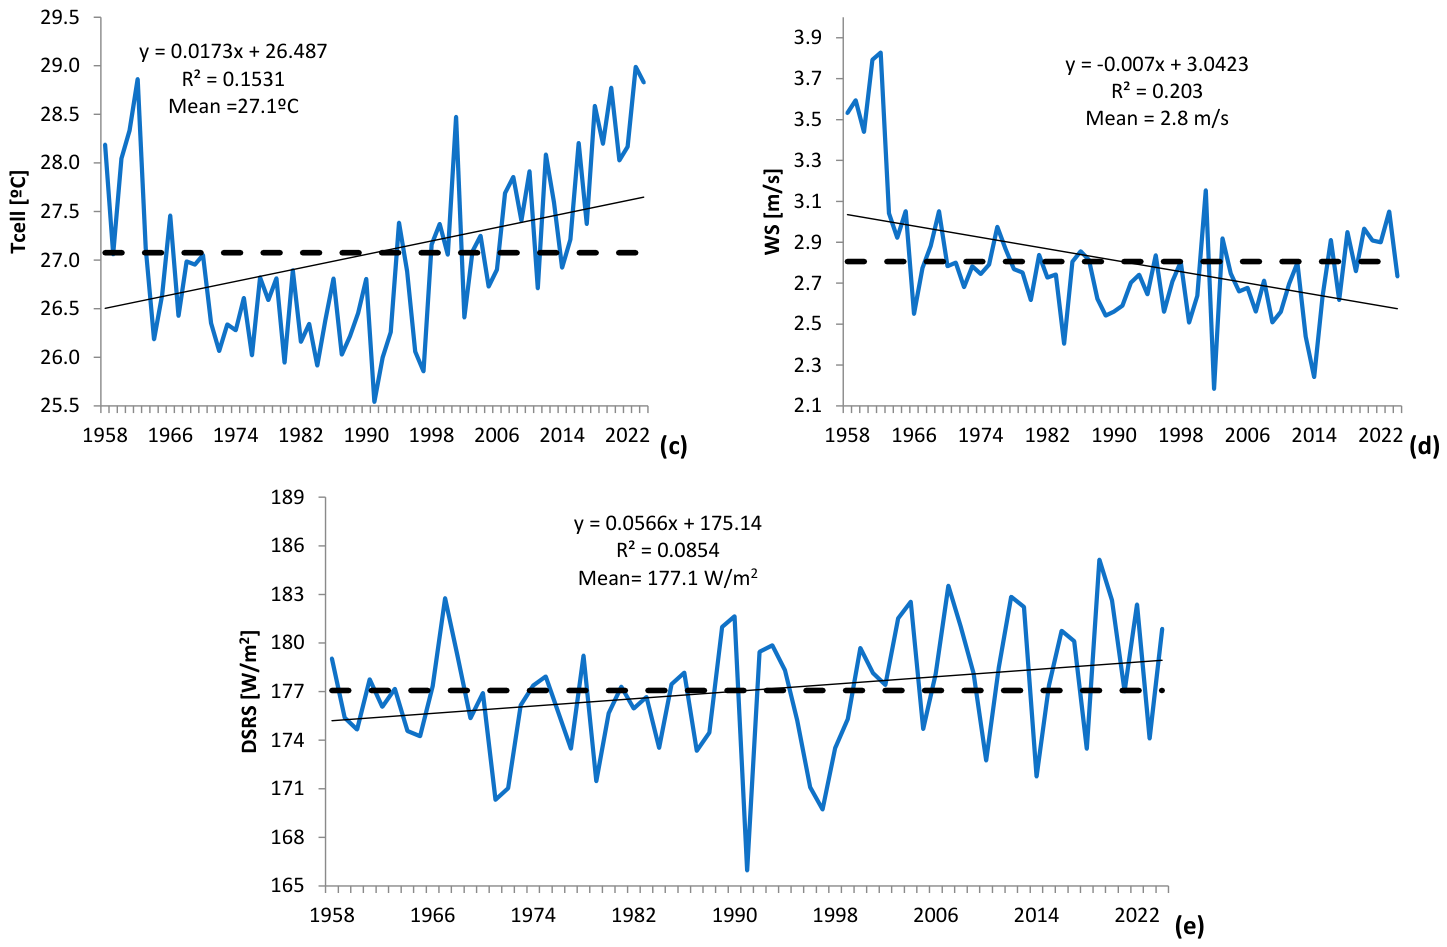
  • All temperature parameters in Başakşehir show positive trends from 1958 to 2024 (Figure 5). It is found that Tmin has increased by +0.030 °C/year (R2 = 0.4243), while Tmax has increased by +0.025 °C/year (R2 = 0.4030). The strongest warming effect is observed in the Tmin parameter, indicating that night-time temperature increased more rapidly than daytime temperature. PV cell temperature has been growing at +0.0173 °C/year (R2 = 0.1561), implying increasingly warm conditions for the operation of photovoltaic devices. Furthermore, wind speed demonstrated a negative trend of about −0.007 m/s/year (R2 = 0.2030), with an average value of 2.8 m/s. Also, the DSRS has demonstrated a slight positive trend of +0.0566 W/m2/year (R2 = 0.0854), with a mean value of 177.1 W/m2. Despite the increased solar radiation values, the simultaneous increase in both air temperature and cell temperature may hinder potential improvements in power generation due to decreased efficiency.
  • Temperature-based variables in Adana demonstrate obvious positive long-term trends between 1958 and 2024 (Figure S1). Annual maximum temperature (Tmax) had a growing rate of +0.025 °C/year (R2 = 0.3702), while the minimum temperature (Tmin) had a growth of +0.025 °C/year (R2 = 0.3453). At the same time, PV cell operating temperature (Tcell) also had a significant increasing rate equal to +0.0197 °C/year (R2 = 0.2176). The obtained results indicate the presence of strong warming trends both for ambient and PV operating temperatures. In addition, the annual average wind speed (WS) in Adana has shown a negative linear regression with the rate of −0.005 m/s/year (R2 = 0.1722). In addition, the annual mean wind speed is 2.0 m s−1 (Figure S1d). Such trends can lead to reduced convective cooling of PV panels, increasing the thermal effect on their energy conversion process. Also, downward surface solar radiation (DSRS) had a weakly positive correlation of +0.0328 W/m/year (R2 = 0.0451), with the average value of DSRS equal to 204.5 W m−2. Therefore, despite a slight positive correlation, the rising temperature can reduce the efficiency of PV cells.
  • All variables related to temperature in Bursa Şehir Hospital reveal increasing long-term tendencies between 1958 and 2024 (Figure S2). For instance, the rate of rise in annual Tmax equals about +0.0232 °C/year (R2 = 0.483; mean = 9.5 °C). In addition, Tmin demonstrates an almost similar temperature trend of about +0.028 °C/year (R2 = 0.413; mean = 20.0 °C), which reflects the largest increment in temperature out of all studied parameters. Finally, the positive Tcell values show the highest trend equal to +0.0055 °C/year (R2 = 0.032; mean = 27.6 °C). However, the increase in temperature for this variable is significantly lower compared to the air parameters. In addition, the annual WS value exhibits a strong downward trend of about −0.0128 m/s/year (R2 = 0.207; mean = 2.7 m s−1) (Figure S2d). This means that during the 66-year study period, there has been a decrease in the annual WS by 0.84 m/s. The negative slope is in line with the decreasing trend throughout the record and is considered one of the strongest trends among all variables. Furthermore, the DSRD variable exhibits a positive trend of about +0.0499 W/m2/year (R2 = 0.040; mean = 186.1 W m−2) (Figure S2e). Despite a large variation from year to year, there seems to be an increasing trend in DSRD values in Bursa.
  • As shown in Figure S3, positive trends prevail among all temperature-related parameters in Elazig Şehir Hospital for the period 1958–2024. Specifically, the Tmax annual time series experiences a growing trend by roughly +0.0237 °C/year (R2 = 0.076; mean = 8.2 °C), whereas Tmin has a trend of +0.0208 °C/year (R2 = 0.300; mean = 18.5 °C). Similarly, the Tcell annual time series has a growing trend of roughly +0.0164 °C/year (R2 = 0.084; mean = 25.3 °C). In addition, the annual time series of the wind speed shows a decreasing trend of approximately −0.0077 m/s/year (mean = 2.1 m s−1). Accordingly, this parameter declines from the initial level by about 0.5 m s−1 throughout the period of observations. In contrast to wind speed, the annual time series of the DSR has a small positive trend of about +0.0262 W m−2 year−1 (R2 = 0.177; mean = 200.0 W m−2). Though a considerable amount of interannual variation is observed, it should be recognized that a slight increasing trend is revealed for the period of the study.
  • Long-term trends of solar-relevant climate parameters in Yozgat Şehir Hospital are given in Figure S4. Both air temperature measures show an increasing trend during 1958–2024. Annual Tmax changes with an approximately linear rate of +0.0205 °C/year (R2 = 0.063; mean = 3.1 °C), whereas the Tmin parameter shows a slightly faster warming trend of +0.0251 °C/year (R2 = 0.077; mean = 14.5 °C). The Tcell series demonstrates an extremely low increasing trend of approximately +0.0004 °C/year (R2 = 0.0005; mean = 21.9 °C), implying that PV module temperatures have hardly changed within the long-term analysis period concerning the increasing air temperature measured. Additionally, a noticeable decreasing trend in annual wind speed is recorded, amounting to a reduction of about −0.0149 m/s/year (R2 = 0.205; mean = 2.6 m s−1). The total decrease amounts to nearly 1.0 m s−1, indicating the largest trend among all examined parameters. Moreover, the DRSR index does not change at all during the long-term analysis period, showing virtually no trend of +0.0002 W/m2/year (R2 = 0.019; mean = 193.2 W m−2).
Figure 4. Long-term annual trends (1958–2024) of solar-relevant climate variables in Gaziantep Şehir Hospital for (a) Tmax, (b) Tmin, (c) Tcell, (d) WS and (e) DSRS (blue color: variation of annual value, dotted line: mean value, line: trend line).
Energies 19 03589 g004aEnergies 19 03589 g004b
Figure 5. Long-term annual trends (1958–2024) of solar-relevant climate variables in Başakşehir Şehir Hospital for (a) Tmax, (b) Tmin, (c) Tcell, (d) WS and (e) DSRS (blue color: variation of annual value, dotted line: mean value, line: trend line).
Energies 19 03589 g005aEnergies 19 03589 g005b
Table 4 lists the summary of long-term trends (1958–2024) of solar-relevant climate variables at Turkish hospital locations. Comparing the locations of the six hospitals provides insights into the spatial variations that characterize long-term changes in solar-related climate parameters. Among the study sites, the highest annual warming rate (Tmax) occurred in Gaziantep at +0.0268 °C per year, while the lowest annual warming rate (Tmax) was observed in Yozgat at +0.0205 °C/year. The highest annual increase in minimum temperature (Tmin) was recorded in Başakşehir, at +0.0300 degrees Celsius per year, indicating higher nighttime temperatures, while the lowest annual increase in minimum temperature (Tmin) was recorded in Elazığ, at +0.0208 °C/year. When it comes to the rate of increase in Tcell temperature, Adana recorded the highest warming trend at +0.0197 °C/year; while the lowest change in operating temperatures occurred in Yozgat (+0.0004 °C/year). In the case of wind speed trends, consistent negative trends were observed at all measurement stations, albeit at varying levels. In terms of wind speed trend rates, the greatest was observed in Yozgat (−0.0149 m/s/year), where the least natural convective cooling was reported compared to other stations. However, Gaziantep had the lowest wind speed rate (−0.0031 m/s/year). In terms of DSRS trends, the greatest positive trend was observed in Başakşehir (+0.0566 W/m2/year), implying a slightly rising solar resource potential over time, while in Yozgat (+0.0002 W/m2/year), very little change in surface solar radiation potential was observed. From the results, it is clear that all regions experience warming trends, but there are few changes in solar radiation potentials. As a result, increased temperatures of both air and PV modules, coupled with decreased wind speed, are expected to affect PV efficiency more than variations in solar radiation potential.

3.2. Temporal Climatology of Photovoltaic Resource Availability

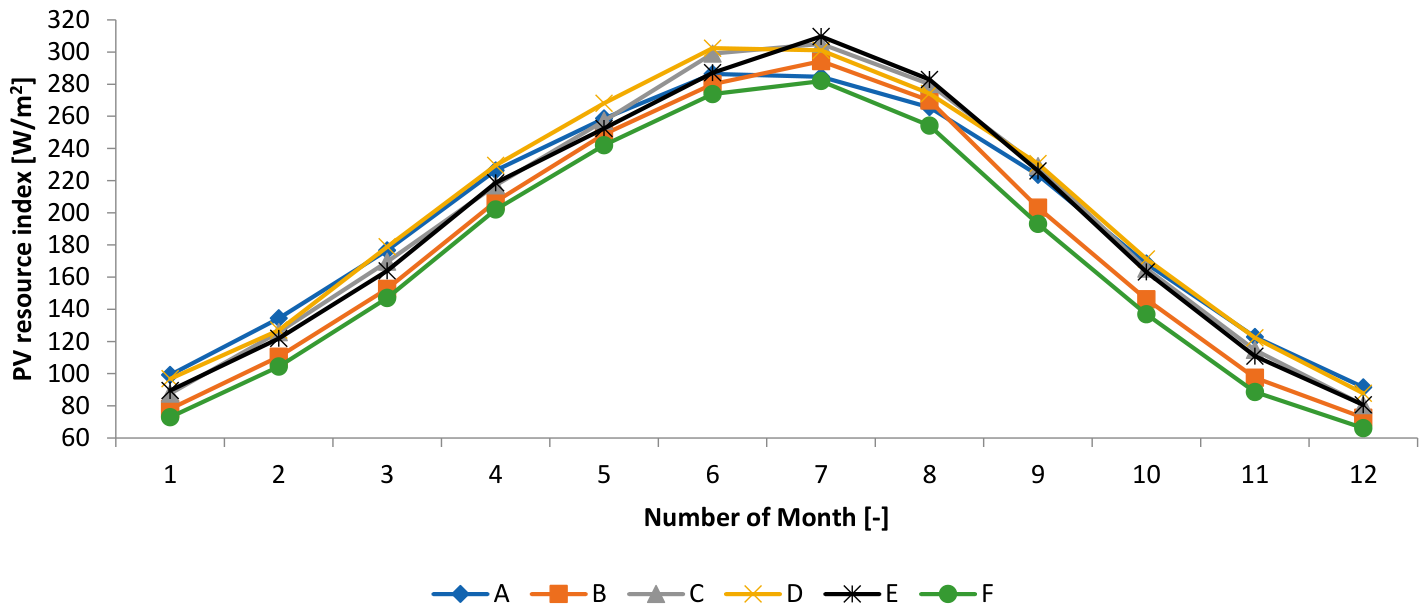
The climatological seasonal cycle of photovoltaic energy resource potential ( P V r e s ) over the six hospital locations chosen in Türkiye is illustrated in Figure 6 for the period from 1958 to 2024. In all cases, P V r e s is found to increase progressively from winter months into summer, peaking in July and then decreasing again into wintertime. The monthly mean values vary between about 70–95 W/m2 during December–January up to around 290–310 W/m2 in July, thus exhibiting a seasonal amplitude in excess of 210 W/m2. Moreover, it is found that the maximum P V r e s levels occur at Elazığ Şehir Hospital, Gaziantep Şehir Hospital, and Yozgat Şehir Hospital, where mean values per month are greater than 300 W/m2 during the month of July. At the same time, the minimum P V r e s is measured at Başakşehir Hospital, especially during the winter months, where the P V r e s level is less than 66 W/m2. Spatial variations depend mainly on latitudinal differences and regional climates, in which the southeastern parts of Türkiye experience higher solar radiation with lower cloud coverage.
Seasonal variations indicate that June to August is the most profitable period for photovoltaic electricity production, while December and January are the least productive periods. Accordingly, energy management plans for solar energy should take into account lower production levels during the winter. Similar seasonal patterns have been reported in other parts of the Eastern Mediterranean and Middle East, which experience a peak during the summer due to high levels of solar radiation and sunlight. Similarly, the lower values observed in the winter months are attributed to the lower angles of the sun as well as cloud formation.

3.3. Long-Term Trends in Photovoltaic Resource Potential

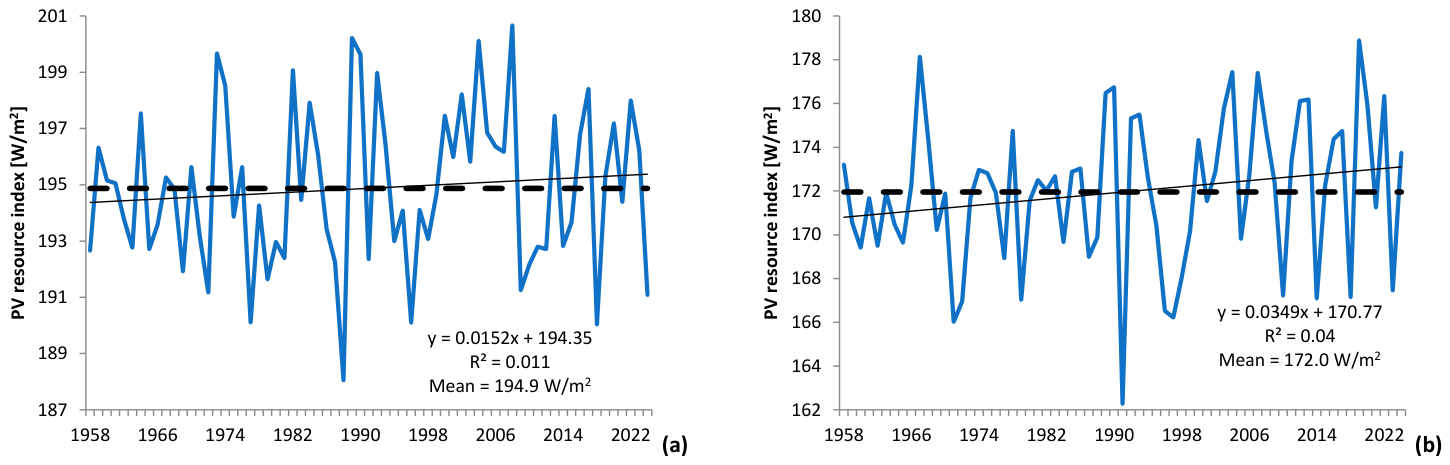
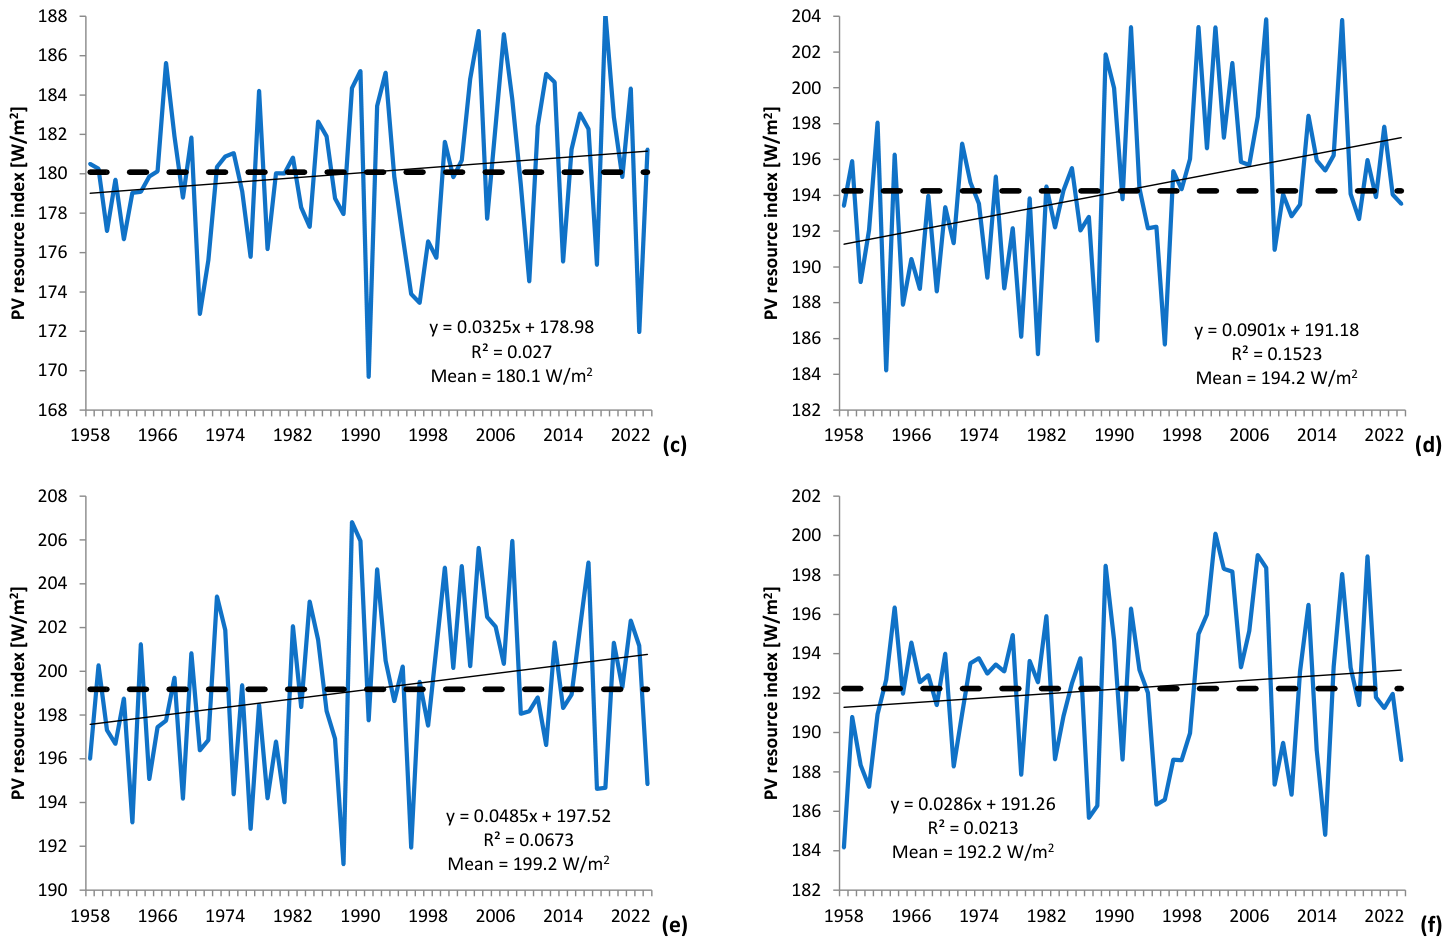
As illustrated in Figure 7, it can be observed that the long-term trends in photovoltaic solar energy resources for selected hospitals over the period from 1958 to 2024 are consistent and relatively stable, with minor variations depending on the hospital’s location. Positive trends were observed in four out of six hospitals, meaning that the availability of solar energy resources is gradually increasing over time, while negative but weak trends could be observed in two other cases. Among all hospital selections, the largest increase was found for Elazığ Şehir Hospital (0.0901 W/m2/year; R2 = 0.152), with an increase in almost 6 W/m2 over the investigated period. In Gaziantep Şehir Hospital, a considerable positive trend was found (+0.048 W/m2/year), while weaker upward trends can be found in Adana Şehir Hospital (+0.0152 W/m2/year) and Yozgat Şehir Hospital (+0.0286 W/m2/year).
In addition, the Başakşehir Şehir Hospital, and Bursa Şehir Hospital also show weak positive trends of around +0.0349 and +0.0325 W/m2/year, respectively. Still, even their coefficients of determination remain very low (R2 < 0.05). This means that the changes happening over a long time frame are explaining only a minor part of the variance. The interannual variability of the annual P V r e s values measured at all sites is very significant, with deviations of about ±10–15 W m−2 from the mean being quite frequent. The reasons for such strong year-to-year variability can be found in clouds, aerosols in the atmosphere, and large-scale climatic processes that affect the amount of solar irradiation reaching the Earth’s surface.
The mean annual P V r e s for each site differs from one another. The greatest mean resource occurs in Gaziantep Şehir Hospital, which reaches a mean of 199.2 W/m2, while the lowest occurs in Bursa, amounting to around 172.0 W/m2. Such variations highlight the impact of climate on solar energy generation potentials within Türkiye. Overall, the trend analysis reveals that there have been no significant changes in photovoltaic energy resources in the selected hospitals over the past 66 years, showing only slight increases or decreases in annual radiation amounts. The absence of significant downward trends plays a crucial role in the future development of photovoltaic cells in the region, allowing for the prediction of fairly stable power generation throughout the operational lifespan of photovoltaic cell systems in these hospitals.

3.4. Technical Viability of Rooftop and Carport Photovoltaic Systems

Based on the results above, the consistency and widespread availability of solar energy in all hospitals included in the research demonstrate that the installation of photovoltaic cells is a perfectly practical solution for providing energy in the most sustainable, economical and environmentally friendly way for hospitals in Turkey.
To assess the feasibility of applying solar energy in the healthcare sector, the roof and parking areas of six major hospitals in Türkiye were estimated using high-resolution satellite imagery from Google Maps. Foremost, the area of building roofs and parking spaces suitable for implementing photovoltaic solar power units was calculated using satellite imagery from Google Maps. Then, based on the available roof area, the estimated capacity of photovoltaic solar power units for each hospital was calculated. Thus, the capacities were calculated as follows: 47 MW for the Başakşehir Şehir Hospital, 34 MW for Bursa Şehir Hospital, 29 MW for Gaziantep Şehir Hospital, 20 MW for Adana Şehir Hospital, 19 MW for Elazığ Şehir Hospital, and 6 MW for Yozgat Şehir Hospital. These capacities were used to estimate electricity production (EP) and capacity factor (CF) based on the prevailing climatic conditions in those hospitals.
Electricity production was calculated based on the quantity of photovoltaic energy resource potential, system efficiency, and installed area according to Equation (5). As a result, variations in power generation depend not only on the local environmental conditions of the area but also on the space available for installing photovoltaic cells. In this way, hospitals with larger rooftop areas and parking lots produce significantly more electricity annually than others.
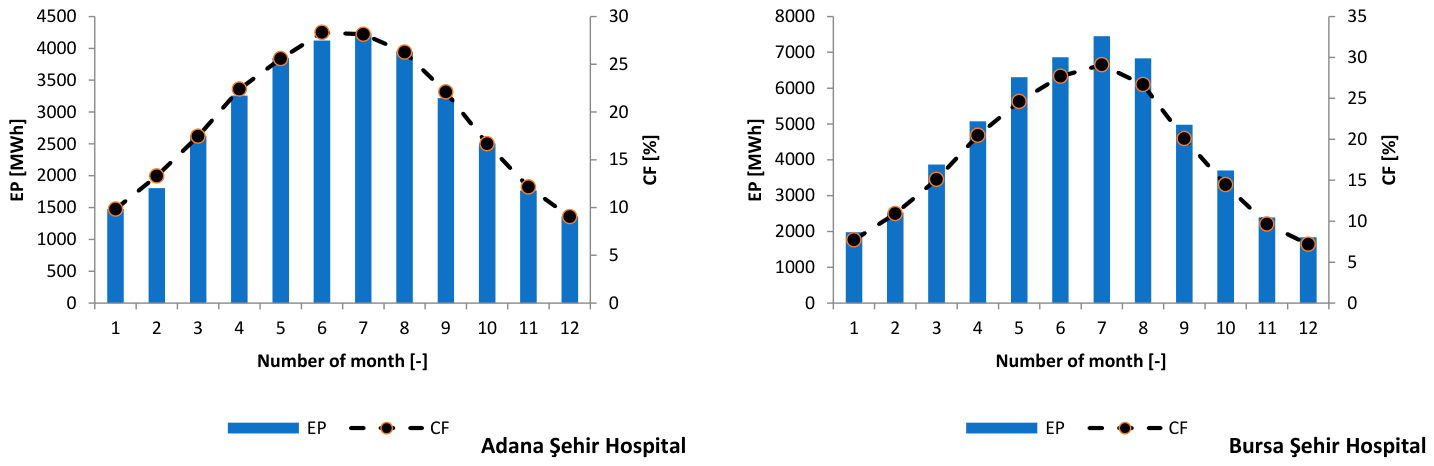
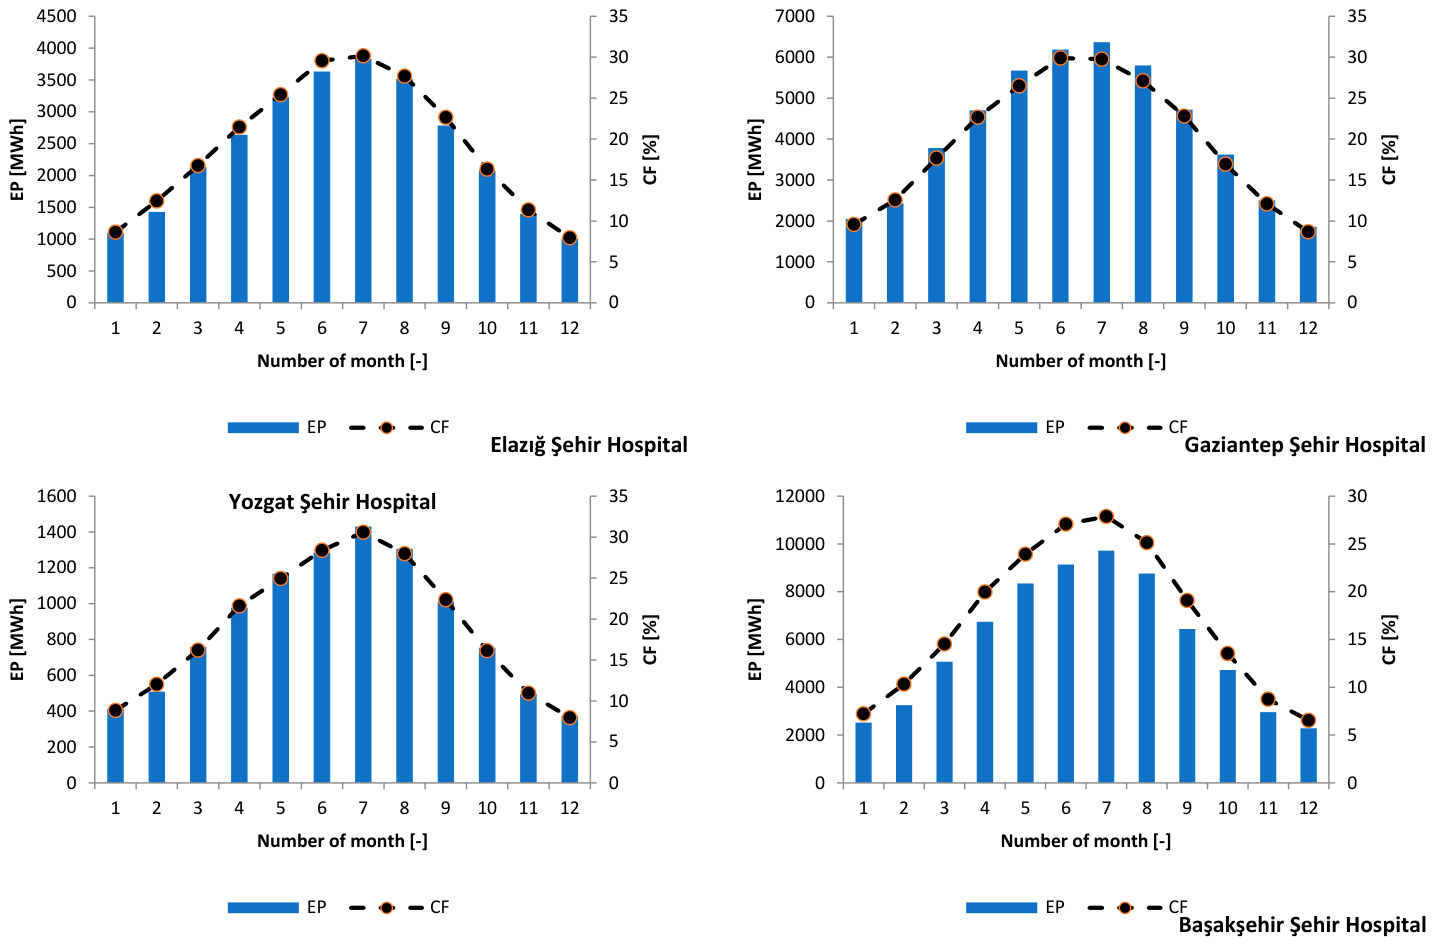
Seasonal variations in the EP and CF of the hospital systems under consideration are quite noticeable (Figure 8). There is an increase in electricity production starting from winter and proceeding up to summer, where a maximum EP occurs in June–August, after which the generation falls off until winter minima. The mentioned trend correlates with the annual seasonal pattern of solar radiation in Türkiye and highlights the influence of the photovoltaic potential on the system efficiency. Başakşehir Hospital is the site that shows the largest monthly electricity production among the hospitals examined. Its annual value in the summer is approximately 27,630 megawatt-hours, which is determined by its relatively large capacity (47 MW) rather than favorable conditions for solar power generation. In addition, increased electricity production was also observed at Bursa Shahir Hospital and Gaziantep Shahir Hospital, where the values for June, July, and August reached 6862, 7452, and 6832 megawatt-hours, respectively. In contrast, the lowest energy level was observed at the famous Yozgat Hospital due to its small capacity (6 MW), with a peak value in July of 1431 MWh.
In addition, the variation in CF on a monthly basis in all hospitals is strikingly similar in nature. The monthly CF is observed to lie within 8–12% during December and January, while it rises to about 27–30% in the months of June and July. Among all cities, the Gaziantep and Adana hospitals have the highest summer CF values owing to the fact that they have better radiation availability in the southern part of Türkiye. In contrast, the Bursa and Başakşehir hospitals possess somewhat smaller values due to their northern location, coupled with increased cloudiness. However, annual values for CF in all the locations studied are comparable to those of international utilities’ values. It is interesting to note that the peak electricity generation coincides with the peak capacity factor in the summer, which underscores the important role that photovoltaic solar power systems play in supplying hospitals with electricity, especially during the summer months when cooling systems are in high demand.
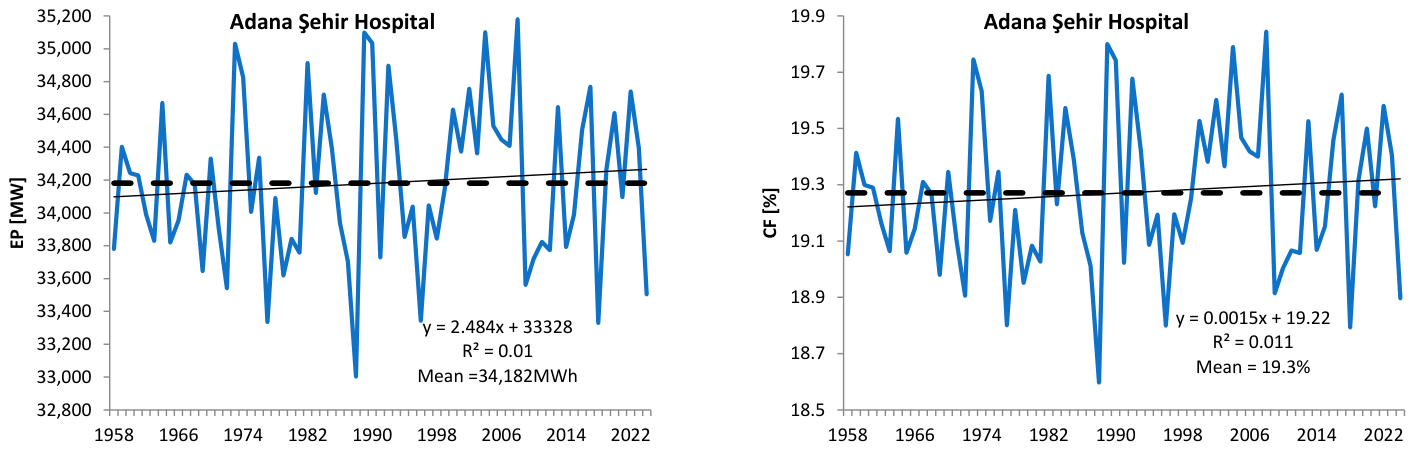
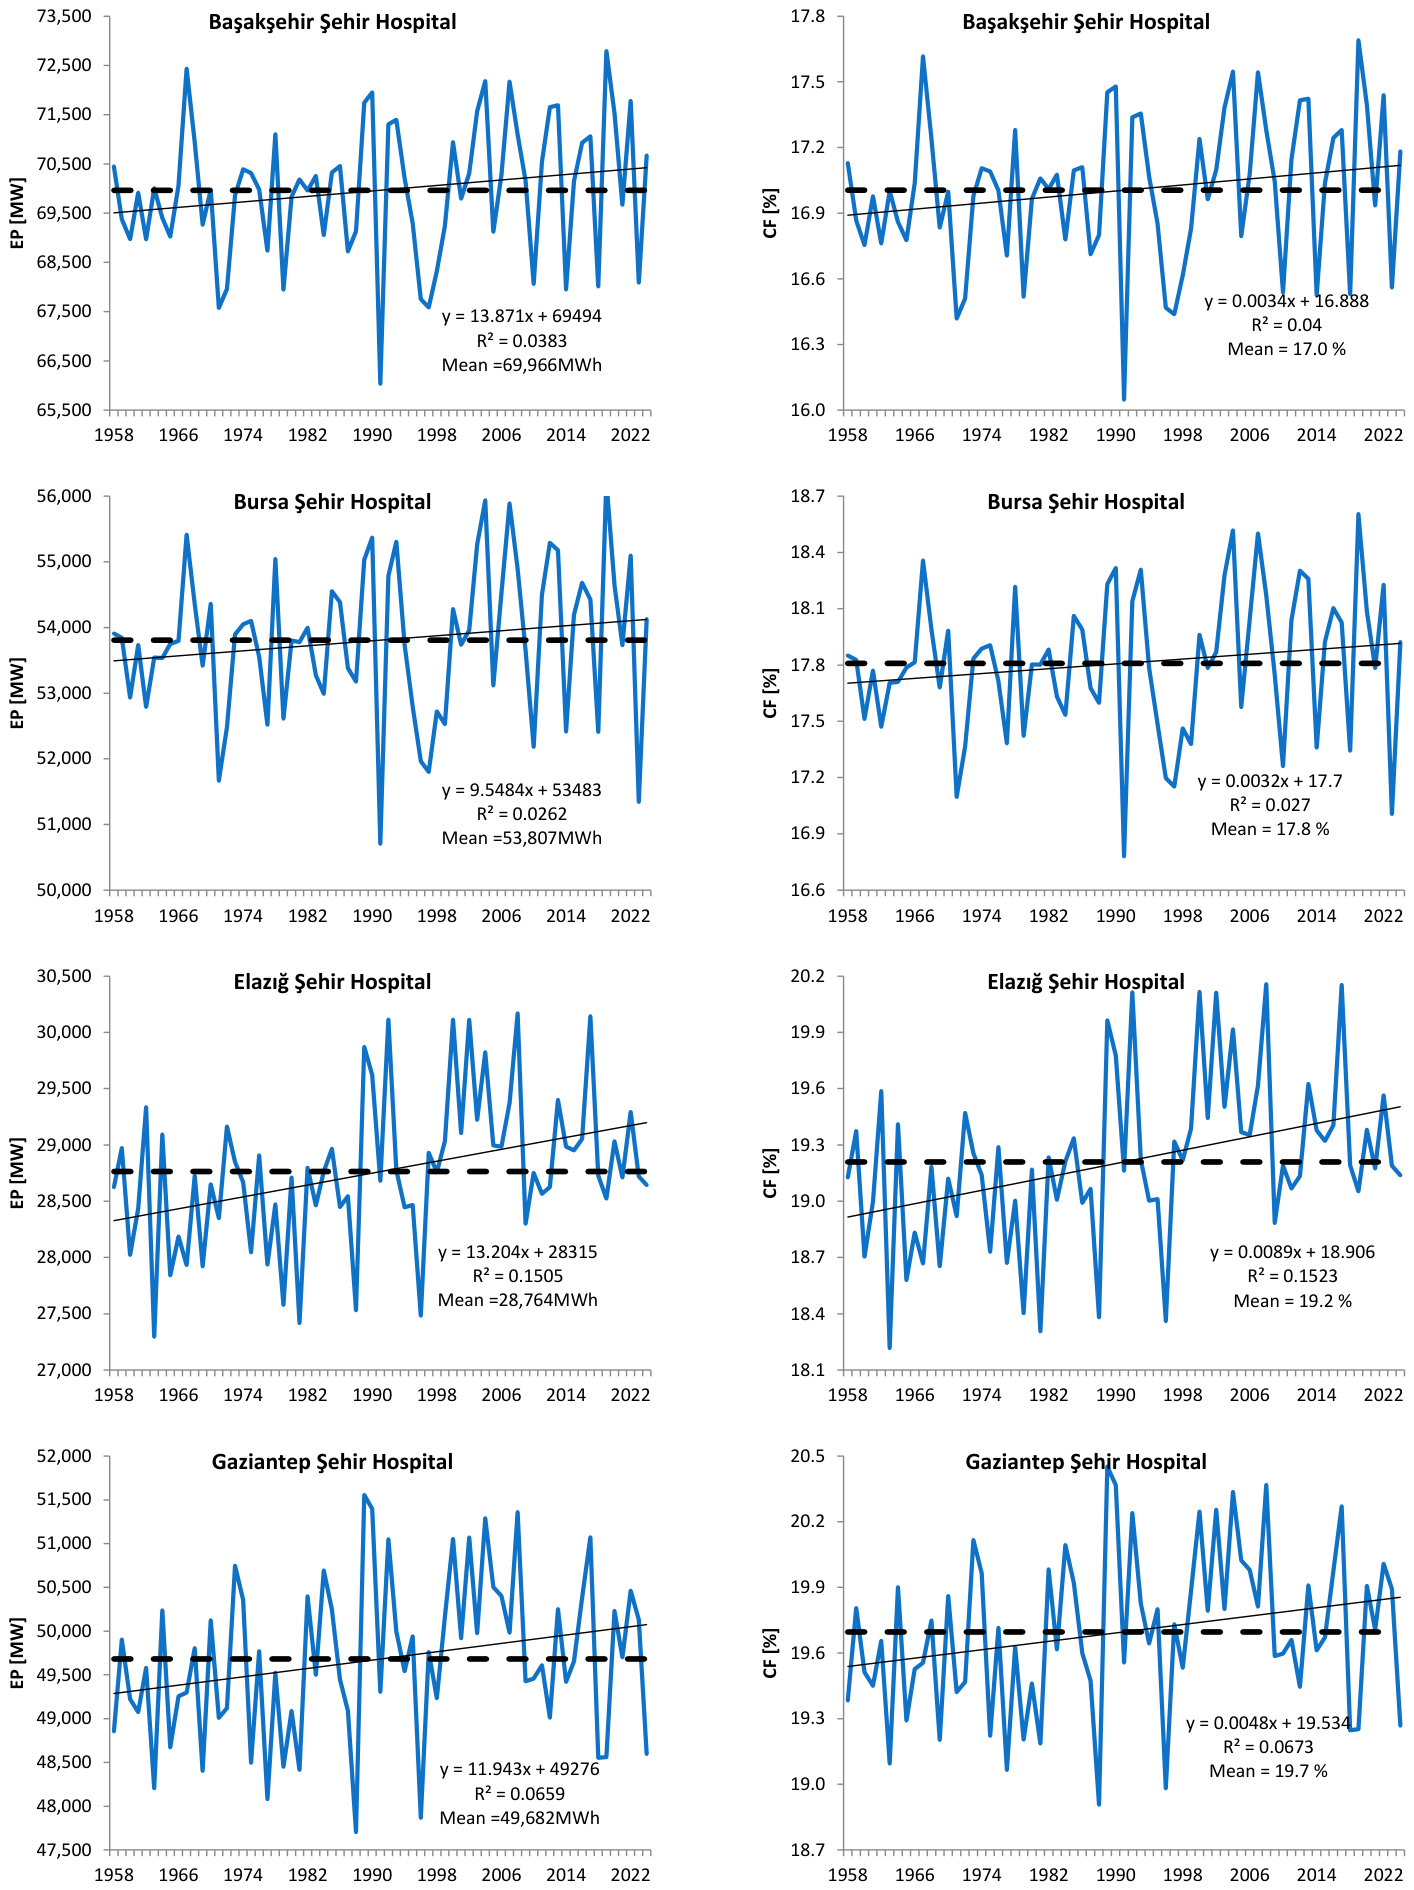
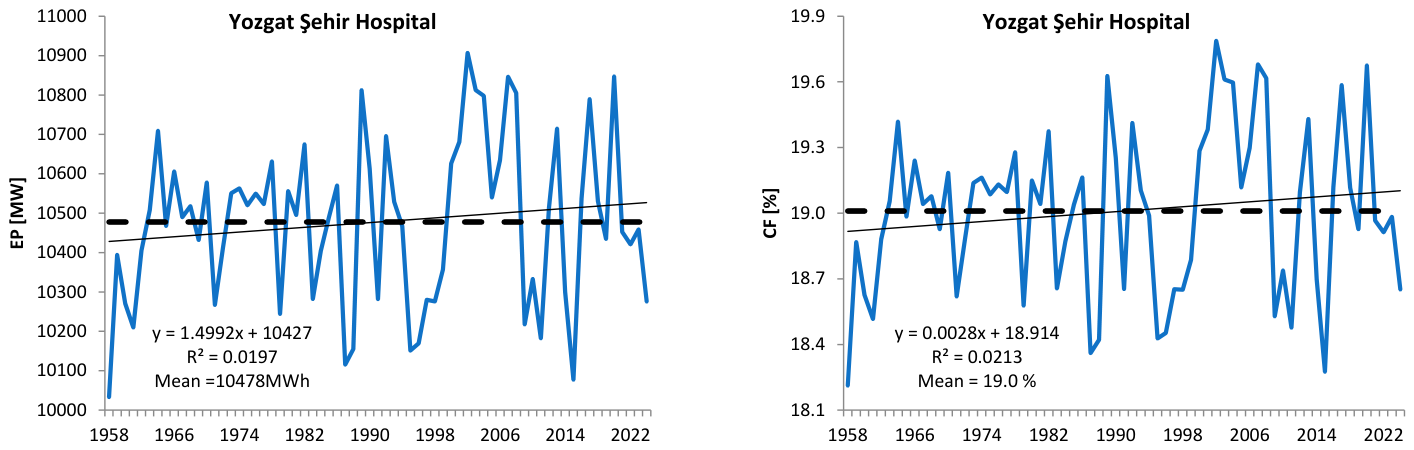
Regarding the long-term changes in annual electricity production and power factor between 1958 and 2024, the trend analysis shows a steady and continuous improvement in the performance of photovoltaic cells at selected hospital sites (Figure 9). The long-term positive tendencies for both EP and CF values for all selected locations show that climate factors have been stable enough to provide consistent production of photovoltaic power throughout the studied period. The highest rates of electricity production growth per year can be noted for the facilities of Başakşehir Şehir Hospital, where annual growth is about 13.9 MWh/year; then Elazığ Şehir Hospital (13.2 MWh/year), Gaziantep Şehir Hospital (11.9 MWh/year), Bursa Şehir Hospital (9.5 MWh/year), Adana Şehir Hospital (2.5 MWh/year), and Yozgat Şehir Hospital (1.5 MWh/year).
Although these growth rates may seem small compared to annual fluctuations, they still reflect a long-term improvement in potential solar energy production. Similarly, some positive tendencies are found in the capacity factor data. Yearly increases in the CF vary from about 0.002 to 0.009 percentage points per annum, based on the geographical location. The capacity factor shows the highest yearly increase in Elazığ, then Gaziantep, and Başakşehir. The relatively low coefficients of determination show that year-to-year changes in CFs are mainly associated with interannual climate variations, but persistently positive trends indicate that no long-term depletion in solar resource availability has been observed over the last 60 years. The mean annual electric power generation depends on the climate conditions and the capacity installed. The highest mean annual generation rate is achieved by Başakşehir Şehir Hospital (about 69,656 MWh), followed by Bursa (53,807 MWh), Gaziantep (49,682 MWh), Adana (33,482 MWh), Elazığ (28,764 MWh), and Yozgat (10,478 MWh). The mean annual capacity factors vary from 17.0% to 19.7%. These values can be considered satisfactory for the good performance of solar photovoltaic systems in a Mediterranean climate.
In summary, the results indicate that the use of photovoltaic power stations on rooftops and parking lots in selected hospitals represents a highly viable option for renewable energy technology. Given the large area available identified using Google Maps, good solar energy resources, long-term stable climate trends, and a capacity factor of around 20%, photovoltaic power plants arguably have very promising prospects in terms of helping hospitals meet their energy needs.

3.5. Comparison of Energy Production Estimations Using TerraClimate-Based Methodology and PVGIS

To assess the reliability of the TerraClimate approach developed, the calculated monthly solar power generation potential of the photovoltaic cell systems was compared with corresponding values generated using the photovoltaic geographic information system (PVGIS). For this purpose, a PVGIS simulation was performed based on the SARAH3 solar radiation dataset because it is specifically designed for solar energy studies and provides high-resolution radiation data derived from satellites for Europe, including Turkey. In comparison with reanalysis data, SARAH3 is commonly used for the estimation of PV potential due to its high spatial resolution and accurate representation of surface solar radiation. In addition, PVGIS takes into account the optimal module tilt and azimuth by means of its irradiance transposition models.
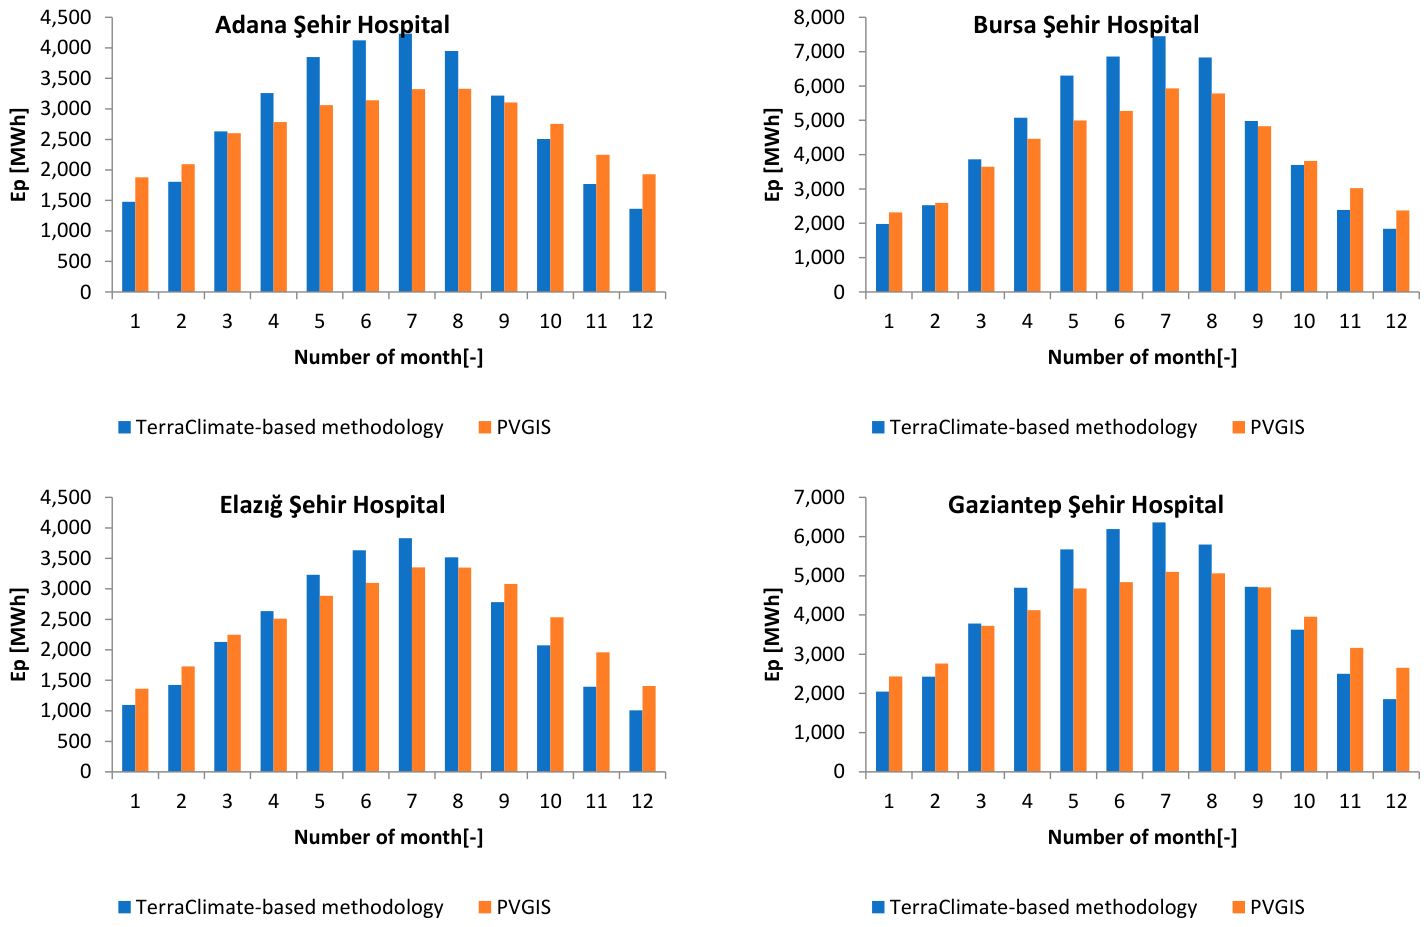
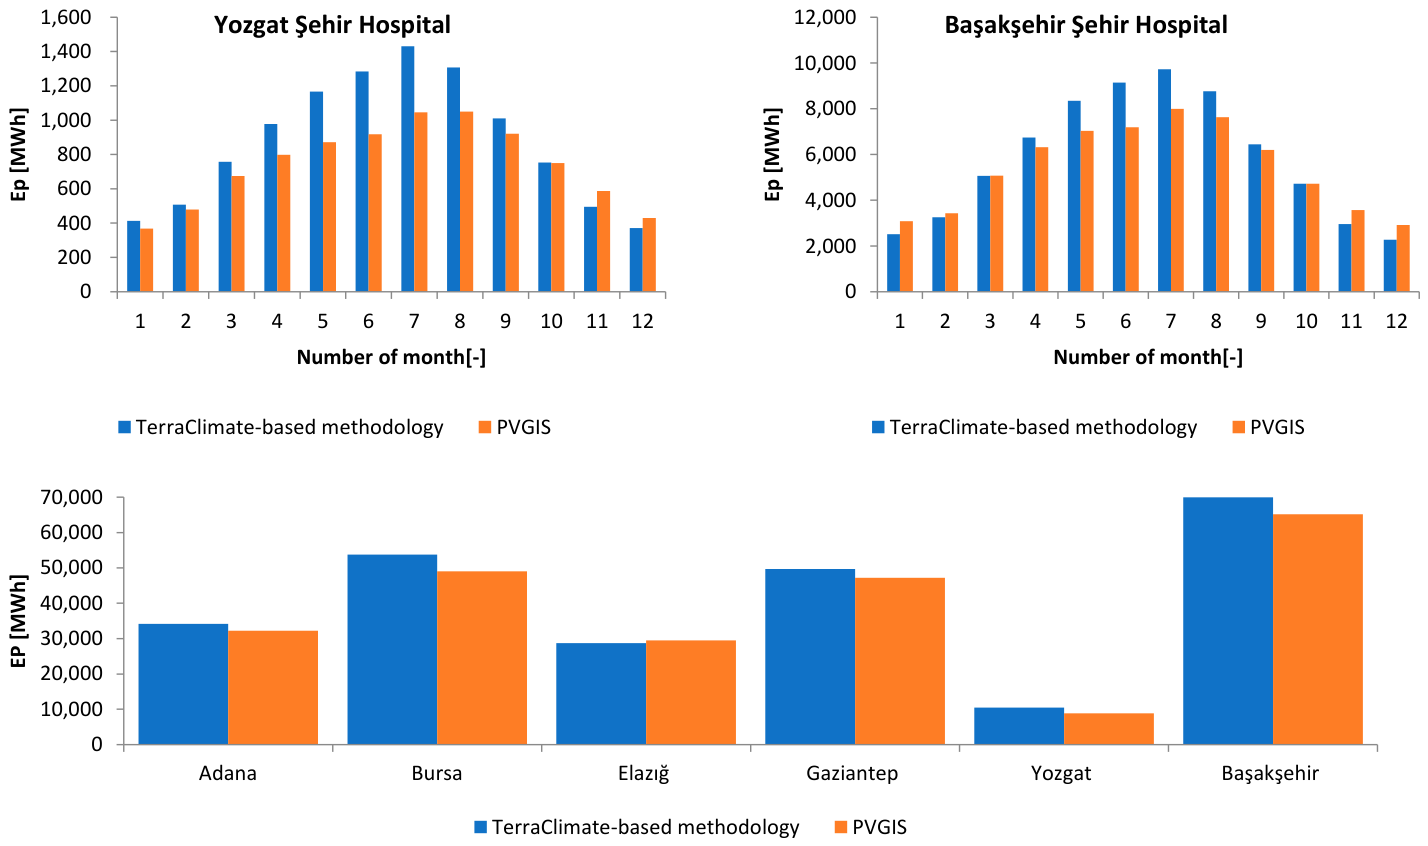
Figure 10 shows the comparison between the monthly solar energy generation of the six studied hospitals obtained from the proposed methodological approach and the respective data calculated by PVGIS. In general, the seasonal behavior of both methodologies is consistent. Both methodologies demonstrate an increase in electricity generation from winter to summer, with its maximum in June–July. The decrease is observed later in the year. This proves the reliability of the proposed methodology. Despite the similarity in seasonal trends, the methodology using TerraClimate estimates higher energy generation compared to PVGIS in most of the hospitals, especially in the summer months. This discrepancy is anticipated since the methodology adopted by TerraClimate for RSDS measures the global solar irradiation on the horizontal surface without considering the irradiation transposition from the horizontal surface to the sloped PV surface and losses included in the PVGIS model.
Moreover, the annual comparison shown in Figure 10 reveals that the differences between the two approaches remain very small in all hospitals, which means that the proposed approach is in good agreement with the PVGIS simulation. The annual comparison shows that the TerraClimate-based methodology produces an accurate estimate of photovoltaic power generation for regional analysis while providing a more straightforward modeling process. The comparison also reveals the effect of unit orientation and radiation transfer performed in PVGIS, which was not included in the proposed methodology.

3.6. Long-Term Climatic Changes in Photovoltaic Electricity Generation

To assess the impact of long-term climate change on photovoltaic power generation, the percentage change in average seasonal photovoltaic power generation between successive decades for six selected hospitals was calculated, as shown in Table 5. These results indicate that seasonal variations in photovoltaic power generation are relatively small, reflecting the limited impact of long-term climate change on photovoltaic power generation. Among the four seasons, winter showed the highest variance between the decades, with rates of change ranging from −4.54% to 7.97%. The maximum increase was observed in Elazig Shaheer Hospital, where it moved from the years 1958–1967 to 1968–1977 (7.97%), while the maximum decrease was observed in the following decade (−4.54%).
This variation was observed in all other hospitals, indicating that photovoltaic electricity production during the winter is highly dependent on climatic factors such as solar radiation and cloud cover. On the other hand, the spring season shows fairly stable trends in all hospitals where the percentage of changes remains below ±2%, except for Elazig Şehir Hospital, where there was a slight increase of 3.97% from 1978 to 1987 to 1988–1997. This slight change may indicate that the climatic factors in the spring were stable enough to provide a nearly constant output of photovoltaic electricity over the period under study. In addition, with the highest ambient temperatures occurring during the summer, changes in photovoltaic electricity production tend to be slight and both negative and positive, with most values falling in a range of approximately −2.3% to 2.6%. Although there was some decrease in photovoltaic electricity production in the summer in some hospitals, the magnitude of the decrease was not very high. This behavior is consistent with the mathematical model (Equations (2)–(4)). When the ambient air temperature rises, it causes the photovoltaic cells to heat up, thus leading to a decrease in the performance ratio and electricity generation capacity. However, due to high solar radiation, there were only slight changes in electricity production during the summer. In addition, the autumnal variance ratios range approximately between −2.61% and 3.20%. The positive and negative changes were observed between different hospitals and time periods extending over a decade as a result of the combined effect of seasonal climate changes on the performance of photovoltaic cell systems.
Generally, the results show that there is no significant trend of increase or decrease in photovoltaic electricity generation in the six hospitals concerned. Seasonal variations are relatively small over the entire time period considered. This means that the overall impact of long-term climate change on electricity generation using photovoltaic cell systems is relatively low. These results confirm that photovoltaic energy systems remain a reliable source of renewable energy for hospitals despite changes in climatic conditions, while seasonal variations in solar radiation play a more significant role than rising temperatures.

3.7. Economic Sustainability

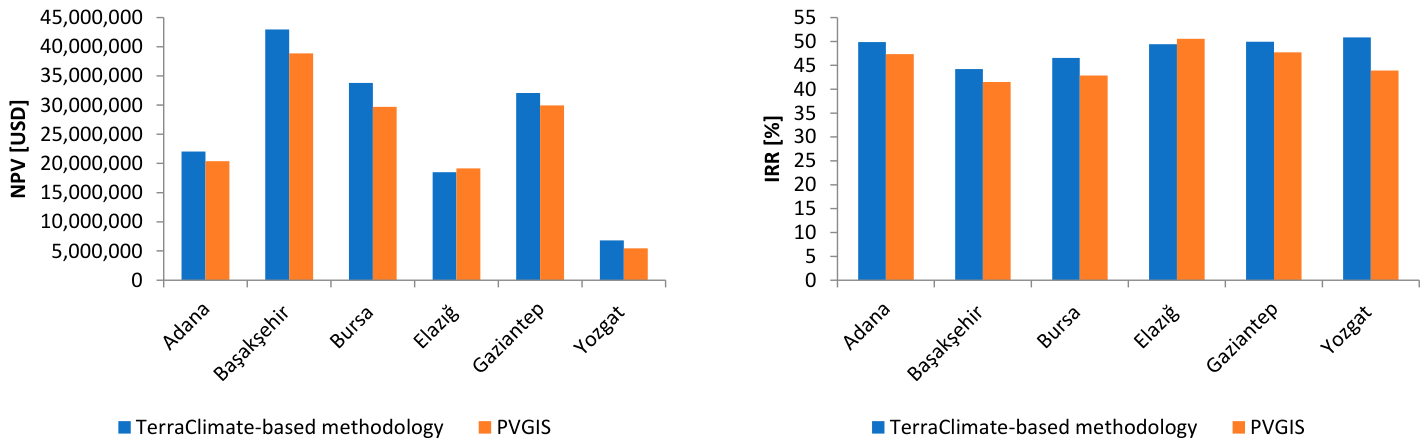
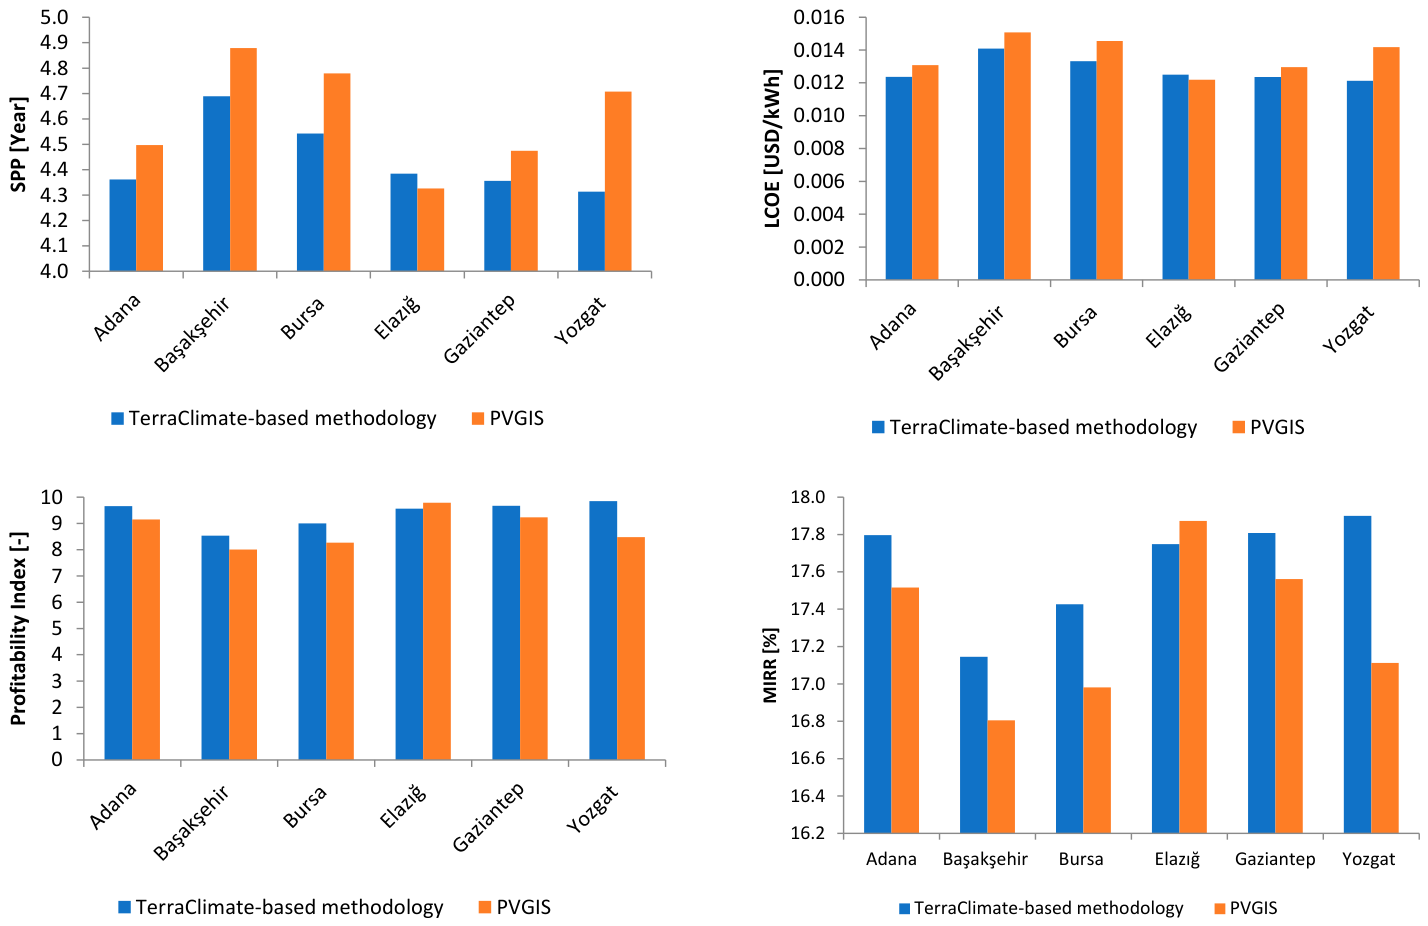
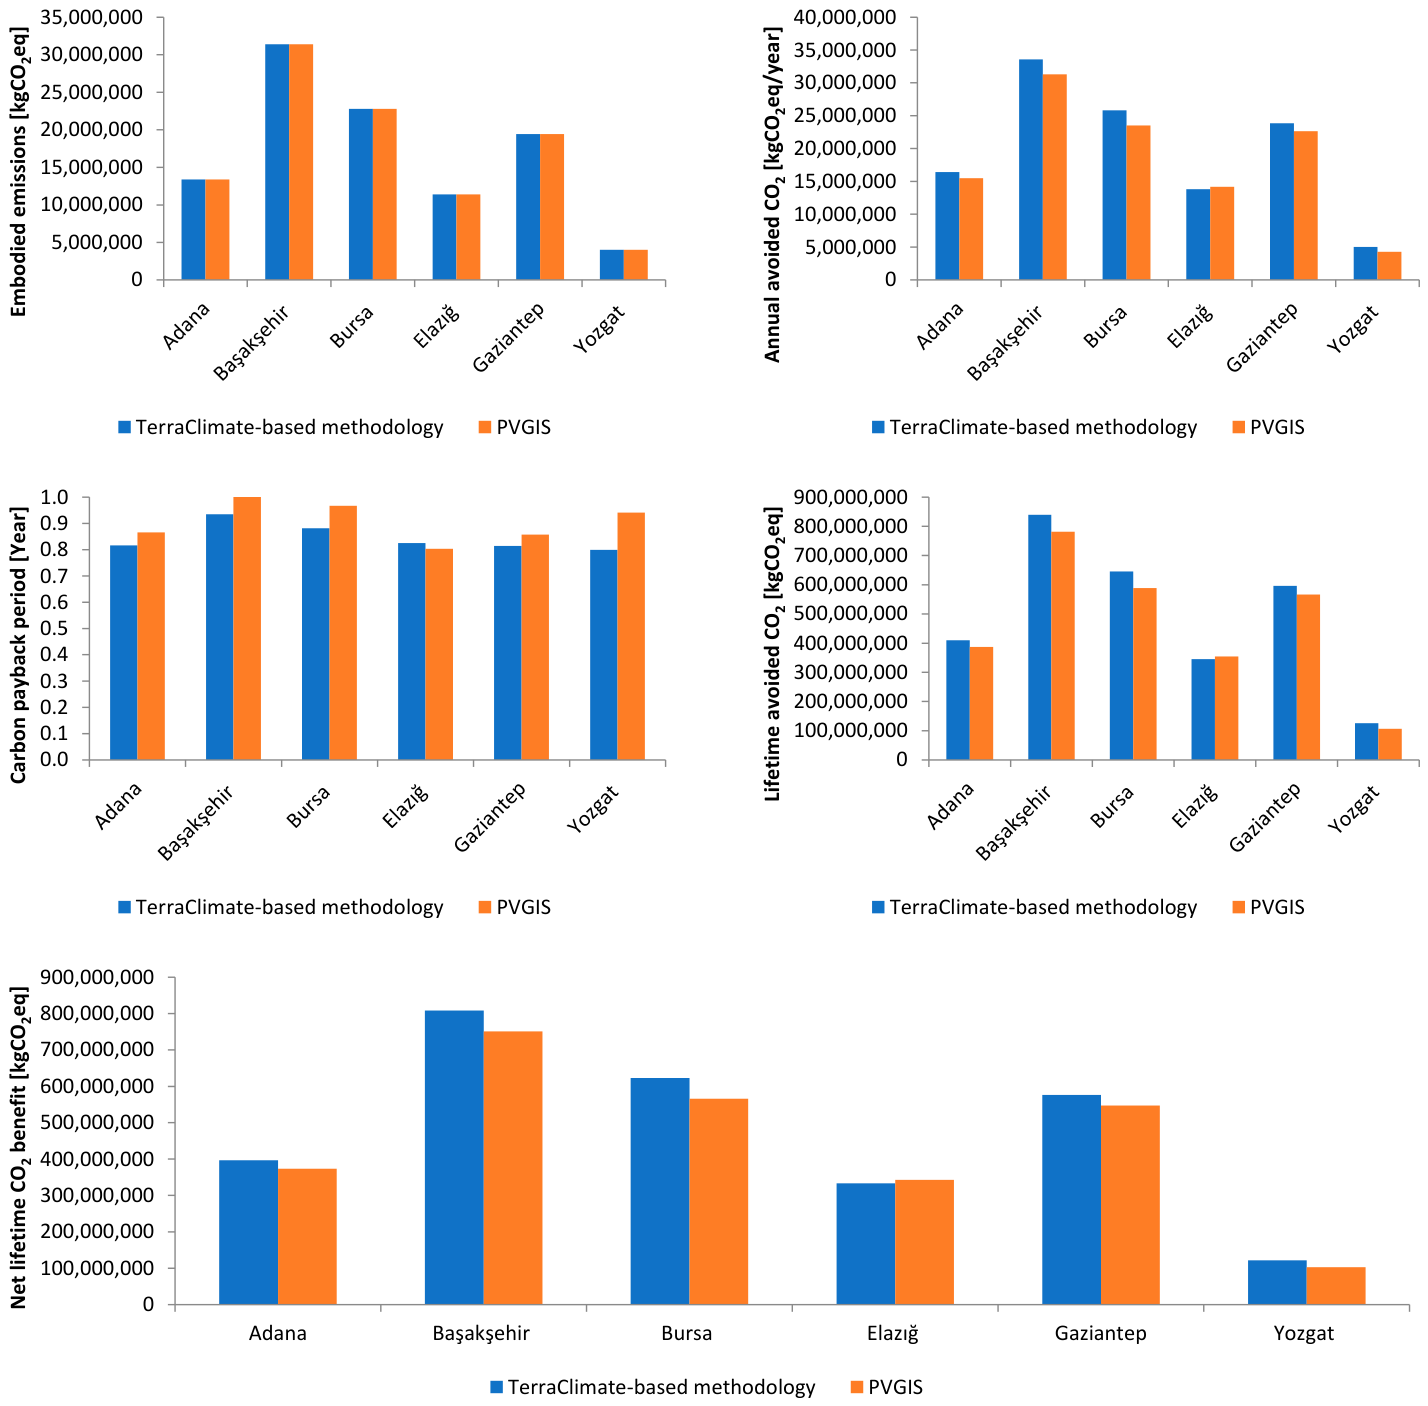
Figure 11 illustrates a comparison between the economic and environmental impact of the proposed approach based on TerraClimate data and PVGIS estimates for the six hospitals studied in the city. The TerraClimate-based method has been shown to have yielded slightly higher economic gains compared to PVGIS estimates, due to higher electricity generation rates calculated based on the TerraClimate solar radiation dataset.
All the hospitals had a positive NPV, indicating that installing PV systems was economically feasible. The NPV obtained using the methodology based on the TerraClimate database ranged from USD 6.81 million for Yozgat City Hospital to USD 42.95 million for the installation of PV at Başakşehir City Hospital. Additionally, high NPVs of USD 33.79 million and USD 32.08 million were obtained for Bursa and Gaziantep City Hospitals, respectively, and USD 22.05 million and USD 18.49 million for Adana and Elazığ City Hospitals, respectively. The NPV values calculated using the PVGIS methodology were somewhat lower, with the range of values varying from USD 5.45 million to USD 38.84 million. The largest difference between the two methods was 10.6% for the Yozgat City Hospital, while the rest of the hospitals showed differences below 8%.
The profitability of the proposed photovoltaic solar energy systems was also confirmed by the internal rate of return (IRR) and the adjusted internal rate of return (MIRR). In particular, using the TerraClimate method for calculating parameters, the following ranges were estimated for IRR (44.19–50.83%) and MIRR (17.15–17.90%) values. Using PVGIS, similar ranges of internal rate of return (IRR) (41.51–50.56%) and adjusted IRR (16.81–17.87%) were calculated. These values are much higher than the assumed discount rate of 7%, making them very attractive investments and proving the viability of all proposed photovoltaic solar energy systems, regardless of the solar radiation data used.
Moreover, the SPP value for all hospitals was less than three years. According to the analysis based on the TerraClimate method, the payback period ranged from 4.31 to 4.69 years, and according to PVGIS, the payback period ranged from 4.33 to 4.88 years. The TerraClimate method showed that the value of LCOE was in the range of 0.0121–0.0141 USD/kWh, whereas the other method (PVGIS) gave an LCOE value ranging between 0.0122 and 0.0151 USD/kWh. The results obtained show that the maximum difference between the two methods was approximately 7%. In other words, both methods provided similar estimates of the long-term cost of electricity generation. Moreover, the profitability index (PI) was higher than 8.0 for all considered hospitals, which was in the range of 8.5–9.8 using the TerraClimate approach and 8.0–9.8 using PVGIS. It should be noted that all PI values are significantly higher than one, which means that the discounted benefits exceed the costs.

3.8. Environmental Assessment Results

Environmental analysis of photovoltaic systems (see Figure 12) showed significant reductions in greenhouse gas emissions. It was found that the emissions involved in the construction of the proposed systems ranged from 4.02 million kg CO2-eq for Yozgat City Hospital to 31.40 million kg CO2-eq for Başakşehir City Hospital. However, even with the high emissions involved, the annual environmental benefits were very large. Using the TerraClimate-based approach, annual CO2 emissions avoided ranged from 5.03 million kg CO2-eq/year for Yozgat City Hospital to 33.58 million kg CO2-eq/year for Başakşehir City Hospital, while PVGIS estimated annual reductions between 4.27 million and 31.29 million kg CO2-eq/year. As a result, the carbon payback time remained quite low and equal to 0.80–0.90 years in the case of the TerraClimate-based approach and 0.80–1.00 years in the case of PVGIS. Therefore, greenhouse gas emissions associated with the production, transportation, and installation of photovoltaic cells and inverters can be offset during the first year of operation. During the 25-year operational period of the projects, the environmental benefits increase significantly. According to estimates based on the TerraClimate methodology, the carbon dioxide emissions avoided over the lifetime of each project ranged from 125.73 million kg CO2-eq for Yozgat City Hospital to 839.59 million kg CO2-eq for Başakşehir City Hospital. Taking into account the embodied emissions, the net lifetime CO2 benefits varied between 121.71 million kg CO2-eq and 808.19 million kg CO2-eq.

3.9. Development of Location-Specific RSM Models for Monthly Energy Production

The Response Surface Methodology (RSM) technique was used in this research work to develop prediction models of EP per month for each site and to analyze the effect of rainfall ( R ),   A O T , and rainfall-to-AOT ( R / A O T ) ratio either individually or collectively on EP. The development of these models involved data for the months between 1981 and 2024, and their respective equations are presented in Table 6. The R / A O T ratio was established in this study for the purpose of measuring the combined effect of both wet precipitation and atmospheric aerosol convection on PV energy production. While A O T refers to the atmospheric load of aerosols and dust that reduces solar radiation, rainfall acts as a tool that affects the amount of solar radiation by reducing it and removing aerosols from the atmosphere and photovoltaic solar panels. Consequently, the R / A O T ratio serves as an important physical characteristic reflecting the process of atmospheric cleansing and attenuation due to aerosols. It also allows for the representation of nonlinear interactions between the two processes in a single variable, thereby enhancing RSM analysis by avoiding the problem of multiple linear correlations between predictive variables.
Table 6 presents location-specific Response Surface Methodology (RSM) models developed to estimate monthly photovoltaic energy production (EP) as a function of rainfall (R), aerosol optical thickness (AOT), and their nonlinear and interaction effects for six hospital sites in Türkiye over the period 1981–2024. Each model incorporates linear terms, quadratic terms (R2 and AOT2), interaction terms (R × AOT), and additional ratio-based terms (R/AOT, R2/AOT, and (R/AOT)2) to capture the complex and nonlinear relationships between atmospheric conditions and PV energy output. Across all locations, AOT shows a strong nonlinear negative influence on EP, indicating the dominant effect of aerosol loading in reducing solar radiation, while rainfall generally exhibits a negative linear effect, reflecting cloud-related attenuation, with additional interaction terms suggesting coupled atmospheric processes. The coefficient of determination (R2) values range from 57.15% to 73.87%, indicating that the models explain a moderate to substantial proportion of the variability in PV energy production, with the highest performance observed in Gaziantep and Elazığ and comparatively lower performance in Yozgat and Başakşehir, likely due to additional unmodeled climatic or local factors.
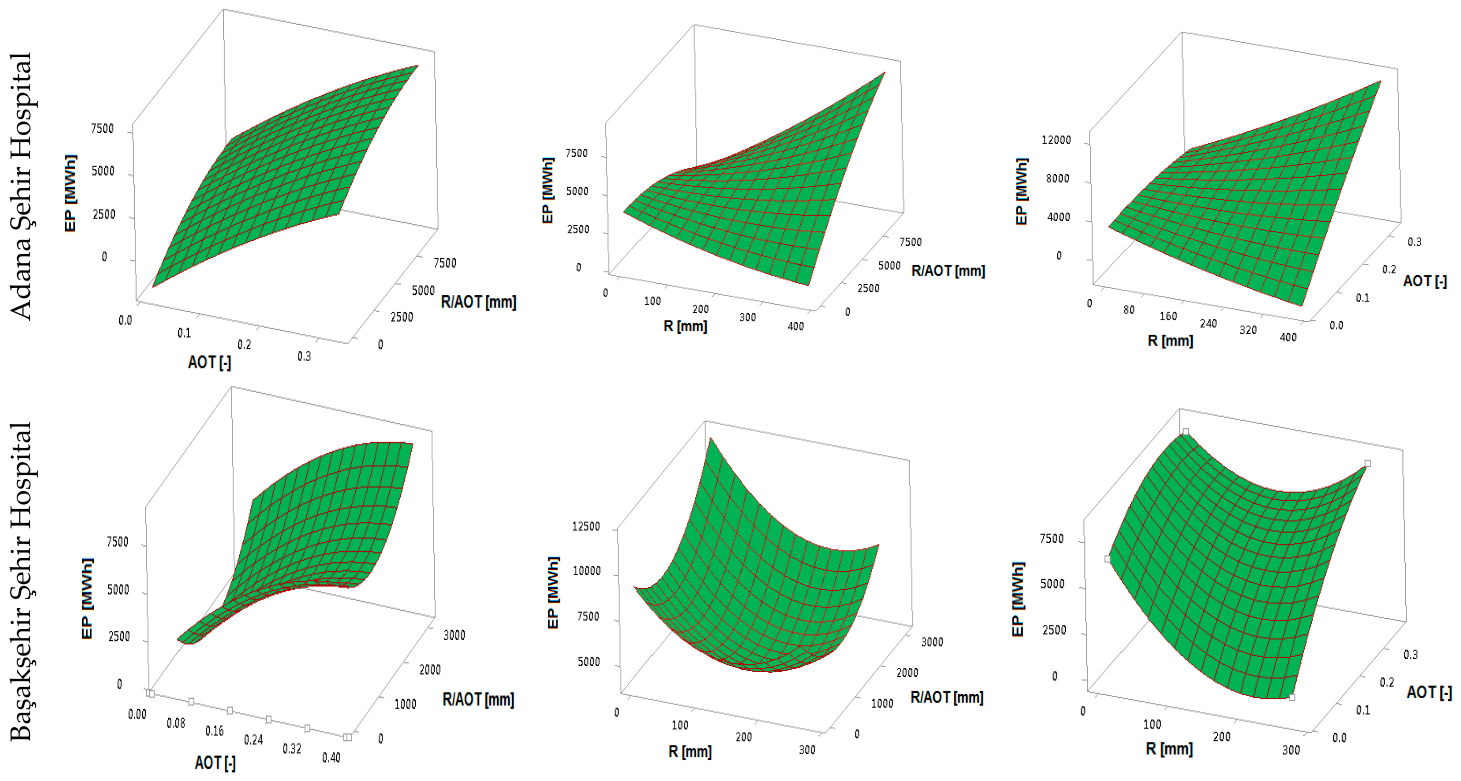
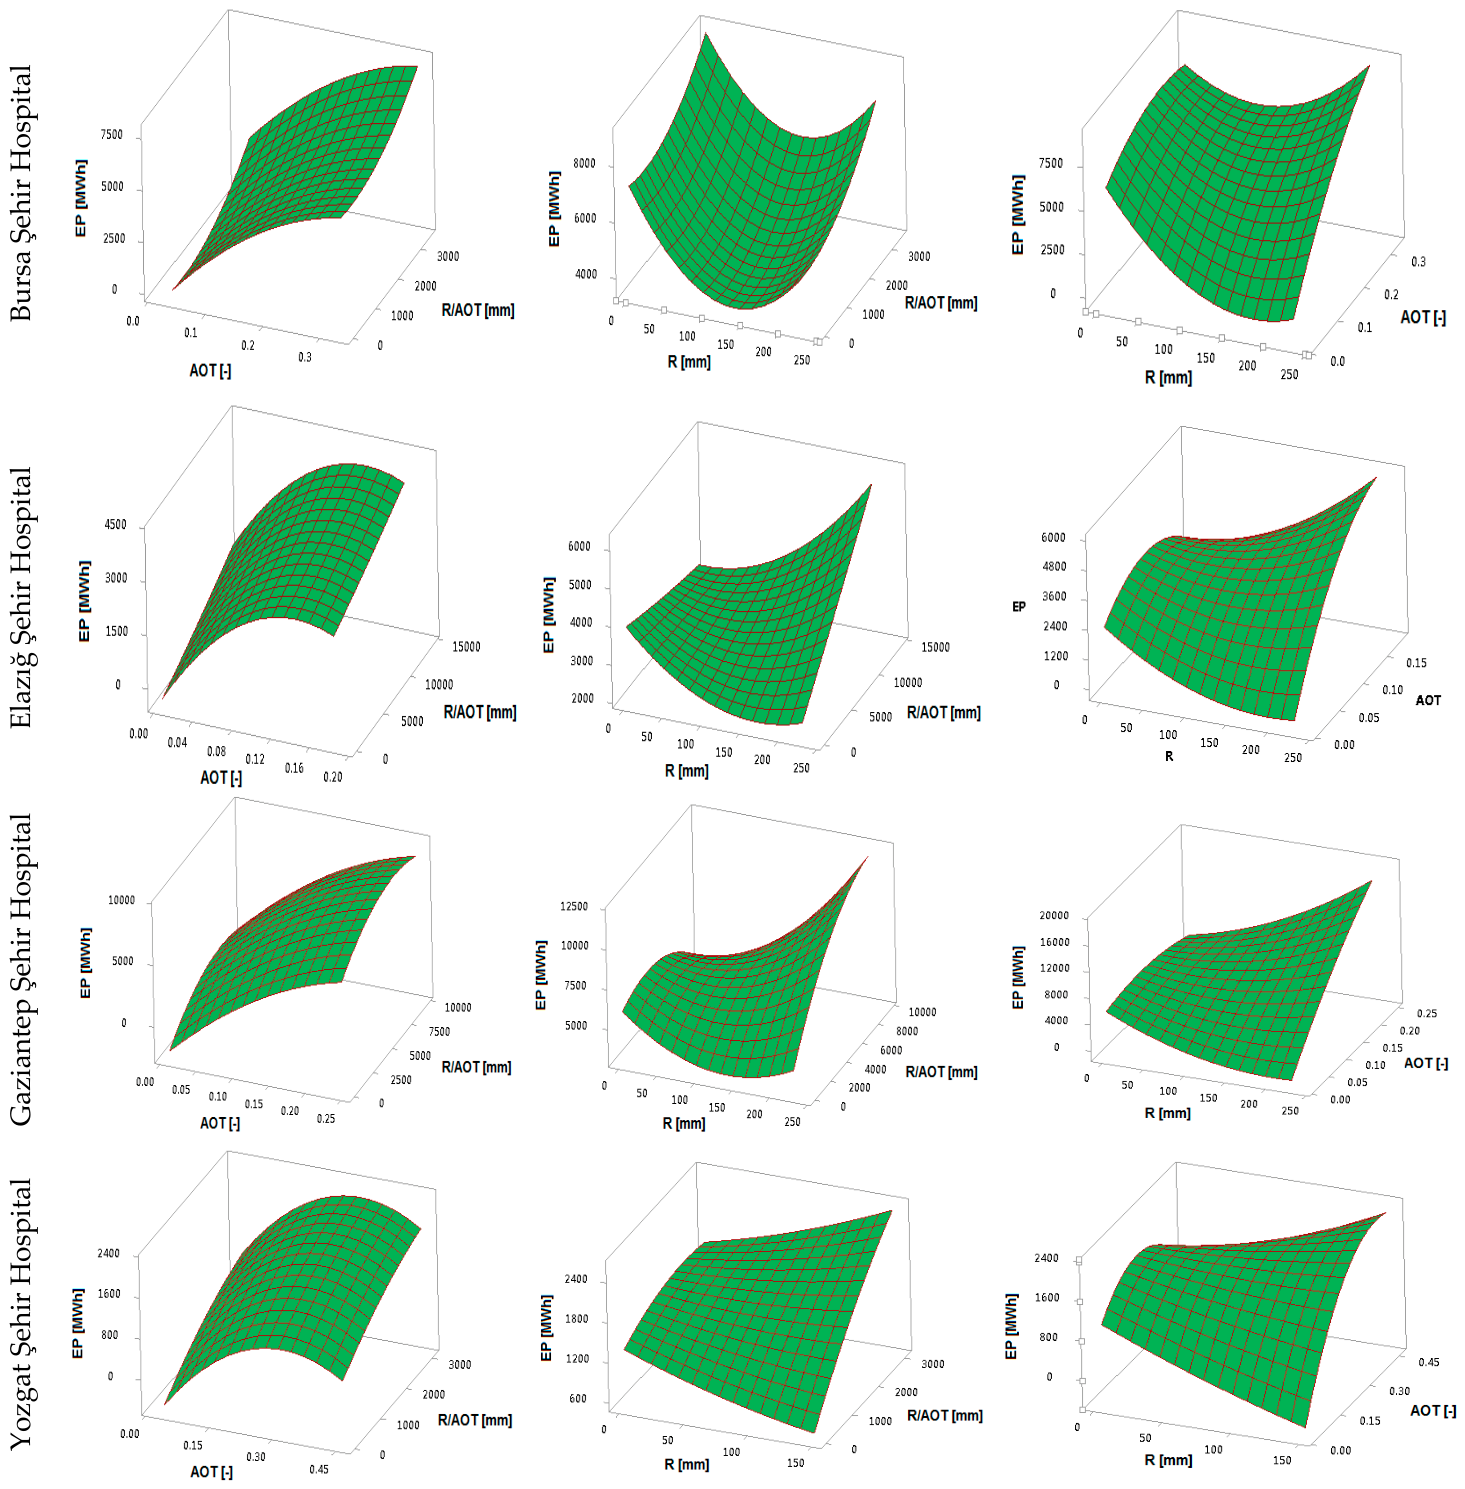
Moreover, Figure 13 shows the three-dimensional response surfaces representing the monthly EP as a function of R, AOT, and R/AOT, as well as the effect of the interaction between them, for all six city hospitals included in the study. These response surfaces were plotted using appropriate nonlinear regression equations to show the effect of both variables on the performance of photovoltaic cells. The curvature of the response surfaces indicates a nonlinear relationship between photovoltaic energy production and climate variables. It is observed that the EP value increases with increasing AOT. While the high concentration of aerosols can be considered a factor in increasing the absorption of solar radiation by the atmosphere, it should be noted that the low AOT values are consistent with the natural background levels of aerosols in Türkiye. At these AOT values, the level of aerosol pollution can be considered to be average for the background level, while the value itself is mainly affected by the seasons. Therefore, higher levels of AOT are observed during high levels of solar radiation and high air temperature, leading to increased photovoltaic electricity production.
The impact of rainfall on energy efficiency is more complex and varies from hospital to hospital. For hospitals in Adana, Gaziantep, and Başakşehir, EP tends to increase in conjunction with rainfall, assuming moderate or high AOTs. This behavior indicates that moderately high amounts of rainfall naturally clean the surfaces of photovoltaic modules, improving solar energy transmission and somewhat compensating for any temporary decrease in radiation due to clouds. As for the hospitals of Bursa and Elazig, the presence of a clear local minimum in the response surfaces with respect to rainfall indicates greater non-linearity between the variables concerned. This behavior is due to differences in climate, meaning that in such areas, rainfall is often associated with cloudy weather and low amounts of solar radiation.
Interaction plots for rainfall and AOT clearly show that the impact of one variable is contingent upon the value of another. With small amounts of rainfall, an increase in AOT leads to relatively small increases in EP. In cases where there are moderate or large amounts of rainfall, an increase in AOT corresponds to a much higher growth in EP production, especially in the case of the three mentioned hospitals (Başakşehir, Gaziantep, and Adana City). This proves a statistically significant interaction between the two climatic factors.

4. Discussion

4.1. Long-Term Warming Trends and Regional Climate Change Context

The results showed significant upward trends in maximum and minimum temperatures at all selected hospital sites in Türkiye during the period 1958–2024. While Tmax values are rising consistently, Tmin values tend to rise faster than Tmax in some locations, such as Başakşehir and Adana. This is a warming pattern known in climate literature as “asymmetric” because the warming occurs more significantly during the nighttime. There are multiple reasons why this type of warming takes place, including the contribution of greenhouse gases, clouds, and rapid urbanization [77,78,79]. The Eastern Mediterranean region, which includes Turkey, has been classified as one of the hotspots with regard to the effects of climate change due to higher rates of warming compared to global trends, along with an increase in extreme thermal events [80,81]. The observed warming rate in this case (~0.02–0.03 °C/year) is in good agreement with the results of climate studies in Anatolia, indicating that the region is indeed experiencing a faster rate of warming in recent decades [82]. Concerning photovoltaic systems, high ambient temperature leads to higher temperatures in photovoltaic modules, which affects their efficiency in terms of reducing the band gap of semiconductors and leads to energy loss. Experimental results show that losses range from −0.3%/°C to −0.5%/°C depending on the photovoltaic cell technology used [83,84]. Therefore, the increasing Tcell values observed in all cases indicate a gradual decrease in the efficiency of photovoltaic cells over time, especially during the summer with peak generation rates.

4.2. Declining Wind Speed and Implications for PV Thermal Regulation

All observation sites showed a persistent negative trend in wind speed, with reduction varying from about −0.003 to −0.015 m/s/year. Since wind speed is an important variable affecting PV performance through improving the convection and reducing the temperature of modules, any decrease in wind speed will aggravate the thermal stress on PV modules under the influence of increased ambient temperature. This is a typical example of what is called “wind cooling,” which is found in many observational datasets [85,86]. The mechanisms of wind quiescence include changes in atmospheric circulation, increased surface roughness as a result of land-use changes, and urban growth. In the case of Türkiye, the increasing rate of urban expansion around hospitals such as Basaksehir will exacerbate this problem. Thus, the interaction of the increase in temperature and the reduction in wind speed can be considered as a negative feedback loop acting on the PV efficiency due to the additional increase in operating temperature of modules compared to their increase due to ambient temperature change only [87,88].

4.3. Solar Radiation Stability and Aerosol–Climate Interactions

Downward surface solar radiation displays slight positive and neutral trends at most sites, indicating a fairly stable solar resource. Such a conclusion matches well with the global phenomena of “global dimming and brightening,” whereby solar radiation reductions in the middle of the twentieth century were partly restored in the 1980s because of reduced anthropogenic aerosol emissions [89,90]. For the studied region of Türkiye and its vicinity, aerosol loading related to anthropogenic activity and aerosol transport from North Africa and the Middle East has an appreciable influence on the solar radiation budget [91,92,93,94]. Therefore, the lack of an observed trend here implies a balance between opposite forces: cleaning due to precipitation and increasing anthropogenic aerosol content. Particularly important is the effect of aerosol optical thickness (AOT) on the attenuation of direct normal irradiance and the decrease in PV power. This conclusion is in good agreement with radiation transmission theory and previous research on the relationship between aerosol loads and photovoltaic performance [91,92,93,94].

4.4. Photovoltaic Resource Stability, Economic Feasibility, and Environmental Sustainability

The differences in PV potential across the studied hospitals relate to the climatic and geographical diversity within Türkiye. Hospitals situated in southern and southeastern parts of the country, such as those in Gaziantep and Adana, are characterized by higher levels of annual solar radiation due to lower cloud coverage and longer sunshine duration, while hospitals in northwestern Türkiye, such as in Bursa and Başakşehir, receive comparatively lower amounts of solar radiation due to higher cloud cover. However, despite this difference, the proposed methodology utilizing TerraClimate data found that all six hospitals have sufficient solar potential to implement economically viable rooftop and parking lot photovoltaic systems on their territory. These results confirm the latest regional estimates of solar resource potential, which indicate that Southeast and Central Anatolia are the most suitable regions for photovoltaic electricity production due to high levels of annual global horizontal solar radiation [95,96,97].
Although the intensity of solar radiation varies from place to place, a similar pattern was observed in all hospitals, with the highest electricity production from photovoltaic cells recorded from May to August, while the lowest level was recorded during the winter. This seasonal pattern is consistent with the annual solar cycle and is in line with other studies on solar energy in the Mediterranean climate, where photovoltaic power generation increases in the summer as a result of increased hours of sunshine and its angle of elevation [98,99,100]. Moreover, the calculated CF values in this study ranged from 17% to 20%, which is within the expected capacity factor range for fixed-tip crystalline silicon photovoltaic cells in a Mediterranean climate [36,101,102].
According to the economic analysis, the use of PV systems in healthcare facilities is very profitable. Also, SPP was calculated between 4.31 and 4.69 years using the TerraClimate calculation approach, and between 4.33 and 4.88 years when using the PVGIS data. These payback periods are similar to typical payback periods for public and commercial photovoltaic solar energy projects in Europe and the Middle East, which usually range from approximately 4 to 8 years, depending on the availability of local solar energy resources, electricity prices, financing, and system design [103,104,105]. According to Ali et al. [105], commercial PV systems normally exhibit an economic payback period ranging from 3 to 5 years for optimum conditions, although many others are between 5 and 10 years. Therefore, the short payback period indicates the high economic feasibility of applying photovoltaic solar energy systems on the roofs of hospitals and parking lots in Türkiye.
Concerning the environment, the recommended PV systems have significant greenhouse gas emission reductions. The avoided emissions during the annual period were between 5.03 and 33.58 million kg CO2-eq year−1, leading to avoided emissions of 125.73–839.59 million kg CO2-eq during the 25-year project life span. Following the deduction of the embodied emissions from PV production, transportation, mounting structures, and inverters, the net lifetime CO2 benefit of 121.71 to 808.19 million kg CO2-eq was achieved, proving that the operational environmental benefits far outweigh the embodied emissions. In addition, the carbon payback period ranged between 0.80 and 0.90 years using the TerraClimate-based method and 0.80–1.00 years using PVGIS, which is similar to or less than the 1–3 years reported for the crystalline silicon PV systems [73,106,107]. These results show that photovoltaic systems installed on rooftops and parking garages are able to recover the emissions contained very quickly, while providing additional benefits.

5. Conclusions

This research examined the effects of climate change and its fluctuations on solar energy potential and systems, through a study of photovoltaic energy in six hospitals in Turkey from 1958 to 2024. It can be stated that, although solar radiation sources remained relatively stable during the studied period, many of the climatic factors affecting the effectiveness of this type of renewable energy underwent significant changes.
The findings demonstrated a continuous rise in temperatures, both maximum and minimum, in all areas of the hospital. Moreover, it was observed that some areas experienced similar, or even higher, nighttime temperatures compared to daytime temperatures, reflecting changes in atmospheric thermal conditions. In addition, a decrease in wind speed was recorded in all regions, which helps to reduce the cooling effect on photovoltaic panels and thus leads to further loss of efficiency in photovoltaic power generation during periods of abundant solar energy. On the other hand, there was no significant downward trend in solar radiation falling on the surface, indicating the high potential of solar energy resources in Türkiye for photovoltaic power generation.
The analysis showed that the concentration of aerosols is one of the most important weather factors affecting energy generation using photovoltaic panels, while rainfall may affect the efficiency of these panels through its effect on cloud and aerosol formation. From a technical and economic point of view, the installation of PV panels on rooftops and carports of hospitals is feasible.
The main finding of this study is that although future climate changes will not significantly reduce the availability of solar energy, they may gradually lead to a decrease in the energy conversion efficiency of photovoltaic systems as a result of increased thermal stress and a decrease in the wind speed required for cooling. Furthermore, integrating renewable energy systems into hospital building structures can contribute to ensuring energy security for healthcare institutions during unexpected power outages in Turkey, as was recorded in 2015 [108]. Therefore, it is important to design photovoltaic solar energy systems for hospitals with consideration for future increases in temperature levels and changes in climatic conditions.

Supplementary Materials

The following supporting information can be downloaded at: https://www.mdpi.com/article/10.3390/en19153589/s1, Figure S1: Long-term annual trends (1958–2024) of solar-relevant climate variables in Adana Şehir Hospital for (a) Tmax, (b) Tmin, (c) Tcell, (d) WS and (e) DSRS. Figure S2: Long-term annual trends (1958–2024) of solar-relevant climate variables in Bursa Şehir Hospital for for (a) Tmax, (b) Tmin, (c) Tcell, (d) WS and (e) DSRS. Figure S3: Long-term annual trends (1958–2024) of solar-relevant climate variables in Elazığ Şehir Hospital for for (a) Tmax, (b) Tmin, (c) Tcell, (d) WS and (e) DSRS. Figure S4: Long-term annual trends (1958–2024) of solar-relevant climate variables in Yozgat Şehir Hospital for for (a) Tmax, (b) Tmin, (c) Tcell, (d) WS and (e) DSRS.

Author Contributions

Conceptualization, Y.K.; Methodology, Y.K.; Software, Y.K.; Validation, Y.K.; Formal analysis, Y.K.; Investigation, Y.K.; Resources, Y.K. and D.A.E.; Data curation, D.A.E.; Writing—original draft, Y.K. and H.G. All authors have read and agreed to the published version of the manuscript.

Funding

This research received no external funding.

Data Availability Statement

The original contributions presented in this study are included in the article/Supplementary Materials. Further inquiries can be directed to the corresponding author.

Conflicts of Interest

The authors declare no conflicts of interest.

References

  1. Elkhatat, A.; Al-Muhtaseb, S. Climate change and energy security: A comparative analysis of the role of energy policies in advancing environmental sustainability. Energies 2024, 17, 3179. [Google Scholar]
  2. Raihan, A.; Rashid, M.; Voumik, L.C.; Akter, S.; Esquivias, M.A. The dynamic impacts of economic growth, financial globalization, fossil fuel, renewable energy, and urbanization on load capacity factor in Mexico. Sustainability 2023, 15, 13462. [Google Scholar] [CrossRef] [Scilit]
  3. Panicker, K.; Anand, P.; George, A. Assessment of building energy performance integrated with solar PV: Towards a net zero energy residential campus in India. Energy Build. 2023, 281, 112736. [Google Scholar] [CrossRef] [Scilit]
  4. Balali, A.; Valipour, A. Prioritization of passive measures for energy optimization designing of sustainable hospitals and health centres. J. Build. Eng. 2021, 35, 101992. [Google Scholar] [CrossRef] [Scilit]
  5. Fernández, F.J.; Díaz, J.; Suárez, I.; Zueco, J. The integration of heat pumps into the thermal systems of hospital facilities to advance their transformation towards Zero-Emission Buildings. J. Build. Eng. 2025, 111, 113531. [Google Scholar] [CrossRef] [Scilit]
  6. Papadakis, N.; Katsaprakakis, D.A. A review of energy efficiency interventions in public buildings. Energies 2023, 16, 6329. [Google Scholar] [CrossRef] [Scilit]
  7. Bawaneh, K.; Ghazi Nezami, F.; Rasheduzzaman, M.; Deken, B. Energy consumption analysis and characterization of healthcare facilities in the United States. Energies 2019, 12, 3775. [Google Scholar] [CrossRef] [Scilit]
  8. Cygańska, M.; Kludacz-Alessandri, M. Energy Consumption Trends and Determinants in Polish Hospitals: Implications for Energy Efficiency Strategies. Sustainability 2024, 16, 9153. [Google Scholar] [CrossRef] [Scilit]
  9. Cilibiu, C.; Abrudan, A.C. Solutions for Heating in Healthcare Facilities: A Case Study on the Use of Heat Pumps and Energy Consumption Reduction. In International Conference on Advancements of Medicine and Health Care Through Technology; Springer Nature Switzerland: Cham, Switzerland, 2024; pp. 274–283. [Google Scholar]
  10. Ma, Y.; Zedan, S.; Liu, A.; Miller, W. Impact of a warming climate on hospital energy use and decarbonization: An Australian building simulation study. Buildings 2022, 12, 1275. [Google Scholar] [CrossRef] [Scilit]
  11. Nematchoua, M.K.; Yvon, A.; Kalameu, O.; Asadi, S.; Choudhary, R.; Reiter, S. Impact of climate change on demands for heating and cooling energy in hospitals: An in-depth case study of six islands located in the Indian Ocean region. Sustain. Cities Soc. 2019, 44, 629–645. [Google Scholar] [CrossRef] [Scilit]
  12. Dion, H.; Evans, M.; Farrell, P. Hospitals management transformative initiatives; towards energy efficiency and environmental sustainability in healthcare facilities. J. Eng. Des. Technol. 2023, 21, 552–584. [Google Scholar]
  13. Wang, T.; Li, X.; Liao, P.C.; Fang, D. Building energy efficiency for public hospitals and healthcare facilities in China: Barriers and drivers. Energy 2016, 103, 588–597. [Google Scholar] [CrossRef] [Scilit]
  14. Christiansen, N.; Kaltschmitt, M.; Dzukowski, F. Electrical energy consumption and utilization time analysis of hospital departments and large scale medical equipment. Energy Build. 2016, 131, 172–183. [Google Scholar] [CrossRef] [Scilit]
  15. Čongradac, V.; Prebiračević, B.; Jorgovanović, N.; Stanišić, D. Assessing the energy consumption for heating and cooling in hospitals. Energy Build. 2012, 48, 146–154. [Google Scholar] [CrossRef] [Scilit]
  16. Nishanthy, J.; Raja, S.C.; Nesamalar, J.J.D. Feasibility analysis of solar PV system in presence of EV charging with transactive energy management for a community-based residential system. Energy Convers. Manag. 2023, 288, 117125. [Google Scholar] [CrossRef] [Scilit]
  17. Freedman, B.; Dorsey, W.; Frazier, A.; Kambhampati, M.; Galiotos, J.; Mukherjee, S. Renewable and Non-renewable Energy Sources. In Environmental Science; Jones & Bartlett Publishers: Burlington, MA, USA, 2024. [Google Scholar]
  18. Güney, T. Renewable energy, non-renewable energy and sustainable development. Int. J. Sustain. Dev. World Ecol. 2019, 26, 389–397. [Google Scholar] [CrossRef] [Scilit]
  19. Ratnesh, R.K.; Kumar, R.; Singh, S.; Chandra, R.; Singh, J. Recent advances in solar cell technology: Addressing technological challenges, scenarios, and environmental implications in the development of sustainable energy solutions. New J. Chem. 2025, 49, 6861–6887. [Google Scholar] [CrossRef] [Scilit]
  20. Gallardo, I.; Amor, D.; Gutiérrez, Á. Recent trends in real-time photovoltaic prediction systems. Energies 2023, 16, 5693. [Google Scholar] [CrossRef] [Scilit]
  21. Gan, K.E.; Taikan, O.; Gan, T.Y.; Weis, T.; Yamazaki, D.; Schüttrumpf, H. Enhancing renewable energy systems, contributing to Sustainable Development Goals of United Nation and building resilience against climate change impacts. Energy Technol. 2023, 11, 2300275. [Google Scholar] [CrossRef] [Scilit]
  22. United Nations. Transforming Our World: The 2030 Agenda for Sustainable Development. 2015. Available online: https://sdgs.un.org/2030agenda (accessed on 26 July 2026).
  23. Woldegiyorgis, T.A.; Li, H.X.; Admassu, F.C.; Gezahegne, M.; Kebede, A.; Abera, T.; Ishaq, H.; Asmare, E. Assessment of a Hybrid Energy System for Reliable and Sustainable Power Supply to Boru Meda Hospital in Ethiopia. arXiv 2025, arXiv:2512.22859. [Google Scholar]
  24. Refahi, A.; Talkhabi, H.; Rostami, A.; Aghdam, A.H. Technical feasibility study of the integration of the solar photovoltaic system for a hospital: A case study of Qom City, Iran. Future Energy 2024, 3, 1–12. [Google Scholar] [CrossRef] [Scilit]
  25. Khamharnphol, R.; Kamdar, I.; Waewsak, J.; Chiwamongkhonkarn, S.; Khunpetcha, S.; Kongruang, C.; Gagnon, Y. Techno-economic assessment of a 100 kWp solar rooftop PV system for five hospitals in central southern Thailand. Int. J. Renew. Energy Dev. 2023, 12, 77–86. [Google Scholar] [CrossRef] [Scilit] [PubMed]
  26. Alamoudi, R.; Taylan, O.; Aktacir, M.A.; Herrera-Viedma, E. Designing a solar photovoltaic system for generating renewable energy of a hospital: Performance analysis and adjustment based on RSM and ANFIS approaches. Mathematics 2021, 9, 2929. [Google Scholar] [CrossRef] [Scilit]
  27. Assareh, E.; Keykhah, A.; Ghodrat, M.; Firoozzadeh, M.; Lee, M. A proposal on a co-generation system accompanied with phase change material to supply energy demand of a hospital to make it a zero energy building (ZEB). Energy Build. 2024, 318, 114478. [Google Scholar] [CrossRef] [Scilit]
  28. Izadi, A.; Shahafve, M.; Ahmadi, P.; Hanafizadeh, P. Design, and optimization of COVID-19 hospital wards to produce Oxygen and electricity through solar PV panels with hydrogen storage systems by neural network-genetic algorithm. Energy 2023, 263, 125578. [Google Scholar] [CrossRef] [Scilit] [PubMed]
  29. Ngoh, S.K.; Bakehe, J.F.; Fils, P.E. Green electricity and medical electrolytic oxygen from solar energy-A sustainable solution for rural hospitals. Sci. Afr. 2022, 17, e01389. [Google Scholar] [CrossRef] [Scilit]
  30. Naveed, A.; Iqbal, S.; Munir, S.; Rehman, A.U.; Eslami, M.; Kamel, S. Renewable energy integration in healthcare systems: A case study of a hospital in Azad Jammu and Kashmir. IET Renew. Power Gener. 2024, 18, 796–809. [Google Scholar] [CrossRef] [Scilit]
  31. Al-Rawi, O.F.; Bicer, Y.; Al-Ghamdi, S.G. Sustainable solutions for healthcare facilities: Examining the viability of solar energy systems. Front. Energy Res. 2023, 11, 1220293. [Google Scholar] [CrossRef] [Scilit]
  32. Soto, E.A.; Hernandez-Guzman, A.; Vizcarrondo-Ortega, A.; McNealey, A.; Bosman, L.B. Solar energy implementation for health-care facilities in developing and underdeveloped countries: Overview, opportunities, and challenges. Energies 2022, 15, 8602. [Google Scholar] [CrossRef] [Scilit]
  33. Teklemariam, S.K.; Schiasselloni, R.; Cattani, L.; Bozzoli, F. Solar Energy Solutions for Healthcare in Rural Areas of Developing Countries: Technologies, Challenges, and Opportunities. Energies 2025, 18, 3908. [Google Scholar]
  34. Osho, Z.; Sareen, J. Accessing solar energy to deliver healthcare for all. In Resilient Health; Academic Press: Cambridge, MA, USA, 2024; pp. 301–309. [Google Scholar]
  35. Ouedraogo, A.; Diallo, A.; Goro, S.; Ilboudo, W.D.A.; Madougou, S.; Bathiebo, D.J.; Kam, S. Analysis of the solar power plant efficiency installed in the premises of a hospital—Case of the Pediatric Charles De Gaulle of Ouagadougou. Sol. Energy 2022, 241, 120–129. [Google Scholar]
  36. Kassem, Y.; Gökçekuş, H.; Güvensoy, A. Techno-economic feasibility of grid-connected solar PV system at Near East University hospital, Northern Cyprus. Energies 2021, 14, 7627. [Google Scholar] [CrossRef] [Scilit]
  37. Ossola, S.T.F.; Cristeche, J.; Chévez, P.J.; Barbero, D.A.; Martini, I. Model for the implementation of strategies for the solar energy use in a healthcare network. E-Prime-Adv. Electr. Eng. Electron. Energy 2023, 5, 100226. [Google Scholar] [CrossRef] [Scilit]
  38. Kowsar, A.; Saha, S.; Naima, F.; Palash, M.L.; Faruque, M.J.; Lasker, G.K.; Haque, N.; Alam, F. Unlocking the potential of rooftop photovoltaic power generation for healthcare in Bangladesh. Renew. Energy 2025, 243, 122509. [Google Scholar] [CrossRef] [Scilit]
  39. Paksoy, H.O.; Andersson, O.; Abaci, S.; Evliya, H.; Turgut, B. Heating and cooling of a hospital using solar energy coupled with seasonal thermal energy storage in an aquifer. Renew. Energy 2000, 19, 117–122. [Google Scholar] [CrossRef] [Scilit]
  40. Ozden, E.; Tari, I. Energy and Exergy Analyses of a Solar-Hydrogen Based Energy System for the Emergency Room of a Hospital in Ankara, Turkey. In Exergy for a Better Environment and Improved Sustainability 1: Fundamentals; Springer International Publishing: Cham, Switzerland, 2018; pp. 779–794. [Google Scholar]
  41. Pastakkaya, B. Investigation of solar powered sorption cooling and heating systems to supply hospital’s thermal requirements in pandemic periods. Int. J. Low-Carbon Technol. 2023, 18, 373–383. [Google Scholar] [CrossRef] [Scilit]
  42. Güven, A.F.; Kaya, Y.; İbiş, S. Optimization of hybrid renewable energy systems for a public hospital: A case study of grid and off-grid solutions in Yalova, Turkey. In Proceedings of the International European Congress on Advanced Studies in Basic Sciences, Roma, Italy, 11–13 November 2024. [Google Scholar]
  43. Yorulmaz, M.; Taş, T.İ. Carbon footprint reduction and strategic benefits of energy efficiency: A case study in the healthcare sector. Electr. Eng. Energy 2025, 4, 55–67. [Google Scholar]
  44. Suganthi, L.; Samuel, A.A. Energy models for demand forecasting—A review. Renew. Sustain. Energy Rev. 2012, 16, 1223–1240. [Google Scholar] [CrossRef] [Scilit]
  45. Hong, T.; Fan, S. Probabilistic electric load forecasting: A tutorial review. Int. J. Forecast. 2016, 32, 914–938. [Google Scholar] [CrossRef] [Scilit]
  46. Abatzoglou, J.T.; Dobrowski, S.Z.; Parks, S.A.; Hegewisch, K.C. TerraClimate, a high-resolution global dataset of monthly climate and climatic water balance from 1958–2015. Sci. Data 2018, 5, 170191. [Google Scholar] [CrossRef] [Scilit] [PubMed]
  47. Gadain, H.; Libanda, B. A 66-year assessment of photovoltaic solar resource trends across Yemen. Sol. Energy Adv. 2025, 5, 100113. [Google Scholar] [CrossRef] [Scilit]
  48. Kassem, Y.; Gökçekuş, H.; Mosbah, A.A.S. Prediction of monthly precipitation using various artificial models and comparison with mathematical models. Environ. Sci. Pollut. Res. 2023, 30, 41209–41235. [Google Scholar] [CrossRef] [Scilit] [PubMed]
  49. Fick, S.E.; Hijmans, R.J. WorldClim 2: New 1-km spatial resolution climate surfaces for global land areas. Int. J. Climatol. 2017, 37, 4302–4315. [Google Scholar] [CrossRef] [Scilit]
  50. Harris, I.; Osborn, T.J.; Jones, P.; Lister, D. Version 4 of the CRU TS monthly high-resolution gridded multivariate climate dataset. Sci. Data 2020, 7, 109. [Google Scholar] [CrossRef] [Scilit] [PubMed]
  51. Ebita, A.; Kobayashi, S.; Ota, Y.; Moriya, M.; Kumabe, R.; Onogi, K.; Harada, Y.; Yasui, S.; Miyaoka, K.; Takahashi, K.; et al. The Japanese 55-year reanalysis “JRA-55”: An interim report. Sola 2011, 7, 149–152. [Google Scholar] [CrossRef] [Scilit]
  52. Kosmopoulos, P.G.; Kazadzis, S.; Taylor, M.; Athanasopoulou, E.; Speyer, O.; Raptis, P.I.; Marinou, E.; Proestakis, E.; Solomos, S.; Gerasopoulos, E.; et al. Dust impact on surface solar irradiance assessed with model simulations, satellite observations and ground-based measurements. Atmos. Meas. Tech. 2017, 10, 2435–2453. [Google Scholar] [CrossRef] [Scilit]
  53. Akinyoola, J.A.; Oluleye, A.; Gbode, I.E. A review of atmospheric aerosol impacts on regional extreme weather and climate events. Aerosol Sci. Eng. 2024, 8, 249–274. [Google Scholar] [CrossRef] [Scilit]
  54. Ben-tayeb, A.; Diouri, M.; Meziane, R.; Steli, H. Solar radiation attenuation by aerosol: Application to solar farms. Air Qual. Atmos. Health 2020, 13, 259–269. [Google Scholar] [CrossRef] [Scilit]
  55. Hatzianastassiou, N.; Matsoukas, C.; Drakakis, E.; Stackhouse, P.W., Jr.; Koepke, P.; Fotiadi, A.; Pavlakis, K.G.; Vardavas, I. The direct effect of aerosols on solar radiation based on satellite observations, reanalysis datasets, and spectral aerosol optical properties from Global Aerosol Data Set (GADS). Atmos. Chem. Phys. 2007, 7, 2585–2599. [Google Scholar] [CrossRef] [Scilit]
  56. Fard, A.M.; Broomandi, P.; Bagheri, M.; Middleton, N.; Ledari, D.G.; Fathian, A.; Shafiei, S.; Leuchner, M.; Kim, J.R. Atmospheric dust: Cluster based frequency and intensity projections in Central Asia under SSP scenarios. Aeolian Res. 2025, 74, 101009. [Google Scholar] [CrossRef] [Scilit]
  57. Acker, J.G. Using the NASA Giovanni system to assess and evaluate remotely-sensed and model data variables relevant to public health issues. In Geospatial Technology for Human Well-Being and Health; Springer International Publishing: Cham, Switzerland, 2022; pp. 127–149. [Google Scholar]
  58. Radziemska, E. The effect of temperature on the power drop in crystalline silicon solar cells. Renew. Energy 2003, 28, 1–12. [Google Scholar] [CrossRef] [Scilit]
  59. Jerez, S.; Tobin, I.; Vautard, R.; Montávez, J.P.; López-Romero, J.M.; Thais, F.; Bartok, B.; Christensen, O.B.; Colette, A.; Déqué, M.; et al. The impact of climate change on photovoltaic power generation in Europe. Nat. Commun. 2015, 6, 10014. [Google Scholar] [CrossRef] [Scilit] [PubMed]
  60. Mavromatakis, F.; Makrides, G.; Georghiou, G.; Pothrakis, A.; Franghiadakis, Y.; Drakakis, E.; Koudoumas, E. Modeling the photovoltaic potential of a site. Renew. Energy 2010, 35, 1387–1390. [Google Scholar] [CrossRef] [Scilit]
  61. Tonui, J.K.; Tripanagnostopoulos, Y. Performance improvement of PV/T solar collectors with natural air flow operation. Sol. Energy 2008, 82, 1–12. [Google Scholar] [CrossRef] [Scilit]
  62. Chenni, R.; Makhlouf, M.; Kerbache, T.; Bouzid, A. A detailed modeling method for photovoltaic cells. Energy 2007, 32, 1724–1730. [Google Scholar] [CrossRef] [Scilit]
  63. Efughu, D.; Azubuike, O.C.; Akpiri, B.F. Investigating the optimal photovoltaic (PV) tilt angle using the photovoltaic geographic information system (PVGIS). Niger. J. Technol. 2024, 43, 101–114. [Google Scholar] [CrossRef] [Scilit]
  64. Matius, M.E.; Ismail, M.A.; Farm, Y.Y.; Amaludin, A.E.; Radzali, M.A.; Fazlizan, A.; Muzammil, W.K. On the optimal tilt angle and orientation of an on-site solar photovoltaic energy generation system for Sabah’s rural electrification. Sustainability 2021, 13, 5730. [Google Scholar] [CrossRef] [Scilit]
  65. Abdallah, R.; Juaidi, A.; Salameh, T.; Jeguirim, M.; Çamur, H.; Kassem, Y.; Abdala, S. Estimation of solar irradiation and optimum tilt angles for south-facing surfaces in the United Arab Emirates: A case study using PVGIS and PVWatts. In Recent Advances in Renewable Energy Technologies; Academic Press: Cambridge, MA, USA, 2022; pp. 3–39. [Google Scholar]
  66. Kazem, H.A.; Chaichan, M.T.; Al-Waeli, A.H.; Sopian, K. Recent advancements in solar photovoltaic tracking systems: An in-depth review of technologies, performance metrics, and future trends. Sol. Energy 2024, 282, 112946. [Google Scholar] [CrossRef] [Scilit]
  67. Frid, S.E.; Lisitsksaya, N.V. Evaluating the possibility of increasing the capacity factor of grid-connected photovoltaic power plants. Therm. Eng. 2022, 69, 535–544. [Google Scholar] [CrossRef] [Scilit]
  68. Njoku, H.O.; Omeke, O.M. Potentials and financial viability of solar photovoltaic power generation in Nigeria for greenhouse gas emissions mitigation. Clean Technol. Environ. Policy 2020, 22, 481–492. [Google Scholar] [CrossRef] [Scilit]
  69. Guaita-Pradas, I.; Blasco-Ruiz, A. Analyzing profitability and discount rates for solar PV plants. A Spanish case. Sustainability 2020, 12, 3157. [Google Scholar] [CrossRef] [Scilit]
  70. Imam, A.A.; Al-Turki, Y.A.; R., S.K. Techno-economic feasibility assessment of grid-connected PV systems for residential buildings in Saudi Arabia—A case study. Sustainability 2019, 12, 262. [Google Scholar] [CrossRef] [Scilit]
  71. Singh, S.; Alharthi, M.; Anand, A.; Shukla, A.; Sharma, A.; Panchal, H. Performance evaluation and financial viability analysis of grid associated 10 MWP solar photovoltaic power plant at UP India. Sci. Rep. 2022, 12, 22380. [Google Scholar] [CrossRef] [Scilit] [PubMed]
  72. Wang, Y.; Lee, S.; Li, C.; Umair, M.; Yakhyaeva, I. Techno-economic evaluation of solar photovoltaic power production in China for sustainable development and the environment. Environ. Dev. Sustain. 2024, 1–30. [Google Scholar] [CrossRef] [Scilit]
  73. Fthenakis, V.M.; Kim, H.C. Photovoltaics: Life-cycle analyses. Sol. Energy 2011, 85, 1609–1628. [Google Scholar] [CrossRef] [Scilit]
  74. Gerbinet, S.; Belboom, S.; Léonard, A. Life Cycle Analysis (LCA) of photovoltaic panels: A review. Renew. Sustain. Energy Rev. 2014, 38, 747–753. [Google Scholar] [CrossRef] [Scilit]
  75. ISO 14040:2006; Environmental Management—Life Cycle Assessment—Principles and Framework. International Organization for Standardization (ISO): Geneva, Switzerland, 2006.
  76. Constantino, G.; Freitas, M.; Fidelis, N.; Pereira, M.G. Adoption of photovoltaic systems along a sure path: A life-cycle assessment (LCA) study applied to the analysis of GHG emission impacts. Energies 2018, 11, 2806. [Google Scholar] [CrossRef] [Scilit]
  77. IPCC. Climate Change 2021: The Physical Science Basis; Cambridge University Press: Cambridge, UK, 2021. [Google Scholar]
  78. Hansen, J.; Ruedy, R.; Sato, M.; Lo, K. Global surface temperature change. Rev. Geophys. 2010, 48. [Google Scholar] [CrossRef] [Scilit]
  79. Easterling, D.R.; Horton, B.; Jones, P.D.; Peterson, T.C.; Karl, T.R.; Parker, D.E.; Salinger, M.J.; Razuvayev, V.; Plummer, N.; Jamason, P.; et al. Maximum and minimum temperature trends for the globe. Science 1997, 277, 364–367. [Google Scholar] [CrossRef] [Scilit]
  80. Giorgi, F. Climate change hot-spots. Geophys. Res. Lett. 2006, 33. [Google Scholar] [CrossRef] [Scilit]
  81. Lelieveld, J.; Hadjinicolaou, P.; Kostopoulou, E.; Chenoweth, J.; El Maayar, M.; Giannakopoulos, C.E.; Hannides, C.; Lange, M.A.; Tanarhte, M.; Tyrlis, E.; et al. Climate change and impacts in the Eastern Mediterranean and the Middle East. Clim. Change 2012, 114, 667–687. [Google Scholar] [CrossRef] [Scilit] [PubMed]
  82. Turkes, M.; Turp, M.T.; An, N.; Ozturk, T.; Kurnaz, M.L. Impacts of climate change on precipitation climatology and variability in Turkey. In Water Resources of Turkey; Springer International Publishing: Cham, Switzerland, 2019; pp. 467–491. [Google Scholar]
  83. Skoplaki, E.; Palyvos, J.A. On the temperature dependence of photovoltaic module electrical performance: A review of efficiency/power correlations. Sol. Energy 2009, 83, 614–624. [Google Scholar] [CrossRef] [Scilit]
  84. Singh, P.; Ravindra, N.M. Temperature dependence of solar cell performance—An analysis. Sol. Energy Mater. Sol. Cells 2012, 101, 36–45. [Google Scholar] [CrossRef] [Scilit]
  85. McVicar, T.R.; Roderick, M.L.; Donohue, R.J.; Li, L.T.; Van Niel, T.G.; Thomas, A.; Grieser, J.; Jhajharia, D.; Himri, Y.; Mahowald, N.M.; et al. Global review and synthesis of trends in observed terrestrial near-surface wind speeds: Implications for evaporation. J. Hydrol. 2012, 416, 182–205. [Google Scholar] [CrossRef] [Scilit]
  86. Vautard, R.; Cattiaux, J.; Yiou, P.; Thépaut, J.N.; Ciais, P. Northern Hemisphere atmospheric stilling partly attributed to an increase in surface roughness. Nat. Geosci. 2010, 3, 756–761. [Google Scholar] [CrossRef] [Scilit]
  87. Nordmann, T.; Clavadetscher, L. Understanding temperature effects on PV system performance. Delta 2003, 20, 30. [Google Scholar]
  88. Hasan, K.; Yousuf, S.B.; Tushar, M.S.H.K.; Das, B.K.; Das, P.; Islam, M.S. Effects of different environmental and operational factors on the PV performance: A comprehensive review. Energy Sci. Eng. 2022, 10, 656–675. [Google Scholar] [CrossRef] [Scilit]
  89. Wild, M. Introduction to special section on global dimming and brightening. J. Geophys. Res. Atmos. 2010, 115. [Google Scholar] [CrossRef] [Scilit]
  90. Kouklaki, D.; Papachristopoulou, K.; Fountoulakis, I.; Tsekeri, A.; Raptis, P.I.; Kazadzis, S.; Eleftheratos, K. Impact of Aerosols on Surface Solar Radiation and Solar Energy in the Mediterranean Basin. Environ. Sci. Proc. 2023, 26, 56. [Google Scholar] [CrossRef] [Scilit]
  91. Kim, D.; Ramanathan, V. Solar radiation budget and radiative forcing due to aerosols and clouds. J. Geophys. Res. Atmos. 2008, 113. [Google Scholar] [CrossRef] [Scilit]
  92. Turnock, S.T.; Spracklen, D.V.; Carslaw, K.S.; Mann, G.W.; Woodhouse, M.T.; Forster, P.M.; Haywood, J.; Johnson, C.E.; Dalvi, M.; Bellouin, N.; et al. Modelled and observed changes in aerosols and surface solar radiation over Europe between 1960 and 2009. Atmos. Chem. Phys. 2015, 15, 9477–9500. [Google Scholar] [CrossRef] [Scilit]
  93. Alfadda, A.; Rahman, S.; Pipattanasomporn, M. Solar irradiance forecast using aerosols measurements: A data driven approach. Sol. Energy 2018, 170, 924–939. [Google Scholar] [CrossRef] [Scilit]
  94. Yoon, J.W.; Sungmin, O.; Kim, H.; Park, S.K. Assessing the impact of aerosol optical depth on solar radiation forecasts using WRF-Solar over South Korea. Renew. Energy 2026, 263, 125511. [Google Scholar] [CrossRef] [Scilit]
  95. Sari, F.; Rusen, S.E. Assessment of the criteria importance for determining solar panel site potential via machine learning algorithms, a case study Central Anatolia region, Turkey. Renew. Energy 2025, 239, 122145. [Google Scholar] [CrossRef] [Scilit]
  96. Akay, S.S. Investigating Land Suitability for PV Farm and Existing Sites Using a Multi-Criteria Decision Approach in Gaziantep, Türkiye. Appl. Sci. 2025, 15, 2441. [Google Scholar] [CrossRef] [Scilit]
  97. Gok, A. Determination of optimal locations for utility-scale photovoltaic installations in Turkiye for improved performance and service lifetime. Renew. Energy 2026, 273, 126113. [Google Scholar] [CrossRef] [Scilit]
  98. Gholam, M.; Dorahaki, S.; Reza, M.H.; Ben-Brahim, L.; Muyeen, S.M. Evaluating Year-Round Solar Energy Harvesting in Semi-Transparent PV-Integrated Greenhouses with Roof and Wall Installation in an Even-Span Design. Energy Nexus 2025, 21, 100617. [Google Scholar] [CrossRef] [Scilit]
  99. Rolim, J.; Vacas, B.; Silva, C.; Patrício, O.; Cameira, M.D.R. Integrating Solar Radiation Dynamics into Irrigation System Design: An Asymmetric-Sector Approach for Mediterranean Orchards. Agriculture 2026, 16, 744. [Google Scholar] [CrossRef] [Scilit]
  100. Jordan, D.C.; Kurtz, S.R. Photovoltaic degradation rates—An analytical review. Prog. Photovolt. Res. Appl. 2013, 21, 12–29. [Google Scholar] [CrossRef] [Scilit]
  101. Hazem, T.; Cheghib, H.; Fezzani, A.; Kahoul, N.; Sari, M.R.; Rashid, F.L.; Ameen, A.; Kezzar, M.; Mahariq, I. Performance evaluation of grid connected photovoltaic pilot plant in saharan climate using experimental and numerical analysis. Sci. Rep. 2025, 15, 32488. [Google Scholar] [CrossRef] [Scilit] [PubMed]
  102. Agathokleous, R.A.; Kalogirou, S.A. PV roofs as the first step towards 100% RES electricity production for Mediterranean islands: The case of Cyprus. Smart Energy 2021, 4, 100053. [Google Scholar] [CrossRef] [Scilit]
  103. Bakhshi-Jafarabadi, R.; Sadeh, J.; Dehghan, M. Economic evaluation of commercial grid-connected photovoltaic systems in the Middle East based on experimental data: A case study in Iran. Sustain. Energy Technol. Assess. 2020, 37, 100581. [Google Scholar] [CrossRef] [Scilit]
  104. Hadjipanayi, M.; Koumparou, I.; Philippou, N.; Paraskeva, V.; Phinikarides, A.; Makrides, G.; Efthymiou, V.; Georghiou, G.E. Prospects of photovoltaics in southern European, Mediterranean and Middle East regions. Renew. Energy 2016, 92, 58–74. [Google Scholar] [CrossRef] [Scilit]
  105. Ali, A.O.; Elgohr, A.T.; El-Mahdy, M.H.; Zohir, H.M.; Emam, A.Z.; Mostafa, M.G.; Al-Razgan, M.; Kasem, H.M.; Elhadidy, M.S. Advancements in photovoltaic technology: A comprehensive review of recent advances and future prospects. Energy Convers. Manag. X 2025, 26, 100952. [Google Scholar] [CrossRef] [Scilit]
  106. Peng, J.; Lu, L.; Yang, H. Review on life cycle assessment of energy payback and greenhouse gas emission of solar photovoltaic systems. Renew. Sustain. Energy Rev. 2013, 19, 255–274. [Google Scholar] [CrossRef] [Scilit]
  107. National Renewable Energy Laboratory. Energy and Carbon Payback Times for Modern U.S. Utility Photovoltaic Systems; (NREL/FS-7A40-88653); U.S. Department of Energy: Washington, DC, USA, 2024. Available online: https://www.nrel.gov/docs/fy24osti/88653.pdf (accessed on 26 July 2026).
  108. European Network of Transmission System Operators for Electricity. Report on Blackout in Turkey on 31st March 2015; (Final Version 1.0); ENTSO-E: Brussels, Belgium, 2015; Available online: https://eepublicdownloads.entsoe.eu/clean-documents/SOC%20documents/Regional_Groups_Continental_Europe/20150921_Black_Out_Report_v10_w.pdf (accessed on 26 July 2026).
Figure 1. Details of the selected hospitals.
Energies 19 03589 g001
Figure 2. Monthly electricity consumption data of 2025 for the selected hospitals.
Energies 19 03589 g002aEnergies 19 03589 g002b
Figure 3. Forecasted electricity demand profiles for all hospitals for the period 2026–2028.
Energies 19 03589 g003aEnergies 19 03589 g003b
Figure 6. Monthly climatology of photovoltaic resource potential averaged over selected locations for the period 1958–2024 (A: Adana Şehir Hospital, B: Bursa Şehir Hospital, C: Elazığ Şehir Hospital, D: Gaziantep Şehir Hospital, E: Yozgat Şehir Hospital, F: Başakşehir Şehir Hospital).
Energies 19 03589 g006
Figure 7. Annual photovoltaic resource potential trend in selected locations from 1958 to 2024: (a) Adana Şehir Hospital, (b) Başakşehir Şehir Hospital, (c) Bursa Şehir Hospital; (d) Elazığ Şehir Hospital, (e) Gaziantep Şehir Hospital and (f) Yozgat Şehir Hospital (blue color: variation of annual value, dotted line: mean value, line: trend line).
Energies 19 03589 g007aEnergies 19 03589 g007b
Figure 8. Monthly average energy production and capacity factor of proposed system over selected locations for the period 1958–2024.
Energies 19 03589 g008aEnergies 19 03589 g008b
Figure 9. Annual energy production and capacity factor trend of the proposed systems in selected locations from 1958 to 2024 (blue color: variation of annual value, dotted line: mean value, line: trend line).
Energies 19 03589 g009aEnergies 19 03589 g009bEnergies 19 03589 g009c
Figure 10. Comparison of EP estimation using the proposed TerraClimate-based methodology and PVGIS (SARAH3) on a monthly and yearly basis for six city hospitals.
Energies 19 03589 g010aEnergies 19 03589 g010b
Figure 11. Economic performance of proposed systems.
Energies 19 03589 g011aEnergies 19 03589 g011b
Figure 12. Environmental assessment results for all selected hospitals.
Energies 19 03589 g012
Figure 13. Three-dimensional response surface plots of monthly PV energy production (EP) as a function of rainfall (R), aerosol optical thickness (AOT) and R/AOT.
Energies 19 03589 g013aEnergies 19 03589 g013b
Table 1. Comparison of previous studies on solar energy applications in hospital and healthcare facilities.
ReferenceEnergy System TypeLong-Term Solar Resource AssessmentImpact of Climate Parameters on PV PerformanceTechnical
Analysis
Economic
Analysis
Environmental
Analysis
[23]PV + BG + WP + DG system
[24]Rooftop PV system
[25]Rooftop PV system
[26]PV systemTemperature, wind speed and radiation considered
[27]PV system + PCM
[28]PV system + HES
[29]PV system
[30]PV + WP + DG system
[31]PV system
[35]PV system
[36]PV system
[37]Rooftop PV system + STS
[38]Rooftop PV system
[39]PV system + TES
[40]PV system + Hydrogen
[41]PV system
[42]PV + WP + DG system + BS
[43]PV system
PV: Photovoltaic (PV), BG: biomass generator, WP: wind power, DG: diesel generator, STS: solar thermal systems, TES: thermal energy storage, BS: Battery storage, HES: hydrogen energy storage, PCM: phase change materials, ✗: not included, ✓: included.
Table 2. Optimum orientation angles value for all selected locations.
LocationSlope Angle [°]Azimuth Angle [°]
Yozgat Şehir Hospital32−1
Adana Şehir Hospital336
Elazığ Şehir Hospital320
Bursa Şehir Hospital336
Başakşehir Şehir Hospital324
Gaziantep Şehir Hospital338
Table 3. The mathematical equations of financial indicators and life-cycle assessment criteria.
Economic Feasibility Indicators
Indicator Description Equation
N P V Net present value N P V = t = 1 n C F t 1 + r t C 0
where C F t is the annual net cash flow in year t [USD], r is the discount rate [%], n is the project lifetime [years], and C 0 is the total initial investment cost [USD]
I R R Internal Rate of Return O = t = 1 n C F t 1 + I R R n C 0
R O I Return on Investment R O I = t = 1 n C F C 0 t C 0 × 100
L C O E Levelized cost of energy L C O E = t = 0 n C t 1 + r t t = 1 n E t 1 + r t
where C t is the annual project cost and E t is the electricity generated during year t
S P P Simple payback period S P P = C 0 E a n n u a l × P e C O & M
where E a n n u a l is the annual electricity generated by the PV system [kWh/year], P e is the electricity tariff and C O & M is the annual operation and maintenance cost [USD/year].
P I Profitability Index P I = t = 1 n C F t 1 + r t C 0
Life-cycle assessment criteria
CriteriaDescriptionEquation
C O 2 , e , e m b Embodied emissions C O 2 ,   e m b = P i n s t E F P V + E F t r a n s + E F B O S
where P i n s t is the installed PV capacity [kWp], E F P V is the PV module embodied emission factor, E F t r a n s is the transportation emission factor, and E F B O S represents the balance-of-system emission factor.
C O 2 , s a v e Annual avoided greenhouse gas emissions C O 2 ,   s a v e = E a n n u a l × E F g r i d
where E F g r i d is the grid emission factor [kg CO2-eq kWh−1]
C P P Carbon payback period C P P = C O 2 , e m b C O 2 , s a v e
C O 2 , l i f e Lifetime avoided emissions C O 2 , l i f e = C O 2 , s a v e × n
C O 2 , n e t Net lifetime environmental benefit C O 2 , n e t = C O 2 , s a v e C O 2 , e m b
Table 4. Summary of long-term trends (1958–2024) of solar-relevant climate variables at Turkish hospital locations.
LocationTmax [°C/Year]Tmin [°C/Year]Tcell [°C/Year]WS [m/s/Year]DSRS
[W/m2/Year]
Key Observation
Adana Şehir Hospital0.0250.0250.0197−0.00500.0328Strong warming of air and PV temperatures; declining wind speed may reduce PV cooling.
Bursa Şehir Hospital0.02320.0280.0055−0.01280.0499Largest warming observed in Tmin; strong decrease in wind speed and modest increase in solar radiation.
Elazığ Şehir Hospital0.02370.02080.0164−0.00770.0262Moderate warming trends and declining wind speed; solar radiation remains relatively stable.
Gaziantep Şehir Hospital0.02680.02680.0141−0.00310.054Strong warming signal with nearly unchanged solar radiation; temperature is the dominant factor affecting PV performance.
Yozgat Şehir Hospital0.02050.02510.0004−0.01490.0002Weakest Tcell trend but strongest wind speed decline; solar radiation shows virtually no long-term change.
Başakşehir Şehir Hospital0.0250.030.0173−0.00700.0566Strongest Tmin warming among all sites; increasing temperatures may offset gains from slightly higher solar radiation.
Table 5. Percentage change in average seasonal photovoltaic electricity generation between consecutive decadal periods (1958–1967 to 2018–2024) for the selected hospitals.
LocationSeason1958–1967 → 1968–19771968–1977 → 1978–19871978–1987 → 1988–19971988–1997 → 1998–20071998–2007 → 2008–20172008–2017 → 2018–2024
Adana Şehir HospitalWinter4.86−1.445.941.17−2.02−0.83
Spring−0.190.051.201.36−0.350.25
Summer−0.20−0.10−1.620.12−0.66−0.41
Autumn−2.250.95−1.901.47−0.960.30
Başakşehir Şehir HospitalWinter−2.650.146.84−0.51−1.441.85
Spring−0.530.77−1.011.560.56−0.82
Summer0.730.31−0.981.75−0.34−0.44
Autumn−1.690.25−1.390.020.241.24
Bursa Şehir HospitalWinter−0.930.506.19−0.23−1.170.42
Spring−0.600.91−0.831.31−0.03−0.54
Summer0.760.31−1.582.28−0.30−0.86
Autumn−2.610.97−2.110.630.830.32
Elazığ Şehir HospitalWinter7.97−4.547.194.50−3.89−2.54
Spring0.320.653.971.060.46−1.99
Summer0.15−0.17−0.811.05−0.69−0.04
Autumn−2.420.37−1.413.20−1.13−0.43
Gaziantep Şehir HospitalWinter6.82−1.966.541.54−1.90−1.24
Spring−0.261.121.531.66−0.02−1.90
Summer−0.180.14−0.95−0.08−0.56−0.35
Autumn−1.540.33−1.032.08−1.49−0.77
Yozgat Şehir HospitalWinter2.20−0.885.212.64−3.24−0.27
Spring−0.420.681.181.88−1.21−0.64
Summer2.06−1.37−1.932.55−2.280.92
Autumn−0.690.14−2.311.88−1.261.23
Table 6. RSM equations relating rainfall and aerosol optical thickness (AOT) to photovoltaic electricity generation for the selected hospitals.
LocationEquationR-Squared
Adana Şehir Hospital E P = 3753 32.54 · R + 2891 · A O T + 0.013 R A O T + 0.0113 · R 2 18250 · A O T 2 + 124.5 · R · A O T + 0.00303 · R 2 A O T 61.73%
Başakşehir Şehir Hospital E P = 6273 56.0 · R + 22091 · A O T 2.45 · R A O T + 0.139 · R 2 38699 · A O T 2 + 0.0011 · R A O T 2 + 66.0 · R · A O T + 0.00303 · R 2 A O T 58.45%
Bursa Şehir Hospital E P = 4944 74.6 · R + 20326 · A O T 0.40 R A O T + 0.195 · R 2 42520 · A O T 2 + 0.00277 · R A O T 2 + 114.4 · R · A O T + 0.00303 · R 2 A O T 63.04%
Elazığ Şehir Hospital E P = 2670 36.05 · R + 28319 · A O T 0.073 R A O T + 0.0637 · R 2 160407 · A O T 2 + 155.9 · R · A O T + 0.00156 · R 2 A O T 69.87%
Gaziantep Şehir Hospital E P = 4979 83.42 · R + 18631 · A O T + 0.422 R A O T + 1417 · R 2 88608 · A O T 2 + 344.6 · R · A O T + 0.00459 · R 2 A O T 73.87%
Yozgat Şehir Hospital E P = 446 19.27 · R + 8389 · A O T + 0.297 · R A O T + 0.0139 · R 2 19024 · A O T 2 + 48.5 · R · A O T + 0.00381 · R 2 A O T 57.15%
Disclaimer/Publisher’s Note: The statements, opinions and data contained in all publications are solely those of the individual author(s) and contributor(s) and not of MDPI and/or the editor(s). MDPI and/or the editor(s) disclaim responsibility for any injury to people or property resulting from any ideas, methods, instructions or products referred to in the content.