Article

Multi-Variant Economic Feasibility Analysis of Heat Transport Using a Mobile Thermal Energy Storage Unit with a Capacity of 2 MWh


by
Piotr Olczak
1,*,
Dominik Kryzia
1,
Piotr Matusiak
2,
Daniel Kowol
2,
Rafał Baron
2,
Paweł Friebe
2,
Karina Ignasiak
3 and
Agata Czardybon
3
1
Mineral and Energy Economy Research Institute, Polish Academy of Sciences, Wybickiego 7a, 31-261 Krakow, Poland
2
KOMAG Institute of Mining Technology, 44-101 Gliwice, Poland
3
Institute of Energy and Fuel Processing Technology, 41-803 Zabrze, Poland
*
Author to whom correspondence should be addressed.
Energies 2026, 19(15), 3559; https://doi.org/10.3390/en19153559
Submission received: 2 June 2026 / Revised: 7 July 2026 / Accepted: 9 July 2026 / Published: 29 July 2026

Abstract

The energy transition entails numerous challenges related to the generation and distribution of various forms of energy and heat. In the case of electricity, these include, among others, challenges associated with transmission; however, these are usually less severe than those related to heat transmission, particularly due to limited access to district heating transmission networks. At the same time, heat storage is considerably less expensive than electricity storage, which means that heat management and balancing are also less costly than balancing electricity generation and demand. These two factors provided the rationale for selecting mobile heat transport from locations where surplus heat is generated to potential end-users as the subject of analysis. In this context, analytical methods were applied to determine the relationship between the economic efficiency of such a solution and selected technical and economic parameters, including CAPEX, OPEX, heat transport costs, and heat prices. The analysis demonstrated that, under current price conditions as of 2025, the economic efficiency of this solution, expressed using the net present value measure, may exceed zero only under specific conditions. These include relatively short transport distances, a high frequency of transport cycles, and favourable heat prices. Nevertheless, in the future, due to potential increases in heat prices or the possibility of subsidising this type of heat transport, particularly with respect to CAPEX, the solution may become economically attractive.

1. Introduction

In both Poland and the European Union, the heat generation sector faces numerous challenges, including the need to increase the share of renewable energy sources in the energy generation mix. One additional challenge is the management of waste heat, understood as surplus heat generated in locations where it cannot be consumed directly. This issue particularly concerns sites without access to a district heating network, where the construction of such infrastructure would potentially be economically inefficient and/or excessively time-consuming. Another important problem in this context is the irreversibility of investment expenditures incurred for heat transmission infrastructure, especially when compared with mobile heat transport. Mobile heat transport, despite requiring lower capital expenditure, entails higher costs related to labour and transportation. Taking these factors into account, as well as the possibility of local heat production, for example from natural gas or heat pumps, only specific conditions may prove economically favourable for either the expansion of district heating networks or the implementation of mobile heat transport.
Poland is characterised by an exceptionally high share of the population with access to district heating networks compared with other European Union countries. Nevertheless, in many locations, so-called waste heat is generated, and its recovery and use in other technological processes could be achieved at almost zero marginal cost. Moreover, such activities are often promoted through various types of subsidy programmes. At the same time, the utilisation of waste heat may provide an additional benefit for companies in the context of ESG reporting.
The challenges faced by the heat market in Poland, particularly those related to heat production and supply, are associated with numerous technical aspects, primarily the improvement of energy efficiency, which has been extensively examined from a long-term perspective [1].

1.1. Heat Market in Poland

The Polish heat market is characterised by an exceptionally extensive district heating infrastructure compared with other European Union countries. In 2023, district heat was supplied to approximately 15 million inhabitants, corresponding to 52.2% of households in the country [2]. By comparison, the average share of district heating in EU countries was approximately 13–14% [3]. According to data from the Energy Regulatory Office (URE), 398 energy companies held 815 licences for activities related to heat generation (354), heat transmission and distribution (349), and heat trading (112). Of these entities, 71% operated in more than one area, indicating a high level of sectoral integration [4].
The total amount of heat produced by licenced entities in 2023 amounted to 376,600 TJ, of which 64% came from cogeneration units and the remaining 36% from heat-only plants [4]. Fossil fuels accounted for the vast majority of energy carriers: hard coal and lignite jointly represented 61.2% of the fuel consumed, and natural gas accounted for 13.0%, while renewable energy sources and waste, mainly biomass, accounted for 14.4% of total consumption [4]. Biomass remains the main renewable energy source in the heating sector, representing as much as 97% of the total RES share in this sector [2].
With regard to transmission infrastructure, the total length of district heating networks in Poland in 2023 was 21,756 km, more than 90% of which was located in cities with more than 50,000 inhabitants [4]. However, a significant part of this infrastructure is outdated. According to URE estimates, approximately 42% of the network requires modernisation due to low transmission efficiency and high heat losses [4]. The average heat transmission efficiency ratio in Poland in 2023 was 86.1%, meaning that almost 14% of heat was lost during delivery to end-users [4].
In the heat sales market, the total amount of heat sold by licenced enterprises in 2023 amounted to 335,430 TJ, representing a decrease of 6.17% compared with 2022. The residential sector remained the largest heat consumer, accounting for 48.2% of heat sold, followed by the public services sector (20.4%) and industry (17.7%) [4]. The average selling price of district heat in 2023 was PLN 104.65/GJ, which represented an increase of 63.43% compared with the previous year [4].
The financial situation of the sector remains difficult. In 2023, the total revenues of licenced district heating companies amounted to PLN 42 billion, of which PLN 31 billion came from activities related to heat generation, transmission and distribution [4]. However, the sector’s net result was highly differentiated: as many as 23% of enterprises recorded a financial loss, mainly due to high fuel purchase costs, CO2 emission allowance costs, and limited possibilities of passing these costs through to tariffs [4]. The average cost of CO2 emissions in 2023 was approximately EUR 75/t, and its share in heat production costs exceeded 20% in the case of coal-fired units [2].
In addition, the utilisation of waste heat potential and low-temperature heat sources remains marginal. Although it is technically possible to recover heat from, among others, data centres, industrial refrigeration facilities, and wastewater heat, their current share in the heat mix does not exceed 1% [5]. There is also a lack of appropriate regulations promoting the integration of such sources into district heating networks.

1.2. Literature Review

One of the approaches to improving energy efficiency and reducing CO2 emissions is the utilisation of waste heat from industrial processes. In this context, Fritz et al. conducted a comparative analysis of district heating networks, which are capital-intensive and require considerable time for implementation, and examined the conditions under which such networks may be more economically viable than mobile heat transport [6]. The demonstrated profitability depends on the quantity of available heat; therefore, both qualitative and quantitative analyses were carried out to compare the economic aspects of the analysed solutions. Based on more than 450,000 analysed variants, the authors showed, among other findings, that the transport of an appropriate amount of heat over distances below 6 km may be economically efficient [6].
Asefi et al. analysed porous phase change materials (PCMs) for heat transport and storage under Chinese conditions, using hybrid photovoltaic–thermal systems, i.e., systems generating both electricity and heat [7]. The levelised cost of energy (LCOE) was adopted as the economic performance indicator, and the study examined the conditions under which this indicator would reach its lowest values [7].
The analysis of mobile heat transport demonstrated that the economic efficiency of this solution is influenced primarily by the scale of heat demand and transport distances. The impact of PCM material costs and transport costs on the final economic outcome was also identified, with the lifetime of the installation additionally taken into account [8].
Giampieri et al. analysed mobile heat transport and storage using different substances and determined the conditions under which heat transport over a distance of approximately 10 km may be economically viable [9]. Deckert et al. examined the occurrence and frequency of charging and discharging cycles of thermal energy storage systems, as well as the impact of various PCM-related factors on mobile heat transport and storage [10].
Liu et al. analysed three different PCM material structures for mobile heat transport and compared the costs per 1 kWh of energy [11]. In another study, different sizes and thicknesses of PCM capsules were analysed in the context of heat storage from solar systems, using the Ansys Fluent 15.0 simulation software [12].
Potential heat sources for mobile heat storage and transport include renewable energy installations, industrial processes, air-conditioning and refrigeration systems, district heating systems, and cogeneration units. Hydrogen technologies also constitute an important group of potential sources, including hydrogen production and storage processes in which recoverable heat streams are generated, such as heat produced during the operation of electrolysers [13,14] and fuel cells [15]. Taking these sources into account broadens the potential application range of mobile thermal energy storage systems, particularly in locations situated away from district heating networks.
Tests concerning the application of mobilised thermal energy storage (M-TES) under Polish conditions, using geothermal heat, were carried out by Kuta. The study considered 700 kg of PCM to meet the heat demand of a single-family house. The results provided several guidelines for the design of this type of installation, including the appropriate selection of PCM and a suitably adapted heat exchanger design. These aspects were shown to depend on the supply temperature and the stability of operating conditions at the heat source. In addition, the study highlighted the importance of the distance between the charging and discharging points [16]. This work constitutes a continuation of the research by Matuszewska et al. [17], which focused on the economic analysis of mobile thermal energy storage for the transport of geothermal heat to single-family houses.
The conditions related to competing heat sources are also significant, particularly in view of differences in natural gas prices before 2021 and after 2022, as indicated, among others, by Kaczmarzewski et al. [18]. These changes were also indirectly affected by consumption-related conditions in the natural gas market [19]. The need for the appropriate selection of PCM type and shape, as well as heat exchanger design, in order to enable a more efficient process of thermal energy storage and transport, was demonstrated by Kuta et al. [20], with the aim of increasing the use of renewable energy. Long-term analyses of solar energy utilisation with the application of PCM were conducted by Radomska and Mika [21].
Recent studies have examined M-TES from different technical and economic perspectives. Matuszewska et al. [17] assessed geothermal heat delivery using M-TES under Polish conditions, Shehadeh et al. [22] analysed its integration into a district energy network, and Fritz et al. [6] compared mobile and stationary excess-heat transport technologies. Resch and Dehner [23] updated the economic assessment for the energy-price conditions of 2022, while Yang et al. [24] focused on the design and thermal performance of a composite-PCM M-TES unit. Reviews by Kuta [25] and Kuta et al. [26] confirm that existing studies remain dominated by technical analyses and location-specific case studies. However, the literature does not combine a newly designed 2 MWh PCM-based mobile thermal energy storage unit, post-2021 Polish heat-market conditions, detailed CAPEX, OPEX and transport-cost assumptions, and a long-term NPV assessment across a broad multidimensional parameter space. The novelty of the present study therefore lies in analysing 1.656 billion parameter combinations to identify profitability boundaries as functions of heat purchase and selling prices, annual cycle number, transport distance, transport costs, RTE and uCAPEX. This approach makes it possible to determine the technical, operational and market conditions under which the analysed system may become economically viable, rather than assessing only a single location-specific configuration. Section 1 outlines the background of the problem, presents a review of the literature, and defines the research gap. Section 2 describes the analytical assumptions, calculation variants, adopted techno-economic parameters, and the procedure used to assess economic viability. Section 3 presents the outcomes of the multi-variant calculations, including the relationship between NPV and key parameters, as well as the sensitivity analysis. Section 4 interprets the results, identifies their limitations, and discusses practical implications for the application of mobile thermal energy storage systems. Finally, Section 5 summarises the most important findings and indicates directions for further research.

2. Methods

The economic potential of applying mobile thermal energy storage was analysed using economic efficiency indicators across different variants. The base variant takes into account the difference between the selling price of heat and the purchase price of waste heat, i.e., a price spread sufficient to cover operating costs and to ensure profitability when investment expenditures are also considered. The selling price of heat is assumed to be competitive relative to alternative solutions, such as local stationary heat generation. At present, the main competing technology is heat generation based on natural gas.

2.1. Cost–Benefit Analysis (CBA)

A cost–benefit analysis was carried out for a project involving the mobile transport of waste heat as a substitute for heat generated from natural gas.
A detailed analysis according to the nine-step CBA framework is presented below:
  • Project outline: Definition of the project goals, objectives, and scope.
The objective of the project, as understood within the CBA framework, is to implement an innovative system for the mobile transport of waste heat from locations where it is generated, such as industrial facilities or combined heat and power plants, to final consumers who currently use, or could potentially use, heat generated from natural gas or heat pumps. The main objectives are to reduce natural gas consumption, lower heating costs for end-users, decrease greenhouse gas emissions, and improve energy efficiency through the utilisation of previously unused waste heat.
The implementation of the project includes, among other activities, the purchase and operation of mobile thermal energy storage units, in this case thermal tank trailers, the construction or adaptation of heat loading and unloading points, and, optionally, the optimisation of transport logistics.
2.
List of costs: Identification of all potential costs associated with the project, including direct costs, such as materials and labour, and indirect costs, such as overheads and opportunity costs.
List of costs:
  • Investment costs (CAPEX):
    Purchase of mobile thermal energy storage units, including thermal tank trailers, thermal containers, and transport vehicles.
    Construction or adaptation of infrastructure at the heat source, including loading stations, pumps, and heat exchangers.
    Construction or adaptation of infrastructure at the heat consumers’ sites, including unloading stations, connections to the heating network, pumps, and heat exchangers.
    Design, engineering, and administrative costs related to project implementation.
    Costs of permits and licences, where applicable.
  • Operating costs (OPEX):
    Fuel and electricity costs for transport vehicles.
    Maintenance and repair costs of mobile units and infrastructure.
    Labour costs, including drivers, loading and unloading station operators, technical personnel, and logistics management staff.
    Insurance costs for vehicles and infrastructure.
    Costs associated with heat losses during transport and storage.
    Monitoring and system management costs.
    Asset depreciation costs.
    Administrative and overhead costs.
These costs were classified into categories and included in Table 1.
3.
List of benefits: Identification of all potential project benefits, including direct benefits, such as increased revenues, and indirect benefits, such as improved efficiency and enhanced reputation.
List of benefits for the recipient of the solution, understood as the enterprise receiving heat and investing in the necessary infrastructure:
  • Measurable benefits (financial benefits):
    Cost savings resulting from replacing heat generated, for example, from natural gas with cheaper waste heat recovered from other processes.
  • Non-measurable benefits (non-financial benefits):
    Access to a stable and diversified heat source: Reduced dependence on volatile natural gas prices and geopolitical factors affecting its availability.
    Improved energy efficiency: Utilisation of resources that were previously wasted.
    Environmental benefits: Reduction of greenhouse gas emissions, including CO2, NOx, and SOx, as well as other air pollutants, contributing to improved local air quality.
    Strengthening the image of the company or region: Positioning as a leader in sustainable development and innovation.
    Increased energy security: Improved resilience to energy crises.
4.
Valuation of costs and benefits: Assignment of monetary values to all listed costs and benefits.
At this stage, all identified costs and benefits are converted into monetary values. Investment costs are usually relatively easy to estimate on the basis of supplier quotations and construction cost estimates. Operating costs require an analysis of fuel and electricity consumption, wage rates, and maintenance costs. Financial benefits, such as savings resulting from the substitution of heat generated, for example, from natural gas, are calculated on the basis of forecast natural gas prices and the amount of heat replaced. The results are included in Table 1.
The total capital expenditure of a mobile heat transport project consists of two categories: (i) the cost of the complete mobile thermal energy storage module and (ii) the costs of additional transport and site-specific infrastructure. In the detailed engineering estimate presented below, the mobile module includes the PCM material, tank and semi-trailer structure, thermal insulation, internal heat exchanger system, measurement and control equipment, supporting structure, technical documentation and approvals, assembly, testing, transport and technical acceptance. Costs related to a tractor unit, stationary charging and discharging stations, external connections and site adaptation are treated as additional configuration-dependent expenditures. The semi-trailer itself should be equipped with a complete set of heat exchangers and an appropriate PCM material. In addition, the costs of constructing or adapting stations enabling the connection of the mobile thermal energy storage unit to energy distribution systems should be taken into account, for example through ramps and stationary heat exchangers.
The adopted technical assumptions involve the transport of 2 MWh of energy, which corresponds to 7200 MJ or 7.2 GJ. When using PCM, such as paraffin or inorganic salts, with a latent heat of phase transition of approximately 200 kJ/kg, a melting temperature in the range of 60–120 °C, and a density of approximately 900 kg/m3, the required mass of the material amounts to approximately 36,000 kg, i.e., 36 tonnes, which corresponds to a volume of approximately 40 m3. Such parameters are typical for thermal energy storage applications based on PCM [27].
To transport this quantity of material, it is necessary to use a thermally insulated tank semi-trailer with a capacity of at least 40 m3. Under EU conditions, the permissible gross vehicle weight of such a vehicle combination is approximately 44 tonnes, of which around 10 tonnes correspond to the mass of the semi-trailer, while the remaining 36 tonnes are the PCM payload. The insulation should be made using vacuum or polyurethane technology with a minimum thickness of 100 mm, ensuring a heat transfer coefficient U below 0.3 W/m2K. Inside the tank, the installation of stainless-steel heat exchangers, for example in the form of coils with a total heat transfer area of 20–30 m2, is assumed in order to enable efficient heat charging and discharging.
The calculation of investment expenditures includes both the structural components of the semi-trailer and the cost of purchasing the PCM material. The market price of technical-grade paraffin with a melting temperature of 60–120 °C is in the range of PLN 8–15/kg, depending on purity and supplier [cf. BASF, Micronal® PCM (BASF SE, Ludwigshafen, Germany); www.basf.com (accessed on 11 May 2026)]. For 36 tonnes, this results in a total cost of approximately PLN 288,000–540,000 net. In the case of inorganic salts, such as salt hydrates, the unit cost is lower, typically in the range of PLN 4–8/kg [IEA, Thermal Energy Storage, www.iea.org/reports/thermal-energy-storage (accessed on 11 May 2026)], which corresponds to PLN 144,000–288,000 for the entire load. The choice of material therefore has a significant impact on total CAPEX and should be linked to the temperature requirements of the application and the permissible gross vehicle weight.
An indicative cost analysis of the semi-trailer itself includes the manufacture of a 40 m3 stainless-steel tank at PLN 90,000–120,000, thermal insulation at PLN 40,000–60,000, a heat exchanger system at PLN 25,000–40,000, a measurement and automation system with temperature, pressure, and flow sensors at PLN 15,000–25,000, a supporting structure and equipment compliant with ADR standards at PLN 40,000–60,000, preparation of the design and technical documentation including Office of Technical Inspection (UDT)/ADR approvals at PLN 10,000–15,000, and assembly and testing, including pressure and leak tests, at PLN 30,000–50,000, as well as transport and technical acceptance costs at PLN 5000–10,000. The sum of these items gives an indicative expenditure range of approximately PLN 255,000–380,000 net. After adding the cost of purchasing the PCM, the total investment expenditure ranges from approximately PLN 399,000 in the lower-cost inorganic salt variant to as much as PLN 920,000 in the high-purity paraffin variant.
For a storage capacity of 2 MWh, the above engineering estimate corresponds to approximately EUR 46,000–106,000/MWh. The lower value represents a configuration based on a low-cost inorganic-salt PCM and the lower estimates for tank manufacture and auxiliary equipment. The upper value represents a configuration based on high-purity paraffin and the upper estimates for the tank, insulation, heat exchanger, automation and other mobile-module components.
The wider uCAPEX range of EUR 40,000–200,000/MWh adopted in Table 1 represents a scenario range rather than the direct result of the detailed mobile-module estimate. The lower bound corresponds to an optimised and standardised configuration using a low-cost PCM, serial-production effects and existing transport or connection infrastructure. The upper bound represents a conservative prototype or customised project configuration, potentially including a more expensive PCM, enhanced heat exchangers and insulation, advanced automation, a dedicated tractor unit, stationary charging and discharging infrastructure, site adaptation, certification and a cost contingency.
5.
Compare costs and benefits: Comparison of total costs and total benefits to determine whether the benefits outweigh the costs.
After monetary values have been assigned to all items, total costs and total benefits are aggregated over the entire project analysis period. At this stage, a preliminary assessment is made as to whether the sum of benefits exceeds the sum of costs. However, this is a simplified assessment, as it does not account for the time value of money (Equations (2), (3) and (5)).
6.
Calculate payback time: Determination of how long it will take for the project’s benefits to offset its costs.
The payback time is the period in which the cumulative net benefits generated by the project become equal to the initial investment expenditures. A shorter payback period is generally preferred, although this indicator does not account for profits generated after the payback point or for the time value of money.
7.
Apply discount rates: Adjustment of future costs and benefits to their present values using discount rates to account for the time value of money.
To account for the time value of money, i.e., the fact that money received today is worth more than the same amount received in the future, future streams of costs and benefits are discounted to their present value. An appropriate discount rate of 5% is applied, reflecting the cost of capital, project risk, and inflation.
8.
Analyse results: Evaluation of net present value (NPV) and other relevant metrics to assess the project’s overall financial viability.
After all cash flows have been discounted, the net present value (NPV) is calculated (Equation (1)). NPV represents the difference between the sum of discounted benefits and the sum of discounted costs. A positive NPV indicates that the project is financially viable and generates value for the investor.
9.
Make recommendation: Formulation of a recommendation on whether to proceed with the project and identification of necessary adjustments.
Based on a comprehensive analysis of NPV, IRR, payback time, and the results of the sensitivity analysis, a recommendation is formulated. If the NPV is positive and the project remains robust under adverse scenarios, as indicated by the sensitivity analysis, its implementation is recommended. The recommendation may also include suggestions for project optimisation, such as seeking additional sources of financing, including subsidies, negotiating more favourable heat or fuel prices, or optimising transport routes in order to maximise benefits and minimise risk.
In price comparisons, tariff-related aspects should also be taken into account, since tariff structures and regulatory mechanisms affect the final heat prices in Poland [28,29]. Therefore, the profitability analysis of mobile heat transport should be benchmarked against the costs of alternative local heat generation, including natural gas, electricity, and heat pumps. In the case of heat pumps, the COP/SCOP efficiency and electricity tariff profile are particularly important. In addition, heat losses in heat exchangers and during transport, which depend on transport distance and cycle duration, must be included so that the comparison refers to the cost of useful heat delivered to the end-user.

2.2. Computational Methodology

The basic indicator of economic efficiency incorporating discounting was calculated according to the following formula:
N P V = y e a r C F y e a r 1 + r y e a r , y e a r < 0 , Y >
where
  • Y: Lifetime of mobilised thermal storage, years.
  • R: Discount rate, %.
  • CF: Yearly cash flow—Equation (2), EUR/year.
  • year: Year of calculation from 0 to Y.
C F ( y e a r ) = cap   × uCAPEX       if   year = 0 CFinc y e a r CFcost y e a r       if   year > 0
where
  • uCAPEX: Unit CAPEX per MWh, EUR/MWh.
  • cap: Capacity of heat storage (depends on temperature and type of PCM), MWh.
  • CFinc: Cash flow—income part—Equation (5), EUR.
  • CFcost: Cash flow—cost part—Equation (3), EUR.
C F c o s t ( y e a r ) = O P E X f + ( O P E X v + P r W H × c a p ) × N o C ( y e a r )
where
  • OPEXf: Operational expenditures—fixed for year scale, EUR.
  • OPEXv: Operational expenditures—variable, dependent on distance.
  • PrWH: Waste heat price, EUR/MWh.
  • cap: capacity of heat storage (depend on temperature and kind of PCM), MWh.
O P E X v = T C f + T C v × d i s t
where
  • TCf: Unit transport cost fixed for one cycle (mainly labour cost), euro/cycle.
  • TCv: Unit transport cost per distance, EUR/km.
  • Dist: Whole distance by road from heat supply to heat consumer—the way there and back, km/cycle.
C F i n c y e a r = P r H y e a r × c a p × R T E 100 × N o C ( y e a r )
where
  • PrH: Heat price (for selling)—mean value for year, EUR/MWh.
  • PrWH: Waste heat price (for buying), EUR/MWh.
  • cap: Capacity of M-TES, MWh.
  • RTE: Total round trip efficiency, %.
  • NoC: Number of cycles (how many times full of heat transport is selling for the same distance and heat consumer), per year.
Although the indicators PrH and PrWH refer to heat prices, without a substantial difference between the purchase and selling prices of heat, the concept of mobile heat transport would be highly questionable from an economic perspective. In such a case, the only practically relevant benefits would be environmental ones, including the reduction of CO2 emissions and other related impacts.
The following values were adopted as constants:
  • Capacity (cap) = 2 MWh;
  • Discount rate r = 5% [30,31];
  • Total round-trip efficiency (RTE) = 80%. It should be noted that RTE should also depend on the temperature difference, cycle duration, transport distance, and other operational conditions. This aspect is therefore identified as an area for further research.
The value of RTE = 80% was adopted as a baseline engineering assumption for a well-insulated 2 MWh PCM-based mobile thermal energy storage unit operating under favourable short-distance transport conditions. In this study, RTE is defined as the ratio of useful heat delivered to the end user to the heat charged into the unit, including losses during charging, transport, idle periods and discharging, as well as heat exchanger losses. It should therefore be understood as a reference value for the techno-economic assessment, not as a fixed physical property of the system.
The 80% assumption is justified by the expected use of adequate tank insulation and by the relatively limited share of insulation costs in the total trailer/tank manufacturing cost. Increasing insulation thickness to reduce heat losses and achieve the required seasonal efficiency may therefore be possible with only a limited increase in total system CAPEX.
The authors acknowledge, however, that actual RTE may vary with operating conditions, including temperature difference, cycle duration, transport distance, ambient temperature, wind, idle time, insulation quality and charging/discharging performance. Consequently, a constant RTE may overestimate NPV under less favourable conditions, especially for longer transport distances or extended idle periods. Therefore, the impact of RTE variability is further examined in the sensitivity analysis.
The assumed overall RTE of 80% was further decomposed into charging, storage/transport/idle-period and discharging components, according to the general approach in which total storage efficiency is expressed through the efficiencies of individual stages [32]:
RTE = ηch × ηst,tr × ηdis
where ηch is the charging efficiency, ηdis is the discharging efficiency, and ηst,tr is the combined storage, transport and idle-period efficiency. For the baseline case, ηch = 0.95 and ηdis = 0.95 were adopted as engineering assumptions for a properly designed heat exchange system. These values are consistent with reported PCM/LHTES/M-TES performance, including discharge efficiencies of approximately 89–93.5% in PCM-based LHTES systems [33] and approximately 97% heat release during discharging in an M-TES system [24]. The remaining component was calculated as ηst,tr = 0.80/(0.95 × 0.95) = 0.886. The residual term ηst,tr = 0.886 should be interpreted as an aggregated efficiency of the storage, transport and idle-period stages, rather than as a directly measured efficiency of one isolated process. Its value is consistent with the typical 75–90% efficiency range reported for PCM-based thermal energy storage systems [34]. Physically, it accounts for heat losses through the tank, pipework and connection insulation during storage and road transport, idle-period losses between charging and unloading, thermal bridges, non-uniform PCM temperature distribution, and other minor operational imperfections. In the present preliminary model, the individual shares of insulation losses, idle-period losses and other operational losses were not calculated separately, as this would require a dedicated transient heat-transfer model and experimental validation. For the interpretation of the sensitivity analysis, ηst,tr = 0.886 refers to the reference case of a well-insulated 2 MWh PCM-based M-TES unit, a total return transport distance of 25 km and moderate ambient conditions, represented by an ambient temperature of approximately 15 °C. Therefore, ηst,tr should not be treated as a universal constant; longer distances, extended idle periods, lower ambient temperatures or poorer insulation may reduce its value. This uncertainty is addressed in the model through the sensitivity analysis of total RTE.
The adopted transport cost ranges were based on the literature and data on road freight transport costs. The variable transport cost TCv = 0.4–2.0 EUR/km reflects a range from marginal costs, mainly related to fuel consumption, to full market-based transport costs. For Poland, CNR data indicate a fuel-related cost of approximately 0.42 EUR/km and a total cost of approximately 1.08 EUR/km for a 40-tonne heavy goods vehicle [35]. Similar values are used in M-TES studies, e.g., 0.97 EUR/km for diesel truck operation [23], while European road freight benchmarks indicate rates of approximately 1.14–1.68 EUR/km on the Poland–Germany corridor and higher values on selected Western European routes [36]. The fixed cost TCf = 1–5 EUR/cycle was interpreted as an additional short cycle-dependent handling and organisational cost, rather than as the full labour cost related to transport. This range is consistent with previous M-TES assumptions for Polish conditions, where a labour cost of 5 EUR/h and a 12 min container exchange time correspond to approximately 1 EUR/cycle [17]. In addition, based on CNR data for Polish road transport, the cost of one hour of driver labour is 14.74 EUR/h [35]. Assuming a short cycle handling time of 12–20 min, this corresponds to approximately 2.95–4.91 EUR/cycle, which falls within the adopted TCf range of 1–5 EUR/cycle.
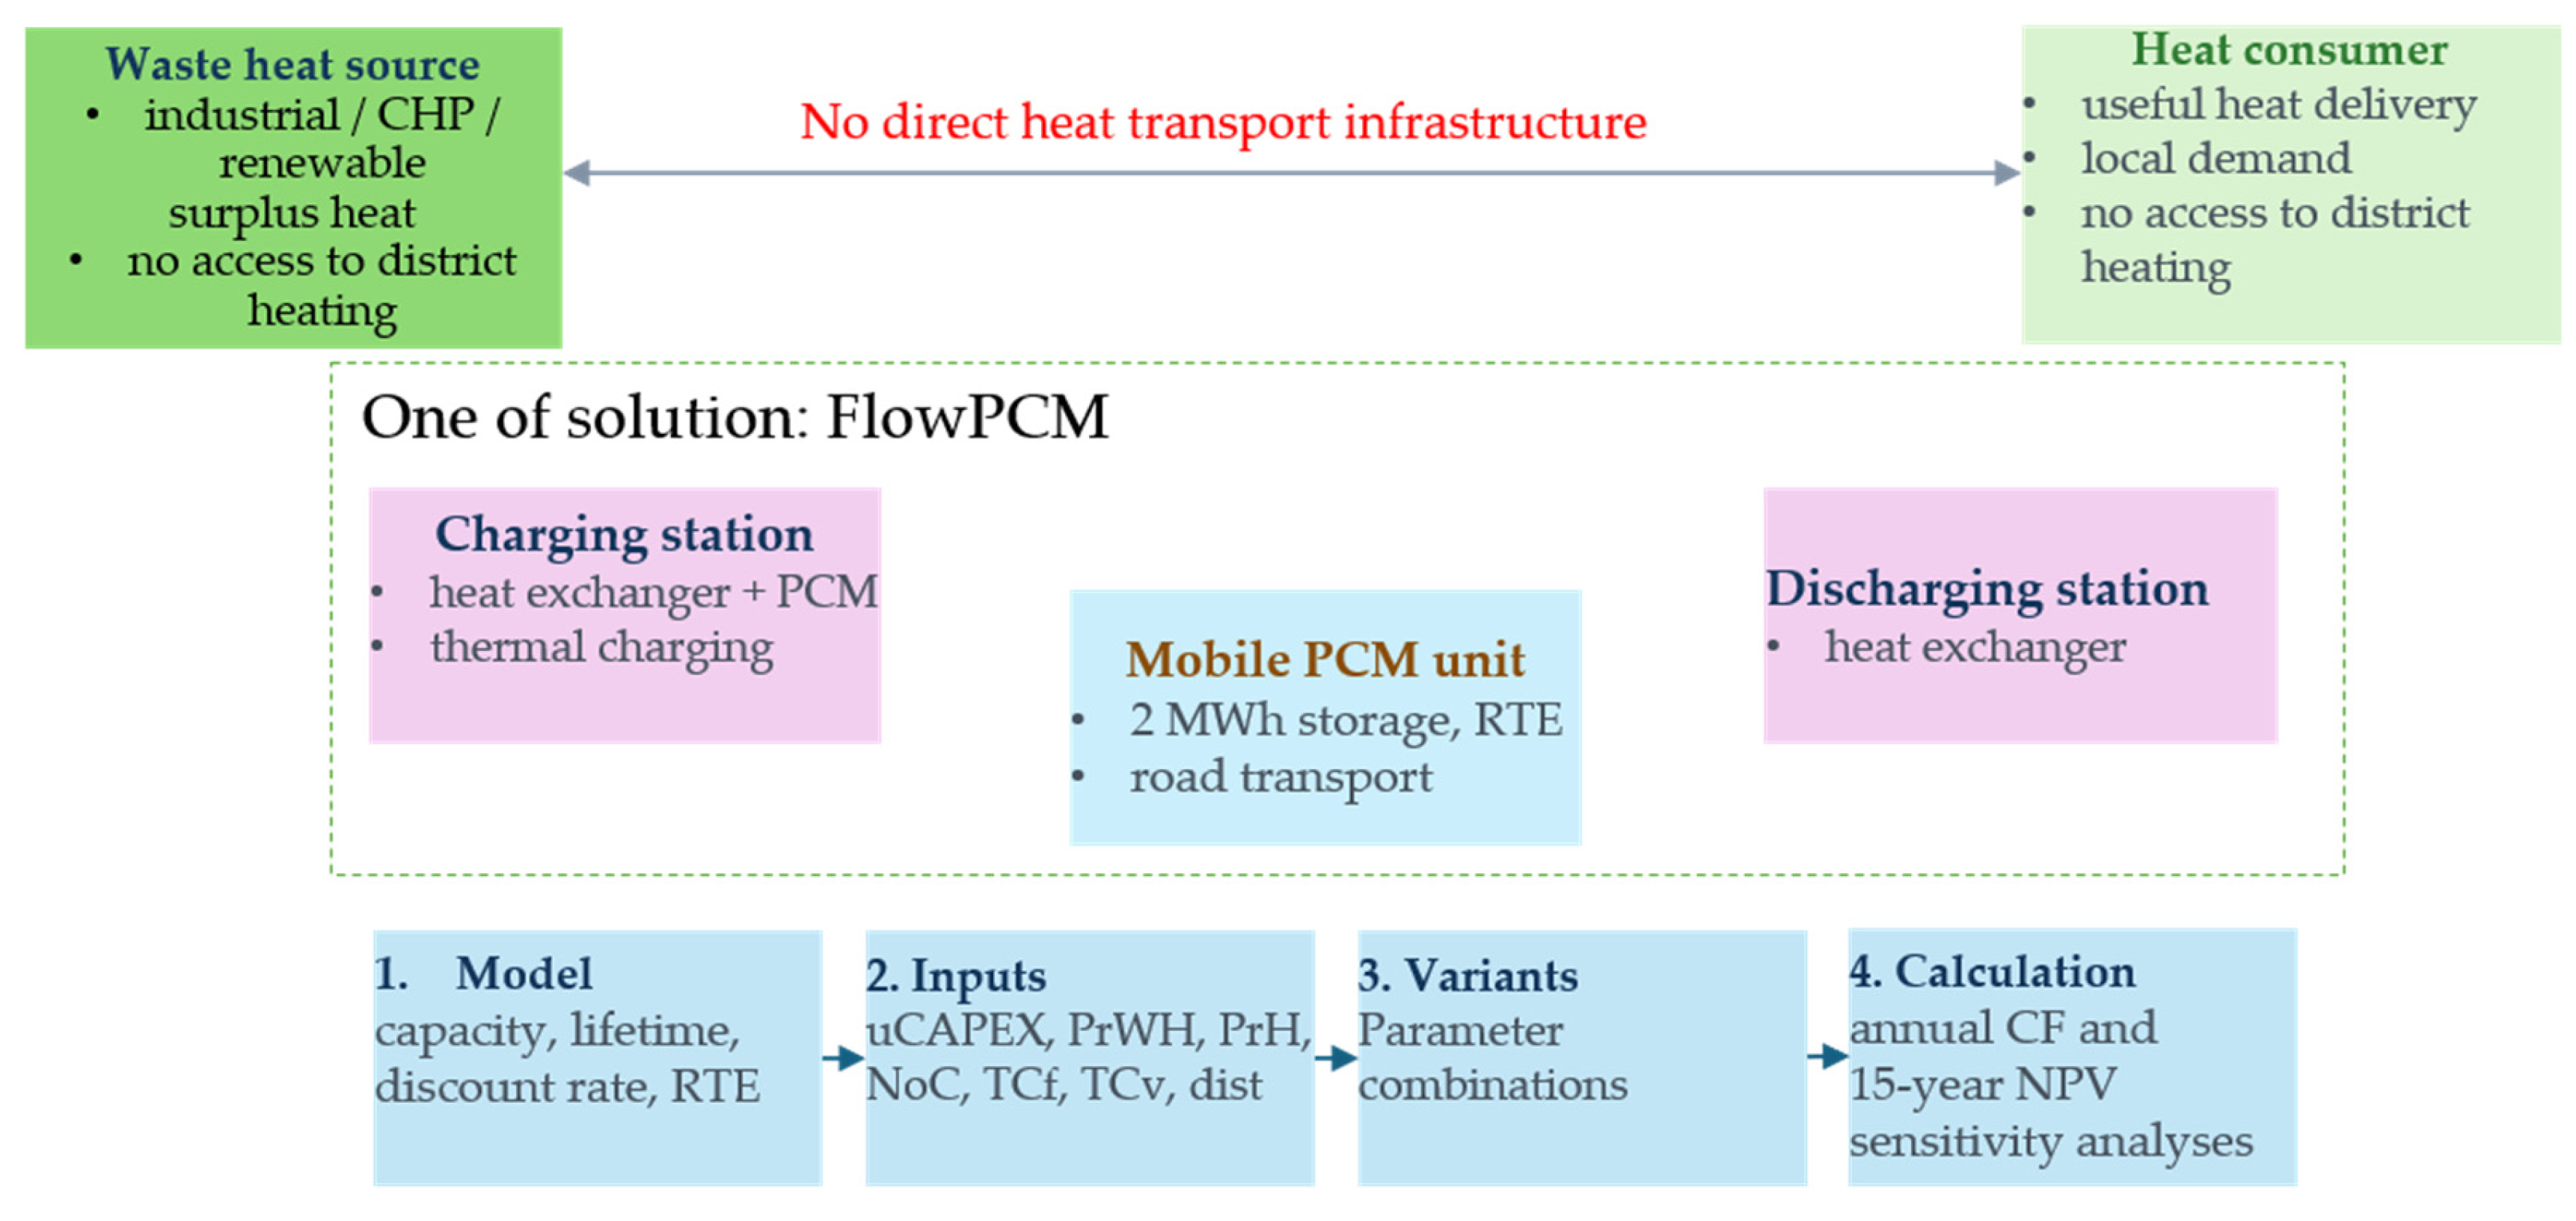
The workflow of the multi-variant techno-economic analysis is presented in Figure 1.
A total of 1.656 billion computational combinations were analysed in order to determine the boundaries and conditions of the economic viability of heat transport using the investigated mobile thermal energy storage and transport system across a broad range of technical and economic parameters. Such a large number of variants enabled a multidimensional assessment of the impact of key factors on the economic performance of the system, as well as the identification of profitability regions.
The obtained results were then compared with the costs of local stationary heat generation from natural gas, which was treated as the reference variant. The benchmark was the comparative heat selling price that could realistically be achieved on the market. This made it possible to determine the conditions under which heat transport may constitute a competitive alternative to local gas-based heat sources.

3. Results

The analysed computational combinations were used to determine the relationships describing the impact of the adopted decision variables on the NPV of the investigated project. The analysis was carried out over the full range of parameter values presented in Table 1, which enabled the identification of both economically unviable regions and variants with the highest economic potential.
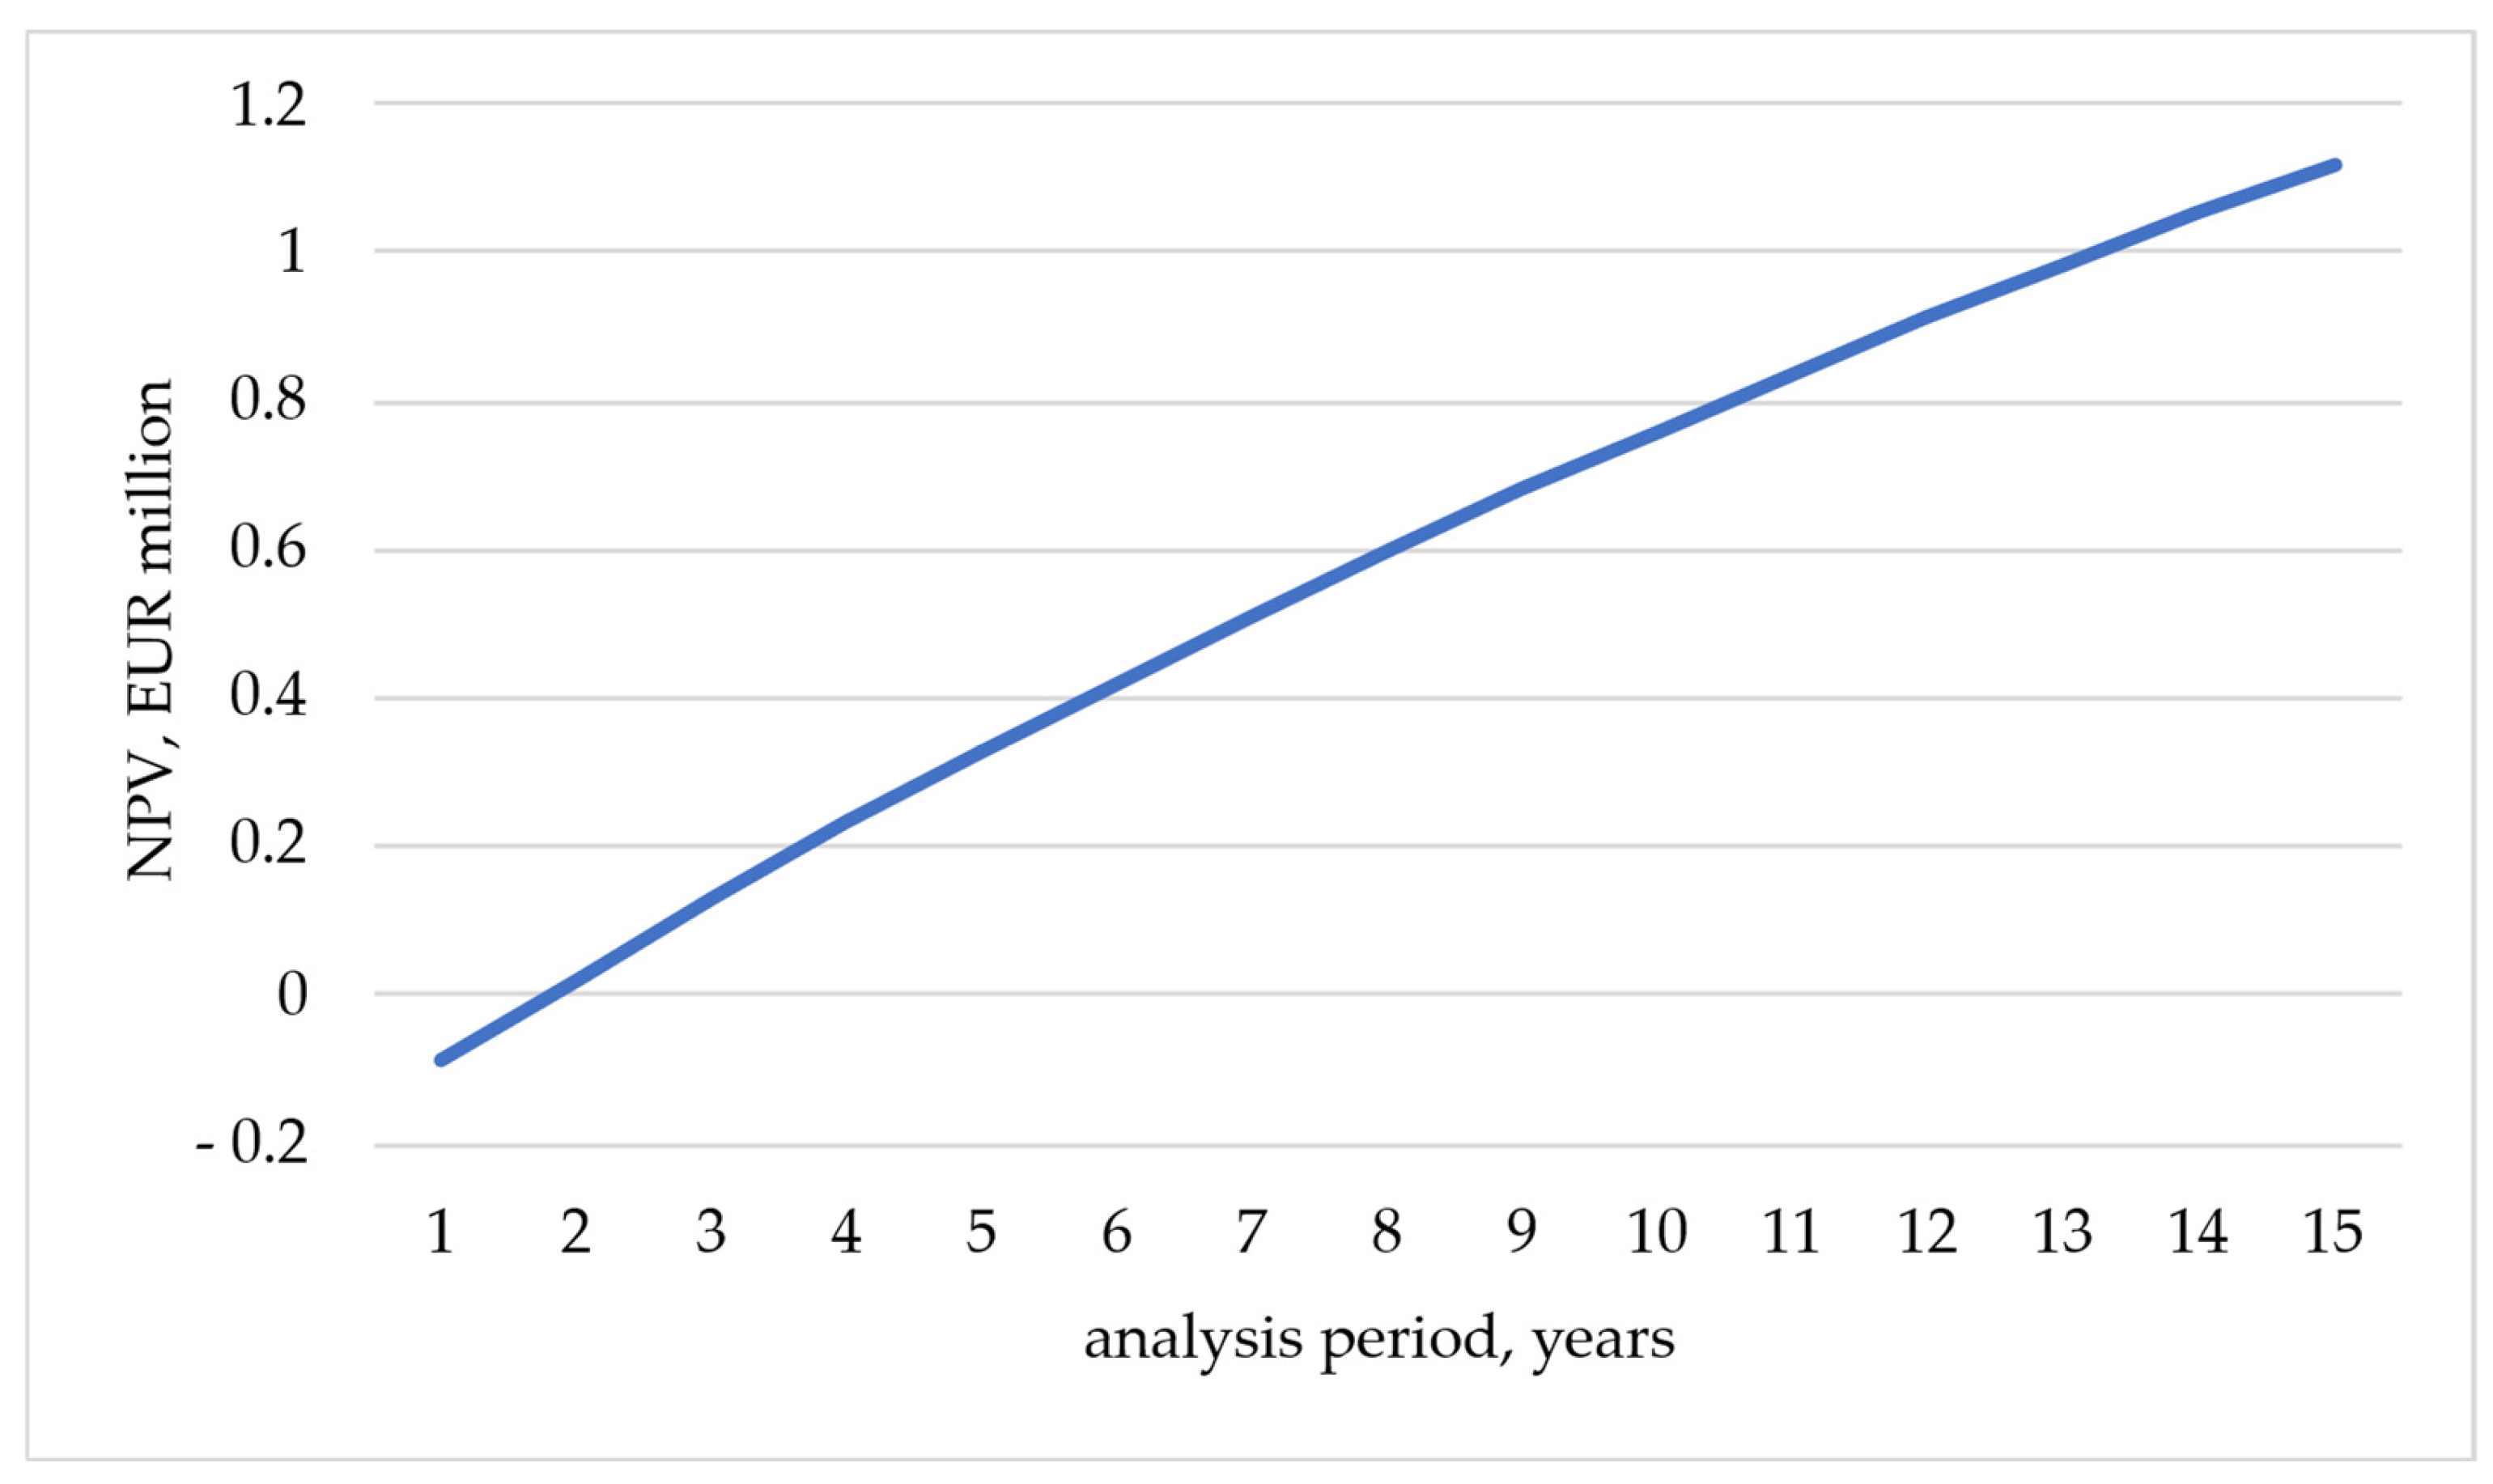
As a result, the scenario characterised by the highest NPV within the analysed set of variants was identified. Its trajectory over the analysis horizon, expressed in terms of NPV and/or annual cash flows, is presented in Figure 2.
Under specifically favourable conditions, the project achieves a positive net present value (NPV) around the end of the second year of the project duration. In subsequent years, the project continues to increase its value, reaching an NPV exceeding EUR 1.1 million in year 15.
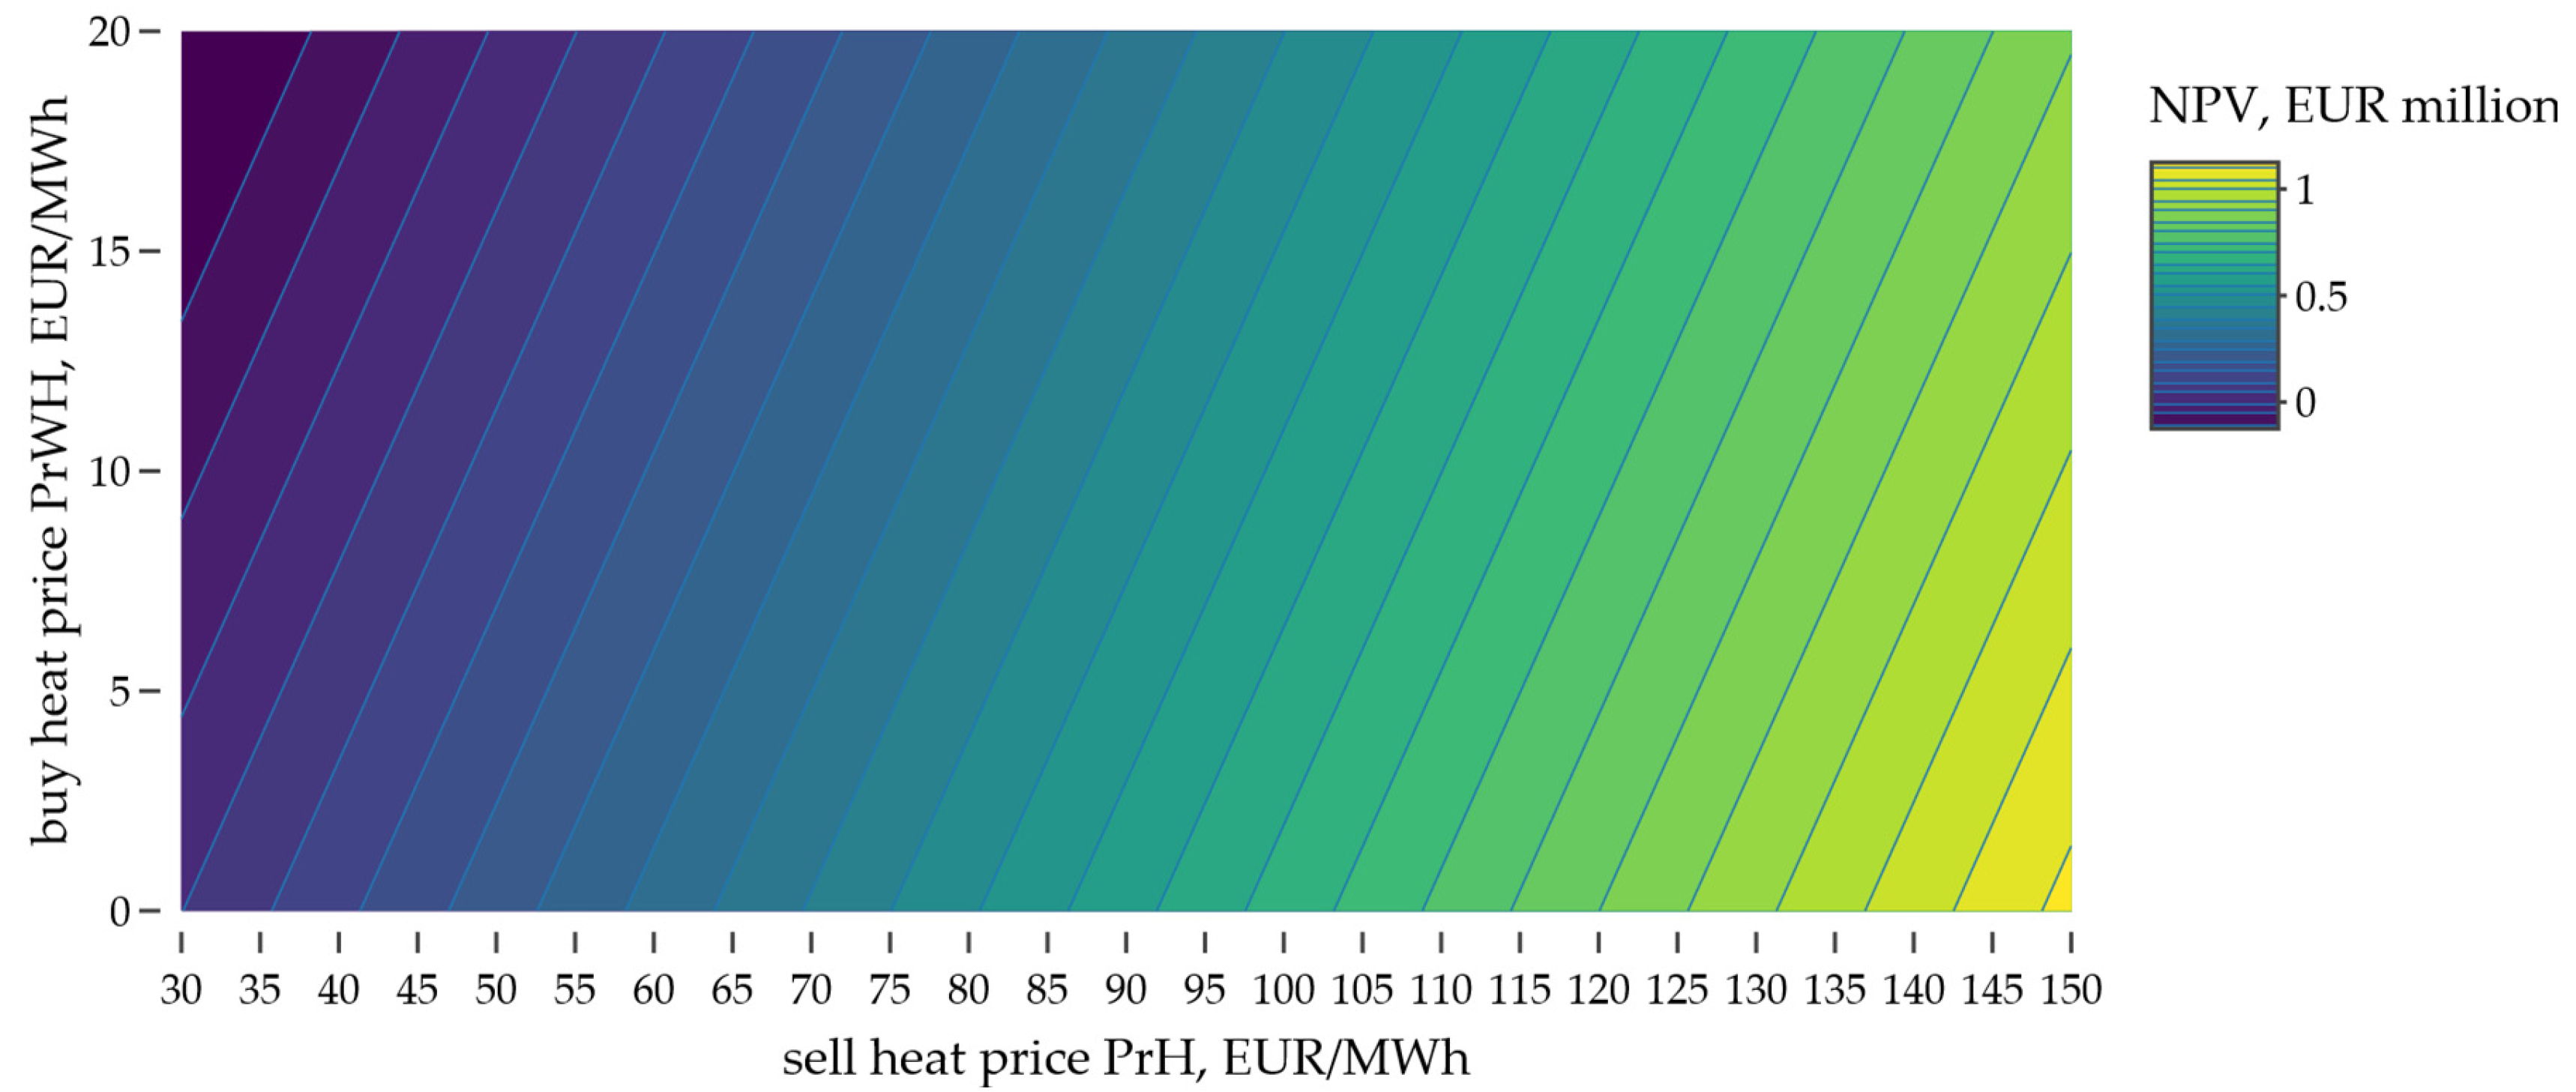
The results were then visualised in the form of map-based charts for combinations of different decision parameters. First, the relationship between the purchase price of heat, i.e., heat acquired for transport, and the price of alternative heat available to the final consumer was analysed. The latter represents the price that the consumer may be willing to pay or consider competitive in relation to the proposed solution based on a mobile thermal energy storage system. The results are presented in Figure 3.
The project NPV is directly and strongly related to the combination of the heat purchase price, representing the cost component, and the heat selling price, representing the revenue component. The highest profitability level, with NPV exceeding EUR 1 million, marked in yellow, is achieved when the final selling price is high, above approximately EUR 135/MWh, and the purchase price of heat is low, close to zero.
The project reaches the break-even point, where NPV equals zero, along the diagonal line. This means that, for the project to be profitable, the spread between the selling price and the purchase price must be sufficiently large to compensate, among other factors, for the costs of transport using the mobile thermal energy storage system.
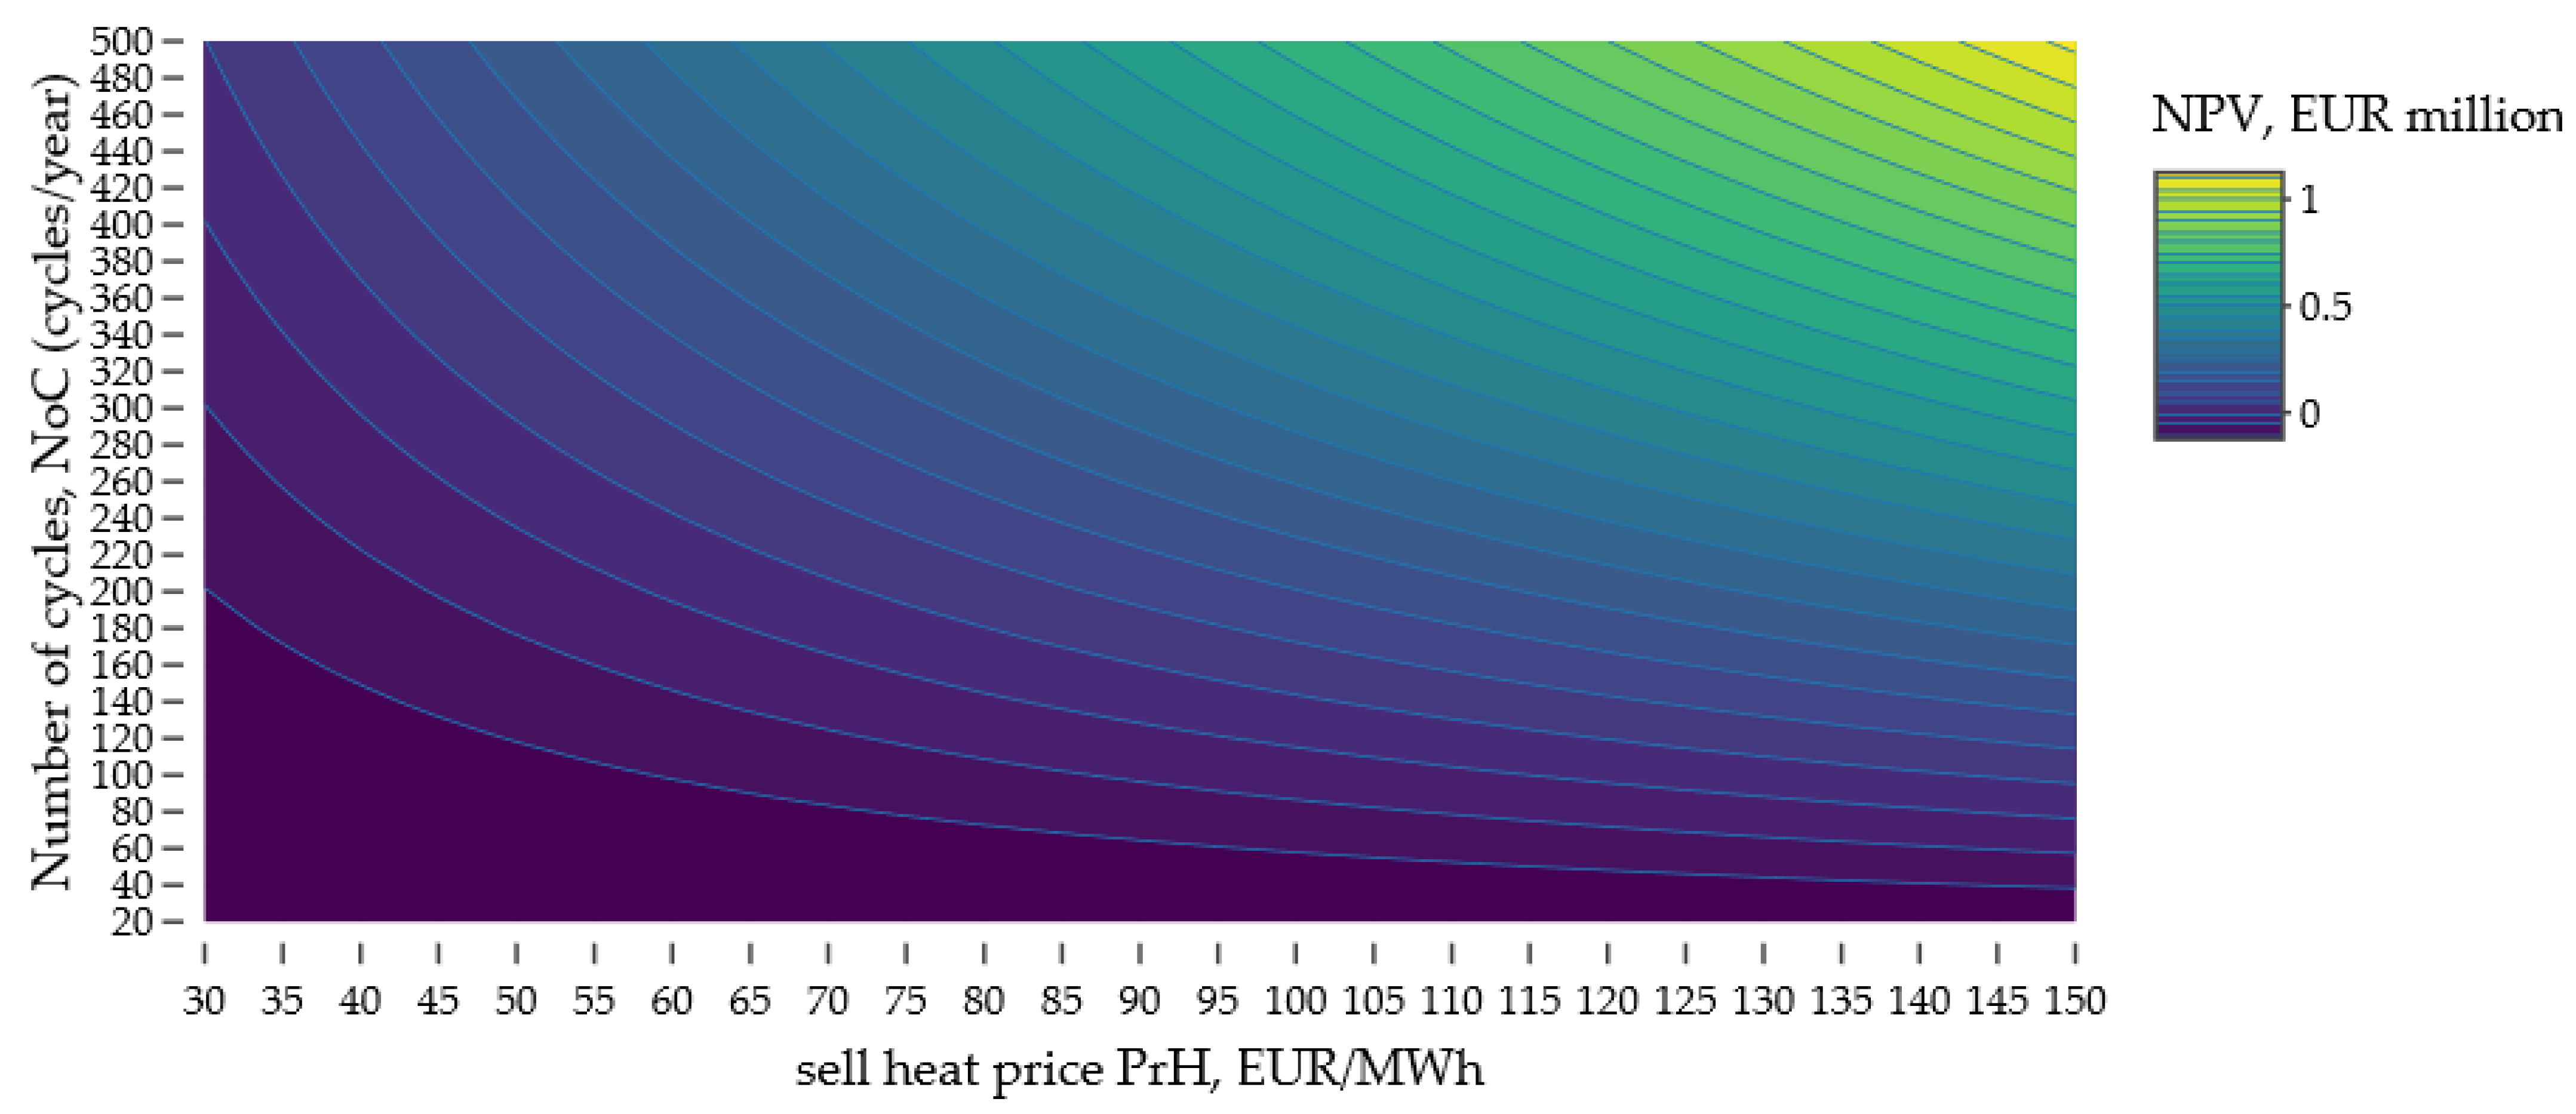
The Figure 4 shows that the project NPV is highly sensitive to the heat selling price and the utilisation intensity of the mobile thermal energy storage unit. The maximum profitability, with NPV exceeding EUR 1 million, is achieved only when two conditions are met simultaneously: a very high heat selling price, above EUR 140/MWh, and the maximum number of annual transport cycles, close to 500.
The break-even point, where NPV equals zero, requires maintaining a substantial margin between the heat selling price and the purchase price, as shown in the previous figure. This margin must be sufficient to compensate for all operating costs, including transport costs. Therefore, for the project to be profitable, it must operate at high utilisation levels and target a market characterised by a high heat price, which may, however, raise concerns regarding the competitiveness of the solution.

Sensitivity Analysis

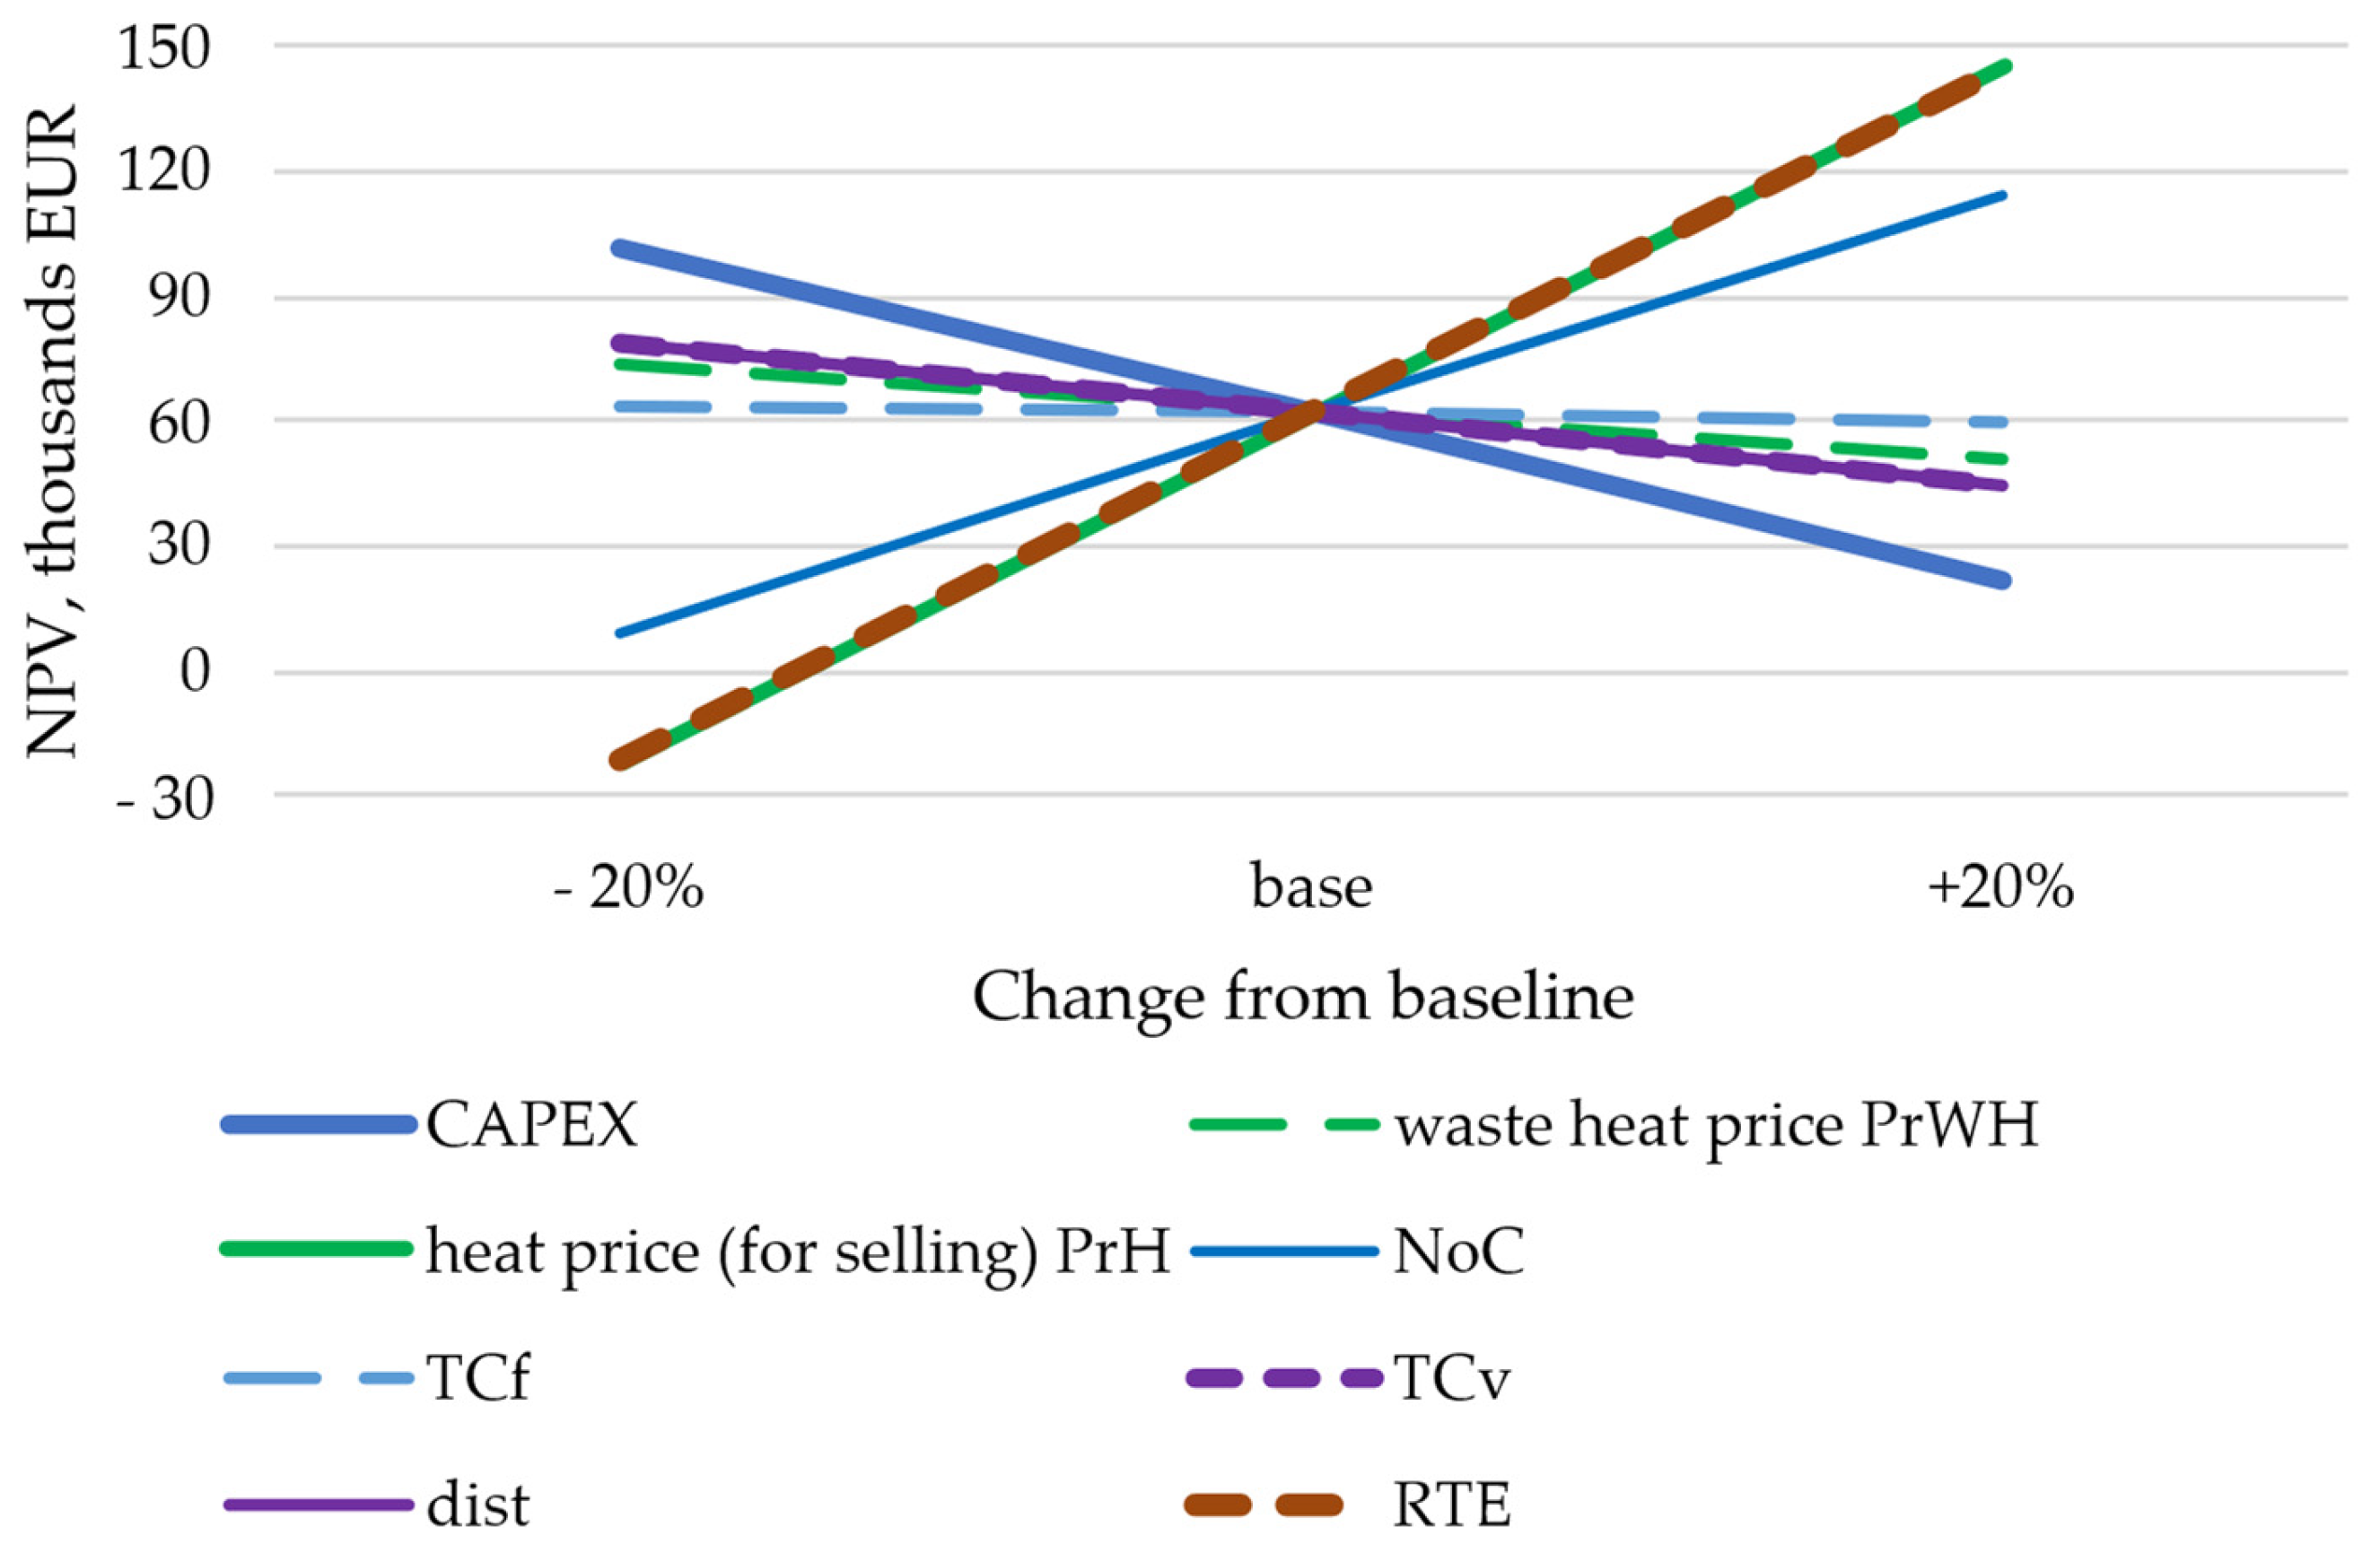
A one-at-a-time sensitivity analysis was performed to assess (Figure 5) the influence of selected techno-economic parameters on the net present value (NPV) of the FlowPCM technology. The baseline scenario assumed a CAPEX of 100,000 EUR/MWh, a heat purchase price of 10 EUR/MWh, a heat selling price of 108 EUR/MWh, an annual operation of 260 cycles per year, a fixed transport cost of 3 EUR per cycle, a variable transport cost of 1.2 EUR/km, and a transport distance of 25 km. Each parameter was varied by ±20% relative to its baseline value, while all other parameters were kept constant.
The results indicate that the economic performance of the FlowPCM system is most strongly affected by parameters directly related to revenue generation and asset utilisation. The heat selling price has the highest impact on NPV. A 20% increase in the selling price leads to a substantial improvement in project profitability, whereas a 20% decrease reduces the NPV below the break-even level. This confirms that the financial feasibility of the technology strongly depends on the possibility of securing an appropriate heat offtake price or a favourable contractual model with the end user.
The second major factor is the number of annual operating cycles. Increasing the number of cycles improves the utilisation of the trailer and increases the total amount of heat delivered to the customer, which directly translates into higher revenues and a higher NPV. Conversely, a reduction in the number of cycles significantly deteriorates the economic result. This shows that the operational organisation of the system is a key determinant of profitability.
The CAPEX also has a significant effect on NPV, although its influence is opposite in direction to revenue-related parameters. A 20% reduction in investment expenditure improves the NPV, whereas a 20% increase substantially decreases it. If interpreted in the context of CAPEX subsidies, the results demonstrate that investment support may considerably improve the economic attractiveness of the technology, especially during early market deployment.
The heat purchase price has a moderate effect on the NPV. An increase in this parameter reduces profitability because it raises the cost of charging the thermal storage unit, while a lower heat purchase price improves the financial performance. In comparison, transport-related parameters have a weaker influence. The fixed transport cost per cycle has only a minor effect on NPV, whereas the variable transport cost and transport distance are more relevant because they directly affect the cost of heat delivery between the source and the recipient. Nevertheless, their impact remains lower than that of the heat selling price, annual number of cycles, and CAPEX.
The analysis also confirms the importance of determining the operational capacity of the trailer, understood as the maximum number of cycles achievable per year. This capacity depends not only on economic assumptions, but also on technical and logistical conditions, including charging time, discharging time, travel distance, transport speed, availability of loading and unloading infrastructure, operational downtime, and the synchronisation between waste heat availability and heat demand. Based on design data from the FlowPCM project, the charging and discharging time was assumed to range from 4 to 6 h, with an average value of 5 h. This represents the maximum assumed duration of one charging or discharging process and corresponds to an average thermal power of approximately 400 kW.
Overall, the sensitivity analysis shows that the profitability of the FlowPCM system may be improved primarily through three measures: securing a sufficiently high heat selling price, maximising the annual number of cycles through efficient logistics and system availability, and reducing investment costs, for example through optimisation, scaling effects, or CAPEX support mechanisms. Transport parameters remain important for practical implementation, but their influence on NPV is secondary compared with revenue-related parameters and the degree of system utilisation.

4. Discussion

The obtained results confirm that the economic viability of mobile heat transport using PCM-based thermal energy storage is conditional and is determined primarily by the simultaneous fulfilment of technical, operational, and market requirements. The developed model was used to perform a total of 1.656 billion computational combinations. Within the analysed parameter space, positive NPV occurs only in a subset of scenarios, while the highest profitability is achieved for short transport distances, a high number of cycles, and a favourable relationship between the purchase and selling prices of heat.
The results obtained are generally consistent with previous techno-economic studies of mobile thermal energy storage. Matuszewska et al. [17], analysing a substantially smaller 55 kWh system for geothermal heat delivery under Polish conditions, found that profitability decreased strongly with transport distance and concluded that distances exceeding approximately 3–4 km were not economically justified under the adopted assumptions. Similarly, Shehadeh et al. [22] demonstrated that the levelised cost of heat delivered by M-TES increases with transport distance and decreases with increasing energy storage density. Fritz et al. [6] and Resch and Dehner [23] also identified short transport distances as a key condition for economic competitiveness, with PCM-based M-TES being particularly favourable at distances below approximately 6–7 km.
The present results confirm these general relationships: positive NPV is achieved only for combinations involving a sufficiently favourable heat price spread, high annual utilisation and relatively short transport distances. However, the numerical profitability thresholds are not directly comparable because the studies differ in storage capacity, heat source, transport assumptions, energy prices and evaluation methods. The present study extends earlier work by considering a 2 MWh PCM-based unit, post-2021 Polish heat-market conditions and 1.656 billion combinations of technical, operational and economic parameters. Consequently, it identifies multidimensional profitability boundaries rather than evaluating only a limited number of predefined or location-specific scenarios.
The NPV maps indicate that the system is highly sensitive to the heat price margin and the intensity of trailer utilisation, expressed as the number of cycles per year. This means that the economics of the solution are driven largely by system throughput and the effective heat price spread, rather than solely by the investment cost of the storage unit itself. At the same time, it should be emphasised that assuming a constant round-trip efficiency (RTE) of 80% simplifies real operating conditions. In practice, cycle efficiency is not constant, but depends on the temperatures of the heat source and heat consumer, cycle duration, standstill time, insulation quality, wind conditions, vehicle body geometry, heat exchanger losses, and transport-related losses. Therefore, the adopted RTE value should be interpreted as a reference value for a well-insulated mobile thermal energy storage unit operating under favourable short-distance transport conditions, rather than as a universal efficiency level applicable to all operating scenarios.
The authors identify this issue as an important direction for further research, since neglecting RTE variability may lead to an overestimation of profitability in scenarios characterised by long cycle durations or less favourable weather conditions. This potential overestimation may be particularly relevant when the storage unit remains idle for extended periods, when transport distances increase, when ambient temperatures are low, or when convective heat losses are intensified by wind and vehicle movement. Under such conditions, a lower effective RTE would reduce the amount of useful heat delivered to the end user per cycle and, consequently, decrease annual revenues and NPV. In practical terms, this means that the assumed RTE has a direct influence on the break-even heat selling price and on the minimum number of annual cycles required to achieve economic viability.
Experimental studies on vehicle-based systems show that the convective heat transfer coefficient may be strongly dependent on vehicle speed and body geometry, which confirms the need to incorporate this effect into the model.
This decomposition should be interpreted as an engineering representation of the baseline RTE assumption rather than as a direct measurement for the analysed prototype. The charging and discharging components are mainly related to heat exchanger design, temperature differences and flow rates, while ηst,tr is the component most sensitive to insulation quality, transport duration, idle time, ambient temperature, wind conditions and vehicle speed. The current model does not explicitly calculate these environmental effects; instead, they are represented in aggregated form through ηst,tr and through the additional RTE sensitivity analysis in the range of 70–90%. Therefore, the authors acknowledge that the constant RTE assumption may overestimate NPV in longer-distance, cold-climate or extended-idle scenarios. Future work should include a dynamic heat-transfer model of the mobile tank.
From the perspective of PCM selection, the current economic results expressed by NPV should, in subsequent stages, be linked to a multi-criteria PCM selection procedure rather than to a generalised CAPEX parameter alone. The literature emphasises that PCM selection should simultaneously consider the phase transition temperature, energy storage density, thermal conductivity, cyclic stability, cost, and operational safety [37,38]. This is particularly important in mobile applications, where mass and volume constraints favour the use of PCM technologies, while at the same time increasing the importance of heat transfer power and reliable operation over multiple cycles.
The results indicate that further research should be conducted on two levels: optimisation from the perspective of the system operator, including how many trailers should be operated, on which routes, and according to what schedule; and optimisation from the perspective of the technology manufacturer, including how many trailers should be produced in order to achieve economies of scale and reduce unit CAPEX. In the first case, the key factor is the threshold annual volume of delivered heat required to achieve a positive NPV. In the second case, product development costs, serial production costs, and the potential learning curve become particularly important.
From the perspective of the operational model, the annual amount of heat delivered may, as a first approximation, be described as a function of the number of trailers, the number of cycles per trailer, the storage capacity, and the effective cycle efficiency. Under the reference parameters of 2 MWh, 500 cycles per year, and RTE = 80%, one trailer would theoretically deliver approximately 800 MWh per year. In practice, however, this value would be lower due to downtime, limitations in the availability of the heat source and/or heat consumer, and losses dependent on operating conditions.
In this context, modelling the maximum number of annual cycles as a function of charging time, discharging time, and travel time becomes particularly important. Increasing the number of trailers without a parallel increase in the capacity and number of loading and unloading stations may not improve NPV proportionally, but may instead lead to a decline in asset utilisation.

5. Conclusions

The study identified the techno-economic and market conditions under which the use of mobile thermal energy storage and heat transport may be economically efficient compared with stationary heat generation, for example from natural gas, electricity, or other fuels. The results indicate that the profitability of this solution is conditional and occurs only under specific configurations of technical, price-related, and operational parameters. At the same time, the key challenges for the further development of this technology were identified, relating both to supply-side conditions, namely the availability of a stable low-cost waste heat stream, and to demand-side conditions, particularly the long-term predictability of heat demand among end-users.
The quantitative analysis covered 1.656 billion combinations of technical, operational and economic parameters. For a 2 MWh storage unit and an RTE of 80%, the useful heat delivered per cycle is 1.6 MWh. Therefore, the analysed range of 20–500 cycles per year corresponds to approximately 32–800 MWh of useful heat annually, while 260 cycles correspond to about 416 MWh/year.
In the best-performing scenario, NPV exceeded EUR 1.1 million after 15 years, and the break-even point was reached around the end of the second year. The highest profitability occurred when the waste heat purchase price was close to 0 EUR/MWh, the selling price exceeded approximately 135–140 EUR/MWh, the transport distance was 5 km, and utilisation approached 500 cycles/year.
For the sensitivity-analysis baseline, the 15-year NPV was approximately 122,000 EUR. A ±20% change in the heat selling price produced an NPV range of approximately 29,000–216,000 EUR, while a ±20% change in the annual number of cycles resulted in approximately 58,000–187,000 EUR. The corresponding range for uCAPEX was approximately 82,000–162,000 EUR. Reducing RTE from 80% to 64% decreased NPV to approximately −21,000 EUR, whereas increasing it to 96% raised NPV to approximately 145,300 EUR. These results confirm that profitability is determined primarily by the heat selling price, annual utilisation, uCAPEX and effective RTE.
The obtained results have important practical and regulatory implications. The existence of a relatively narrow range of economically viable conditions means that the design of financial support mechanisms for mobile heat transport should be precisely targeted and should take into account the local specificity of waste heat sources, heat consumers, and supply chain organisation. Otherwise, there is a risk of supporting solutions that will not achieve sustainable economic efficiency under market conditions.
Compared with local heat generation, it is also necessary to account for benefits that are more difficult to quantify unambiguously within a conventional economic assessment. These include the flexibility to change the heat supplier or heat consumer, as well as the avoidance of investment expenditures on production and transmission infrastructure that is difficult to reverse. These characteristics may increase the attractiveness of mobile thermal energy storage and transport systems in selected niche applications. Therefore, further research should extend the analysis by incorporating a dynamic perspective on operating conditions, supply and demand risks, and the valuation of system flexibility.

Author Contributions

Conceptualisation, P.O., P.M., D.K. (Daniel Kowol) and D.K. (Dominik Kryzia); methodology, P.O. and D.K. (Dominik Kryzia); software, P.O.; validation, P.O. and D.K. (Dominik Kryzia); formal analysis, P.M. and D.K. (Daniel Kowol); investigation, P.O., D.K. (Dominik Kryzia), P.M. and D.K. (Daniel Kowol); resources, R.B., P.F., K.I. and A.C.; data curation, P.O., P.M., D.K. (Daniel Kowol), R.B. and P.F.; writing—original draft preparation, P.O. and D.K. (Dominik Kryzia); writing—review and editing, P.O., D.K. (Dominik Kryzia), P.M., D.K. (Daniel Kowol), R.B., P.F., K.I. and A.C.; visualisation, P.O.; supervision, P.O. and D.K. (Dominik Kryzia); project administration, P.O.; funding acquisition, P.M. and D.K. (Daniel Kowol). All authors have read and agreed to the published version of the manuscript.

Funding

This research and the APC were funded by the National Centre for Research and Development under contract No. NTE2/0021/2022 of 31 March 2023, for the project entitled “Mobile heat storage with the use of PCM stream”, implemented under the NTE II call of the Strategic Programme “New Technologies in Energy”.

Data Availability Statement

The original contributions presented in this study are included in the article. Further inquiries can be directed to the corresponding authors.

Conflicts of Interest

The authors declare no conflicts of interest.

References

  1. Siuta-Olcha, A.; Cholewa, T.; Gomółka, M.; Kołodziej, P.; Skaarup Østergaard, D.; Svendsen, S. On the influence of decommissioning an area thermal substation in a district heating system on heat consumption and costs in buildings—Long term field research. Sustain. Energy Technol. Assess. 2022, 50, 101870. [Google Scholar] [CrossRef] [Scilit]
  2. PTEC. Impact of EU Regulations on the Transformation of the Centralized District Heating Sector in Poland Assessment of the Effects and Recommendations for National Regulations; PTEC: Warszawa, Poland, 2024; Available online: https://ptec.org.pl/raporty/impact-of-eu-regulations-on-the-transformation-of-the-centralized-district-heating-sector-in-poland/ (accessed on 11 May 2026).
  3. Insight. Heat for Change: How to Modernise the District Heating Sector in Poland; Polityka Insight: Warsaw, Poland, 2024; Available online: www.politykainsight.pl/bibliotekaraportow/2102061,cieplo-do-zmiany-jak-zmodernizowac-sektor-cieplownictwa-systemowego-w-polsce.read (accessed on 11 May 2026). (In Polish)
  4. URE. District Heating in Numbers; URE: Warsaw, Poland, 2024. Available online: www.ure.gov.pl/pl/cieplo/energetyka-cieplna-w-l/12424,2023.html (accessed on 11 May 2026). (In Polish)
  5. Rubczyński, A.; Jakob, M.; Bagemihl, J.; Wyrwa, A.; Raczyński, M.; Kasza, J.; Król, M.; Świątecki, M. Low-Temperature District Heating Networks: A Basis for the Modernisation of the Heat Sector. Forum Energii. 2024. Available online: www.forum-energii.eu/sieci-niskotemperaturowe (accessed on 11 May 2026). (In Polish)
  6. Fritz, M.; Plötz, P.; Schebek, L. A technical and economical comparison of excess heat transport technologies. Renew. Sustain. Energy Rev. 2022, 168, 112899. [Google Scholar] [CrossRef] [Scilit]
  7. Asefi, G.; Ma, T.; Wang, R. Techno-economic evaluation of photovoltaic thermal system integrated with porous phase change materials: Case studies in China. Energy Convers. Manag. 2023, 290, 117227. [Google Scholar] [CrossRef] [Scilit]
  8. Li, H.; Wang, W.; Yan, J.; Dahlquist, E. Economic assessment of the mobilized thermal energy storage (M-TES) system for distributed heat supply. Appl. Energy 2013, 104, 178–186. [Google Scholar] [CrossRef] [Scilit]
  9. Giampieri, A. Techno-economic feasibility of pipeline and mobile thermal energy storage for liquid desiccant transport. Appl. Energy 2025, 392, 125975. [Google Scholar] [CrossRef] [Scilit]
  10. Deckert, M.; Scholz, R.; Binder, S.; Hornung, A. Economic efficiency of mobile latent heat storages. Energy Procedia 2014, 46, 171–177. [Google Scholar] [CrossRef] [Scilit]
  11. Liu, G.; Li, Y.; Wei, P.; Xiao, T.; Meng, X.; Yang, X. Thermo-Economic Assessments on a Heat Storage Tank Filled with Graded Metal Foam. Energies 2022, 15, 7213. [Google Scholar] [CrossRef] [Scilit]
  12. Talukdar, S.; Afroz, H.M.M.; Hossain, M.A.; Aziz, M.A.; Hossain, M.M. Heat transfer enhancement of charging and discharging of phase change materials and size optimization of a latent thermal energy storage system for solar cold storage application. J. Energy Storage 2019, 24, 100797. [Google Scholar] [CrossRef] [Scilit]
  13. van der Roest, E.; Bol, R.; Fens, T.; van Wijk, A. Utilisation of waste heat from PEM electrolysers—Unlocking local optimisation. Int. J. Hydrogen Energy 2023, 48, 27872–27891. [Google Scholar] [CrossRef] [Scilit]
  14. Lümmen, N.; Karouach, A.; Tveitan, S. Thermo-economic study of waste heat recovery from condensing steam for hydrogen production by PEM electrolysis. Energy Convers. Manag. 2019, 185, 21–34. [Google Scholar] [CrossRef] [Scilit]
  15. Ceran, B.; Mielcarek, A.; Hassan, Q.; Teneta, J.; Jaszczur, M. Aging effects on modelling and operation of a photovoltaic system with hydrogen storage. Appl. Energy 2021, 297, 117161. [Google Scholar] [CrossRef] [Scilit]
  16. Kuta, M. Mobilized thermal energy storage (M-TES) system design for cooperation with geothermal energy sources. Appl. Energy 2023, 332, 120567. [Google Scholar] [CrossRef] [Scilit]
  17. Matuszewska, D.; Kuta, M.; Olczak, P. Techno-Economic Assessment of Mobilized Thermal Energy Storage System Using Geothermal Source in Polish Conditions. Energies 2020, 13, 3404. [Google Scholar] [CrossRef] [Scilit]
  18. Kaczmarzewski, S.; Kulpa, J.; Olczak, P. Analysis of variability of payback time of investments in various types of res micro-installations for enterprises purchasing electricity and gas at the tge on micro-installation scale. Rynek Energii 2023, 169, 81. [Google Scholar]
  19. Cieślik, T.; Narloch, P.; Szurlej, A.; Kogut, K. Indirect Impact of the COVID-19 Pandemic on Natural Gas Consumption by Commercial Consumers in a Selected City in Poland. Energies 2022, 15, 1393. [Google Scholar] [CrossRef] [Scilit]
  20. Kuta, M.; Matuszewska, D.; Wójcik, T.M. The role of phase change materials for the sustainable energy. E3S Web Conf. 2016, 10, 00068. [Google Scholar] [CrossRef] [Scilit]
  21. Radomska, E.; Mika, Ł. Long-term modeling of the performance of a solar still with phase-change material. Appl. Therm. Eng. 2023, 235, 121339. [Google Scholar] [CrossRef] [Scilit]
  22. Shehadeh, M.; Kwok, E.; Owen, J.; Bahrami, M. Integrating Mobile Thermal Energy Storage (M-TES) in the City of Surrey’s District Energy Network: A Techno-Economic Analysis. Appl. Sci. 2021, 11, 1279. [Google Scholar] [CrossRef] [Scilit]
  23. Resch, A.; Dehner, H. Economic Analysis of Mobile Thermal Energy Storages as Complement to District Heating. Environ. Clim. Technol. 2023, 27, 516–531. [Google Scholar] [CrossRef] [Scilit]
  24. Yang, S.; Bai, M.; Grégoire, B.; Ma, H.; Zhang, T.; Ding, Y. Design and Modelling of Mobile Thermal Energy Storage (M-TES) Using Structured Composite Phase Change Material Modules. Appl. Therm. Eng. 2024, 254, 123896. [Google Scholar] [CrossRef] [Scilit]
  25. Kuta, M. Mobilized Thermal Energy Storage for Waste Heat Recovery and Utilization—Discussion on Crucial Technology Aspects. Energies 2022, 15, 8713. [Google Scholar] [CrossRef] [Scilit]
  26. Kuta, M.; Mlonka-Mędrala, A.; Radomska, E.; Gołdasz, A. Mobile Thermal Energy Storage—A Review and Analysis in the Context of Waste Heat Recovery. Energies 2025, 18, 4136. [Google Scholar] [CrossRef] [Scilit]
  27. Sharma, A.; Shukla, A. Thermal cycle test of binary mixtures of some fatty acids as phase change materials for building applications. Energy Build. 2015, 99, 196–203. [Google Scholar] [CrossRef] [Scilit]
  28. Surma, T.; Komorowska, A.; Kaszyński, P. District heating tariff systems in selected countries—Recommendations for Poland. Rynek Energii 2024, 5, 11–16. [Google Scholar]
  29. Komorowska, A.; Surma, T. Comparative analysis of district heating markets: Examining recent prices, regulatory frameworks, and pricing control mechanisms in Poland and selected neighbouring countries. Polityka Energ. Energy Policy J. 2024, 27, 95–118. [Google Scholar] [CrossRef] [Scilit]
  30. Kryzia, D.; Kopacz, M.; Kryzia, K. The Valuation of the Operational Flexibility of the Energy Investment Project Based on a Gas-Fired Power Plant. Energies 2020, 13, 1567. [Google Scholar] [CrossRef] [Scilit]
  31. Karki, S.; Haapala, K.R.; Fronk, B.M. Technical and economic feasibility of solar flat-plate collector thermal energy systems for small and medium manufacturers. Appl. Energy 2019, 254, 113649. [Google Scholar] [CrossRef] [Scilit]
  32. EASE. Storage Efficiency Calculation Methods; European Association for Storage of Energy: Brussels, Belgium, 2016; Available online: https://ease-storage.eu/wp-content/uploads/2016/03/Storage_efficiencies_EASE_Final.pdf (accessed on 11 May 2026).
  33. Fadl, M.; Eames, P.C. Thermal performance analysis of the charging/discharging process of a shell and horizontally oriented multi-tube latent heat storage system. Energies 2020, 13, 6193. [Google Scholar] [CrossRef] [Scilit]
  34. IRENA; IEA-ETSAP. Thermal Energy Storage: Technology Brief; International Renewable Energy Agency and International Energy Agency—Energy Technology Systems Analysis Programme; IRENA: Abu Dhabi, United Arab Emirates, 2013; Available online: www.irena.org/-/media/Files/IRENA/Agency/Publication/2013/IRENA-ETSAP-Tech-Brief-E17-Thermal-Energy-Storage.pdf (accessed on 11 May 2026).
  35. Comité National Routier (CNR). The Polish Road Freight Transport Sector—2022; Comité National Routier: Paris, France, 2024; Available online: www.cnr.fr/en/publications (accessed on 11 May 2026).
  36. Transport Intelligence (Ti); Upply; International Road Transport Union (IRU). The European Road Freight Rate Benchmark—Q4 2024; Ti, IRU: Paris, France, 2025; Available online: www.upply.com/en/ti-upply-iru-benchmarks-reports (accessed on 11 May 2026).
  37. Szewerda, K.; Michalak, D.; Matusiak, P.; Kowol, D. Concept of Adapting the Liquidated Underground Mine Workings into High-Temperature Sand Thermal Energy Storage. Appl. Sci. 2025, 15, 3868. [Google Scholar] [CrossRef] [Scilit]
  38. Kurpiel, W.; Kaczmarczyk, K. Electrode Boiler Integrated with an Energy Management and Storage System. Min. Mach. 2025, 43, 105–120. [Google Scholar] [CrossRef]
Figure 1. Workflow of the multi-variant techno-economic analysis of the FlowPCM mobile thermal energy storage system. Source: own elaboration.
Energies 19 03559 g001
Figure 2. NPV trajectory over the 15-year analysis period for the best-performing scenario. Assumptions: uCAPEX = 40,000 EUR/MWh, PrWH = 0 EUR/MWh, PrH = 150 EUR/MWh, NoC = 500 cycles/year, TCf = 1 EUR/cycle, TCv = 0.4 EUR/km, dist = 5 km, OPEXf = 100 EUR/year, and RTE = 80%. The NPV = 0 level represents the economic break-even point. Source: own elaboration.
Energies 19 03559 g002
Figure 3. NPV after the 15-year analysis period as a function of the waste heat purchase price (PrWH) and heat selling price (PrH). Assumptions: NoC = 500 cycles/year, uCAPEX = 50,000 EUR/MWh, OPEXf = 100 EUR/year, TCf = 1 EUR/cycle, TCv = 0.4 EUR/km, dist = 5 km, and RTE = 80%. The NPV = 0 contour represents the economic break-even boundary. Source: own elaboration.
Energies 19 03559 g003
Figure 4. NPV after the 15-year analysis period as a function of the heat selling price (PrH) and the annual number of cycles (NoC). Assumptions: PrWH = 0 EUR/MWh, uCAPEX = 50,000 EUR/MWh, OPEXf = 100 EUR/year, TCf = 1 EUR/cycle, TCv = 0.4 EUR/km, dist = 5 km, and RTE = 80%. The NPV = 0 contour represents the economic break-even boundary. Source: own elaboration.
Energies 19 03559 g004
Figure 5. One-at-a-time sensitivity analysis of the 15-year NPV for changes of −20%, 0%, and +20% relative to the baseline values. The baseline scenario assumes uCAPEX = 100,000 EUR/MWh, PrWH = 10 EUR/MWh, PrH = 108 EUR/MWh, NoC = 260 cycles/year, TCf = 3 EUR/cycle, TCv = 1.2 EUR/km, dist = 25 km, OPEXf = 100 EUR/year, and RTE = 80%. Source: own elaboration.
Energies 19 03559 g005
Table 1. Model parameters, baseline values, scenario ranges, calculation increments, units, and sources used in the economic analysis.
NameSymbolValue or RangeStepUnitSource
Unit capital expenditures for thermal storageuCAPEX40–20020thous. EUR/MWhProject calculation
Fixed costs per year (maintenance, insurance, cleaning, etc.)OPEXf100 EUR/MWhcalculated eq.
Waste heat purchase pricePrWH0–205EUR/MWhsimulation
Selling price of heatPrH30–1505EUR/MWhassumption
Number of cycles per yearNoC20–50020cycles/yearassumption
Transport cost fixed per cycleTCf1–51EUR/cyclecalculation
Transport cost variable per distanceTCv0.4–20.2EUR/kmassumption
Total distance of transport (return)dist5–505km/cyclecalculation
Note: The detailed engineering estimate for the complete 2 MWh mobile storage module corresponds to approximately EUR 46,000–106,000/MWh. The broader range of EUR 40,000–200,000/MWh is used as a scenario range to account for standardised low-cost configurations as well as prototype, customised and infrastructure-intensive project variants.
Disclaimer/Publisher’s Note: The statements, opinions and data contained in all publications are solely those of the individual author(s) and contributor(s) and not of MDPI and/or the editor(s). MDPI and/or the editor(s) disclaim responsibility for any injury to people or property resulting from any ideas, methods, instructions or products referred to in the content.