Article

Analysis of Pollutant Emissions and Fuel Consumption in Chassis Dynamometer Testing of a Passenger Car Under United Nations Climate and Sustainability Frameworks


by
Monika Andrych-Zalewska
1,
Katarzyna Bebkiewicz
2,
Zdzisław Chłopek
2,
Jerzy Merkisz
3 and
Jacek Pielecha
3,*
1
Faculty of Mechanical Engineering, Wroclaw University of Science and Technology, 50-370 Wroclaw, Poland
2
The National Center for Emissions Management, The Institute of Environmental Protection, Słowicza 32, 02-170 Warszawa, Poland
3
Faculty of Civil and Transport Engineering, Poznan University of Technology, 1 Jacka Rychlewskiego Street, 61-131 Poznan, Poland
*
Author to whom correspondence should be addressed.
Energies 2026, 19(15), 3533; https://doi.org/10.3390/en19153533
Submission received: 21 June 2026 / Revised: 15 July 2026 / Accepted: 24 July 2026 / Published: 27 July 2026

Abstract

This publication presents the results of studies on exhaust emissions and fuel consumption from spark-ignition engines in the NEDC test, which applies to the vast majority of passenger cars in use in the European Union. This emissions testing procedure was selected based on an analysis of the number of existing engines meeting specific emission standards. A statistical analysis of the studied processes was conducted. Additionally, the product of speed and acceleration modulus was examined as quantities characterizing the dynamic characteristics of the vehicle speed process during testing. Correlation studies of vehicle speed and exhaust emission rates, particle number rates, and mass fuel consumption rates were presented. Average distance-specific emissions, average distance-specific particulate number, and average distance-specific fuel consumption were determined in the NEDC test. The probability density distributions of the investigated processes in the NEDC test were analyzed. Based on an assessment of the conformity of the studied sets with the normal distribution using the Kolmogorov–Smirnov, Lilliefors, and Shapiro–Wilk hypotheses, it was concluded that there was no basis for accepting the hypotheses that the sets conform to the normal distribution. Moreover, the power spectral density of the investigated processes was evaluated. Significant variation in spectral characteristics, especially at high frequencies, was identified, revealing substantial dynamic differences between the processes. The average road emission values in the NEDC test were significantly lower than even the limits for Euro 7.

1. Introduction and Literature Review

Transport remains a significant source of greenhouse gas emissions and atmospheric pollutants, generating significant challenges for environmental protection efforts and human health [1,2]. In response to these challenges, the United Nations 2030 Agenda and its Sustainable Development Goals (SDGs) provide a comprehensive framework for mitigating the environmental impact of transport activities [3]. Specifically, DSG 13 (Climate Action) and DSG 7 (Affordable and Clean Energy) highlight the importance of emission reductions, improving energy efficiency, and the adoption of cleaner and more sustainable transportation technologies.
Passenger cars equipped with internal combustion engines, including spark-ignition engines, still constitute a significant portion of the vehicle fleet in Europe, despite the increasing electrification of transport. Therefore, detailed studies of exhaust emissions and fuel consumption under controlled and repeatable conditions are essential to assess their environmental impact and compliance with current and future emission regulations [4]. Chassis dynamometer tests, conducted in accordance with standardized driving tests such as the NEDC, enable precise analysis of emission intensity and fuel consumption patterns as a function of time and engine operating states.
From the perspective of achieving the SDGs, it is particularly important to reduce emissions of carbon dioxide, carbon monoxide, nitrogen oxides and hydrocarbons, which affect both climate change and air quality [5]. At the same time, reducing fuel consumption leads to improved energy efficiency, which is consistent with global efforts for rational energy management [6].
Building on previous research into exhaust emissions and fuel consumption in standardized driving tests, this study broadens the analysis to encompass issues related to global sustainability challenges. The findings can provide a basis for developing more effective emission reduction strategies and support the achievement of sustainable transport goals aligned with the United Nations.
Vehicle performance tests, particularly with respect to exhaust emissions, were conducted through research tests that characterize engine operating conditions and determine engine operating states, which are determined by the following parameters [7]:
  • Engine rotational speed;
  • Engine thermal state, determined by the temperature distribution within engine components and its operating conditions, and typically described by a representative thermal parameter, primarily the coolant or engine oil temperature;
  • Engine load, typically expressed in terms of engine torque; it can also be measured by net power, fuel delivery and, in spark-ignition engines, intake system pressure.
It is also essential to evaluate the time-dependent nature of engine operating states, distinguishing between predominantly stable (static) conditions and those characterized by significant temporal fluctuation (dynamic states) [8,9]. Static engine operating states are typical for heavy-duty vehicle engines, such as buses and trucks. Therefore, such engines can be tested on an engine dynamometer in tangential states described by the speed-torque coordinates with appropriate weighting factors [10]. Such testing is considerably more practical, given the limited availability and high operational complexity of chassis dynamometers for heavy vehicles. This allows for the determination of specific exhaust emissions, which are quantities characterizing the emissions for all pollutants. There are also procedures for testing exhaust emissions on an engine dynamometer in dynamic tests defined by the speed and torque functions over time, e.g., FTP—Federal Test Procedure, as well as on a chassis dynamometer, e.g., HD-UDDS (EPA Urban Dynamometer Driving Schedule) [11]. Specific exhaust emission values are derived from the measured exhaust emissions, specifically by adjusting for the power output relative to the effective work performed by the engine. These values are traditionally expressed in units of grams per kilowatt-hour [g/(kW·h)]. There are also methods for testing heavy-duty vehicles in driving tests conducted on roads, primarily to measure fuel consumption. Examples of such tests include the UITP (Union Internationale des Transports Publics) tests: SORT 1, SORT 2, and SORT 3 (SORT—Standardized On-Road Test Cycles) [12] and the MZA (Warsaw City Bus Company) [13].
In light vehicles (passenger cars, light trucks, and L-category vehicles—motorcycles, mopeds, quad bikes, and microcars), exhaust emissions are measured in driving tests, where specific road emissions along with particulate matter numbers are determined. Light vehicle tests are performed in most cases, particularly in type-approval procedures, due to the accuracy and repeatability of conditions on a chassis dynamometer. An extension of these procedures is the RDE (Real Driving Emissions) procedure [14] using PEMS (Portable Emissions Measurement Systems) and Semtech equipment to confirm the consistency of test results in driving conditions and in the WLTC (Worldwide Harmonized Light Vehicle Test Cycle) test, performed on a chassis dynamometer in the WLTP (Worldwide Harmonized Light Vehicle Test Procedure) [15].
Apart from the procedures required for vehicle type approval, numerous other test methods are used, including those developed under the ARTEMIS (Assessment and Reliability of Transport Emission Models and Inventory Systems) program [16]: AMDC 130 (Artemis Motorway Driving Cycle 130), AMDC 150 (Artemis Motorway Driving Cycle 150), ARDC (Artemis Rural Driving Cycle), and AUDC (Artemis Urban Driving Cycle). Special tests have also been developed: Autobahn—a test for testing light vehicles on highways and expressways and Stop&Go—a test for testing light vehicles in congestion [17].
Tests based on empirical research—driving speed measurements in typical traffic conditions—have also been developed, e.g., the Malta test [18]. Paper [8] presents the results of empirical studies enabling the development of stochastic driving tests in the form of sets of representations of vehicle speed processes [19]. The traffic models for which the stochastic driving tests were developed are consistent with the standards used in road transport emission inventories [20]:
  • Driving in cities with significant traffic disruptions: in traffic jams or during hours of significant traffic disruptions;
  • Driving in cities with minor traffic disruptions: without traffic jams or during hours of minor traffic disruptions;
  • Outside urban areas;
  • On expressways: on motorways and highways.
The quantities characterizing exhaust emissions in driving tests are the specific distance emissions and the particulate matter number. Specific distance emissions are defined as the amount of pollutants emitted per unit distance traveled by the vehicle and may be interpreted as the derivative of cumulative emissions with respect to the distance. Similarly, distance-specific particle number emissions are defined as the particle number emitted per distance traveled. Traditionally, road emissions are expressed in grams per kilometer (g/km), or the particle number per kilometer—1/km.
There are two basic methods for creating driving tests:
  • Synthesis of tests with assumed characteristics of the speed process and identification of parameters of this process, such as the average value, extreme values, extreme accelerations, etc., based on experience from empirical research results (e.g., NEDC test, Japanese 10–15 Mode);
  • Faithful simulation in the time domain (Malta test); sometimes, recorded fragments are used, and then, by using the Monte Carlo method, for example [21], tests are created, e.g., FTP-75.
In September 2017, the WLTP (Worldwide Harmonized Light Vehicle Test Procedure) procedure was introduced in the European Union for the approval of light vehicles, with the new WLTC (Worldwide Harmonized Light Vehicle Test Cycle) test specified in Commission Regulation (EU) 2017/1151 [4]. Between September 2017 and September 2018, the provisions of either the NEDC or WLTC tests could be applied to the approval tests of light vehicles. From September 2018 onwards, all new light vehicles placed on the market in the European Union must be tested and approved in accordance with the WLTP procedure. An exception is end-of-series vehicles (sale of a limited number of unsold vehicles that were approved under the old NEDC test for one more year). However, despite the new WLTC test being in force since September 2017, a significant proportion of vehicles meeting Euro 6 requirements have already been introduced since September 2014, when the NEDC test was mandatory in the type approval procedure. Therefore, testing vehicles for exhaust emissions in the NEDC test is justified.

2. Methodology

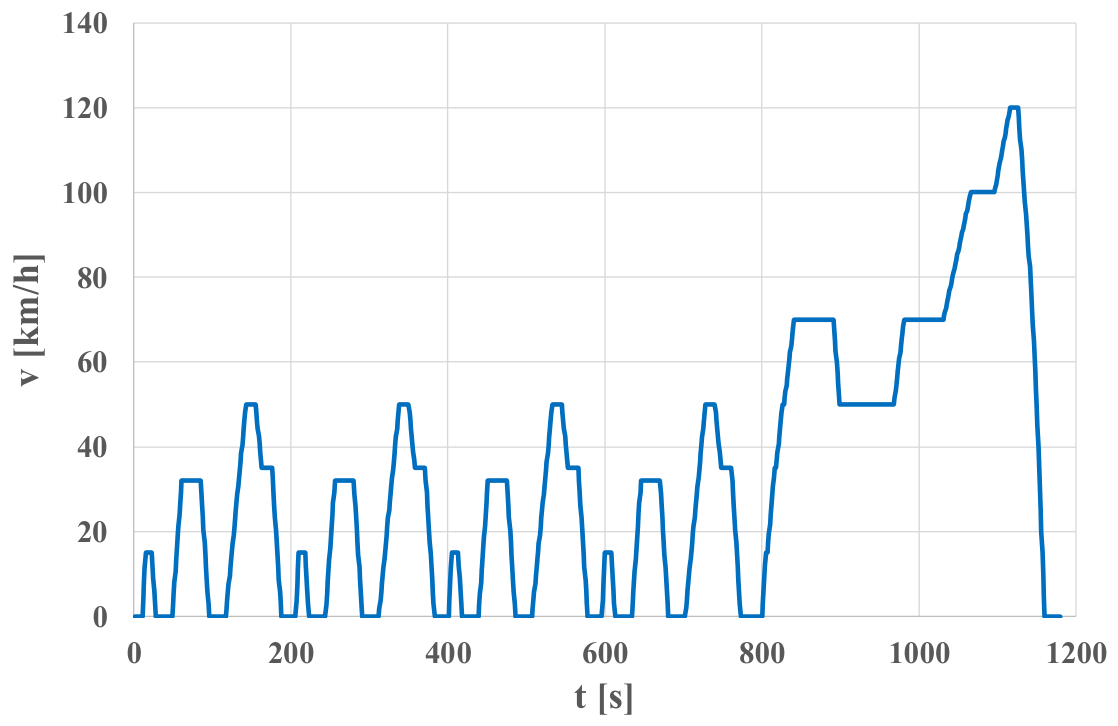
The research method used in this paper involved empirical testing of a passenger car on a chassis dynamometer using the NEDC test, consisting of a quadruple repetition of the ECE 15—Economic Commission for Europe (or UDC—Urban Driving Cycle) test and the EUDC—Extra-Urban Driving Cycle test [4] (Figure 1). The NEDC test characteristics were presented in Table 1 [10,11].
In the type approval procedure, the criteria for the NEDC test results are the average specific distance emissions of carbon monoxide (bCO [mg/km]), hydrocarbons (bHC [mg/km]), nitrogen oxides (bNOx [mg/km]), particulate matter (bPM [mg/km]) and the particulate number (bPN [1/km]). The empirical test results performed in the NEDC test on a chassis dynamometer yielded the following values:
  • Vehicle speed—v;
  • Exhaust emission intensity of: carbon monoxide—ECO, hydrocarbons—EHC, nitrogen oxides—ENOx and carbon dioxide—ECO2;
  • Particulate matter number intensity—EPN;
  • Fuel mass consumption intensity—qf.
Exhaust emission intensity is the derivative of exhaust emission with respect to time, and particulate matter emission intensity is the derivative of particulate matter intensity with respect to time. The product of velocity and acceleration modulus—v·|a| was determined. This quantity characterizes the dynamic properties of the vehicle speed process.
The studies included:
  • Statistical characteristics of the processes [22,23];
  • Pearson’s linear correlation coefficients between the processes tested in the NEDC test; determining the average specific distance emissions, average specific distance particulate matter numbers, and average specific distance fuel consumption in the NEDC test;
  • Determining the product of speed and acceleration modulus and the average value of the test;
  • Standardization of the recorded drive tests [24], which is necessary when comparing the results of analyses of various physical quantities;
  • Probability density of the processes in the NEDC test: vehicle speed, exhaust emission intensity, particulate matter number intensity, and fuel mass consumption intensity;
  • Zero-padding of the analyzed test drives to the number of points 2N, where N is a natural number, which enables the use of the Fast Fourier Transform (FFT) algorithm [25] to determine the power spectral density of the tested processes;
  • Power spectral density of processes in the NEDC test: vehicle speed, exhaust emission intensity, particulate matter number intensity, and fuel mass consumption intensity;
  • Formulation of research conclusions.
Pollutant-specific distance—b—is defined as the ratio of the pollution emission rate—E—and the vehicle speed—v (for a vehicle speed different from 0 km/h), taking into account the appropriate units of measurement:
b = E v
Particulate number-specific distance—bPN—is defined as the ratio of pollutant emissions intensity—PN—to vehicle speed—v (for vehicle speeds other than 0 km/h), taking into account the appropriate units of measurement:
b P N = E P N v
Statistical characteristics of the studied velocity processes are determined [8,23]:
  • Average value—AV,
  • Minimum value—Min,
  • Maximum value—Max,
  • Range—R,
  • Standard deviation—D,
  • First quartile—Q1,
  • Median (second quartile)—M,
  • Third quartile—Q3,
  • Interquartile range—RQ,
  • Interquartile deviation—DQ,
  • Coefficient of variation—W,
  • Interquartile coefficient of variation—WQ,
  • Kurtosis—K,
  • Skewness—S.
The publication defines the values:
  • Coefficient of variation—W
    W = D/|AV|
  • Quartile coefficient of variation
    WQ = DQ/|M|
The probability density of the processes was determined for standardized set values using the determined process histograms [8,24]. The power spectral density of the processes was determined using the fast Fourier transform [25]. Therefore, the set cardinality was padded with zeros up to a set cardinality of 2N, where N is a natural number. The fast Fourier transform was performed for the standardized set values. The maximum frequency of the integral transform of the studied waveform is consistent with the Kotelnikov–Nyquist–Shannon theorem and results from the sampling interval of the time-domain waveform—in the case under consideration, this interval is 1 s. Estimates of the power spectral density were averaged using the simple moving average (SMA). Tests of the consistency of the distributions of the considered quantities with the normal distribution were performed for standardized quantities [8].

3. Research Results

An SUV test car with approximately 19,000 km mileage, serviced according to the manufacturer’s instructions, was used for the tests. The technical specifications of the tested passenger car are presented in Table 2.
The research was carried out at BOSMAL Automotive Research and Development Institute Ltd. The research laboratory meets the requirements of the PN-EN ISO/IEC 17025:2018-02 standard [26] and has an accreditation certificate issued by the Polish Centre for Accreditation (PCA) and foreign recommendations:
  • Customers’ recommendations and accreditations,
  • Fiat Chrysler Automobiles, conducting tests as part of qualifying the quality of parts and assemblies intended for assembly at FCA Poland SA,
  • ITDC—Central Laboratories, Opel Rüsselsheim, testing parts and assemblies as part of the evaluation of OPEL suppliers,
  • Laboratory approval from VW Group (VW 52000 [27] and VW 50180 Standard [28]),
  • Laboratory approval from BMW,
  • Laboratory approval from VOLVO (interior emission tests),
  • FOEN Accreditation and List of Accredited Laboratories.
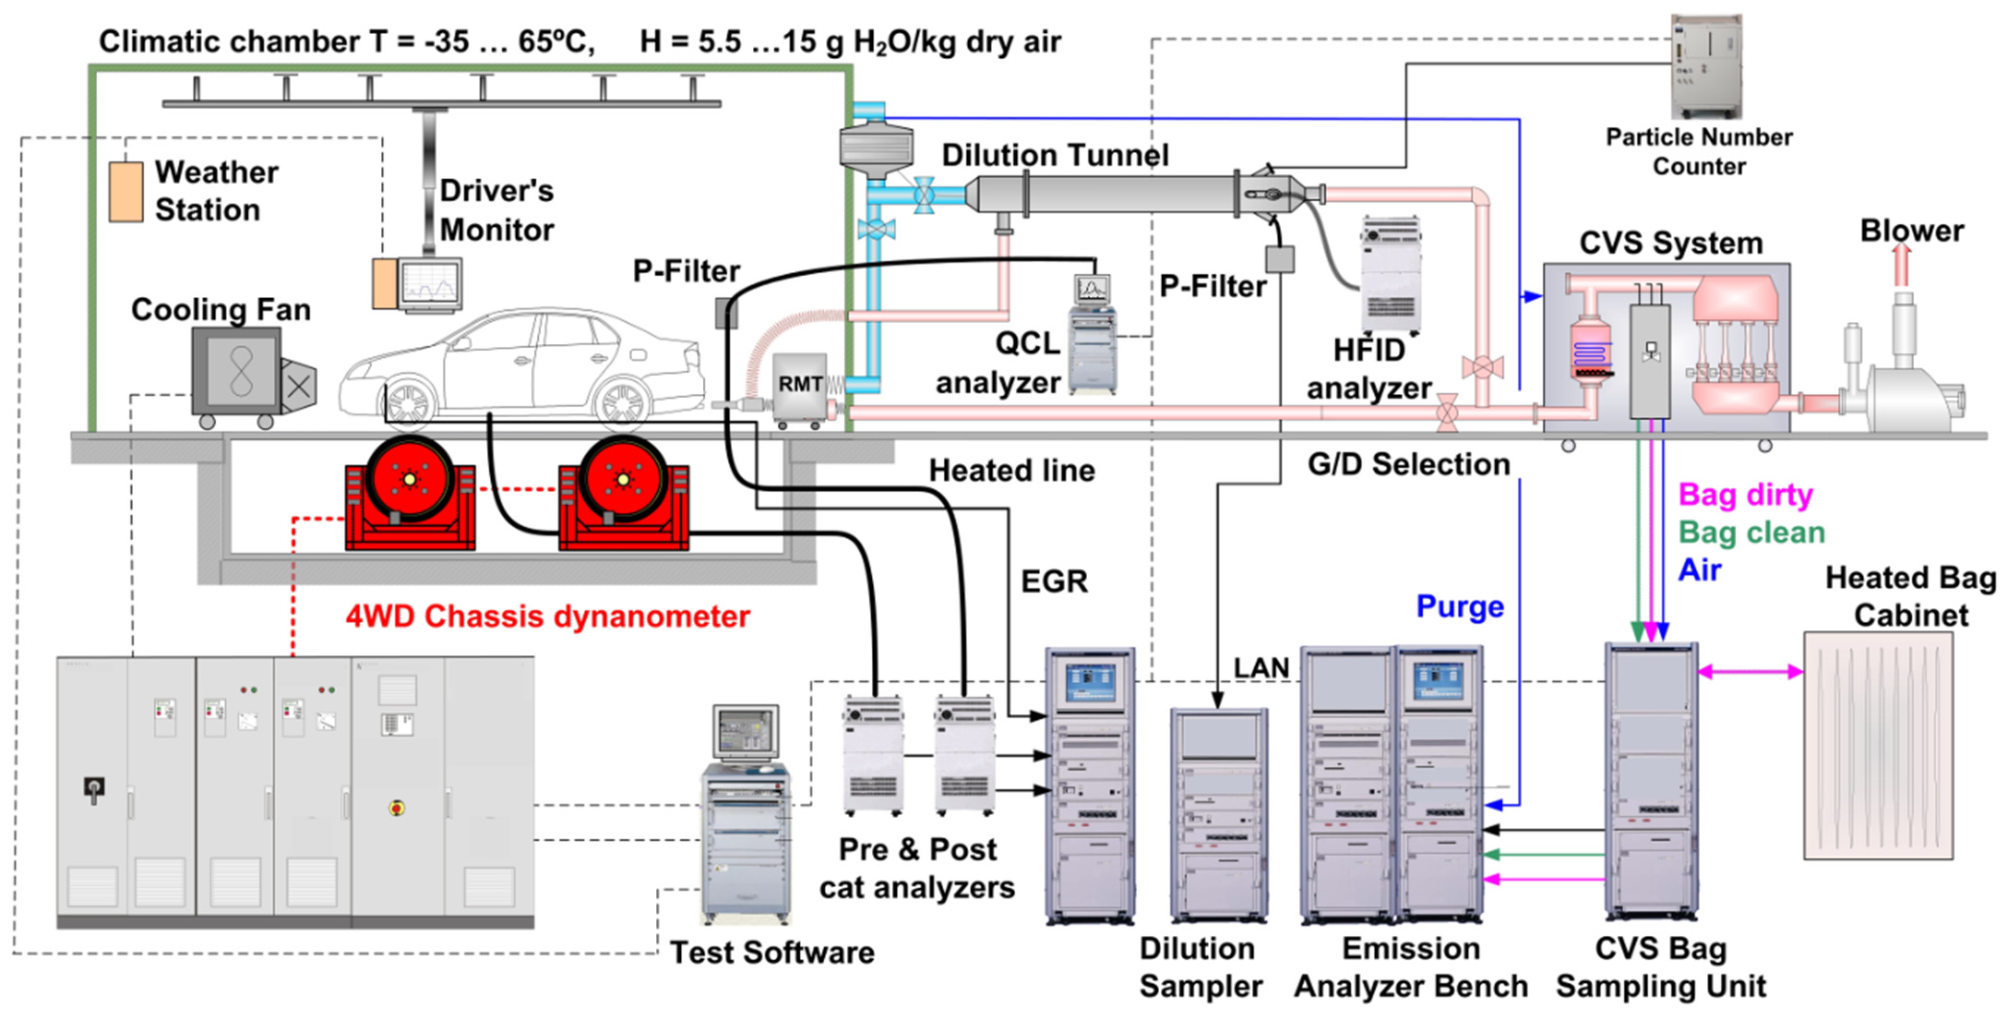
The empirical study was performed using a chassis dynamometer that complied with the requirements of the type approval procedures. The laboratory was air-conditioned to maintain a target temperature of ±2.0 °C and a target relative humidity of ±5% during testing. The tests were performed at 23 °C. Figure 2 presents the functional diagram and equipment of the BOSMAL laboratory.
The measuring equipment includes all necessary exhaust gas analyzers used during legislative emissions testing, as well as analyzers for continuous measurement of diluted exhaust gas component concentrations and for continuous measurement of raw exhaust gas component concentrations (Table 3). The measuring equipment is also equipped with a particulate matter counter.
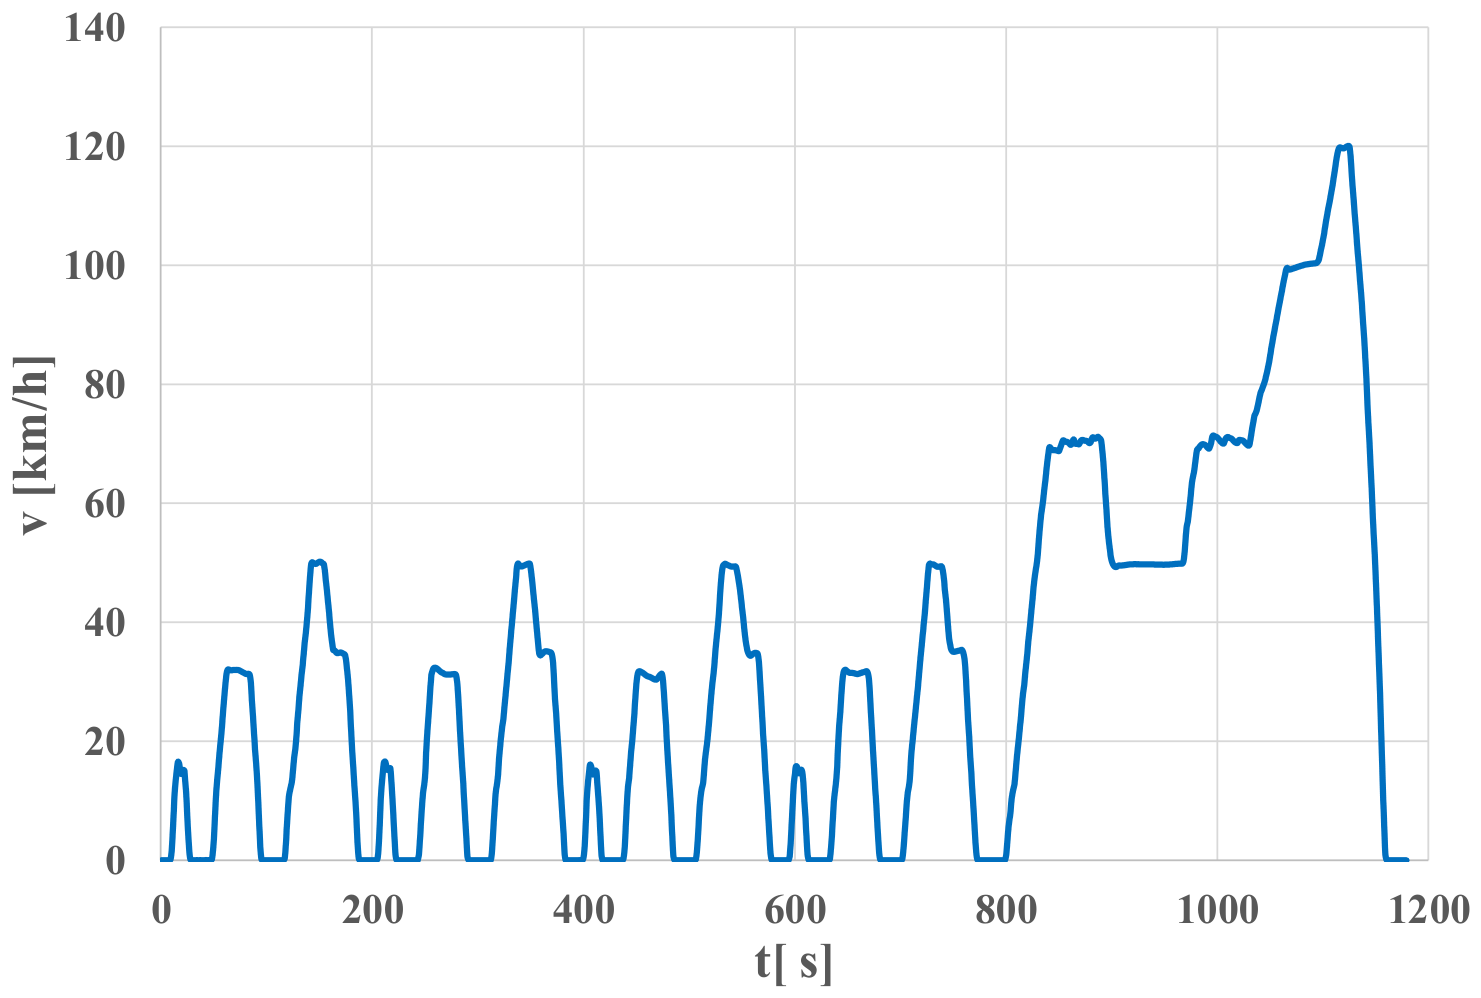
The measured values were recorded every 1 s. The recorded test results were filtered with a low-pass filter to reduce the contribution of high-frequency noise to the signal. A Savitzky–Golay filter with a 5-point averaging and second-order polynomial approximation parameters was used for filtering [29].
Figure 3 shows the vehicle speed during the NEDC test, recorded on the chassis dynamometer.
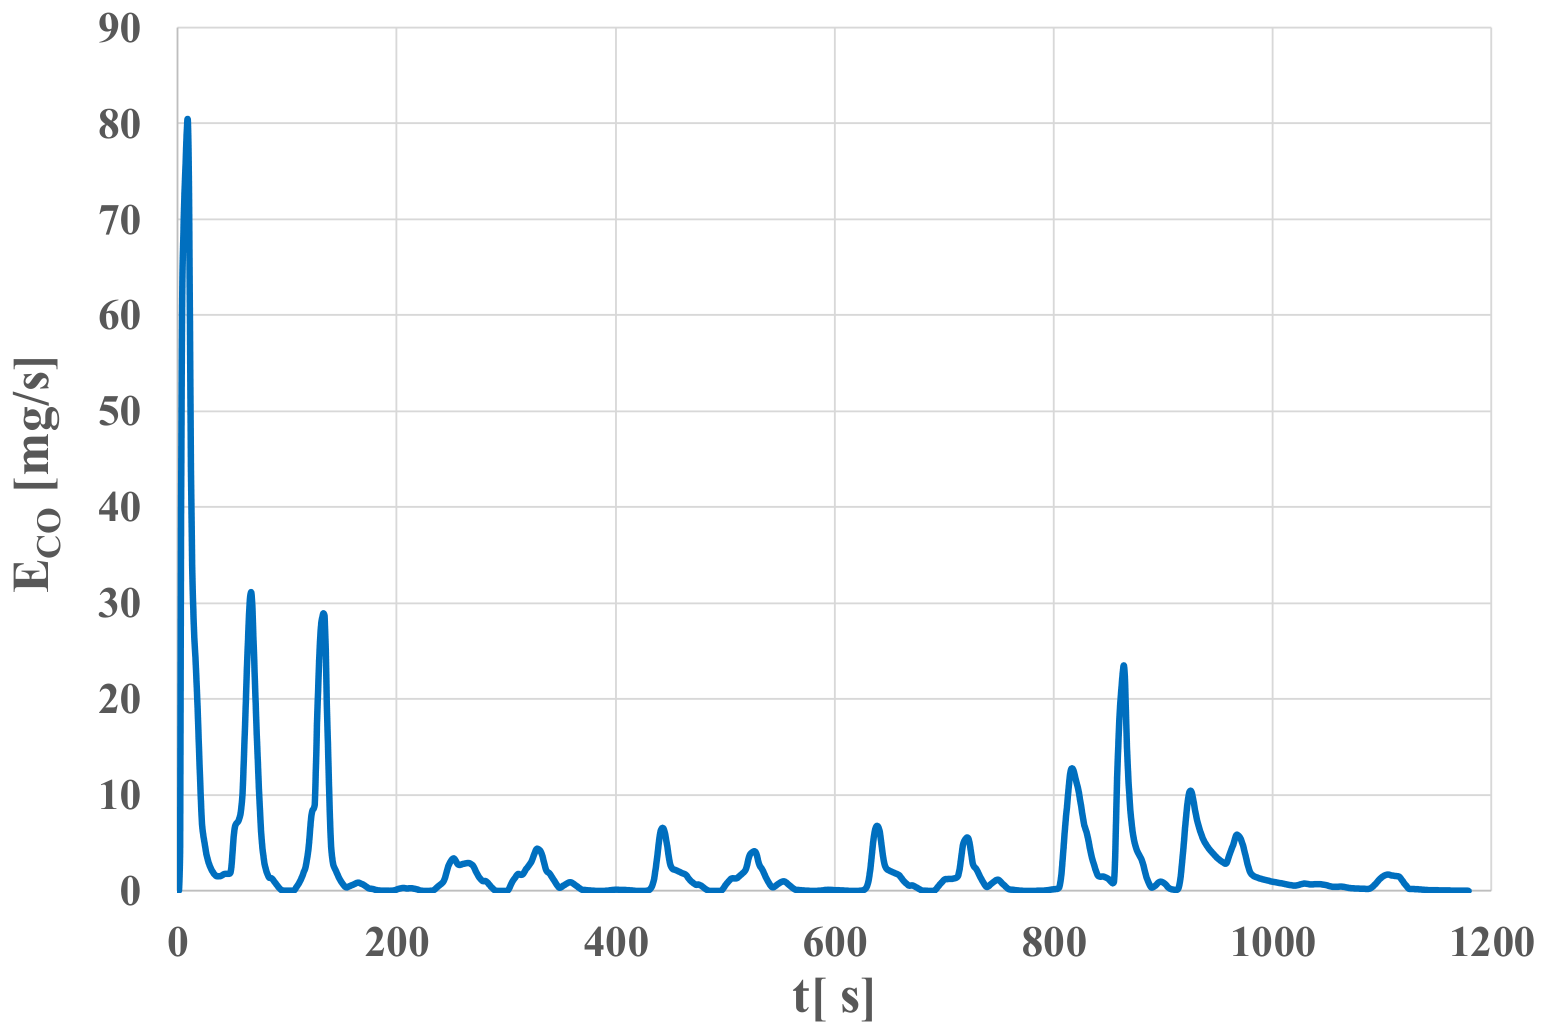
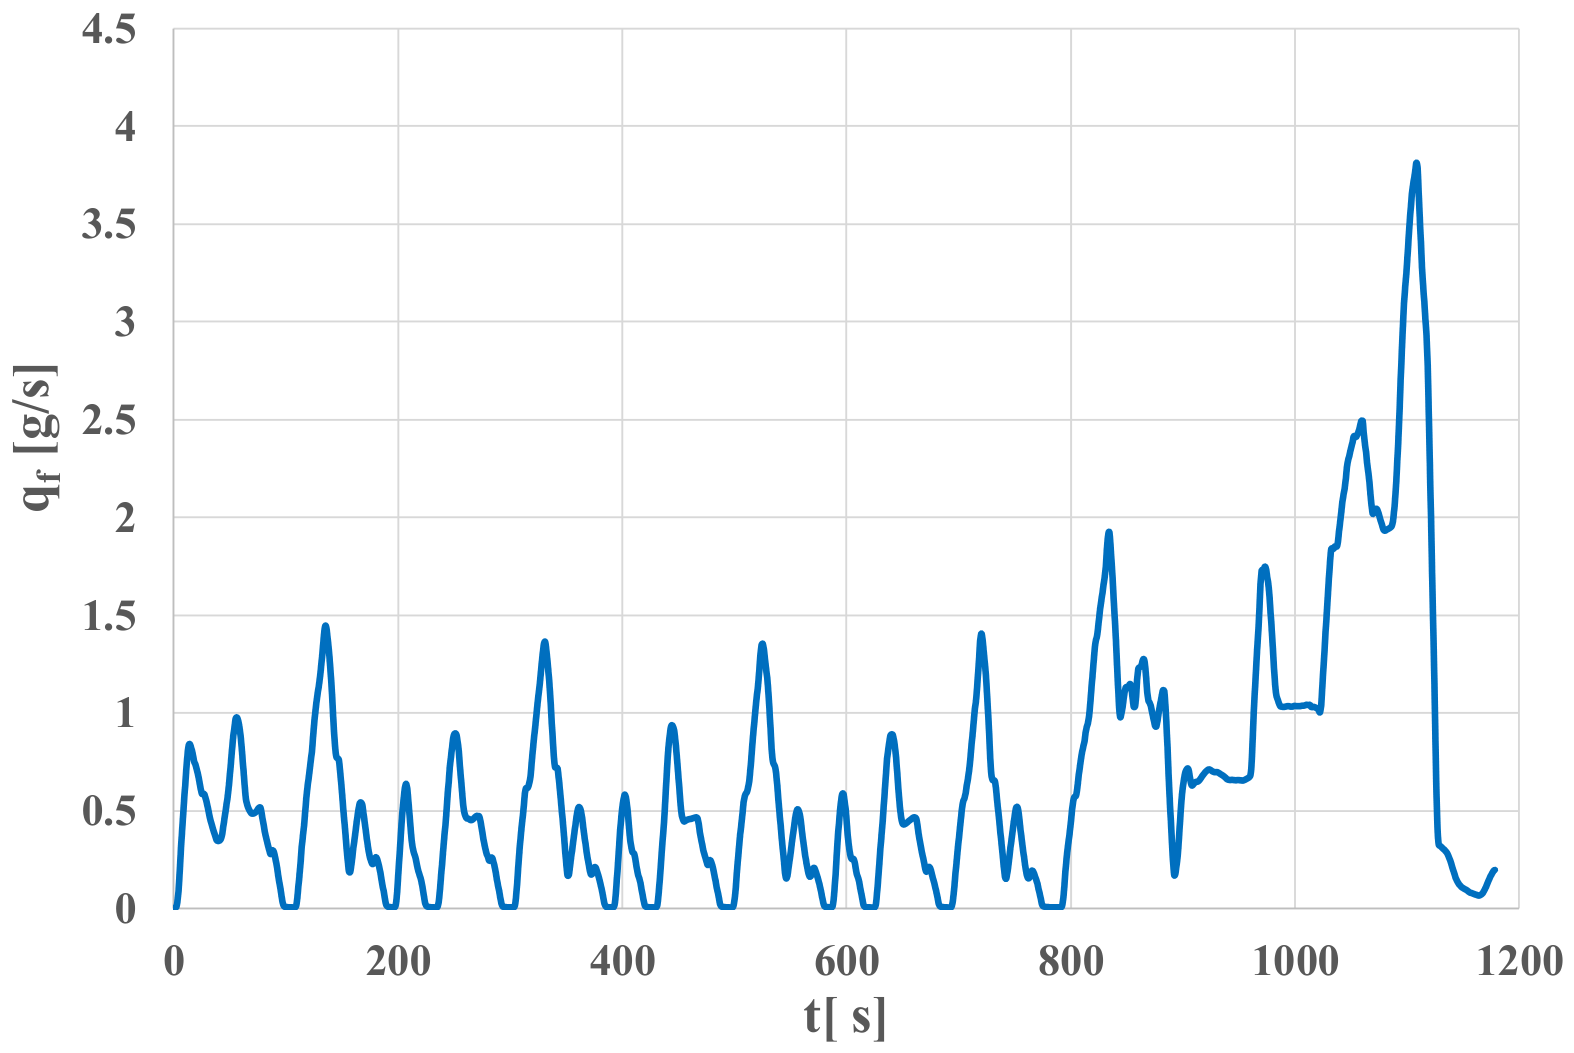
It is clearly visible that the recorded vehicle speed closely matches the reference (Figure 1). Figure 4, Figure 5, Figure 6, Figure 7, Figure 8 and Figure 9 present the exhaust emission intensity of: carbon monoxide—ECO, hydrocarbons—EHC, nitrogen oxides—ENOx, carbon dioxide—ECO2, particulate number intensity—EPN and fuel mass consumption intensity—qf.
Carbon monoxide emission intensity is characterized by significant variability and the occurrence of emission peaks, particularly during dynamic engine operation (Figure 4). In spark-ignition engines, carbon monoxide emissions result primarily from incomplete combustion of the mixture during momentary disruptions in the value of the air–fuel ratio. In compression-ignition engines, carbon monoxide emissions are typically lower because such engines operate with excess air. However, similarly, increased emissions of this compound are observed during transient states associated with delays in mixture formation and local oxygen deficiencies. Substantial differences in carbon monoxide emission intensity were observed depending on engine operating conditions, particularly rotational engine speed and load, and above all the occurrence of dynamic states.
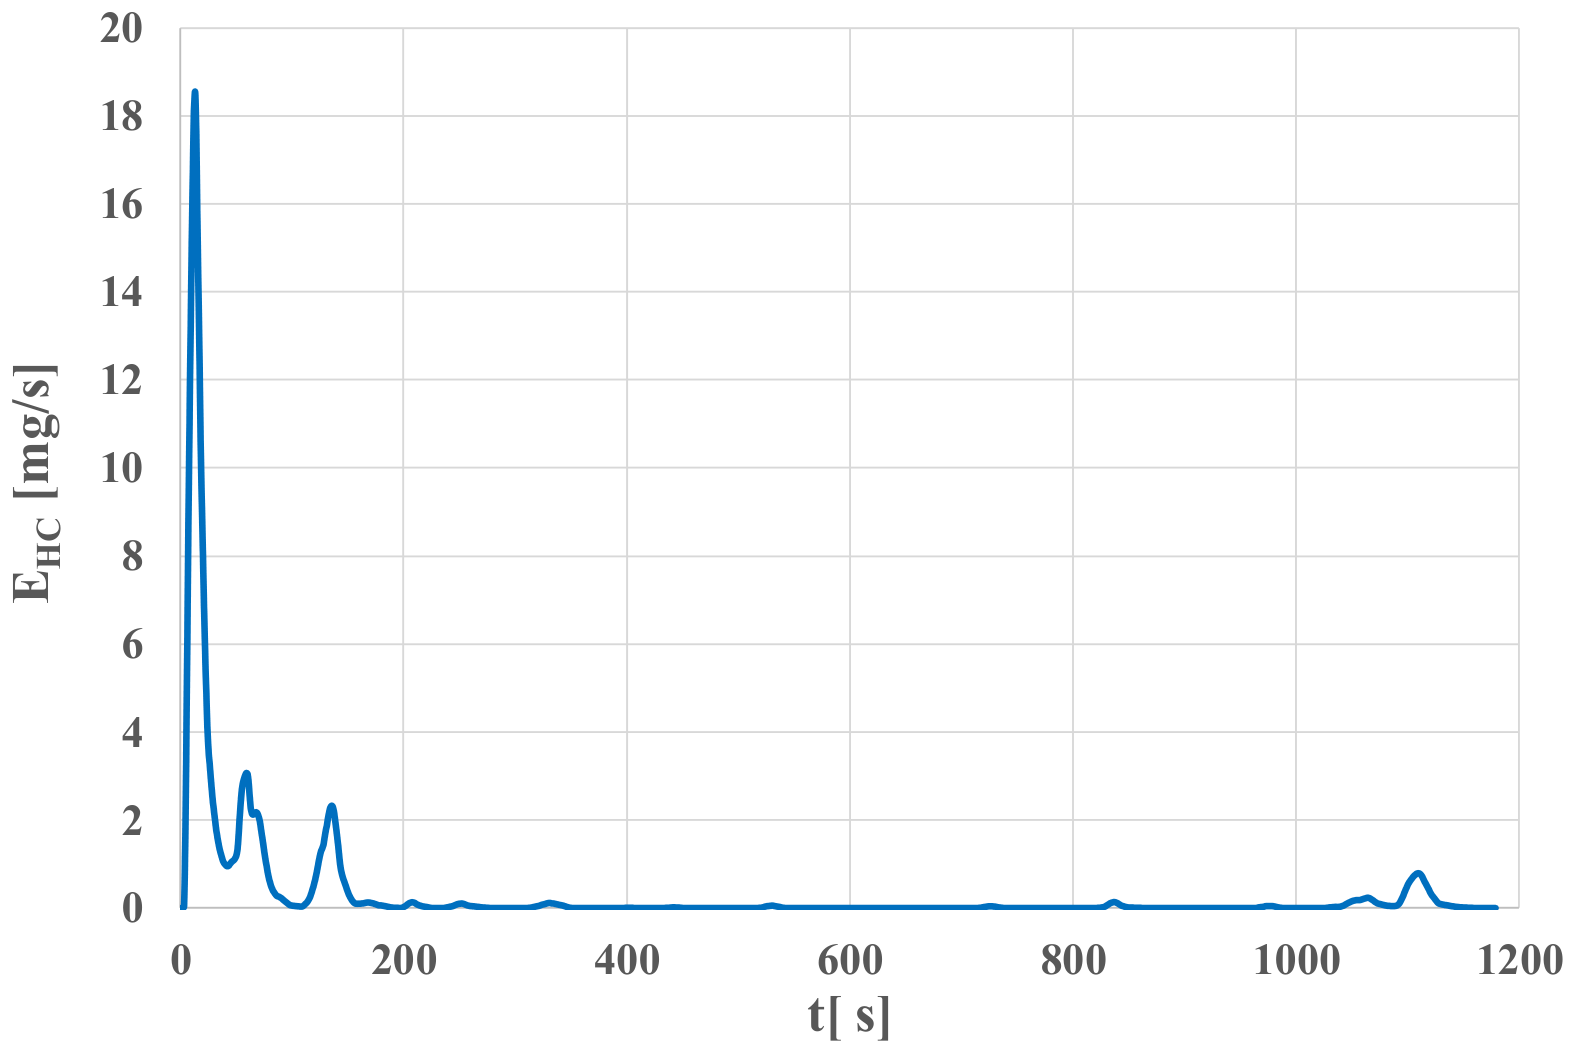
Hydrocarbon emission intensity follows a similar pattern to carbon monoxide emissions, with significant increases during transition phases (Figure 5). In diesel engines, hydrocarbon emissions are typically lower than in SI engines, but they are caused by local areas of incomplete combustion, particularly in low-temperature zones and during engine start-up and load changes. Under dynamic conditions, increased hydrocarbon emissions are observed, resulting from insufficient mixture homogenization and delays in the injection and combustion processes. The dependence of hydrocarbon emission intensity on the engine operating states is similar to that observed for carbon monoxide emission intensity.
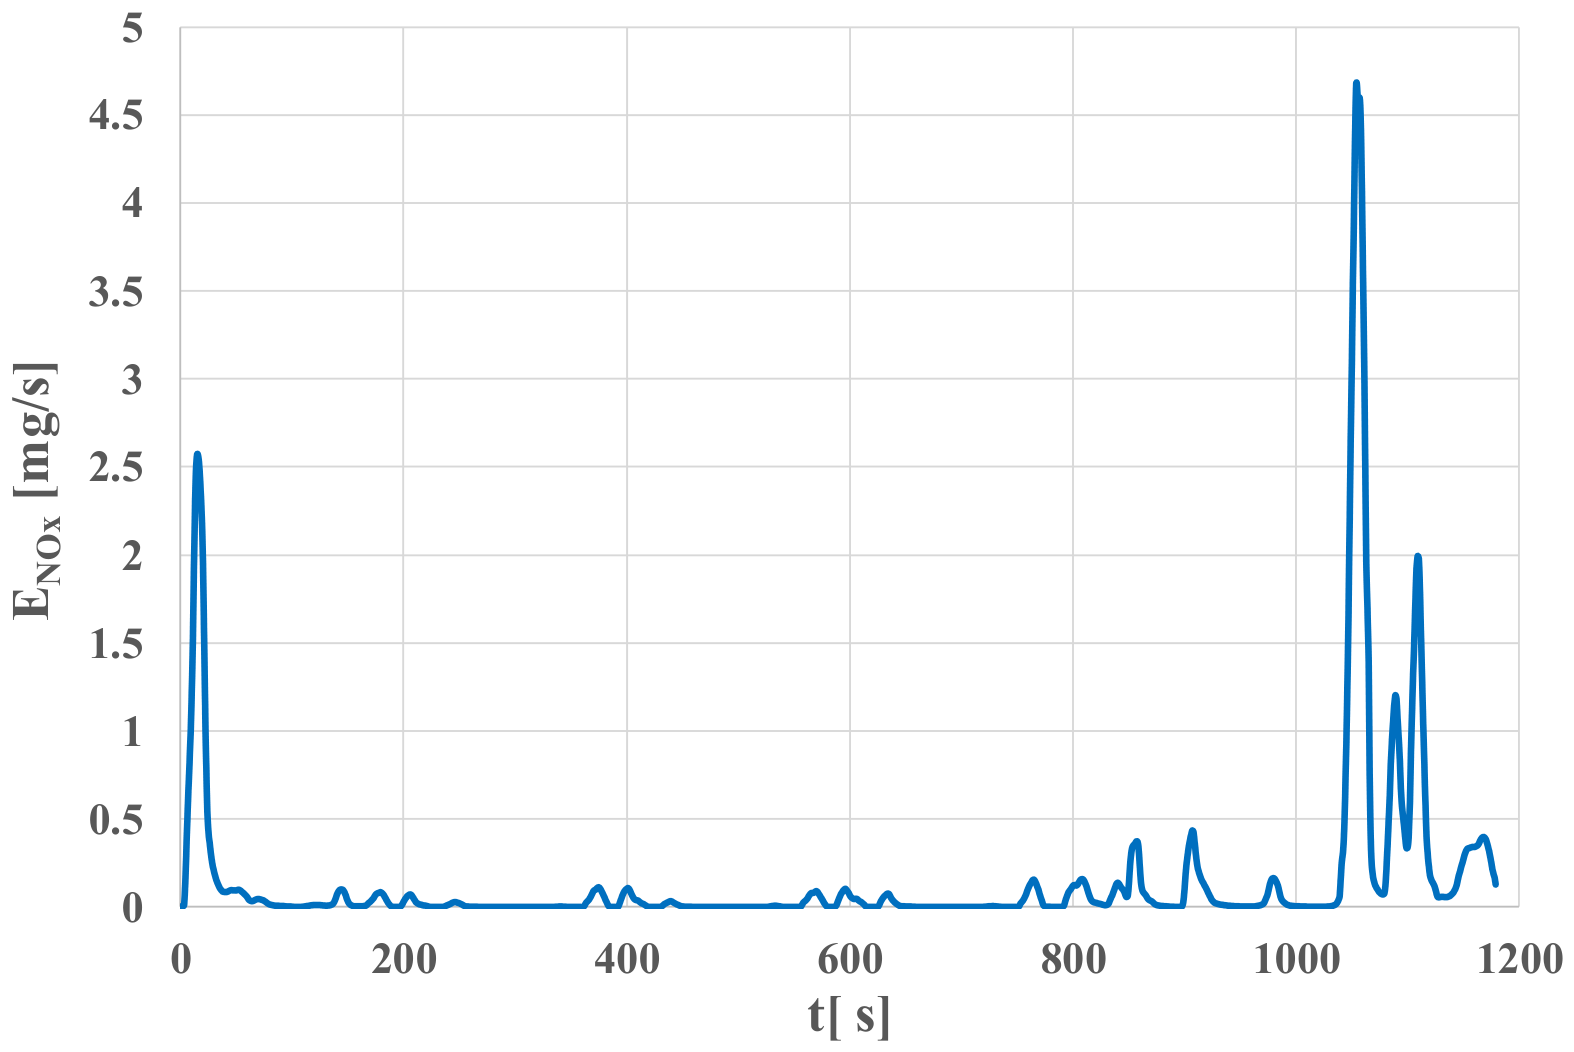
The nitrogen oxide emission intensity is dominated by engine load and maximum combustion temperature (Figure 6). Peak nitrogen oxide emissions occur at high engine speeds and high engine loads, which contribute to increased temperatures in the combustion chamber. In diesel engines, nitrogen oxide emissions are particularly significant due to the elevated temperatures and pressures in the combustion chamber, which intensify the formation of nitrogen oxides. Compared to SI engines, this relationship is more pronounced and represents one of the main environmental constraints of diesel engines. The dominant factor for nitrogen oxide emission intensity is the engine load, which is mainly related to the vehicle speed.
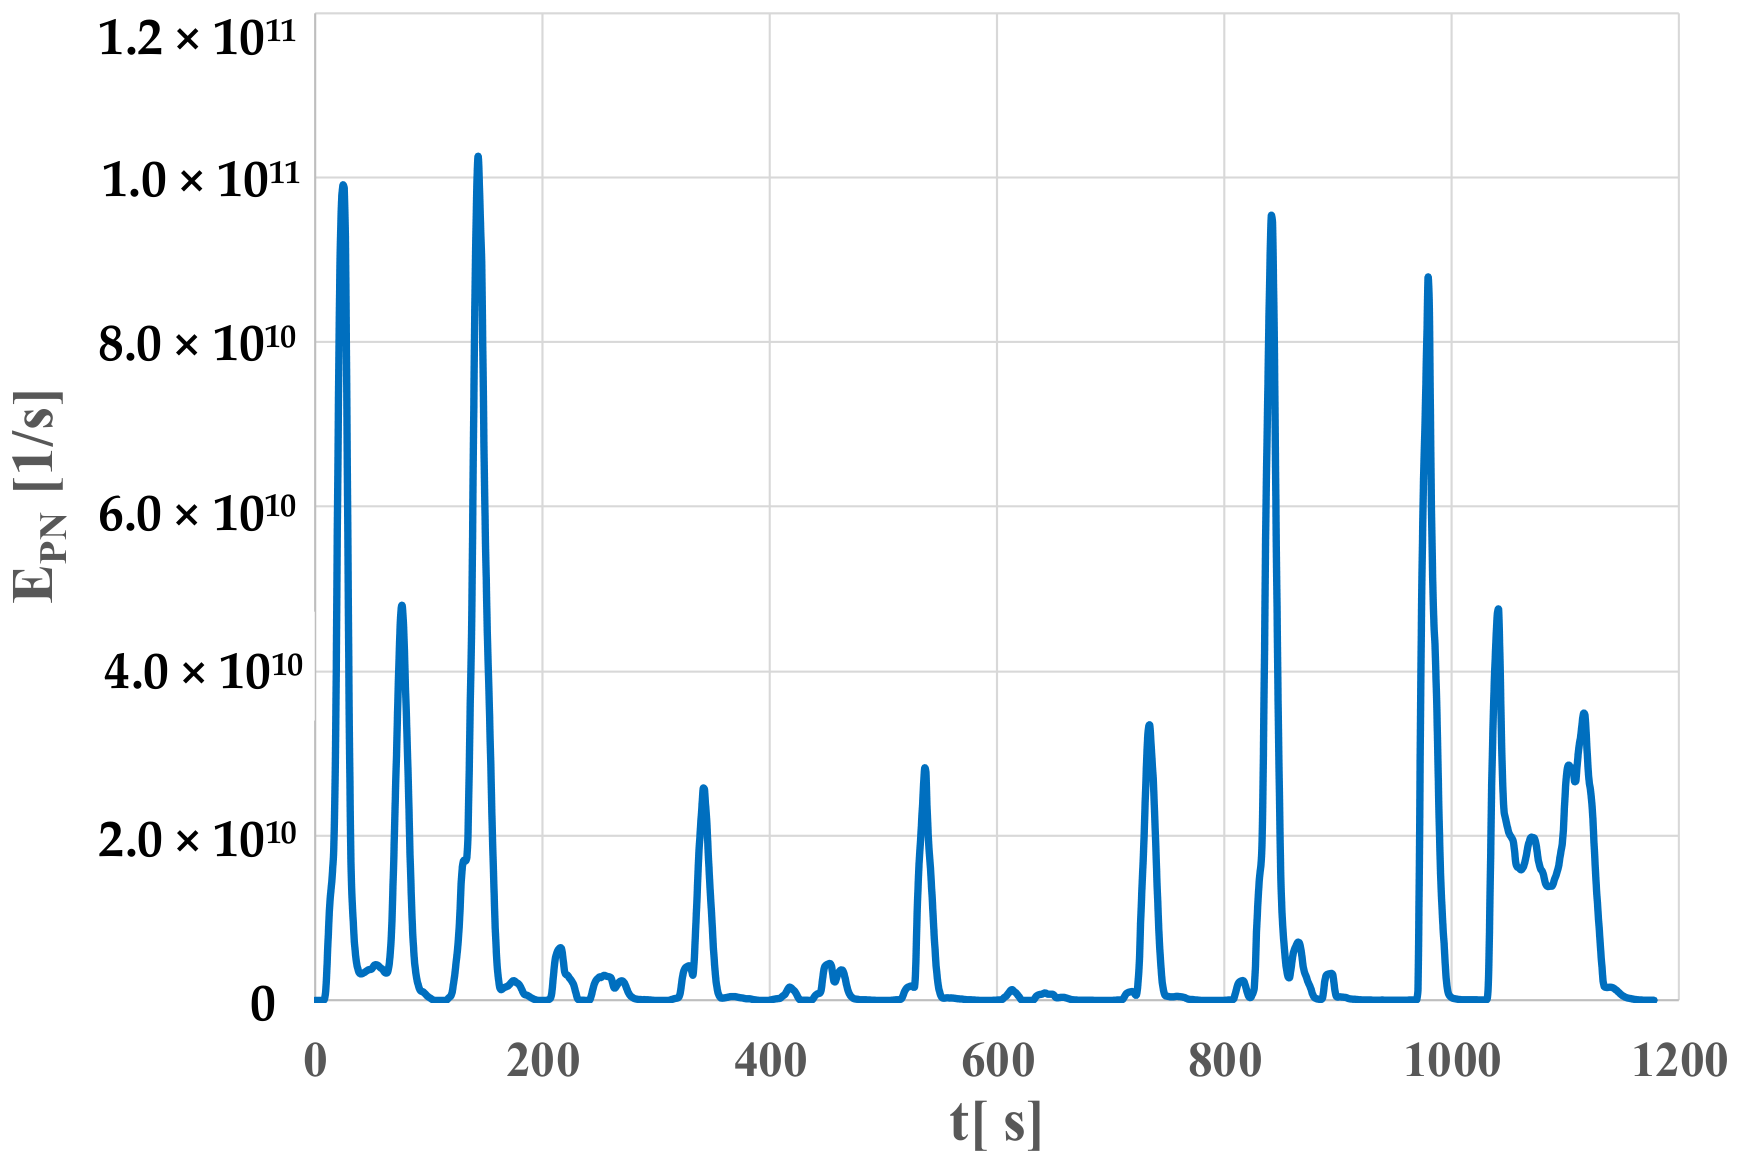
The particle number emission intensity is characterized by high dynamics and peaks during intense acceleration phases—showing only in the final phase of the NEDC test (Figure 7). Especially high particulate matter emission values were observed during rapid increases in fuel injection, leading to soot formation and agglomeration. In the case of particle number emissions intensity, the factor determining the value of this intensity is primarily the strong increase in rotational speed, which is accompanied by a rapid increase in the engine load.
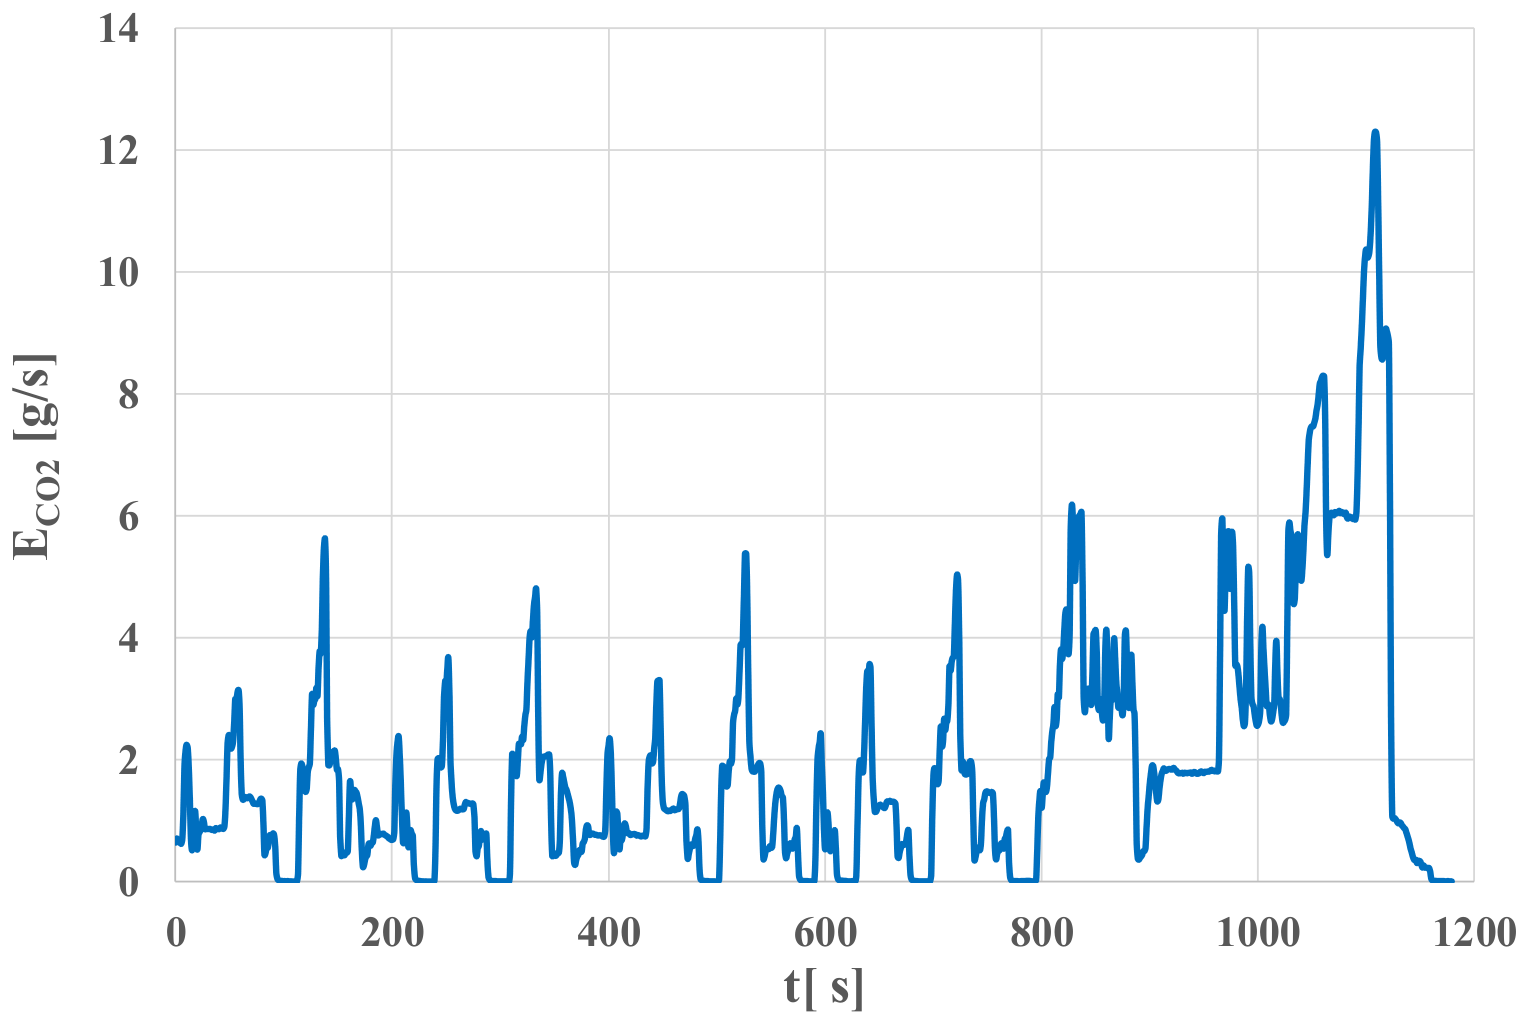
Carbon dioxide emissions follow a relatively continuous pattern and are strongly correlated with engine load and fuel consumption (Figure 8 and Figure 9). The nature of the pattern indicates a close relationship between carbon dioxide emissions and the engine’s instantaneous effective power. Fuel injection increases with increasing power demand, particularly during acceleration and heavy-load driving.

4. Analysis of Research Results

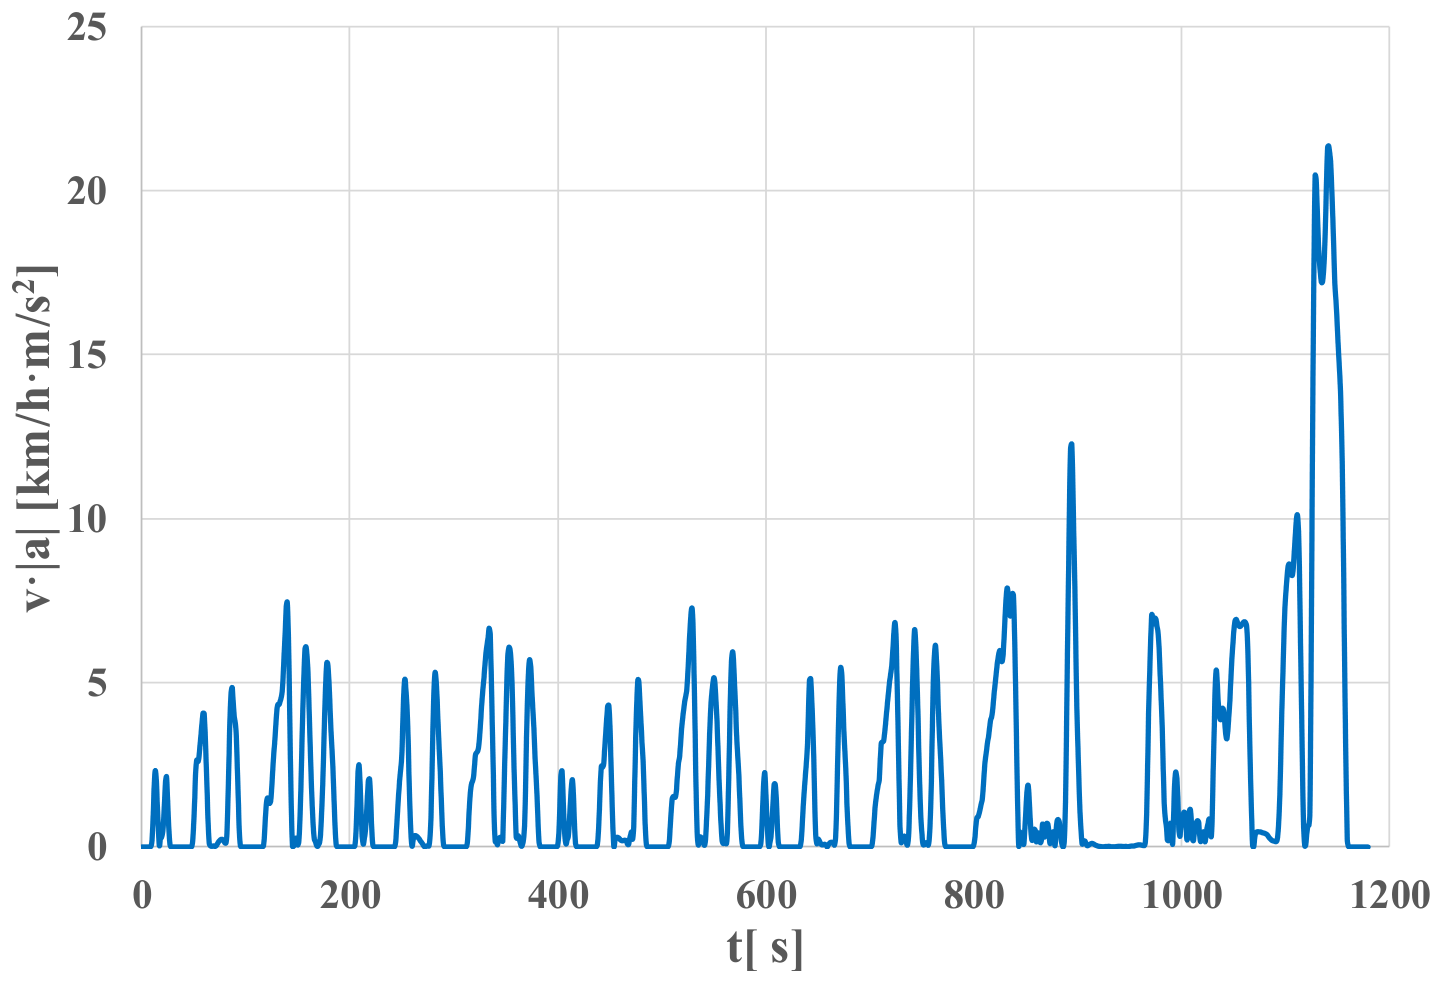
Figure 10 shows the product function of the speed and acceleration modulus of the car in the NEDC test. This parameter strongly characterizes the dynamic properties of the vehicle speed process, and its strong dependence on vehicle speed is clearly evident. The statistical characteristics of the processes: speed—v—and the product of speed and acceleration modulus—v·|a—obtained in the NEDC test are presented in Table 4.
The following statistical characteristics were examined: AV—mean value, M—median, D—standard deviation, Rg—range, Min—minimum value, Max—maximum value, Q1—first quartile, Q3—third quartile, RQ—interquartile range, DQ—interquartile deviation, W—coefficient of variation, WQ—quartile coefficient of variation, K—kurtosis and S—skewness.
The large difference between the maximum and average values of both vehicle speed and the product of vehicle speed and the acceleration modulus is characteristic of this type of measurement. The positive skewness observed in the distributions of the investigated processes further confirms these findings. The speed distribution is slightly platykurtic, the product of speed and acceleration modulus—strongly leptokurtic. The quarterly coefficient of variation of the product of speed and acceleration modulus was particularly large—this was consistent with the high value of the distribution’s kurtosis. Table 5 presents the statistical features of the exhaust emission rates of: carbon monoxide—ECO, hydrocarbons—EHC, nitrogen oxides—ENOx, carbon dioxide—ECO2, particle number emission intensity—EPN and fuel mass consumption intensity—qf.
Based on the determined statistical features of the studied processes, it can be concluded that there is a very large difference between the maximum and average values. The minimum values were very small. It is significant that the average value was higher than the median, which is confirmed by the high value of kurtosis, especially for the emission of carbon monoxide, hydrocarbons (mainly) and nitrogen oxides. In general, exhaust emission rates, particle number emission intensity and fuel mass consumption intensity have platykurtic and right-skewed distributions. The very large value of the quarterly coefficient of variation of the hydrocarbon emission rate is consistent with a large divergence from the normal distribution.
Table 6 shows Pearson’s linear correlation coefficients between the processes tested in the NEDC test: vehicle speed—v and the emission rates of: carbon monoxide—ECO, hydrocarbons—EHC, nitrogen oxides—ENOx, carbon dioxide—ECO2, particle number emission intensity—EPN and fuel mass consumption intensity—qf.
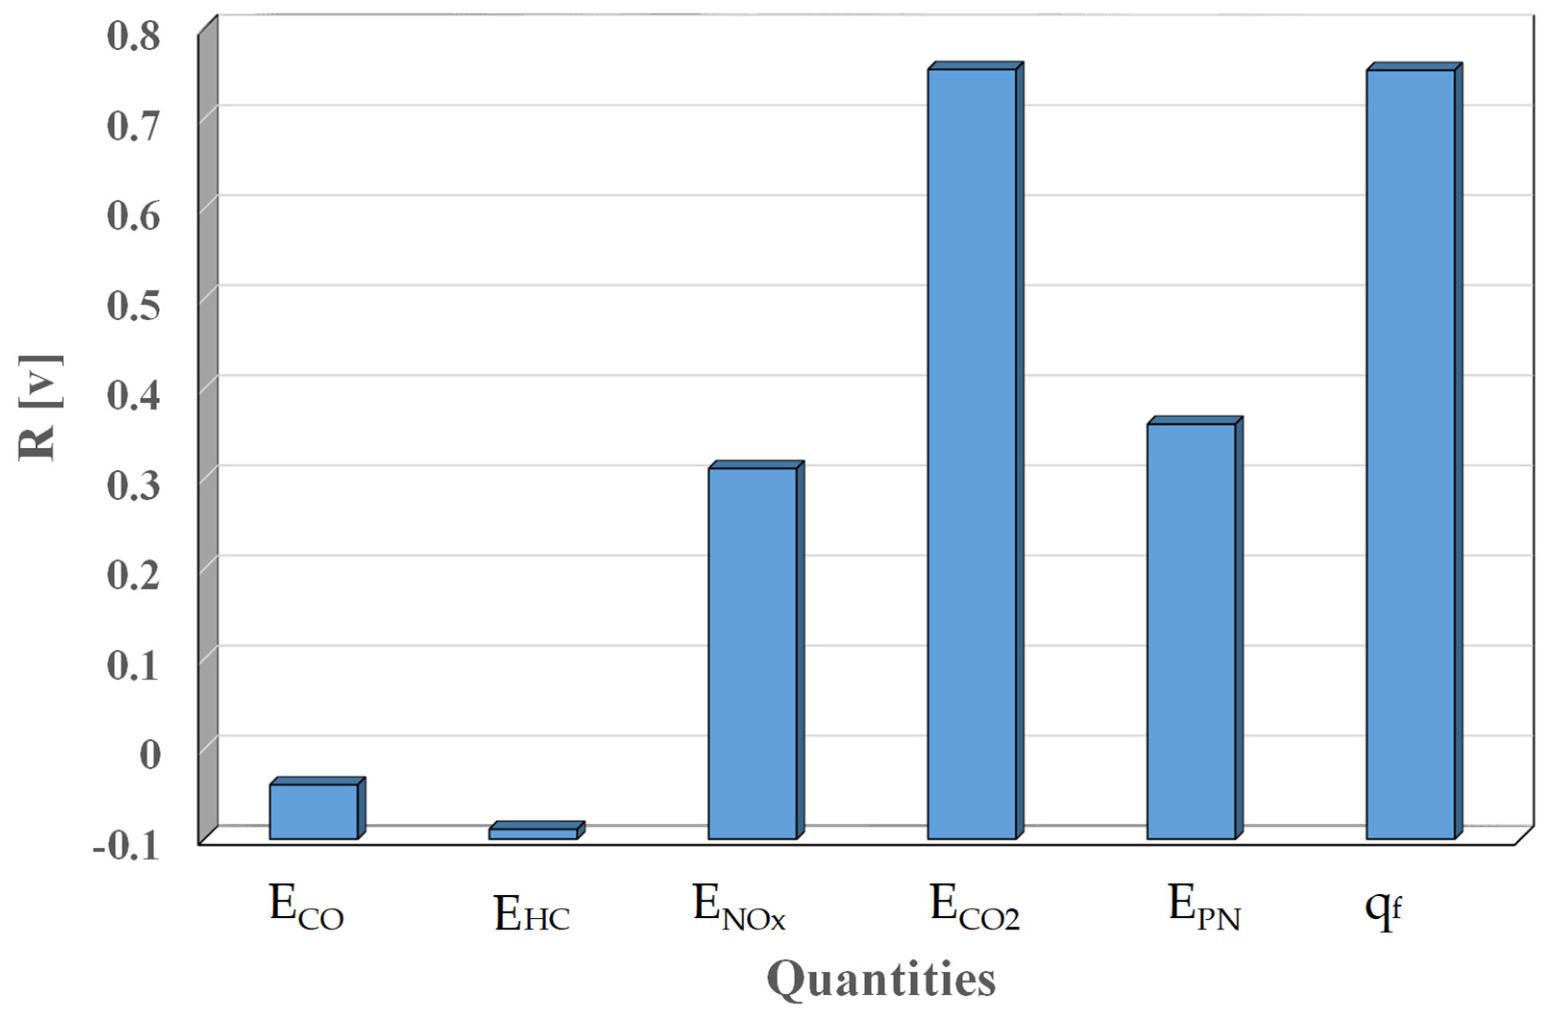
The strongest positive correlation was found between vehicle speed and carbon dioxide emissions and fuel mass consumption intensity. Figure 11 shows the Pearson’s linear correlation coefficient between the vehicle speed process and the processes of exhaust emission rates of: carbon monoxide—ECO, hydrocarbons—EHC, nitrogen oxides—ENOx, carbon dioxide—ECO2, particle number emission intensity—EPN and fuel mass consumption intensity—qf.
The negative value of the linear correlation coefficient of vehicle speed is with the carbon monoxide emission intensity and stronger with the hydrocarbon emission intensity.
Table 7 shows specific distance exhaust emission of: bCO, bHC, bNOx and bCO2, specific distance particle number—bPN—and specific distance of mass fuel consumption—qf—in the NEDC test and limits for Euro 7.
The values of average specific distance emissions in the NEDC test were even much lower than the limits for Euro 7.
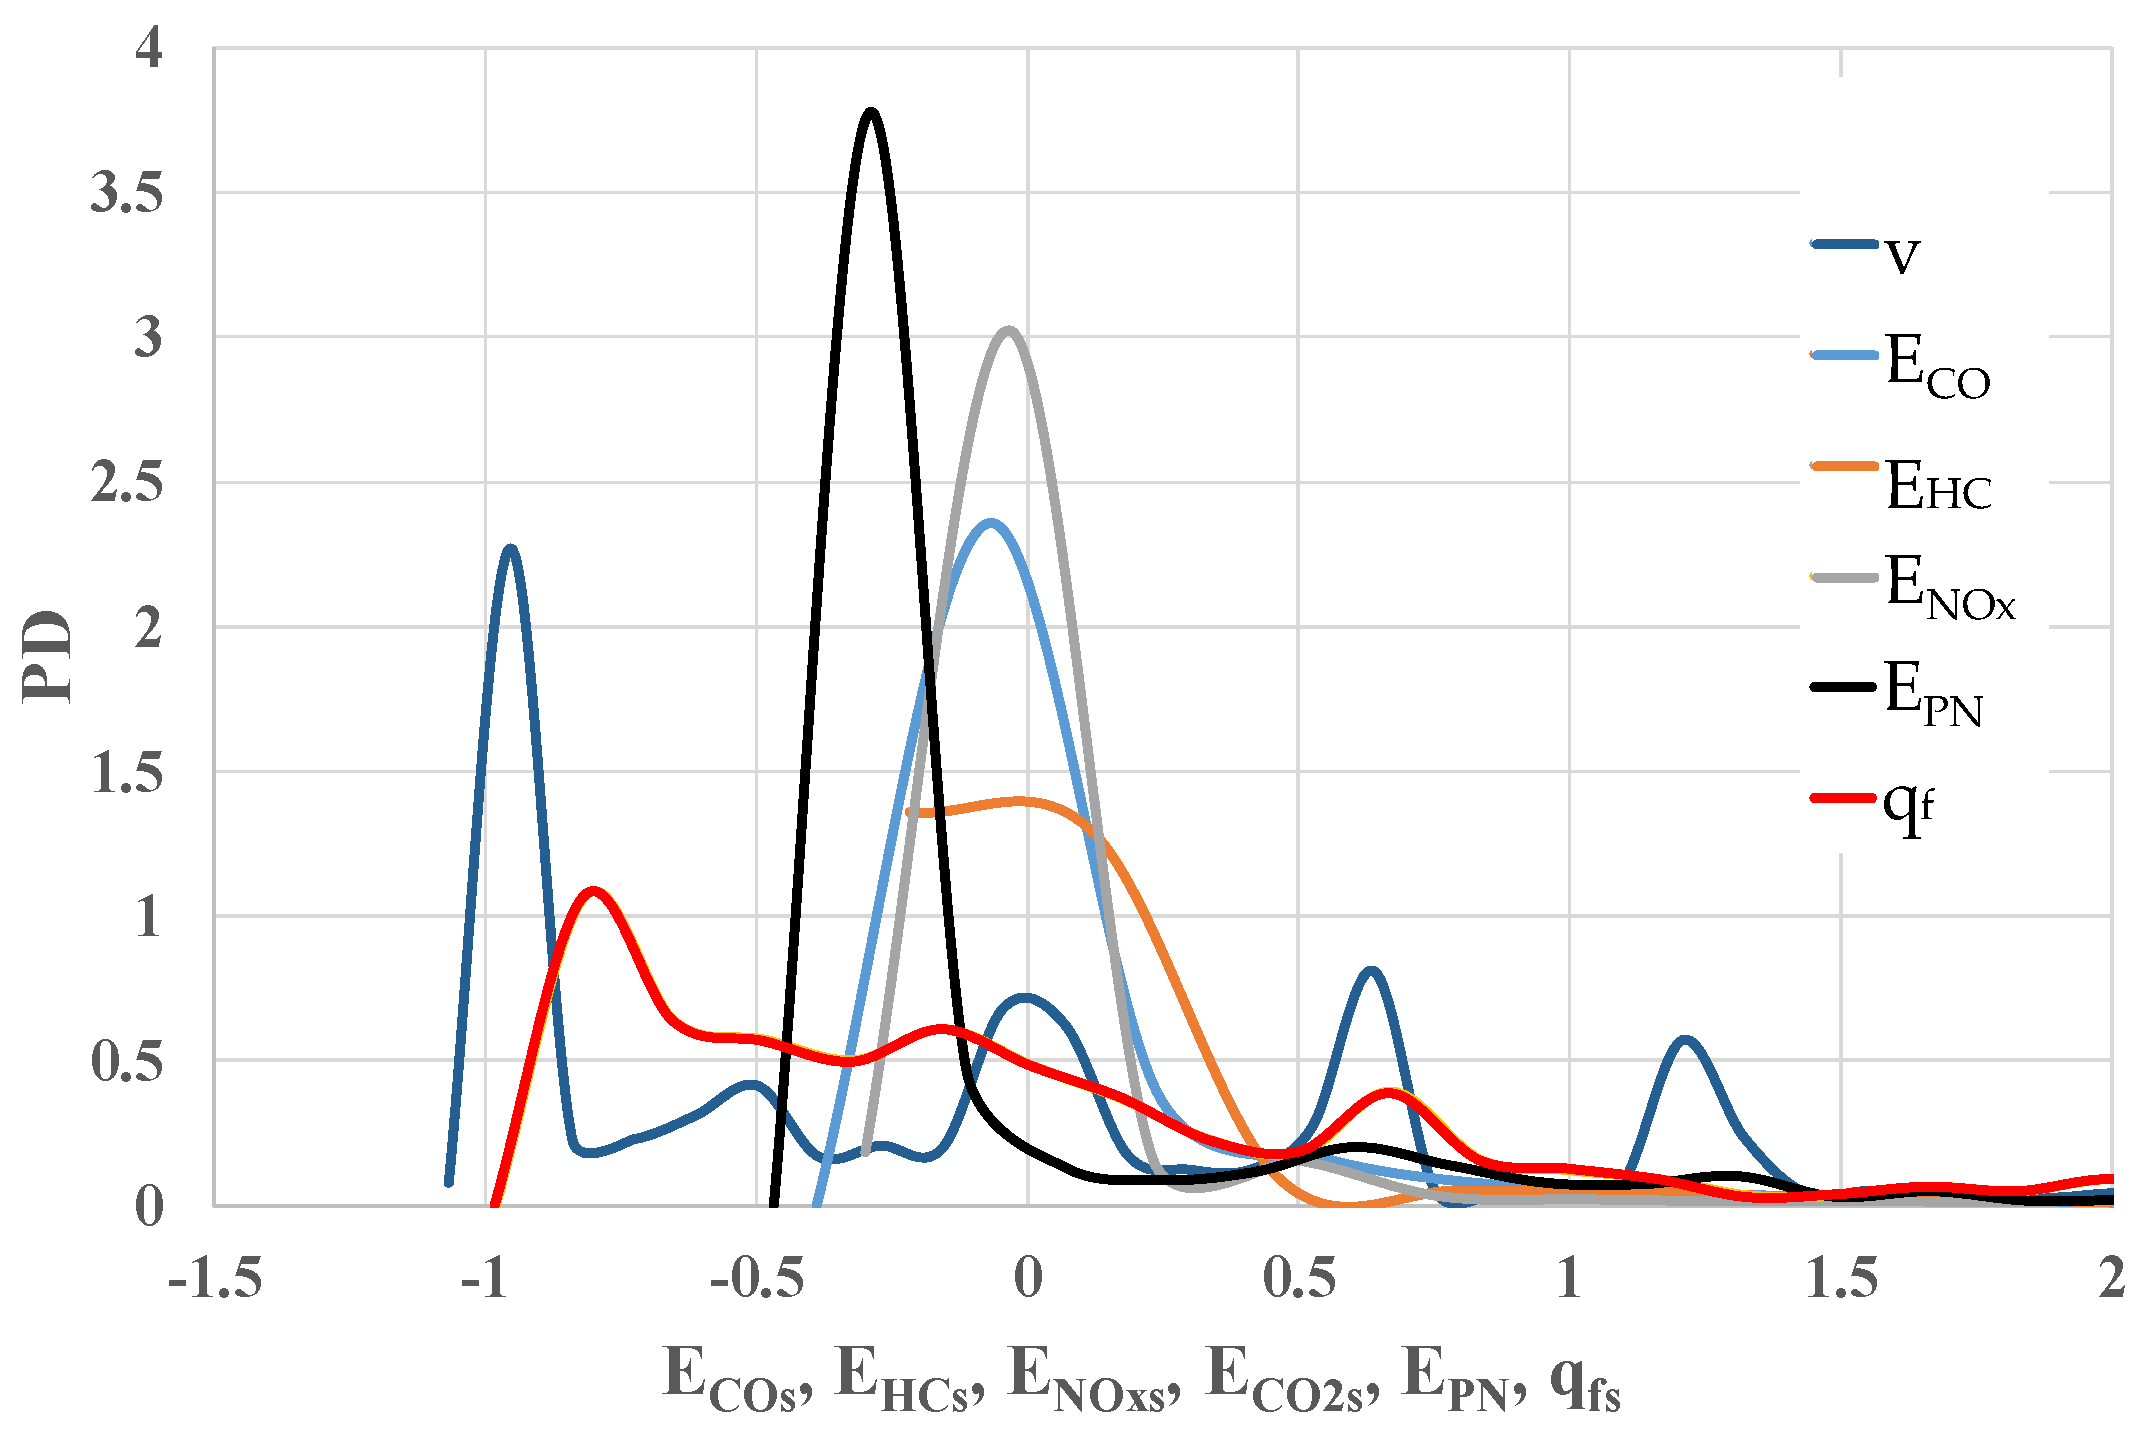
Figure 12 shows the probability density of standardized processes—PD in the NEDC test: exhaust emission intensity, particulate number emission intensity and fuel mass consumption intensity.
There is a strong asymmetry in the probability distributions of the studied processes, as measured by their strong right-skewness. A large variation in the probability density of the tested processes was observed. This may be associated with artificial vehicle operating conditions in the NEDC test cycle, which was developed through the synthesis of speed-profile requirements rather than by faithfully reproducing real-world driving conditions in the time domain. An assessment of the compliance of the investigated datasets with the normal distribution was carried out, which was verified by the Kolmogorov–Smirnov [30], Lilliefors [31] and Shapiro–Wilk [32] tests. The probability of not rejecting the Kolmogorov–Smirnov, Lilliefors and Shapiro–Wilk hypotheses about the compliance of the analyzed sets with a normal distribution was less than 0.01. Therefore, it was concluded that there are no grounds to adopt hypotheses about the compliance of the sets with a normal distribution.
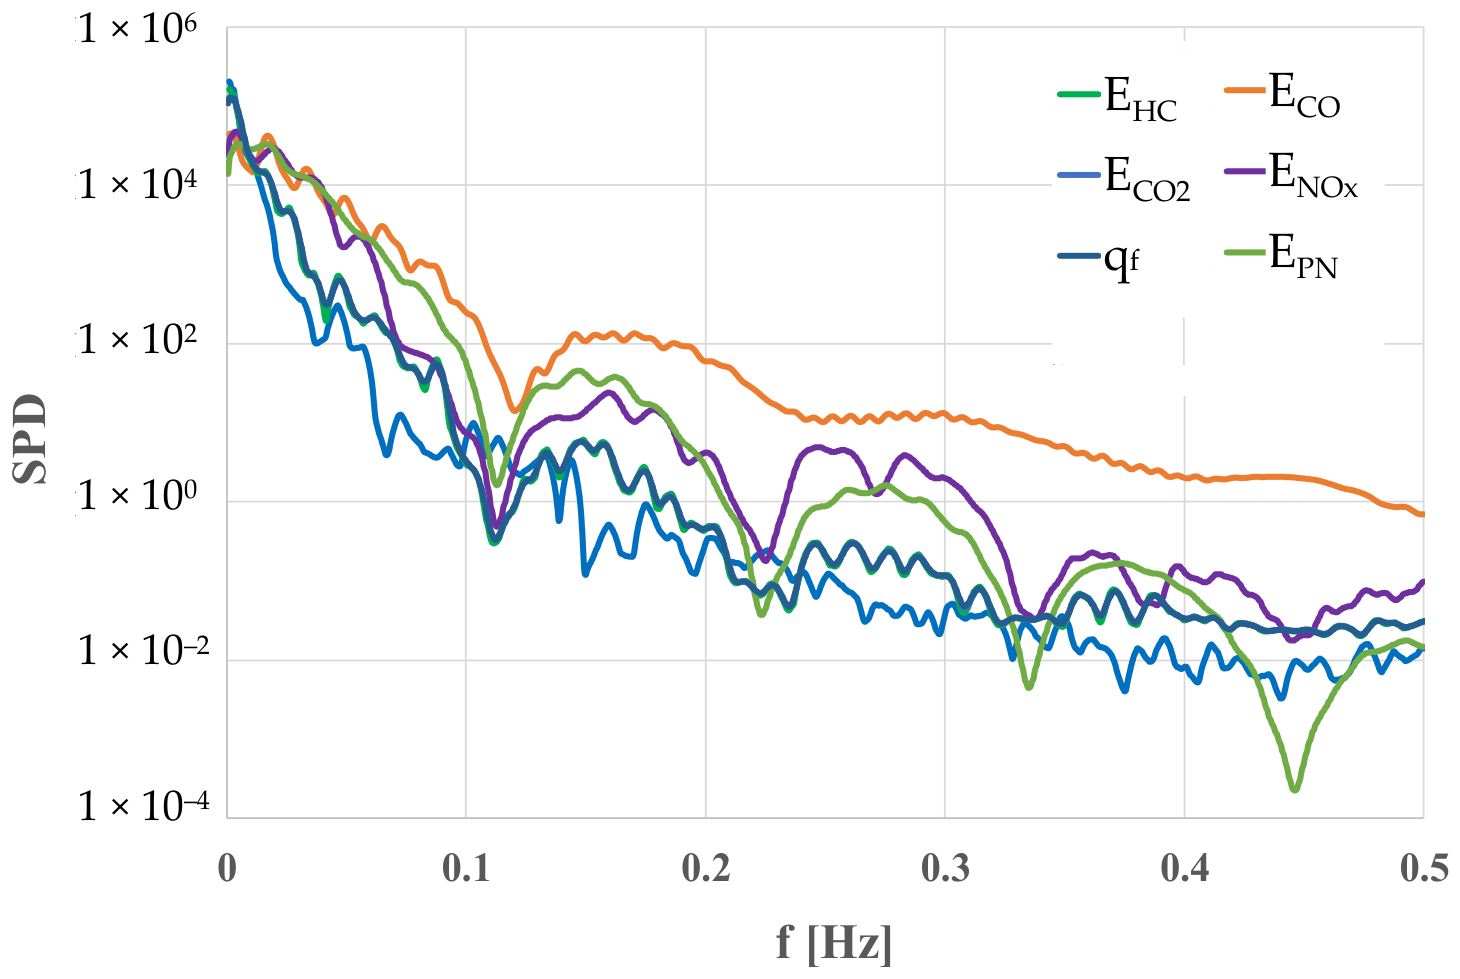
Figure 13 illustrates the power spectral density of the vehicle speed processes—SPD, exhaust emission intensity, particulate number intensity and fuel mass consumption intensity.
There is significant variation in the power spectral density of the studied processes, especially for high frequencies, which indicates significant dynamic differences in the processes.

5. Summary

The main conclusions arising from the conducted research are as follows:
  • It is typical for modern cars with high exhaust emission categories that in a significant part of the test the intensity of exhaust emissions is very low. This is the result of the use of advanced exhaust aftertreatment technologies. This also results in low exhaust emissions for the entire vehicle lifespan.
  • Such a large difference between the maximum value and the average value of the examined processes is characteristic for this case. This is confirmed by the positive skewness of the distributions of the studied processes.
  • In general, exhaust emission rates, particulate number emission intensity and fuel mass consumption intensity have platykurtic and right-skewed distributions.
  • A large variation could be observed in the probability density of the tested processes, which may be influenced by unnatural vehicle movement conditions in the NEDC test.
  • On the basis of an assessment of the compliance of the investigated datasets with the normal distribution using the Kolmogorov–Smirnov, Lilliefors and Shapiro–Wilk hypotheses, it was concluded that there are no grounds for adopting hypotheses about the compliance of the sets with normal distribution.
  • There is a large variation in the power spectral density of the studied processes, especially for high frequencies, which indicates significant dynamic differences in the processes.
  • The values of average road emissions recorded in the NEDC test were much lower than even the limits for Euro 7.

Author Contributions

Conceptualization, M.A.-Z., K.B., Z.C., J.M. and J.P.; methodology, M.A.-Z., K.B., Z.C., J.M. and J.P.; software, M.A.-Z., K.B., Z.C., J.M. and J.P.; validation, M.A.-Z., K.B., Z.C., J.M. and J.P.; formal analysis, M.A.-Z., K.B., Z.C., J.M. and J.P.; investigation, M.A.-Z., K.B., Z.C., J.M. and J.P.; resources, M.A.-Z., K.B., Z.C., J.M. and J.P.; data curation, M.A.-Z., K.B., Z.C., J.M. and J.P.; writing—original draft preparation, M.A.-Z., K.B., Z.C., J.M. and J.P.; writing—review and editing, M.A.-Z., K.B., Z.C., J.M. and J.P.; visualization, M.A.-Z., K.B., Z.C., J.M. and J.P.; supervision, M.A.-Z., K.B., Z.C., J.M. and J.P.; project administration, M.A.-Z., K.B., Z.C., J.M. and J.P.; funding acquisition, M.A.-Z., K.B., Z.C., J.M. and J.P. All authors have read and agreed to the published version of the manuscript.

Funding

This research received no external funding.

Data Availability Statement

The original contributions presented in this study are included in the article material. Further inquiries can be directed to the corresponding author.

Conflicts of Interest

The authors declare no conflicts of interest.

Abbreviations

The following abbreviations are used in this manuscript:
aacceleration
AMDC 130Artemis Motorway Driving Cycle 130
AMDC 150Artemis Motorway Driving Cycle 150
ARDCArtemis Rural Driving Cycle
ARTEMISAssessment and Reliability of Transport Emission Models and Inventory Systems
AUDCArtemis Urban Driving Cycle
Autobahntest for testing light vehicles on highways and expressways
AVaverage value
bspecific distance emission
bCOcarbon monoxide specific distance emission
bCO2carbon dioxide specific distance emission
bHChydrocarbons specific distance emission
bNOxnitrogen oxides specific distance emission
bPNparticle number specific distance
BUWALBundesamt für Umwelt, Wald und Landschaft
COcarbon monoxide
CO2carbon dioxide
Dstandard deviation
DQquarter deviation
ECEEconomic Commission for Europe
ECOcarbon monoxide emission intensity
ECO2carbon dioxide emission intensity
EHChydrocarbons emission intensity
ENOxnitrogen oxides emission intensity
EPAEnvironmental Protection Agency
EPNparticle number intensity
EUDCExtra-Urban Driving Cycle
ffrequency
GSPDspectral power density
HChydrocarbons
HD Heavy Duty
HD-UDDSEPA Urban Dynamometer Driving Schedule
Kkurtosis
Mmedian (second quartile Q2)
MaltaMalta Driving Cycle
Maxmaximum value
Minminimum value
MZAMiejskie Zakłady Autobusowe (Warsaw City Bus Company)
NEDCNew European Driving Cycle
NOxnitrogen oxides
OBDOn-Board Diagnostics
PDpower density
PDgprobability density
PEMS TestingPortable Emissions Measurement Systems (horiba.com)
PNparticle number
Q1first quartile
Q3third quartile
qfmass fuel consumption specific distance
RPearson’s linear correlation coefficient
Rg difference of extrema values
RQinterquartile range
Sskewness
SORTStandardised On-Road Test Cycles
Stop&Gotest for testing light vehicles in congestions
ttime
UDCUrban Driving Cycle
UITP SORTUnion Internationale des Transports Publics. Standardised On-Road Test Cycles: SORT 1, SORT 2, SORT 3
vvelocity
Wcoefficient of variation
WLTCWorldwide Harmonized Light Vehicle Test Cycle
WLTPWorldwide Harmonized Light Vehicle Test Procedure
WQquarter coefficient of variation

References

  1. European Environment Agency. Decarbonising Road Transport—The Role of Vehicles, Fuels and Transport Demand; Publications Office of the European Union: Luxembourg, 2022. [Google Scholar] [CrossRef]
  2. Intergovernmental Panel on Climate Change (IPCC). Climate Change 2021. The Physical Science Basis: Working Group I Contribution to the Sixth Assessment Report of the Intergovernmental Panel on Climate Change; Cambridge University Press: Cambridge, UK, 2023. [Google Scholar] [CrossRef] [Scilit]
  3. Transforming Our World: The 2030 Agenda for Sustainable Development. United Nations, 2015. Available online: https://sdgs.un.org/publications/transforming-our-world-2030-agenda-sustainable-development-17981 (accessed on 20 June 2026).
  4. Commission Regulation (EU) 2017/1151 of 1 June 2017 Supplementing Regulation (EC) No 715/2007 of the European Parliament and of the Council on Type-Approval of Motor Vehicles with Respect to Emissions from Light Passenger and Commercial Vehicles (Euro 5 and Euro 6) and on Access to Vehicle Repair and Maintenance Information, Amending Directive 2007/46/EC of the European Parliament and of the Council, Commission Regulation (EC) No 692/2008 and Commission Regulation (EU) No 1230/2012 and Repealing Commission Regulation (EC) No 692/2008. Available online: http://data.europa.eu/eli/reg/2017/1151/oj (accessed on 20 June 2026).
  5. WHO Global Air Quality Guidelines: Particulate Matter (PM2.5 and PM10), Ozone, Nitrogen Dioxide, Sulfur Dioxide and Carbon Monoxide. Geneve 2021. Available online: https://www.who.int/publications/i/item/9789240034228/ (accessed on 20 June 2026).
  6. IEA. World Energy Outlook 2022; IEA: Paris, France, 2022; Available online: https://www.iea.org/reports/world-energy-outlook-2022 (accessed on 19 June 2026).
  7. Chłopek, Z.; Biedrzycki, J.; Lasocki, J.; Wójcik, P. Examination of pollutant emissions and fuel consumption at tests simulating the real conditions of operation of a passenger car. Arch. Automot. Eng. 2014, 65, 3–18. [Google Scholar]
  8. Bendat, J.S.; Piersol, A.G. Random Data: Analysis and Measurement Procedures; Book Series: Wiley Series in Probability and Statistics; John Wiley & Sons, Inc.: Hoboken, NJ, USA, 2010. [Google Scholar] [CrossRef] [Scilit]
  9. Oppenheim, A.V.; Schafer, R.W. Digital Signal Processing; Prentice Hall international editions, Proceedings of the IEEE; Prentice-Hall: Englewood Cliffs, NJ, USA, 1975; Volume 63, p. 4. [Google Scholar]
  10. Worldwide Emission Standards for Light-Duty Vehicles 2025/2026. Advancing Sustainability Today, Powering a Cleaner Tomorrow. Available online: https://www.phinia.com/docs/phinialibraries/central-document-hub/worldwide_emissions_standards_for-light-duty_vehicles.pdf?sfvrsn=95f63a7b_12 (accessed on 12 June 2026).
  11. DieselNet: Engine & Emission Technology. Available online: https://dieselnet.com (accessed on 17 June 2026).
  12. Van de Weijer, C.J.T.; Hendriksen, P.; Verbeek, R.P. Urban Bus Driving Cycle. In EAEC Conference, Strasbourg, France, 16–18 June 1993; TNO-Road Vehicles Research Institute: Helmond, The Netherlands, 1993. [Google Scholar]
  13. Chłopek, Z.; Adamczyk, E.; Tułodziecki, M. Problems of Standard Fuel Consumption Estimation in City Buses; TRANS-BALTICA: Vilnius, Lithuania, 2003. [Google Scholar]
  14. Kurtyka, K.; Pielecha, J. The evaluation of exhaust emission in RDE tests including dynamic driving conditions. Transp. Res. Procedia 2019, 40, 338–345. [Google Scholar] [CrossRef] [Scilit]
  15. Woodburn, J.; Bielaczyc, P.; Merkisz, J.; Pielecha, J. Laboratory and on-road characterization of exhaust emissions from plug-in hybrid vehicles at multiple battery states of charge conditions. Transp. Probl. 2023, 18, 99–112. [Google Scholar] [CrossRef] [Scilit]
  16. André, M. The ARTEMIS European driving cycles for measuring car pollutant emissions. Sci. Total Environ. 2004, 334–335, 73–84. [Google Scholar] [CrossRef] [Scilit] [PubMed]
  17. BUWAL (Bundesamt für Umwelt, Wald und Landschaft); INFRAS AG (Infrastruktur-, Umwelt- und Wirtschaftsberatung). Luftschadstoffemissionen des Strassenverkehrs 1950–2010; BUWAL-Bericht: Bern, Switzerland, 1995; p. 255.
  18. Andrych-Zalewska, M.; Chłopek, Z.; Merkisz, J.; Pielecha, J. Analysis of the operation states of internal combustion engine in the Real Driving Emissions test. Arch. Transp. 2022, 61, 71–88. [Google Scholar] [CrossRef] [Scilit]
  19. Parzen, E. Stochastic Processes; Courier Dover Publications: Garden City, NY, USA, 2015. [Google Scholar]
  20. Poland’s Informative Inventory Report 2026 Air Pollutant Emissions in Poland 1990–2024; Institute of Environmental Protection—National Research Institute: Warsaw, Poland, 2026.
  21. Fishman, G.S. Monte Carlo. Concepts, Algorithms and Applications; Springer: New York, NY, USA, 1996. [Google Scholar]
  22. Box, G.E.P.; Hunter, W.G.; Hunter, J.S. Statistics for Experimenters: An Introduction to Design, Data Analysis, and Model Building; John Wiley & Sons: New York, NY, USA, 1978. [Google Scholar]
  23. Utts, J.M.; Heckard, R.F. Mind on Statistics. Standalone Book, 5th ed.; Brooks Cole: South Melbourne, Australia; Boston, MA, USA, 2014. [Google Scholar]
  24. Ralston, A.; Rabinowitz, P. A First Course in Numerical Analysis, 2nd ed.; Dover Publications Inc.: Garden City, NY, USA, 2001. [Google Scholar]
  25. Weisstein, E.W. Fast Fourier Transform; Wolfram Research: Champaign, IL, USA, 2015. [Google Scholar]
  26. ISO/IEC 17025:2017; General Requirements for the Competence of Testing and Calibration Laboratories. International Organization for Standardization (ISO): Geneva, Switzerland, 2017.
  27. VW 52000:2021-07; Materials Verification. Volkswagen AG: Wolfsburg, Germany, 2021.
  28. VW 50180:2025-01; Components, Semi-Finished Products, and Materials in the Vehicle Interior–Emission Behavior. Volkswagen AG: Wolfsburg, Germany, 2025.
  29. Savitzky, A.; Golay, M.J.E. Smoothing and differentiation of data by simplified least squares procedures. Anal. Chem. 1964, 36, 1627–1639. [Google Scholar] [CrossRef] [Scilit]
  30. Kolmogorov, A. Confidence limits for an unknown distribution function. Ann. Math. Stat. 1941, 12, 461–463. [Google Scholar] [CrossRef] [Scilit]
  31. Smirnov, N.V. Table for estimating the goodness of fit of empirical distributions. Ann. Math. Stat. 1948, 19, 279–281. [Google Scholar] [CrossRef] [Scilit]
  32. Shapiro, S.S.; Wilk, M.B.; Chen, H.J. A comparative study of various tests of normality. J. Am. Stat. Assoc. 1968, 63, 1343–1372. [Google Scholar] [CrossRef]
Figure 1. NEDC test pattern. Vehicle speed—v—in the NEDC test in the time domain—t.
Energies 19 03533 g001
Figure 2. Functional diagram and equipment of the Emissions Laboratory in BOSMAL Automotive Research and Development Institute Ltd. (Bielsko-Biała, Poland).
Energies 19 03533 g002
Figure 3. Vehicle speed—v—recorded on the chassis dynamometer in the NEDC test in the time domain—t.
Energies 19 03533 g003
Figure 4. Carbon monoxide emission intensity—ECO—in the NEDC test in the time domain—t.
Energies 19 03533 g004
Figure 5. Hydrocarbons emission intensity—EHC—in the NEDC test in the time domain—t.
Energies 19 03533 g005
Figure 6. Nitrogen oxides emission intensity—ENOx—in the NEDC test in the time domain—t.
Energies 19 03533 g006
Figure 7. Particle number emission intensity—EPN—in the NEDC test in the time domain—t.
Energies 19 03533 g007
Figure 8. Carbon dioxide emission intensity—ECO2—in the NEDC test in the time domain—t.
Energies 19 03533 g008
Figure 9. Mass fuel consumption intensity—qf—in the NEDC test in the time domain—t.
Energies 19 03533 g009
Figure 10. Product of velocity and acceleration modulus—v·|a|—in the NEDC test in the time domain—t.
Energies 19 03533 g010
Figure 11. Linear correlation coefficient—R—between the speed process—v—and the exhaust emission intensities—ECO, EHC, ENOx and ECO2—and the intensity of particle number—EPN—and the intensity of mass fuel consumption—qf—in the NEDC test.
Energies 19 03533 g011
Figure 12. Probability density—PD—of the speed process—v—and the exhaust emission intensities—ECOs, EHCs and ENOxs—and the emission intensity of particle number—EPNs—and the intensity of mass fuel consumption—qfs in the NEDC test.
Energies 19 03533 g012
Figure 13. Power spectral density—SPD—of the exhaust emission intensities—ECO, EHC, ENOx and ECO2—and the intensity of particle number—EPN—and the intensity of mass fuel consumption—qf—in the NEDC test in the frequency domain—f.
Energies 19 03533 g013
Table 1. NEDC test characteristics.
CharacteristicUnitUDC 1EUDCNEDC
Distancekm0.9946.95510.931
Times1954001180
Idle time (stationary)s5739267
Average speed (including stops)km/h18.3562.5933.35
Average speed (excluding stops)km/h25.9369.3643.1
Maximum speedkm/h50120120
Average accelerationm/s20.5990.3540.506
Maximum accelerationm/s21.0420.8331.042
1 Four UDC test repetitions followed by single EUDC test.
Table 2. Technical specifications of the tested vehicle.
CharacteristicValue
EngineGasoline, Turbo, R4, 16 V
Fuel systemDirect injection
Engine displacement1984 cm3
Compression ratio10.5
Max. power195 kW at 5000 min−1
Max. torque370 N·m/(1600–4200) min−1
TransmissionAutomatic, 7 gears
Curb weight1770 kg
Specific power output9.1 kg/kW
Euro standardEuro 6
Table 3. Exhaust gas analyzers used in the Emissions Laboratory.
Measured
Concentrations
Measurement from BagsContinuous MeasurementMeasurement
Accuracy
RangeLeastBiggestLeastBiggest
CO low (NDIR)(0 ÷ 10) ppm(0 ÷ 500) ppm(0 ÷ 50) ppm(0 ÷ 2500) ppm±2%
at the
measuring point
±5%
on a scale
CO high (NDIR)(0 ÷ 0.5)%(0 ÷ 12)%
CO2 (NDIR)(0 ÷ 0.5)%(0 ÷ 20)%(0 ÷ 0.5)%(0 ÷ 20)%
NOx low (CLD)(0 ÷ 1) ppm(0 ÷ 50) ppm(0 ÷ 10) ppm(0 ÷ 500) ppm
NOx high (CLD)(0 ÷ 100) ppm(0 ÷ 1000) ppm(0 ÷ 1000) ppm(0 ÷ 10,000) ppm
THC low (FID)(0 ÷ 1) ppm(0 ÷ 50) ppm(0 ÷ 10) ppm(0 ÷ 500) ppm
THC high (FID)(0 ÷ 1000) ppm(0 ÷ 50,000) ppm
CH4 (NMHC)(0 ÷1) ppm(0 ÷ 500) ppm
PN(0 ÷ 10,000) 1/cm3 ± 10%
Table 4. Statistical features of the product of velocity process—v—and acceleration modulus process—v·|a|—in the NEDC test.
Statistical Featuresvv·|a|
UnitValueUnitValue
AVkm/h33.15km/h·m/s22.19
M31.200.47
D31.053.54
Rg120.0623.57
Min00
Max120.0623.57
Q11.010.01
Q349.753.24
RQ48.743.23
DQ24.371.62
W0.9371.620
WQ0.7813.453
K–0.0779.707
S0.8132.768
Table 5. Statistical features of exhaust emission intensity, particle number intensity and mass fuel consumption intensity in the NEDC test.
Statistical FeaturesExhaust Emission Intensity
UnitECOEHCENOxUnitECO2UnitEPNUnitqf
AVmg/s2.950.350.16g/s2.081/s7.95 × 109g/s0.67
M0.820.000.011.497.20 × 1080.48
D7.501.610.522.121.70 × 10100.68
Rg80.3018.544.6811.921.03 × 10113.81
Min0.035000.00242.00 × 1060.00
Max80.3318.544.6811.921.03 × 10113.81
Q10.150.000.000.608.03 × 1070.19
Q32.580.060.082.925.34 × 1090.94
RQ2.420.060.082.325.26 × 1090.75
DQ1.210.030.041.162.63 × 1090.37
W2.5414.6443.3451.0202.1341.018
WQ1.47334.4763.6380.7793.6560.775
K51.79373.68538.1244.27311.6294.249
S6.4218.1095.7911.8803.2561.874
Table 6. Pearson’s linear correlation coefficient between the processes of speed—v—and exhaust emission intensities—ECO, EHC, ENOx and ECO2—and the emission intensity of particle number—EPN—and the intensity of fuel mass consumption—qf—in the NEDC test.
vECOEHCENOxECO2EPNqf
km/hmg/smg/smgs/sg/s1/sg/s
vkm/h1.000
ECOmg/s–0.0401.000
EHCmg/s–0.0890.6721.000
ENOxmg/s0.3110.1390.3741.000
ECO2g/s0.7540.0860.0480.4801.000
EPN1/s0.3610.0330.1780.2010.3781.000
qfg/s0.7540.0930.0540.4811.0000.3781.000
Table 7. Specific distance exhaust emission of: bCO, bHC, bNOx and bCO2, specific distance particle number–bPN—and specific distance of mass fuel consumption—qf—in the NEDC test and limits for Euro 7.
bCObHCbNOxbCO2bPNqf
mg/kmg/km1/kmg/km
0.3210.0380.0170.2268.63 × 1080.072
Euro 7
1.0000.1000.0600.0056.00 × 1011-
Disclaimer/Publisher’s Note: The statements, opinions and data contained in all publications are solely those of the individual author(s) and contributor(s) and not of MDPI and/or the editor(s). MDPI and/or the editor(s) disclaim responsibility for any injury to people or property resulting from any ideas, methods, instructions or products referred to in the content.