1. Introduction
The integration of renewable electricity into existing energy systems requires efficient storage strategies to address temporal mismatches between supply and demand. Power-to-gas technologies offer a promising route by converting surplus electricity into chemical energy carriers such as H
2 and CH
4 [
1]. In this context, biological methanation—where CO
2 is reduced to CH
4 by hydrogenotrophic microorganisms—has gained increasing attention as a flexible and potentially cost-effective approach for upgrading biogas and producing grid-compatible renewable gas [
2,
3,
4].
A major bottleneck in biological methanation is the limited solubility of H
2 in aqueous systems, which restricts its transfer from the gas phase to the microorganisms in the liquid phase [
5]. As a result, H
2 availability often becomes rate-limiting, leading to incomplete conversion and potential accumulation of H
2 in the reactor headspace [
6]. Enhancing H
2 mass transfer is therefore critical to achieving efficient and stable biomethanation [
7,
8].
Various strategies have been explored to improve H
2 delivery, including gas sparging, increased mixing intensity, gas recirculation, and membrane-based systems such as hollow fibre reactors [
9,
10]. While these approaches can enhance gas–liquid mass transfer, they are often associated with increased energy demand, operational complexity, or high capital costs [
11]. Membrane-based systems offer improved mass transfer performance but may be affected by fouling, scalability challenges, and material limitations [
10]. Consequently, there remains a need for simple, robust H
2 delivery strategies that can be applied to existing reactor configurations, such as continuous stirred tank reactors (CSTRs), without major process modifications.
In this study, we compare three H
2 delivery strategies—direct bubbling, sparging, and diffusion through submerged silicone tubing—in a lab-scale CSTR to assess their relative effectiveness at enhancing H
2 mass transfer. Silicone tubing offers a simple, membrane-free approach to H
2 delivery via diffusion through a permeable wall, a concept explored in related applications involving gas transfer across polymeric materials [
12,
13]. However, its performance relative to conventional gas injection methods and its practical feasibility for scale-up remain insufficiently understood.
The aim of this work is therefore twofold: (i) to provide a comparative assessment of H2 delivery strategies in terms of their impact on H2 dissolution and biomethanation performance, and (ii) to evaluate the practical feasibility of silicone-based diffusion for implementation in anaerobic digestion systems, including its limitations for scale-up. By linking experimental observations with engineering considerations, this study contributes to a better understanding of the trade-offs involved in H2 supply strategies for biological biogas upgrading. In particular, the scalability of diffusion-based H2 delivery in conventional stirred tank reactors remains poorly quantified. This study explicitly addresses this gap by linking experimentally determined mass transfer rates to engineering-scale requirements.
2. Materials and Methods
2.1. Bioreactor Setup
Experiments were performed in 13 L laboratory-scale bioreactors (Labfors 5, Infors HT, Bottmingen, Switzerland) with a working volume of 10 L. The reactors were operated as continuously stirred tank reactors (CSTRs) equipped with sensors for pH, redox potential, temperature, stirring speed, and gas production. Reactor temperature was maintained at 37 ± 1 °C under ambient pressure. Mixing was performed at 150 rpm unless otherwise stated.
2.2. H2 Supply and Delivery Strategies
H2 gas (≥99.9%) was supplied from a pressurised cylinder (Alphagaz, Air Liquide, Paris, France) and delivered using a thermal mass flow controller (EL-FLOW® Select F-201CV-100-RGD-22-V, Bronkhorst, Ruurlo, The Netherlands).
Three H2 delivery strategies were evaluated:
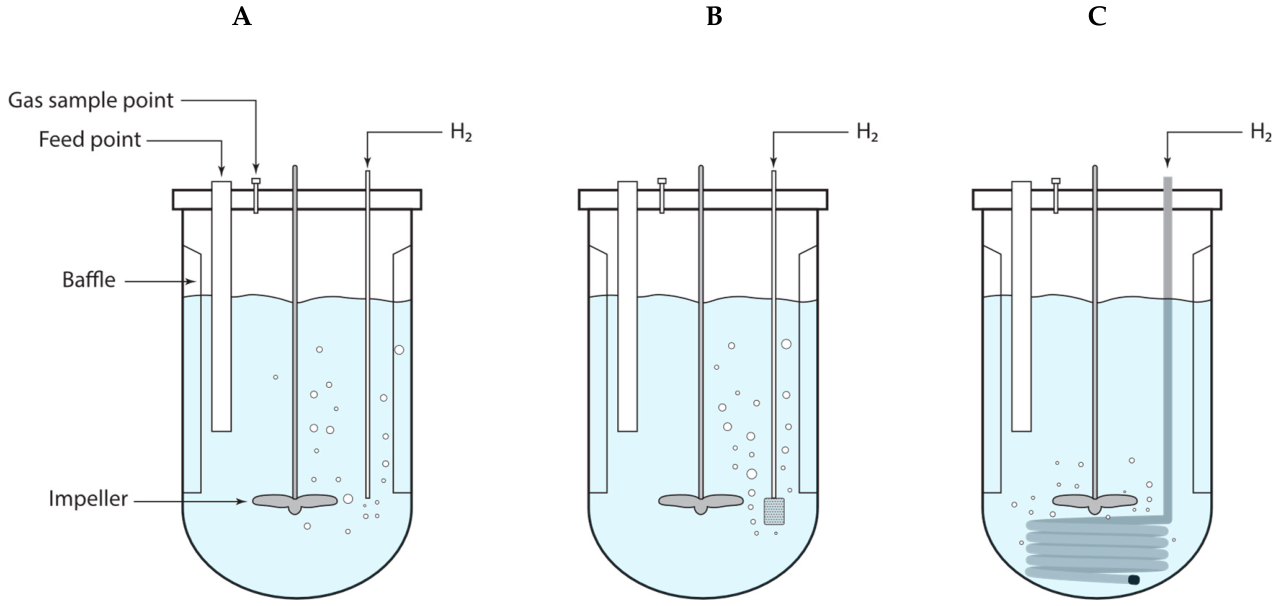
Direct injection (bubbling): H2 was introduced via a stainless steel tube (inner diameter 3.85 mm; outer diameter 6.35 mm).
Sparging: H2 was introduced via a 10 µm sparger (HPLC solvent inlet filter) connected to the same stainless steel tubing.
Silicone-based diffusion: H2 was supplied via a submerged dead-end silicone tube (length 10 m; inner diameter 4 mm; outer diameter 6 mm; Fisherbrand, Fisher Scientific, Thermo Fisher Scientific, Waltham, MA, USA), enabling gas transfer by diffusion without visible bubble formation.
H2 flow rates ranged from 0.2 to 0.8 L·min−1, depending on the experimental configuration. Within individual experiments, flow rates were kept constant to enable direct comparison between delivery strategies.
2.3. H2 Accumulation Test (Abiotic Conditions)
To assess the physical mass-transfer performance of different H2 delivery strategies, experiments were conducted under abiotic conditions. The reactor was filled with 10 L of demineralised water instead of digestate and operated at 37 °C with continuous mixing at 150 rpm. No substrate was added.
H2 was supplied using the delivery strategies described above. Dissolved H2 concentrations were monitored over time until steady-state conditions were reached, allowing quantification of the apparent mass transfer characteristics of each delivery method. The reactor was operated as an open system, allowing excess H2 to escape through the headspace, thereby enabling evaluation of net H2 retention in the liquid phase.
2.4. Dissolved H2 Measurements
Dissolved H
2 concentrations were determined using a methylene blue–platinum (MB-Pt) titration method (MiZ Company Limited, Kamakura, Japan), following manufacturer guidelines and literature [
14].
A liquid sample of approximately 6 g was weighed on an analytical balance, and reagent was added dropwise until a persistent blue colouration appeared. The reagent bottle was weighed before and after titration, and the reagent consumed was quantified gravimetrically (dispensed mass divided by the mean mass per droplet) rather than by integer droplet counts, giving sub-droplet resolution.
The mean droplet mass was determined experimentally: one droplet corresponded to approximately 0.024 g of reagent, equivalent to ≈5 × 10⁻⁵ mol·L−1 (≈0.10 mg·L−1) of dissolved H2, which sets the method’s quantification resolution. All titrations were performed in duplicate at identical equilibration times. The within-pair repeatability standard deviation (s_r) was 2.7 × 10⁻⁵ mol·L−1 for the bubbling method and 2.2 × 10⁻⁵ mol·L−1 for the tubing method (CV ≈ 6%); the sparger configuration was markedly less reproducible (s_r = 9.2 × 10⁻⁵ mol·L−1, CV ≈ 24%) and was therefore not used for quantification. For the best-performing configuration, this gives an estimated detection limit (3·s_r) of ≈8 × 10⁻⁵ mol·L−1—the lowest concentration that can be reliably detected—and a quantification limit (10·s_r) of ≈2.7 × 10⁻⁴ mol·L−1, above which values can be reliably measured. In line with common repeatability-based practice, these limits were estimated from the within-pair spread of the duplicate measurements; dedicated blank series were not required for this comparative assessment.
The MB–Pt method was selected for its practicality under anaerobic conditions. It has been benchmarked against an electrochemical dissolved-hydrogen sensor by Seo et al. [
14] (r = 0.9998, R
2 = 0.9995; residual standard deviation 0.0129 mg·L
−1 for DO-regulated water), although manual titration introduces operator-dependent variability not present in instrumental methods. As no independent electrochemical reference was available in this study, measured plateau concentrations were compared with the theoretical equilibrium solubility at 310 K (Henry’s law); all three configurations underestimated dissolved H
2 by 37–43%, consistent with hydrogen loss by evaporation during titration (accentuated at 37 °C relative to the ~25 °C used by Seo et al. [
14]) and with the empirical droplet-to-H
2 calibration factor of that method. Validation against a GC-based or electrochemical reference is identified as a priority for future work.
2.5. Biological Experiments (Digestate-Based Operation)
2.5.1. Reactor Operation
For biological experiments, reactors were filled with 10 kg of digestate obtained from an anaerobic digester at the wastewater treatment plant in Garmerwolde. Reactors were operated under semi-continuous conditions.
Every 24 h, 50 mL of slurry was withdrawn using a syringe, followed by the addition of 10 g substrate diluted in 25 mL demineralised water. The feeding port was rinsed with an additional 25 mL of demineralised water to ensure complete transfer. This resulted in a hydraulic retention time (HRT) of approximately 200 days.
Before H2 addition, reactors were operated until stable conditions were reached. Steady state was defined as constant biogas production and stable CH4 and CO2 concentrations.
2.5.2. In Situ Biomethanation
For the in situ experiments, two identical reactors were operated in parallel. One reactor received H2 via submerged silicone tubing, while the second served as a control without H2 addition. Both reactors were fed with 10 g substrate per day and operated at a mixing speed of 150 rpm. Gas and liquid samples were collected at defined time intervals.
2.5.3. Ex Situ Biomethanation
For the ex situ configuration, two reactors were connected in series. The first reactor functioned as the biogas-producing unit, while the second served as the biomethanation reactor. Biogas was transferred from the first to the second reactor using a thermal mass flow controller (EL-FLOW® Select F111B-100AGD-22-V, Bronkhorst). The primary reactor was fed with 10 g substrate daily for five consecutive days, followed by two days without feeding.
H2 was supplied to the second reactor via submerged dead-end silicone tubing. Mixing speeds were maintained at 150 rpm in the primary reactor and 200 rpm in the biomethanation reactor. Gas and liquid samples were collected at defined time intervals.
2.6. Substrate Preparation
The substrate consisted of a mixture of pre-ground sugar beet pulp, rabbit feed, and wheat flour in a 46:44:10 (w/w) ratio, corresponding to 100:95:23 g, respectively. Sugar beet pulp (cossettes) was supplied by Cosun Beet Company (Groningen, The Netherlands). Rabbit feed (Q-Rabbit mix) was obtained from Teurlings (Casteren, The Netherlands), and wheat flour (type 405) from Belhake (Braunschweig, Germany).
Sugar beet pulp and rabbit feed were milled separately using a commercial blender (Waring Commercial Blender, Stamford, CT, USA) for 1 min at maximum speed. All components were air-dried individually and stored at 4 °C until use. Fresh substrate mixtures were prepared weekly. The final substrate contained approximately 82% organic dry matter (ODM), with the remaining fraction (18%) consisting of water and ash.
2.7. Gas Analysis
Biogas composition (H2, CH4, CO2) was determined using a gas chromatograph (GC-2014, Shimadzu, Kyoto, Japan) equipped with a molecular sieve column (Molsieve 5A, Restek, Bellefonte, PA, USA).
Gas samples (10 µL) were collected from the reactor headspace using a gas-tight syringe (Hamilton Company, Reno, NV, USA). The column temperature was set at 110 °C and ramped to 150 °C (50 °C·min−1), with an initial hold of 6 min and a final hold of 3 min. Injector and detector temperatures were maintained at 150 °C. Nitrogen was used as carrier gas at 8.0 mL·min−1. Calibration gases were used to determine response factors for each component. Gas composition was calculated based on peak areas using LabSolutions software version 5.111 (Shimadzu).
2.8. CH4 Production
Cumulative CH4 production was measured using an automated gas-measurement system (AMPTS II, Bioprocess Control, Lund, Sweden) equipped with a wet gas flow cell. Before measuring volume, the biogas produced was passed through a 3 M NaOH solution to strip CO2, ensuring that only CH4 was quantified. CH4 volumes were expressed in normalised millilitres (NmL).
2.9. Note on Experimental Design
All experiments were conducted as proof-of-concept under controlled conditions without biological replicates. Results are therefore interpreted comparatively, focusing on relative trends rather than absolute performance. The abiotic mass transfer experiments were conducted under a single set of conditions (150 rpm, 1.0 × 10⁻² mol H2·h−1). The primary aim of this study was a comparative assessment of three delivery strategies under identical conditions, rather than a parametric characterisation of each strategy across a range of operating variables. Conclusions should therefore be interpreted as applying specifically to the tested conditions. A full parametric study—varying stirring speed, H2 feed rate, temperature, and reactor geometry—would further strengthen the findings and is identified as a priority for future work.
3. Results
The main limitation of the biological Sabatier reaction (CO
2 + 4 H
2 → CH
4 + 2 H
2O) is the low solubility and mass transfer of H
2 gas into the liquid phase. To address this, three H
2 delivery strategies were evaluated: (i) direct bubbling through a stainless-steel tube, (ii) sparging, and (iii) diffusion through a submerged dead-end silicone tube (
Figure 1).
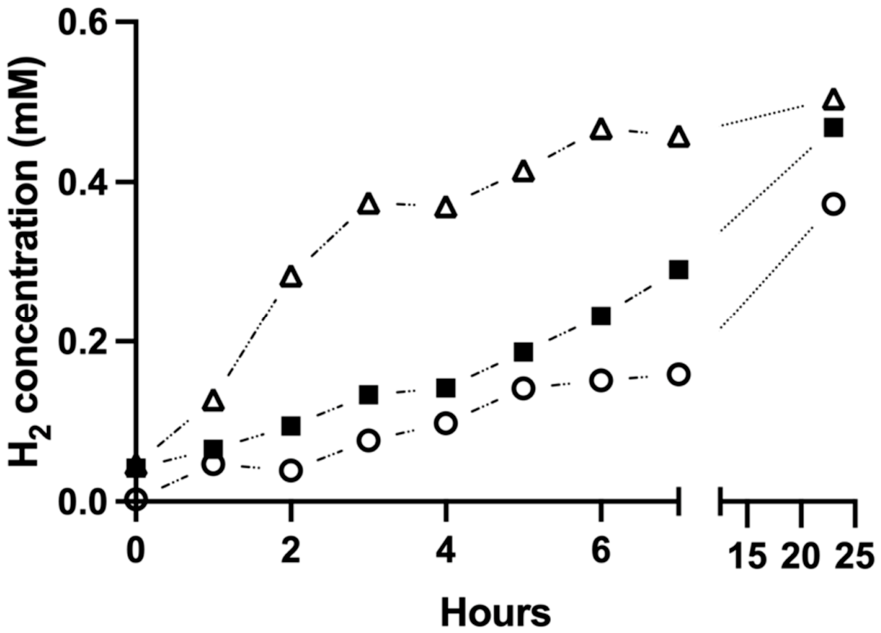
H
2 was supplied at a constant rate of 1.0 × 10
−2 mol·h
−1. The increase in dissolved H
2 concentration depended strongly on the delivery method (
Figure 2). The highest mass transfer rate was observed for the silicone tube configuration, with a slope of 0.1139 mM·h
−1 (R
2 = 0.9848), followed by the sparger (0.0303 mM·h
−1, R
2 = 0.9871) and direct bubbling (0.0214 mM·h
−1, R
2 = 0.8270).
These results indicate that H2 mass transfer was approximately 3.8-fold lower with sparging and 5.3-fold lower with bubbling than with silicone tube diffusion. Despite identical H2 input rates, only a fraction of the supplied H2 was retained in the liquid phase under abiotic conditions. For the silicone tube system, a rate of 0.1139 mM·h−1 corresponds to 1.139 mmol H2·h−1 in a 10 L reactor, whereas 10 mmol H2·h−1 was supplied. This implies that approximately 89% of the H2 was not retained in the liquid phase, most likely due to gas stripping and off-gassing in this open system. Notably, across all tested configurations, a substantial fraction of the supplied H2 failed to dissolve into the liquid phase. However, this observation is largely attributable to the experimental design—i.e., operating as an open system and using water as the medium, which inherently has low H2 solubility. Consequently, these results should be interpreted with caution and are not directly representative of systems in which biological H2 consumption occurs, where continuous uptake can significantly enhance effective mass transfer and retention.
The differences in H
2 transfer observed in
Figure 2 can be mechanistically explained by distinct transport regimes governing gas–liquid mass transfer in bubbling systems versus membrane-mediated diffusion. In sparging and bubbling configurations, hydrogen transfer is described by the volumetric mass transfer coefficient (K
La), where the rate depends on the liquid-side mass transfer coefficient (K
L) and the gas–liquid interfacial area (a) provided by dispersed bubbles. The relatively low initial slopes observed in the sparger and bubbling systems reflect inherent limitations of this regime, including bubble coalescence, short gas residence times, and inefficient gas utilisation, which result in substantial hydrogen losses.
In contrast, the silicone tube system operates under a diffusion-controlled regime, where hydrogen transport is governed by Fickian diffusion through the polymer wall. The significantly higher initial slope observed in
Figure 2 (0.1139 mM·h
−1) indicates enhanced mass transfer under these conditions. The absence of visible bubble formation reduces stripping losses and provides a stable and extended effective transfer area.
In biological systems, dissolved hydrogen is typically maintained at very low levels (in the µM range) due to rapid consumption by hydrogenotrophic microorganisms [
15]. This continuous consumption sustains a steep concentration gradient across the membrane, thereby further enhancing diffusive flux.
Although the initial mass transfer rates differ substantially, dissolved hydrogen concentrations converge after prolonged operation (~24 h) and approach the thermodynamic solubility limit (~0.7 mM at 37 °C). This indicates that, in the absence of biological consumption, equilibrium solubility ultimately constrains the system, whereas the observed differences in initial slopes primarily reflect differences in mass-transfer kinetics.
The superior performance of the silicone tube can thus be attributed to the transition from a KLa-limited regime to a diffusion-controlled regime, which is particularly advantageous for poorly soluble gases such as hydrogen.
To enable quantitative comparison between the bubble-based delivery strategies, volumetric mass transfer coefficients (K𝐿a) were estimated from the initial H
2 dissolution rates (slopes from
Figure 2) and the driving force (C* − C𝐿), where C* is the equilibrium dissolved H
2 concentration at 37 °C and 1 atm (≈0.7 mM) and C𝐿 ≈ 0 mM at t = 0. This yields K𝐿a = slope/C*, giving: sparger: 0.043 h
−1 (1.2 × 10
−5 s
−1); direct bubbling: 0.031 h
−1 (8.6 × 10
−6 s
−1). It should be noted that K𝐿a is not an appropriate descriptor for the silicone tube system, where H
2 transport occurs via Fickian diffusion through the polymer wall rather than across a gas–liquid interface. Mass transfer performance of the silicone tube is therefore more appropriately characterised by the experimentally determined H
2 flux of 2.22 × 10
−5 mol·s
−1·m
−2, as reported in
Section 3.1. These K𝐿a estimates are condition-specific (150 rpm, 1.0 × 10
−2 mol H
2·h
−1) and should not be extrapolated beyond the tested operating window.
3.1. Diffusion Through Silicone Tubing
The diffusion coefficient of H2 in silicone rubber was experimentally determined using a stirred reactor system. H2 gas was supplied to a closed-end silicone tube at a controlled flow rate of 240 mL·h−1. After saturation of the tube wall, H2 diffused radially through the silicone into the surrounding liquid phase.
The diffusion coefficient was determined to be 1.4 × 10
−10 m
2·s
−1, which is consistent with literature values reported for H
2 diffusion in elastomeric materials such as nitrile butadiene rubber (NBR), EPDM, and fluorocarbon rubbers, typically in the range of 10
−11–10
−10 m
2·s
−1. The inner surface area of the silicone tube (0.125 m
2) was used to calculate the H
2 flux. Based on the supplied H
2 flow rate, the resulting flux was 2.22 ×10
−5 mol H
2·s
−1·m
−2. To estimate the required tubing length for a given H
2 delivery rate, the following expression was used:
Equation (1) describes steady-state radial diffusion through a cylindrical membrane, relating H2 flux to the concentration gradient and membrane geometry. QtH represents the quantity of diffusing H2 (), a is the outer diameter, and b is the inner diameter. D: the diameter of the tubing (m), Cout: is the H2 concentration on the outside (), Cin: is the H2 concentration inside ().
3.2. Selection of H2 Delivery Strategy and Experimental Design
Based on the results described above, H2 was supplied to the bioreactor via diffusion through submerged dead-end silicone tubing, which offered the highest mass-transfer efficiency. To evaluate the effect of H2 addition on biomethanation, two experimental configurations were investigated: an in situ and an ex situ setup. While parallel biological experiments across all three delivery strategies would allow direct comparison of biological performance, the experiments were intentionally limited to silicone-based delivery, as this strategy demonstrated the highest mass-transfer efficiency in the abiotic comparison. The abiotic mass transfer data provide a reliable proxy for comparing relative H2 availability across strategies.
In the in situ configuration, H2 and an organic substrate were supplied to a single reactor, allowing simultaneous activity of fermentative/acetogenic microorganisms and hydrogenotrophic archaea. In this configuration, H2 addition may interfere with upstream conversion processes, for example, by thermodynamically inhibiting syntrophic oxidation steps that produce acetate and CO2.
In the ex situ configuration, two reactors were operated in series. The first reactor was used for biogas production from organic substrates, while H2 was added only in the second reactor. As a result, CH4 formation in the second reactor was driven exclusively by hydrogenotrophic methanogenesis, thereby eliminating potential interference with upstream microbial processes.
3.3. In Situ Biomethanation
In the in situ setup, biomethanation was performed in a stirred reactor (R1) equipped with a 10 m submerged dead-end silicone tube for H2 addition. A control reactor (R0), also equipped with a silicone tube but without H2 addition, was operated in parallel to quantify biogas production from the organic substrate alone.
Organic substrate (10 g day
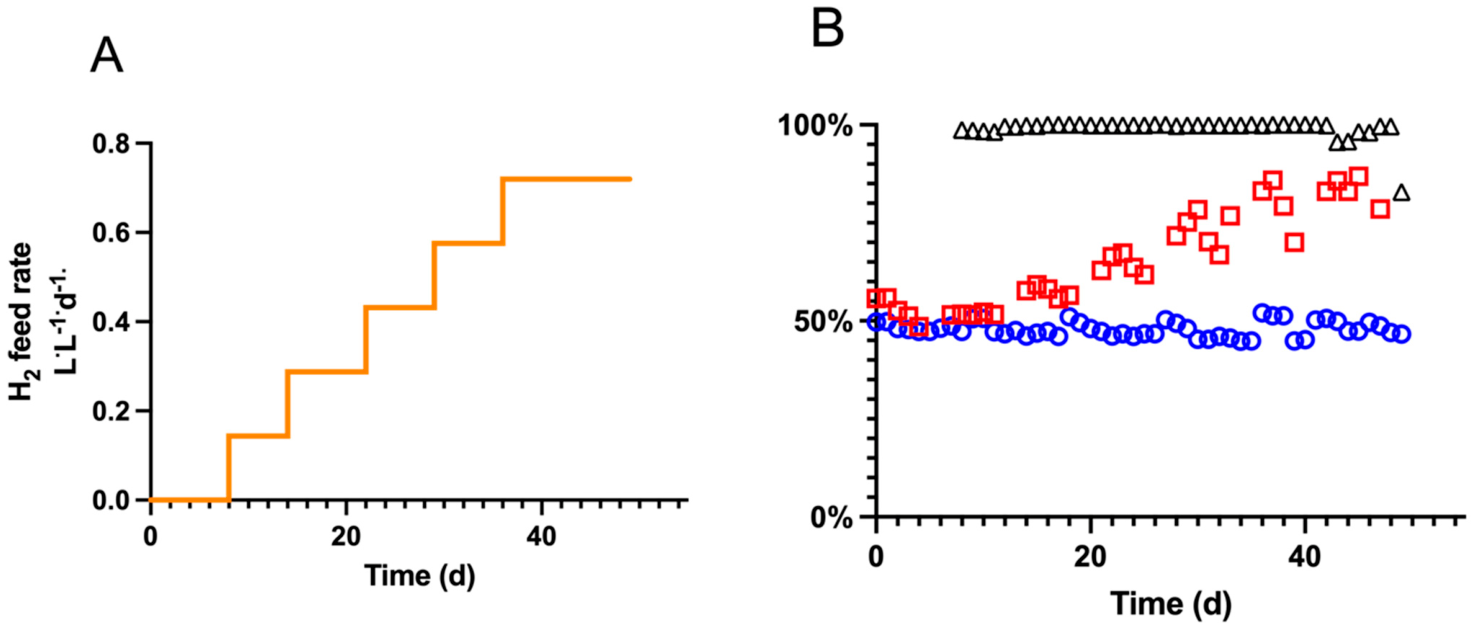
−1) was supplied to both reactors. The H
2 loading rate in R1 was gradually increased over time (
Figure 3A), resulting in a progressive shift in biogas composition. During the initial phase without H
2 addition, both reactors exhibited similar CH
4 fractions (~48%), indicating comparable baseline performance.
Upon H
2 addition, the CH
4 fraction in R1 increased from ~48% to ~85%, accompanied by a corresponding decrease in CO
2 concentration (
Figure 3B). No H
2 accumulation was detected in the biogas, indicating efficient consumption by hydrogenotrophic methanogens. Although alternative H
2-consuming pathways, such as homoacetogenesis, cannot be entirely ruled out, the pH remained stable throughout the experiment, which argues against substantial acetate formation via this route. Nevertheless, any acetate produced could subsequently be converted to CH
4 and CO
2 by acetoclastic methanogens. From a process perspective, the net effect on overall methane production remains comparable, although the underlying metabolic routes may differ.
The increase in the CH4 fraction indicates that exogenous H2 was effectively converted to CH4 via CO2, thereby enhancing the overall CH4 yield at constant substrate loading. The organic loading rate (OLR) was deliberately kept relatively low (0.82 g ODM·L−1·d−1) to limit biogas production. This ensured sufficient residence time for hydrogenotrophic methanogenesis and maximised the detectable impact of H2 addition on gas composition. At higher OLRs, increased gas production rates would reduce gas–liquid contact time, thereby masking the effect of H2 addition on CH4 enrichment. The absence of detectable H2 in the headspace indicates that H2 transfer and microbial consumption were well balanced. This suggests that hydrogenotrophic methanogenesis proceeded under kinetically favourable conditions, preventing H2 accumulation and associated thermodynamic inhibition of upstream syntrophic processes.
Analysis of the H
2 conversion efficiency data (
Figure 3B and
Figure 4B) reveals that peak conversion efficiency reached approximately 95% at the lowest H
2 loading rates tested. Only a minor decline in efficiency was observed as the H
2 loading rate increased, and this variation is within the range attributable to short-term operational disturbances rather than a systematic effect. The small magnitude of this change does not clearly indicate a transition from biologically rate-limited to mass-transfer-limited operation over the tested range. These observations are consistent with the K
La values reported in
Section 3 and indicate that the silicone-based delivery system sustained high H
2 conversion efficiency across the tested loading rates.
3.4. Ex Situ Biomethanation
In the ex situ configuration, two reactors were operated in series: a biogas production reactor (R1.1) and a downstream biomethanation reactor (R1.2). Reactor R1.1 was fed with the organic substrate, and the produced biogas was continuously transferred to R1.2. H2 was supplied exclusively to R1.2 via diffusion through a submerged 10 m dead-end silicone tube, enabling the conversion of CO2 into CH4 by hydrogenotrophic archaea.
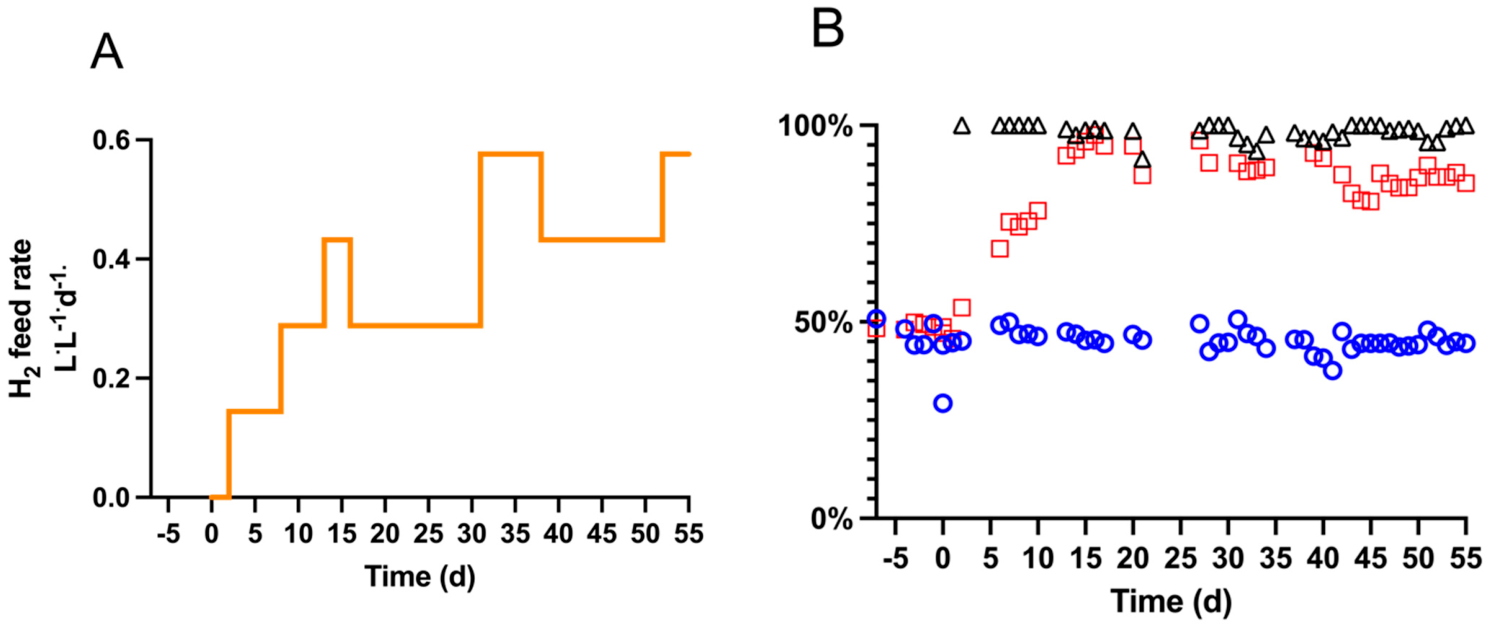
The H
2 loading rate in R1.2 was increased stepwise over time (
Figure 4A). This resulted in a progressive increase in CH
4 content in the biogas from approximately 48% to >85% (
Figure 4B). The increase in CH
4 fraction was accompanied by a corresponding decrease in CO
2 concentration, indicating effective hydrogenotrophic methanogenesis.
No H2 was detected in the reactor headspace throughout the experiment, indicating near-complete H2 consumption under all operating conditions. This suggests that H2 transfer and microbial uptake were well balanced, preventing H2 accumulation in the gas phase. The more pronounced CH4 yield observed in the ex situ configuration is consistent with the spatial separation of fermentation and hydrogenotrophic methanogenesis. This prevents hydrogen-induced inhibition of upstream microbial pathways, allowing independent optimisation of mass transfer and microbial activity. Microbial community dynamics and H2 partial pressure were not directly measured in this study; mechanistic interpretation is therefore based on indirect indicators and supporting literature.
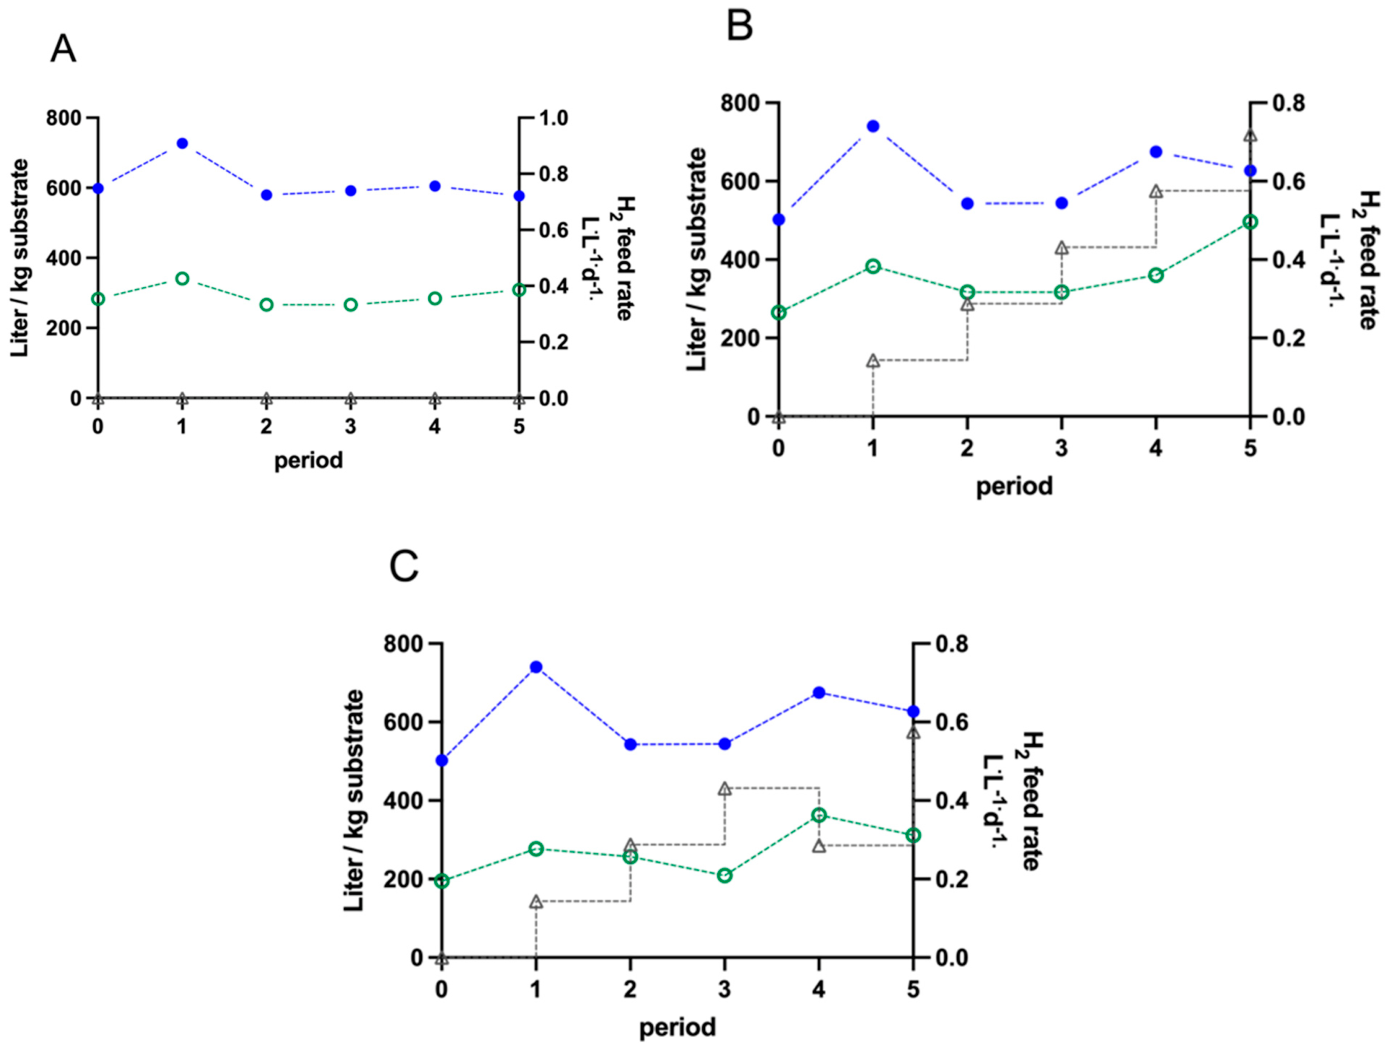
3.5. Comparison of Control, In Situ and Ex Situ Configurations
Three configurations were compared: a control reactor without H2 addition; an in situ setup with H2 addition in the biogas reactor; and an ex situ setup with H2 addition in a downstream reactor. The experiments were evaluated over sequential operational periods, each representing approximately seven days.
In the control reactor (
Figure 5A), both total biogas production and CH
4 yield remained stable over time, indicating steady-state operation in the absence of H
2 addition.
In the in situ configuration (
Figure 5B), total biogas production remained comparable to the control, while the CH
4 yield increased with increasing H
2 supply. This indicates that H
2 addition enhanced CH
4 formation without affecting the overall substrate conversion rate.
In the ex situ configuration (
Figure 5C), a similar trend was observed, with constant biogas production and a more pronounced increase in CH
4 yield compared to the in situ setup. This reflects more efficient conversion of CO
2 into CH
4 in the dedicated downstream reactor. In contrast to the in situ system, where CO
2 is continuously produced during upstream fermentation and acetogenesis, the ex situ configuration decouples CO
2 generation from hydrogenotrophic methanation. As a result, CO
2 conversion is not offset by simultaneous production, and hydrogen is utilised more selectively by methanogens. In addition, competition for H
2 from alternative pathways, such as homoacetogenesis, is reduced under ex situ conditions.
Furthermore, the improved performance of the ex situ system is consistent with the mass-transfer results obtained in this study. The silicone-based H2 delivery system enhances gas–liquid transfer and, combined with continuous biological H2 consumption, thereby maintains a steep concentration gradient and promotes efficient hydrogen utilisation. This coupling of favourable mass transfer and biological conversion is more effectively realised in the dedicated ex situ reactor.
Across all configurations, the total biogas production remained essentially unchanged, indicating that H2 addition did not increase overall gas production. Instead, the increase in CH4 yield in the in situ and ex situ systems indicates that H2 was primarily used to upgrade the biogas composition by converting CO2 to CH4. This effect was most pronounced in the ex situ configuration, where spatial separation of biogas production and hydrogenotrophic methanogenesis enabled more efficient CH4 enrichment. The ex situ configuration is therefore more favourable, as it decouples biological conversion steps and allows independent optimisation of gas transfer and microbial activity. The constant CH4 production further suggests that the partial pressure of H2 remained low throughout the experiments, likely due to rapid microbial consumption, thereby preventing thermodynamic inhibition of upstream fermentation processes. These results indicate that H2 addition does not increase the total extent of substrate conversion, but instead redistributes carbon from CO2 to CH4. Biomethanation thus functions as a gas-upgrading step that enhances CH4 content by converting CO2, rather than as a process that enhances overall substrate degradation.
4. Green Gas Production
Biogas was biologically upgraded to bioCH4 via hydrogenotrophic methanation, in which CO2 is converted to CH4 using H2 via the Sabatier reaction (CO2 + 4 H2 → CH4 + 2 H2O). In both in situ and ex situ configurations, total biogas production remained essentially unchanged, while CH4 content increased significantly. This indicates that biological upgrading enhances gas quality by converting CO2 into CH4 rather than increasing total gas production. This distinction is essential when evaluating process performance, as improvements in CH4 yield originate from CO2 conversion rather than increased organic matter degradation.
From an energy perspective, this conversion is associated with an intrinsic loss due to water formation. The reaction results in an energy difference of approximately 70 kJ per mol CO
2 converted, corresponding to an energy loss of ~7% relative to the input H
2. Despite this loss, upgrading substantially increases the gas’s calorific value. For example, raw biogas with ~60% CH
4 has a Higher Heating Value (HHV) of approximately 23.3 MJ·Nm
−3. In contrast, upgraded bioCH
4 (~95% CH4) has an HHV of ~35.2 MJ·Nm
−3, making it suitable for injection into natural gas grids [
16].
The partial pressure of H
2 strongly governs process stability during biological upgrading. Elevated H
2 concentrations can inhibit syntrophic oxidation processes and lead to the accumulation of intermediates such as propionate and butyrate, whereas low H
2 partial pressures favour CH
4 formation [
17]. The absence of H
2 in the reactor headspace in this study indicates that H
2 was rapidly consumed, maintaining favourable thermodynamic conditions and preventing inhibition of upstream microbial processes.
In addition to H
2, CO
2 and bicarbonate concentrations, process stability is critical. CO
2 consumption during methanation reduces bicarbonate alkalinity, thereby increasing pH and decreasing buffer capacity. Excessive CO
2 removal can therefore destabilise the system if not properly controlled [
18]. This highlights the importance of balancing H
2 supply with available CO
2 to maintain both efficient conversion and stable reactor conditions.
Compared with physicochemical upgrading technologies such as water scrubbing, pressure swing adsorption (PSA), membrane separation, and cryogenic upgrading, biological methanation offers the advantage of directly converting CO
2 into additional CH
4 rather than relying on physical removal. While conventional upgrading technologies consume energy without increasing CH
4 yield, biological upgrading enhances carbon conversion efficiency. However, these technologies generally achieve higher volumetric productivity and are more established at an industrial scale [
19].
The cost of producing green gas using PSA technology has been reported to range from 0.05 to 0.063 €·Nm
−3, with operational expenses—primarily electricity consumption—being the dominant cost component [
20]. In parallel, the cost of supplying biogenic CO
2 as a feedstock is estimated at USD 15–30 per ton of CO
2 [
21], which influences the economic feasibility of upgrading pathways.
Biological methanation is particularly attractive when H
2 is produced via electrolysis using surplus renewable electricity. In this context, the process functions as a Power-to-CH
4 (P2M) system, enabling the storage of intermittent renewable energy as CH
4 and facilitating integration with existing gas infrastructure [
22].
4.1. Green Gas Utilisation and Environmental Impact
Using upgraded biogas from organic waste offers significant environmental benefits. Compared to fossil-based synthetic natural gas (SNG), bioCH
4 can reduce greenhouse gas (GHG) emissions by approximately 60 g CO
2-eq·MJ
−1, depending on the feedstock and upgrading pathway [
23]. This reduction is primarily attributable to the carbon’s renewable origin and the avoidance of fossil carbon emissions.
In addition to direct emission reductions, biological upgrading improves carbon utilisation efficiency by converting CO2 into CH4, thereby increasing the gas’s energy density without additional fossil inputs. This is particularly relevant in the context of Power-to-CH4 (P2M) systems, where H2 produced via electrolysis using surplus renewable electricity is combined with biogenic CO2.
The implementation of P2M technology enables both energy storage and carbon valorisation, facilitating the integration of intermittent renewable energy sources such as wind and solar into existing energy systems [
24]. By converting excess electricity into CH
4, P2M provides a flexible pathway for long-term energy storage and grid balancing, while simultaneously reducing greenhouse gas emissions.
4.2. Practical Implications of H2 Supply in Biomethanation Systems
Efficient biomethanation critically depends on the transfer of H
2 from the gas phase to the liquid phase, which is typically the rate-limiting step [
11]. Strategies to enhance H
2 mass transfer, such as increasing gas recirculation rates and reducing bubble size, have been shown to improve reactor performance [
8,
25]. Alternatively, membrane-based gas delivery systems, such as silicone tubing, provide a bubble-free approach that can reduce gas losses and improve transfer efficiency [
10].
Insufficient H
2 transfer results in H
2 accumulation in the reactor headspace, potentially affecting process stability and microbial activity [
6]. In contrast, diffusion-based delivery via submerged silicone tubing enables controlled H
2 supply directly to the liquid phase, where hydrogenotrophic microorganisms can rapidly consume it. This mechanism supports efficient conversion of CO
2 to CH
4 under both in situ and ex situ conditions [
26].
The diffusion of H2 through silicone membranes can be described by Fick’s law, where the concentration gradient and the diffusion coefficient govern flux. Although this approach is effective at the laboratory scale, scaling it to industrial biogas upgrading remains challenging.
The scale-up estimate was derived as follows. All gas volumes are reported at standard conditions (0 °C, 1 atm; i.e., Nm3). The H2 demand for upgrading 3000 m3 biogas day−1 containing 60% CH4 and 40% CO2 to 88% CH4 was calculated from the stoichiometry of hydrogenotrophic methanation (CO2 + 4 H2 → CH4 + 2 H2O). Achieving this methane concentration requires conversion of 840 m3 CO2 day−1 (70% of the initial CO2 fraction), corresponding to an H2 demand of 3360 m3 H2 day−1, or 1.74 mol H2 s−1.
Using the experimentally determined H2 flux of 2.22 × 10⁻⁵ mol H2 m−2 s−1, the required membrane surface area was calculated to be approximately 7.84 × 10⁴ m2. For hollow-fibre tubing with an inner diameter of 4 mm and outer diameter of 6 mm (1 mm wall thickness), this corresponds to approximately 4.16 × 10⁶ m of tubing, equivalent to roughly 4160 km of membrane length based on the external surface area (A = πDL).
This membrane requirement corresponds to a physical tubing volume of approximately 118 m3. Assuming realistic packing densities of 30–50%, the equivalent reactor volume required to accommodate this amount of tubing would be in the range of 200–400 m3, highlighting the substantial spatial footprint of such a membrane system at full scale.
The Crank-based diffusion model and the experimentally determined H2 flux represent fundamentally different quantities and should therefore not be directly compared. The Crank approach uses the hydrogen diffusion coefficient in silicone (D = 1.4 × 10⁻¹⁰ m2 s−1) to estimate theoretical membrane transport based solely on diffusion physics. In contrast, the experimentally measured H2 flux reflects overall reactor performance, integrating membrane diffusion, hydrogen solubility, gas–liquid mass transfer, reactor hydrodynamics, microbial consumption, and biofilm effects. Consequently, the Crank model provides a theoretical transport limit, whereas the experimental flux reflects practical system performance under real operating conditions.
For comparison, the radial diffusion model of John Crank [
27] predicts a substantially larger required membrane length, on the order of 10
8 m at 1 bar. Despite the differences in methodology, both approaches indicate membrane requirements that exceed practical engineering limits by several orders of magnitude. These results demonstrate that direct scale-up of silicone membrane-based H
2 delivery, under the conditions evaluated here, is currently impractical in stirred-tank reactors. A scenario analysis was performed using the experimentally determined H
2 flux as the baseline, rather than relying solely on theoretical diffusion coefficients. This approach provides a more realistic engineering assessment, as the measured flux integrates membrane diffusion, gas–liquid transfer, reactor hydrodynamics, and microbial consumption. Several scenarios representing progressive improvements in H
2 transfer performance were evaluated, including increased operating pressure, reduced membrane wall thickness, and improved mass transfer conditions (
Table 1).
Calculations are based on the experimentally determined H2 flux (2.22 × 10−5 mol H2 m−2 s−1) under baseline conditions (1 bar, 1 mm wall thickness). Scenario calculations assume, as an optimistic upper bound, that H2 flux scales proportionally with operating pressure and inversely with membrane wall thickness. In practice, liquid-side and biofilm resistances would reduce the achievable gains. Reactor volume was estimated assuming tubing packing densities of 30–50%. The outer tube diameter was held constant at 6 mm across all scenarios; only the diffusion path length (wall thickness) was varied. The table shows that increasing operating pressure and reducing membrane wall thickness substantially decreases the required tubing length and reactor volume. Under the most favourable scenario considered (6 bar, 1 mm wall thickness), the required tubing length decreases from 4.16 × 10⁶ m (1 bar, 1 mm) to 6.93 × 10⁵ m (6 bar, 1 mm), representing a sixfold reduction. Despite this improvement, the required membrane length remains on the order of hundreds of kilometres, while reactor volumes remain in the tens of cubic metres. These results indicate that although engineering optimisation can significantly improve performance, direct scale-up of silicone tubing-based H2 delivery remains challenging for full-scale stirred-tank biomethanation.
Techno-economic context. A full techno-economic analysis (TEA) with capital and operational cost modelling is beyond the scope of this proof-of-concept study. It is identified as a priority for future work. However, published cost benchmarks provide useful context. Silicone tubing for laboratory and industrial use is commercially available at approximately 1–5 €·m−1 (bulk pricing), implying material costs alone in the range of 125–1060 M€ for the tubing quantities, which is prohibitive for large-scale deployment. For comparison, H2 supply via alkaline electrolysis using surplus renewable electricity is currently estimated at 2–5 €·kg−1 H2, depending on electrolyser cost and electricity price. PSA biogas upgrading costs 0.05–0.063 €·Nm−3 of upgraded gas, while sparging-based biological methanation systems have been reported to have comparable or lower capital intensity than membrane-based approaches, though with lower mass-transfer efficiency per unit volume. Trickle-bed reactors (TBRs) offer a more favourable surface-area-to-volume ratio and are currently regarded as the most cost-effective configuration for dedicated ex situ biomethanation at scale. These comparisons reinforce the conclusion that silicone diffusion is best positioned as a retrofit or polishing technology rather than a primary scale-up strategy.
Despite these improvements, membrane-based H
2 delivery remains challenging at a large scale. Additional factors, such as biofouling, material compatibility (e.g., sensitivity to H
2S), and reactor hydrodynamics, must be considered for long-term operation. Consequently, alternative H
2 delivery strategies—such as gas recirculation, advanced sparging systems, or hybrid membrane–bubble systems—should be evaluated for industrial applications [
27]. Consequently, alternative reactor configurations with higher gas–liquid interfacial area, such as trickle bed reactors, are more promising for industrial implementation.
4.3. Future Research on Biomethanation
The current study was limited to short-term proof-of-concept operation, and long-term degradation mechanisms were not quantified. For practical deployment of silicone-based H
2 delivery, several materials and biological degradation processes must be considered. First, biofilm formation on the outer membrane surface has been reported to reduce gas permeability over time by increasing the effective diffusion barrier; regular cleaning or anti-fouling surface treatments may therefore be required [
28]. Second, mineral scaling—driven by carbonate and struvite precipitation under the alkaline conditions typical of anaerobic digesters—can occlude membrane pores and reduce active surface area [
29]. Third, hydrogen sulphide (H
2S), typically present at 100–3000 ppm in biogas, readily permeates through silicone rubber membranes due to its high solubility in PDMS. While this permeability may be exploited for H
2S removal, prolonged exposure to H
2S-containing biogas may affect the mechanical integrity of silicone tubing over time; however, the extent of material degradation under the conditions typical of anaerobic digestion has not been systematically characterised. These degradation mechanisms represent open questions for future work and should be systematically characterised under realistic long-term operating conditions before scaled deployment can be considered.
The use of silicone tubing for H2 delivery is highly effective at the laboratory scale. Still, it poses significant challenges to direct scale-up in stirred-tank reactors, primarily due to the required tubing length and the associated reactor volume. Rather than disqualifying silicone-based diffusion as a viable technology, these limitations define the operational window in which it is most valuable: as a bubble-free, retrofit-compatible H2 delivery strategy for existing anaerobic digesters. A considerable installed base of CSTR-type biogas reactors is already operating, and upgrading such systems typically faces significant economic and spatial constraints. Submerged silicone tubing offers a pathway to enhance H2 mass transfer in these existing reactors without major structural modifications, thereby enabling partial biogas upgrading within the current infrastructure. In this context, silicone diffusion is best positioned as a complementary technology: suitable for moderate H2 loading rates, polishing steps, or retrofitting scenarios where construction of a dedicated upgrading reactor is not feasible.
For greenfield installations and high-throughput industrial applications, alternative reactor configurations with higher gas–liquid interfacial area are more appropriate. A promising approach is to implement a two-stage system that combines a continuously stirred tank reactor (CSTR) for biogas production with a downstream trickle-bed reactor (TBR) for ex situ biomethanation. In such a configuration, biogas generated in the CSTR is upgraded in the TBR by contacting it with H2 gas over a biofilm, thereby improving gas–liquid mass transfer and process efficiency. Silicone-based diffusion and TBR technology should therefore be regarded as complementary rather than competing strategies: the former targets retrofitting of existing infrastructure. At the same time, the latter addresses high-capacity, dedicated biomethanation at an industrial scale. Hybrid configurations, in which diffusion-based H2 delivery is integrated within TBR or other high-surface-area reactor concepts, may further extend the applicability of membrane-based H2 supply.
Based on these considerations, construction of a pilot-scale TBR has been initiated at EnTranCe (Centre of Expertise Energy, Groningen). This dedicated hydrogen research hub provides access to renewable H2 production and energy management infrastructure through the REMO platform. This setting enables direct coupling of biomethanation research with electrolysis-based H2 supply from intermittent renewable sources, thereby bridging laboratory-scale findings and system-level Power-to-Methane implementation. Future research should focus on optimising H2 distribution, reactor hydrodynamics, biofilm stability, and long-term operational performance, and on evaluating the feasibility of scale-up and integration with renewable H2 supply systems via the REMO infrastructure. In parallel, further development of silicone-based diffusion systems—including reinforced tubing for higher operating pressures, thinner membrane walls, and integration within high-surface-area reactor geometries—is required to fully exploit their potential as a retrofit technology for existing anaerobic digesters.




 ,
,