2. Literature Review and Research Gap
Strategic energy investment has become a multidimensional decision problem shaped by the simultaneous pressure of decarbonization, energy security, affordability, technological transformation, and market uncertainty. Countries no longer evaluate energy investments only through installed capacity or cost reduction; instead, they must balance renewable energy expansion, grid modernization, storage readiness, energy efficiency, supply diversification, and emerging low-carbon technologies such as green hydrogen. Recent studies show that energy transition investments are closely connected with climate risk, energy security, green innovation, policy stringency, finance, and socio-economic justice. Bashir et al. [
1], for example, link renewable energy investment and energy transition to the mitigation of energy security risks in major energy-consuming economies, while Tamasiga et al. [
2] emphasize that sustainable energy futures must also address socio-economic justice. Similarly, Khaleel and Yusupov [
3] underline the importance of finance, policy, infrastructure, and demand-side integration in advancing sustainable energy transitions. This is also consistent with Shears et al. [
4], who show that climate and energy transition risks are increasingly managed by financial institutions, and with Bergougui et al. [
5], who connect digitalization and environmental technology with energy security outcomes. These studies suggest that energy investment prioritization cannot be treated as a purely technical or financial optimization problem; it requires a broader decision-support structure that reflects national energy systems, institutional capacity, market volatility, and resource endowment.
The complexity of energy investment is further reinforced by the changing role of both traditional and emerging energy sectors. Dongo and Relvas [
6] show that oil- and gas-producing countries face specific challenges in redefining their position within the energy transition, whereas Delpisheh et al. [
7] emphasize the economic, technological, and policy dimensions required for advancing the hydrogen economy. Storage and hybrid systems are also becoming central to investment decisions. D’Adamo et al. [
8] examine PV and battery energy storage systems as drivers of sustainable transition, indicating that renewable expansion increasingly depends on complementary flexibility technologies. At the same time, Maghyereh et al. [
9] show that green innovation and environmental policy stringency influence energy transition investments, while Lin and Xie [
10] connect digital finance to energy transition through green investment mechanisms. Taken together, these studies indicate that energy investment readiness differs across countries because each system combines different levels of renewable potential, financial capacity, regulatory quality, fossil fuel dependence, demand pressure, and market risk.
Multi-criteria decision-making (MCDM) methods have been widely used to address such complexity in energy decision problems. MCDM has supported renewable energy technology selection, energy policy prioritization, energy security evaluation, sustainability assessment, microgrid architecture design, energy infrastructure planning, and site selection. Commonly applied methods include the analytic hierarchy process (AHP), best–worst method (BWM), Technique for Order Preference by Similarity to Ideal Solution (TOPSIS), VIseKriterijumska Optimizacija I Kompromisno Resenje (VIKOR), Preference Ranking Organization Method for Enrichment Evaluation (PROMETHEE), Measurement Alternatives and Ranking according to Compromise Solution (MARCOS), Combined Compromise Solution (CoCoSo), entropy, Criteria Importance Through Intercriteria Correlation (CRITIC), and fuzzy extensions. Recent studies continue to show the value of fuzzy MCDM under uncertainty. Vijay et al. [
11] use a probabilistic hesitant fuzzy MCDM approach to assess renewable energy microgrid architectures, Başeğmez [
12] develops a hybrid geographic information system (GIS)-fuzzy MCDM and game-theoretic framework for offshore wind farm siting, Morady et al. [
13] rank renewable energy resources for different climatic zones through fuzzy MCDM, and Razavian et al. [
14] apply interval-valued Fermatean fuzzy MCDM to analyze barriers in sustainable urban digital twin systems. These studies demonstrate that fuzzy MCDM is useful when uncertainty, ambiguity, and conflicting criteria are present.
Despite this usefulness, many fuzzy MCDM applications still depend heavily on expert-derived linguistic scores for both weights and alternative performance values. Expert judgment is valuable when tacit knowledge is needed, but exclusive reliance on expert evaluations may reduce reproducibility, transparency, and cross-country comparability. In many energy MCDM studies, fuzzy numbers are assigned through linguistic categories such as “low,” “medium,” or “high,” which are then converted into triangular or interval-valued fuzzy values. This captures subjective uncertainty but does not always reflect empirical uncertainty observed in real energy systems. Variables such as electricity price volatility, renewable generation variability, energy import dependence, carbon intensity, and demand growth are measurable through secondary data. Therefore, fuzzy values can be generated from empirical distributions, historical variation, or scenario bands rather than relying only on expert judgment. This creates an opportunity to shift fuzzy MCDM from an expert-opinion-based ranking tool toward a more reproducible, data-driven decision-support architecture.
The decision support systems literature provides the broader foundation for this shift. Decision support system (DSS) research emphasizes the need to support complex, semi-structured, and uncertain decisions by combining data, models, user interaction, and explanation. Recent artificial intelligence (AI)-supported DSS studies increasingly highlight trust, transparency, data quality, explainability, human control, and sociotechnical alignment. Bondac et al. [
15] emphasize the importance of trust, transparency, and data quality in AI-based decision support for complex systems. Rezaeian et al. [
16] show that explainability and AI confidence influence trust, diagnostic performance, and cognitive load in decision-support settings. Gerdes [
17] similarly underlines the role of explainability in AI-supported decision-making, while Kaltenbrunner [
18] stresses the need to preserve human control in shared decision-making with AI-enabled DSS. This is also consistent with Strunk et al. [
19], who argue that risks in AI-based decision support should be treated as multidimensional rather than uniform, and with Behrens et al. [
20], who stress sociotechnical alignment in intelligent DSS. Although many of these contributions come from domains outside energy, their implications are directly relevant: a DSS should not merely generate a ranking, but should also justify why a recommendation is produced, how sensitive it is to assumptions, and how it changes under different decision contexts.
Large language models (LLMs) can support this architecture, particularly at the criterion extraction and documentation stage. Recent studies show that LLMs and generative AI can assist in knowledge extraction, technical data extraction, literature screening, and evidence structuring. Duranti et al. [
21] discuss LLM-driven knowledge extraction in structured logical settings, while Kong et al. [
22] develop a generative AI-based tool for technical data extraction in IoT application systems. Spillias et al. [
23] evaluate generative AI for qualitative data extraction in the community-based fisheries management literature. Expert-calibrated LLM frameworks, such as the one proposed by Mobadersani et al. [
24], further suggest that LLMs can support structured decision processes when combined with human validation. In the proposed framework, LLMs are not used as final decision makers; they serve as an assisted knowledge extraction layer for identifying and organizing energy investment criteria from policy and strategic documents. The final ranking remains grounded in measurable secondary data and formal decision models.
Explainability and personalization are also necessary because a single universal ranking may not reflect stakeholder diversity. A public energy planner may prioritize energy security, affordability, social welfare, and decarbonization. A private investor may focus on market size, macroeconomic stability, institutional quality, and return potential. A grid operator may prioritize demand growth, renewable variability, price volatility, and flexibility needs. A sustainability-oriented policymaker may emphasize carbon intensity, renewable share, and long-term transition pathways. Therefore, persona-based decision support can produce stakeholder-sensitive rankings rather than a static one-size-fits-all result. Fairness is also important because rankings may favor high-income countries, countries with mature institutions, or countries with already developed renewable infrastructure, while resource-rich but financially constrained countries may be penalized. A fairness-aware DSS should therefore reveal whether a low ranking reflects structural disadvantage, policy weakness, market risk, or technical limitations.
Finally, conventional MCDM robustness analysis is often limited to changing criterion weights and observing rank variation. While useful, this does not fully capture the behavioral diversity of decision environments. Recent developments in AI-supported and hybrid DSS indicate the value of simulation and agentic decision modeling. Nozari and Szmelter-Jarosz [
25], for example, integrate agentic AI and evolutionary optimization in a hybrid DSS for reverse logistics, while Morić et al. [
26] demonstrate the use of Bayesian networks in AI-based decision support. The need for hybrid evidence structures is also supported by Lu et al. [
27], who develop a knowledge-data-structure fusion weighting model. For energy investment prioritization, simulated-agent analysis can complement traditional sensitivity analysis by testing whether rankings remain stable under heterogeneous synthetic preference profiles. Overall, the literature reveals a clear methodological gap: energy transition studies recognize multidimensional investment challenges, fuzzy MCDM provides tools for uncertainty, and DSS research emphasizes explainability and personalization, yet these streams are rarely combined in a secondary-data-driven, stakeholder-sensitive, and explainable country-level screening framework. The present study addresses this gap by implementing a reproducible secondary-data decision matrix, baseline and objective-weighting comparisons, persona-based rankings, explainability, fairness diagnostics, external validation, and simulated-agent robustness analysis, while treating fuzzy-interval and causal/LLM-salience elements as methodological extensions.
Recent LLM, fuzzy MCDM, and causal-weighting studies further support the modular extensions of the present framework, particularly the use of LLM-based knowledge extraction, hybrid fuzzy optimization, intuitionistic and Fermatean fuzzy assessment, and balancing-weight logic for causal inference [
28,
29,
30,
31,
32,
33,
34,
35,
36].
Additional literature-positioning and comparison materials are provided in
Supplementary File S1. This section focuses on the core literature logic needed to position the research gap.
3. Materials and Methods
3.1. Materials, Data Sources, and Country Sample
The materials used in the empirical application consist of publicly available secondary data covering macroeconomic, institutional, electricity-system, sustainability, market, and technical-resource indicators. Macroeconomic indicators such as gross domestic product (GDP) per capita, GDP growth, inflation, foreign direct investment (FDI) inflows, and energy import dependence were obtained from the World Bank World Development Indicators (WDI) [
37]. Institutional indicators, namely regulatory quality and government effectiveness, were obtained from the World Bank Worldwide Governance Indicators (WGI) [
38]. Electricity and decarbonization indicators, including fossil electricity share, renewable electricity share, electricity carbon intensity, electricity demand, and net electricity imports, were derived from Our World in Data (OWID) and Ember-based electricity datasets [
39,
40]. Renewable installed capacity was based on renewable energy statistics reported through the International Renewable Energy Agency (IRENA) and related public energy datasets [
41]. Solar irradiance and wind speed were derived from National Aeronautics and Space Administration (NASA) POWER indicators using representative country-level coordinates [
42,
43]. Electricity demand growth was calculated from electricity consumption values, while electricity price volatility was operationalized as a proxy indicator based on available country-level electricity-price sources, including Eurostat, European Network of Transmission System Operators for Electricity (ENTSO-E)-related European price data, and supplementary national or international price references where comparable Eurostat data were not available [
44,
45]. Countryeconomy was used as a supplementary source for electricity consumption and generation values required for selected calculated indicators [
46]. The study includes 36 countries: the EU-27 member states, the United Kingdom, Norway, Switzerland, Türkiye, the United States, Canada, Japan, South Korea, and Australia. This sample was selected because these countries provide relatively strong access to comparable secondary data, represent diverse energy systems and investment conditions, and are relevant to energy transition and strategic investment planning.
No chemicals, reagents, devices, instruments, commercial cell lines, biological samples, or laboratory materials were used in this study, as the empirical analysis was based entirely on publicly available secondary data. Data compilation, cleaning, normalization, descriptive analysis, weighting calculations, ranking procedures, correlation analysis, sensitivity checks, and visualization were performed using Microsoft Excel for Microsoft 365 (Microsoft Corporation, Redmond, WA, USA) and Python 3.11 (Python Software Foundation, Wilmington, DE, USA). The Python analysis used the pandas, NumPy 2.5.0, SciPy 1.18.0, scikit-learn 1.9, and Matplotlib 3.11.0 packages for data processing, statistical calculation, robustness testing, and figure generation.
3.2. Decision Alternatives and Investment-Readiness Criteria
The empirical application ranks countries according to their relative readiness and attractiveness for strategic energy investment. Therefore, the country is treated as the decision alternative in the baseline application. A higher score indicates that a country shows stronger readiness under the combined criteria of macroeconomic feasibility, institutional capacity, energy security, sustainability, market conditions, and technical resource potential. The framework is also designed to support pathway-specific interpretation for strategic energy options such as solar photovoltaic (PV), wind, battery storage, grid modernization, energy efficiency, green hydrogen, and other low-carbon technologies. The criteria were organized into six dimensions and 18 indicators. The first dimension, macroeconomic feasibility, includes GDP per capita, GDP growth, inflation, and FDI inflows. The second dimension, institutional capacity, includes regulatory quality and government effectiveness. The third dimension, energy security, includes energy import dependence, fossil electricity share, and net electricity imports as a share of demand. The fourth dimension, sustainability and decarbonization, includes renewable electricity share, renewable installed capacity, electricity carbon intensity, and carbon dioxide (CO2) emissions per capita. The fifth dimension, market and demand conditions, includes electricity demand, electricity demand growth, and electricity price volatility. The sixth dimension, technical resource potential, includes solar irradiance and wind speed at 50 m.
To improve cross-country data comparability, the empirical design prioritized internationally harmonized data sources wherever possible. The normalization procedure reduces differences in units and scales, and the benefit/cost classification ensures directional consistency before scoring. However, normalization cannot fully eliminate differences in national reporting systems, electricity-market design, wholesale and retail price definitions, interconnection structures, or the spatial resolution of solar and wind resource data. Therefore, the resulting rankings should be interpreted as strategic, country-level screening outputs rather than as precise project-level investment assessments. All criteria were classified as either benefit or cost indicators before normalization. Benefit indicators are those for which higher values indicate stronger investment readiness or potential, while cost indicators are those for which higher values imply greater risk, weakness, or transition pressure. The criteria dictionary is summarized in
Table 1, and additional assumptions, proxy decisions, source notes, and calculation details are documented in
Supplementary File S1.
Several indicators require methodological caution because they are calculated indicators, proxy indicators, or screening-level technical-resource measures. Electricity demand growth, net electricity imports share, electricity price volatility, solar irradiance, and wind speed are therefore interpreted as country-level screening signals rather than project-level feasibility measures. Detailed source, comparability, and proxy notes for these indicators are provided in
Supplementary File S1, Table S1.6.
3.4. Decision Support Architecture and Analytical Procedures
3.4.1. Overview of the Proposed DSS Architecture
The proposed methodology is designed as a secondary-data-driven decision support framework with AI-assisted criterion documentation and a fuzzy-interval extension, rather than as a fully autonomous AI system or a complete dynamic fuzzy-panel ranking model. Its purpose is to rank countries according to strategic energy investment readiness, explain how rankings are formed, show how they change across decision-maker profiles, and demonstrate how uncertainty can be represented when sufficient historical data are available. This design is appropriate because strategic energy investment involves conflicting criteria, heterogeneous stakeholder priorities, uncertain market conditions, and cross-country differences in energy systems, institutions, demand patterns, and renewable resource potential.
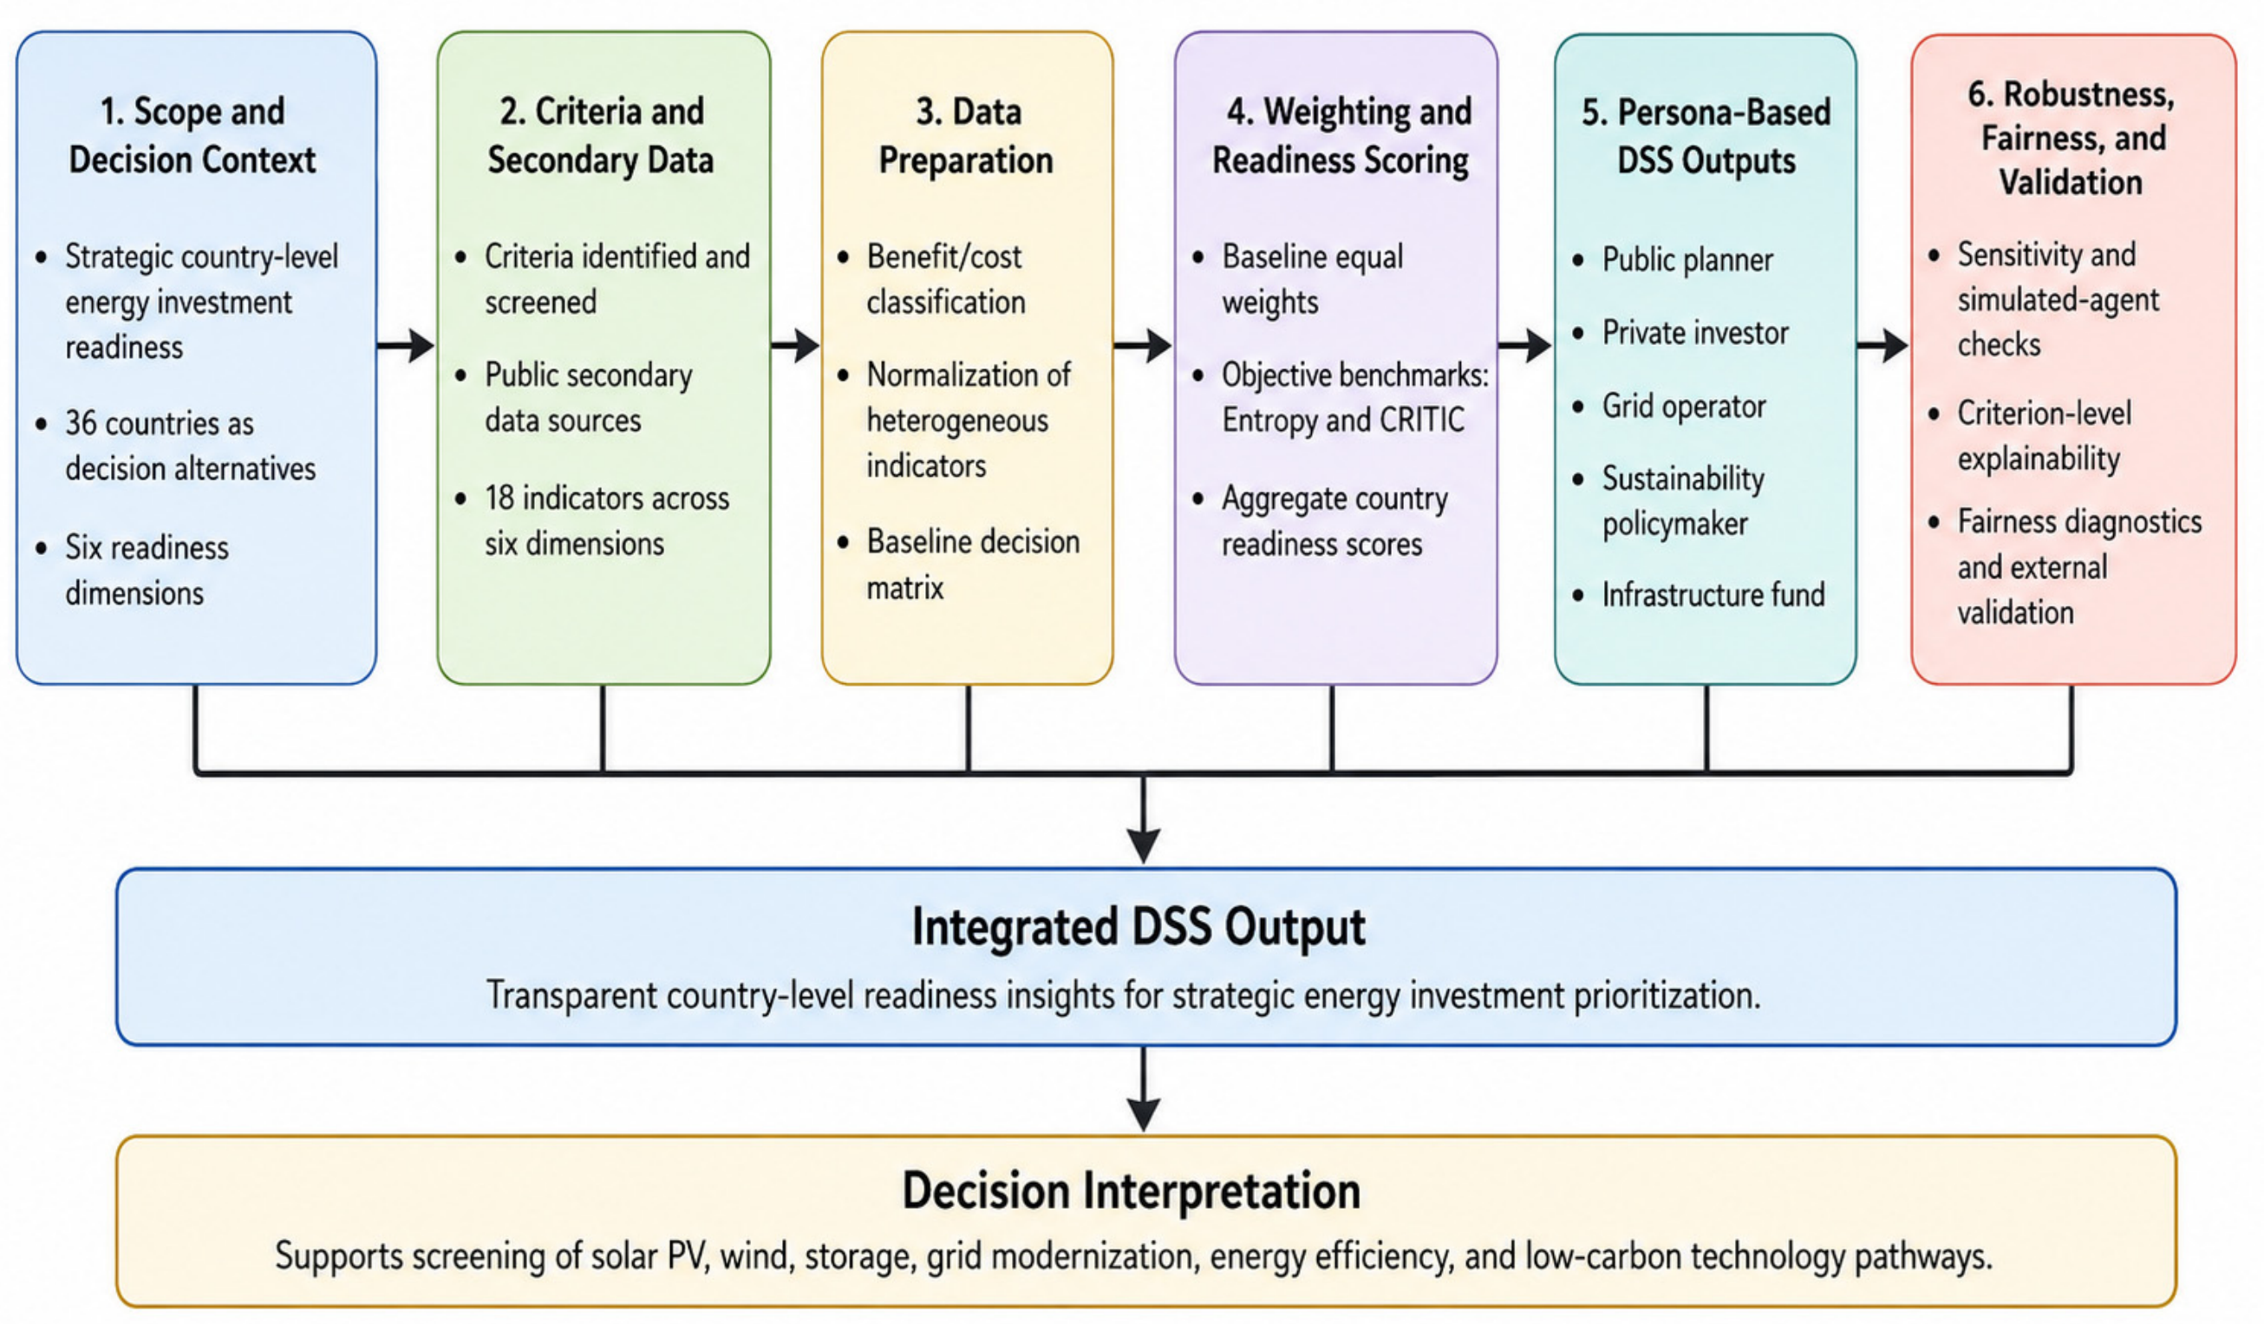
The architecture consists of eight connected stages. First, policy and strategy documents are used as a knowledge base for identifying energy investment criteria. A large language model (LLM)-assisted extraction layer identifies recurring decision dimensions and terminology, but it is not used as an autonomous decision maker. Second, the extracted criteria are matched with measurable secondary indicators to construct a country-level decision matrix. In the empirical application, the alternatives are 36 countries and the criteria consist of 18 indicators grouped under macroeconomic feasibility, institutional capacity, energy security, sustainability and decarbonization, market and demand conditions, and technical resource potential. The full data matrix and source notes are provided in
Supplementary File S1.
Third, raw data are transformed into comparable values through benefit/cost classification and normalization. Fourth, the framework specifies an uncertainty-sensitive fuzzy-interval extension. Instead of assigning fuzzy numbers only from expert linguistic evaluations, fuzzy intervals can be generated from empirical evidence such as historical variation, distributional ranges, scenario bands, and observed volatility. In the present application, the latest available normalized values are used for the baseline ranking, while the panel-based fuzzy interval procedure is presented as an illustrative extension for criteria with sufficient time-series coverage.
Fifth, the model allows multiple weighting schemes, but the empirical baseline is intentionally transparent. Equal weights are used for the main readiness ranking, while entropy, Criteria Importance Through Intercriteria Correlation (CRITIC), and hybrid entropy-CRITIC weights are reported as objective robustness benchmarks. Causal-evidence weighting and LLM-assisted salience weighting remain modular extensions because validated causal-effect sizes and auditable salience matrices are not used to produce the current baseline ranking. Sixth, multi-criteria readiness scoring generates investment-readiness scores. Seventh, persona-specific decision profiles are created for public planners, private investors, grid operators, sustainability-oriented policymakers, and infrastructure funds. Eighth, fairness, explainability, and validation layers are added through criterion-level contributions, fairness checks, and simulated-agent validation.
Figure 1 illustrates the workflow of the analysis.
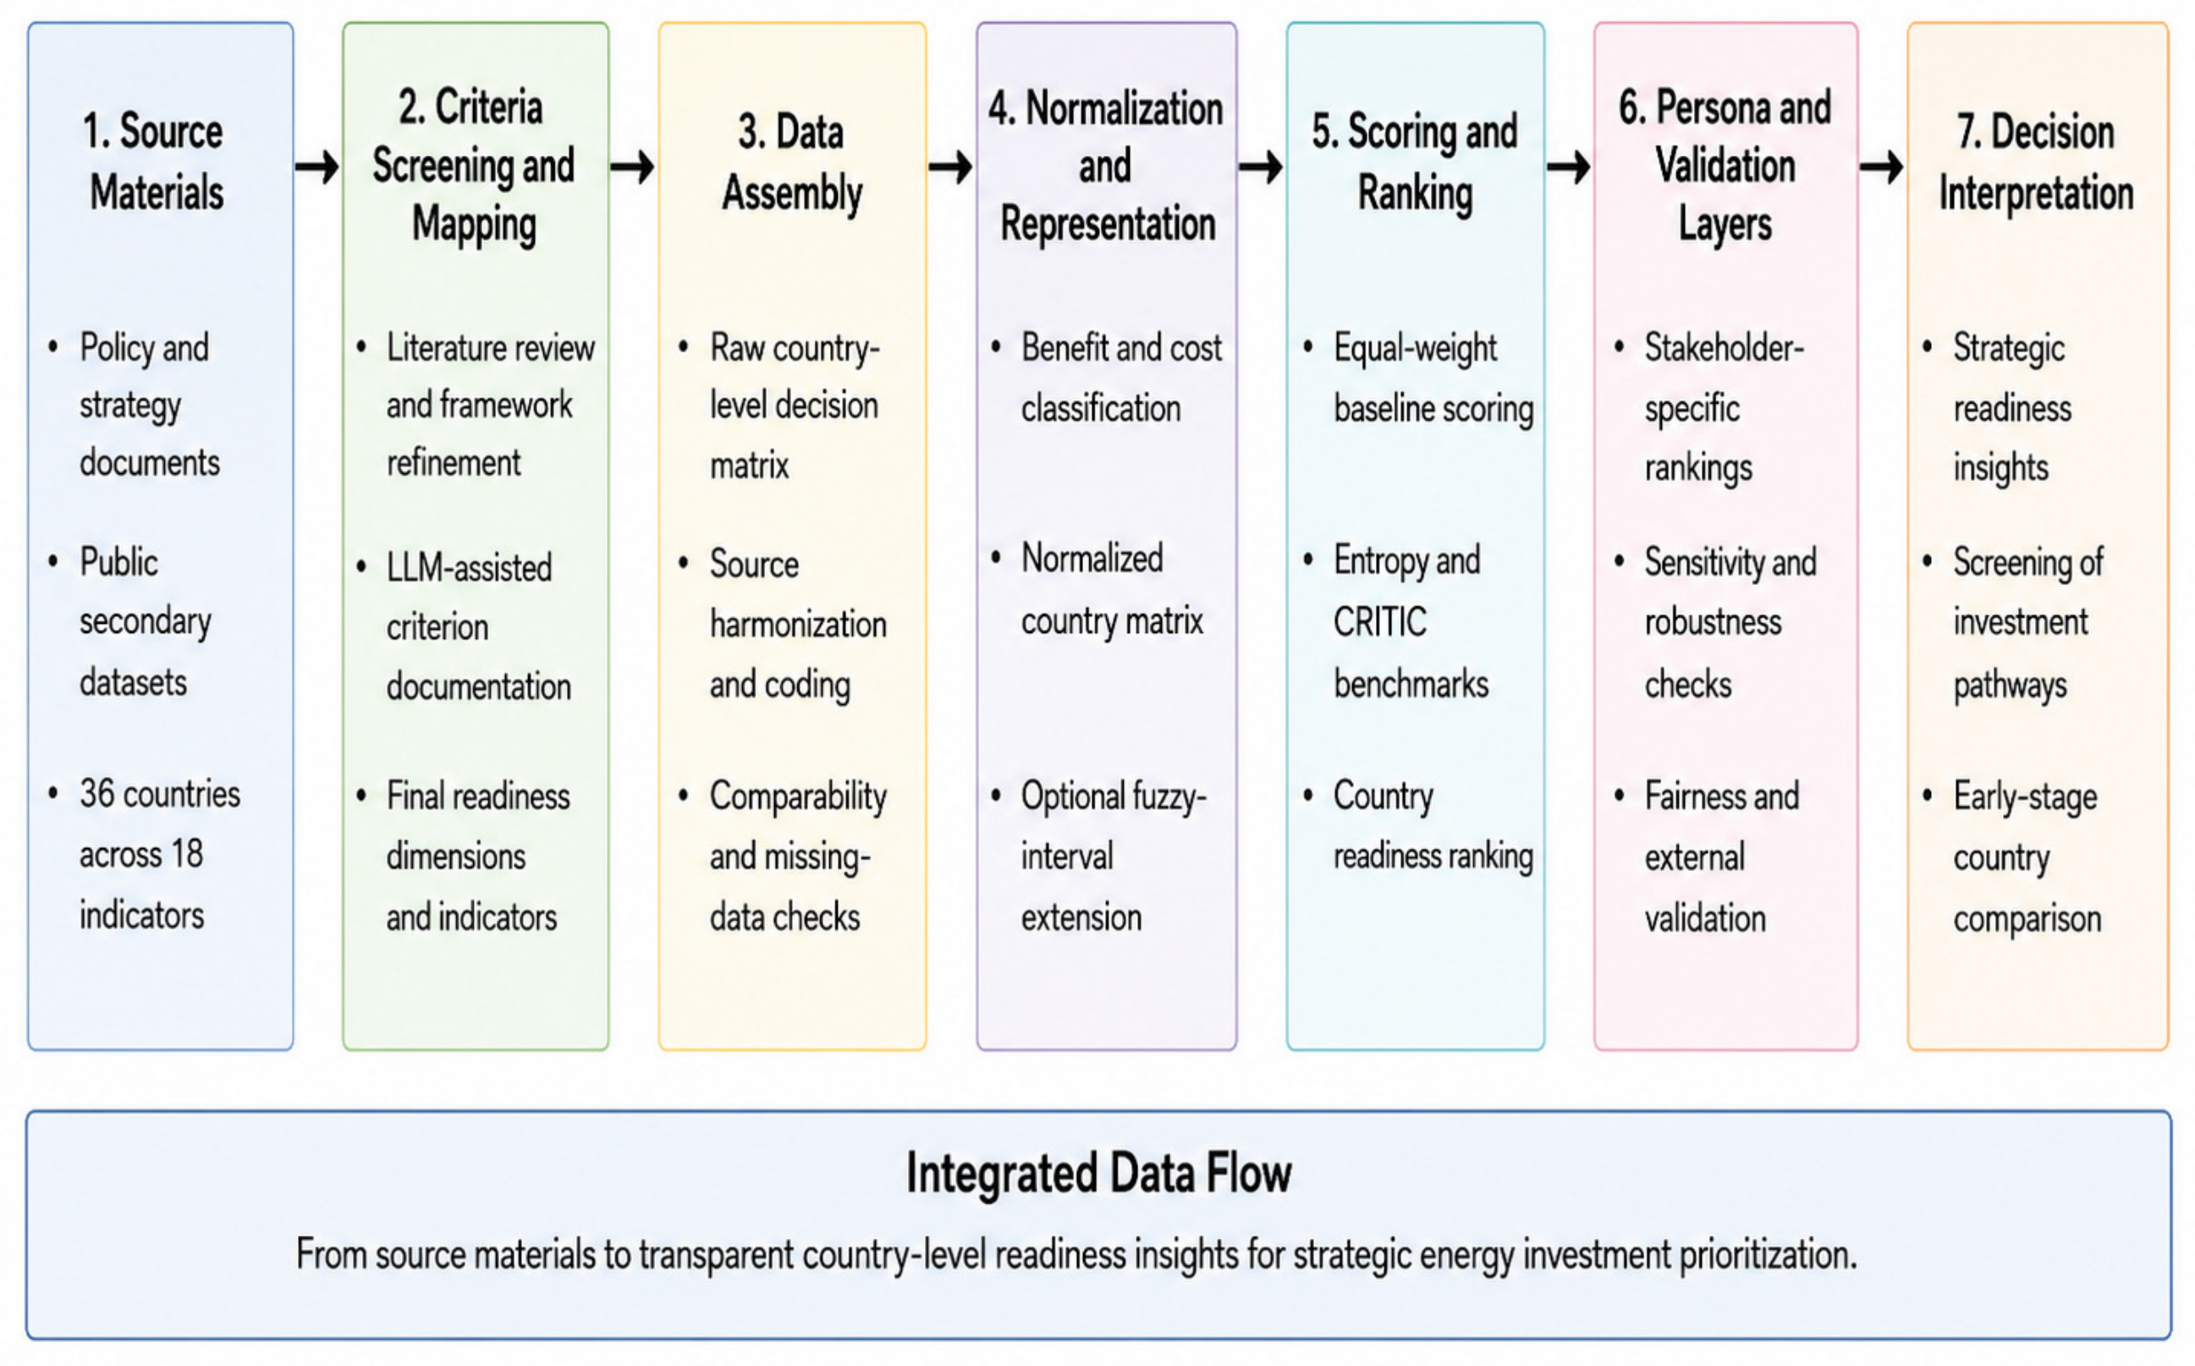
To complement the conceptual workflow in
Figure 1,
Figure 2 traces the data flow from raw document and indicator collection to normalization, fuzzy representation, weighting, ranking, validation, and investment-readiness interpretation. This companion figure clarifies which inputs are transformed at each stage and how the empirical outputs used in the results section are produced.
Figure 1 and
Figure 2 summarize the methodological workflow and data-processing route. A detailed implementation-status table identifying which components are empirically implemented and which remain modular extensions is provided in
Supplementary File S1, Table S1.7.
3.4.2. Large Language Model (LLM)-Assisted Criterion Extraction
The LLM-assisted stage was used only to support criterion discovery, semantic grouping, measurable-indicator mapping, and documentation. It did not score countries, assign final weights, generate rankings, define fuzzy values, conduct fairness diagnostics, or validate results. Candidate criteria were retained only after research-team review confirmed their relevance to strategic energy investment readiness, public-data availability, cross-country comparability, clear benefit/cost direction, and non-duplication.
Full details of the LLM-assisted document-corpus logic, prompt templates, extraction protocol, human-validation rules, bias-control checklist, criteria-to-indicator mapping, and reproducibility checklist are provided in
Supplementary File S2, Sections S2.3–S2.9 and S2.11.
3.4.3. Secondary-Data Decision Matrix Construction
After the criteria are identified and mapped, a secondary-data decision matrix is constructed. In the empirical application, the decision alternatives are countries, and the criteria are 18 indicators representing macroeconomic feasibility, institutional capacity, energy security, sustainability and decarbonization, market and demand conditions, and technical resource potential. The decision matrix is defined as
where
denotes the observed value of country
on criterion
,
represents the number of countries, and
represents the number of criteria. The matrix is built from public secondary sources, including World Bank WDI, World Bank WGI, Our World in Data, Ember, IRENA, NASA POWER, Countryeconomy, Eurostat, ENTSO-E-related sources, and supplementary electricity price references. The complete raw matrix and latest-year coverage notes are provided in
Supplementary File S1, Tables S1.2 and S1.3.
3.4.4. Benefit/Cost Classification and Normalization
Because the criteria are measured in different units, normalization is required before weighting and ranking. Each criterion is classified as either a benefit or cost indicator. Benefit criteria are those for which higher values indicate stronger investment readiness, such as GDP per capita, GDP growth, FDI inflows, renewable electricity share, renewable installed capacity, electricity demand, solar irradiance, and wind speed. Cost criteria are those for which higher values indicate greater risk or weaker readiness, such as inflation, energy import dependence, fossil electricity share, electricity carbon intensity, CO2 emissions per capita, net electricity imports as a share of demand, and electricity price volatility.
For benefit criteria, normalized values are calculated as
For cost criteria, normalized values are calculated as
This produces a normalized matrix, where all values range between 0 and 1 and higher values consistently indicate stronger strategic energy investment readiness.
3.4.5. Uncertainty-Sensitive Fuzzy-Interval Extension
The framework allows normalized values to be represented as triangular fuzzy numbers when sufficient historical or scenario data are available. In the present empirical application, the baseline ranking is calculated from the latest available normalized decision matrix. The fuzzy-interval layer is therefore treated as an uncertainty-sensitive extension rather than as the primary empirical ranking engine.
When complete panel data are available, lower, modal, and upper fuzzy bounds can be derived from empirical percentiles, volatility bands, or scenario ranges. The illustrative panel-based fuzzy interval procedure is provided in
Supplementary File S1, Table S1.8, because it is treated as an uncertainty-sensitive extension rather than the baseline ranking engine.
3.4.6. Weighting and Baseline Scoring Procedure
The baseline readiness score is calculated using equal criterion weights. This transparent benchmark avoids embedding unobserved stakeholder preferences into the first ranking and allows later comparisons with alternative weighting assumptions. Entropy, CRITIC, and hybrid entropy-CRITIC configurations are used as objective robustness benchmarks.
Causal-evidence weighting and LLM-salience fusion are retained as modular extensions and are not activated in the baseline ranking because independently estimated causal effects and formally validated salience matrices are not available for the current empirical application. The weighting inputs, entropy/CRITIC benchmarks, and weighting-sensitivity details are provided in
Supplementary File S1, Table S1.9.
3.4.7. Baseline Readiness Ranking Procedure
After normalization and weighting, with fuzzy representation retained as an extension, the model calculates investment-readiness scores for each country. In the baseline model, the score is computed as
where represents the readiness score of country. In the fuzzy extension, the score is calculated using fuzzy values:
The fuzzy score can be defuzzified using the centroid method:
Countries are ranked according to . The framework can be implemented through fuzzy Measurement Alternatives and Ranking according to Compromise Solution (MARCOS), fuzzy Combined Compromise Solution (CoCoSo), or fuzzy Double Normalization-Based Multiple Aggregation (DNMA). To maintain interpretability, the study reports the baseline readiness score and uses the fuzzy layer as the uncertainty-sensitive extension.
3.4.8. Persona-Based Personalized Decision Support
A single ranking may be insufficient because energy investment decisions differ across stakeholders. Therefore, the framework creates persona-specific rankings for different decision contexts. Recent AI-enabled and personalized DSS studies emphasize that decision tools should be adapted to user objectives, risk preferences, and operational settings [
47,
48,
49,
50,
51,
52]. In this study, the main personas are public energy planner, private investor, grid operator, sustainability-oriented policymaker, and infrastructure fund.
For each persona, a persona-specific weight vector is defined as
The persona-specific score is then calculated as
A public planner may assign greater weight to energy security, affordability, and decarbonization. A private investor may emphasize macroeconomic feasibility, regulatory quality, market size, and price signals. A grid operator may prioritize demand growth, price volatility, and renewable integration pressure. This allows the DSS to produce stakeholder-sensitive recommendations rather than a single universal ranking.
3.4.9. Fairness and Explainability Layer
The explainability layer decomposes each score into criterion-level contributions:
where
shows how much criterion
contributes to the final score of country
,
represents the weight assigned to criterion
, and
represents the normalized performance value of country
on criterion
. These contributions can also be aggregated by dimension to show whether a country’s ranking is driven by macroeconomic feasibility, institutional capacity, energy security, sustainability, market conditions, or resource potential. This is important because a DSS should justify its outputs rather than only provide a final ranking.
The fairness layer examines whether the ranking systematically favors high-income countries, institutionally mature countries, or countries with already developed renewable infrastructure. A simple diagnostic compares readiness scores with GDP per capita, institutional quality, and technical resource potential. If a country has strong solar or wind potential but ranks lower due to financial or institutional constraints, the model identifies this as a structural investment barrier rather than a lack of energy potential. This allows the DSS to support more balanced interpretation of investment priorities.
3.4.10. Simulated-Agent Validation Laboratory
The simulated-agent validation layer tests whether ranking conclusions remain stable when decision preferences vary across synthetic decision makers. Agents are generated by varying the relative importance assigned to the six readiness dimensions around stakeholder-relevant anchors, and the resulting rankings are compared with the equal-weight baseline using rank-correlation and overlap metrics.
This procedure is used as an additional robustness check rather than as evidence of observed decision-maker behavior. The full agent-generation rules, constraints, and validation-output tables are provided in
Supplementary File S1, Table S1.12.
4. Results
4.1. Cross-Country Variation in Energy Investment Readiness Indicators
The empirical dataset was finalized as an analysis-ready 36-country by 18-criterion matrix covering macroeconomic feasibility, institutional capacity, energy security, sustainability and decarbonization, market and demand conditions, and technical-resource potential. The descriptive results show meaningful cross-country variation in economic capacity, renewable capacity, electricity demand, import dependence, carbon intensity, and technical-resource indicators. The raw country-level matrix and descriptive statistics are provided in
Supplementary File S1, Tables S1.2 and S1.5.
4.2. Countries with the Strongest and Weakest Strategic Investment Readiness
The baseline ranking was calculated using the completed C01–C18 normalized decision matrix under an equal-weighting scheme. In this specification, each criterion receives the same weight, allowing the first ranking to serve as a neutral benchmark before applying persona-specific or alternative weighting structures. The score therefore reflects the average normalized readiness performance of each country across macroeconomic feasibility, institutional capacity, energy security, sustainability and decarbonization, market and demand conditions, and technical resource potential.
Table 2 reports the countries with the highest and lowest baseline strategic investment-readiness scores under the equal-weight model. Norway ranks first, followed by Denmark, the United States, Sweden, and Switzerland. These countries show stronger overall readiness across the combined 18 criteria. At the lower end, Estonia, Bulgaria, Türkiye, Hungary, and Poland record the weakest baseline scores in the sample. These results should not be interpreted as a general statement that one country is “better” than another. Rather, the ranking indicates relative energy investment readiness under the selected criteria and equal-weight assumptions. The full 36-country ranking and descriptive ranking statistics are provided in
Supplementary File S1, Table S1.5.
4.3. Convergent Validity Against Energy-Transition and Investment Benchmarks
To strengthen the empirical relevance of the proposed readiness index, a post-hoc external validation check was added. The baseline readiness score was compared with observable investment- and transition-related benchmarks available from independent public energy and macroeconomic data sources. The validation does not claim causal prediction; rather, it assesses convergent validity by examining whether countries with higher readiness scores also show stronger transition performance or more favorable investment-related outcomes. The external benchmark interpretation was also compared with major transition and investment-attractiveness frameworks, including Climatescope, RECAI, the Climate Change Performance Index, and the Energy Transition Index [
53,
54,
55,
56]. Because some benchmarks are conceptually close to the criteria used in the decision support system, the results should be interpreted as an external outcome-oriented validity check rather than as a fully independent causal test.
Table 3 reports whether the proposed readiness index converges with observable investment and transition benchmarks by presenting Pearson and Spearman correlations: foreign direct investment inflows, renewable electricity share, renewable installed capacity, electricity carbon intensity, and electricity demand. The results show the expected positive association with renewable electricity share and renewable installed capacity, and the expected negative association with electricity carbon intensity. The association with foreign direct investment inflows and electricity demand is positive but weaker, suggesting that the proposed decision support system captures transition readiness and system quality more strongly than general capital inflow or market size alone. The full validation dataset and benchmark-comparison outputs are provided in
Supplementary File S1, Table S1.10.
The comparison with external transition and investment-attractiveness frameworks indicates that the proposed readiness index is aligned with broader energy-transition logic but does not duplicate any single external ranking. The full validation dataset and benchmark-comparison outputs are provided in
Supplementary File S1, Table S1.10.
4.4. How Alternative Weighting Assumptions Affect Country Prioritization
To further address the sensitivity of the weighting stage, an additional weighting-sensitivity check was added using only the weighting configurations that were empirically activated in the present application. Because the causal-effect and LLM-salience components are retained as modular extensions and were not activated in the baseline calculation, no alpha-beta-gamma fusion-parameter scenario is reported as an empirical result at this stage. Instead, the sensitivity analysis compares the equal-weight baseline with entropy, CRITIC, and a hybrid entropy-CRITIC objective weighting configuration calculated from the normalized C01-C18 matrix. This approach clarifies how much the country ranking changes when the model shifts from a neutral baseline to data-structure-sensitive weighting assumptions.
Table 4 shows how alternative weighting assumptions affect country prioritization. The CRITIC configuration is highly consistent with the equal-weight baseline, whereas entropy weighting produces a larger but still acceptable shift because it assigns greater importance to criteria with higher dispersion, especially scale-related variables such as electricity demand and renewable installed capacity. The hybrid entropy-CRITIC configuration remains strongly aligned with the baseline. These findings indicate that the ranking is not dependent on a single equal-weight assumption, while also showing that weighting choices can affect the relative position of some countries when scale-sensitive criteria receive greater emphasis. The underlying weighting inputs and extended sensitivity calculations are provided in
Supplementary File S1, Table S1.9.
Accordingly, the weighting-sensitivity analysis is interpreted as a robustness check for the empirically implemented weighting layer rather than as a full causal-LLM fusion experiment. A full fusion-parameter sensitivity test can be conducted in future dynamic applications when independently estimated causal-effect sizes and formally validated LLM salience scores are available for all criteria.
4.5. National Readiness Profiles Across Six Investment Dimensions
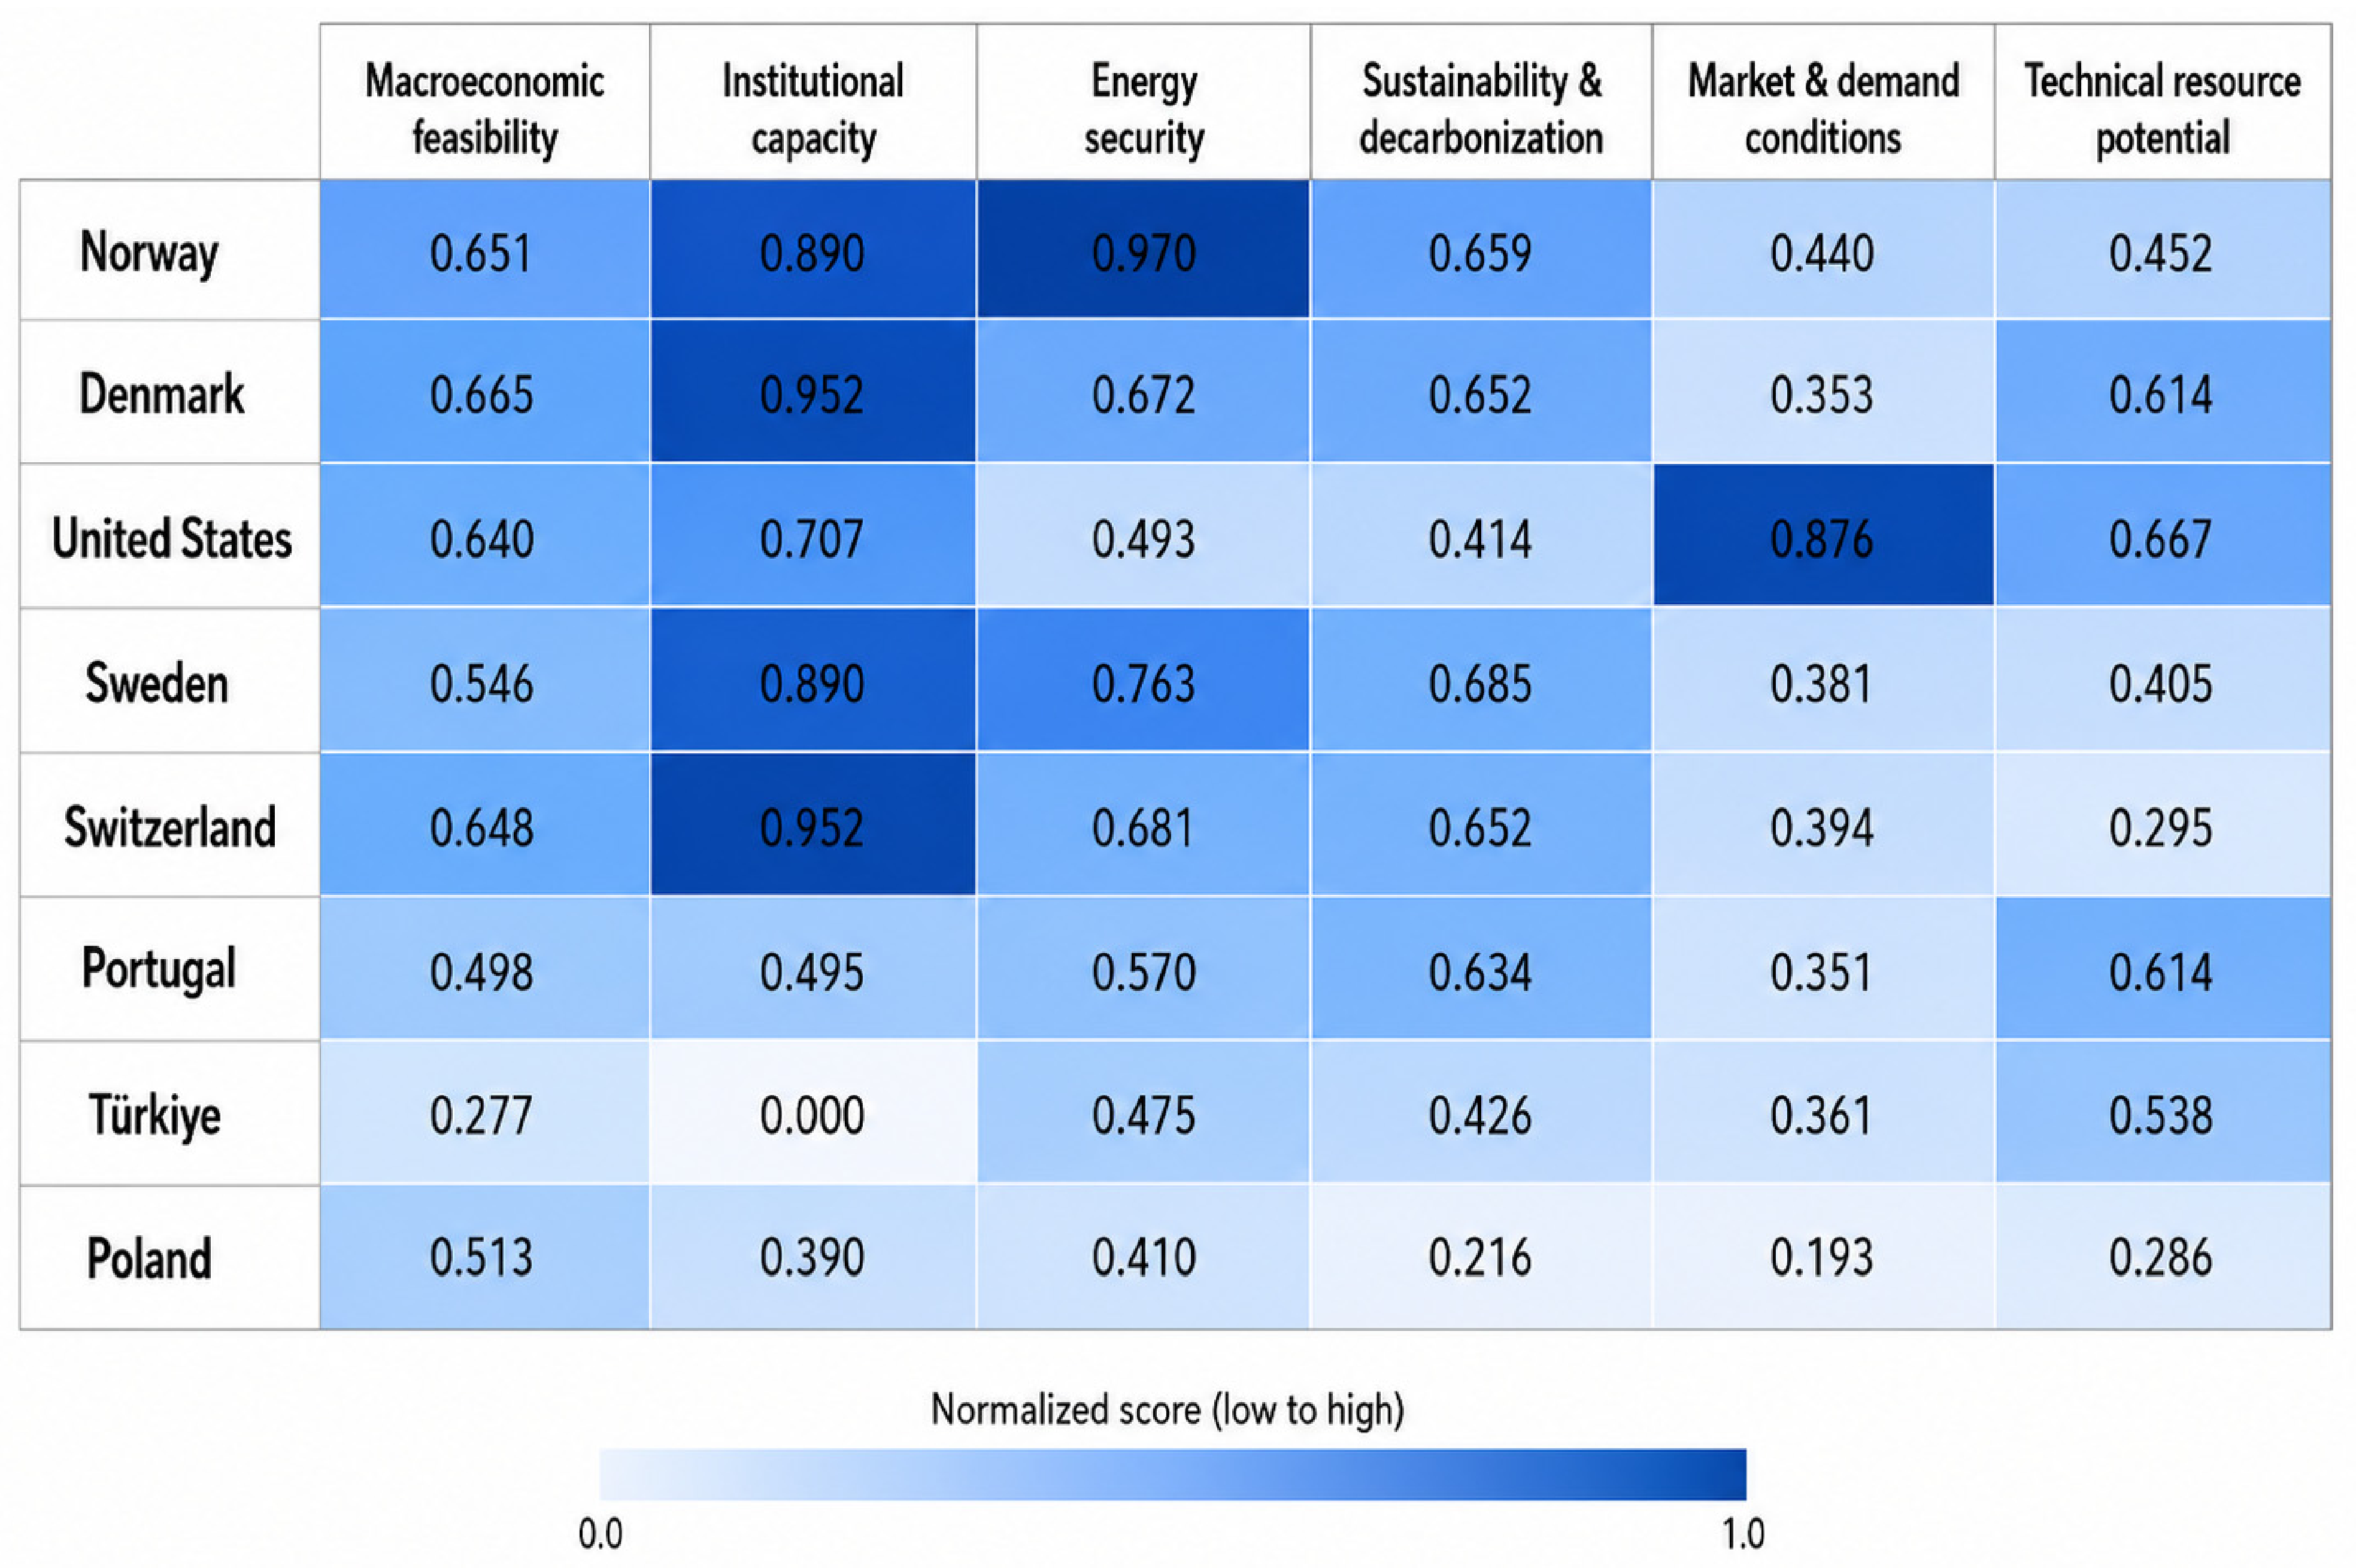
To obtain a more detailed interpretation of the baseline results, the 18 criteria were aggregated into six readiness dimensions: macroeconomic feasibility, institutional capacity, energy security, sustainability and decarbonization, market and demand conditions, and technical resource potential. Each dimension score was calculated as the arithmetic mean of the normalized criteria belonging to that dimension. This allows the analysis to move beyond a single aggregate readiness score and identify the specific areas that drive each country’s investment profile.
Figure 3 presents the dimension-level readiness profiles for selected countries. The selected set includes high-ranked countries, such as Norway, Denmark, the United States, Sweden, and Switzerland, as well as Portugal, Türkiye, and Poland to illustrate mid-range and lower-readiness profiles without overcrowding the figure. The results show that Norway’s strong position is mainly driven by energy security, institutional capacity, and sustainability-related performance. Denmark and Switzerland display balanced profiles, especially in institutional capacity and macroeconomic feasibility. The United States has the strongest market and demand profile, reflecting its large electricity market and investment scale. Sweden performs strongly in sustainability and energy security, while Portugal shows a relatively balanced sustainability and technical resource profile.
By contrast, Türkiye’s profile is more uneven. It shows relatively stronger technical resource potential and market/demand conditions, but weaker institutional and macroeconomic readiness in the normalized matrix. Poland records lower scores particularly in sustainability, market/demand conditions, and technical resource potential. These differences indicate that strategic energy investment readiness is not uniform across countries; rather, each country combines strengths and constraints across different dimensions. The detailed dimension-level scores are provided in
Supplementary File S1, Table S1.16, which reports the six-dimensional readiness profile calculated from the normalized country-criterion matrix.
The dimension-level findings confirm that the DSS captures different readiness configurations.
Figure 3 therefore replaces the longer country-by-dimension table in the main text, while the full dimension-score matrix is provided in
Supplementary File S1, Table S1.16, and the descriptive profile statistics and baseline ranking outputs are provided in
Supplementary File S1, Table S1.5.
4.6. Stakeholder-Specific Differences in Country Prioritization
The persona-based analysis was conducted by recalculating the country scores under five stakeholder-specific weighting structures. Unlike the equal-weight baseline, this stage adjusts the relative importance of the six readiness dimensions according to the likely priorities of different decision makers. The public planner profile gives greater emphasis to energy security and sustainability; the private investor profile prioritizes macroeconomic feasibility, institutional capacity, and market conditions; the grid operator profile focuses more strongly on market/demand conditions and system security; the sustainability policymaker profile assigns the highest weight to sustainability and technical resource potential; and the infrastructure fund profile uses a more balanced long-term investment perspective.
Table 5 reports the exact dimension weights used to generate the five stakeholder-persona rankings. The weights are theory-informed decision profiles derived from the stakeholder priorities discussed in the DSS design. All weights are non-negative and sum to one for each persona.
The public planner profile emphasizes energy security and decarbonization; the private investor profile emphasizes macroeconomic and institutional conditions; the grid operator profile gives the greatest weight to market/demand and system-security dimensions; the sustainability policymaker profile prioritizes decarbonization and technical resource potential; and the infrastructure fund profile uses a more balanced long-term portfolio logic.
Table 6 shows how country prioritization changes across stakeholder-persona viewpoints. Norway remains highly ranked across all profiles, indicating a robust readiness position. However, Denmark becomes the leading country under the sustainability policymaker profile, mainly because of its strong institutional and sustainability-related performance. The United States improves under the private investor and grid operator profiles, reflecting its market scale and demand-side strength. Sweden and Switzerland remain consistently strong, but their relative positions vary depending on whether the decision logic prioritizes sustainability, institutional quality, or market conditions. These differences confirm that the proposed DSS does not generate a single fixed ranking; instead, it produces stakeholder-sensitive investment priorities.
The results demonstrate the personalization capacity of the DSS. Countries with strong institutional and sustainability profiles perform better under public and sustainability-oriented perspectives, whereas countries with large electricity markets and stronger demand-side signals improve under investor and grid-operator profiles. This finding is important because strategic energy investment decisions are not uniform across stakeholders. A government, a private investor, a grid operator, and a sustainability-oriented policymaker may use the same dataset but reach different priority rankings because their decision objectives differ. Therefore, persona-based scoring strengthens the practical value of the framework by allowing the same C01–C18 matrix to support multiple investment decision contexts.
4.7. Stability of Stakeholder Rankings Under Weight Perturbation
Additional sensitivity checks were performed by perturbing the persona dimension weights by ±10% and ±20% around each stakeholder anchor. The results show that the stakeholder-specific rankings remain stable under moderate perturbations, with only limited movement among countries close to one another in the ranking. The full persona-sensitivity outputs are provided in
Supplementary File S1, Table S1.11.
4.8. Readiness Configurations and Country-Level Trade-Offs
The country rankings were interpreted by examining the combinations of readiness dimensions that support or constrain each profile. This analysis shows that similar aggregate scores can emerge from different configurations: some countries are supported by institutional stability and energy security, while others show stronger market, sustainability, or resource-potential signals. Detailed ranking-driver configurations are provided in
Supplementary File S1, Table S1.14.
4.9. Translating Country Readiness into Investment-Area Priorities
Because the framework is intended for early-stage screening, readiness scores should be translated into investment-area implications through the underlying dimension profile. For example, strong technical-resource potential may support solar or wind screening, high price volatility and renewable penetration may point toward storage and grid-flexibility needs, and strong institutional capacity may reduce implementation risk. The detailed investment-area mapping is provided in
Supplementary File S1, Table S1.15.
4.10. Criterion-Level Drivers of Selected Country Rankings
The explainability layer was applied by decomposing each baseline score into criterion-level contributions. Under the equal-weight model, each criterion contributes to the final readiness score according to its normalized value multiplied by the common criterion weight. This makes it possible to identify whether a country’s readiness is mainly driven by institutional quality, energy security, sustainability performance, market scale, or technical resource potential.
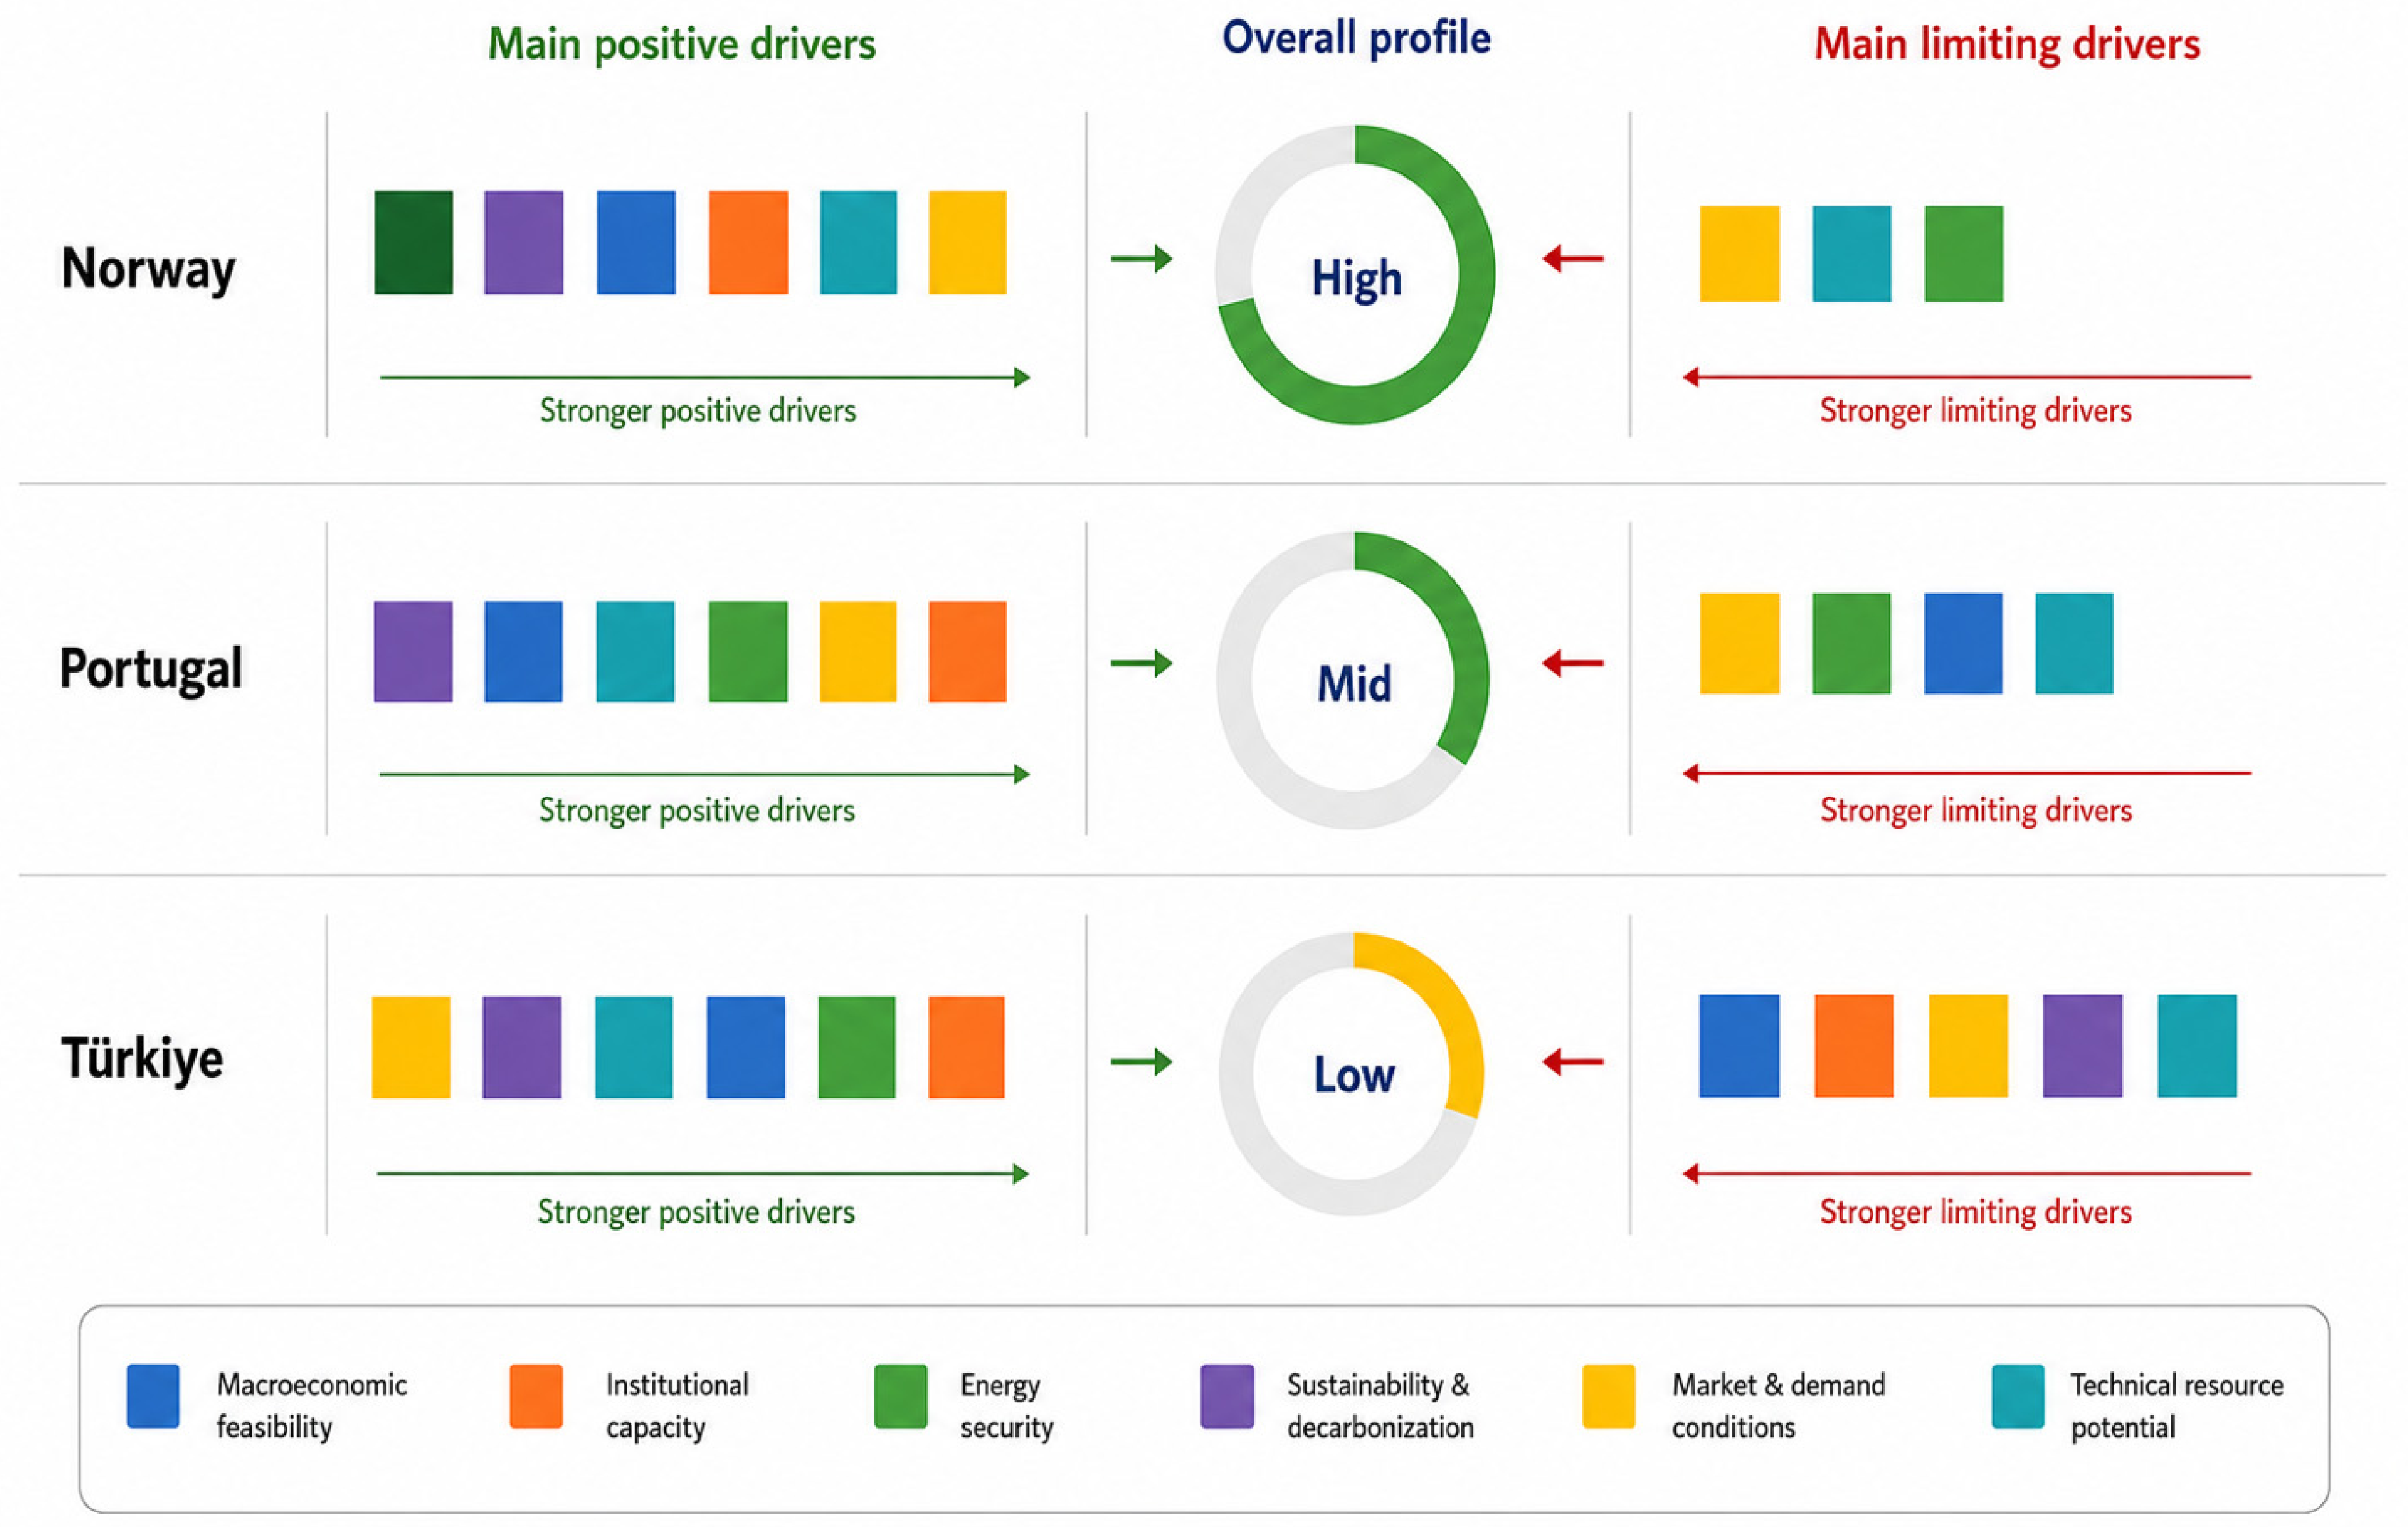
Figure 4 presents the contribution-based readiness profiles of Norway, Portugal, and Türkiye by distinguishing between the dimensions that strengthen each country’s investment-readiness position and those that constrain it.
The contribution analysis shows that Norway’s baseline readiness is mainly driven by strong energy security and sustainability-related indicators. Its highest contributions come from energy import dependence, fossil electricity share, renewable electricity share, electricity carbon intensity, inflation stability, government effectiveness, wind speed, and electricity price volatility. However, Norway receives weaker contributions from solar irradiance, electricity demand, and renewable installed capacity. This indicates that Norway’s high overall position is not based on market scale, but on system stability, low-carbon electricity performance, and institutional strength.
Portugal shows a different profile. Its strongest contributions are linked to inflation stability, CO2 emissions per capita, electricity carbon intensity, solar irradiance, net electricity import conditions, and renewable electricity share. This suggests that Portugal’s readiness is supported by sustainability and solar-resource potential rather than by market size. Its weakest contributions come from electricity demand, renewable installed capacity, GDP per capita, and energy import dependence. Therefore, Portugal can be interpreted as a country with meaningful transition-oriented potential, but with more limited scale and macroeconomic capacity compared with the highest-ranked countries.
Türkiye displays a more uneven contribution structure. Its strongest contributions come from electricity demand growth, CO
2 emissions per capita, net electricity imports share, solar irradiance, and GDP growth. These results indicate that Türkiye has investment-relevant demand and resource potential, especially for solar-oriented and demand-responsive energy investments. However, its baseline score is strongly constrained by very low contributions from inflation, regulatory quality, government effectiveness, electricity price volatility, and GDP per capita. This profile suggests that Türkiye’s lower ranking does not reflect an absence of investment potential; rather, it reflects institutional, macroeconomic, and price-risk constraints that reduce its overall readiness score.
Supplementary File S1, Table S1.14 summarizes the main criterion contribution patterns for selected countries by showing which criteria most strongly support or limit their overall investment-readiness scores. These findings demonstrate the value of the explainability layer.
Figure 4 provides a compact visual profile of the positive and limiting contribution patterns, while the detailed criterion-level driver table is provided in
Supplementary File S1, Table S1.14.
4.11. Whether Readiness Rankings Extend Beyond Wealth and Institutional Maturity
A fairness and distributional check was conducted to examine whether the baseline ranking mainly favors high-income countries, institutionally strong countries, or countries with already large renewable energy capacity. This step is important because an energy investment DSS should not simply reproduce existing economic or institutional advantages; it should also identify broader readiness patterns based on energy security, sustainability, demand conditions, and technical resource potential.
Table 7 summarizes the associations between readiness scores and wealth, institutional maturity, renewable capacity, and technical-resource potential. The results show that baseline readiness is strongly associated with GDP per capita and institutional capacity, with Pearson correlations of 0.727 and 0.751, respectively. This indicates that wealthier and institutionally stronger countries tend to perform better in the baseline ranking. However, the relationships are not perfect, suggesting that the model is not determined by economic or institutional variables alone. Existing renewable installed capacity shows a weaker association with readiness, while technical resource potential has a moderate relationship. These results indicate that the DSS captures broader investment-readiness conditions rather than simply rewarding countries that already have large renewable energy systems or favorable natural resources.
Partial-correlation diagnostics were also used to examine whether the readiness score captures dimensions beyond economic capacity alone. After controlling for GDP per capita and, where relevant, institutional capacity, technical-resource potential, sustainability and decarbonization, market and demand conditions, and energy-security variables continued to provide additional information. The full partial-correlation diagnostics are provided in
Supplementary File S1, Table S1.13.
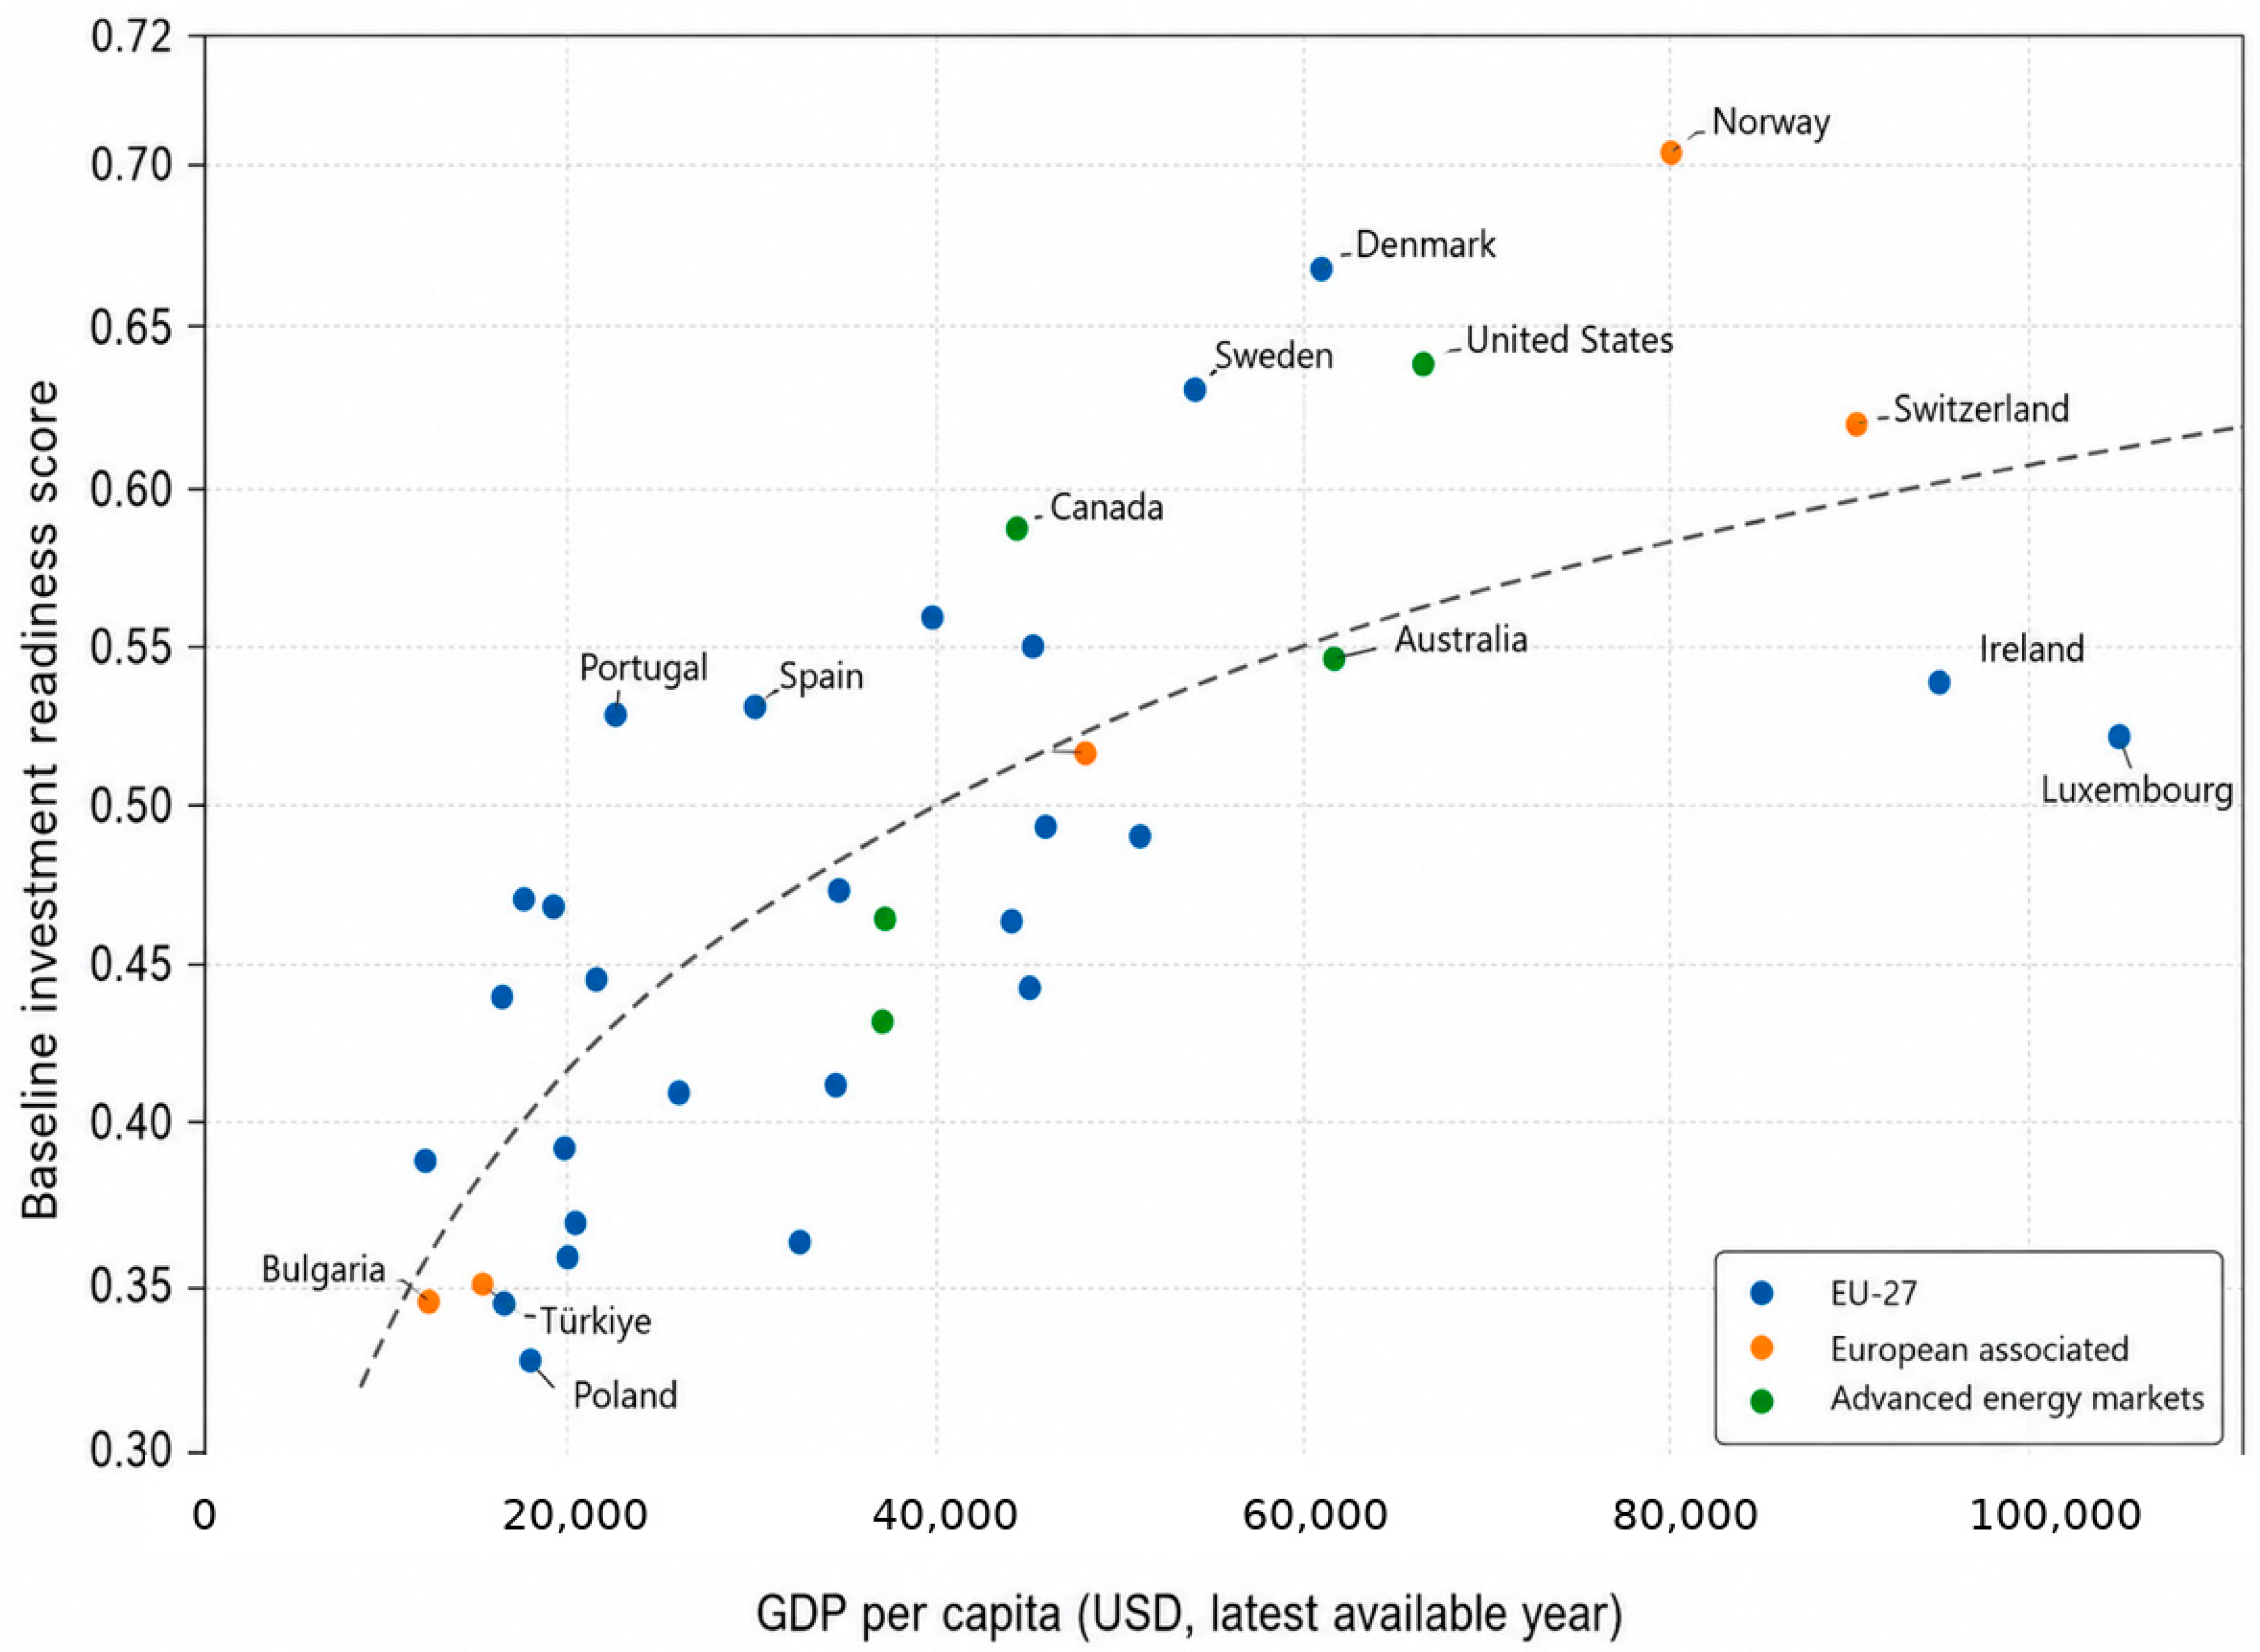
Figure 5 compares baseline investment readiness scores with GDP per capita. The figure shows that higher-income countries generally achieve stronger readiness scores, but the distribution is not fully linear. For example, countries with very high GDP per capita do not automatically occupy the top positions, while some countries with lower income levels show stronger readiness than their income position alone would suggest. This supports the interpretation that the ranking reflects a combination of macroeconomic feasibility, institutional capacity, energy security, sustainability, market conditions, and technical potential.
The distributional and partial-correlation checks therefore show that the baseline ranking partly favors high-GDP and institutionally mature countries, but it does not simply reproduce wealth, institutional strength, or existing renewable capacity. Instead, the C01–C18 framework captures a broader readiness structure in which economic and institutional factors interact with energy-system, sustainability, demand, and resource-potential indicators. Thus, the fairness check supports the use of the model as a multidimensional screening tool rather than a narrow wealth-based ranking.
4.12. Ranking Stability Under Heterogeneous Decision-Maker Preferences
The robustness analysis was conducted to examine whether the baseline ranking remains stable when the decision logic changes. The equal-weight ranking was used as the reference scenario, and alternative rankings were generated through persona-specific weighting schemes, objective weighting methods, and simulated decision agents. For each scenario, ranking stability was assessed using Spearman correlation with the baseline ranking, top-5 overlap, and the largest observed rank change.
Table 8 shows whether country prioritization remains stable under stakeholder, weighting, data-treatment, and simulated-agent scenarios. The persona-based scenarios produce high Spearman correlations, ranging from 0.938 to 0.977, indicating that the overall ordering of countries remains relatively stable even when stakeholder priorities change. The top-5 overlap is also high, with most persona scenarios retaining four of the baseline top five countries. This suggests that the highest-ranked countries are not highly sensitive to moderate changes in decision-maker priorities.
The objective weighting checks provide additional evidence. The CRITIC-weighted scenario shows the strongest alignment with the baseline ranking, with a Spearman correlation of 0.986 and a full 5/5 top-5 overlap. The entropy-weighted scenario is more sensitive, with a lower but still strong Spearman correlation of 0.892 and a 3/5 top-5 overlap. This difference is expected because entropy assigns greater importance to criteria with higher dispersion, such as electricity demand and renewable installed capacity, which can shift the ranking toward countries with larger system scale.
Simulated-agent validation was then used to move beyond conventional sensitivity analysis. A total of 500 synthetic decision agents were generated by randomly varying the relative importance of the six readiness dimensions. The median Spearman correlation across simulated agents was 0.932, with a median top-5 overlap of 4/5. This indicates that the DSS produces broadly stable results under heterogeneous decision preferences, although some countries experience larger rank changes when agents strongly prioritize specific dimensions such as technical potential, market scale, or sustainability.
Table 8 reports the summarized robustness and simulated-agent validation results, while the full simulated-agent design and output tables are provided in
Supplementary File S1, Table S1.12.
These results confirm that the proposed DSS is not overly dependent on a single weighting assumption. The baseline ranking remains strongly correlated with most alternative scenarios, while the simulated-agent laboratory shows how rankings may change under more diverse decision preferences. This validation strengthens the practical reliability of the framework because it demonstrates that the DSS can support different stakeholders without producing unstable or arbitrary investment priorities.
5. Discussion
5.1. Interpretation of the Main Findings
The results should be interpreted as indicators of relative energy investment readiness under the selected energy security, sustainability, market, institutional, macroeconomic, and technical criteria, rather than as a universal judgement that one country is “best.” The baseline and persona-based results show that investment readiness is multidimensional and depends on how different strengths and constraints are combined. This is consistent with the literature review, which frames strategic energy investment as a complex decision problem shaped by decarbonization, affordability, institutional feasibility, market stability, energy security, and technical resource potential. Recent studies cited in the manuscript also connect energy transition investment with energy security, climate risk, green innovation, policy stringency, finance, and socio-economic justice, showing that investment prioritization requires a broader decision-support structure rather than a narrow technical or financial ranking.
The findings reveal several readiness profiles. First, some countries show strong institutional and macroeconomic readiness but more limited technical resource potential. These countries may offer stable policy environments, stronger regulatory quality, and lower implementation risk, but their investment pathways may depend more on grid modernization, storage, efficiency, interconnection, and technology upgrading than on large-scale resource expansion alone. Second, some countries display high renewable resource potential but weaker macroeconomic or institutional conditions. In such cases, solar or wind potential may be attractive, but investment readiness can be constrained by inflation, regulatory quality, government effectiveness, price volatility, or financing conditions. Third, high-demand countries represent a different profile: they may not always score highest overall, but their market size and demand growth indicate significant investment need. Fourth, fossil-dependent countries require transition-oriented investments because high fossil electricity shares and carbon intensity create both risk and opportunity. For these countries, the DSS is useful because it identifies where decarbonization pressure, energy security exposure, and infrastructure needs overlap.
The ranking-driver analysis added in the results section strengthens this interpretation by showing that the same aggregate readiness score can reflect different combinations of opportunity and constraint. A high score may indicate a mature investment environment with strong institutions and low-carbon electricity performance, whereas a mid-range or lower score may indicate that technical potential is present but constrained by price volatility, macroeconomic instability, or weaker governance. This distinction is important for policy and investment practice because the DSS does not merely identify where investment is easiest; it also reveals where targeted interventions can convert latent technical or market potential into investable readiness.
5.2. Comparison with International Energy-Transition and Investment-Readiness Studies
The country patterns identified in the results are consistent with, but more diagnostically detailed than, the broader international literature on energy-transition investment. Studies on energy security and transition finance emphasize that investment readiness depends not only on renewable potential, but also on policy credibility, financing conditions, infrastructure capacity, demand-side integration, and socio-economic constraints [
1,
2,
3,
9]. The present findings support this argument because the highest-ranked countries are not simply those with one strong indicator; rather, they combine institutional capacity, energy-system stability, lower carbon exposure, and market conditions in different ways.
The strong performance of Norway, Denmark, Sweden, and Switzerland can be interpreted in line with international evidence that mature institutions, stable policy environments, and low-carbon electricity systems reduce transition-investment risk. Norway’s high readiness is mainly associated with energy security and low-carbon electricity performance, while Denmark and Sweden combine institutional strength with sustainability-oriented energy profiles. These findings are consistent with studies that describe energy-transition readiness as a systemic property shaped by governance quality, infrastructure reliability, and policy implementation capacity rather than by resource potential alone. They also explain why countries with high income do not automatically receive the strongest readiness profile if their market, resource, or energy-system indicators are less balanced.
The results for the United States illustrate a different international profile. The United States performs strongly on market and demand conditions, reflecting the scale of its electricity market and investment capacity, but its profile differs from the Nordic and Swiss cases because readiness is driven more by market size and technical-resource potential than by uniformly high sustainability indicators. This distinction is important because investment attractiveness in large markets may arise from scale, demand growth, and innovation capacity even when decarbonization indicators remain uneven. The result is consistent with international research linking energy-transition investment to finance, green innovation, and policy stringency, where market depth can attract capital but does not by itself guarantee balanced transition readiness [
9,
10].
Portugal represents a mid-range transition-oriented case. Its profile is supported by sustainability performance and solar-resource potential, while its limiting factors relate more to market size, GDP per capita, and renewable installed capacity. This finding corresponds to international work on photovoltaic and storage-oriented transition pathways, which shows that technical suitability becomes investable only when combined with infrastructure, financing, and stable policy conditions [
8]. In contrast, Türkiye and Poland illustrate opportunity-constrained profiles. Türkiye shows demand growth and solar-resource potential, but its readiness is reduced by macroeconomic, institutional, and price-risk constraints; Poland shows lower sustainability and market/demand readiness, suggesting that transition investment may require stronger policy, grid, and decarbonization support. These cases support the argument that lower readiness should not be interpreted as absence of potential, but as evidence of de-risking needs and structural transition barriers.
The comparison with international studies also clarifies the added value of the proposed DSS. Previous fuzzy multi-criteria decision-making applications often focus on a single technology, site, or resource class, such as offshore wind siting, renewable-resource ranking, or microgrid architecture assessment [
11,
12,
13]. By contrast, the present framework evaluates country-level readiness across macroeconomic, institutional, energy-security, sustainability, market, and resource dimensions and then links these profiles to stakeholder-specific interpretations. Therefore, the empirical results should be read not only as a ranking, but as a comparative diagnostic map that explains why countries differ and what type of policy or investment pathway may be more appropriate in each case.
5.3. Methodological Implications
The methodological contribution of the study lies in extending a conventional multi-criteria ranking exercise into a more transparent country-level screening architecture. Traditional energy MCDM studies are valuable because they can combine conflicting criteria, and fuzzy extensions are useful when uncertainty and ambiguity are present. However, the literature review and the international comparison above show that many applications remain technology-specific, expert-dependent, or focused on a single decision context. The present study responds by using public secondary data, explicit indicator direction rules, objective-weight benchmarks, persona-based interpretation, explainability, and validation checks, while treating the fuller fuzzy-panel and proposed causal-evidence/LLM-salience weighting modules as extensible components rather than as fully activated empirical modules.
The proposed framework addresses this limitation in several ways. First, criteria are supported by LLM-assisted document extraction, which helps organize policy, strategy, and regulatory knowledge into measurable decision dimensions. The LLM is not used as an autonomous decision maker; it supports criterion identification and documentation, while final scoring remains grounded in secondary data and formal decision models. Second, fuzzy numbers are generated from empirical data characteristics rather than only from expert linguistic scales. This is important because variables such as price volatility, demand growth, carbon intensity, import dependence, solar irradiance, and wind speed are observable. Third, the implemented model reports equal-weight, entropy, CRITIC, and hybrid entropy-CRITIC configurations, while causal-evidence and textual-salience weighting remain modular extensions rather than activated empirical inputs. Fourth, rankings are persona-sensitive, allowing the same C01–C18 matrix to support public planners, investors, grid operators, sustainability policymakers, and infrastructure funds. Fifth, explainability and fairness checks make the DSS more transparent by showing which criteria drive country scores and whether the model mainly reproduces income, institutional strength, or existing renewable capacity. Finally, simulated agents provide a stronger validation layer by testing the ranking under heterogeneous decision preferences. The proposed framework therefore shifts energy MCDM from an expert-opinion-based ranking exercise toward a reproducible and adaptive decision support architecture.
5.4. Implications for Energy Investment Strategy
The findings can be translated into pathway-specific investment strategies rather than interpreted only as a general country ranking. Energy transition investment requires the alignment of resource potential, institutions, finance, market demand, grid readiness, and decarbonization pressure. This is consistent with recent studies showing that energy transitions depend on finance, policy, infrastructure, demand-side integration, energy security, and climate-risk reduction [
1,
3].
For solar PV, the key signals are solar irradiance, policy quality, market demand, and grid readiness. Countries with strong solar potential but weaker institutional or macroeconomic conditions may still offer long-term opportunities, but they require de-risking tools, stable auctions, grid-connection planning, and financing support. For wind investment, wind speed must be interpreted together with electricity demand, market stability, regulatory quality, and grid capacity. This supports the logic of recent fuzzy MCDM-based wind-siting studies, where technical potential is evaluated alongside strategic and institutional criteria [
12].
For battery storage, readiness is linked to price volatility, renewable penetration, demand variability, and grid stress. Storage becomes more relevant where renewable electricity is increasing and system flexibility is needed, which is consistent with the role of PV and battery systems in sustainable transition [
8]. For grid modernization, important signals include electricity demand growth, import dependence, renewable share, fossil electricity share, and price volatility. Countries with rising demand or higher import exposure may need grid reinforcement, interconnection, digital grid technologies, and flexibility solutions.
For energy efficiency, the DSS is especially relevant where demand growth, import dependence, and affordability pressures are high. Efficiency investments can reduce system pressure and improve energy security before costly supply-side expansion. For green hydrogen, readiness depends on renewable capacity, resource potential, institutional quality, infrastructure readiness, and long-term demand. This is consistent with Delpisheh et al. [
7], who emphasize that hydrogen development depends on economic, technological, and policy conditions.
The investment-area interpretation provided in
Supplementary File S1, Table S1.15 strengthens this practical contribution by showing how the same country-readiness score can be translated into different strategic pathways. For public actors, the table helps identify whether policy support should prioritize security, grid resilience, demand-side management, or decarbonization. For private investors and infrastructure funds, it clarifies whether a country’s attractiveness is driven by market scale, technical resource potential, institutional capacity, or transition pressure. This prevents the ranking from being interpreted as a simple league table and instead positions it as a diagnostic entry point for technology-specific feasibility analysis.
5.5. Implications for Decision Makers
The persona-based outputs show that the same country-level evidence can lead to different investment interpretations depending on the decision maker’s priorities. This is one of the main practical contributions of the framework, because strategic energy investment decisions are rarely made from a single perspective. A country that appears highly attractive for a public planner may not be equally attractive for a private investor, and a country that is suitable for grid modernization may not necessarily be the strongest option for low-risk infrastructure finance. The results therefore suggest that country-level readiness should be interpreted as a stakeholder-sensitive profile rather than as a single universal ranking.
For public planners, the framework is useful because it highlights how energy security, decarbonization performance, institutional capacity, and affordability-related risks interact in shaping readiness. Countries with strong energy-security and sustainability scores may be better positioned for policy-led transition programs, while countries with weaker institutional or macroeconomic conditions may require regulatory strengthening, public guarantees, or blended-finance mechanisms before large-scale energy investments can be implemented effectively. In this sense, the framework can support early-stage policy prioritization by identifying where public intervention may be needed to reduce investment barriers.
For private investors, the results provide a structured way to screen countries before conducting detailed financial appraisal. Investors are likely to be more sensitive to macroeconomic feasibility, institutional quality, market size, and price volatility. A country with strong technical-resource potential but weak regulatory quality or high inflation may still be attractive, but it may require higher risk premiums, stronger contractual protections, or partnership with public institutions. Conversely, countries with stable institutions and predictable market conditions may be more suitable for lower-risk investment strategies, even when their technical-resource potential is more moderate.
For grid operators and system planners, the framework draws attention to demand growth, electricity-market conditions, import dependence, renewable penetration, and system flexibility needs. Countries with high renewable shares and price volatility may require storage, grid-balancing technologies, interconnection upgrades, and flexibility-oriented investments. Countries with growing demand but weaker system readiness may require grid modernization before renewable expansion can be scaled efficiently. Therefore, the framework can help grid-related decision makers connect readiness scores with system-level investment needs rather than treating investment attractiveness only as a financial or resource-potential question.
For sustainability-oriented policymakers, the framework is valuable because it separates low-carbon performance from broader investment feasibility. A country may perform well in decarbonization indicators but still face market, institutional, or technical constraints. Similarly, a country with weaker current sustainability performance may represent an important transition opportunity if it has sufficient market scale, resource potential, or policy capacity. This helps avoid a narrow interpretation in which countries are assessed only according to their current renewable capacity or emissions profile. Instead, the framework supports a more balanced view of both current performance and future transition potential.
For infrastructure funds, the results are especially relevant because long-term energy investments require stable deployment conditions. Infrastructure funds may prioritize institutional maturity, predictable market conditions, energy-system stability, and long-term demand. The persona-based interpretation can therefore help identify countries where the investment environment is suitable for large-scale, long-horizon assets such as renewable generation portfolios, transmission infrastructure, storage systems, and energy-efficiency platforms. At the same time, the results can help distinguish between countries that are immediately investable and those that may require de-risking, policy reform, or phased entry strategies.
The persona-based analysis shows that the framework should not be used to produce a single “best country” conclusion. Its value lies in showing how readiness changes when the priorities of different decision makers are made explicit. This makes the framework useful as an early-stage screening tool, a stakeholder dialogue instrument, and a structured basis for deciding where more detailed feasibility analysis should be conducted. Detailed stakeholder-implication and persona-sensitivity materials are provided in
Supplementary File S1, Table S1.11.
5.6. Comparison with Conventional MCDM
The proposed framework differs from conventional MCDM applications in both its data logic and its decision-support purpose. Many conventional fuzzy MCDM studies rely mainly on expert linguistic evaluations to assign criterion weights and alternative performance scores. This approach is valuable when decision variables are difficult to observe directly or when expert judgment is the only available source of information. However, in country-level energy investment readiness assessment, many important indicators can be measured through public secondary data. Macroeconomic conditions, institutional indicators, electricity-system structure, renewable electricity share, energy import dependence, carbon intensity, electricity demand, and technical-resource indicators can all be operationalized through comparable datasets. The present framework therefore reduces dependence on expert-only linguistic scoring by using measurable secondary data as the empirical basis of the decision matrix.
This does not mean that expert judgment or fuzzy logic is unnecessary. Rather, the study positions fuzzy modeling more cautiously. The fuzzy component is retained as an uncertainty-sensitive extension that can represent historical variability, volatility, scenario bands, or panel-based uncertainty when sufficient time-series data are available. In the implemented empirical model, however, the baseline ranking is based on the latest available normalized secondary-data matrix. This distinction is important because it clarifies the boundary between the empirically implemented model and the methodological extensions proposed for future applications. In this way, the framework responds to concerns about methodological transparency and avoids presenting the fuzzy extension as a fully activated empirical ranking engine.
Another difference from many conventional MCDM studies is that the proposed framework does not stop after producing a final ranking. A single ranking can be informative, but it may also hide the reasons behind country performance and the sensitivity of the results to different assumptions. For this reason, the framework combines baseline scoring with objective weighting benchmarks, persona-based rankings, criterion-level explainability, fairness diagnostics, external validation, and robustness checks. These layers allow the reader to see not only which countries rank higher or lower, but also why they do so, whether the ranking is mainly driven by wealth or institutional maturity, and how stable the results remain under alternative weighting assumptions.
The persona-based component also extends conventional MCDM practice by recognizing that different decision makers do not evaluate investment readiness in the same way. Public planners, private investors, grid operators, sustainability policymakers, and infrastructure funds may all use the same country-level evidence, but they place emphasis on different readiness dimensions. Conventional MCDM models often present one aggregated ranking as the final output. In contrast, the proposed framework treats the baseline ranking as a common reference point and then shows how priorities change under stakeholder-specific decision profiles. This makes the framework more suitable for strategic energy investment contexts, where decisions are shaped by multiple actors and competing policy, financial, technical, and sustainability objectives.
The explainability and fairness components further distinguish the framework from standard ranking-oriented approaches. Instead of assuming that a higher score automatically reflects stronger overall suitability, the model examines the contribution of different dimensions and evaluates whether the ranking mainly reproduces income level, institutional quality, or existing renewable capacity. This is important because country-level energy investment assessment can unintentionally favor already advanced economies. By adding fairness and partial-correlation diagnostics, the framework provides a more cautious interpretation of readiness and helps identify whether lower-ranked countries are constrained by structural disadvantages, market risks, institutional weaknesses, or specific energy-system limitations.
Finally, the robustness and simulated-agent layers broaden the conventional sensitivity logic. Standard MCDM sensitivity analysis often changes criterion weights and observes whether rankings shift. The present framework keeps this logic but adds persona-weight perturbations and simulated-agent preference heterogeneity. This allows the ranking to be tested under more diverse decision assumptions. The aim is not to claim that simulated agents represent real decision makers perfectly, but to examine whether the readiness structure remains broadly stable when preferences vary. In this respect, the framework provides a stronger basis for early-stage screening than a single static MCDM ranking.
The framework also differs from representative energy DSS and fuzzy MCDM studies by combining country-level secondary data, stakeholder-sensitive interpretation, and validation-oriented diagnostics within one reproducible screening structure. Its contribution lies in integration and boundary clarity: the main empirical results are implemented with observable data and formal decision-support procedures, whereas the fuzzy-panel and proposed causal-evidence/LLM-salience components are explicitly retained as extensions. Additional comparison materials are provided in
Supplementary File S1.
6. Conclusions
This study proposed and demonstrated a secondary-data-driven decision support framework for comparing strategic energy investment readiness across countries. The empirical application used publicly available macroeconomic, institutional, energy-security, sustainability, market-demand, and technical-resource indicators to construct a comparable decision matrix for 36 countries and 18 criteria. The main purpose was not to produce a final investment decision, but to offer a transparent screening structure that helps decision makers understand where country-level readiness is strong, where constraints remain, and how priorities may change across different stakeholder perspectives.
The findings show that strategic energy investment readiness is clearly multidimensional. Countries with strong overall readiness do not perform well for the same reasons. For example, some countries are mainly supported by institutional strength and energy-system stability, while others benefit from market size, demand conditions, sustainability performance, or technical-resource potential. Similarly, countries with lower aggregate scores should not be interpreted as lacking investment potential. In many cases, they show specific strengths, but these are offset by macroeconomic, institutional, market, or system-level constraints. This confirms the value of treating investment readiness as a profile rather than as a single financial, technical, or environmental indicator.
The main conclusions of the study are as follows:
Public secondary data can be transformed into a reproducible country-level readiness matrix through clear indicator selection, benefit/cost classification, normalization, and source documentation.
Strategic energy investment readiness differs substantially across countries and across readiness dimensions, showing that no single indicator is sufficient to explain country-level investment attractiveness.
Persona-based rankings demonstrate that public planners, private investors, grid operators, sustainability-oriented policymakers, and infrastructure funds may prioritize different countries because they emphasize different readiness dimensions.
Fairness and partial-correlation diagnostics indicate that the readiness index is not only a reflection of income level, institutional maturity, or existing renewable capacity. Other dimensions, such as energy security, market conditions, decarbonization performance, and technical-resource potential, also contribute to the results.
Robustness checks show broad ranking stability under alternative weighting assumptions, outlier treatment, persona-weight perturbations, and simulated-agent preference heterogeneity, while still revealing meaningful shifts for some countries.
The framework should be interpreted as an early-stage country-level screening tool, not as a substitute for project-level feasibility analysis, financial appraisal, or site-specific technical assessment.
The practical value of the framework lies in its ability to organize complex country-level evidence in a form that is understandable for different decision makers. Governments and climate-policy bodies can use the results to identify countries where investment readiness is strengthened or weakened by policy capacity, energy security, or decarbonization performance. Private investors and infrastructure funds can use the framework to compare market attractiveness, institutional conditions, and investment risks. Grid operators and energy planners can interpret the results in relation to system flexibility, demand growth, price volatility, and technical-resource potential. In this sense, the framework supports more informed early-stage screening before detailed project appraisal is undertaken.
The study also clarifies the status of its methodological components. The secondary-data matrix, baseline readiness scoring, objective-weighting checks, persona-based rankings, explainability analysis, fairness diagnostics, external validation, and simulated-agent robustness analysis were implemented empirically. By contrast, the panel-based fuzzy interval procedure and proposed causal-evidence/LLM-salience weighting logic are presented as methodological extensions. They should be activated in future studies only when complete time-series data, independently estimated causal effects, or formally validated salience matrices are available. This distinction is important because it prevents the framework from being interpreted as a fully implemented fuzzy, causal, or autonomous AI-based investment model.
Several limitations should be noted. First, the empirical application is mainly based on the latest available cross-sectional data, which limits the ability to capture long-term transition dynamics. Second, public secondary data improve transparency and reproducibility, but they may also contain comparability limitations related to national reporting practices, electricity-market definitions, and differences between wholesale and retail price data. Third, solar irradiance and wind-speed indicators are used as country-level screening variables and should not be interpreted as substitutes for project-level resource assessments. Fourth, the LLM-assisted component is limited to criterion discovery and documentation support; it does not determine the final scoring, weighting, or ranking. Finally, simulated-agent validation is based on synthetic preference profiles rather than observed decision-maker behavior.
Future research can extend the framework in several directions. A full panel-data application could better capture changes in energy investment readiness over time. The fuzzy interval module could be implemented more completely by using multi-year data for all countries and criteria. Future studies could also calibrate stakeholder profiles using survey or interview data from policymakers, investors, grid operators, and infrastructure-finance experts. In addition, regional or site-level versions of the framework could provide more detailed guidance for specific investment pathways, such as solar photovoltaic, wind energy, storage, grid modernization, energy efficiency, and green hydrogen.
In conclusion, the study offers a transparent and explainable approach for comparing strategic energy investment readiness across countries. Its contribution is strongest when understood as a structured screening framework: it helps decision makers make sense of complex country-level evidence, compare readiness profiles across stakeholder priorities, and identify where deeper feasibility assessment is needed.