Article

Deep Risk Assessment of Gas Storage Based on Coupling Network and Game Theory

1
Chongqing Xiangguosi Gas Storage Co., Ltd., Chongqing 401121, China
2
College of Safety Science and Engineering, Chongqing University of Science and Technology, Chongqing 401331, China
3
College of Continuing Education, Chongqing University of Science and Technology, Chongqing 401331, China
*
Author to whom correspondence should be addressed.
Energies 2026, 19(13), 3041; https://doi.org/10.3390/en19133041
Submission received: 3 June 2026 / Revised: 18 June 2026 / Accepted: 25 June 2026 / Published: 27 June 2026
(This article belongs to the Section H: Geo-Energy)

Abstract

To address the issues of unclear risk-coupling mechanisms and the subjective-objective imbalance in evaluation weights for underground gas storage, this paper proposes an assessment method integrating network analysis with game-theory-based fusion weighting. A comprehensive geology–wellbore–surface–auxiliary whole-system risk inventory is first established. Meanwhile, the cross-system risk conduction network is analyzed based on the identification of material, energy, and information flows among subsystems. Subsequently, fault tree analysis (FTA) and expert risk scoring (ERS) are integrated to form a coupling network-guided game theory-based weighting model (CN-GT). This mechanism introduces a game-theoretic deviation-minimization model to reconcile conflicts between subjective and objective information sources and explicitly incorporates risk conduction paths into the weight-aggregation process to quantitatively correct cross-system coupling effects. A case study is conducted at the Xiangguosi gas storage facility. Results from ablation experiments and benchmark method comparisons demonstrate that the cross-system coupling effect is significant; the weight of the risk factor “systemic risk caused by improper compressor operation” ranks first after integration, a contribution severely underestimated by traditional methods. Furthermore, the risk prioritization clearly identifies wellbore integrity and critical equipment reliability as the primary control points. This study provides a quantifiable and decision-support tool for the systematic risk management and control of gas storage.

1. Introduction

As China’s energy structure undergoes transformation, underground gas storage facilities have taken on an increasingly prominent role in natural gas peak shaving and ensuring supply security [1,2]. Gas storage systems encompass geological formations, wellbores, surface processing facilities, and auxiliary systems; under operating conditions involving high-pressure injection and withdrawal as well as alternating high- and low-pressure cycles, they face significant risks such as leaks, fires, and explosions [3]. Domestic and international research indicates that risks often stem from dynamic coupling, transmission, and amplification across multiple systems, rather than from single-equipment failures [4,5,6,7]. Therefore, conducting a systematic and in-depth assessment of safety risks is a crucial prerequisite for enhancing the inherent safety of gas storage facilities.
Unlike pipelines and individual refining and processing units, a gas storage facility is a complex, large-scale system characterized by strong dynamic interactions, comprising geological formations, wellbores, surface processing facilities, and auxiliary systems. The core characteristic of these risks is “coupling”: risks can propagate between systems along the flow of injection and production materials (transmission coupling), or they can lead to system-wide functional failure due to the failure of a single critical supporting system (such as the power grid) (common-cause coupling) [8,9]. Therefore, the unique challenge in assessing risks associated with gas storage facilities lies in how to scientifically incorporate this networked, cross-system coupling structure into quantitative assessment models.
Although there are currently many risk assessment methods for gas storage facilities, they still have significant limitations in addressing complex system-to-system coupling and integrating objective and subjective factors in the assessment process. At the coupling analysis level, although traditional methods such as HAZOP and FMEA are effective in identifying risks within individual units, their analytical frameworks struggle to systematically characterize the networked pathways through which risks propagate and amplify across hierarchical layers via material flow, energy flow, and information flow along the “geology–wellbore–surface facilities–auxiliary systems” chain [10,11,12,13]. Although fault tree analysis (FTA) can describe logical causal relationships, its traditional “AND/OR” gate structure is cumbersome and insufficiently intuitive for scenarios involving common-cause coupling and multi-path coupling with feedback [14]. For salt cavern gas storage facilities, Zhang Linguo et al. [15] explored the application of the HAZOP method, and Luo Jinheng et al. [16] summarized risk assessment methods; however, neither addressed the quantification of coupling pathways. Some researchers have introduced methods such as Bayesian networks, complex networks, and system dynamics to characterize risk coupling and dynamic evolution. For example, Xu et al. [4] and Agarwal et al. [17], respectively, developed a dynamic risk assessment model for gas storage facilities based on Bayesian networks and a bow-tie Bayesian network; Sun et al. [18] analyzed risk propagation and traceability paths during the operation phase of gas storage facilities based on complex network theory; Guo et al. [19] employed system dynamics to investigate multi-factor coupled risks in coal mine gas; Zhang et al. [20] combined Bayesian networks with system dynamics for drilling operation risk analysis.
Furthermore, Durukan et al. [21] proposed a method combining quantitative HAZOP with D-S evidence theory and fault tree analysis; Kalathil et al. [22] introduced D-S evidence theory into FMECA; Zheng et al. [23] extended the FMEA model. However, most of the aforementioned methods require precise failure probability data and struggle to convert identified coupling paths into comparable quantitative weights. Although they can describe “how risk propagates”, they cannot answer “how significant the risk becomes as a result of this propagation”, leading to assessment results that still mainly serve logical qualitative descriptions rather than being directly integrated into the weight aggregation process.
At the level of weight determination, subjective weighting methods represented by the Analytic Hierarchy Process (AHP) rely heavily on expert experience, with judgment matrices prone to inconsistency and significantly influenced by individual cognitive biases [24]; the grading of risk matrices is also highly subjective. Sun Fuqiang et al. [25] conducted monitoring and risk classification for sustained casing pressure in gas storage facilities, but this method remains qualitative or semi-quantitative in nature. To overcome the one-sidedness of a single information source, some studies have attempted to combine subjective and objective weighting methods and have introduced game theory to minimize the deviation of combined weights [26,27,28,29,30]. For example, Zheng et al. [26] combined CRITIC with D-AHP and used game theory to optimize weights for tunnel collapse risk assessment; Jin et al. [27] applied AHP and the improved entropy weight method combined with game theory to optimize deep foundation pit support schemes; Chen et al. [28] used an AHP-entropy weight-game theory combined model in site selection for compressed air energy storage caverns; Mao et al. [29] and Liu et al. [30] adopted similar combined weighting approaches in rock mass stability evaluation and risk analysis of coal mine gas transmission systems, respectively. In the field of gas storage facilities, Wang et al. [31] assessed the risks of salt cavern gas storage caverns based on AHP and objective weighting methods; Bi et al. [32] adopted a vague set and entropy weight method combined with matter-element extension to evaluate gas storage safety; Yang et al. [33] combined AHP with fault tree analysis to analyze the major risks of layered salt rock storage; Ban et al. [34] applied AHP and fuzzy comprehensive evaluation to assess caprock sealing integrity; Jing et al. [35] used a risk matrix based on accident statistical analysis to evaluate risks of salt cavern oil (gas) storage; Lackey et al. [36] systematically analyzed well leakage events and integrity management issues in U.S. underground gas storage facilities; Kaya et al. [37] comprehensively reviewed wellbore integrity issues in gas storage facilities; Wickenhauser et al. [38] conducted quantitative risk assessments; Cao et al. [39] performed qualitative and quantitative risk assessments for LNG storage tanks. In addition, Ridolfi et al. [40] developed a screening method for hydrogen storage site selection. These studies demonstrate the effectiveness of game theory-based combined weighting in reconciling conflicts between subjective and objective weights. However, a critical issue has been generally overlooked: the “fusion” in existing combined weighting methods occurs at the weight vector level, rather than at the system topology level of risk factors. In other words, these methods still treat each risk factor as an independent node, with its weight merely reflecting its inherent risk within a single system. The “propagation breadth” and “amplification effect” that risk factors acquire through cross-system transmission are not quantified, and this is precisely the core breakthrough of the CN-GT model proposed in this paper.
In summary, existing research faces three challenges in risk assessment for gas storage facilities: (1) Insufficient characterization of coupling mechanisms: although methods such as Bayesian networks and complex networks have been used to explore risk propagation paths, it remains difficult to convert these paths into a priori structures for weight calculation; (2) Weight imbalance: subjective and objective information sources have not been effectively balanced and integrated, and the amplification effect of cross-system coupling on risk importance is often ignored; (3) Static assessment: the path for transforming assessment results into dynamic risk monitoring and early warning remains unclear.
To address the above issues, this paper proposes an in-depth risk assessment method (CN-GT model) that couples network analysis with game theory-based combined weighting. The main innovations include: (1) proposing a “coupling topology-guided weighting” approach that uses cross-system risk propagation paths as a priori structures for weight aggregation, overcoming the limitation of traditional methods that insufficiently quantify coupling effects; (2) introducing game theory to minimize weight deviation, achieving a balanced optimization of subjective and objective information sources and overcoming the one-sidedness of any single information source; (3) designing ablation experiments and comparisons with benchmark methods to verify the necessity of the coupling correction step and the superiority of the proposed method. Taking the Xiangguosi Gas Storage Facility as an example, the application process of the method is systematically demonstrated. Furthermore, a three-level “strategy-tactics-execution” dynamic monitoring indicator system is proposed, bridging static assessment and dynamic control, thereby providing a quantifiable decision-support tool for the risk management of complex gas storage systems.

2. Materials and Methods

2.1. Systemic Risk Identification Framework

To overcome the limitations of isolated perspectives and incomplete coverage inherent in traditional risk identification, this study develops a comprehensive, system-wide risk identification framework based on physical processes and functional logic. The gas storage facility is decomposed into four core modules: the geological formation (A), well engineering (B), surface processing (C), and auxiliary systems (D), thereby ensuring full risk coverage. Risk identification follows the trajectory of “equipment → failure mode → root cause,” yielding a foundational risk inventory for the entire system. Taking a compressor failure in the surface processing system as an example, this study presents the corresponding risk factors in Table 1. This inventory provides a structured foundation for subsequent risk-coupling analysis and quantitative assessment.

2.2. Risk Transmission Analysis Based on System Coupling Theory

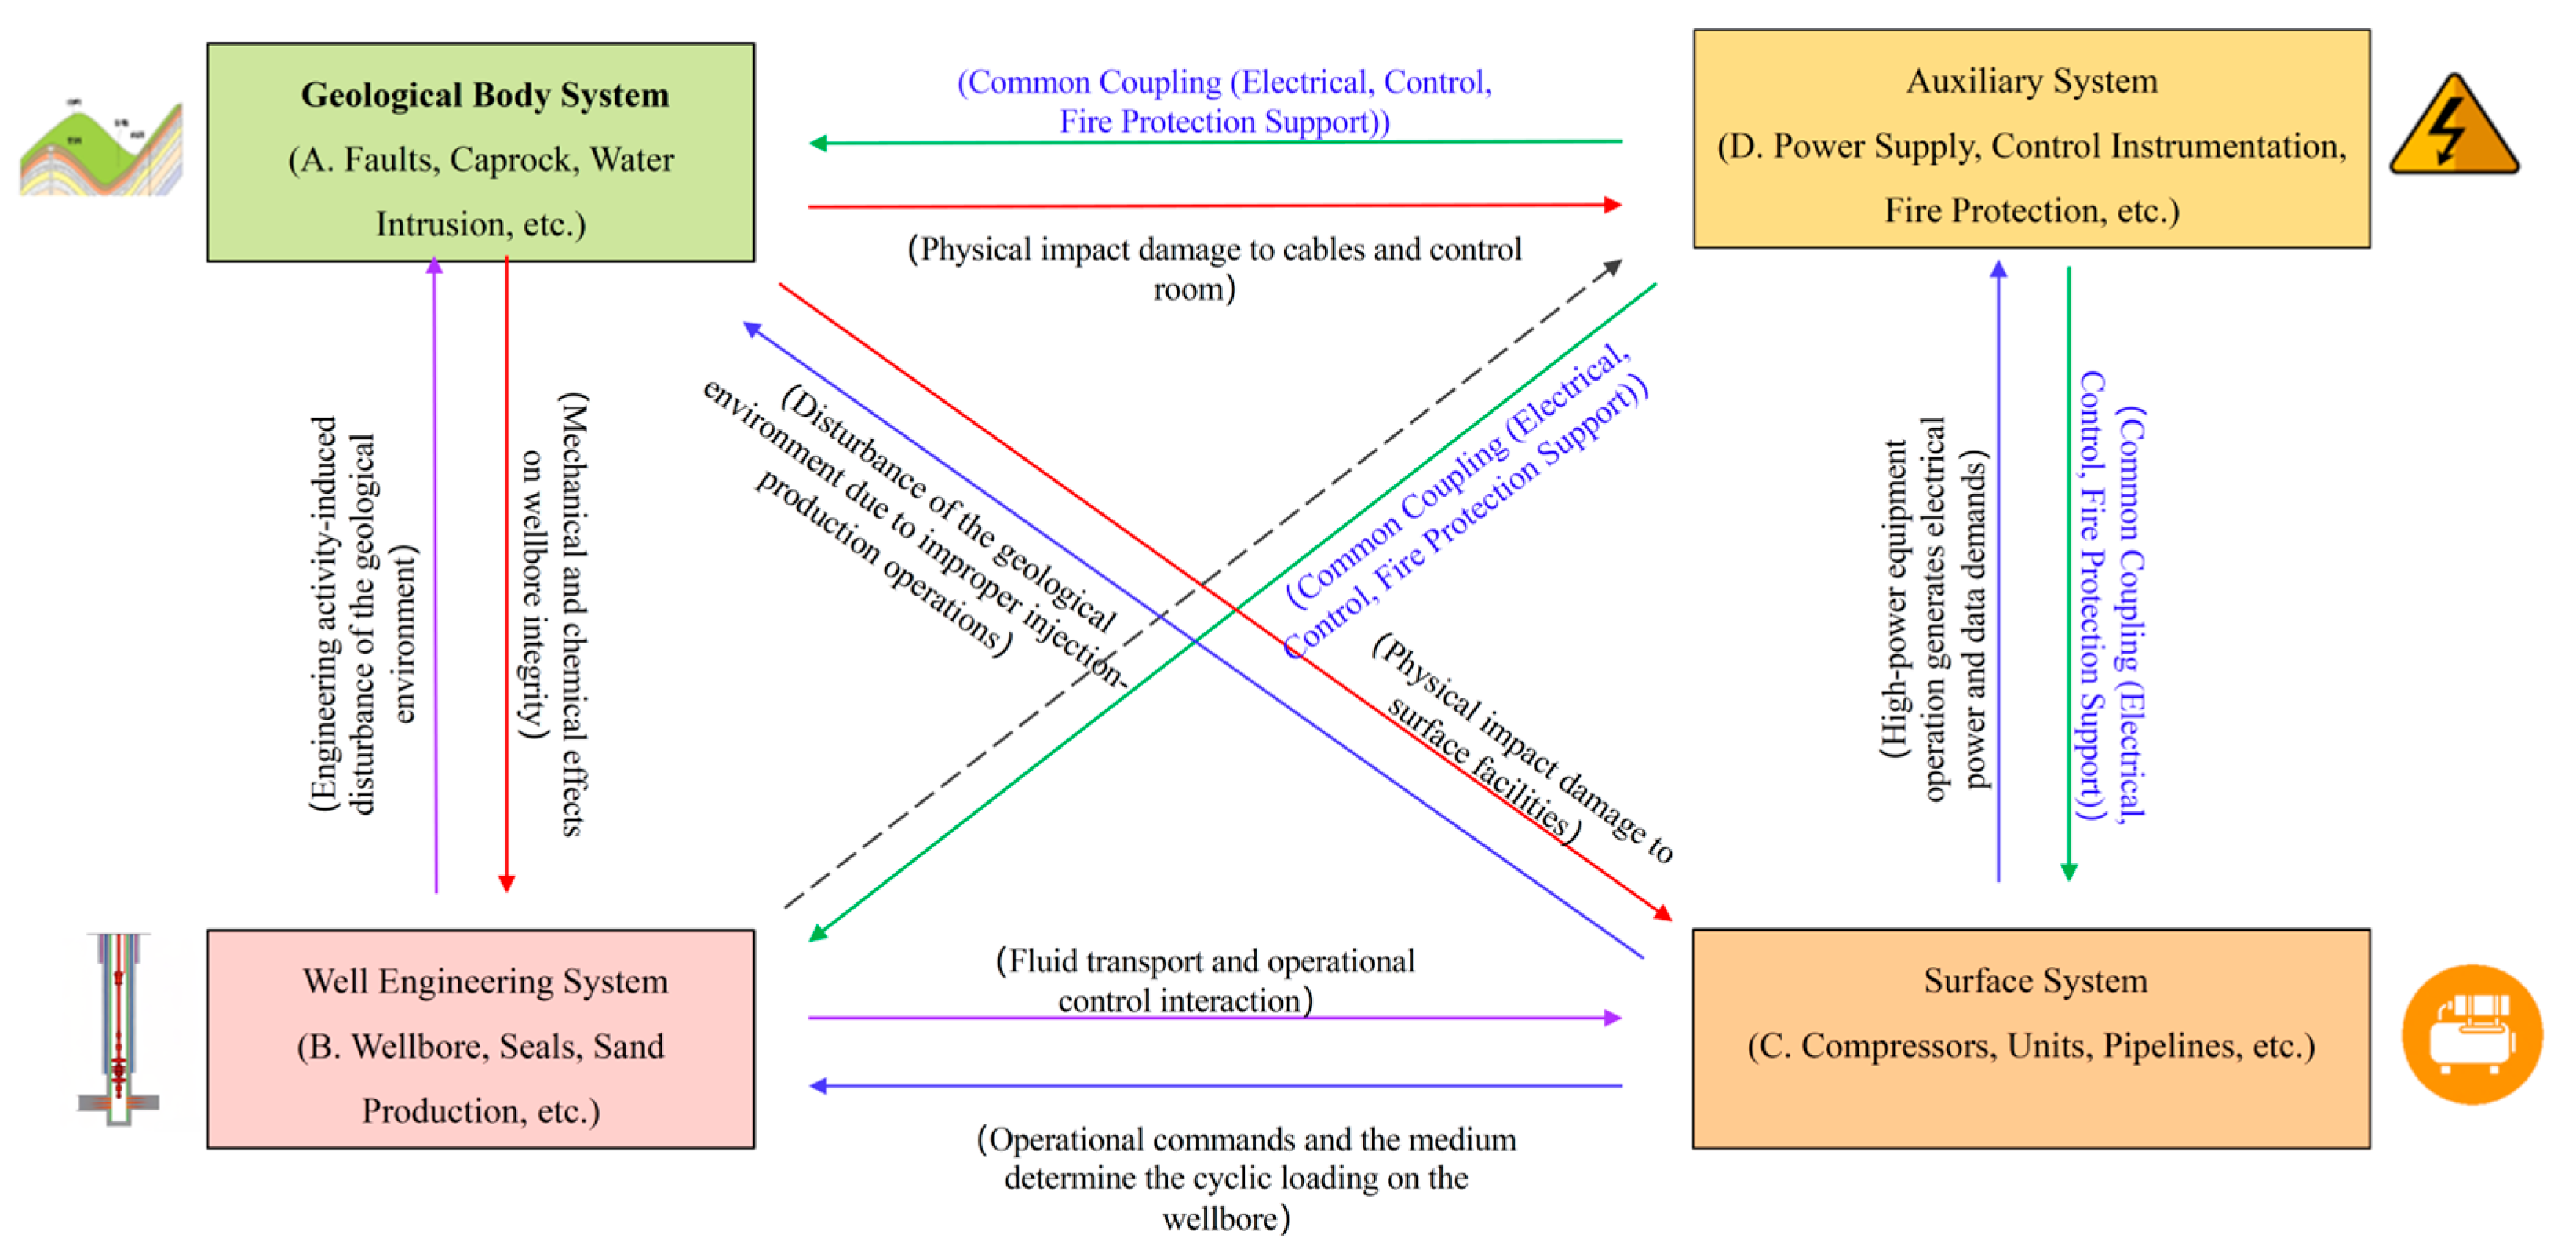
Based on the full-system risk inventory established in Section 2.1, the system-theoretic accident analysis method [7] is introduced to focus on the dynamic network mechanism through which risks are transmitted, amplified, and propagated across systems along energy flows, material flows, and information flows (as shown in Figure 1). Two coupling modes are identified: transmission coupling and common-cause coupling. Transmission coupling refers to chain-like risk conduction along process flows (e.g., “geological body → wellbore → surface equipment”) or control chains (e.g., “surface operation → wellbore load → geological stress”). Common-cause coupling refers to the parallel impact in which the failure of a single supporting system (e.g., power, control) simultaneously causes functional paralysis in multiple upper-level systems.
Taking the Xiangguosi gas storage as an example, the transfer coupling chain of ‘frequent compressor start-stop (C4) → wellbore alternating load → cement sheath seal failure’ was identified, as well as ‘plant-wide power outage (D1)’ as a typical common coupling source (as shown in Table 2). Coupling analysis transforms a static risk list into a dynamic interaction network, providing a structural correlation basis for subsequent quantitative assessment.

2.3. FTA-ERS-Game Theory Combined Weighting Model Integrating Coupled Network Analysis

To convert the risk coupling network into a quantifiable evaluation system and address the scientific issue of integrating subjective and objective weights, this paper develops a four-stage combined weighting model that incorporates coupling network analysis, named the Coupling Network-guided Game Theory weighting model (CN-GT). The core idea of this model is to respect and integrate two types of essentially different but equally important information: the first type originates from the system’s fault logic and is obtained through Fault Tree Analysis (FTA), providing a topology-based logical baseline, while the second type stems from experts’ long-term engineering practice and risk perception (a subjective information source) and is obtained through Expert Risk Scoring (ERS). The two are not homogeneous but complementary. To scientifically fuse these two types of heterogeneous information and overcome the one-sidedness of single weighting methods, a game theory-based deviation minimization model is introduced. This model aims to find an optimal set of combination coefficients that minimizes the total deviation between the final weights and all original weights, thereby achieving a balanced result that takes into account both “system objective facts” and “expert experience and wisdom”.
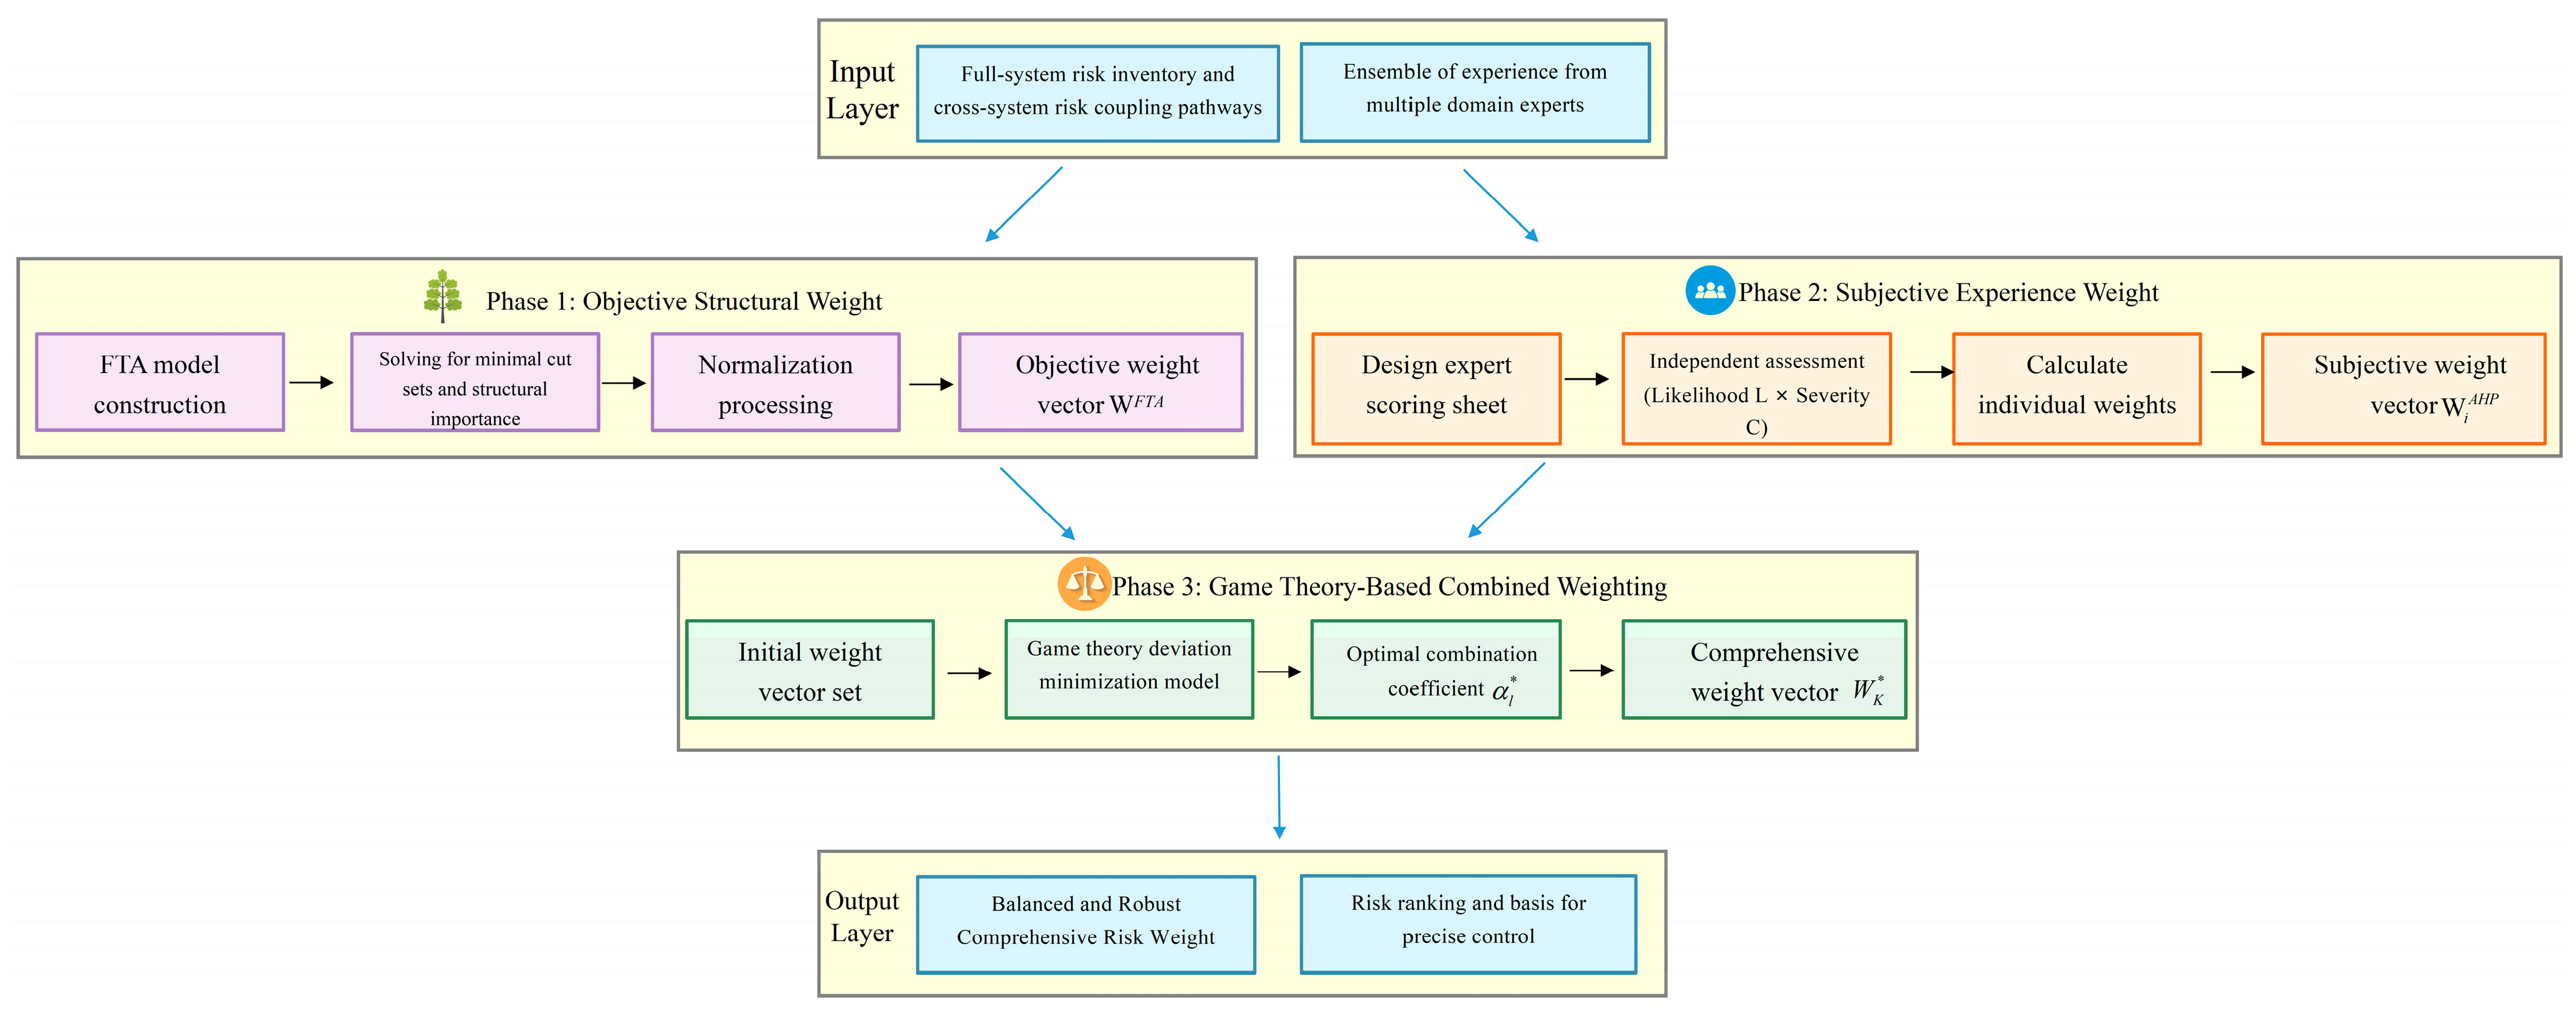
On this basis, the cross-system risk transmission paths identified through coupling analysis (as described in Section 2.2) are used to perform an integrated correction on the initial comprehensive weights, ensuring that the quantitative results truly reflect the transmission and amplification effects of risk factors across systems. The model strictly follows the four-stage framework of “objective structure → subjective cognition → combined weighting → coupling correction” (as shown in Figure 2).

2.3.1. Phase 1: Objective Weight Calculation Based on FTA

Using the critical coupling paths and risk factors identified in Section 2.2 as basic events, fault tree models are constructed with the top-level failures of subsystems A, B, C, and D as top events, respectively. Through Boolean algebraic operations, all minimal cut sets {Kj} for each fault tree are determined. To quantify the contribution of a basic event Xi to the occurrence of the top event, the theory of structural importance is introduced. It is worth noting that the structural importance coefficient reflects the topological vulnerability of the system, assuming all basic events have equal probabilities. It does not consider the actual failure probability (if failure rate data are available for all basic events, then probabilistic importance would be preferable). In this paper, an exact calculation method based on the order of minimal cut sets is adopted. The structural importance coefficient Iϕ(i) for event Xi is defined by Equation (1):
I ϕ ( i ) = K j Ω i 1 2 n j 1
Let Ω i be the set of minimum cut sets containing Xi, and let nj be the order of the minimum cut set Kj.
Normalize the calculated structural importance coefficients of each event, as shown in Equation (2):
W i F T A = I ϕ ( i ) k = 1 n I ϕ ( k )
n is the point of risk factors.
Thus, a set of topology-based logical weights derived from the fault tree structure is obtained:
W F T A = w 1 F T A , w 2 F T A , , w n F T A T
For cross-system risk factors (e.g., C4, A4, D1), the same basic event is explicitly included in the fault trees of all subsystems where it has a physical influence. For instance, C4 (improper compressor operation) appears in the fault trees of the geological body (as a stress disturbance), well engineering (as a cyclic load source), surface process (as a direct operational factor), and auxiliary system (as a power grid disturbance source).

2.3.2. Stage 2: Subjective Weight Calculation Based on ERS

To obtain subjective weights that reflect practical engineering experience, this study adopts a direct expert scoring method based on the risk matrix principle, referred to as Expert Risk Scoring (ERS). A scoring table covering all risk factors was designed, and five senior experts (p = 5) were invited to independently assess the risks of each factor within each subsystem based on their professional experience.
For the k-th expert and the i-th risk factor, the expert assigned an “occurrence likelihood” Lik on a scale of 1 (very low) to 5 (very high) and a “consequence severity” Cik on a scale of 1 (negligible) to 5 (catastrophic). The risk value Rik was then calculated as the product of the assigned likelihood and severity. For each expert, the subjective weight wik of the i th risk factor was obtained by normalizing its risk value over all n factors (Equation (4)), and the corresponding weight vector is given by Equation (5):
w i k = R i k j = 1 n R j k
W k E R S = w 1 k , w 2 k , , w n k T
wik is the subjective weight of the i-th risk factor under the evaluation of the k-th expert.
When scoring cross-system risk factors, each expert evaluates the likelihood and severity of the factor separately for each subsystem based on its distinct failure mechanism in that subsystem. For example, for C4 (improper compressor operation), the expert assigns one pair of (L, S) for its effect on the geological body, another pair for its effect on well engineering, a third pair for the surface process, and a fourth pair for the auxiliary system. The same principle applies to other cross-system factors such as A4 (reservoir-Induced Seismicity) and D1 (external power failure).

2.3.3. Stage 3: Combined Weighting Optimization Based on Game Theory

Assume that the topology-based logical weights provide one set of weight vectors WFTA, and the subjective information source consists of independent evaluation results from p experts (in this case, p = 5), yielding p sets of weight vectors W1ERS, W2ERS, …, WpERS. To integrate these p + 1 sets of heterogeneous information, the concept of game theory [41] is introduced. Each set of weights is regarded as a player participating in a “weight competition”, and a set of optimal combination coefficients is sought to minimize the total deviation between the combined weight and each original weight.
Suppose there are L = p + 1 sets of weight vectors (in this case, the FTA method and the ERS method from five experts, totaling six types), yielding L initial weight vectors wl, where l = 1,2, …, L. The goal is to find a set of non-negative linear combination coefficients αl that sum to 1, such that the sum of squared deviations between the combined weight vector W* =∑αw and each original weight vector is minimized. This optimization problem is ultimately transformed into solving the system of linear Equation (6) to obtain the optimal combination coefficients αl*:
w 1 w 1 T w 1 w L T w L w 1 T w L w L T α 1 α L = w 1 w 1 T w L w L T
For each specific risk factor k, its weight wk(l) under the l-th method is linearly weighted by the optimal combination coefficients αl* to obtain the final comprehensive global weight wk* for that factor:
w k = l = 1 L α l W k ( l )

2.3.4. Stage 4: Cross-System Risk Weight Integration Based on Coupling Network

The preceding steps (Section 2.3.1, Section 2.3.2 and Section 2.3.3) calculate the comprehensive global weight of each risk factor within a single system. However, the coupling analysis in Section 2.2 reveals that certain risk factors have significant cross-system effects: the same risk factor (e.g., improper compressor operation C4) may appear simultaneously in multiple systems—geological body (A), well engineering (B), surface process (C), and auxiliary systems (D)—and its true risk should equal the sum of its risk contributions across all relevant subsystems. This step represents the core technical contribution of the CN-GT model: it explicitly transforms the network topology identified by coupling analysis into an aggregation operator for weight calculation, thereby correcting the deficiency of traditional weighting methods in quantifying systemic coupling effects. As described in Section 2.3.1 and Section 2.3.2, each cross-system factor obtains separate subsystem-specific weights because it is included as a basic event in multiple fault trees and is scored independently by experts for each subsystem. These subsystem-specific weights are then aggregated using Equation (8).
To this end, the model aggregates the cross-subsystem weights of the same factor based on the cross-system paths identified by coupling analysis. Suppose a risk factor X is identified as a cross-system factor in the coupling analysis and exists in m subsystems, with the comprehensive weight calculated in each subsystem denoted as wk*(X) (k = 1,2, …, m). It is important to clarify that the summation used here does not assume a propagation probability of 1; rather, it reflects the fact that such a factor contributes to the overall system risk through distinct physical mechanisms in different subsystems. For example, improper compressor operation (C4) disturbs in-situ stress in the geological body, induces cyclic fatigue in the wellbore, directly affects compressor reliability in the surface system, and causes power grid fluctuations in the auxiliary system. Thus, its total contribution to the whole system is the sum of its subsystem-specific independent contributions. The final raw weight of X is defined as follows:
w f i n a l ( X ) = k = 1 m w k ( X )
After calculating wfinal (X) for all risk factors (including those appearing in only one subsystem), the entire weight vector is renormalized so that the sum of all final weights equals 1. This renormalization step eliminates any concern about double-counting and makes cross-factor comparisons meaningful. For risk factors that exist only within a single subsystem, they are included in the same renormalization process.
This step transforms the network structure information identified through coupling analysis (i.e., the pathways through which a risk factor affects multiple systems) into quantifiable weight aggregation, thereby embedding the coupling effects into the quantitative assessment results. Through this integration, cross-system factors (e.g., C4), which originally do not have the highest weights within individual subsystems, have their global importance revealed, reflecting their systemic impact transmitted across multiple systems.
It should be noted that there is a mathematical equivalence between the summation in Equation (8) and placing a shared basic event in a single global fault tree that covers all four subsystems. However, the modular approach adopted here is preferred for engineering reasons. Constructing a global fault tree for a system as large and interconnected as an underground gas storage would contain several hundred basic events, making the tree difficult to construct, audit, and maintain. The modular workflow—building separate sub-system fault trees, identifying cross-system factors through coupling analysis, and then aggregating weights—offers better transparency and traceability. The coupling analysis plays a critical role: it identifies which risk factors propagate beyond their original subsystems and which subsystems are affected. This identification is a prerequisite for the weight aggregation in Equation (8), and it is precisely what traditional single-system assessments lack. The complete set of coupling paths is provided in the Supplementary Material to ensure full traceability of the aggregation process.

2.4. Case Application: In-Depth Safety Risk Assessment of the Xiangguosi Gas Storage Facility

2.4.1. Case Overview

The Xiangguosi Underground Gas Storage facility is a seasonal peak-shaving gas storage facility reconstructed from a previously depleted gas reservoir. It features a large designed storage capacity, frequent gas injection and production cycles, and a wide operating pressure range. The system is fully integrated, encompassing complex geological structures with fault systems, multiple injection-production wells, surface processes at the gathering and injection station, as well as supporting power and automatic control systems. It represents a typical complex gas storage system, making it well-suited as a case study for applying this method.

2.4.2. Risk Identification and Coupling Analysis Results

Using the full-system risk identification framework, a structured identification was carried out for the four major subsystems, resulting in a total of 129 specific risk factors (10 for the geological body, 25 for well engineering, 53 for the surface process system, and 41 for the auxiliary system). This forms a complete risk inventory covering the geological body, well engineering, surface processes, and auxiliary systems.
On this basis, the risk transmission logic based on system coupling theory was employed to further analyze the coupling influence paths among the subsystems. Typical examples are shown in Table 3. Risks can propagate along multiple paths between subsystems: for instance, failure of the wellbore barrier in well engineering can create a channeling flow path, compromising the sealing integrity of the geological body (transfer coupling); improper operation of surface process compressors can disturb the in-situ stress field and activate faults (transfer coupling); while an external power failure in the auxiliary system can simultaneously cause shutdown of surface processes and failure of the wellbore protection system (common coupling). Conversely, in-situ stress and corrosive media from the geological body can lead to deformation and corrosion of the well engineering tubular string, and seismic activity within the geological body can directly damage surface pipelines and auxiliary facilities. The analysis shows that risks can propagate and amplify along multiple paths among subsystems, and it is difficult to fully grasp the overall risk profile of the gas storage facility from the perspective of a single subsystem alone.

3. Results

3.1. Subsystem Comprehensive Weight

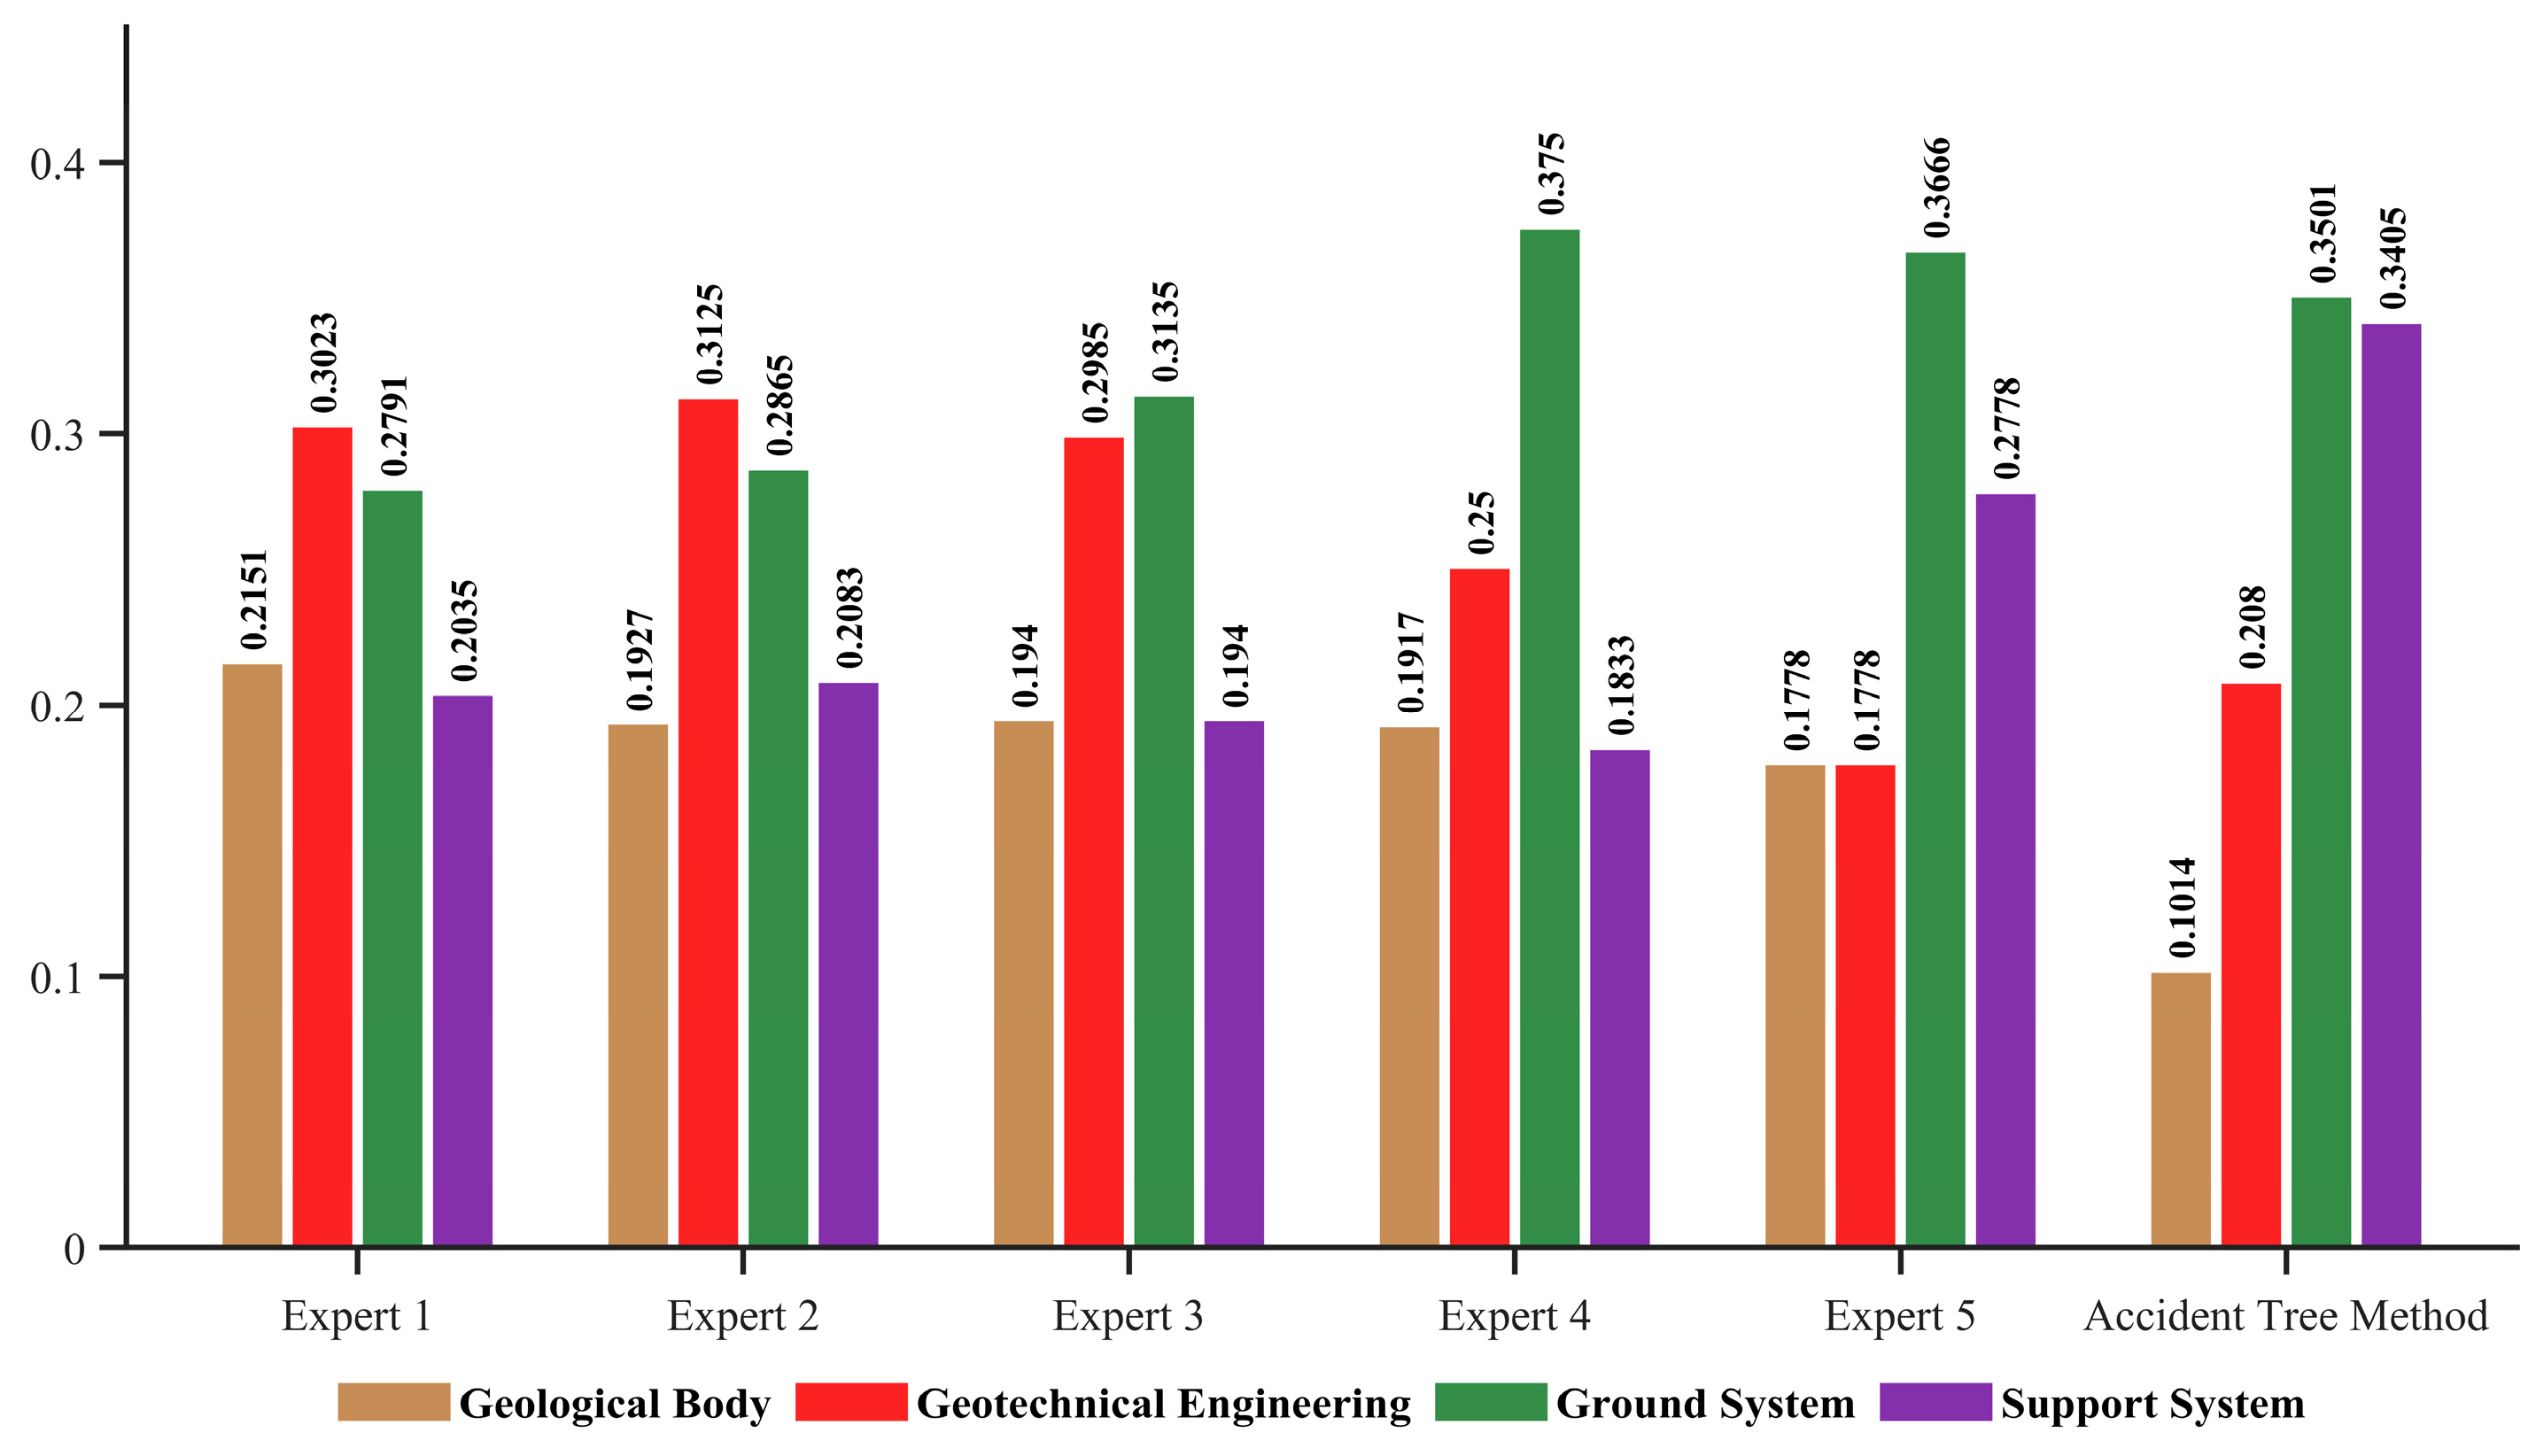
To determine the comprehensive global weights of each specific risk factor, six initial weight vectors from topology-based logical weights (FTA) and subjective information sources (five experts using ERS) were first calculated based on Section 2.3.1 and Section 2.3.2, respectively. The weight distributions of the four subsystems assigned by each information source are shown in Figure 3. Figure 3 indicates that both the fault tree analysis and the expert scoring identify the surface process system as the primary risk source, but they differ on the secondary risk sources: the fault tree analysis considers the auxiliary system as having higher risk, whereas the expert consensus focuses more on the well engineering system. This discrepancy suggests that a single information source cannot fully reflect the risk structure of the system, necessitating the introduction of game theory combination weighting to achieve a balanced fusion of objective and subjective information sources.
Based on this, the deviation minimization model of game theory described in Section 2.3.3 is applied for combination weighting. The optimal combination coefficients for the topology-based logical weights (FTA) and the five subjective expert sources are calculated as 0.170, 0.159, 0.164, 0.167, 0.172, and 0.168 (arranged in the order of FTA, Expert 1 to Expert 5). Using these coefficients to linearly weight the six sets of weights, the comprehensive weights of each subsystem are obtained: surface process system (C) 32.93%, well engineering system (B) 25.75%, auxiliary system (D) 23.51%, and geological body system (A) 17.83%. This result indicates that, during the current operational phase of the Xiangguosi Underground Gas Storage Facility, the combined risk contribution of the surface process system and the auxiliary system exceeds 56%, making them the top priorities for risk management. This is closely related to their extreme dependence on equipment reliability and system stability, given the facility’s operation as a high-load plant.

3.2. Overall Risk Factors Prioritization

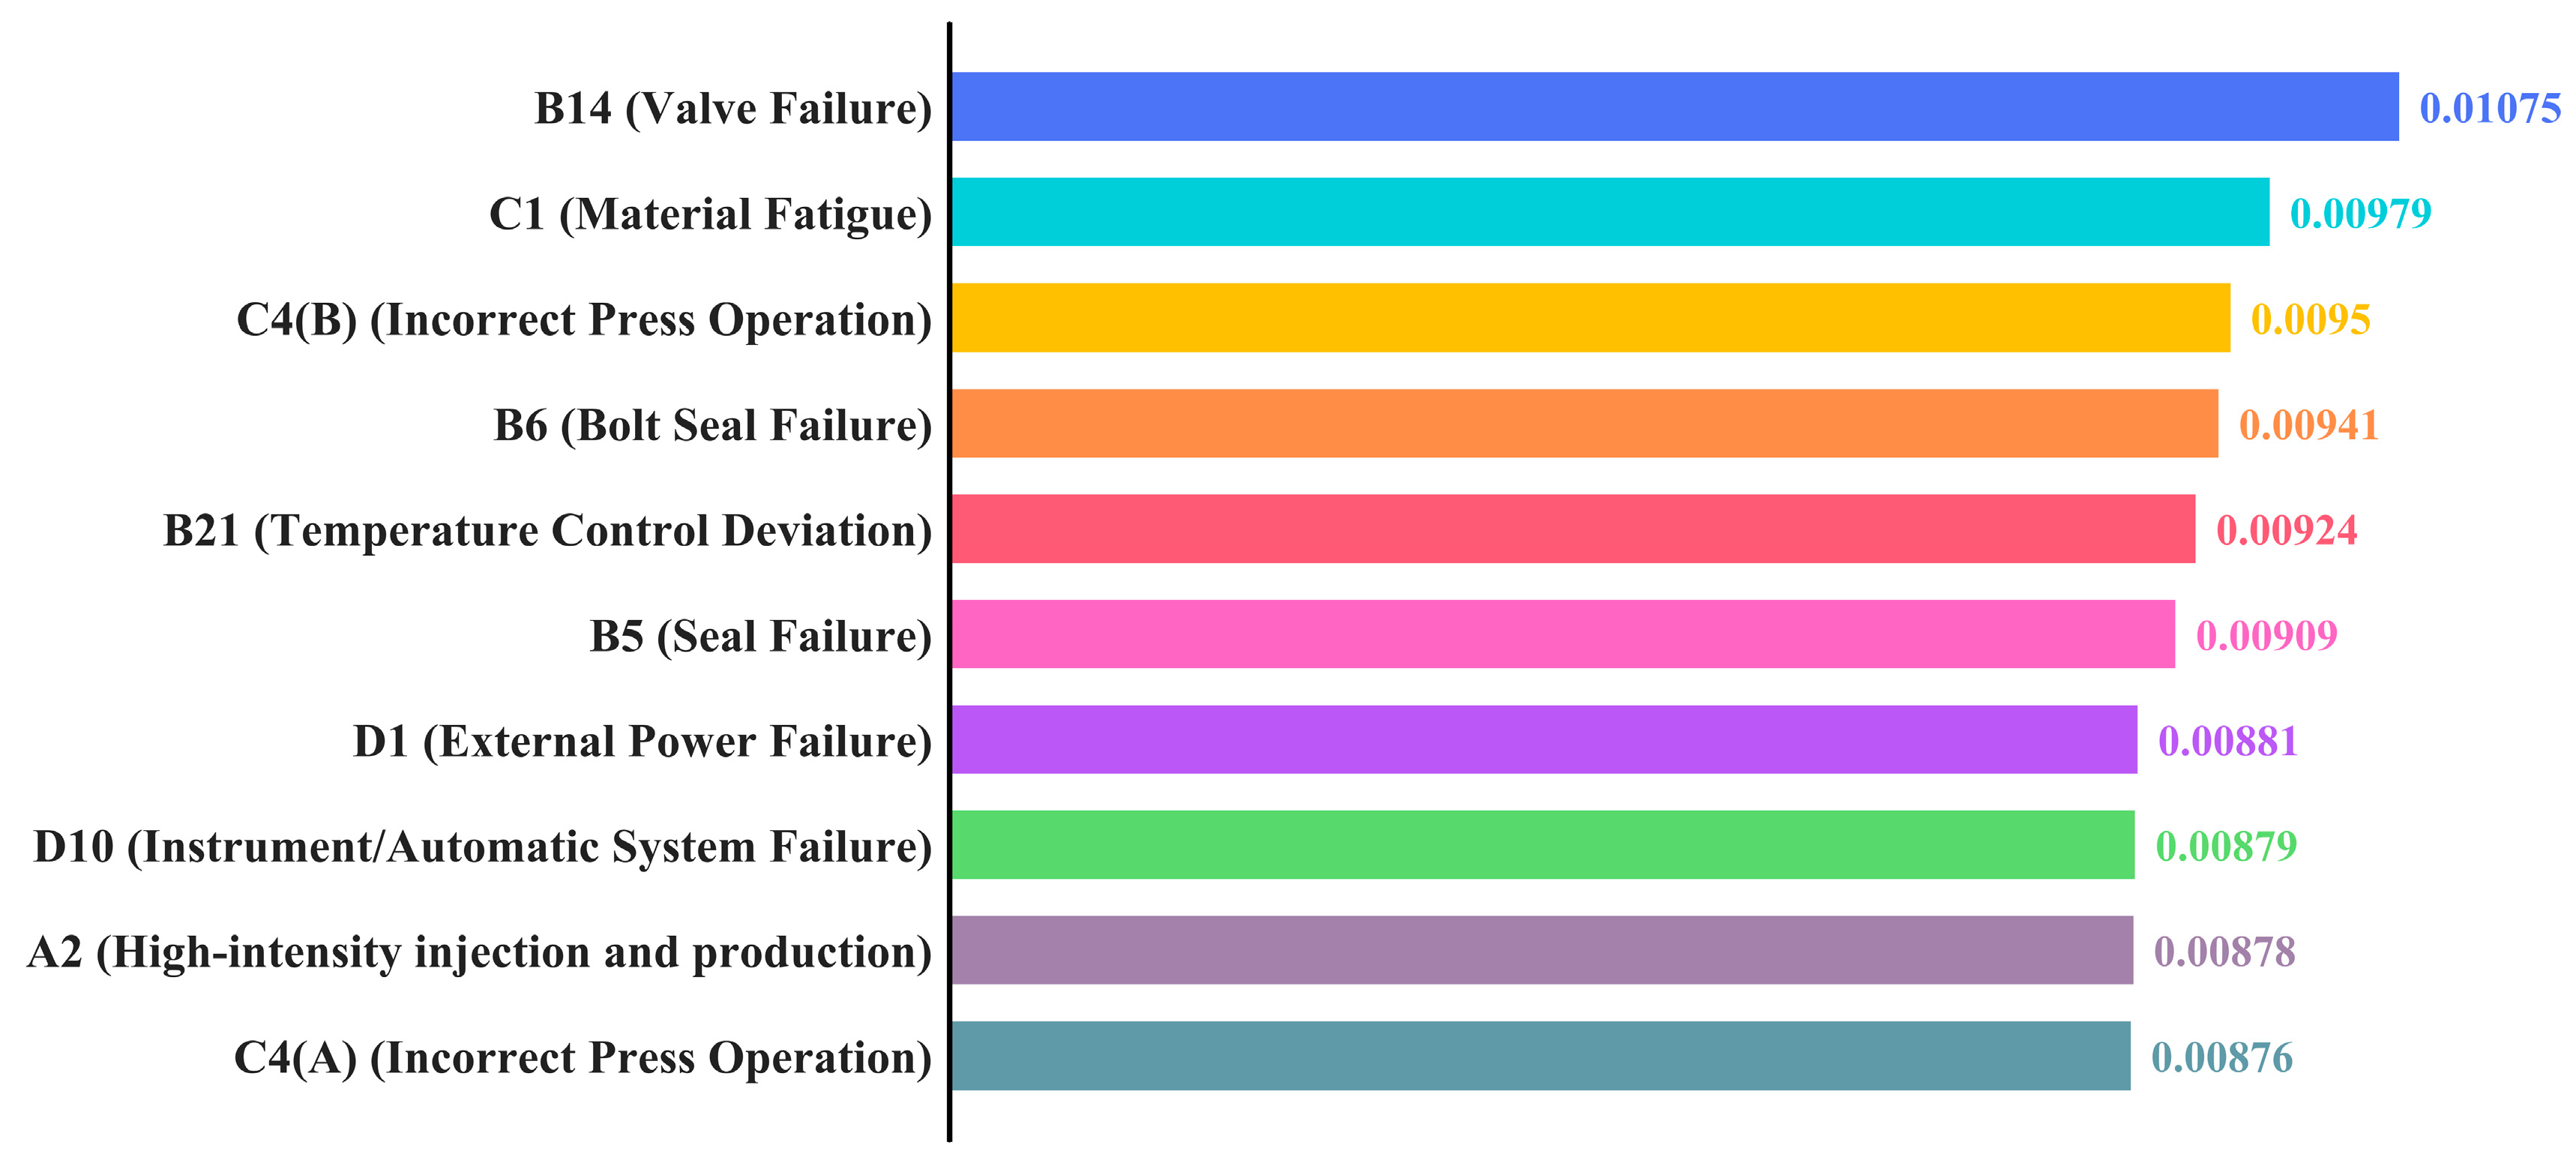
Rank the comprehensive global weights of each risk factor, extract those with extremely high risk levels, and form a priority list for risk control, as shown in Figure 4. The analysis indicates that the TOP 10 factors are highly concentrated in wellbore integrity (Category B, accounting for 5 items) and critical equipment reliability (Categories C and D). For example, the highest-ranked “B14” and the third-ranked “C4” are both acute and explicit risks that can directly lead to gas leakage or production interruption. Their high weights are highly consistent with the focus of engineering practice.
It should be noted that the coupling effects of risk factors across systems are expressed in the form of “factor (system)”. For instance, C4 (A) represents the impact of risk factor C4 from the surface process system on the geological body system.

3.3. Coupling-Induced Weight Adjustment Outcomes

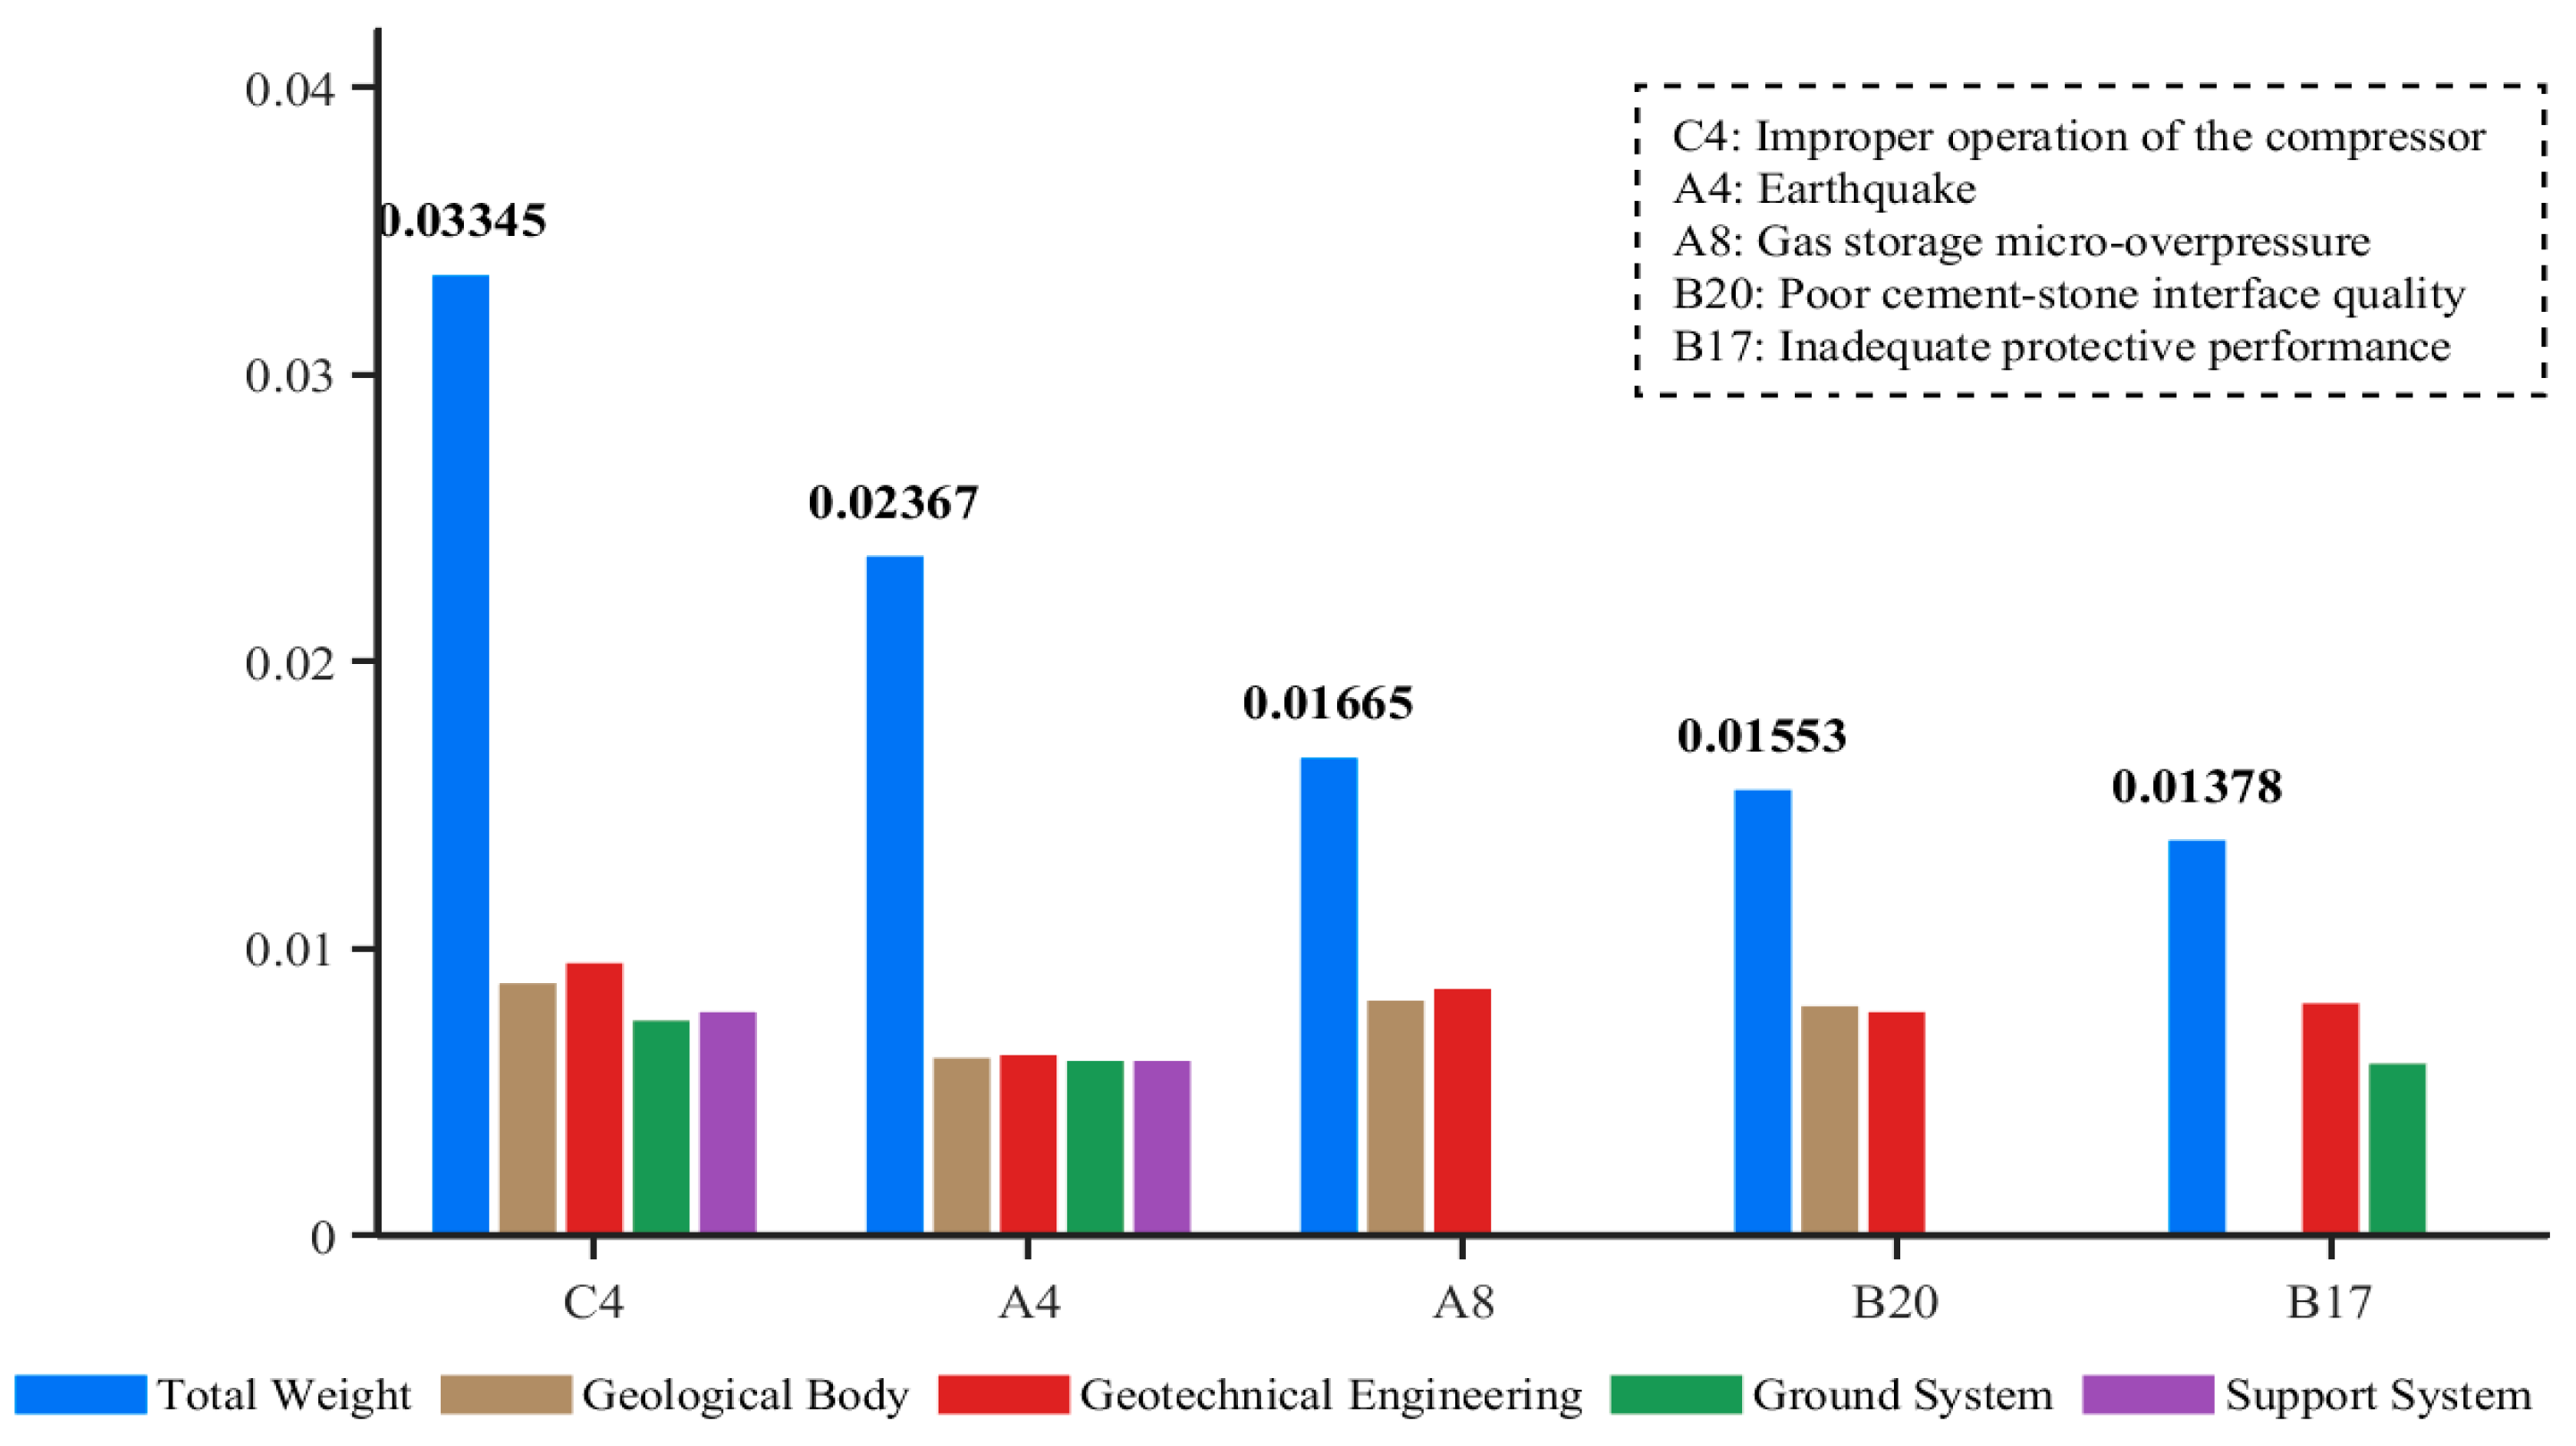
To quantitatively verify the conclusions of the coupling analysis and to demonstrate the effectiveness of the integration procedure described in Section 2.3.4, this paper performs weight integration for the key cross-system risk factors identified through coupling analysis. Taking “Improper Compressor Operation (C4)” as an example, the initial comprehensive weights distributed across subsystems are as follows: geosphere 0.00876, well engineering 0.00950, surface process 0.00756, and auxiliary system 0.00763. After coupling-based integration, the final weight is obtained as:
w f i n a l ( C 4 )   =   0.00876   +   0.00950   +   0.00756   +   0.00763   =   0.03345
Similarly, the integrated weight of A4 is 0.02367 (with subsystem contributions: 0.00611, 0.00604, 0.00577, 0.00575).
Engineering significance analysis of pre- vs. post-integration weights: Figure 5 illustrates the integrated weights of selected cross-system risk factors and their subsystem contribution compositions. Among them, C4 exhibits the highest integrated weight (0.03345), followed by A4 (0.02367). Both factors show relatively balanced contributions across subsystems, reflecting their coupled propagation characteristics across multiple systems. In contrast, A8, B20, and B17 are predominantly concentrated on geological-wellbore or wellbore-surface pairwise coupling paths.
The key insight is that if assessed in isolation within individual subsystems, neither C4 nor A4 ranks among the top factors within their respective subsystems, and they might be misjudged as moderate-risk factors. However, through coupling analysis to identify their cross-system impacts and subsequent weight integration, their global importance rises to the top, truly reflecting the systemic risk characteristic of “a small disturbance in one part may affect the whole system”. This demonstrates that neglecting risk coupling would significantly underestimate the true importance of core risks, and also validates the value of the integrated framework of “coupling analysis—weight integration—quantitative assessment”.
It should be noted that pre-integration (intra-subsystem) and post-integration (cross-system aggregated) risk weights are not substitutes for each other but serve different management levels. Pre-integration weights focus on the intrinsic risk depth within subsystems, providing each professional team with a direct “tactical checklist” for inspection, maintenance, and spare part provisioning. Post-integration weights reflect the propagation breadth and coupling associations of risk sources across the entire system, offering management a “strategic map” for optimizing resource allocation, identifying common-cause failures, and developing cross-departmental coordination strategies. The two are complementary, together constituting a complete risk quantification view from the execution level to the decision-making level.

4. Discussion

4.1. Verification of the Necessity of Coupling Correction

To verify the necessity of the coupling weight integration step, this paper designs an ablation experiment that compares the ranking results of the model without coupling correction (M1) and the full CN-GT model (M2) (Table 4). The results show that M1 ranks “Improper Compressor Operation (C4)” at 36th place, while M2 pushes it to the top, a surge of 35 positions; moreover, the ranking of “Reservoir-Induced Seismicity (A4)” jumps from 82nd to 2nd place.
This remarkable ranking reversal reveals a hidden risk amplification mechanism within the coupling network. Within traditional subsystem boundaries, C4 is merely regarded as an operational deviation event in the surface process system, with limited local structural importance. However, once its impacts along the propagation chain of “compressor start/stop → wellbore alternating load → cement sheath seal degradation → gas migration” are explicitly aggregated across the geosphere, wellbore, and surface subsystems, its true systemic criticality becomes apparent. In other words, the risk of C4 does not stem from a high occurrence probability of the event itself, but from its position as a “critical node” in the coupling network topology—it serves as the starting point of a propagation chain that can trigger multi-system cascading failures.

4.2. Comparative Analysis with Existing Risk Assessment Methods

This paper selects the traditional risk matrix and the FTA-fuzzy comprehensive evaluation as benchmark methods, and conducts a horizontal comparison from three dimensions: common coupling characterization, transitive coupling characterization, and risk distinguishability (Table 5).
The comparison in Table 5 reveals a fundamental paradigm difference. Traditional methods such as the risk matrix and FTA-based fuzzy comprehensive evaluation are essentially component- or subsystem-based assessment paradigms: they decompose the system into several independent units, evaluate the risk of each unit separately, and then form an overall risk profile through linear superposition or logic gate combinations. This paradigm is effective for loosely coupled systems, but for highly coupled complex systems such as gas storage facilities—where the “geology–wellbore–surface” subsystems are tightly integrated—it systematically overlooks emergent risks arising from cross-unit interactions.
In contrast, the CN-GT model represents a network-based assessment paradigm. Under this paradigm, the final weight of a risk factor depends not only on its local failure probability but also on its topological position and transmission capability within the cross-system coupling network. The reason why C4 escalates from a moderate local risk to the primary global risk is precisely that it serves as a critical node in the coupling network—a node where a disturbance can propagate throughout the entire system. This paradigm shift is highly consistent with current frontiers in safety science, where a growing body of research indicates that major accidents in complex socio-technical systems often stem not from individual component failures, but from unforeseen interactions among system components.

4.3. Limitations and Future Directions of Quantitative Comparison

It should be noted that this paper does not present a numerical comparison with the above-mentioned methods based on the same dataset, primarily due to the following objective constraints: First, mainstream methods such as the traditional risk matrix and FTA-fuzzy comprehensive evaluation are essentially qualitative or semi-quantitative assessments, whose outputs are mostly discrete risk levels or fuzzy interval values. In contrast, the CN-GT model proposed in this paper yields continuous numerical weights. The two types of outputs are not directly comparable in terms of dimension or numerical scale. Second, there is no publicly available unified database of failure probabilities specific to the underground gas storage (UGS) domain, which prevents the establishment of a standardized quantitative benchmarking input for different methods. Forcibly constructing a synthetic dataset could instead introduce additional uncertainties. Third, historical incident and near-miss records at Xiangguosi are documented only qualitatively (e.g., event descriptions without quantified likelihood-severity scales), and therefore, cannot provide the numerical benchmarks needed to directly validate the continuous weight outputs of the CN-GT model. Consequently, a quantitative external validation against historical records is not performed.
To partially compensate for the lack of quantitative external validation, we assessed the robustness of our results against individual expert variation by performing a sensitivity analysis using the five expert weight vectors on the four subsystems (geological body, well engineering, surface process, auxiliary). For each subsystem, the highest and lowest expert weights were removed, and the remaining three were averaged to obtain a consensus expert weight vector. This consensus vector was then combined with the FTA-derived objective weights by simple averaging. The resulting subsystem ranking was compared with the original game-theoretic ranking using Spearman’s rank correlation coefficient, yielding ρ = 0.8. This indicates that the overall risk prioritization is stable against individual expert variation.
A practical observation regarding the game-theoretic combination is that the optimal coefficients in this case study are nearly uniform (0.159–0.172). This uniformity is not a methodological weakness but a reflection of high consistency between the objective and subjective information sources. The FTA was developed through in-depth technical exchanges with the Xiangguosi facility, and the five experts are all senior engineers with long-term operational experience in the field of gas storage safety. Consequently, their subjective judgments naturally align with the objective analysis. Under such consistency, a simple arithmetic average would produce essentially the same risk ranking as the game-theoretic result. Nevertheless, the game-theoretic formulation is retained because it provides a principled framework for combining heterogeneous information sources when they diverge (e.g., when applying the method to different gas storage types or integrating operational data).
Furthermore, the current CN-GT model has several limitations that warrant attention. First, the model relies on a static FTA structure and expert-based ERS judgments, and does not yet fully account for the dynamic evolution of coupling strength with varying operating conditions (e.g., intensive injection-withdrawal periods versus shut-in periods). Second, the identification of coupling paths is currently based on expert experience; future work could explore data-driven causal discovery algorithms to automatically mine potential coupling relationships from historical monitoring data. Finally, validation of the model currently depends on ablation experiments and methodological comparisons. As integrity management data for UGS facilities accumulate, quantitative comparison and validation based on measured data will represent an important direction for further deepening the research. Fourth, the current model does not take into account the attenuation coefficient along the propagation path. Once sufficient field data regarding the propagation probability of a specific path is obtained, a more refined model incorporating path strength or attenuation factors can be developed in the future. Fifth, the expert panel in this study consists of five senior engineers from gas storage operator companies. While their extensive operational experience ensures the practical relevance of the subjective weights, the limited diversity of their backgrounds may introduce shared biases. Future work should involve a more diverse panel, including academic researchers and equipment manufacturers, to further enhance the generalizability of the results. Sixth, the FTA-derived weights in this study are based on structural importance, which assumes equal failure probability for all basic events and does not incorporate actual failure rates. This was a practical choice due to the current lack of systematic failure rate data for the 129 specific risk factors. When such data become available, probability importance or criticality importance could replace structural importance to further improve the accuracy of the model.

4.4. From Static Assessment to Dynamic Control Design

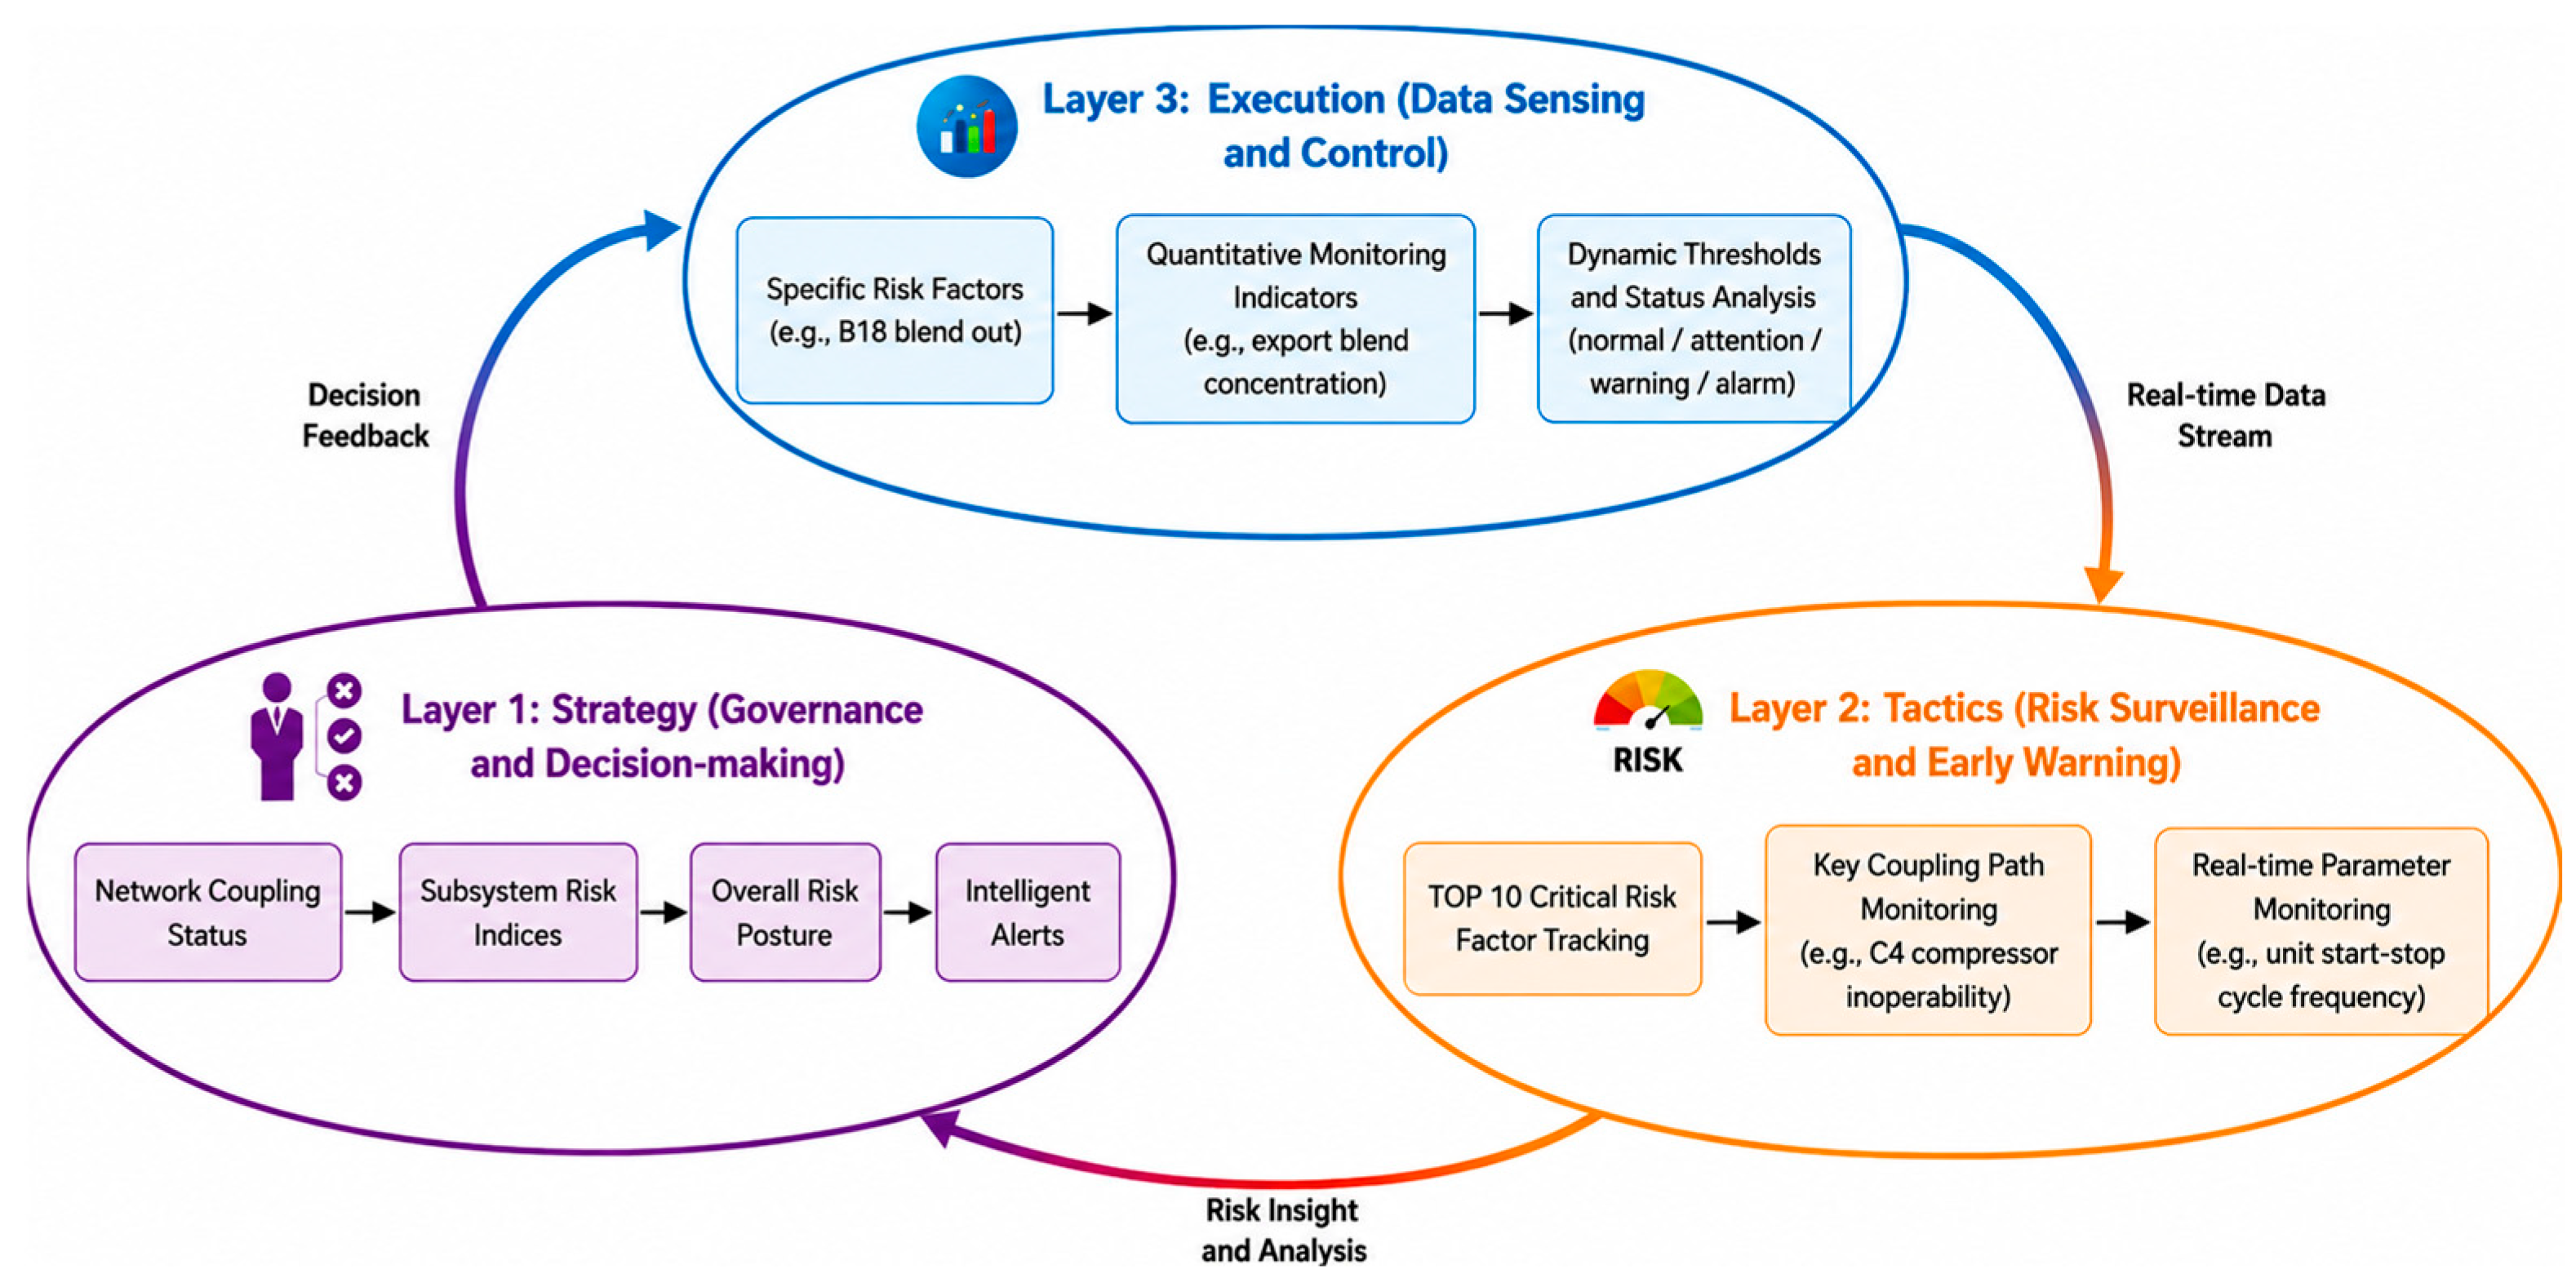
The above assessment results provide a static priority list for risk control. However, the operating conditions of an underground gas storage are dynamically variable, and the risk pattern evolves accordingly. To transform the assessment conclusions into a management tool capable of real-time response, this paper further proposes a three-tier “strategy-tactics-execution” dynamic monitoring indicator system as a conceptual framework to bridge static assessment and dynamic control, as illustrated in Figure 6.
Strategic Level: Corresponds to the comprehensive weights of the four subsystems determined in this study. By acquiring real-time status data of risk factors subordinate to each subsystem and performing weighted integration using their comprehensive weights, the macro risk index of the entire underground gas storage (UGS) is dynamically calculated and displayed.
Tactical Level: Focuses on the top 10 extremely high-risk factors and key coupling paths. For example, for the core node “compressor improper operation (C4)” revealed by the coupling analysis, real-time process parameters such as “start-stop frequency per unit time” and “standard deviation of outlet pressure fluctuation” can be associated for monitoring and early warning.
Execution Level: Maps specific risk factors to measurable indicators (e.g., associating the risk of “B18 pay zone sand production” with “monitored wellhead sand concentration”) and establishes a four-level dynamic threshold of “normal—watch—warning—alarm”. For example, for C4 (improper compressor operation), the risk level is assessed based on the frequency of start/stop cycles: 0% corresponds to operation within the recommended range; 50% indicates that the start/stop frequency approaches or slightly exceeds the recommended range without obvious damage to the unit; 100% corresponds to prolonged or severe exceedance, including emergency trips, loaded starts, or short-interval start/stop cycles that have caused abnormal vibration, sudden temperature changes, or component damage. For B18 (pay zone sand production), the risk level is assessed as follows: 0% when no sand production is detected; 50% under intermittent minor sand production; 100% under sustained severe sand production that has caused choke or pipeline blockage. These threshold values are derived from compressor manufacturer specifications, field operating logs at Xiangguosi, and industry standards, and should be calibrated to actual site conditions when applied.
The core value of this three-level framework lies in transforming the assessment results from a “one-time report” into a “continuous decision support system”. At the strategic level, subsystem weights provide a quantitative scale for macro safety situation awareness. At the tactical level, coupling-corrected key risk factors (e.g., C4) guide managers to pay attention to cross-system transmission nodes that are easily overlooked by traditional monitoring systems. At the execution level, specific thresholds convert abstract risks into actionable alerts that frontline personnel can respond to immediately. This framework offers a practical theoretical bridge for the transition of UGS safety management from “passive response based on periodic inspection” to “active early warning based on dynamic risk monitoring”.
The proposed framework has not yet been tested against historical events at Xiangguosi; this validation will be carried out in future work as operational data accumulate.

5. Conclusions

This paper addresses the issues of unclear coupling mechanisms and the imbalance between subjective and objective weights in the risk assessment of gas storage facilities. It proposes a comprehensive evaluation framework that integrates system coupling analysis with game-theoretic combination weighting and validates the effectiveness of the proposed methodology through a case study of the Xiangguosi gas storage facility. The main conclusions are as follows:
A “geology–wellbore–surface–auxiliary” system-wide risk transmission and coupling mechanism analysis framework was constructed, wherein two critical pathways—transmission coupling and common-cause coupling—were identified. This framework reveals the dynamic, networked mechanisms by which risk factors propagate, amplify, and even generate new risks across subsystems, thereby providing a novel analytical perspective for systemic risk identification.
By integrating Fault Tree Analysis (FTA) with the Expert Risk Scoring (ERS) and introducing a game-theoretic deviation minimization model, a coupling-network-guided game-theoretic fusion model (CN-GT) was proposed, achieving a balanced integration of subjective and objective weights. This approach effectively overcomes the limitations inherent in single-weighting methods and enhances both the scientific rigor and the applicability of risk assessment for complex systems.
The case study demonstrates that risk coupling effects are significant: the integrated weights of cross-system nodes such as “compressor misoperation” and “reservoir-induced seismicity” substantially exceed their weights within individual subsystems, confirming that isolated assessment can severely underestimate systemic risk. Wellbore integrity failure and critical equipment reliability were identified as the current extremely high-risk nodes, while the subsystem weight ranking provides a quantitative basis for the optimal allocation of resources.
The necessity and superiority of the CN-GT model were validated through ablation experiments and comparisons with benchmark methods. The results show that removing the coupling correction step leads to a substantial decline in the ranking of critical cross-system risks (e.g., C4 drops from 1st to 36th place). Compared with the conventional risk matrix and the FTA–fuzzy comprehensive evaluation method, the proposed approach demonstrates distinct advantages in terms of both the capacity to characterize coupling effects and the degree of risk differentiation.
This study adopts a depleted gas reservoir type storage facility as the case study, and the specific weight rankings obtained are influenced by the geological conditions and operational status of this particular facility. Nevertheless, the proposed assessment framework—comprising “system coupling analysis–heterogeneous information fusion–cross-system weight integration”—exhibits methodological generalizability to different types of gas storage facilities (e.g., salt cavern type, aquifer type) and different operational stages (e.g., construction phase, capacity ramp-up phase). When extending and applying the framework, parameters such as the risk factor inventory, fault tree structure, ERS judgment matrices, and risk determination criteria should be tailored to the typological characteristics of the target storage facility. Future research will further verify the adaptability of the methodology through multi-case comparative studies and explore a dynamic weight updating mechanism informed by real-time monitoring data.

Supplementary Materials

The following supporting information can be downloaded at: https://www.mdpi.com/article/10.3390/en19133041/s1, Attachment S1: List of Risk Factors; Attachment S2: Cross-system Coupling Path; Attachment S3: Boolean Algebra Expressions (Fault Tree Logic Equations); Attachment S4: Complete expert scoring data; Attachment S5: Weight of risk factors.

Author Contributions

Conceptualization, G.L.; methodology, W.M., J.Z. and G.L.; software, W.M. and Y.D.; validation, W.M., J.Z., Y.D., J.L. (Jiayi Liu), D.H., K.Z., J.L. (Jiayi Liu), G.L. and J.H.; formal analysis, W.M., J.Z. and Y.D.; investigation, W.M., J.Z., Y.D., J.L. (Jiayi Liu), D.H. and K.Z.; resources, G.L. and J.H.; data curation, W.M., J.Z., Y.D., J.L. (Jiayi Liu), D.H. and K.Z.; writing—original draft preparation, W.M., J.Z. and Y.D.; writing—review and editing, G.L., J.L. (Jie Liu) and J.H.; visualization, W.M., J.Z. and Y.D.; supervision, G.L.; project administration, G.L.; funding acquisition, G.L. All authors have read and agreed to the published version of the manuscript.

Funding

This research received no external funding.

Data Availability Statement

The data presented in this study are not publicly available due to confidentiality restrictions. Requests to access the data should be directed to the corresponding author.

Acknowledgments

The authors would like to thank the editor and anonymous reviewers for their valuable comments and suggestions, which greatly improved the quality of this paper.

Conflicts of Interest

Authors Wei Mao, Juan Zeng, Yumeng Deng, Jiayi Liu, Dongyuan Huo and Ke Zhong were employed by the company Chongqing Xiangguosi Gas Storage Co., Ltd. The remaining authors declare that the research was conducted in the absence of any commercial or financial relationships that could be construed as a potential conflict of interest.

Abbreviations

The following abbreviations are used in this manuscript:
ERSExpert Risk Scoring
CG-NTCouping Network-guided Game Theory
FTAFault Tree Analysis

References

  1. Nie, C.; Gu, X.; Liu, L.; Zhang, J.; Nie, Z.; Wang, Y.; Zhou, R.; Liang, X. Joint Peak Shaving Mechanism of Pipeline Gas Storage: Case Study of West-East Gas Pipeline. E3S Web Conf. 2024, 520, 7. [Google Scholar] [CrossRef]
  2. Liu, J.X.; Liu, Y. Development Status and Prospect of Underground Gas Storage Construction in China. Appl. Chem. Ind. 2022, 51, 1136–1140+1145. [Google Scholar]
  3. Ministry of Emergency Management of China. Guidelines for Safety Risk Assessment of Underground Gas Storage (Trial); Ministry of Emergency Management of China: Beijing, China, 2025.
  4. Xu, Q.; Liu, H.; Song, Z.; Dong, S.; Zhang, L.; Zhang, X. Dynamic risk assessment for underground gas storage facilities based on Bayesian network. J. Loss Prev. Process Ind. 2023, 82, 104961. [Google Scholar]
  5. Hu, Y. Study on Leakage Accident Evolution Mechanism of Depleted Oil and Gas Reservoir Underground Gas Storage. Ph.D. Thesis, Southwest Petroleum University, Chengdu, China, 2022. [Google Scholar]
  6. Yu, J.; Ding, H.; Wu, S.; Zeng, Q.; Ma, W. Risk assessment of domino effects under fire and explosion accidents in LNG storage tank farms based on Bayesian network. J. Loss Prev. Process Ind. 2025, 93, 105201. [Google Scholar] [CrossRef]
  7. Hu, J.Q.; Dong, S.H.; Wang, R.H.; Zhang, X.Y. Construction of a typical accident forward model for LNG reserve depot based on STAMP-STPA. Pet. Sci. Bull. 2021, 6, 481–493. [Google Scholar]
  8. Xie, S.; He, B.; Chen, L.; Xu, K.; Luo, J.; Li, L.; Wang, B. Key Elements in Integrity Management of Underground Gas Storage: A Framework for Energy Safety. Energies 2025, 18, 378. [Google Scholar] [CrossRef]
  9. Baronio, E.; Busollo, C.; Abdo, E. Implementation of a Risk Assessment Procedure to Manage Well Integrity in Underground Gas Storage. In Proceedings of the SPE Europe Energy Conference and Exhibition, Turin, Italy, 26–28 June 2024. [Google Scholar]
  10. Sun, Y.B.; Liu, J.W.; Li, W.J. Risk assessment of pressure reduction and blowdown operations in gas transmission stations based on 2GW-HAZOP and deviation degree. J. Saf. Sci. Technol. 2021, 17, 97–102. [Google Scholar]
  11. Huang, A.D.; Li, C.J.; Wu, X.; Wang, Y.J. Quantitative risk assessment of failure probability for petrochemical rotating equipment based on polymorphic fuzzy Bayesian network. Saf. Environ. Eng. 2021, 28, 36–43. [Google Scholar]
  12. Li, J.; Sun, M.J.; Jin, Z.L.; Ju, J.Q.; Chen, Y.Y.; Han, L.X.; Wu, M.Y. Identification method of critical risk factors during design phase of oil and gas reservoir underground gas storage based on C-FRAM. Saf. Environ. Eng. 2024, 31, 88–95. [Google Scholar]
  13. Akni, A.; Bidi, M. Quantitative risk assessment of hazardous chemical discharges and simulation of threat zones in hydrocarbon storage systems. Bull. Pol. Acad. Sci. Tech. Sci. 2025, 73, 152705. [Google Scholar] [CrossRef]
  14. Zhang, R.; Song, S. Bayesian network approach for dynamic fault tree with common cause failures and interval uncertainty parameters. Eksploat. Niezawodn. Maint. Reliab. 2024, 26, 190379. [Google Scholar] [CrossRef]
  15. Zhang, L.G.; Li, J.J.; Qian, B.; Ying, Y.N. Discussion on application of HAZOP method in risk identification of salt cavern gas storage. In Proceedings of the China Gas Association Safety Committee Member Conference and Gas Safety Exchange Seminar, Jiaxing, China, 16–17 March 2023. [Google Scholar]
  16. Luo, J.H.; Li, L.F.; Zhao, X.W.; Wang, K.; Cai, K.; Li, X.; Yang, H.J. Risk assessment method and application of salt cavern underground gas storage. Nat. Gas Ind. 2011, 31, 106–111+140. [Google Scholar]
  17. Agarwal, A.; Ayello, F.; Raghunathan, V.; Demay, V.; Sridhar, N. Quantitative Assessment of Failure Probability of Underground Natural Gas Storage Wells Using an Integrated Bow-Tie Bayesian Network Approach. J. Fail. Anal. Prev. 2021, 21, 107–123. [Google Scholar]
  18. Sun, M.; Han, L.; Zhang, L.; Yin, H.; Liao, K.; Hu, J.; Fan, X. A study on risk propagation and traceability of gas storage based on complex network. In Proceedings of the 2023 International Conference on Artificial Intelligence, Systems and Network Security, Mianyang, China, 22–24 December 2023; pp. 343–348. [Google Scholar]
  19. Guo, H.; Chen, Y.; Cheng, L.; Li, S. Analysis and measurement of multi-factor coupling risk in underground coal mine gas explosion based on system dynamics. Sci. Rep. 2025, 15, 42252. [Google Scholar] [CrossRef] [PubMed]
  20. Zhang, J.; Wu, L.; Zhang, T.; Wu, D. Systemic and dynamic risk analysis of drilling construction based on bayesian network and system dynamics model. Sci. Rep. 2025, 15, 27989. [Google Scholar] [CrossRef] [PubMed]
  21. Durukan, O.; Akyuz, E.; Destanoğlu, O.; Arslanoğlu, Y.; Sezer, S.I. Quantitive HAZOP and D-S evidence theory-fault tree analysis approach to predict fire and explosion risk in inert gas system on-board tanker ship. Ocean Eng. 2024, 308, 117512. [Google Scholar]
  22. Kalathil, M.J.; Renjith, V.R.; Augustine, N.R. Failure mode effect and criticality analysis using dempster shafer theory and its comparison with fuzzy failure mode effect and criticality analysis: A case study applied to LNG storage facility. Process Saf. Environ. Prot. 2020, 138, 337–348. [Google Scholar] [CrossRef]
  23. Zheng, Q.; Tang, J.; Wang, W.; Deveci, M.; Mardani, A. Analyzing the risk of the ammonia storage facility using extended FMEA model based on probabilistic linguistic GLDS method with consensus reaching. Int. J. Hydrogen Energy 2024, 62, 1231–1244. [Google Scholar] [CrossRef]
  24. Lukinskiy, V.; Lukinskiy, V.; Bazhina, D. Refining the analytic hierarchy process: A statistical and methodological exploration of expert judgments. Alex. Eng. J. 2025, 125, 526–536. [Google Scholar] [CrossRef]
  25. Sun, F.Q.; Yan, Y.F.; Zhang, S.Y.; Yan, X.Z.; Liu, Y.P. Annulus pressure monitoring and risk classification of injection-production wells in gas storage. Pet. Tubul. Goods Instrum. 2021, 7, 38–43. [Google Scholar]
  26. Zheng, W.; Xu, S.; Wang, Z. Fuzzy Comprehensive Evaluation of Collapse Risk in Mountain Tunnels Based on Game Theory. Appl. Sci. 2024, 14, 5163. [Google Scholar] [CrossRef]
  27. Jin, T.; Zhang, P.; Niu, Y.; Lv, X. Integrating Combination Weighting of Game Theory and Fuzzy Comprehensive Evaluation for Selecting Deep Foundation Pit Support Scheme. Buildings 2024, 14, 619. [Google Scholar] [CrossRef]
  28. Chen, B.; Zang, Z.; Xiao, Y.; Ding, H.; Lin, S.; Dong, M. Research on the AHP-EWM-VIKOR Model and Comprehensive Evaluation Method for Selecting Sites for Artificial Caverns in CAES. Processes 2025, 13, 4048. [Google Scholar] [CrossRef]
  29. Mao, H.; Zhang, H.; Chen, B.; Zhu, R.; Yu, H.; Li, X. The Analysis of Deep Energy Storage Rock Mass Stability Assessment Based on Fuzzy Evaluation. Procedia Comput. Sci. 2025, 261, 954–961. [Google Scholar] [CrossRef]
  30. Liu, C.; Li, J.; Zhang, D. Fuzzy Fault Tree Analysis and Safety Countermeasures for Coal Mine Ground Gas Transportation System. Processes 2024, 12, 344. [Google Scholar] [CrossRef]
  31. Wang, Z.; Chen, F.; Shi, X.; Ma, H.; Dong, Z.; Yang, C. Construction and application of a safety risk assessment system for salt cavern gas storage based on simulation and monitoring. Tunn. Undergr. Space Technol. 2025, 164, 106838. [Google Scholar] [CrossRef]
  32. Bi, A.; Luo, Z.; Kong, Y.; Zhao, L. Comprehensive weighted matter-element extension method for the safety evaluation of underground gas storage. R. Soc. Open Sci. 2020, 7, 191302. [Google Scholar] [CrossRef] [PubMed]
  33. Yang, C.; Jing, W.; Daemen, J.; Zhang, G.; Du, C. Analysis of major risks associated with hydrocarbon storage caverns in bedded salt rock. Reliab. Eng. Syst. Saf. 2013, 113, 94–111. [Google Scholar] [CrossRef]
  34. Ban, S.; Liu, H.; Wei, X.; Shi, X.; Mao, H.; Song, Y.; Tan, H. The Application of the Fuzzy Comprehensive Evaluation Method in the Sealing Evaluation of Caprocks in Underground Gas Storage. Appl. Sci. 2023, 13, 9753. [Google Scholar] [CrossRef]
  35. Jing, W.J.; Yang, C.H.; Chen, F. Risk assessment of salt cavern oil/gas storage based on accident statistical analysis. Rock Soil Mech. 2011, 32, 1787–1793. [Google Scholar]
  36. Lackey, G.; Mundia-Howe, M.; Pekney, N.J. Underground natural gas storage facility operations and well leakage events in the United States. Geoenergy Sci. Eng. 2024, 234, 212630. [Google Scholar] [CrossRef]
  37. Kaya, G.; Taleghani, A.D. Integrity Issues for Underground Gas Storage Wells. ASME Open J. Eng. 2025, 4, 4067764. [Google Scholar] [CrossRef]
  38. Wickenhauser, P.L.; Wagg, B.T.; Barbuto, F.A. Quantitative Risk Assessment: Underground Natural Gas Storage Facilities. In Proceedings of the 2006 International Pipeline Conference, Calgary, AB, Canada, 25–29 September 2006. [Google Scholar]
  39. Cao, J.; Dong, Y.; Li, R. Qualitative and Quantitative Risk Assessment Method for Fire Safety Accident in Liquefied Natural Gas Storage. Control Syst. Eng. 2018, 1. [Google Scholar] [CrossRef]
  40. Ridolfi, R.M.; Azzaro, S.; Beaubien, S.E.; Da Pra, A.; Pontiggia, M.; Bigi, S. Development of a site-screening method for hydrogen storage purposes and its application to an industrial dataset of Italian reservoirs. In Proceedings of the European Geosciences Union General Assembly 2024 (EGU24), Vienna, Austria, 14–19 April 2024. [Google Scholar]
  41. Wang, C.J.; Guo, H. SD simulation of safety vulnerability in oil and gas stations based on game theory combination weighting. Oil Gas Storage Transp. 2022, 41, 55–62. [Google Scholar]
Figure 1. Logic diagram of cross-system risk coupling transmission in gas storage.
Energies 19 03041 g001
Figure 2. Structure and Process of the Hierarchical Fusion Quantification Model.
Energies 19 03041 g002
Figure 3. Initial weights of subsystems under objective and subjective information sources.
Energies 19 03041 g003
Figure 4. TOP 10 global high-risk factors in Xiangguosi Gas Storage.
Energies 19 03041 g004
Figure 5. Weight integration and composition of cross-system risk factors (example).
Energies 19 03041 g005
Figure 6. Conceptual diagram of the three-level dynamic monitoring indicator system.
Energies 19 03041 g006
Table 1. List of risk factors in surface process system (compressor failure).
Failed SystemFailure TypeSpecific Risk Factors
Compressor failurePiston wear/breakageC1 Material fatigue, C2 Insufficient lubrication, C3 Foreign matter entering cylinder, C4 Compressor improper operation (e.g., frequent start/stop)
Lubrication system failureC5 Low lube oil pressure or failure of oil pump auto-start in compressor unit, C6 Insufficient heat exchange efficiency or clogging of lube oil cooler, C7 Deterioration of lube oil quality, C8 Lube oil leakage, C9 No online lube oil monitoring instrument
Compressor failureC10 Cooler clogging, C11 Fan failure, C12 Insufficient coolant, C13 Temperature sensor failure, C14 Circulating water pump failure
Safety monitoring and protection failureC15 No pulsation analysis or anti-surge device installed, C16 No pressure alarm or shutdown device at inlet/outlet, C17 No vibration monitoring or overspeed shutdown device at outlet
Table 2. Typical Paths of Cross-System Risk Coupling Transmission.
Coupling TypeSource System/FactorTransmission PathTarget System/Consequence
Transmission couplingGround system (C4 compressor improper operation, e.g., frequent start/stop)→ Wellbore alternating loadWellbore engineering (seal failure)
Common couplingAuxiliary system (D1: external power failure)→ Simultaneously causesGround shutdown, well control failure, monitoring interruption
Table 3. Example of a typical coupling risk path.
Risk Receiving SystemPrimary Risk Source SystemKey Coupling Pathway Description
Geologic BodyWell Engineering Surface Facilities(1) Wellbore barrier failure → formation of flow pathways → loss of geologic sealing integrity (2) Improper compressor operation → disturbance of in-situ stress field → fault activation
Well EngineeringGeologic Body Surface Facilities Auxiliary Systems(1) In-situ stress/corrosive media → tubular deformation/corrosion (2) Alternating loads → tubing thread loosening/seal failure (3) Power supply failure → downtime of protective fluid systems → accelerated corrosion
Surface FacilitiesAuxiliary Systems, Well Engineering, Geologic Body(1) Power supply failure → compressor shutdown/paralysis of lubrication, cooling and dehydration systems (2) Sand production/corrosion products → equipment blockage and wear (3) Earthquake → pipeline rupture and leakage
Auxiliary SystemsSurface Facilities Geologic Body(1) Large equipment startup/shutdown → power grid voltage fluctuation (2) Earthquake/landslide → damage to power infrastructure
Note: In this study, the analysis of coupling paths follows the “critical path” screening principle, focusing on typical paths with clear propagation logic, significant risk contributions, and engineering manageability. For global events such as “external power supply failure,” although their impacts are extensive, this study focuses on analyzing their direct and dominant pathways that trigger system-level functional failures.
Table 4. Comparison of ablation experiment results (Ranking changes of top high-risk factors).
Risk FactorM1 Rank (Without Coupling Correction)M2 Rank (Proposed CN-GT Model)Rank Change
C4 Improper Compressor Operation361↑ 35
B14 Valve Failure117↓ 16
A4 Reservoir-Induced Seismicity822↑ 80
B20 Poor cement-stone interface quality325↑ 27
Note: ↑ indicates an increase in ranking, while ↓ indicates a decrease in ranking.
Table 5. Comparison of Characteristics of Different Risk Assessment Methods.
Comparison DimensionTraditional Risk MatrixFTA-Fuzzy Comprehensive EvaluationConventional Combination Weighting MethodThe Proposed CN-GT Model
Common Coupling CharacterizationWeak. Ignores parallel attack effects.Moderate. Qualitative expression available, but cannot quantify coupling contributions.Weak. Weight fusion does not consider coupling structures.Strong. Explicitly aggregates multi-system weights.
Transmissive Coupling CharacterizationNone. Limited to single-system evaluation.Weak. Fault tree logic is complex, cannot quantify transmission increments.None. Still treats subsystems as independent units.Strong. Tracks propagation paths and quantifies amplification effects.
Risk Discrimination CapabilityLow. Difficult to rank risks within the same level.Moderate. Depends on membership function design.Moderate. Combines subjective and objective weights, but does not reflect coupling.High. Continuous numerical weights enable fine-grained differentiation.
Data DependencyLow. Relies on expert grading.Moderate. Requires fuzzy numbers for basic event probabilities.Moderate. Depends on data input; no need for precise probabilities.Moderate. Combines structural and empirical information; no need for precise probabilities.
Note: The comparative conclusions in this table are derived from the classical principles and application characteristics of each method.
Disclaimer/Publisher’s Note: The statements, opinions and data contained in all publications are solely those of the individual author(s) and contributor(s) and not of MDPI and/or the editor(s). MDPI and/or the editor(s) disclaim responsibility for any injury to people or property resulting from any ideas, methods, instructions or products referred to in the content.