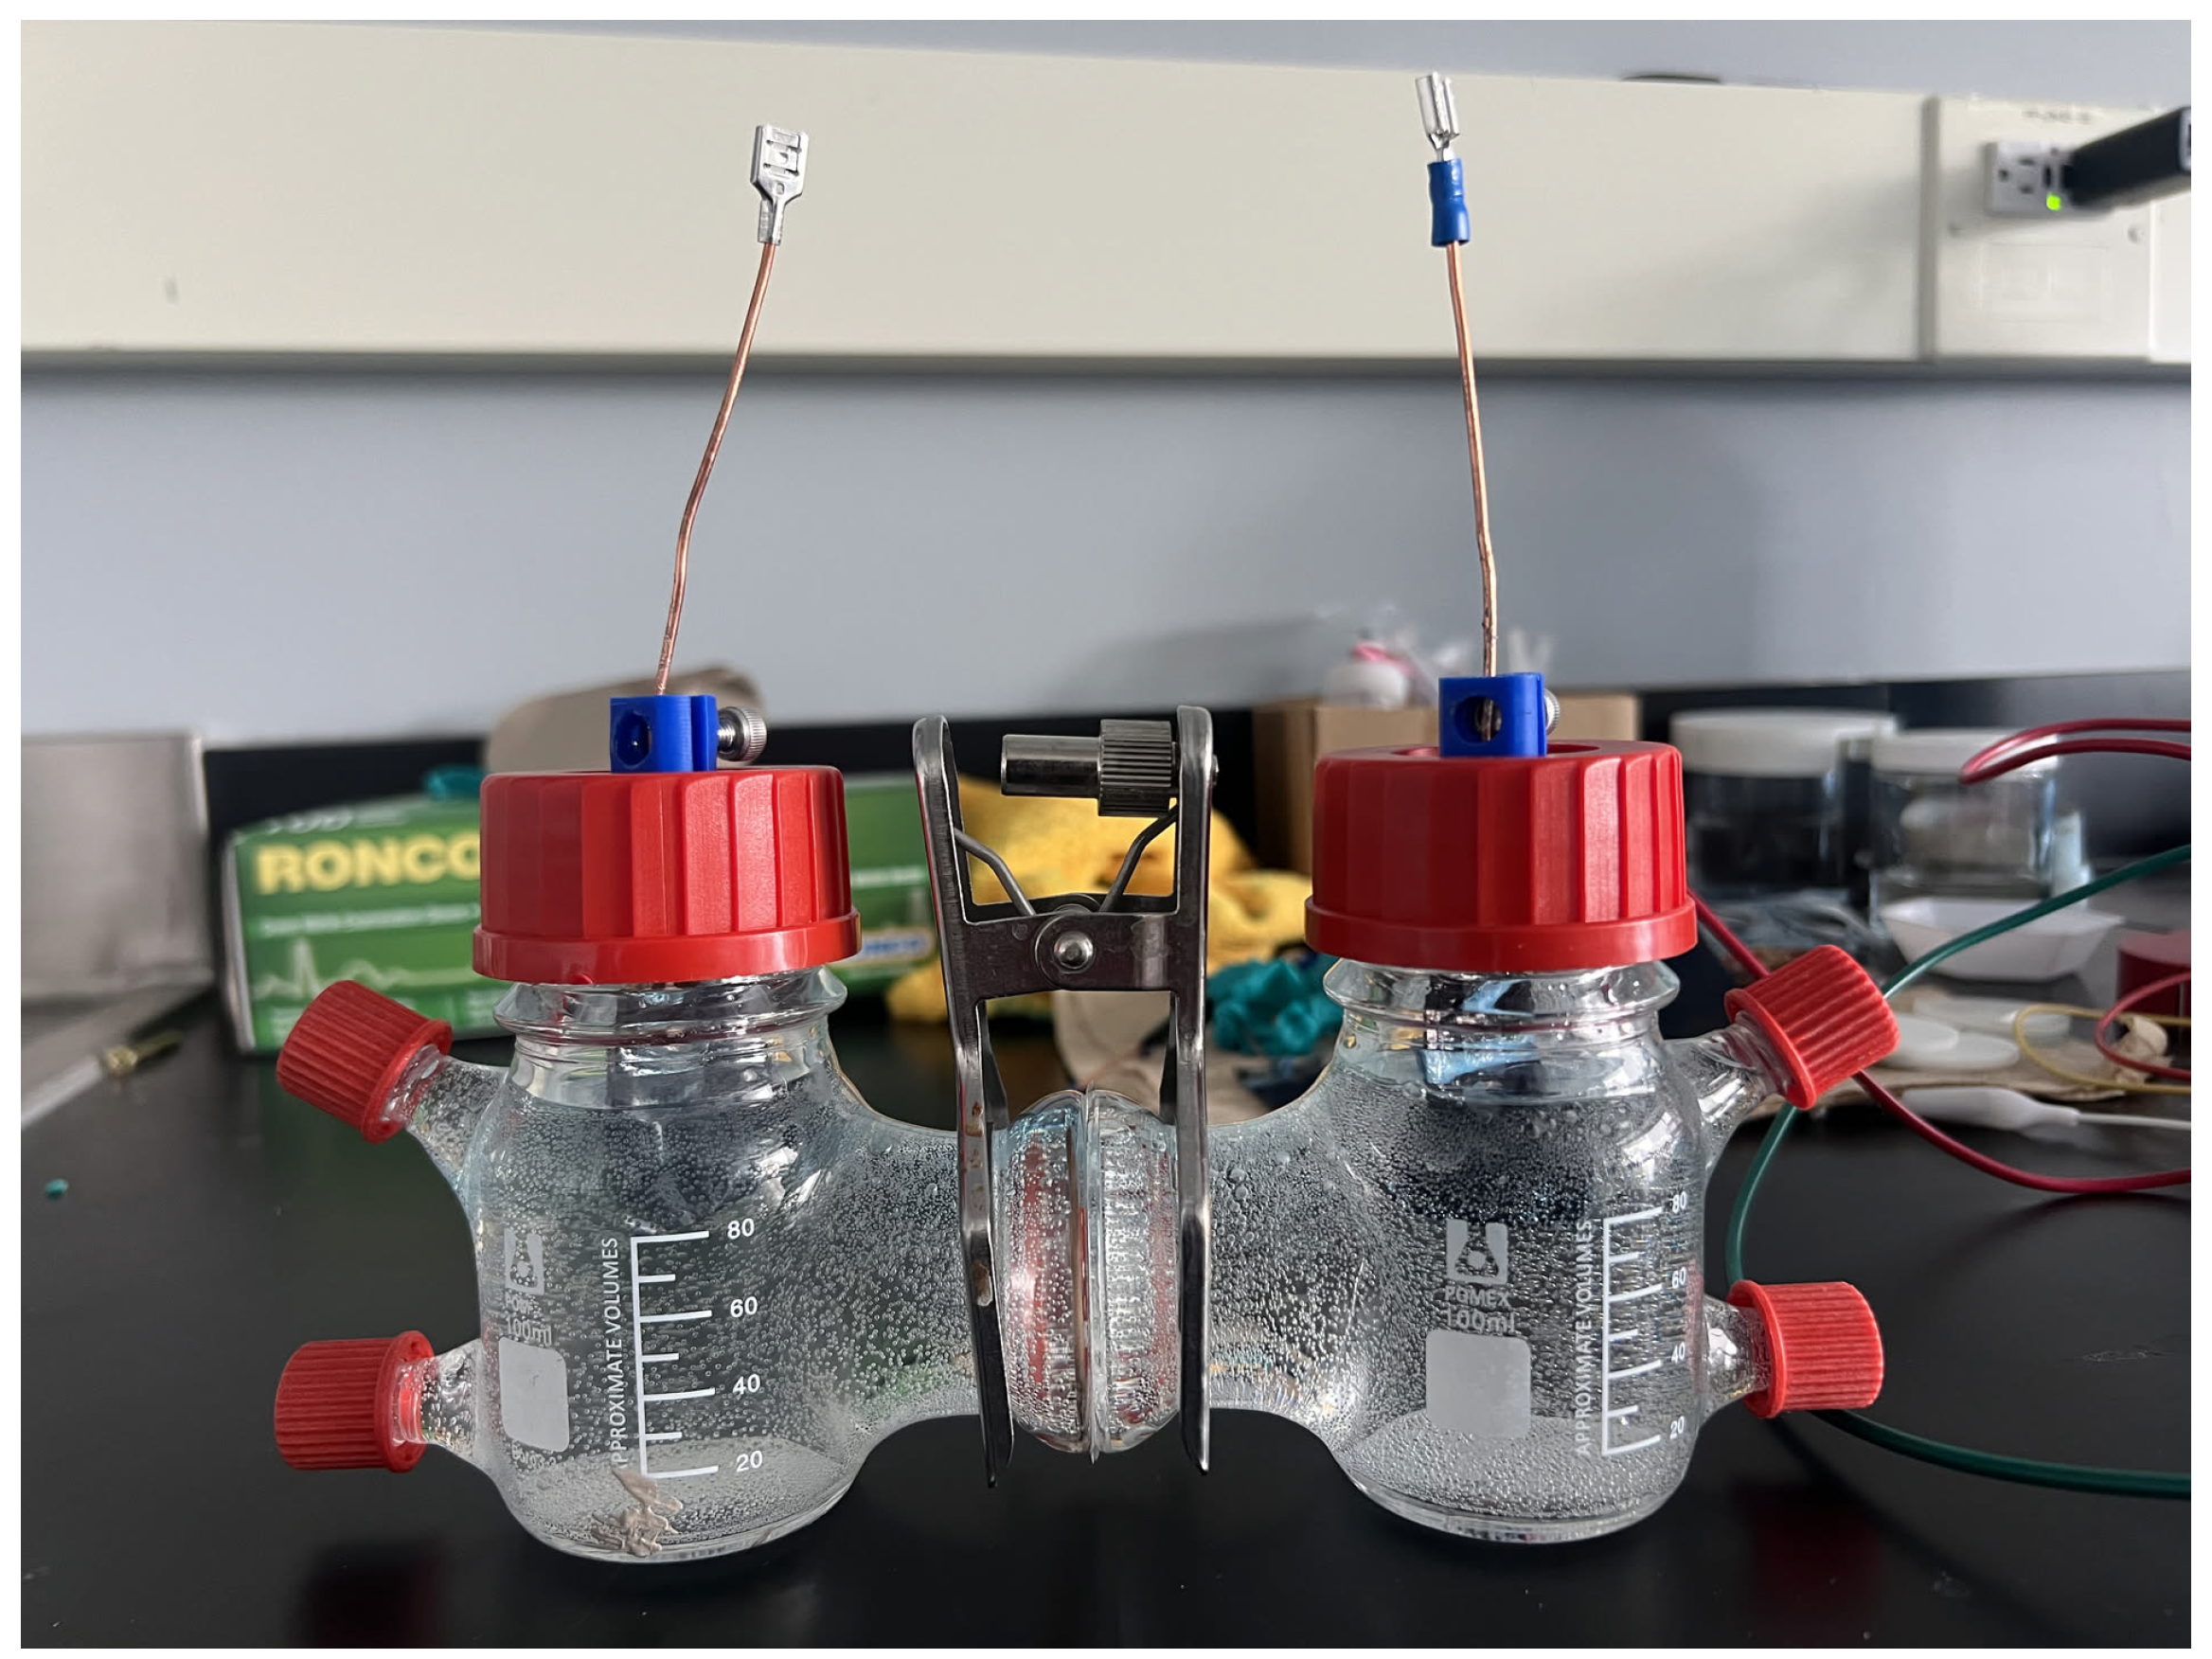
3.1. The Optimal Compartment pH Results
First, looking at the influence of pH on the Ta compartment,
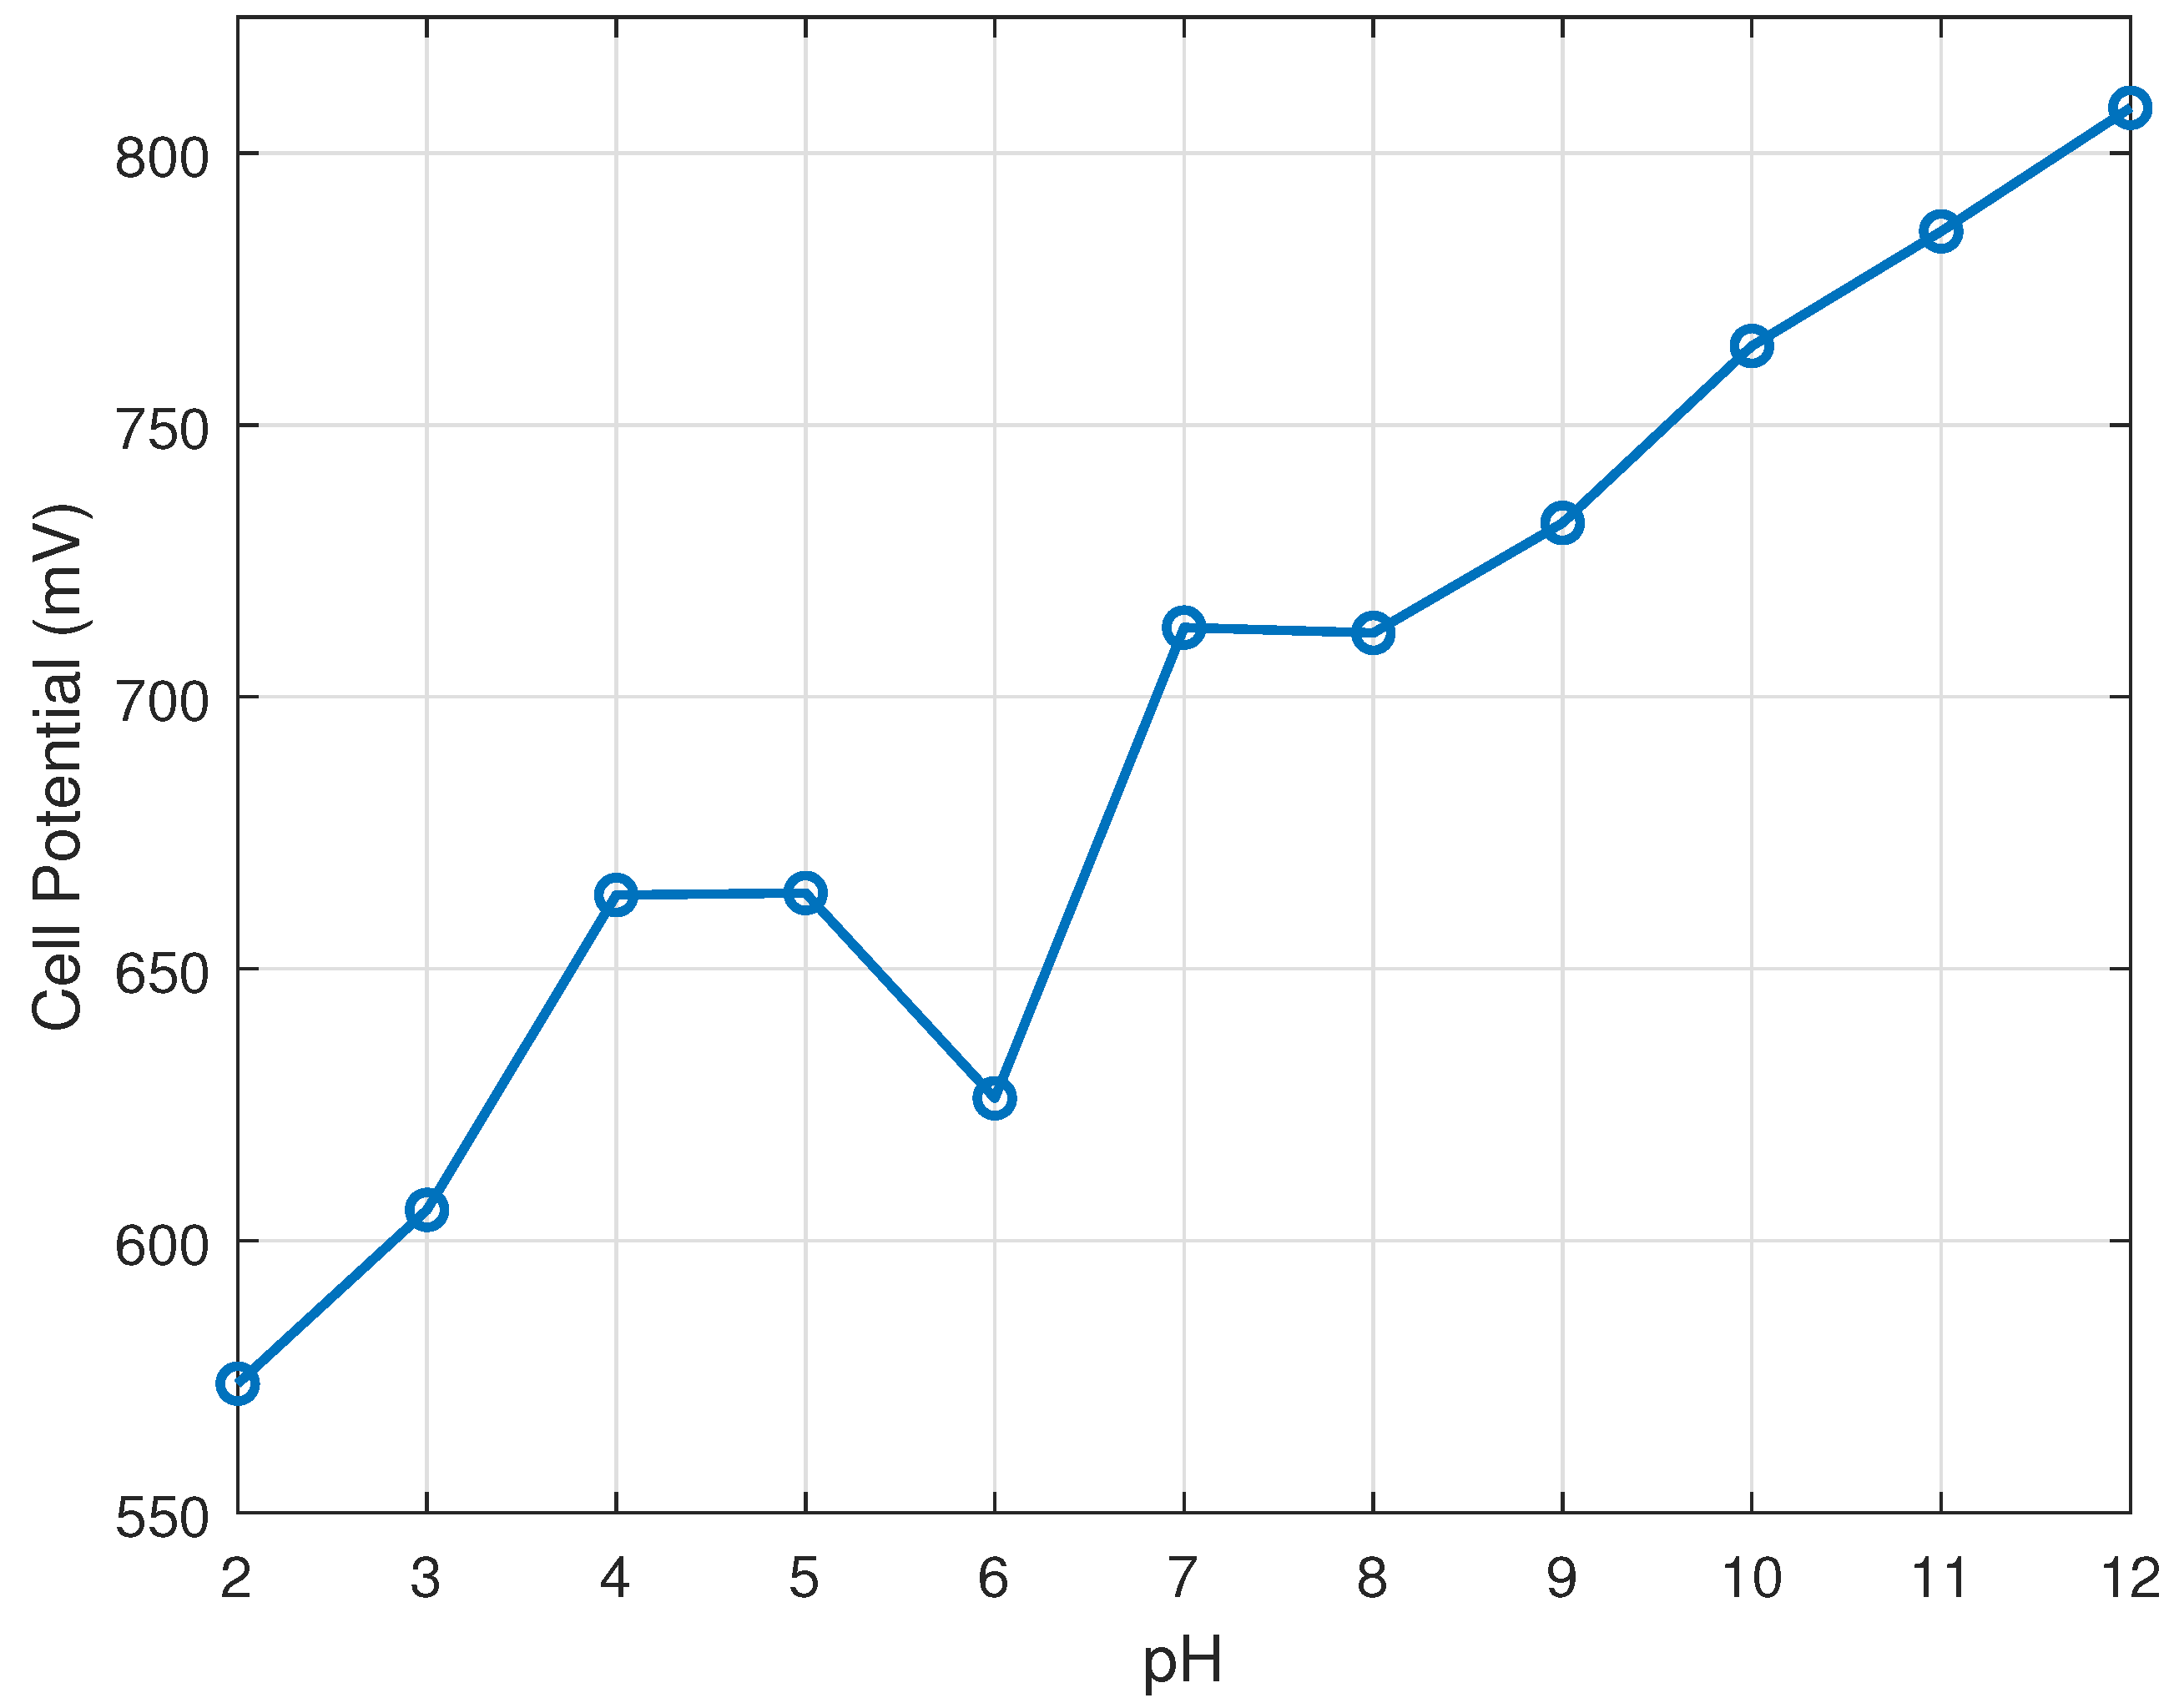
Figure 2 shows that the cell voltage increased non-linearly with pH, rising from 573.7 mV at pH 2 to 808.3 mV at pH 12, a net increase of 40.9%. The relationship was not strictly linear, a local minimum was observed at pH 6, followed by a recovery and sustained increase from pH 7 to 12.
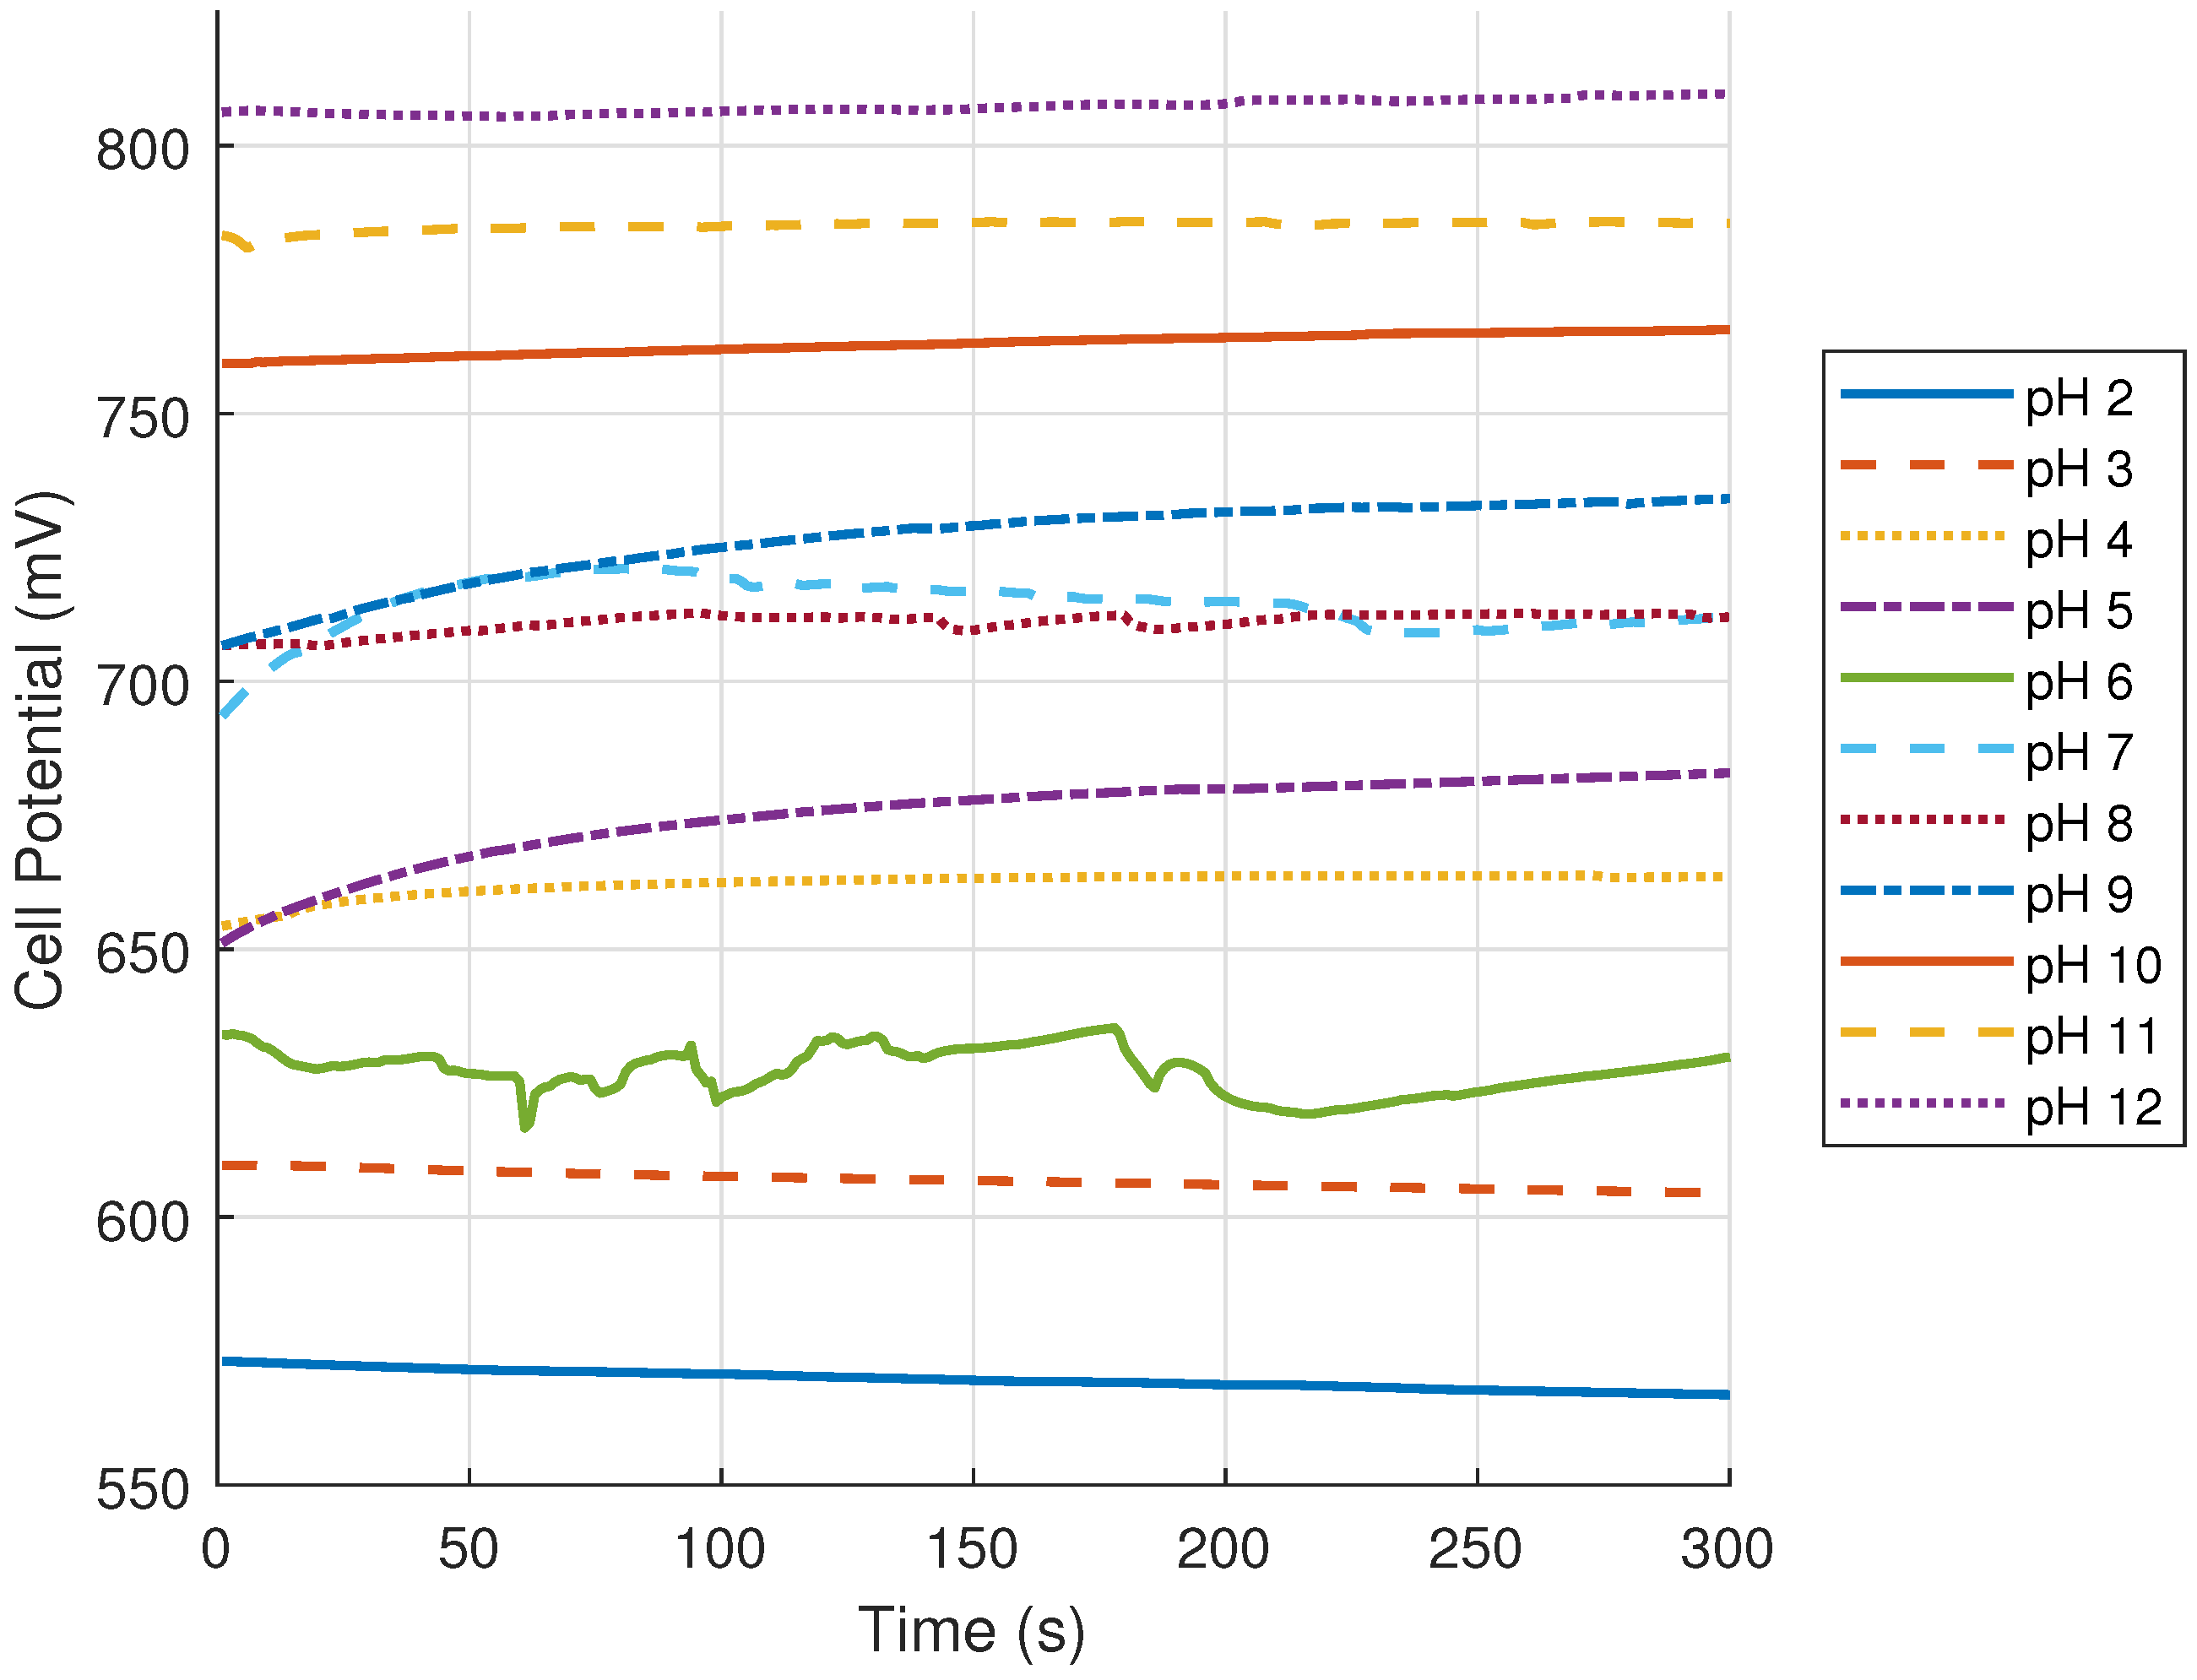
Figure 3 shows that the cell voltage remained stable across most electrolyte pH conditions over the 300 s measurement period. The notable exceptions include pH 6, where the cell voltage fluctuated persistently, and pH 5 and 8, which both had drifted upwards before stabilizing. The remaining pH conditions reached and maintained a stable voltage for the duration of the measurement.
The increase in OCV with pH is consistent with the Nernst equation when applied to the half-reactions governing the electrodes. Jerkiewicz explained for the H
+(aq)/H
2(g) redox in acidic media, the application of the Nernst equation shows that the electrode potential decreases by 59.2 mV per unit increase in pH, since
and the proton activity directly enters the expression for equilibrium potential. An analogous relationship exists in alkaline media, where the redox couple becomes H
2O(aq)/H
2(g),OH
−(aq). The corresponding Nernst expression’s dependence on hydroxide ion activity can be expressed as shown in Equation (
4). The application of this equation yields the same plot as with the acidic media [
8]. As the half-cell potential reaction at the Ta anode site decreases with pH, and the overall cell potential is the difference between the potential of the cathode site and anode site, there would be an overall increase in cell potential. A similar potential decrease with pH was observed by Macagno and Schultze when quantifying the growth of the oxide produced by Ta, Tantalum pentaoxide (Ta
2O
5). It was observed that pH shifted 60 mV per pH unit [
9].
The observed drop in cell potential at pH 6 is a deviation from the upward-trending relationship between pH and OCV. This occurrence was reproduced across 3 independent measurements, confirming it was not due to experimental error. A similar dependence of electrochemical behavior on pH was reported by Attarzadah et al. [
10]. They observed a non-linear variation in the corrosion current density and passive film resistance of Ta in a borate buffer solution across a comparable pH range. The optimal protective behavior was at pH 8.0. This illustrates that non-linear pH responses are not without precedent in electrochemical systems. The precise reason for the deviation at pH 6 in the experimental configuration cannot be determined by electrochemical measurements alone. Future investigations using surface characterization techniques like X-ray photoelectron spectroscopy (XPS), scanning electron microscopes or energy-dispersive X-ray spectroscopy (EDS) would be needed to understand the underlying mechanisms.
H2O2 is well known for its ability to undergo a disproportionation reaction, where the peroxide breaks down into water and O2 spontaneously. This reaction provides the electrolyte a pathway to react without being electrochemically productive as the H2O2 is spent without reacting with the electrode material. This reaction is known to be accelerated under alkaline conditions as well as on the metal oxide surfaces. As both have high pH, and a tantalum oxide passive film is present in the experiment, disproportionation may interfere with the performance results of the cell.
During the experiments, bubble production was observed through the pH levels. There was no notable increase in bubble production at the higher pH values; without a direct measurement of the H2O2 consumption rate, it is not possible to determine what fraction of the H2O2 was consumed productively through the electrochemical reactions versus unproductively through chemical disproportionation. The output represents a net output of the cell from the combined influence of both pathways. This leaves an opportunity to conduct future experiments to find the faradic efficiency, which can be completed using periodic sampling and titration of the electrolyte or an assay, and comparing the consumption rate to the integrated current. This would provide a basis for assessing the productive utilization of H2O2 by the cell.
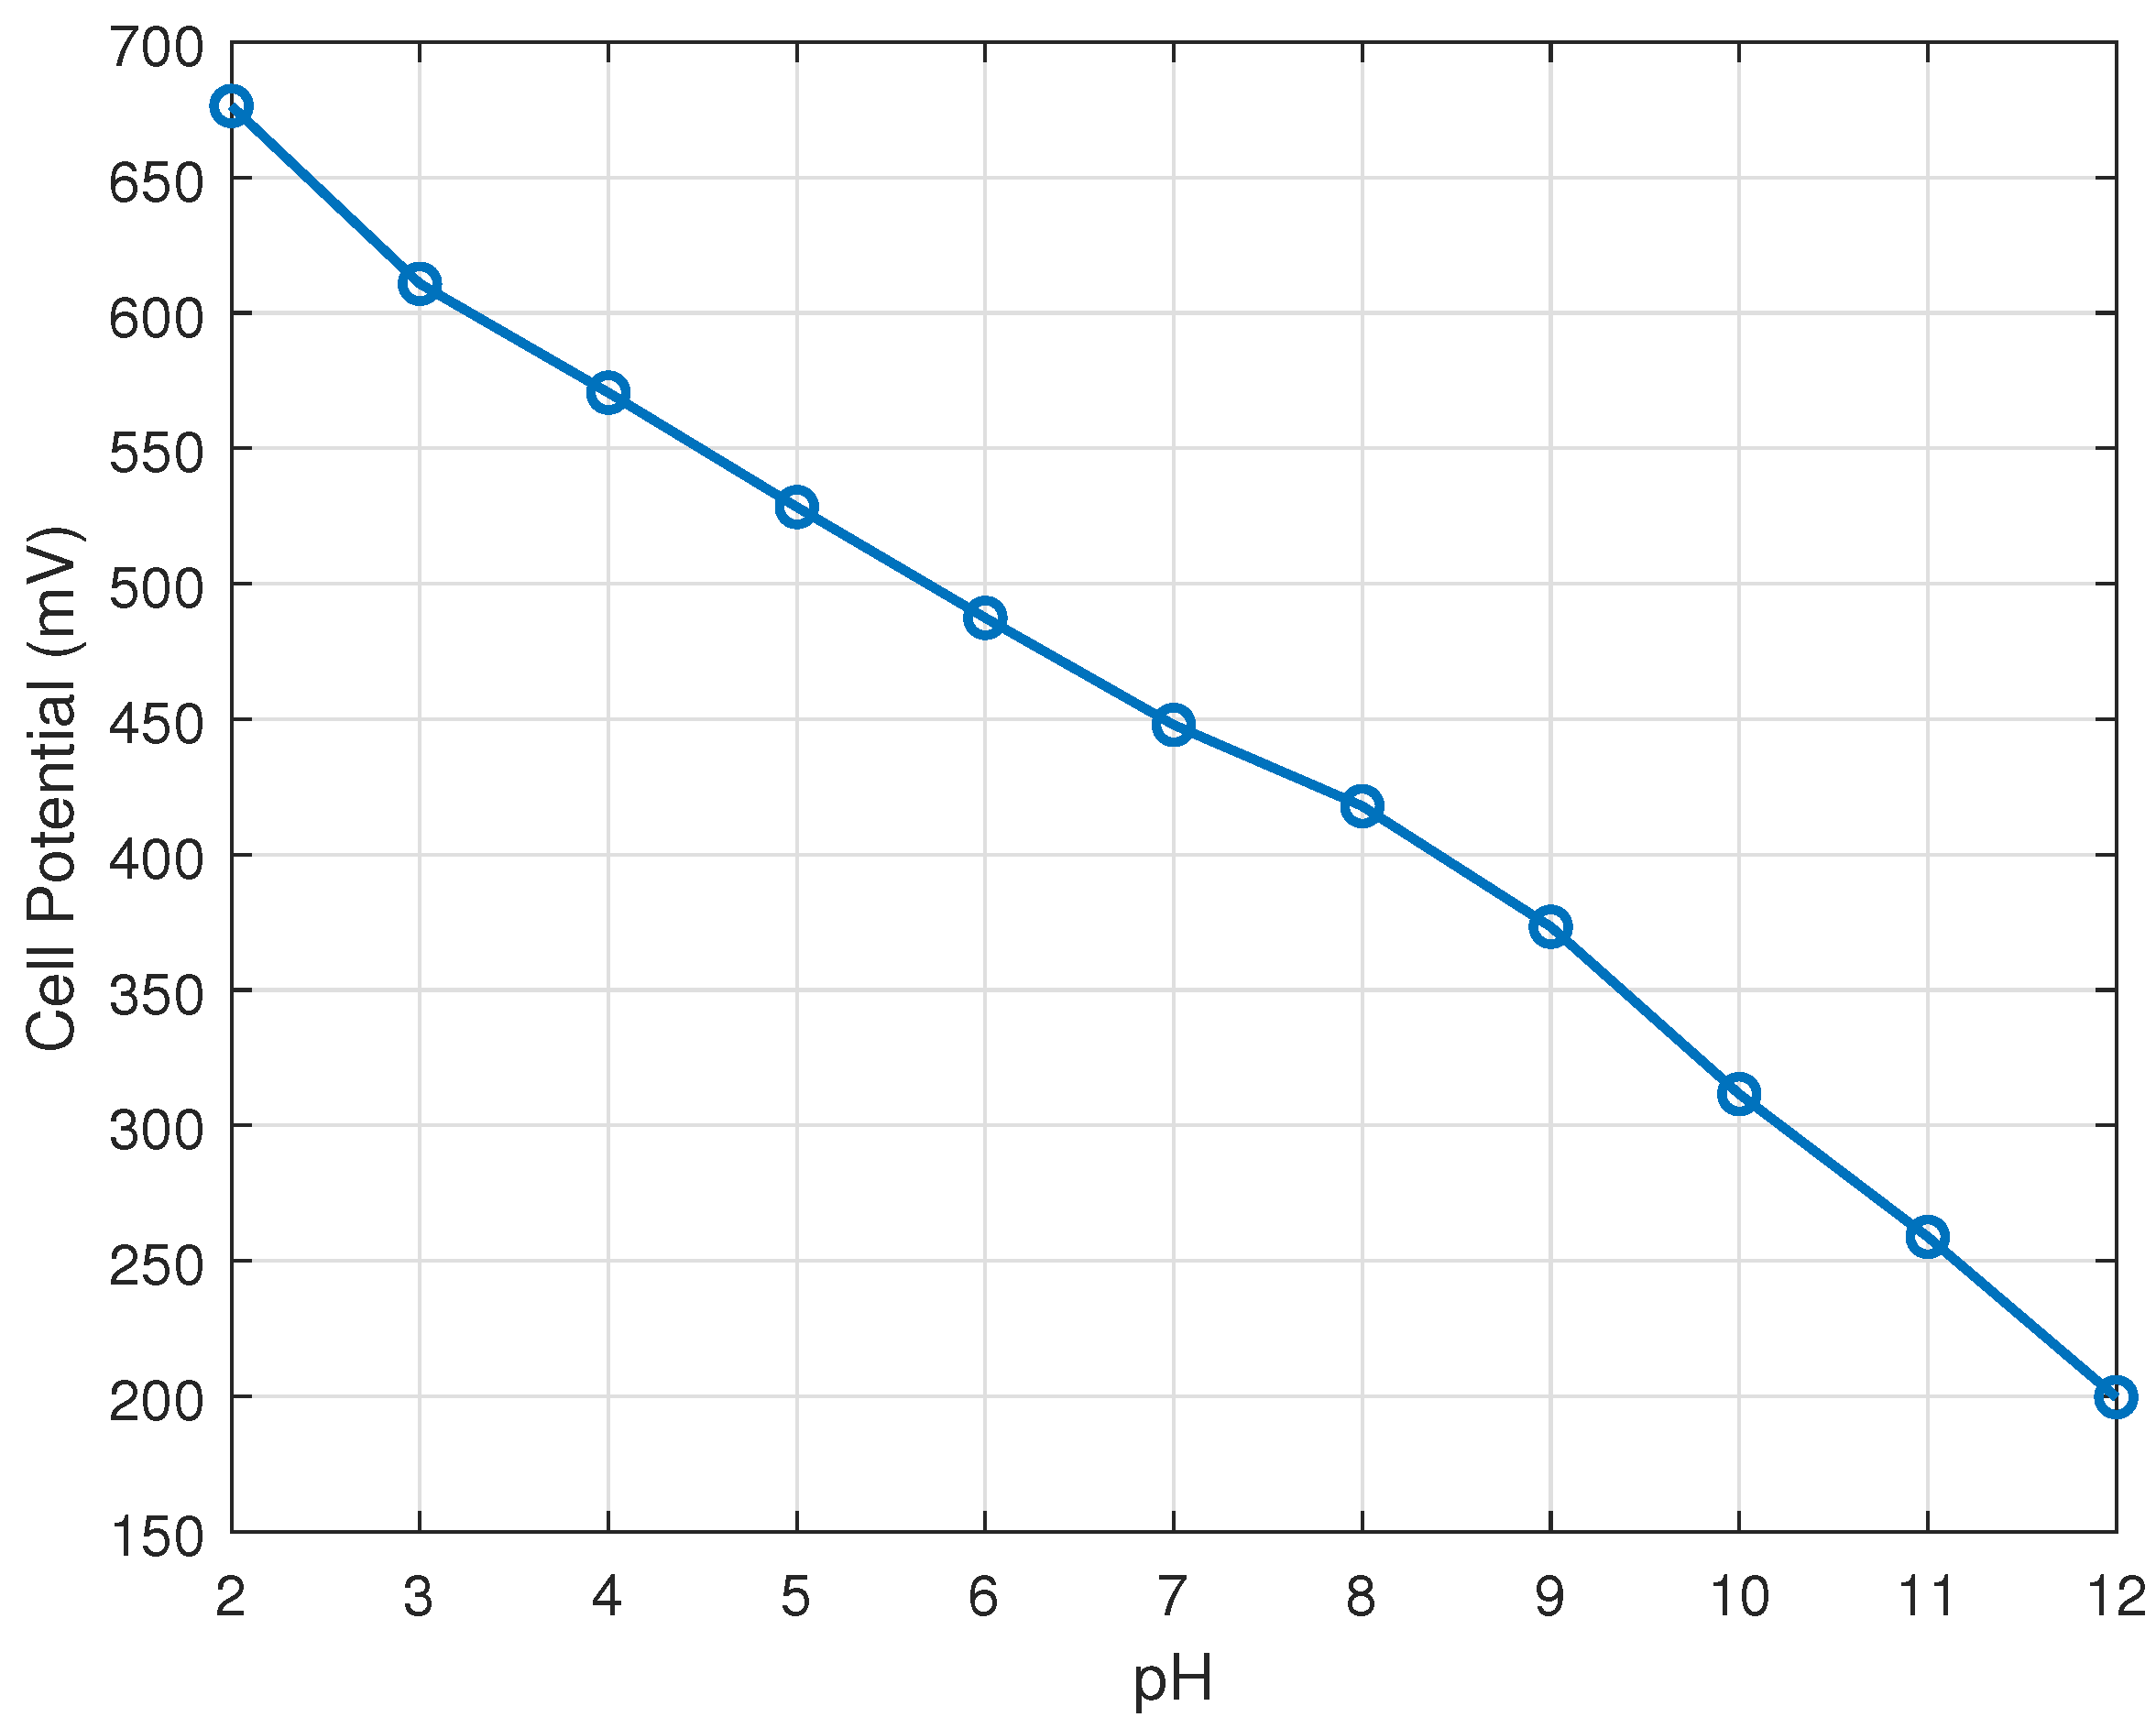
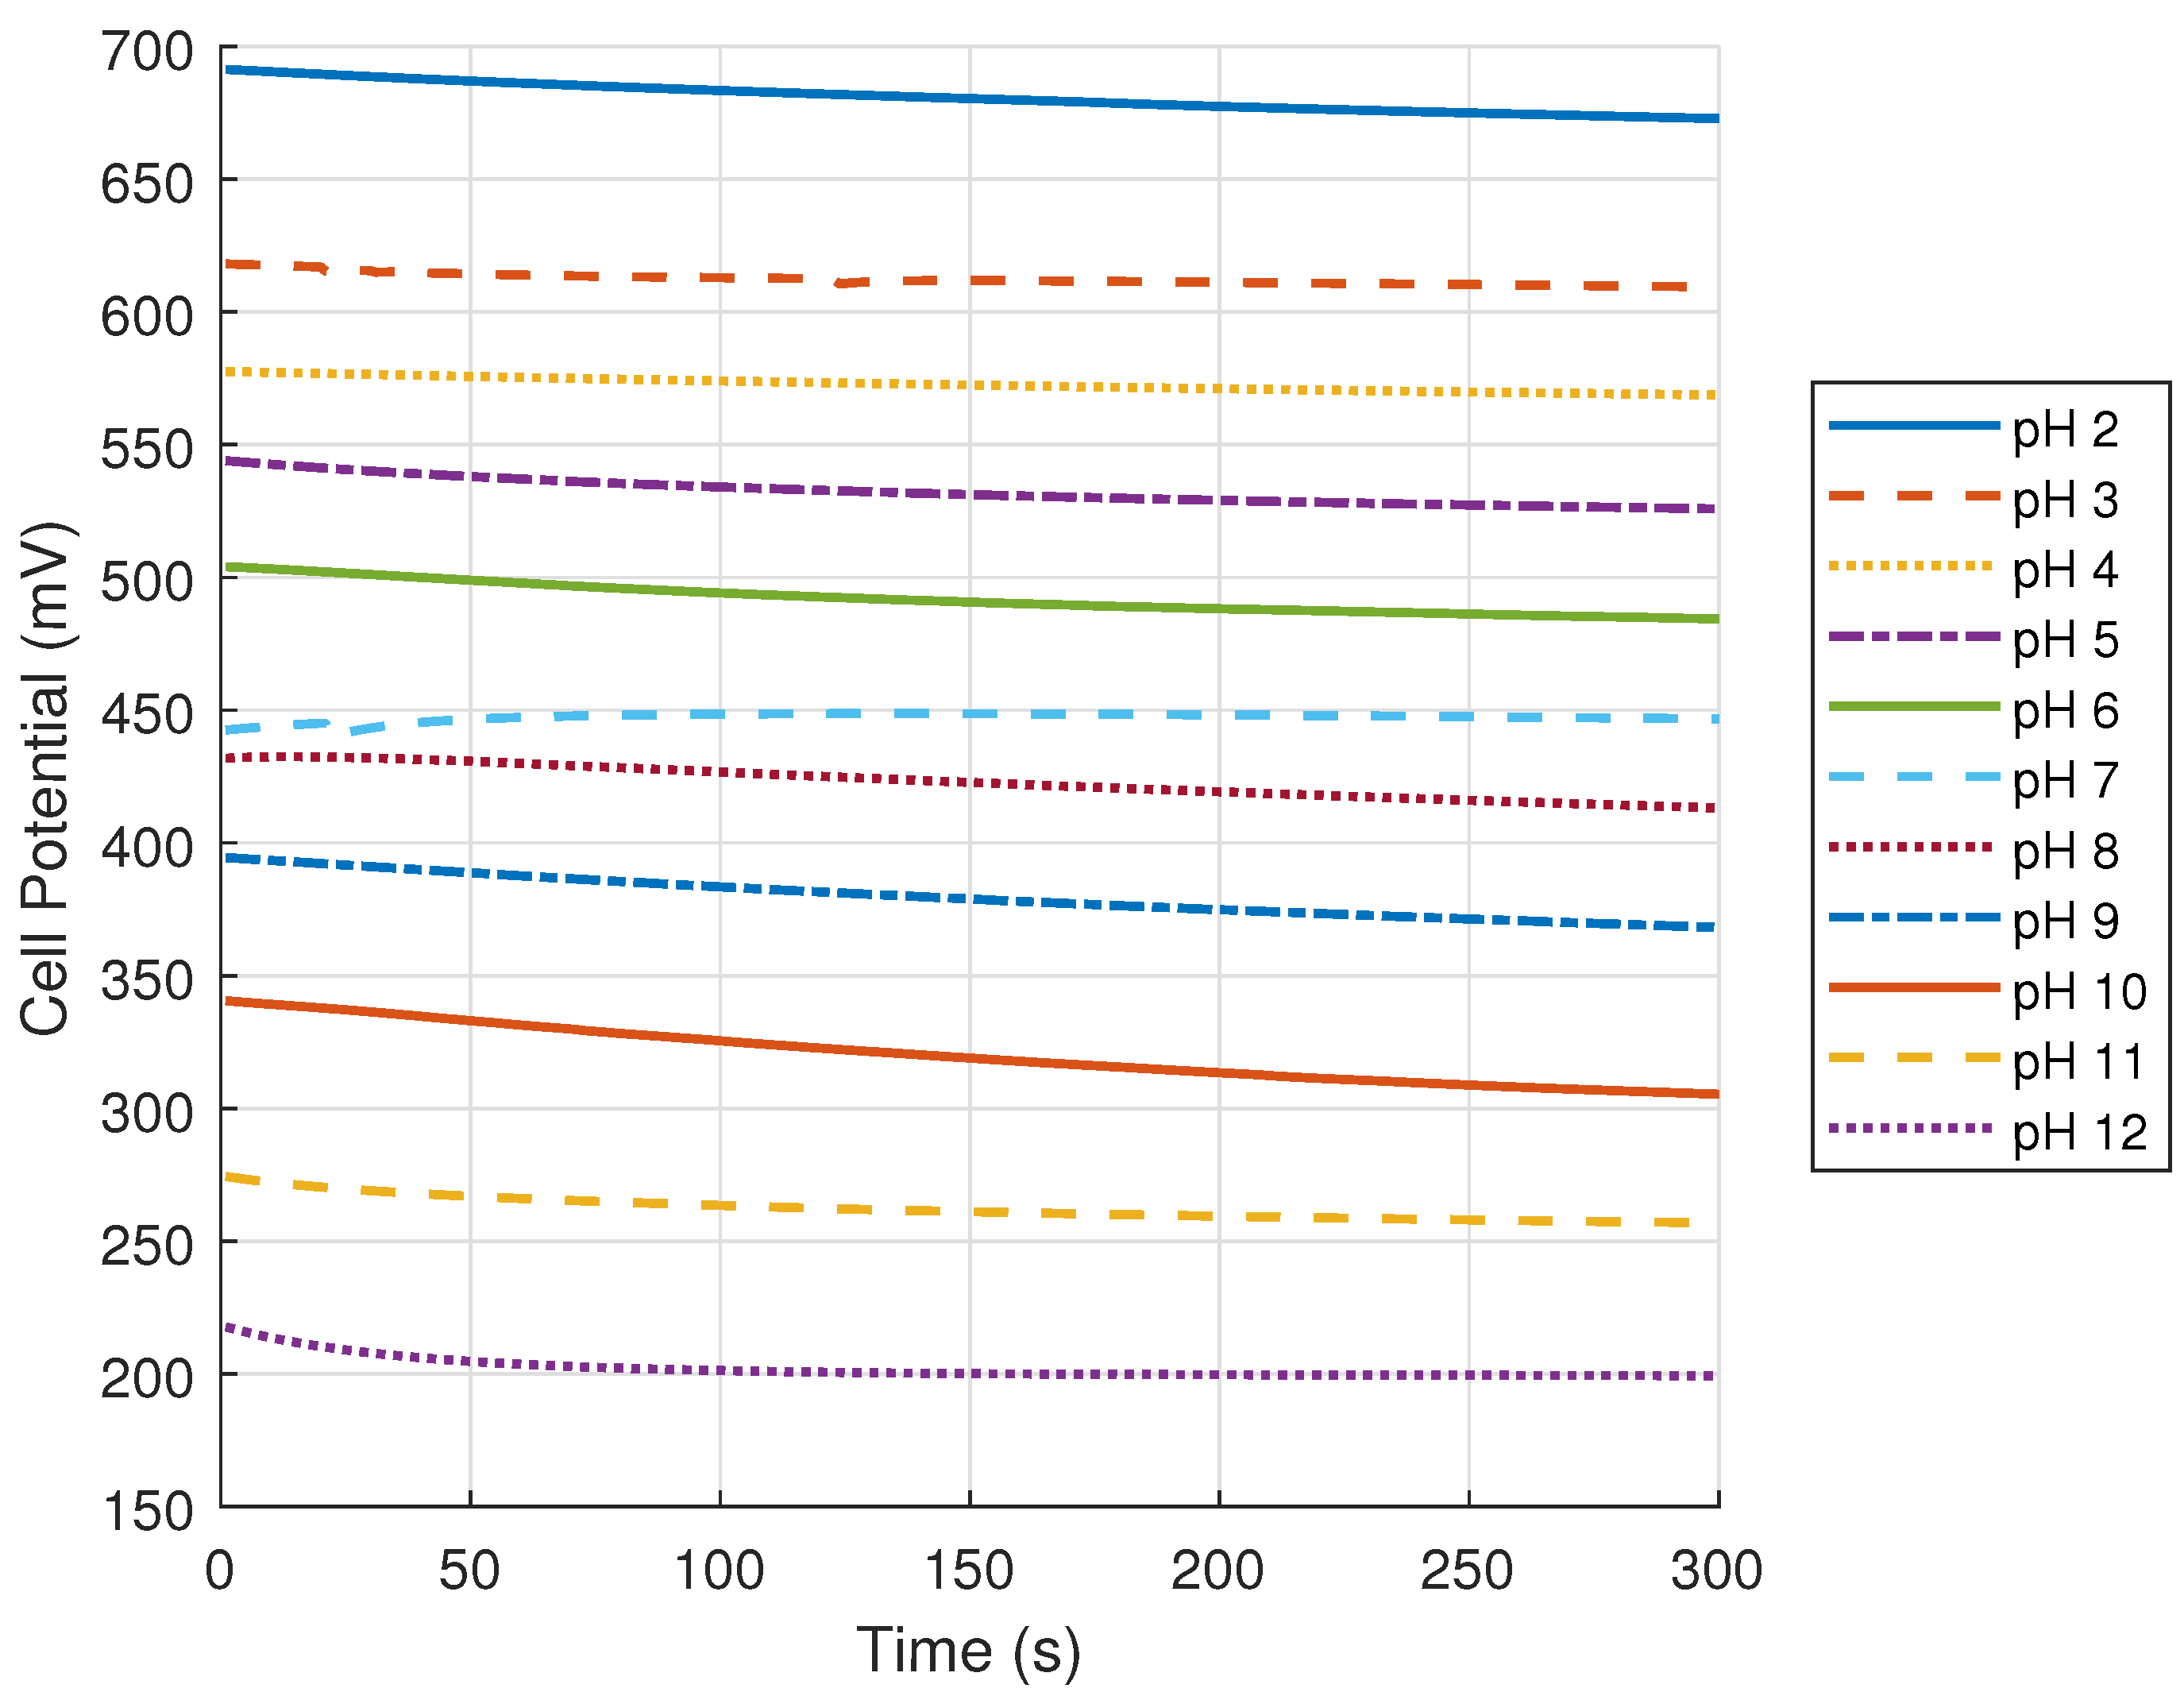
After the Ta runs, the Prussian Blue compartment’s pH was adjusted from pH 2 to 12. The OCV of the cell was measured and is shown in
Figure 4. The cell voltage decreased approximately linearly with increasing pH, falling from 676.4 mV at pH 2 to 199.7 mV at pH 12, a net decrease of 70.5%. Unlike the tantalum compartment results, the relationship was consistent. There were no significant variations observed across the pH range.
Figure 5 shows that the cell voltage remained relatively stable across all pH conditions over the 300 s measurement period, though a gradual downward drift was observed across most pH levels.
The Prussian Blue compartment’s OCV response was the opposite of the Tantalum compartment. This behavior is most likely due to Prussian Blue’s instability in alkaline conditions. Karayakin et al. demonstrated that Prussian Blue modified electrodes were stable in neutral and acidic supporting electrolytes, but the material degraded progressively in alkaline solutions [
11]. The dissolution of Prussian Blue in the alkaline media would result in the loss of material from the electrode surface, resulting in a loss of the reduction reaction sites.
It is important to note that there are two distinct sources of potential that contribute to the measured OCV of the pH-optimized cell. First is the electrochemical fuel cell potential created from the oxidation and reduction of H2O2 at the anode and cathode. There is a secondary cell potential that is generated by the junction potential caused by the proton activity gradient from the varying pH levels on either side of the membrane. The theoretical contribution of a concentration cell with a pH difference of 10 units is about 0.592 V at 298.15 K, as given by the Nernst equation when applied to a pH gradient. The total measured OCV was 730 mV in the optimized conditions, and it began with a baseline of 522 mV when both compartments were at pH 2. In an ideal sense, if the entire contribution of the concentration cell was added to the baseline, the cell would have an overall potential much larger than 1 V. As the measured OCV was below that, it is not solely the contribution from the increase in potential. Further investigations will be required comparing the cell at its optimized pH levels with and without H2O2 to identify the specific contribution of the concentration cell.
Additionally, a large pH gradient between the membrane may drive a proton crossover from the acidic to the alkaline compartment, progressively neutralizing the pH gradient. This self-consumption of the acid and base would be independent of the H2O2 consumption and could be a source of performance degradation under sustained operation. Since the experiments were measured over a 300–350 s window, the degree of collapse of the pH gradient is considered to be small, and the reported values are a reasonable representation of the initial pH gradient. For future sustained operation, strategies like continuous electrolyte replenishment can be employed to minimize the effect of the acid–base self-consumption.
Therefore, from the standpoint of maximizing the cell potential, the results indicate that the configuration with the Tantalum compartment at a pH value of 12 and the Prussian Blue compartment at a pH of 2 should yield the highest achievable cell potential.
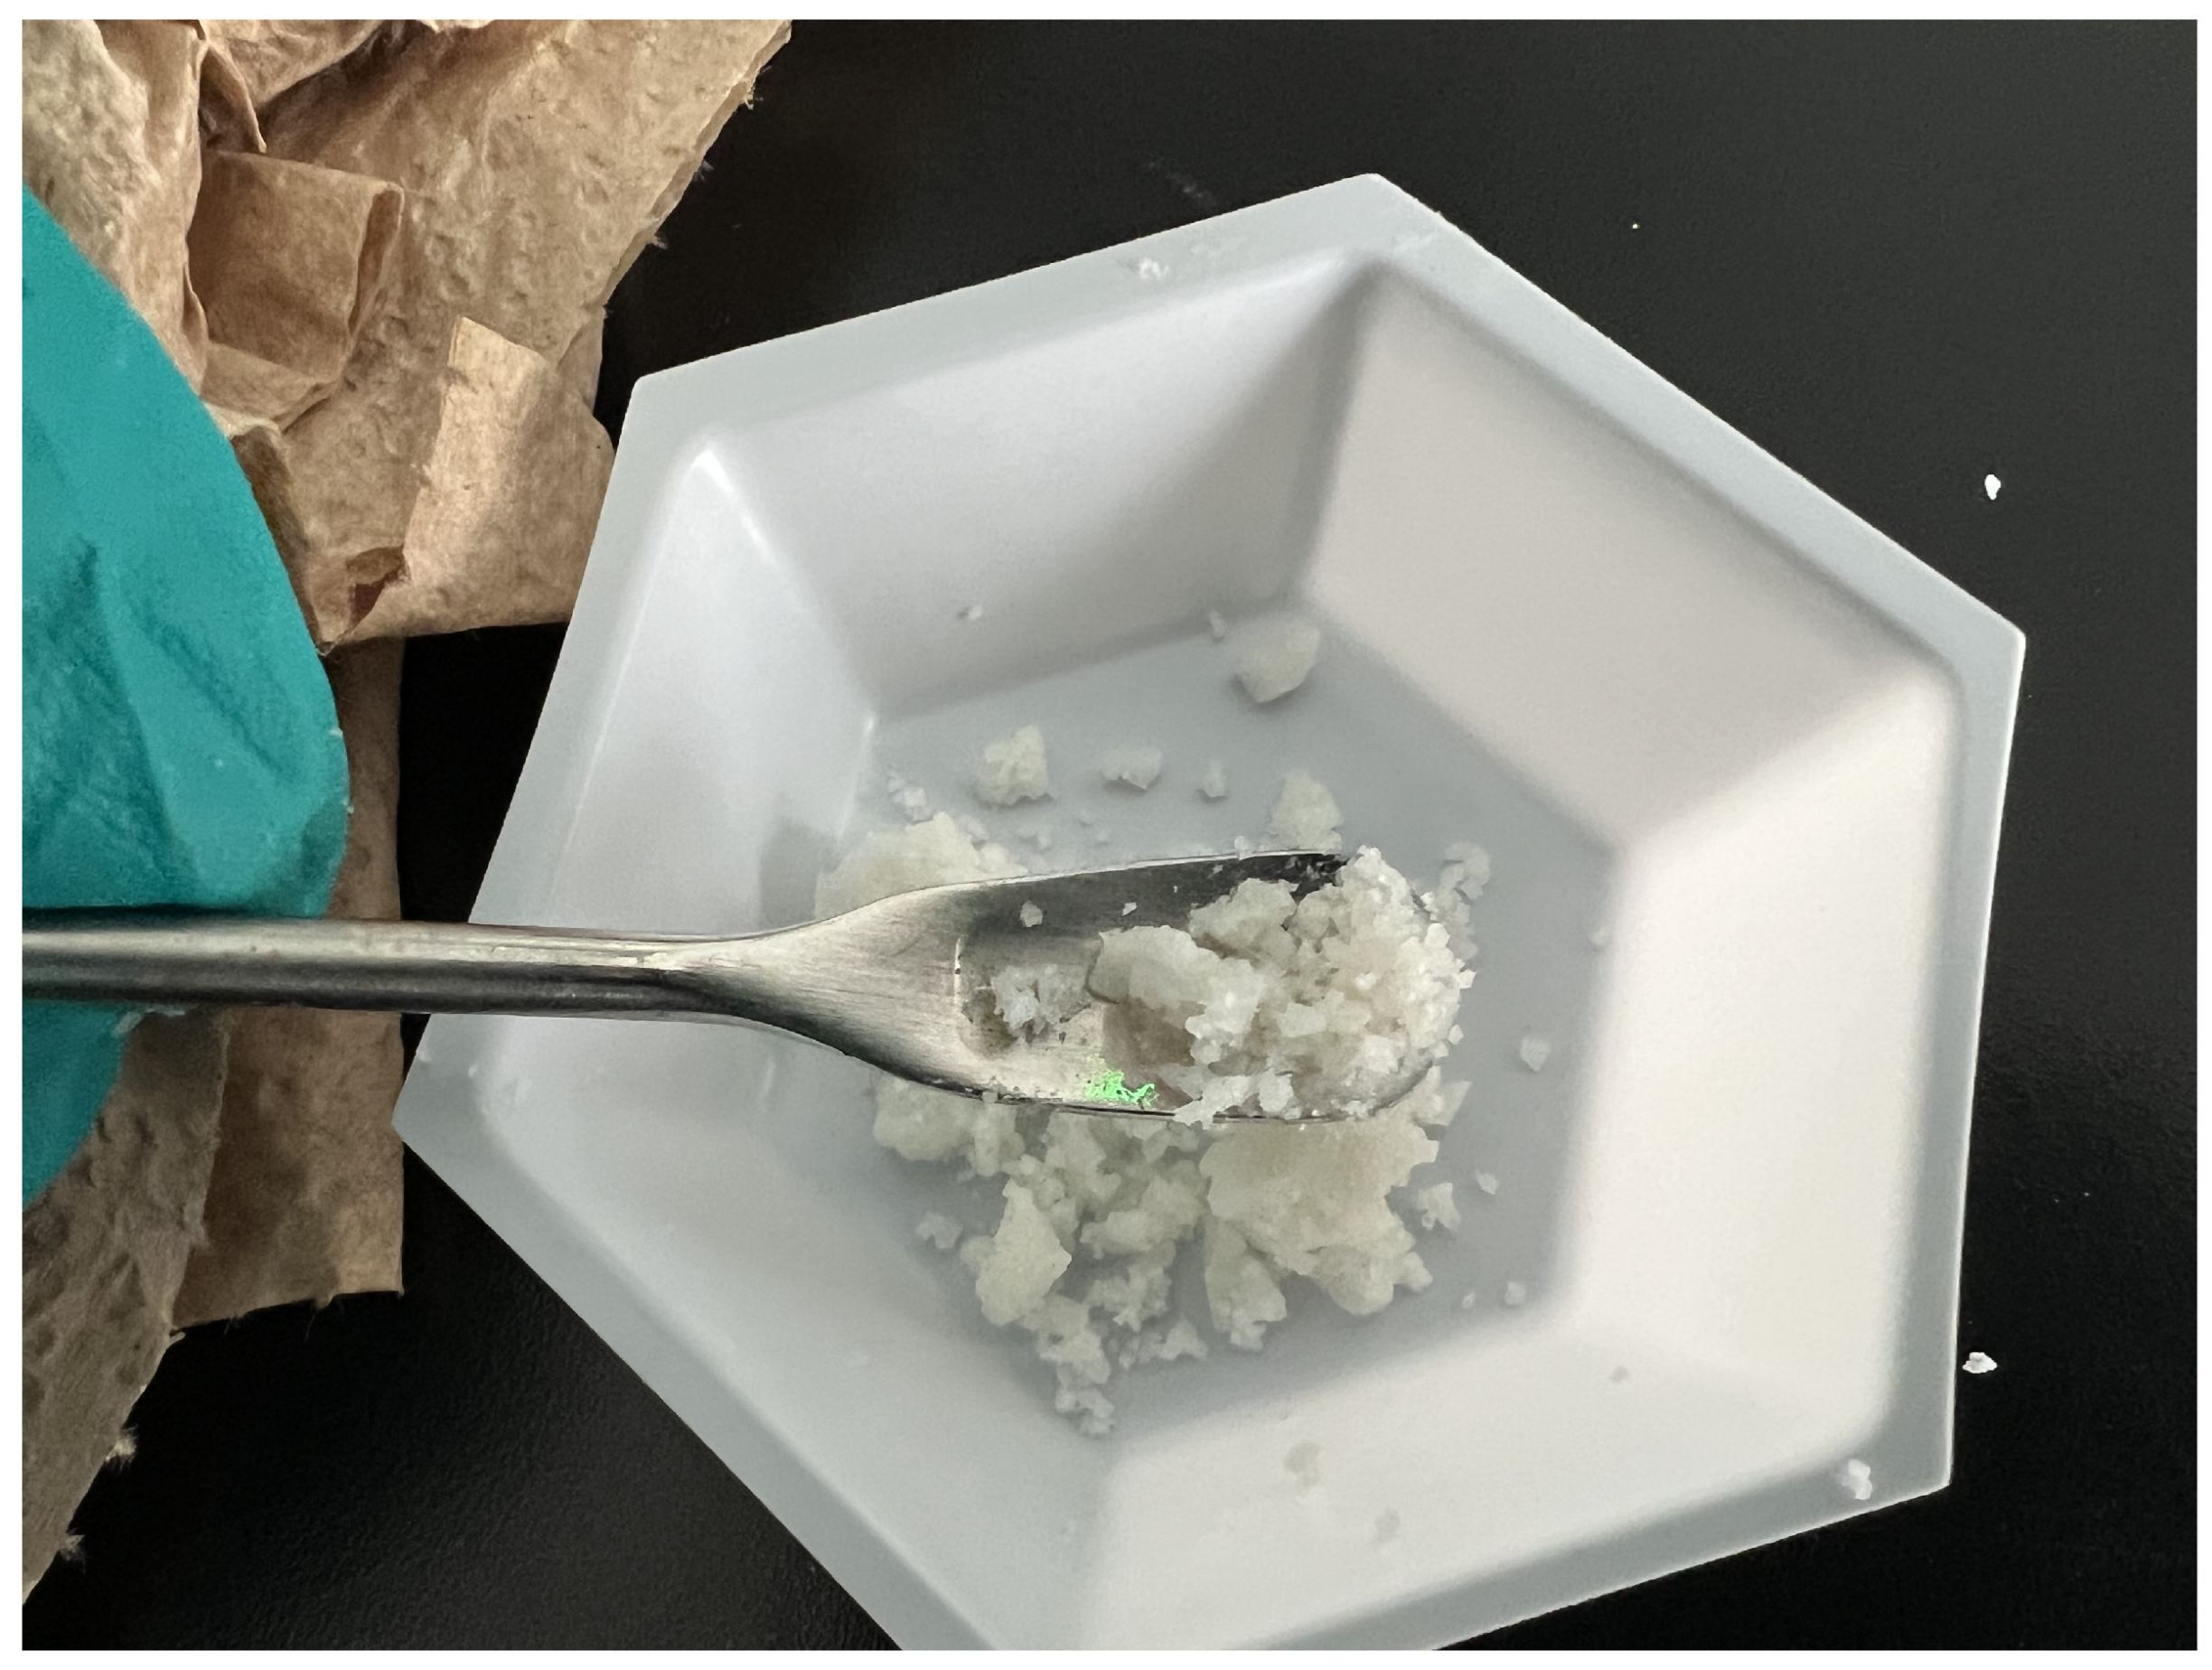
During the pH experiments, the addition of NaOH to the electrolyte produced a white precipitate, as shown in
Figure 6. The quantity of precipitate increased with further NaOH addition. Based on the chemical reactions occurring in the system, this precipitate is believed to be a combination of dysprosium hydroxide (Dy(OH)
3) and NaCl. Dysprosium is a lanthanide known for its ability to be dissolved in aqueous solutions and precipitate upon the addition of aqueous alkali [
12]. The dissolved Dy
3+ reacts with the NaOH to yield solid Dy(OH)
3, while the NaOH simultaneously reacts with the HCl present in the electrolyte to produce NaCl in solution, as described by the reactions in Equations (
5) and (
6). The addition of HCl and NaOH to the electrolyte and the formation of the precipitate changes the electrolyte composition, which introduces some additional influences on results. The HCl and NaOH concentrations were chosen to balance pH control without diluting the electrolyte solution. Future work should include attempting the experiment with other acidic and alkaline solutions to minimize the effect of other variables.
3.2. The Optimal Electrolyte Composition Results
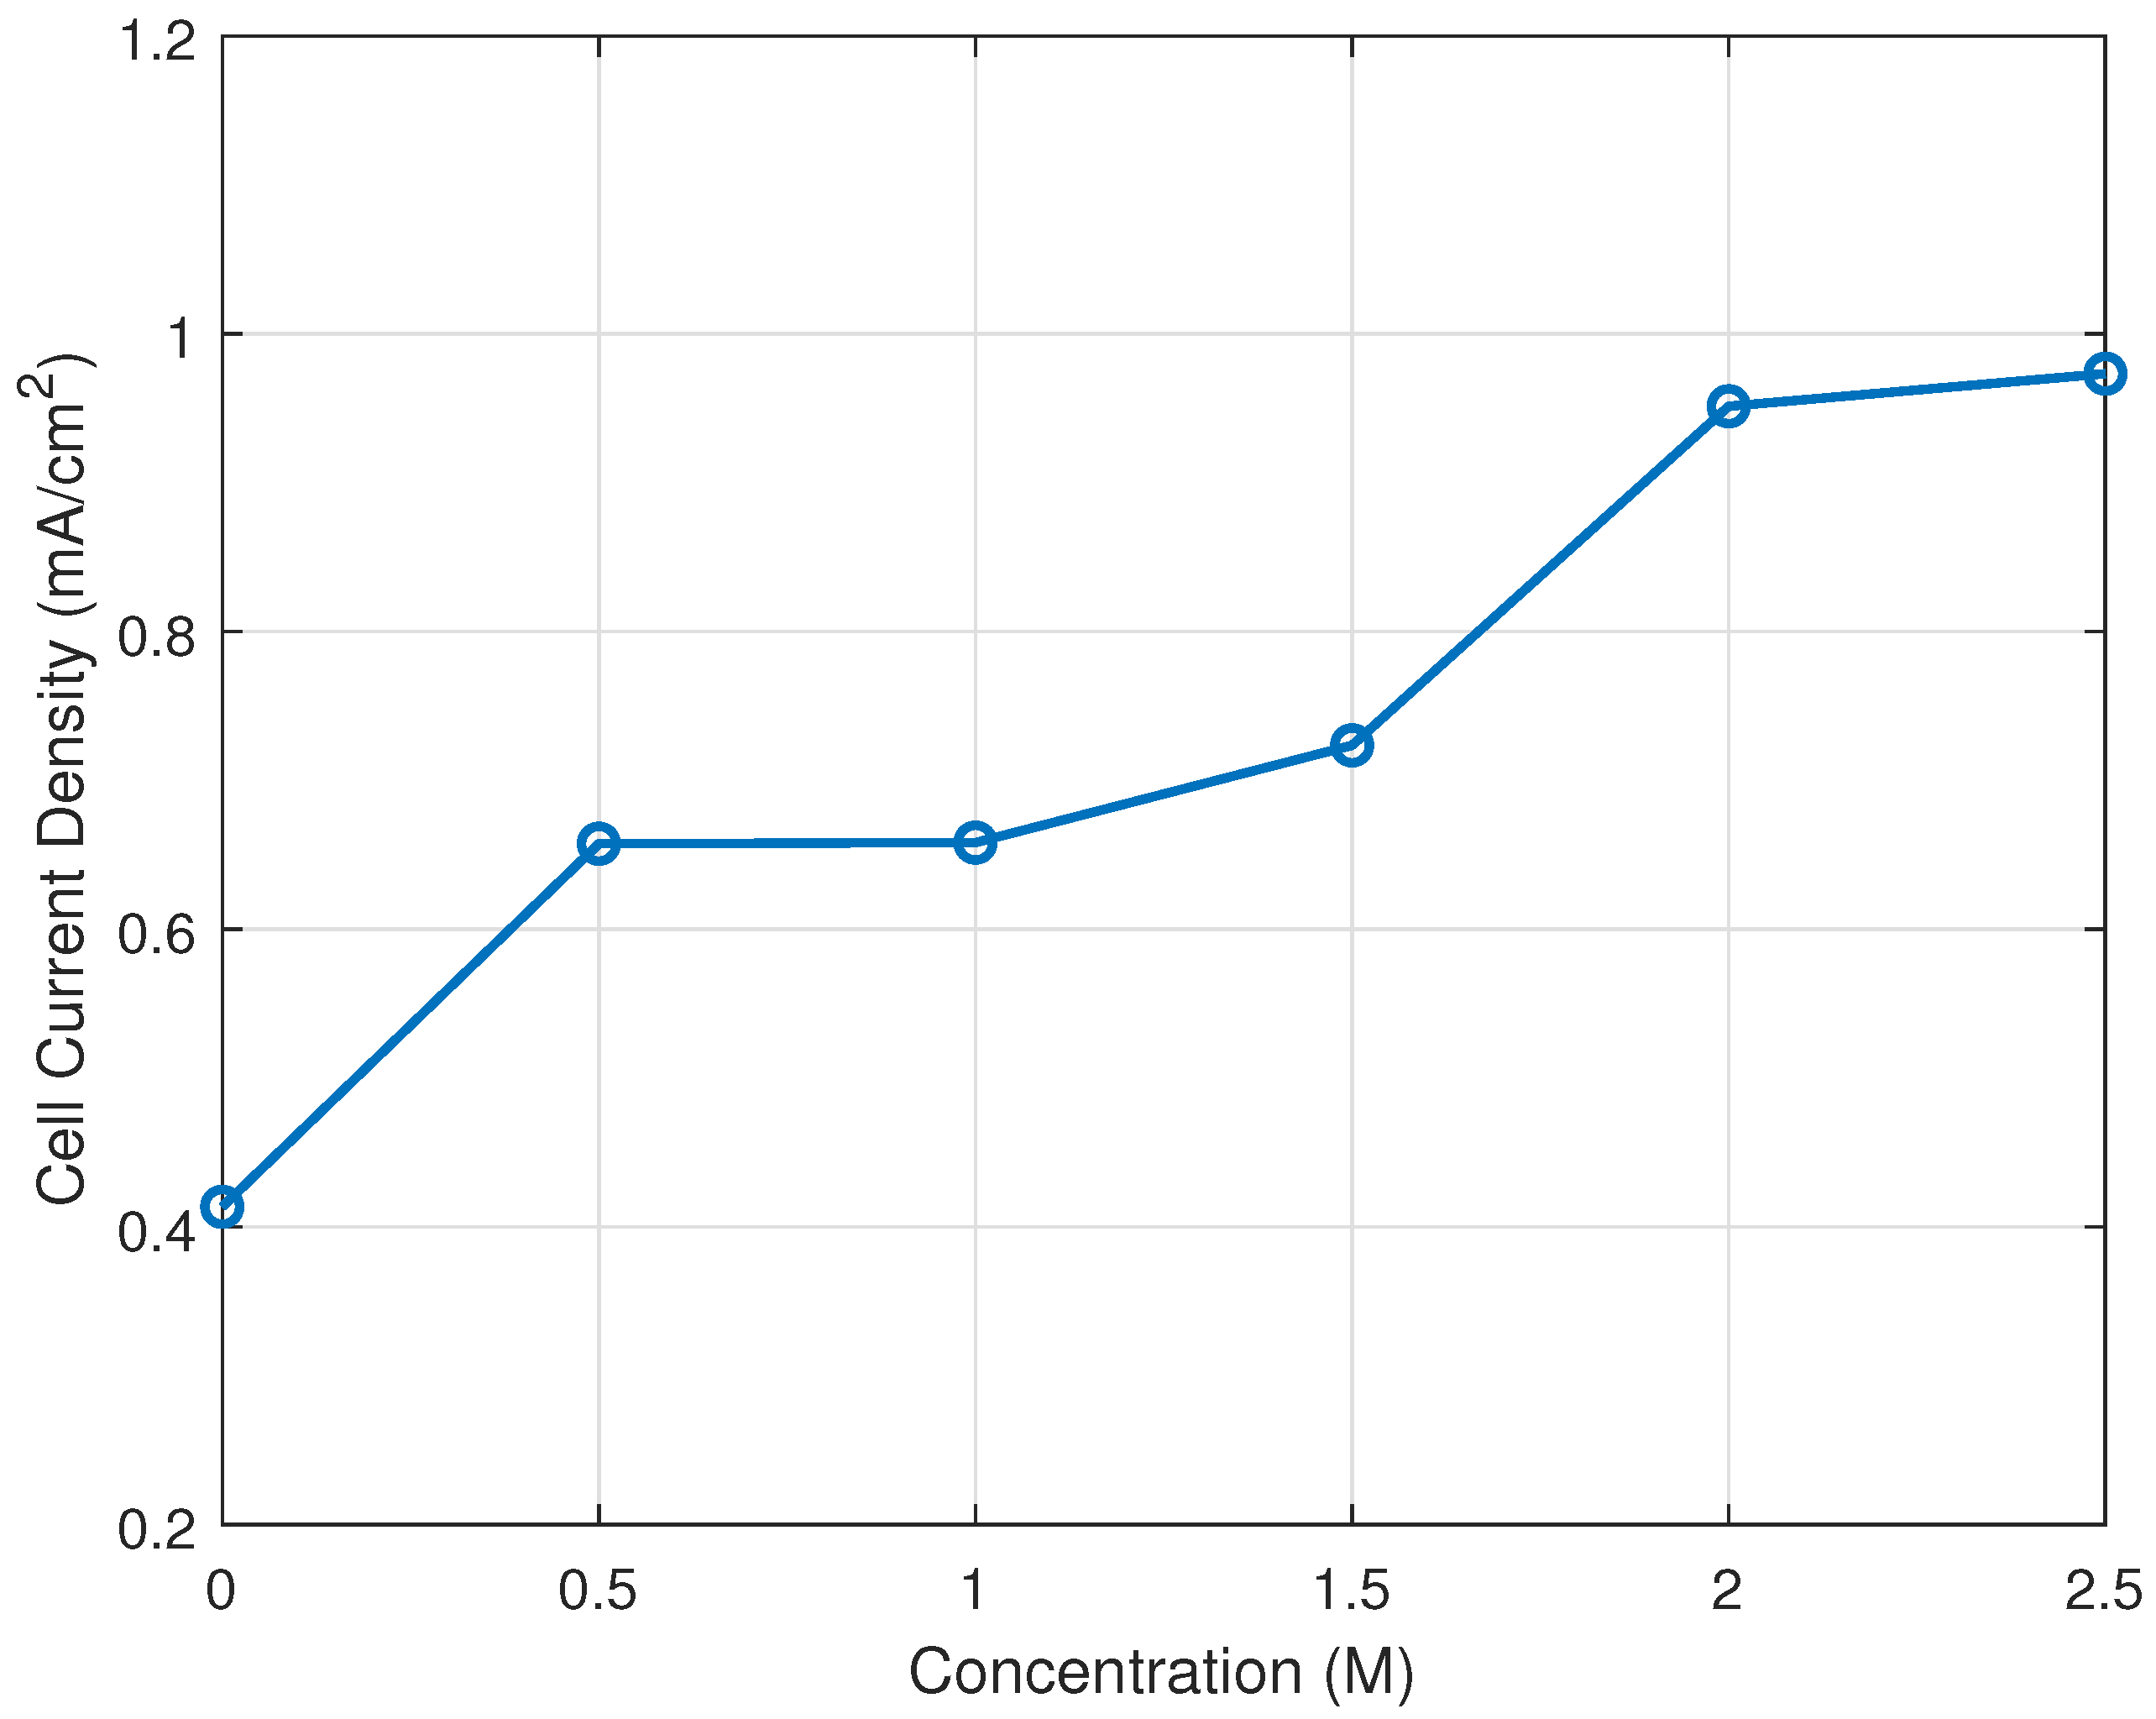
The cell current density was measured as a function of NaCl concentration in the electrolyte across the range of 0 M to 2.5 M. As shown in
Figure 7, the cell current density increased with NaCl concentration, increasing from 0.414 mA/cm
2 at 0 M to 0.973 mA/cm
2 at 2.5 M, an overall increase of 136.6%. The relationship is approximately linear, though a plateau was observed between 0.5 M and 1 M, followed by an increase from 1.5 M onward before leveling off again at 2.5 M.
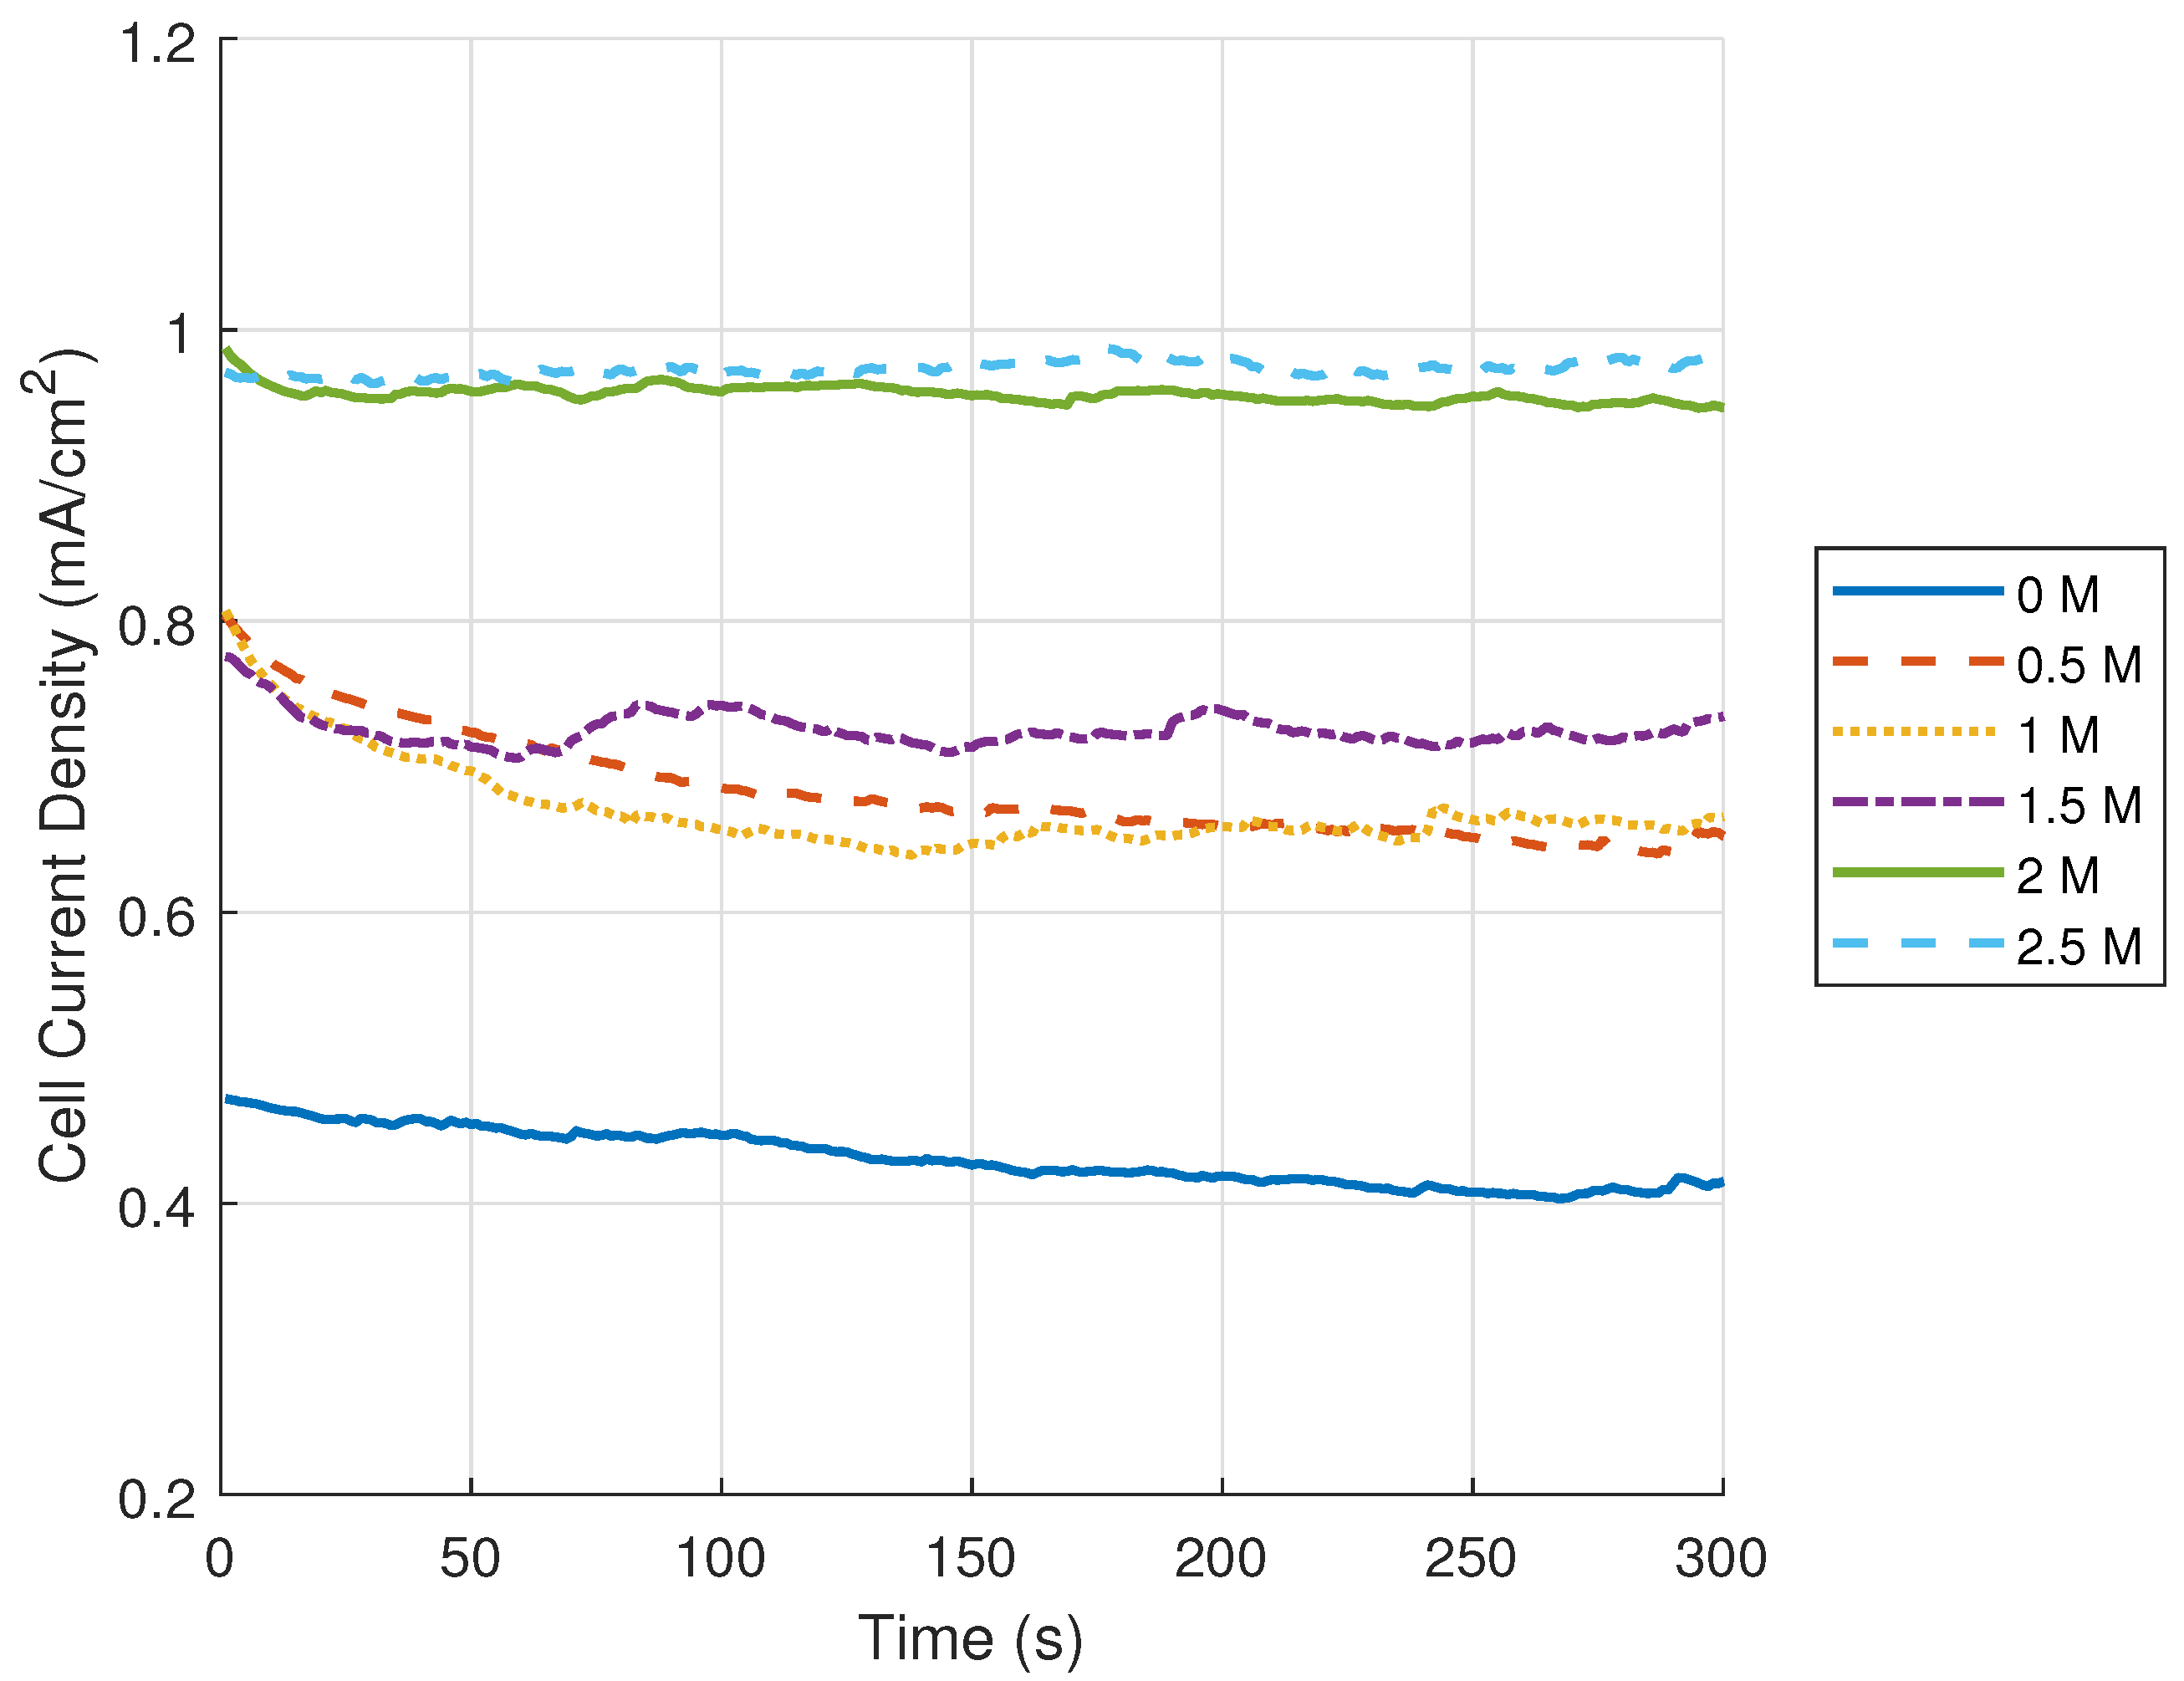
Figure 8 shows the cell current density over the 300-s measurement period at each concentration. The 0 M and 1.5 M conditions had a gradual downward trend throughout the measurement, while the other concentrations, particularly 2 M and 2.5 M, remained comparatively stable.
Figure 7 and
Figure 8 clearly present a positive relationship between the NaCl concentration and the cell current density. This relationship continues up to about 2 M, after which the current begins to plateau. This behavior is expected by the supporting electrolyte in electrochemical cells. A supporting electrolyte in a solvent is used to support the electron transfer between the electrode compartments. A large supporting electrolyte concentration will increase the solution conductivity by reducing the solution resistance [
13]. This is seen in experiments: as the NaCl concentrations increase, so does the current density.
Schalenbach et al. examined the impact of supporting salts on ion transport and limited currents in electrolyte and ionic liquids and established a physical model that described how increasing the salt concentration reduces the transport of electroactive species while also lowering the overall resistance of the cell [
14]. It presents a compromise between the increased conductivity and the limited current of the cell. The experiments in the H
2O
2 fuel cells map to this conclusion. At low NaCl, the cell has a higher internal resistance, and the addition of NaCl improves the performance of the cell by reducing that resistance. The plateau observed past 2 M of NaCl is consistent with this model, as at high salt concentrations, the shared conductance between the ions lowers transport of the electrochemically active ions, limiting further increases in the current density. Therefore, to avoid the plateau, the optimal NaCl concentration is 2 M. The observed increase in current density with NaCl concentration is understood to be primarily due to a reduction in bulk solution resistance through improved ionic conductivity. This is consistent with the established role of supporting electrolyte in electrochemical cells as described by Schalenbach et al. However, it is important to note that the total ohmic resistance of a cell consists of multiple components beyond bulk electrolyte resistance, including the resistance of the proton exchange membrane, the electrode-electrolyte interface, and resistance in the electrode assembly. To further investigate the resistance components, a method like electrochemical impedance spectroscopy (EIS) will need to be employed in future work.
The chemical compatibility of the optimized electrolyte with the electrode material is an important consideration for the sustained operation of the cell. Hypochlorous acid can form through the oxidation of Cl− by H2O2, which can contribute to the degradation of the Prussian Blue electrode. However, due to ambient temperature, the absence of applied potentials in excess of the OCV, and the relatively dilute H2O2 concentration, the rate of Cl− oxidation may be limited. The Cl− may also promote the localized breakdown of the Ta2O5 film, but a reproduceable trend in the tantalum component suggests that the film remained intact throughout the experiment duration. The competitive adsorption of Cl− can inhibit the H2O2 reduction activity at the Prussian Blue surface. As the current density increased with concentration until 2 M of NaCl, this effect may be more pronounced above this concentration. Post-experiment surface characterization using techniques like SEM, EDS and XPS will be employed in future experiments to assess and evaluate the chemical compatibility of the electrolyte and electrode material.
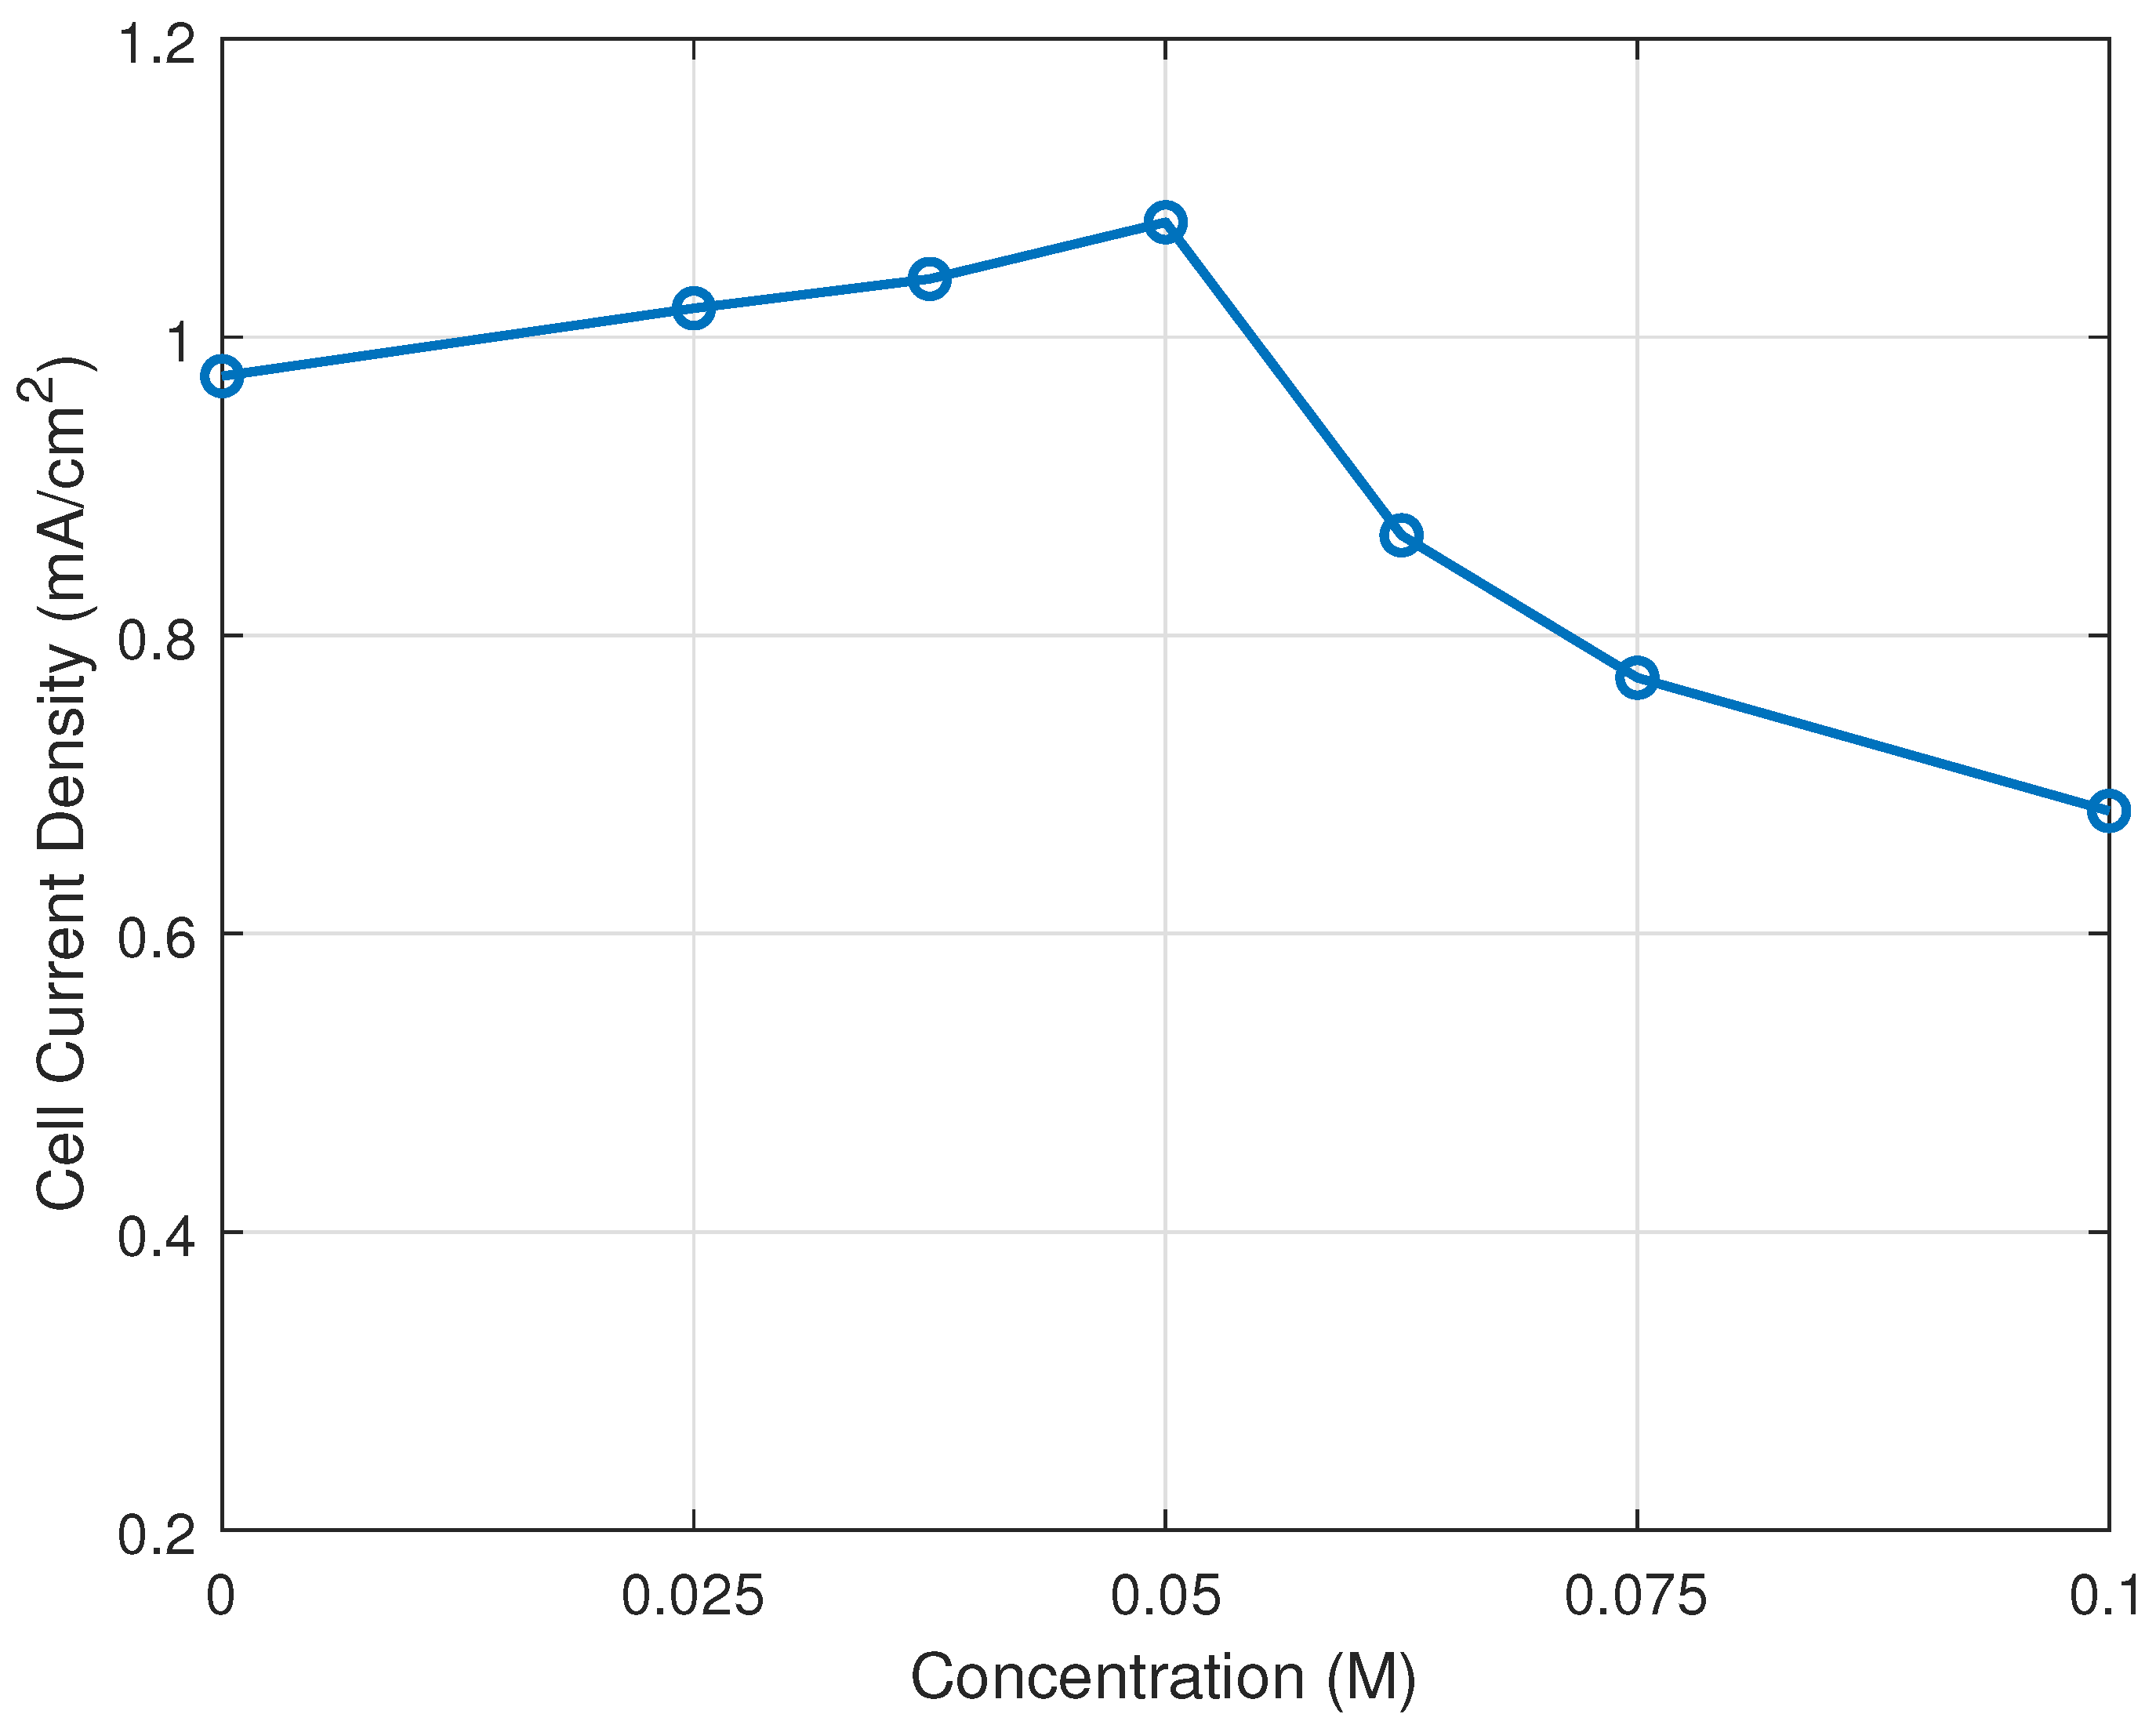
The cell current density was measured as a function of Dy(NO
3)
3 concentration in the electrolyte across the range of 0 M to 0.1 M, with the NaCl concentration fixed at 2 M. As shown in
Figure 9, the cell current density initially increased with Dy(NO
3)
3 concentration, reaching a peak of approximately 1.08 mA/cm
2 at 0.05 M, before declining at higher concentrations to 0.68 mA/cm
2 at 0.1 M.
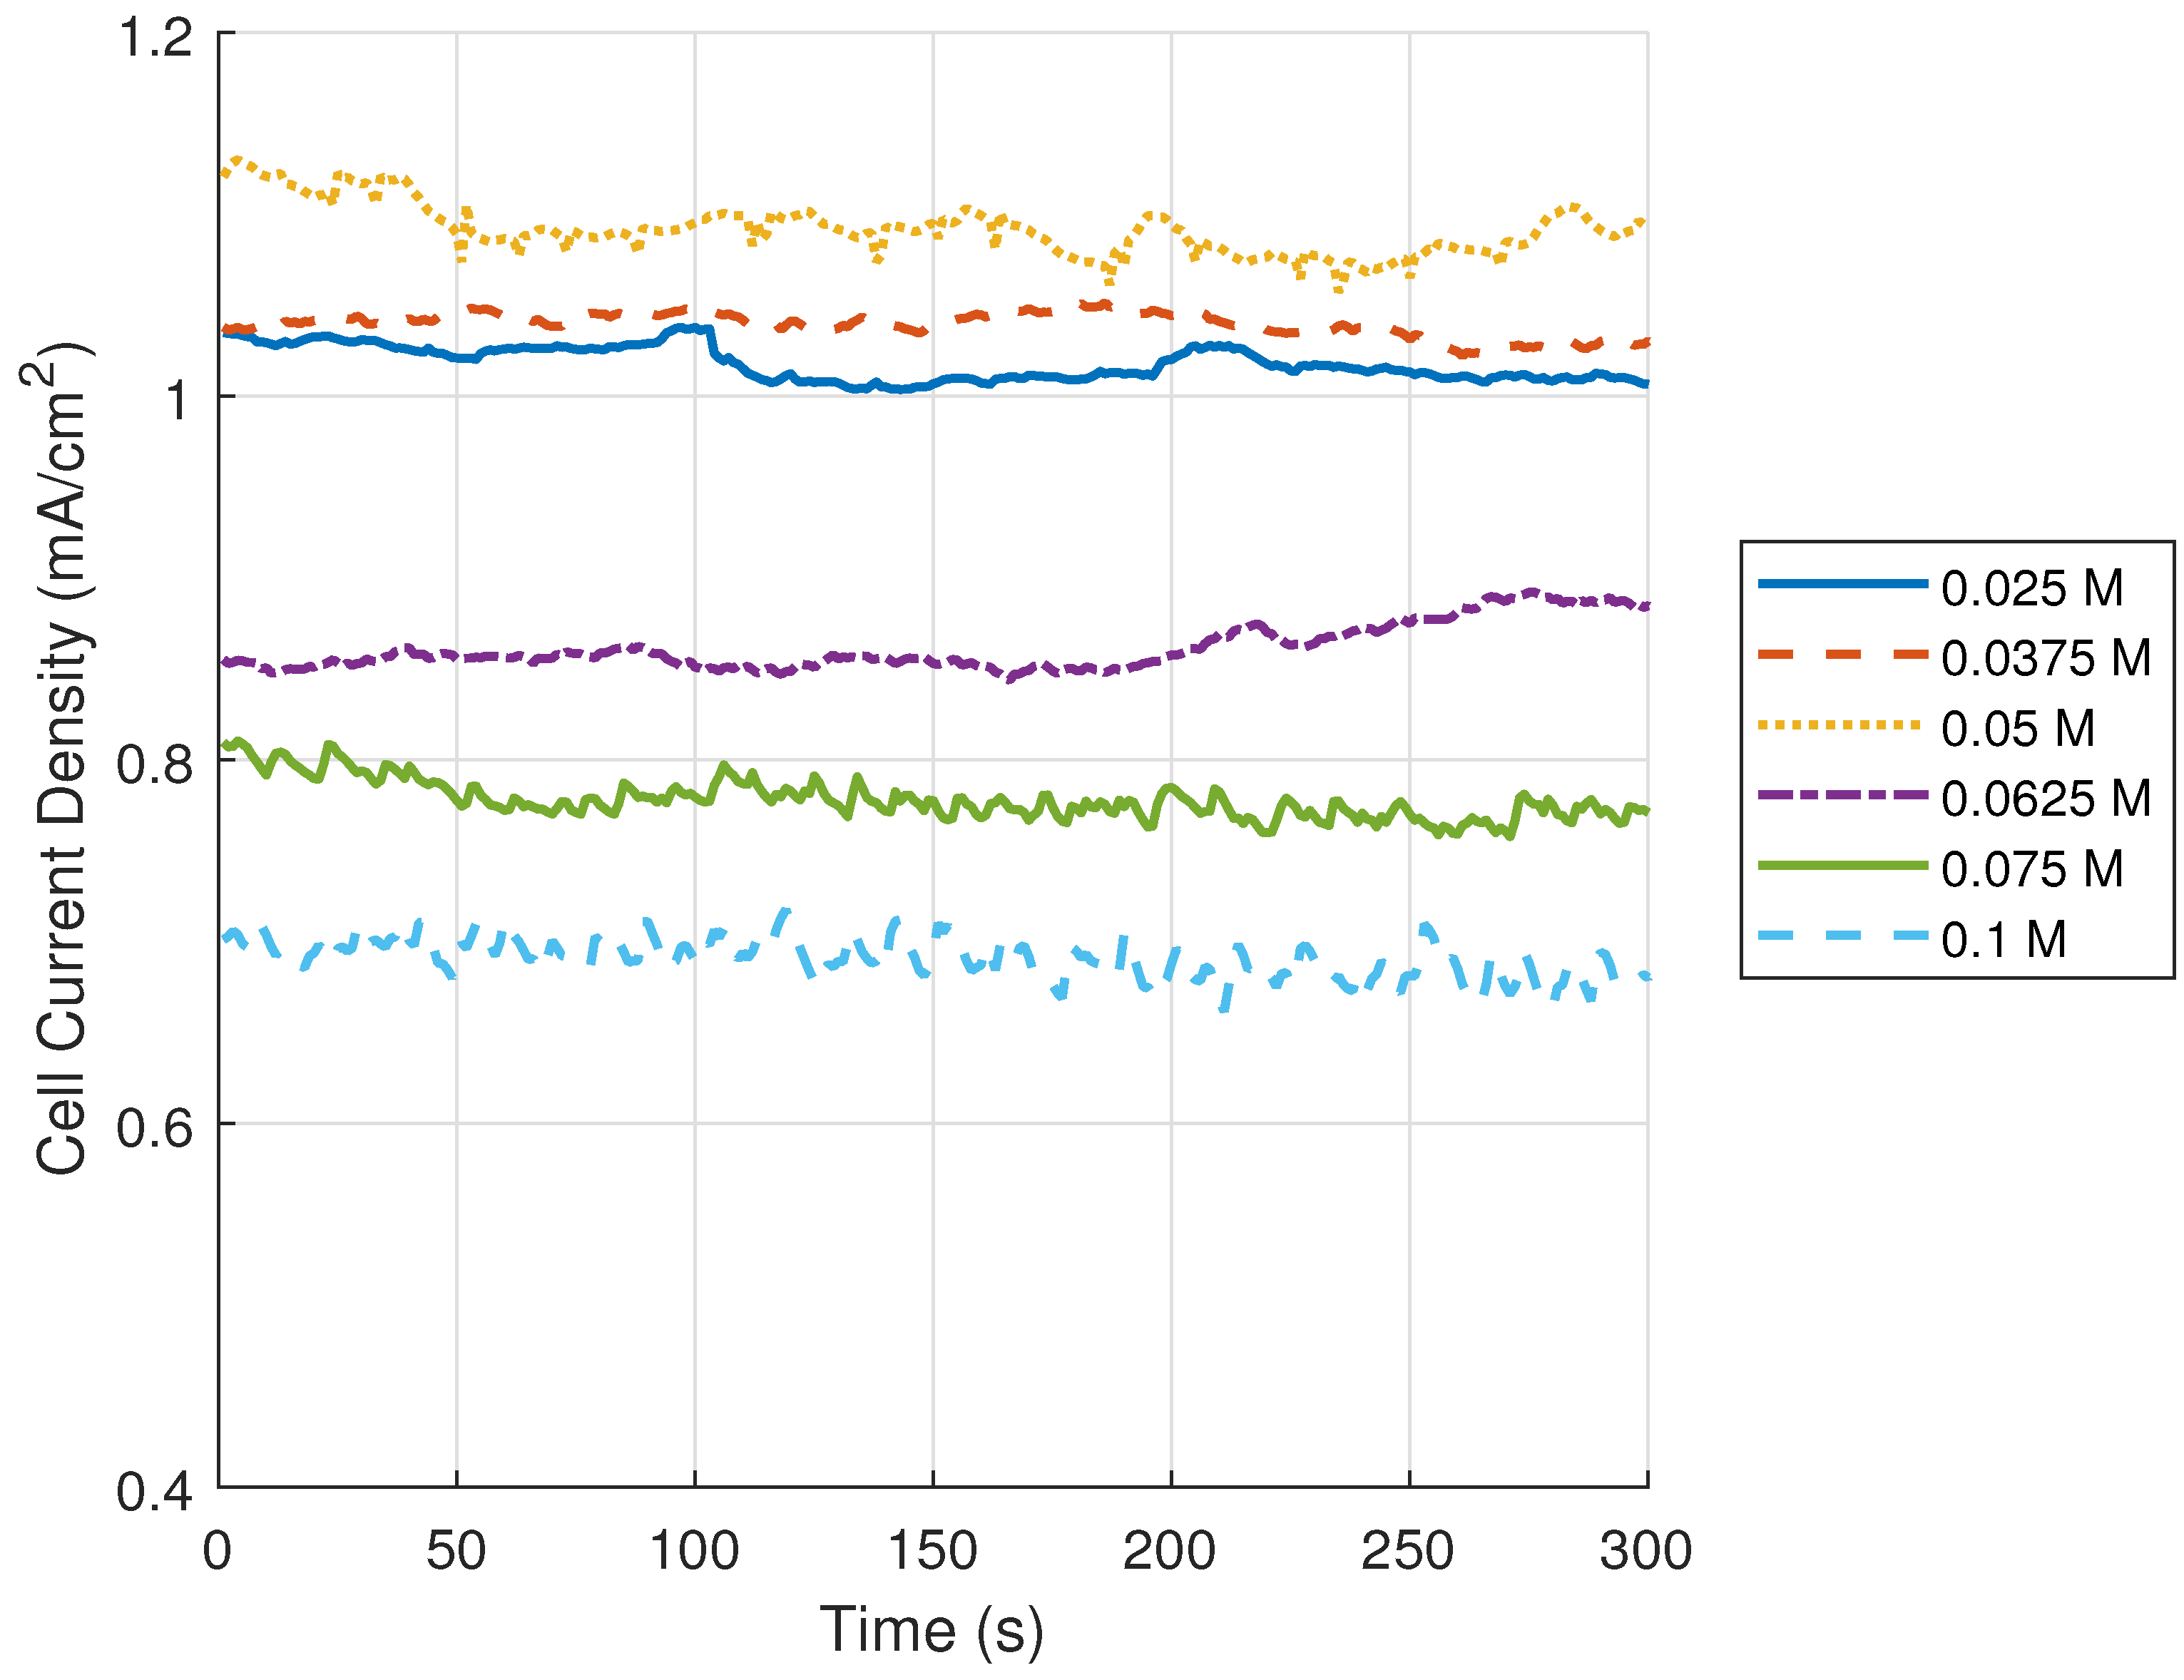
Figure 10 shows the cell current density over the 300 s measurement period at each concentration. The 0.05 M and 0.0375 M conditions produced the highest current densities and remained comparatively stable, while the 0.0625 M, 0.075 M, and 0.1 M conditions were notably lower and less stable.
Figure 9 and
Figure 10 show that with the addition of Dy(NO
3)
3, there is a modest performance increase from 0.951 mA/cm
2 at 0 M to a peak of 1.08 mA/cm
2 at 0.05 M, followed by a sharp decline to 0.68 mA/cm
2 at 0.1 M. Dy(NO
3)
3 has been previously identified to be a strong additive to increase to the OCV of the cell [
7]. Beyond its contribution to increase the rate of reduction, as with NaCl, the addition of Dy
3+ cation may contribute to electrochemical conductivity through its interaction with the electrode surface. Briega-Martos et al. discusses how cations in solution can tune the structure of the interfacial water adlayer at the electrode surface, influencing the rate of the H
2O
2 reduction reaction on Pt(111) electrodes [
15]. Although the authors focused on alkali metal cations, the same mechanism is expected to apply to lanthanides like Dy
3+, considering they are a higher charged ion. Furthermore, lanthanides such as Dy are known for their unique 4f electronic structures, whose movement is known for its ability to decrease activation energy and improve catalytic processes [
16].
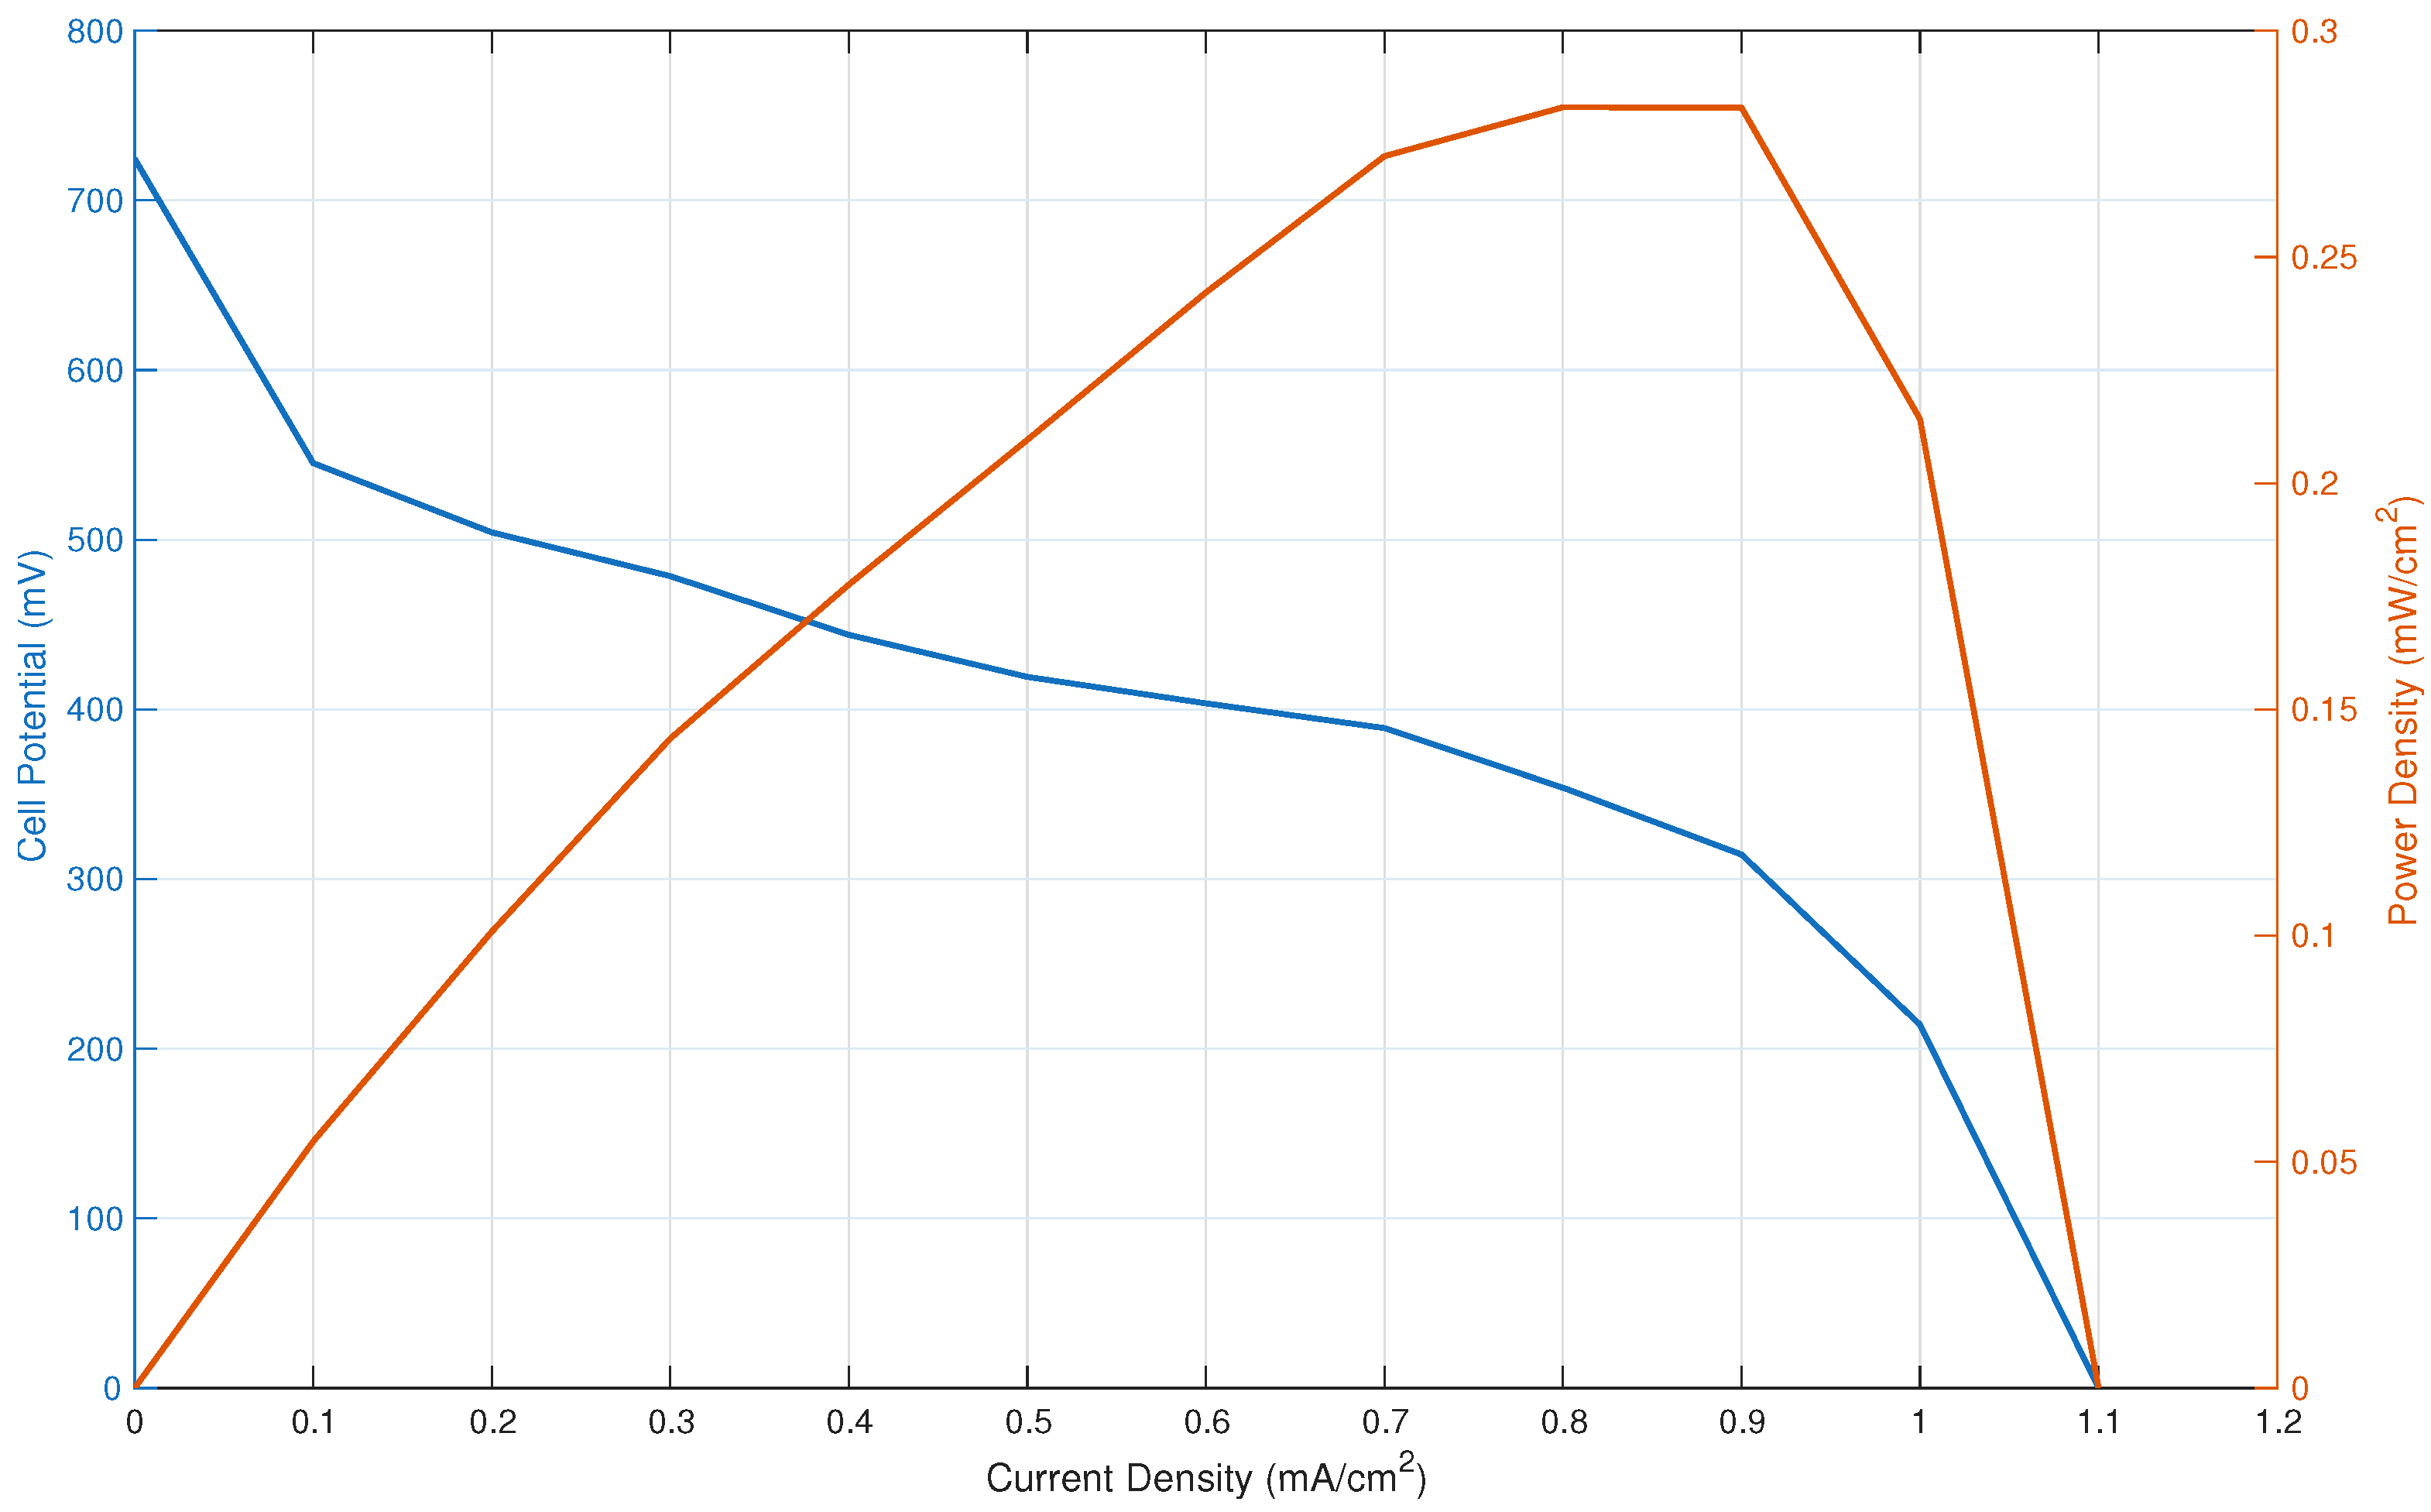
Figure 11 presents the polarization and power density curves of the dual-compartment H
2O
2 fuel cell using the optimized electrolyte in the H-cell membrane reactor. The cell exhibited an OCV of 724 mV, consistent with the results in pH experiments. As the current density increased, the cell potential decreased steadily, following a typical polarization behavior expected of an electrochemical fuel cell. The power density increased with current density, reaching a peak of approximately 0.283 mW/cm
2 at a current density of 0.8 mA/cm
2. After the peak, a sharp decline is observed which is characteristic of concentration polarization, where mass transport limitations restrict the supply of H
2O
2 to the electrode surface. The cell reached a limiting current density of approximately 1.1 mA/cm
2, at which point the cell potential approached zero. As a comparison,
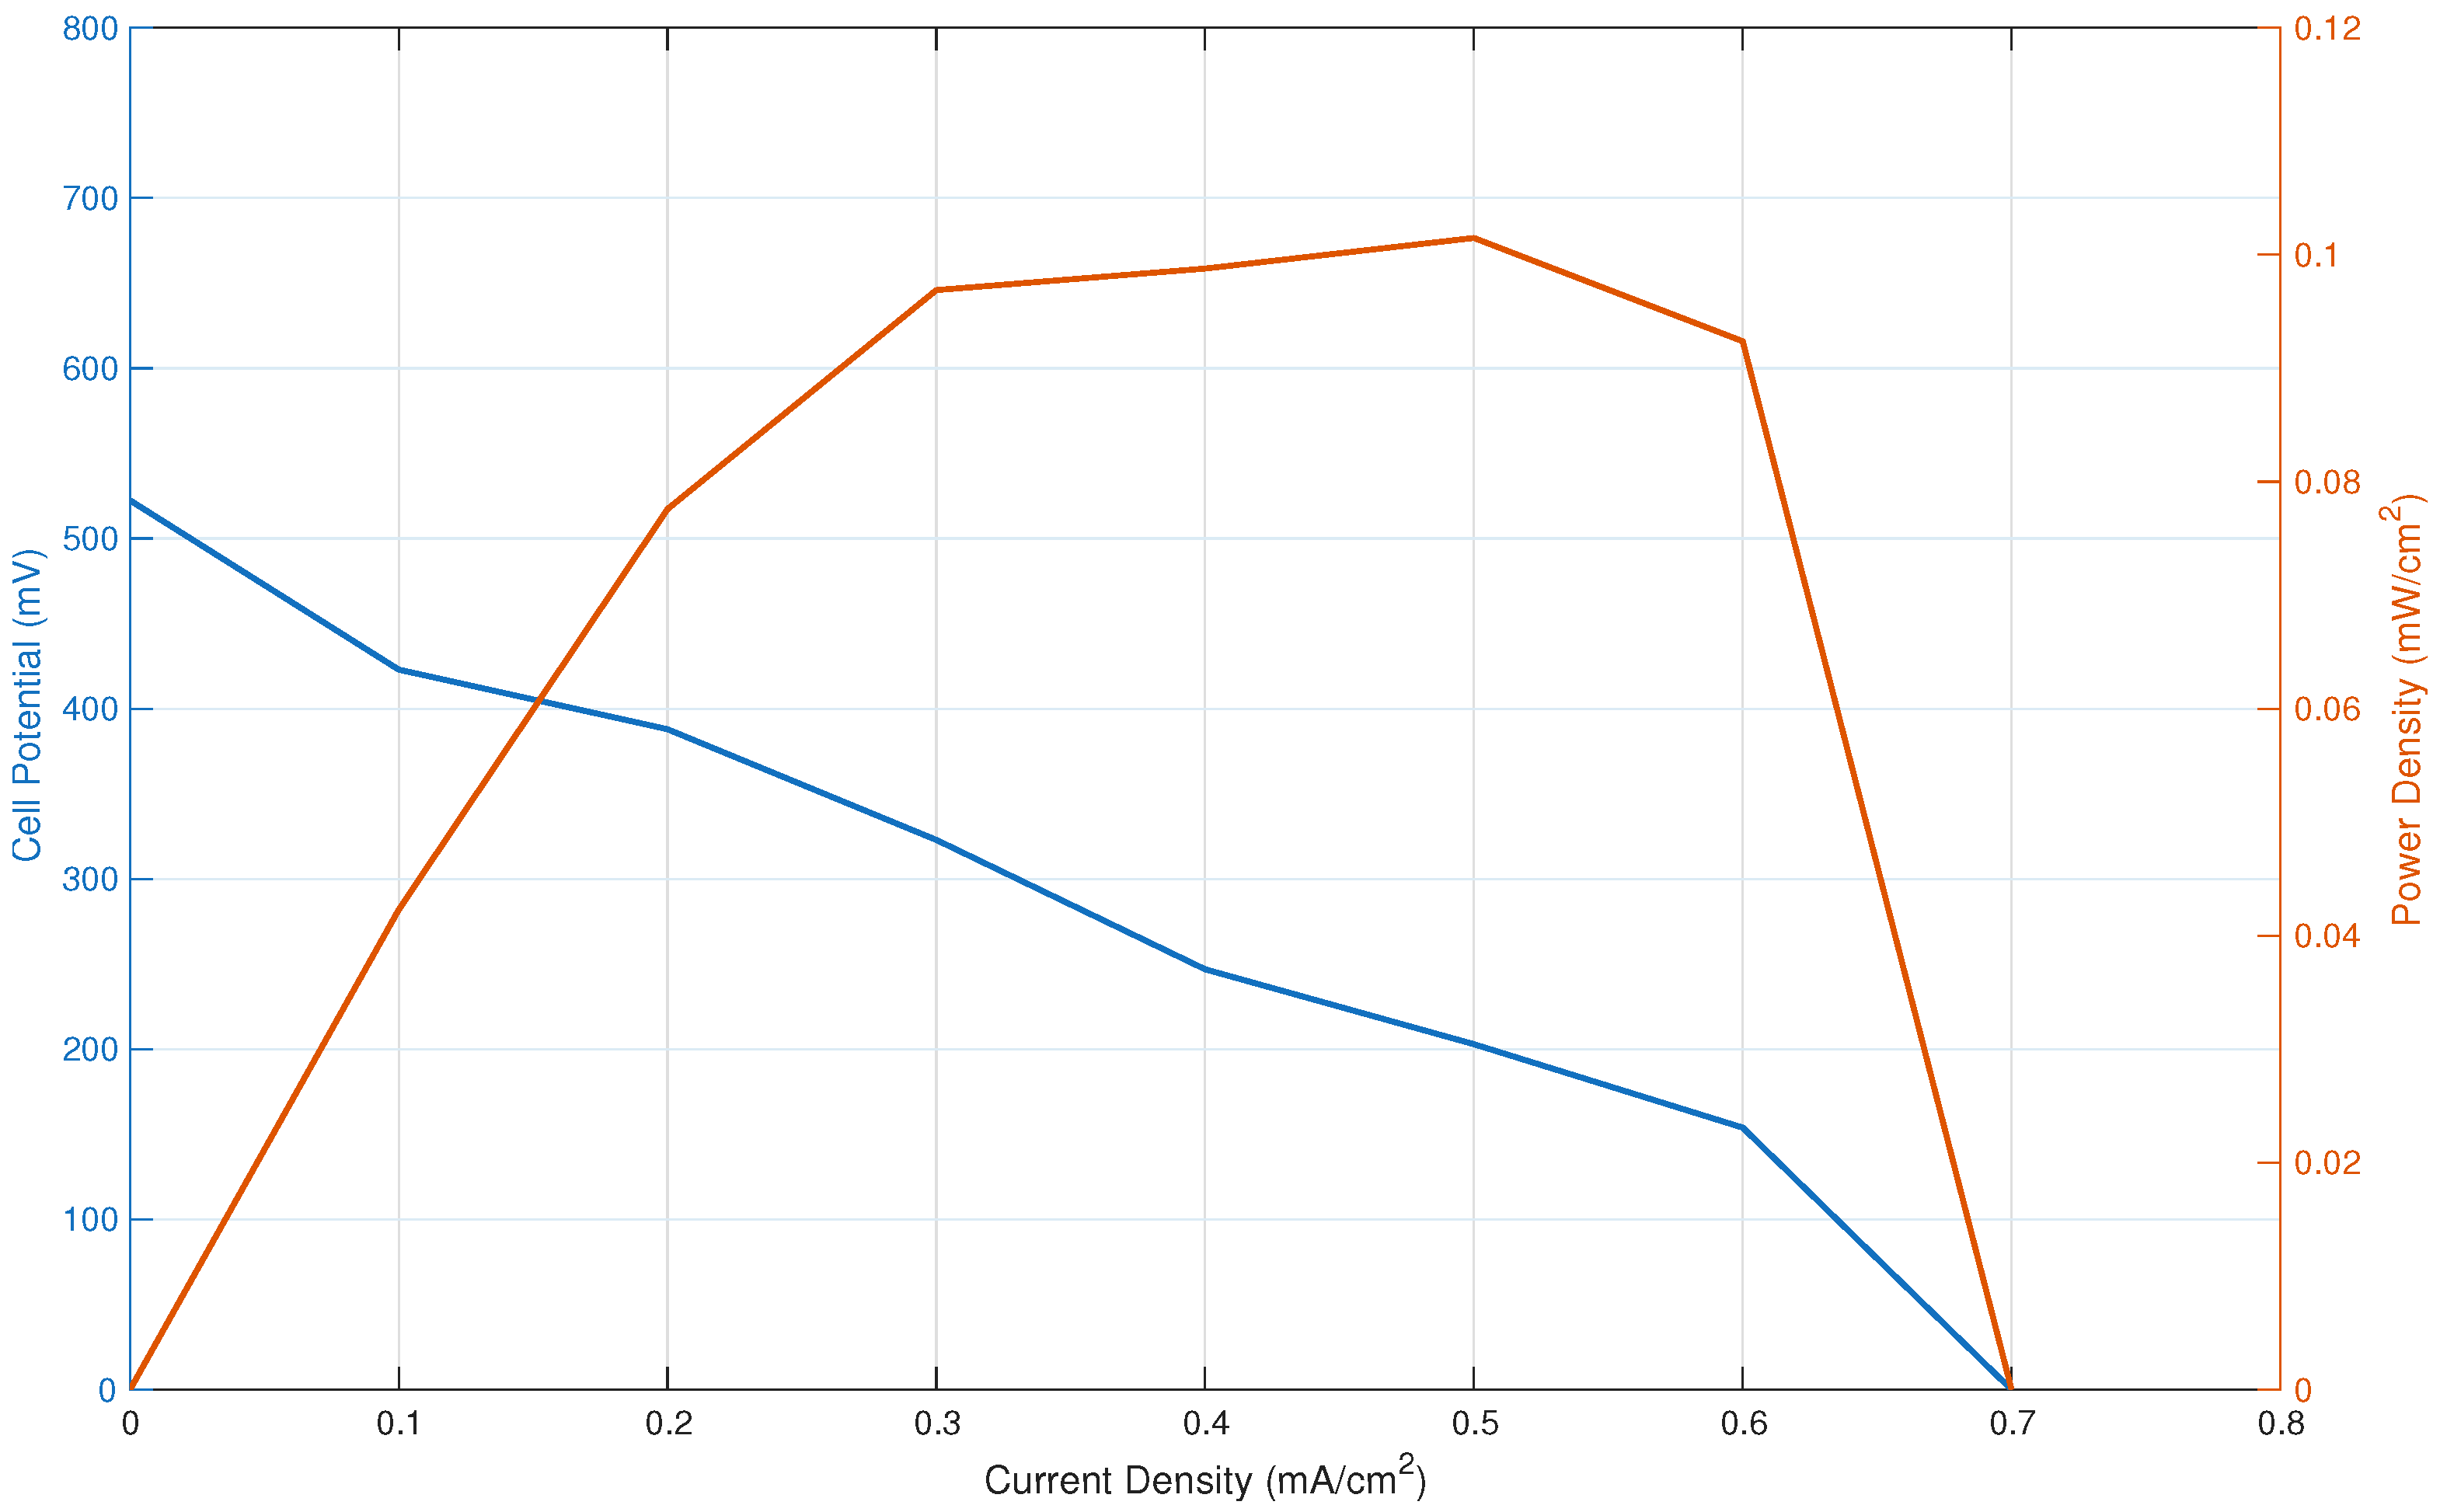
Figure 12 shows the polarization curve of the H-cell using an electrolyte of 0.3 M H
2O
2, and 0.5 M NaCl, with the Ta compartment and the Prussian Blue compartment both at a pH of 2. The OCV if the cell was 522 mV, and it had a peak power density of about 0.101 mW/cm
2 at 0.5 mA/cm
2.
The polarization and power density curves were generated from the H-cell configuration using the optimized electrolyte consisting of 0.3 M H
2O
2, 0.05 M Dy(NO
3)
3, 2.0 M NaCl, and Ta and Prussian Blue compartments at pH 12 and 2, respectively.
Figure 11 depicts the characteristic three-region profile expected from an electrochemical fuel cell [
17].
The initial voltage drop from the OCV of 724 mV as the current density increased is attributed to the activation overpotential of the cell. This is the kinetic barrier that the cell has to overcome to drive the H
2O
2 reactions in the Ta and Prussian Blue compartments. The activation overpotential is described by the Butler–Volmer equation and is characterized by an exponential drop in cell voltage in the low current densities [
18]. At the intermediate current densities, the polarization curve transitions to an ohmic loss region where the voltage decreases with increasing current density. The sources of ohmic resistance in this cell would include the PEM membrane and resistances in the electrode [
19]. The mass transport region occurs at about 0.80 mA/cm
2. This is also where the peak power density of about 0.283 mW/cm
2 was achieved. This occurs when the H
2O
2 is consumed at the electrode, and the rate at which it is consumed begins to exceed the rate at which it can be replenished by the surrounding electrolyte. This current density was limited to 1.1 mA/cm
2, meaning that beyond that load, no further electrochemical reaction can occur.
Figure 12 is the result from the H-cell without any of the optimizations made to the electrolyte. The cell had an OCV of about 522 mV with a peak power density of 0.101 mW/cm
2 at 0.5 mA/cm
2. The optimization of the electrolyte had a direct benefit to the output, as both the potential and current density increased due to the changes.