Article

Thermodynamic Analysis of Vehicle Liquid Hydrogen Tanks in Fire Scenarios

1
Institute of Safety Science & Engineering, South China University of Technology, Guangzhou 510640, China
2
Guangdong Provincial Science and Technology Collaborative Innovation Center for Work Safety, Guangzhou 510640, China
3
Guangdong Provincial Key Laboratory of Industrial Safety and Emergency Technology, Guangzhou 510640, China
4
Guangdong Institute of Special Equipment Inspection and Research, Foshan 528251, China
5
Guangdong Institute of Special Equipment Inspection and Research Foshan Branch, Foshan 528051, China
*
Author to whom correspondence should be addressed.
Energies 2026, 19(11), 2620; https://doi.org/10.3390/en19112620
Submission received: 20 March 2026 / Revised: 22 May 2026 / Accepted: 26 May 2026 / Published: 29 May 2026
(This article belongs to the Special Issue Improving Hydrogen Safety for Energy Applications)

Abstract

As sustainable development becomes increasingly important, technologies for liquid hydrogen (LH2) storage and transportation are advancing rapidly. Safety concerns regarding LH2 tanks in fire accidents require further attention. In this study, a one-dimensional thermodynamic model was developed based on layer-by-layer analysis to assess the heat transfer performance of the insulation structure in LH2 tanks under fire conditions. Through the transformation of the solving target and iteration rules, a novel and efficient solution method was proposed for such thermodynamic problems. The thermodynamic performance of the insulation structure coupled with spray-on foam and variable-density multilayer under normal temperature (NT) and standardized fire conditions (863.15 K) was analyzed, and the effects of insulation structure parameters and environmental factors were evaluated. A case study of a 500 L vehicle LH2 tank was conducted using the software package BoilFAST, with the total heat leakage as the key input, to analyze the evolution of internal pressure and temperature. Results show that within the insulation structure, temperature decreases rapidly by 80.35% and 89.55% under fire and NT conditions, respectively. Spray-on foam insulation thickness, layer density, residual gas pressure, and hydrogen temperature exert minor effects, while the temperature of the external environment and the number of layers significantly affect the heat flux under the fire condition. Under the NT condition, heat leakage is primarily attributed to support structures and accessory pipelines, whereas under the fire condition, heat leakage from the insulation structure becomes the main source, accounting for 63%. This study provides a reference for heat transfer assessment of LH2 tanks in fire scenarios.

1. Introduction

The global energy system is currently undergoing a significant revolution, progressively transitioning towards sustainable development and carbon neutrality [1]. Hydrogen, as a secondary energy carrier derived from various sources, presents a feasible alternative to traditional fossil fuels [2]. Hydrogen typically exists in a gaseous form and is colorless, odorless, and non-toxic. At standard atmospheric pressure, hydrogen has a melting point of 14 K and boils at 20 K [3,4]. It possesses characteristics such as environmental friendliness, high efficiency, and sustainability [5,6], positioning it as a crucial component in the future energy landscape and global economy. The versatility of hydrogen facilitates its widespread application across numerous sectors, including aerospace, agriculture, industry, military applications, and transportation.
The thermal safety analysis of system components and the hydrogen storage technique for vehicle applications are crucial for developing efficient and safe hydrogen fuel cell vehicles (HFCVs), thereby advancing the decarbonization of transportation [7,8]. In particular, storage equipment with high hydrogen storage density and low cost is receiving considerable attention. High-pressure hydrogen storage cylinders store gaseous hydrogen (GH2) by compressing it at pressures above the critical temperature. When the pressure reaches 70 MPa, the volumetric density can reach 39.1 g/L [9]. Owing to the high technological maturity, relatively low cost, and efficient refueling capabilities, Type III and Type IV cylinders have been widely adopted in HFCVs. In contrast, hydrogen stored in liquid hydrogen (LH2) tanks can achieve a much higher volumetric density of 70.8 g/L at 20 K and 1 bar [10]. The LH2 at this cryogenic temperature is subject to a considerable temperature disparity with the external environment, which necessitates an insulation structure to minimize heat transfer, ensuring safe and effective LH2 storage [11,12].
To ensure the performance and safety of LH2 tanks, the heat transfer mechanisms and thermodynamic behavior of the insulation structures have emerged as a critical research focus. Among these, spray-on foam insulation (SOFI) and high-vacuum multi-layer insulation (MLI) coupling are considered some of the most efficient and commonly utilized passive insulation methods [13,14]. SOFI is commonly made of materials such as foam [15], aerogel [16], and hollow glass microspheres (HGMs) [11]. MLI is composed of radiation shields with high reflectivity and spacers with low thermal conductivity, placed in a high-vacuum environment. This solution creates high thermal resistance, thereby reducing heat leakage. Notably, heat leakage generated by solid conduction is more significant near the cold boundary, while heat leakage due to radiation dominates near the hot boundary. Consequently, variable-density multilayer insulation (VDMLI) technology has been developed [17]. This approach optimizes MLI performance by enhancing the spacing of the radiation shields near LH2 and reducing the spacing of the radiation shields near the external environment. Research by Wang et al. [18] indicates that the insulation efficiency can be enhanced by 45.5% when transitioning from MLI to an optimized VDMLI.
Modifying the structure and materials of VDMLI, along with conducting thermodynamic modeling and analysis, is an effective research approach. Wang et al. [19] calculated the heat flux of different heat transfer modes within the VDMLI based on the layer-by-layer model, including solid conduction, gas conduction, and radiation. The impact of SOFI with various components on the effectiveness of the VDMLI for LH2 storage in orbit was summarized. Singh et al. [20] investigated the impact of emissivity, residual gas pressure, and the structure of the radiation shields on the heat transfer of VDMLI under different ambient heat load conditions. Qu et al. [21] developed a framework that integrates computational fluid dynamics with a one-dimensional model to study the heat transfer of LH2 tanks with various residual gas pressures. The findings indicate that residual gas pressure enhances heat leakage and the rates of self-pressurization. The external environment and the size of the LH2 tank are considered factors influencing heat leakage, without taking into account the support structure and accessory pipelines. On the other hand, self-pressurization is primarily affected by the size of the LH2 tank, the temperature of the external environment, and the filling rate. Ye et al. [22] discussed the impact of SOFI thickness and spacer material arrangement for the VDMLI. The study showed that integrating HGMs into the SOFI, combined with a reasonable layout in the spacer material, can significantly enhance insulation performance.
The thermal safety of LH2 tanks has been analyzed under a range of external conditions—from normal temperature (NT) conditions, orbital storage, terrestrial storage, and ascent phases—with the dominant heat transfer mechanisms differing across these scenarios [23]. In parallel, under extreme conditions such as traffic accidents, vehicle fires, and fire testing, the LH2 tanks face potential fire scenarios [24]. This focus on fire safety is critically important, given that hydrogen exhibits a broad range of flammability (from 4% to 75% concentration) and possesses a low minimum ignition energy (0.017 mJ) [25]. In the event of an accidental leak, this could lead to hazardous incidents [26], such as flash fires [27], boiling liquid expanding vapor explosions [28], and jet fires [29], potentially triggering domino effects [30]. Therefore, the thermal response under fire scenarios represents a growing area of interest in safety research. Camplese et al. [31] conducted experiments using uniform MLI in a high-temperature thermal vacuum chamber and established a thermodynamic model to predict MLI temperatures. They also examined the pressure response and potential failure modes of 120 L LH2 tanks under fire conditions [32]. Experimental investigations into the catastrophic failure and explosion behavior of vertical LH2 tanks (100 L and 250 L) in fire scenarios were conducted by Sun et al. [2] with an analysis focused on the resulting overpressure and other failure consequences. Nubli et al. [33] employed an ANSYS Fluent-based computational fluid dynamics approach to investigate pressure and temperature variations within a double-walled, vacuum-perlite-insulated, large-scale (3 m3) LH2 tank under fire exposure at different filling ratios. Similarly, in aerospace applications, thermal management strategies for hydrogen systems also face extreme operational demands under high-temperature conditions. These approaches may inform future innovations in LH2 tank insulation design [34].
The support system of LH2 tanks is equally critical for ensuring both structural safety and thermal insulation performance, with heat leakage under normal temperature conditions being a widely studied focus of research [35]. Kan et al. [36] proposed an octagonal support structure, which was systematically evaluated through finite element analysis covering heat transfer and mechanical analysis. Wan et al. [37] designed a 500 L LH2 tank in accordance with ISO 13985 standards. To minimize heat leakage, a support structure incorporating non-metallic fiber-reinforced materials with low thermal conductivity was employed. Qiu et al. [38] introduced a dual-function strut and, using a 50 L LH2 tank as the object, carried out structural design and heat transfer analysis of the support structure.
While these studies have advanced the understanding of LH2 tank thermal behavior, certain gaps remain in the context of thermodynamic analysis under fire scenarios. Most existing work has focused on large-scale storage tanks or experimental-scale vessels, with an emphasis on failure modes and catastrophic consequences under extreme experimental or uncontrollable conditions characterized by high thermal loads. There remains a relatively limited body of thermodynamic analysis that specifically addresses the standardized fire-test conditions, which are crucial for qualifying vehicle LH2 tanks during production and certification. In terms of modeling, simplified or uniform MLI structures are often assumed, with less attention given to the thermodynamic performance of engineering-applied hybrid insulation systems combining SOFI and VDMLI—including the effects of thickness, layer density distribution, number of layers, and corresponding boundary conditions. Furthermore, the integrated heat leakage from support structures and accessory pipelines, a critical driver of pressure rise in real applications, is frequently neglected in modeling. These limitations can hinder the accurate prediction of the thermal performance of vehicle LH2 tanks under fire conditions, ultimately affecting the assessment of tank performance in fire tests and the design of the insulation structure.
To address these gaps, a one-dimensional thermodynamic model based on layer-by-layer analysis was developed to evaluate the heat transfer performance of the insulation structure in vehicle LH2 tanks. The model accounted for heat transfer from the external environment under both NT and fire conditions. A novel and efficient solution method was proposed for solving such thermodynamic problems. Building on this foundation, a comparative thermodynamic analysis was conducted on the coupled SOFI/VDMLI structure under both typical NT and standardized fire conditions (863.15 K), with a focus on key performance indicators such as temperature distribution and heat flux. Subsequently, the influence of key insulation structure parameters was investigated, including the SOFI thickness, layer density distribution, total number of layers, and residual gas pressure. The influences of hydrogen temperature and the temperature of the external environment were also analyzed to address different internal and external environments. Furthermore, a case study of a 500 L vehicle LH2 tank was conducted using the BoilFAST v1.1.2 software package, with the total heat leakage (from the VDMLI, support structures, and accessory pipelines) as input, to simulate the evolution of internal pressure and temperature. The findings regarding the comparative thermodynamic characteristics of LH2 tanks under NT and fire conditions can enhance the safety of LH2 tank usage and provide valuable design references.

2. Model and Calculation Procedure

2.1. Physical Model

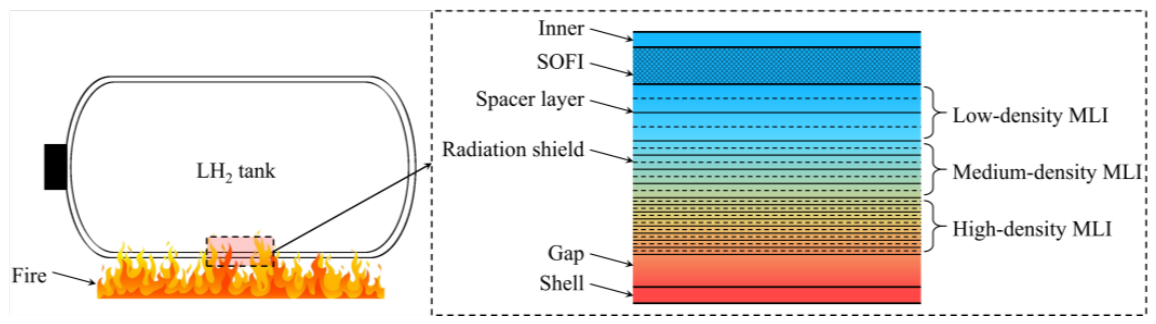
As illustrated in Figure 1, the typical passive insulation structure applied to the vehicle LH2 tank was selected as the research object. The insulation structure primarily included VDMLI and SOFI. The materials used in VDMLI consist of radiation shields made from aluminized mylar, along with spacer layers constructed from dacron net. After being weakened by the insulation system with lower thermal conductivity, only a limited amount of heat from the external environment could be transferred into the vehicle LH2 tank.

2.2. Thermodynamic Model

2.2.1. Assumptions

In this study, the LH2 tank and its insulation system were supposed to be in a state of thermal equilibrium. To establish the one-dimensional steady-state thermodynamic model, the following assumptions were made [11,21]:
  • The heat that leaks into the vehicle LH2 tank is transferred only in the radial direction;
  • The gas and insulation material in the VDMLI are isotropic;
  • The surface emissivity of every radiation shield is considered to be identical.
Founded on the layer-by-layer analysis of VDMLI [39], the inner, shell, SOFI, and external environment were also incorporated as computational nodes (see Figure 2).

2.2.2. Heat Transfer Through the Inner and Shell

316L (EN 10027–2:2015 [40]) was selected for both the inner and shell material, which is well-suited for vehicle LH2 storage applications [32]. The considerable variation in temperature between the inner and the shell, which are in contact with LH2 and the external environment, respectively, results in a large discrepancy in thermal conductivity despite the identical material. Therefore, based on the experimental result by Jeon et al. [41] within the temperature interval of 20 to 300 K and the functional equations for 300–1700 K provided by Kim [42], the thermal conductivity is defined as follows:
k inner = k shell = 7.570 × 10 7 T 3 4.477 × 10 4 T 2 + 0.107 T + 0.829 20   K T 293   K 1.571 × 10 2 T + 9.248 293   K < T 1700   K
where kinner and kshell represent the thermal conductivity of the inner and the shell, respectively, W/(m·K); T is the temperature, K.

2.2.3. Heat Transfer Through the SOFI

In the one-dimensional thermodynamic model of the vehicle LH2 tank, the SOFI is discretized into a grid cells. Solid heat conduction is the main form of heat flux through SOFI. The thermal conductivity of the SOFI (kSOFI) can be considered dependent on temperature [43]:
k SOFI = 3.897 × 10 4 T 2 0.029 T + 1.097 × 10 3

2.2.4. Heat Transfer Through the VDMLI

The VDMLI is divided into b grid cells. For the heat transfer between the a + 2 to a + b + 1 nodes, the heat transfer within the VDMLI comprises three distinct components, calculable via Equation (3):
q VDMLI = q rad + q g _ cond + q s _ cond
where qVDMLI is heat flux within the VDMLI, W/m2; qrad, qg_cond, and qs_cond represent the heat flux of radiation, gas conduction, and solid conduction, respectively, W/m2.
qrad is calculated through Equations (4) and (5) [44]:
q rad = h rad T hot T cold
h rad = σ T hot + T cold T hot 2 + T cold 2 / 1 / ε hot + 1 / ε cold 1
where hrad is the radiation heat transfer coefficient, W/(m2·K); Thot and Tcold represent the temperature of the hot surface and cold surface, respectively, K; σ is the Stefan–Boltzmann constant, 5.67 × 10⁻⁸ W/(m2·K4); εhot and εcold represent the hot surface and cold surface, respectively. The emissivity of SOFI (εSOFI) is taken as 0.8 [44], the emissivity of the radiation shield (εshield) is taken as 0.03 [45], and the emissivity of the inner surface of the shell (εshell_in) is taken as 0.44 [32].
qg_cond is calculated through Equations (6)–(9) [44]:
q g _ cond = h g T hot T cold
h g = C 1 P α
C 1 = γ + 1 / γ 1 R / 8 π M T hot T cold / 2 1 / 2
γ = c p / c v
where hg is the gas heat transfer coefficient, W/(m2·K); C1 is an empirical coefficient; P is the residual gas pressure, Pa; α is the accommodation coefficient, 0.9 (for air under room temperature); γ is the specific heat ratio, 1.4 [44]; R is the gas constant, 8.314 J/(mol·K); M is the molecular weight of the gas, g/mol; cp and cv represent the isobaric heat capacity and the isochoric heat capacity, respectively, J/(kg·K).
qs_cond is calculated through Equations (10)–(12) [46,47]:
q s _ cond = h s T hot T cold
h s = C 2 f k VDMLI / D x
k VDMLI = 0.017 + 7 × 10 6 × 800 T hot T cold / 2 + 0.0228 ln T hot T cold / 2
where hs is the solid heat transfer coefficient, W/(m2·K); C2 is an empirical coefficient, 0.008 (for Dacron net) [48]; f is the relative density of the spacer material and the solid material, 0.0087 [46]; kVDMLI is the thermal conductivity of the spacer material, W/(m·K) [47]; Dx is the spacing of the radiation shields, m.
For the heat transfer between the nodes a + b + 1 and a + b + 2, given that there is an absence of solid heat conduction [49], the heat transfer consists of two components, which can be calculated by Equation (13):
q VDMLI = q rad + q g _ cond

2.2.5. Heat Transfer from the External Environment

When the external environment is at ambient temperature and pressure, the heat transfer from the external environment is due to gas conduction, which can be calculated using Equations (6)–(9). Under fire conditions, the heat transfer from the external environment is composed of gas convective heat transfer and radiation, which can be calculated using Equations (14)–(16) [31,32]:
q fire = q f _ rad + q f _ conv
q f _ rad = σ T fire 4 T shell _ out 4 / 1 / ε fire + 1 / ε shell _ out 1
q f _ conv = h fire ( T fire T shell _ out )
where qfire is the heat transfer from the external environment under fire conditions, W/m2; qf_rad and qf_conv represent the heat flux of radiation and gas convective under fire conditions, respectively, W/m2; Tfire is the temperature of fire, K; Tshell_out is the temperature of the outer surface of the shell, K; εfire is the emissivity of fire, 1 [32]; εshell_out is the emissivity of the outer surface of the shell, 0.5 [31]; hfire is the fire convective heat transfer coefficient, 10 W/(m2·K) [31].

2.3. Calculation Procedure

Current approaches for solving the mentioned steady-state thermodynamic models often involve an initial assumption of the temperature distribution within the MLI. From this assumed temperature profile, the heat flux is determined. Subsequently, the new temperature field is computed using the derived heat flux, and this updated temperature field is then compared to the earlier temperature field. The calculation is considered to have converged when the change at every temperature node falls below the predefined error tolerance (typically 1 × 10⁻⁶ to 1 × 10⁻⁸). Conversely, if there are temperature nodes whose changes exceed the predefined error tolerance, the temperature value of each node is updated, and the calculation is iterated until the temperature change is lower than the specified error threshold while ensuring that the heat flux between each node remains equal.
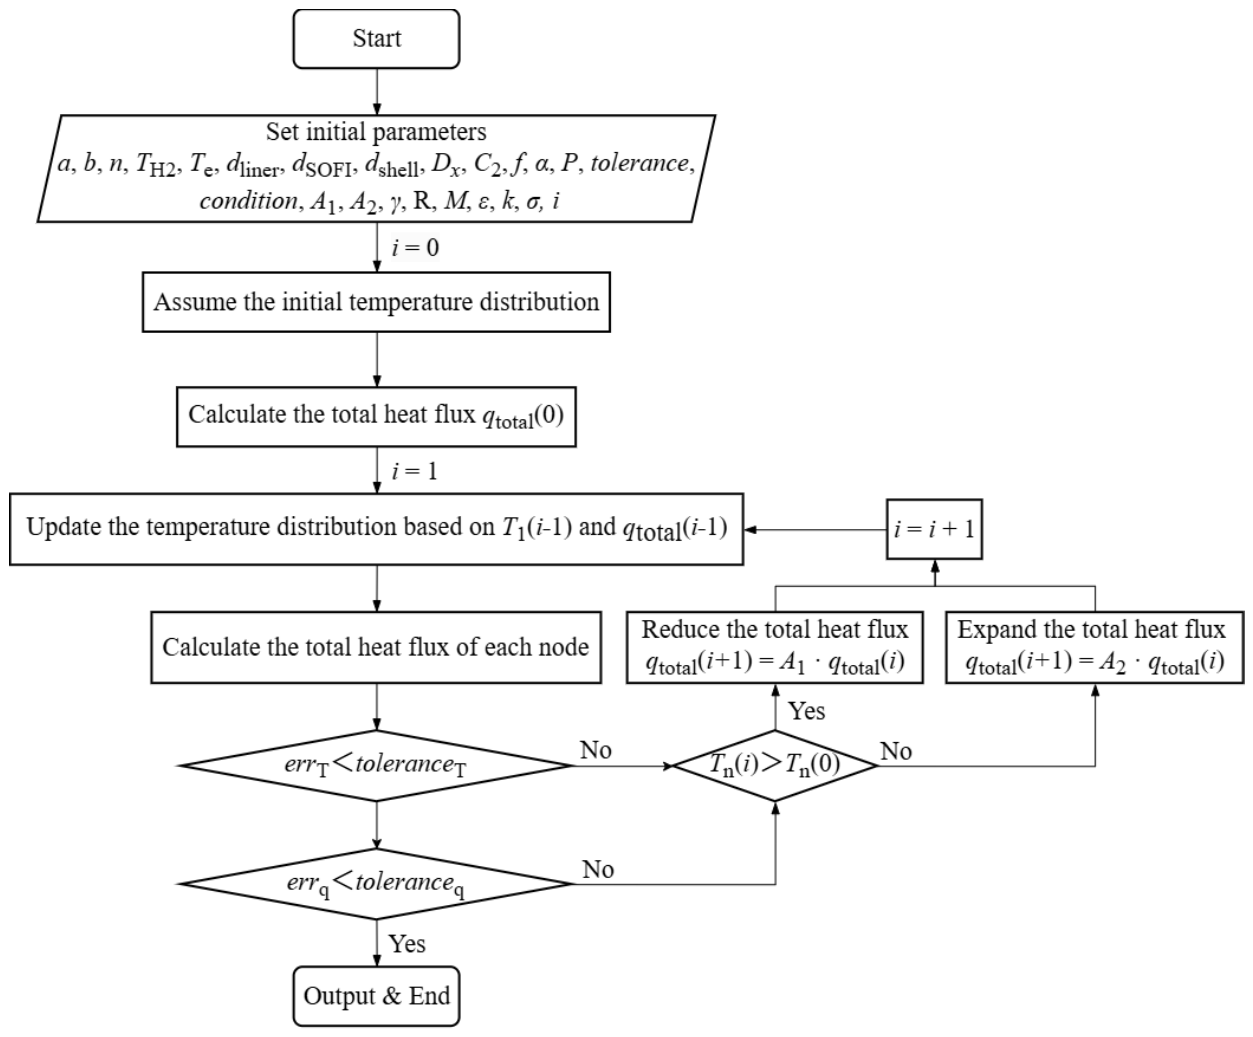
To reduce computational time costs, a novel and efficient solution method has been established by transforming the solving target and iteration rules, as illustrated in Figure 3. The rationale behind the proposed methodology shifts from assessing the temperature error at each calculation node to evaluating the temperature error solely at the final node. This approach reduces the complexity of the calculations and eliminates the need to solve systems of equations or utilize numerical methods such as the bisection method to update each temperature node. Adjustment coefficients A1 and A2 are defined to modulate the heat flux during each iterative calculation:
n = a + b + 4
q total i = T n i T 1 i / z = 1 n - 1 R z i
q total i + 1 = A 1 q total i T n i > T n 0 q total i + 1 = A 2 q total i T n i < T n 0 T 1 0 = T H 2 T n 0 = T e
where qtotal is the total heat flux, W/m2; i is the ith iteration; A1 is the reduction coefficient, which is adaptively adjusted to approximately 0.8–1.0 based on the iterative results; A2 is the expansion coefficient, which is adaptively adjusted to approximately 1.0–1.2 based on the iterative results; n is the total number of nodes; TH2 and Te represent the temperature of hydrogen and external environment, respectively, K; R is the thermal resistance, m2·K/W; z is the zth thermal resistance.
Using TH2 and Te as known boundary conditions to guide the iterative calculations can lead to a faster convergence to an exact solution without compromising the precision of the results. By directly updating the qtotal, the significant influence of the initial temperature field on the difficulty of the solution is mitigated. By adjusting the values of coefficients A1 and A2 appropriately, the speed at which the iterative calculations approach the exact solution can be controlled, allowing for the attainment of an exact solution with only a small number of iterations. In this study, all computational cases were completed within 5 s (Hardware: Intel Core i7-12700F CPU, 16GB DDR4 3200MHz RAM, 1TB SSD). In comparison, the point-by-point model we previously established required approximately 30 s for the same calculations [50], and both methods yielded consistent results.
In this calculation procedure, two errors are introduced to determine whether the iteration converges:
e r r T = T n i T e
e r r q = max   z = 1 n 1 q z i min   z = 1 n 1 q z i
where errT is the temperature error at the final node, K; errq is the heat flux error, W/m2.

3. Results and Discussion

3.1. Conditions and Model Validation

3.1.1. Basic Conditions and Parameters

Regarding the fire resistance testing standards for liquid hydrogen tanks—such as UN GTR No. 13-PH2 [51], ISO 13985-2006 [52], and ISO 11119-2020 [53]—the minimum average temperature for the thermal autonomy test of land vehicle fuel tanks is specified as 863.15 K. However, the detailed temperature–time profile during the fire test is not explicitly defined. Standards for analogous fire tests on high-pressure hydrogen cylinders typically prescribe a two-stage procedure: an initial short-duration (e.g., 10-min) localized fire exposure, followed by a transition to a fully engulfing fire test. Since the fire temperature is stable, and the tank remains in the most critical condition, the tank under the engulfing fire test was selected in this investigation. For comparison, 298.15 K was selected as the ambient temperature. The specific baseline conditions and parameters are detailed in Table 1.

3.1.2. Model Validation

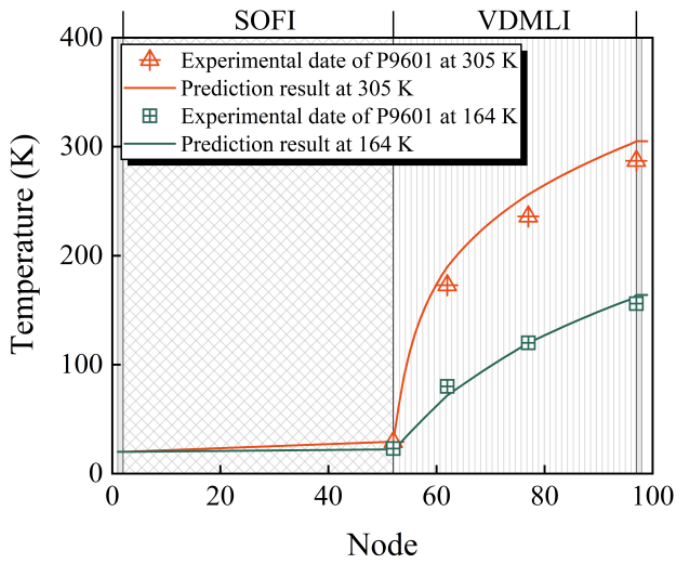
The computational model was validated against the experimental data (Test P9601) from the LH2 tank tests conducted by Martin et al. at NASA [45], in which the insulation structure comprised 3.53 cm of foam and 45 layers of VDMLI. The detailed parameters are provided in Table 1. The comparison of the temperature between the computational model and the experimental data is shown in Figure 4. Under a warm boundary temperature of 305 K, the computational model predicted the temperature distribution with an average error of 6.4%. At a warm boundary temperature of 164 K, the corresponding average error was 5.0%. For warm boundary temperatures of 305 K and 164 K, the heat fluxes were 0.25 W/m2 and 0.086 W/m2, respectively, with corresponding errors of −9.20% and −5.58%.
Since the kSOFI is known to be 0.000866 W/(m·K), the temperature calculations within this layer were relatively accurate. For a warm boundary temperature of 305 K, the experimental value at node 52 was 29.0 K, while the computed value was 29.30 K, yielding a deviation of only 1.03%. However, the kVDMLI was not provided in the test, which introduced discrepancies between the value used in the computational model and the actual experimental value. Under the condition of a 305 K warm boundary, the most significant difference between the calculated temperatures and the experimental data occurred at node 62, with a difference of 16.66 K corresponding to a relative error of 9.63%. Overall, the trends observed in the test results aligned well with those predicted by the computational model, and the deviations remained within an acceptable range.

3.2. Thermodynamic Analysis of the Insulation Structure Under Fire Scenarios

3.2.1. Temperature Distribution

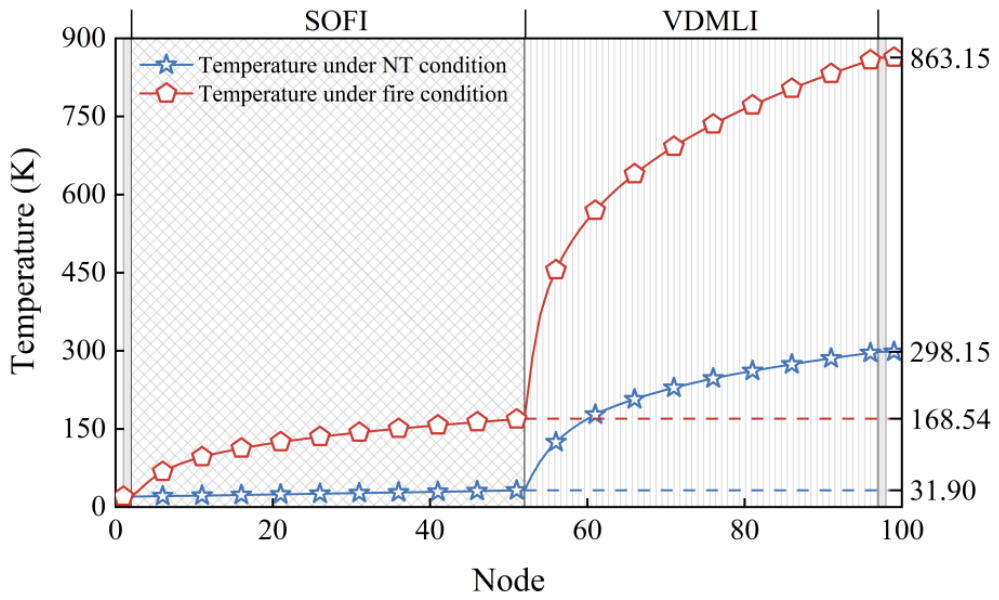
Figure 5 presents the temperature profile under the NT and fire conditions, with more detailed data listed in Table 2.
In the VDMLI section, the temperature rapidly decreases, showing reductions of 80.35% and 89.55% under fire and NT conditions, respectively. During the fire condition, the temperature within the SOFI also exhibits a rapid decline, decreasing by 88.21%. Conversely, under the NT condition, the temperature in the SOFI decreases at a slower rate, with a reduction of 37.81%. The average temperature within the SOFI layer is only 25.91 K, and the average temperature in the VDMLI increases to 223.50 K. Overall, the average temperature of SOFI is closer to TH2, while the average temperature of VDMLI is closer to Te. Within the VDMLI, both the high-density and medium-density sections maintain relatively high average temperatures. However, there is a notable distinction between the average temperatures of the medium-density and low-density sections. Under the fire condition, the average temperature in the low-density section rapidly drops from 672.56 K to 99.95 K.

3.2.2. Heat Flux in the VDMLI

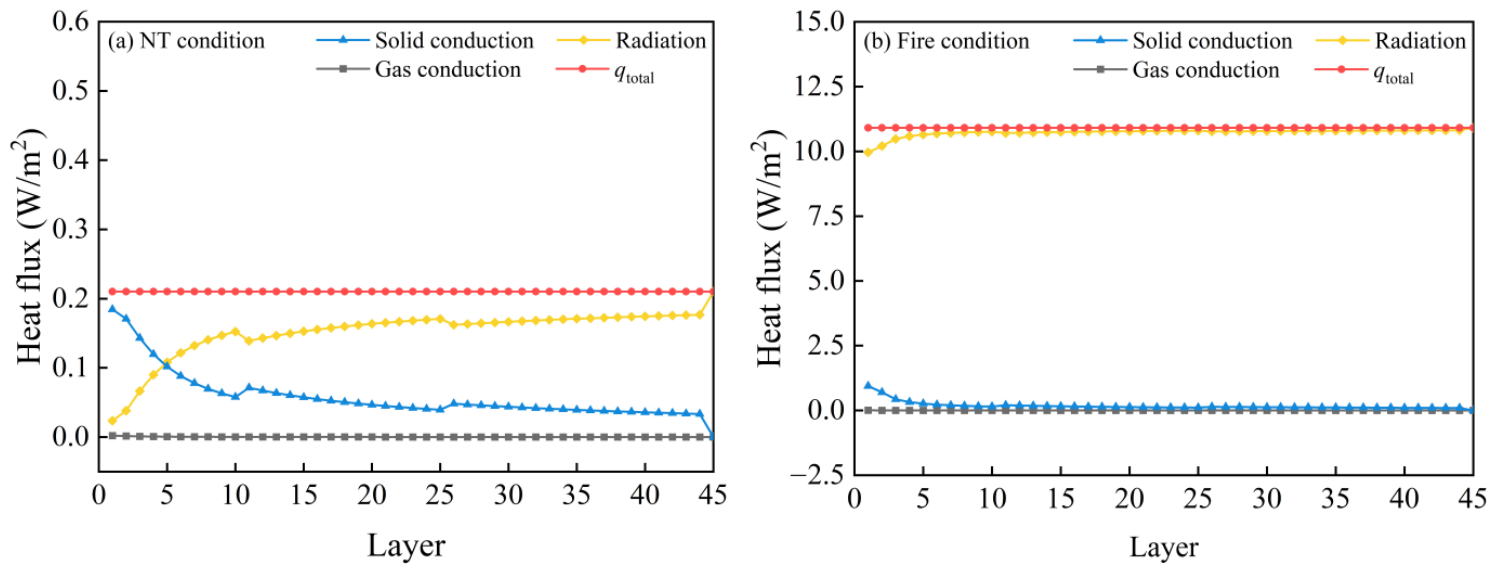
Figure 6a illustrates the qtotal through the VDMLI under the NT condition, as well as the contributions from solid conduction, gas conduction, and radiation. In this scenario, the qtotal is 0.21 W/m2. Within the VDMLI region adjacent to the LH2 side, the heat transfer is predominantly conducted through solid conduction, which constitutes the majority of the qtotal. As one moves toward the external environment, the proportion of solid conduction gradually decreases, while radiation becomes the dominant mode of thermal energy transfer. The contribution of residual gas conduction across each layer is relatively minor, exerting a negligible impact on the qtotal. Figure 6b presents the heat flux in the VDMLI under the fire condition, where the qtotal is significantly higher, reaching 10.91 W/m2. Under this condition, radiation rapidly assumes a dominant role in heat transfer, while the contributions from solid conduction and gas conduction are comparatively minimal.

3.3. The Influence of Parameters in the Insulation Structure

3.3.1. Parameters in the SOFI

When only the SOFI thickness (dSOFI) is varied, the qtotal under NT and fire conditions is presented in Table 3. Under the same fire condition, even when the dSOFI is increased from 0.025 m to 0.1 m, the resulting thermal insulation effect is quite limited. The qtotal only decreases from 10.9174 W/m2 to 10.8601 W/m2, representing a reduction of only 0.52% (1.80% under NT condition). This limited decrease can be attributed to two main factors: Firstly, with the increase in Te, radiation becomes the overwhelmingly dominant mode of heat transfer. Secondly, the dSOFI is constrained by design requirements, such as the size of the LH2 tank, and economic considerations, which limit the extent to which it can be increased. Similar to the effects of dSOFI, changes in the kSOFI and εSOFI also have relatively limited impacts.

3.3.2. Parameters in the VDMLI

Compared to the parameters in SOFI, the influence of parameters in VDMLI is more diverse. As shown in Table 4, under the NT condition, reducing the density of low-density layers and increasing the density of high-density layers can enhance the thermal insulation effect to a certain extent. When the layer density of low-density layers is decreased to 6.4 layers/cm, and the layer density of high-density layers is increased to 17.6 layers/cm, the qtotal decreases from 0.2178 W/m2 to 0.2064 W/m2, representing a 5.23% reduction. However, under the fire condition, the effect of different layer density distributions is significantly diminished, resulting in a decrease of only 0.29%.
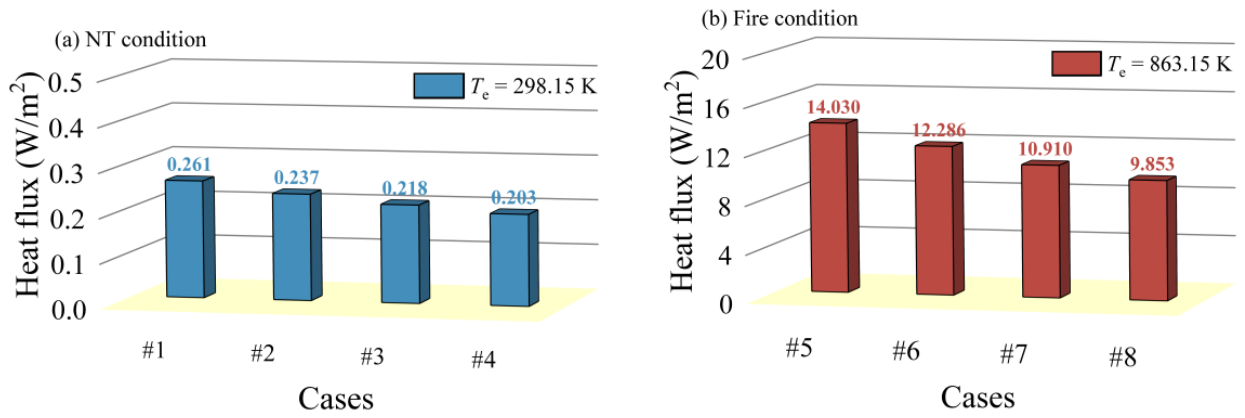
Interestingly, without considering variable-density distribution and maintaining a constant dVDMLI, merely adding more insulation layers can significantly enhance the effectiveness of the insulating system, and this effect is even more pronounced under the fire condition. The basic conditions for the 8 cases with uniform layer densities are presented in Table 5, and the calculated qtotal are depicted in Figure 7. Under the same NT condition, when the number of MLI layers is increased from 35 to 50, qtotal changes from 0.241 W/m2 to 0.189 W/m2, representing a 21.58% reduction. Similarly, under the same fire condition, qtotal decreases from 14.030 W/m2 to 9.853 W/m2 as the number of MLI layers increases, representing a 29.77% reduction.
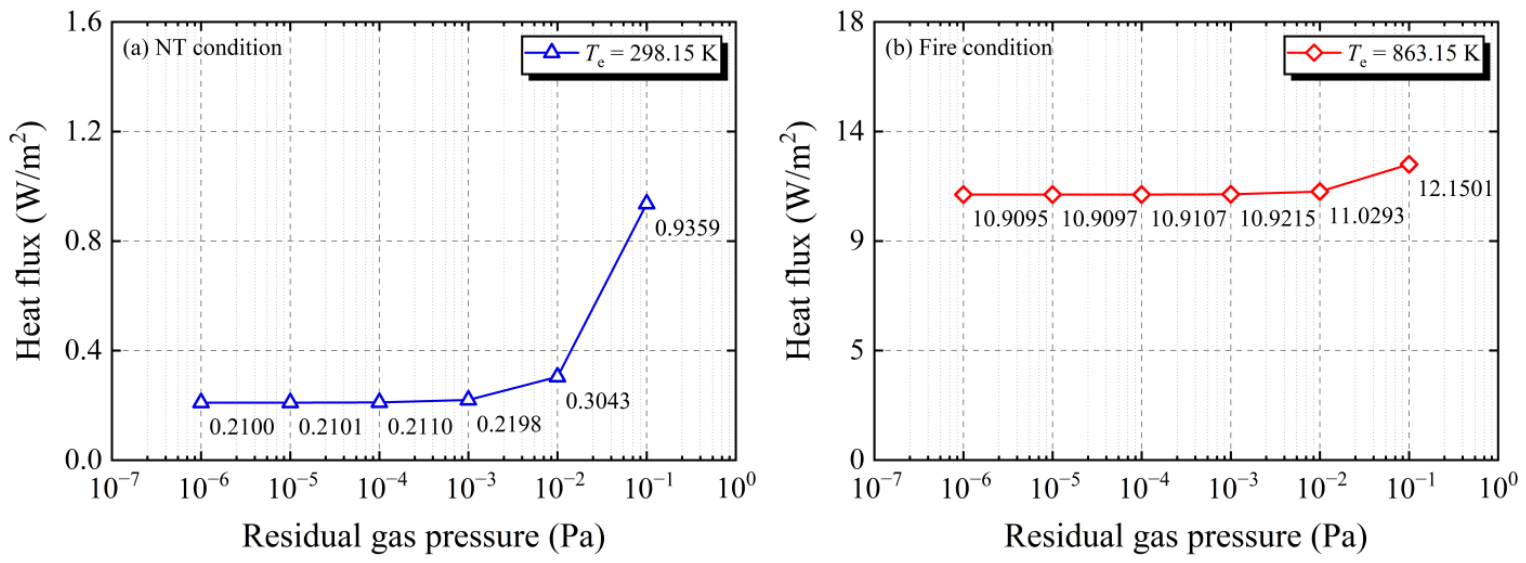
The heat flux at different residual gas pressures (Pg) under NT and fire conditions is illustrated in Figure 8. Due to the relatively minor contribution of gas conduction in VDMLI, it can be anticipated that when the Pg is kept low, an increase in that pressure will only result in slight changes to the qtotal. Under the NT condition, the Pg only begins to have a significant impact on the qtotal after it increases to 0.001 Pa. In contrast, under the fire condition, this effect remains minimal until the Pg reaches 0.01 Pa.

3.4. The Influence of TH2 and Te

As external heat continuously penetrates, the TH2 may increase. Based on the research data from Nubli et al. [33], the TH2 in the LH2 tank may reach approximately 80 K after 3600 s of fire exposure. Therefore, the qtotal was investigated across a TH2 range of 20 K to 80 K, as presented in Table 6. Under the NT condition, as TH2 increases from 20 K to 80 K, the qtotal decreases by 4.18% (0.0088 W/m2). This reduction is attributed to the fact that at lower Te, an increase in TH2 can partially reduce radiative heat transfer and the temperature difference between layers. In the presence of both gas and liquid phases within the LH2 tank, the gas phase exhibits a relatively higher temperature, while the liquid phase remains at a lower temperature, leading to different qtotal values at different positions due to the variation in TH2. The combined effects of pressure, buoyancy, and other factors contribute to the occurrence of thermal stratification. Under the fire condition, where Te is significantly higher than TH2, fluctuations in TH2 are negligible compared to those of Te.
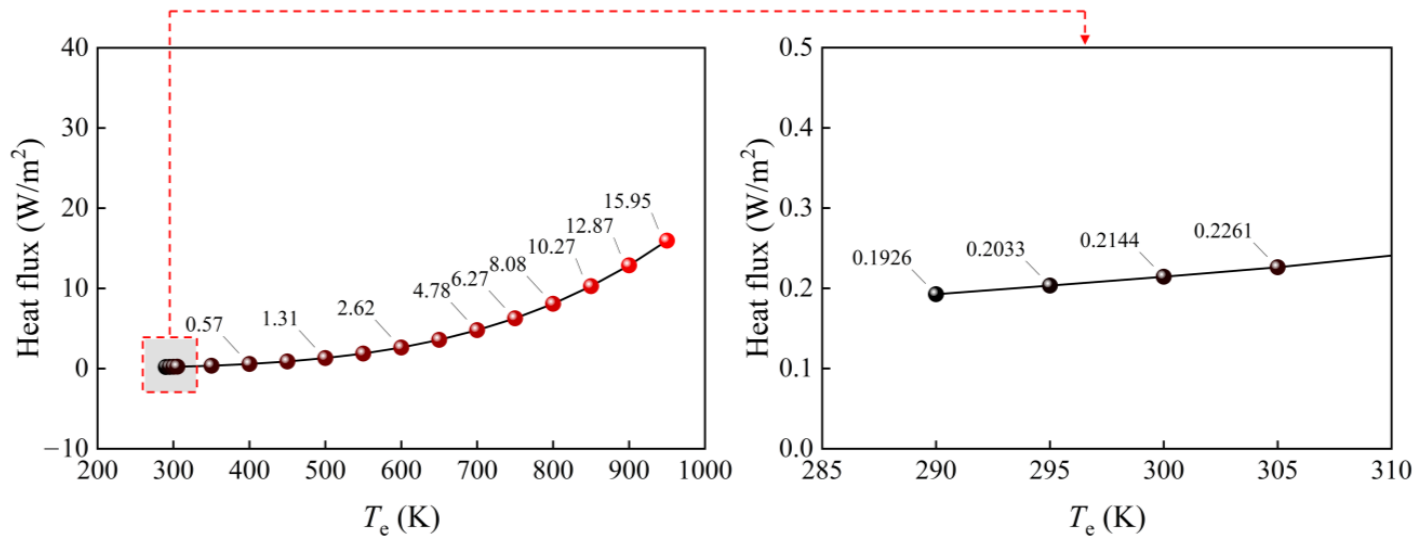
The variation of qtotal with Te is shown in Figure 9. As Te increases, its effect on qtotal becomes progressively more significant, with the data following a distinct monotonic upward trend. The rate of increase in qtotal itself grows with rising Te. This exponential growth in qtotal can be explained by the predominance of radiative heat transfer under high-temperature fire conditions. As expressed in Equations (4) and (5), the radiative heat flux depends on the difference between the fourth power of the Thot and that of the Tcold. As Te rises, the Thot4 term increases dramatically, resulting in a nonlinear and rapidly accelerating growth in qtotal. This accounts for the substantially larger incremental change in qtotal between 800 K and 900 K (4.79 W/m2) compared to that between 300 K and 400 K (0.36 W/m2). The observed trend is a direct physical manifestation of the fourth-power temperature dependence that governs radiative heat transfer under large temperature differences.

3.5. Case Study: A Vehicle Liquid Hydrogen Storage Tank

In the fire scenario of the 120 L LH2 tank studied by Camplese et al. [32], the “dumping factor for standard fire curve correlation (Ψf)” was adopted to characterize the fire intensity. When the Ψf is set to 0.5, the corresponding fire temperature is approximately 833 K, which is close to the fire temperature assumed in the present study (863.15 K). Furthermore, the fire curve stabilizes within a relatively short period. This trend is consistent with the fire temperature variation measured by Sun et al. [2] and Ma et al. [29] in their experiments, thereby supporting the reasonableness of adopting a steady-state simplification for the fire scenario in this work. As analyzed in Section 3.4, under fire conditions where the Te is significantly higher than the TH2, fluctuations in TH2 have a negligible influence on the qtotal compared to variations in Te. Consequently, although the established model is steady-state in nature, it can reliably estimate the heat transfer through the insulation structure when Te remains stable. Based on this rationale, in the case study presented in Section 3.5, the heat leakage from the insulation structure is justifiably treated as a constant input.
However, in actual fire scenarios, the total heat leakage of the LH2 tank includes not only heat transfer through the insulation structure but also heat leakage through the support structures and accessory pipelines. Based on the geometric parameters of the 500 L LH2 tank developed by Ma et al. [54,55] for vehicle applications, and in conjunction with the insulation structure described in Section 3.1.1, heat leakage through the support structures and auxiliary piping was accounted for as a supplement. This modified model was then used to analyze the dynamic changes in internal pressure and temperature of the LH2 tank. The basic physical parameters are listed in Table 7.
According to the assessment of heat loss from the insulation system, the heat leakage from support structures and accessory pipelines was considered. The total heat leakage:
Q total = Q i + Q s + Q p
where Qtotal is the total heat leakage, W; Qi, Qs, and Qp represent the heat leakage from the insulation structure, support structures, and accessory pipelines, respectively, W.
Qi can be calculated by Equation (23):
Q i = A i q total
where Ai is the surface area of the insulation structure, m2.
Qs can be calculated by Equations (24) and (25) [54,55]:
Q s = n s k s A s T e T H 2 / L s
A s = π D o 2 D i 2 / 4
where ns is the number of support structures; ks is the thermal conductivity of the support structure, W/(m·K); As is the cross-sectional area of the support structure, m2; Ls is the length of the support structure, m; Do and Di represent outer diameter and inner diameter of the support structure, respectively, m.
Qp can be calculated by Equation (26) [54,55]:
Q p = k p A p T e T H 2 / L p
where kp is the thermal conductivity of the accessory pipeline, W/(m·K); Ap is the cross-sectional area of the accessory pipeline, m2; Lp is the length of the accessory pipeline, m.
Heat leakage under different external conditions is shown in Table 8. Under the NT condition, the Qtotal is 8.5069 W, primarily originating from the support structures and accessory pipelines. Among these, Qi is 0.7602 W, accounting for the smallest proportion. Qs is 6.2046 W, representing the largest proportion. Under the fire condition, the Qtotal increases to 62.9764 W. At this time, due to the significant rise in Te, Qi accounts for 63% and becomes the primary source of heat leakage, amounting to 39.4942 W. The heat loss from the support structures is 18.8077 W, while the accessory pipelines exhibit a leakage of 4.6745 W.
BoilFAST is an integrated suite for implementing a validated multi-zone thermodynamic model, which was developed and extensively benchmarked by Al Ghafri et al. [12]. It can predict variations in tank pressure and temperature under various conditions, encompassing different heat loads, filling ratios (η), and tank geometries. This specialized thermodynamic modeling tool has been extensively utilized by researchers [56,57,58,59]. Its accuracy has been validated through experiments and LH2 data across various scenarios [59,60,61]. Consequently, BoilFAST v1.1.2 [62] was employed to calculate the thermodynamic evolution within the 500 L LH2 tank, using the Qtotal as the primary input parameter. The fluid components consisted of 0.21% ortho-hydrogen and 99.79% para-hydrogen [63]. The tank was modeled as a horizontal cylinder with ellipsoidal end caps, with an inner diameter of 0.65 m and a head height of 0.163 m. A uniform heat flux into the entire tank volume was applied as the thermal boundary condition. The calculation was conducted for a duration of 900 s with a timestep of 1 s.
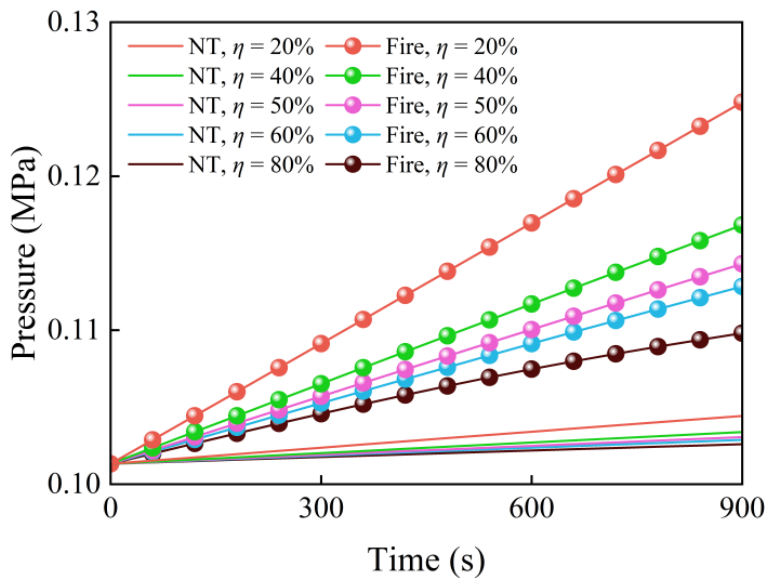
As the LH2 tank continuously absorbs heat from the environment, the temperature inside the tank rises, causing the LH2 to undergo a phase change from liquid to gas. As the temperature increases, the LH2 evaporates and the gas expands, resulting in a rise in pressure. As illustrated in Figure 10, the pressure variations inside the tank were calculated under heat leakage conditions of 8.5069 W and 62.9764 W for different η. Under the fire condition, when η increases from 20% to 80%, the pressure decreases from 0.1248 MPa to 0.1098 MPa at 900 s. In the NT condition, the maximum pressurization is 3.11 kPa (at η = 20%). At the same η, the pressure inside the LH2 tank exhibits a linear increase over time. A higher η corresponds to a greater mass of LH2, which requires more heat to undergo a phase change, thereby slowing down the pressurization process. This observed trend is consistent with the findings reported by Lv et al. [63].
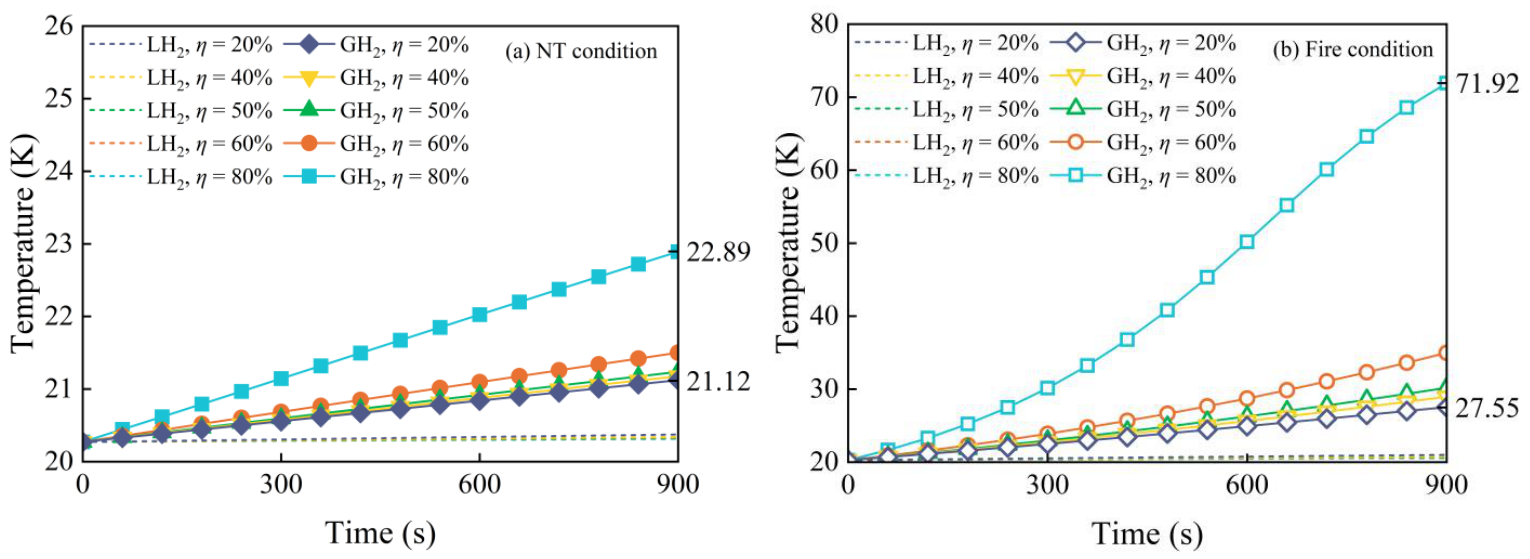
Figure 11a illustrates the temperature evolution of LH2 and GH2 under the NT condition. Over time, the GH2 temperature exhibits a linear increase, reaching a final range between 21.12 K and 22.89 K, while the LH2 temperature remains relatively stable. Contrary to the pressure trend, a higher η corresponds to a higher GH2 temperature. Figure 11b presents the temperature variations under the fire condition. The significant increase in Qtotal leads to a rapid heat influx into the LH2 tank, resulting in a faster temperature rise in the GH2 compared to the NT condition. Despite this accelerated increase, the GH2 temperature remains below 80 K throughout the process, with a maximum value of 71.92 K. These results confirm that the heat leakage from support structures and accessory pipelines significantly influences the thermodynamic performance of the LH2 tank under fire and NT conditions. While the thermodynamic performance of the insulation structure can be analyzed in terms of general trends even without accounting for the parasitic heat load, its inclusion is essential for realistically simulating the thermodynamic performance of the LH2 tank in practical applications, particularly under fire conditions.

3.6. Limitations and Future Work

The analysis presented in this study is based on a one-dimensional steady-state heat transfer model and its corresponding assumptions. By comparing with NASA’s published experimental data, the model demonstrates reasonable accuracy in predicting the heat flux and temperature distribution of the insulation structure, providing an available tool for subsequent studies. However, due to simplifications in the modeling approach and boundary condition settings, this work has the following limitations. First, although the one-dimensional model can efficiently analyze the heat transfer along the insulation thickness, it cannot capture local thermal bridging effects or complex stress states that may arise from the three-dimensional geometry of actual LH2 tanks. Second, the fire scenario is idealized as a stable, uniform, and fully engulfing thermal boundary (Te = 863.15 K). Although this aligns with the standard testing condition, it deviates from the transient, localized, and non-uniform nature of real vehicle fires, which may affect the assessment of dynamic pressure response and fire resistance performance. Third, certain material parameters in the model entail uncertainties under extreme conditions. Moreover, the conclusions are primarily derived from numerical simulations, and, despite validation against existing experimental data, their extrapolation to different operating conditions and tank configurations requires further experimental verification. These factors collectively define the scope of applicability of the present study. The findings remain valid under the stated conditions, but any extension to other scenarios should be carefully evaluated within specific application contexts.
To address the aforementioned limitations, future research could be extended along the following directions. First, a high-fidelity three-dimensional thermal–fluid–structural coupling model could be developed to enable more accurate simulation of local thermal bridging effects, thermal stress distribution, and potential structural failure mechanisms. Second, experimental validation covering critical scenarios such as localized fires and transient thermal shocks would be valuable. A key objective of such validation should be to determine the material performance and thermophysical properties of LH2 tanks under extreme conditions. Furthermore, a systematic investigation into a broader range of parameters could be conducted, including realistically possible dynamic leakage processes and transient thermal loads that conform to standard time–temperature curves. Such efforts would contribute to the gradual development of a more universally applicable safety assessment methodology.
On the engineering practice front, given that the findings of this study indicate a significant increase in the proportion of radiative heat transfer within the leakage mechanism under fire conditions, the focus of insulation structure design could therefore be extended from solely optimizing thermal insulation performance under NT conditions to also ensuring the thermal stability and low emissivity of relevant materials (particularly the radiation shields in MLI) under fire conditions. More specifically, increasing the total number of MLI layers is a more effective strategy for enhancing insulation performance under fire conditions compared to adjusting SOFI parameters or variable-density distributions. Priority could be given to maximizing the layer count within spatial and economic constraints. In terms of safety analysis, for assessments about fire scenarios, it is necessary to enhance the predictive capability for the dynamic pressure response inside the tank under transient thermal shocks (e.g., the time required for the pressure to rise to the safety valve set point), while accounting for the influence of different filling ratios. Furthermore, the case study reveals that heat leakage from support structures and auxiliary pipelines constitutes a significant portion of the total heat leakage. Therefore, a component of the total heat leakage should be given due consideration in the analysis rather than focusing solely on heat transfer through the MLI.

4. Conclusions

The thermodynamic analysis of the insulation structure shows differing temperature reduction characteristics under fire and NT conditions. In the VDMLI section, the temperature decreases by 80.35% under the fire condition and by 89.55% under the NT condition. Within the SOFI, the temperature declines by 88.21% and 37.81% under fire and NT conditions, respectively.
Under the fire condition, the influence of the dSOFI and the VDMLI layer density distribution on the qtotal is limited. In contrast, increasing the total number of MLI layers significantly enhances insulation performance, reducing the qtotal by 29.77% under the fire condition and by 21.58% under the NT condition. When the Pg is maintained at a low level, its variation has a minimal impact on the qtotal.
The analysis of the influence of environmental factors reveals that changes in the TH2 have a relatively weak impact on radiative heat transfer, resulting in only minimal variation in the qtotal under the fire condition. In contrast, as the Te continuously increases, its influence on the qtotal becomes increasingly pronounced and exhibits a clear monotonically increasing trend.
Under the NT condition, the Qtotal of the 500 L vehicle LH2 tank is 8.5069 W, primarily originating from the support structures (Qs, 73%) and accessory pipelines (Qp, 18%), while the contribution from the insulation structure (Qi, 9%) is minimal. Under the fire condition, the Qtotal increases significantly to 62.9764 W, with heat leakage through the insulation structure becoming the main source, accounting for 63% (39.4942 W). The pressurization rate inside the tank is influenced by the η, with a higher η slowing down the pressure increase over time.


Author Contributions

Conceptualization, H.L., L.X., G.Z. and B.D.; methodology, H.L., H.Y., Q.X. and S.Q.; validation, H.Y. and K.H.; investigation, H.L., S.Q., G.Z., B.D. and H.Y.; writing—original draft preparation, H.L.; writing—review and editing, G.C., H.Y. and Q.X.; supervision, G.C. and L.X.; project administration, G.C.; funding acquisition, G.C. All authors have read and agreed to the published version of the manuscript.

Funding

This research was funded by the Guangdong Basic and Applied Basic Research Foundation, grant numbers 2023B1515120024 and 2024A1515011123.

Data Availability Statement

The original contributions presented in this study are included in the article. Further inquiries can be directed to the corresponding author.

Conflicts of Interest

The authors declare no conflicts of interest.

Abbreviations

The following abbreviations are used in this manuscript:
GH2gaseous hydrogen
HFCVshydrogen fuel cell vehicles
HGMshollow glass microspheres
LH2liquid hydrogen
MLImultilayer insulation
NTnormal temperature
SOFIspray-on foam insulation
VDMLIvariable-density multilayer insulation

References

  1. He, Y.; Yang, Z.; Ye, J.; Ji, R.; Liu, J.; Chen, H. Thermodynamic performance investigation of liquid hydrogen storage tanks considering the heat leakage redistribution effect of the wall. J. Energy Storage 2026, 153, 120910. [Google Scholar] [CrossRef]
  2. Sun, Y.; Li, Y.; Dong, Z.; Zheng, G.; Cheng, J.; Zhang, Z.; Bai, Q.; Gao, W. Study on the explosion behavior of liquid hydrogen storage tank in fire scenarios. J. Energy Storage 2026, 155, 121420. [Google Scholar] [CrossRef]
  3. Mirshekarzadeh, T.; Akbari, S.; Sharifian, M.; Mirshekarzadeh, A.; Salehi, F.; Bijarchi, M.A. Physical solutions for hydrogen storage: Technological challenges, safety assessments, and environmental aspects. Renew. Sustain. Energy Rev. 2026, 230, 116627. [Google Scholar] [CrossRef]
  4. Andújar, J.M.; Segura, F.; Rey, J.; Vivas, F.J. Batteries and hydrogen storage: Technical analysis and commercial revision to select the best option. Energies 2022, 15, 6196. [Google Scholar] [CrossRef]
  5. Mitra, A.; Gnanavendan, S.; Ghosh, A.; Shahi, A.; Sharma, V.K.; Thomas, S.B.; Thomas, B. From source to storage: An extensive review of hydrogen production, purification and storage for modern energy applications. Renew. Sustain. Energy Rev. 2026, 231, 116755. [Google Scholar] [CrossRef]
  6. Li, X.; Wei, Q.; Yu, L.; Zhang, X.; Zou, Y.; Zhu, Y.; Peng, Y.; Wang, D.; Zhu, Z.; Chen, X.; et al. Numerical Study of Liquid Hydrogen Internal Flow in Liquid Hydrogen Storage Tank. Energies 2025, 18, 5592. [Google Scholar] [CrossRef]
  7. Durbin, D.J.; Malardier-Jugroot, C. Review of hydrogen storage techniques for on board vehicle applications. Int. J. Hydrogen Energy 2013, 38, 14595–14617. [Google Scholar] [CrossRef]
  8. Tang, X.; Yang, M.; Shi, L.; Hou, Z.; Xu, S.; Sun, C. Adaptive state-of-health temperature sensitivity characteristics for durability improvement of PEM fuel cells. Chem. Eng. J. 2024, 491, 151951. [Google Scholar] [CrossRef]
  9. Zhao, Y.X.; Gong, M.Q.; Zhou, Y.; Dong, X.Q.; Shen, J. Thermodynamics analysis of hydrogen storage based on compressed gaseous hydrogen, liquid hydrogen and cryo-compressed hydrogen. Int. J. Hydrogen Energy 2019, 44, 16833–16840. [Google Scholar] [CrossRef]
  10. He, Y.; Ji, R.; Ye, J.; Liu, T.; Yang, Z. Non-equilibrium thermodynamic modeling and analysis of the self-pressurization mechanism in spherical liquid hydrogen storage tanks. Appl. Therm. Eng. 2026, 285, 129167. [Google Scholar] [CrossRef]
  11. Wang, Y.; Pu, L.; Leng, Y.; Wang, X.; Yu, Z. Performance research and optimization of hollow glass microsphere insulation system for large liquid hydrogen sphere. Int. J. Hydrogen Energy 2025, 111, 555–565. [Google Scholar] [CrossRef]
  12. Al Ghafri, S.Z.S.; Swanger, A.; Jusko, V.; Siahvashi, A.; Perez, F.; Johns, M.L.; May, E.F. Modelling of liquid hydrogen boil-off. Energies 2022, 15, 1149. [Google Scholar] [CrossRef]
  13. Wang, B.; Wang, H.; Gao, Y.; Yu, J.; He, Y.; Xiong, Z.; Lu, H.; Pan, Q.; Gan, Z. Theoretical analysis of entropy generation in multilayer insulations: A case study of performance optimization of variable density multilayer insulations for liquid hydrogen storage systems. Int. J. Hydrogen Energy 2024, 85, 175–190. [Google Scholar] [CrossRef]
  14. Liu, Z.; Li, Y.; Zhou, G. Insulation performance of foam during the terrestrial and ascent period. Appl. Therm. Eng. 2018, 145, 364–374. [Google Scholar] [CrossRef]
  15. Huang, Y.; Wang, B.; Zhou, S.; Wu, J.; Lei, G.; Li, P.; Sun, P. Modeling and experimental study on combination of foam and variable density multilayer insulation for cryogen storage. Energy 2017, 123, 487–498. [Google Scholar] [CrossRef]
  16. Johnson, W.L.; Demko, J.A.; Fesmire, J.E.; Weisend, J.G. Analysis and testing of multilayer and aerogel insulation configurations. AIP Conf. Proc. 2010, 1218, 780–787. [Google Scholar] [CrossRef]
  17. Li, J.; Fan, F.; Xu, J.; Li, H.; Mei, J.; Fei, T.; Sun, C.; Jiang, J.; Xue, R.; Yang, W.; et al. Advances in Thermal Management for Liquid Hydrogen Storage: The Lunar Perspective. Energies 2025, 18, 2220. [Google Scholar] [CrossRef]
  18. Wang, B.; Huang, Y.H.; Li, P.; Sun, P.J.; Chen, Z.C.; Wu, J.Y. Optimization of variable density multilayer insulation for cryogenic application and experimental validation. Cryogenics 2016, 80, 154–163. [Google Scholar] [CrossRef]
  19. Wang, P.; Ji, L.; Yuan, J.; An, Z.; Yan, K.; Zhang, J. The influence of inner material with different average thermal conductivity on the performance of whole insulation system for liquid hydrogen on orbit storage. Int. J. Hydrogen Energy 2021, 46, 10913–10923. [Google Scholar] [CrossRef]
  20. Singh, D.; Singh, M.K.; Chaubey, A.; Ganguly, A.K.; Singh, V. Thermal performance improvement of multilayer insulation technique. Heat Mass Transf. 2023, 59, 1365–1378. [Google Scholar] [CrossRef]
  21. Qu, Z.; Cai, Z.; Ma, Z.; Zhang, X.; Shu, Z.; Liang, W.; Cai, L. Co-simulation of thermal behavior in liquid hydrogen tanks under vacuum degradation. Energy 2025, 329, 136841. [Google Scholar] [CrossRef]
  22. Ye, W.; Song, Q.; Hu, L.; Wang, X.; Liu, Y. Impact of inner material thickness and outer spacer material configuration on insulation performance in liquid hydrogen storage tanks. Appl. Therm. Eng. 2025, 278, 127421. [Google Scholar] [CrossRef]
  23. Li, J.; Fan, F.; Li, H.; Fei, T.; Sun, C.; Jiang, J.; Yang, W.; Song, K. Performance analysis of hydrogen storage insulation system in lunar base. In Proceedings of the 2024 International Conference of Electrical, Electronic and Networked Energy Systems; Springer Nature: Singapore, 2025. [Google Scholar] [CrossRef]
  24. Tang, Q.; Li, Y.; Sun, Y.; Gao, W. Study on the explosion behavior of hydrogen storage tank in fire scenarios. Energy 2026, 344, 140085. [Google Scholar] [CrossRef]
  25. Hübert, T.; Boon-Brett, L.; Black, G.; Banach, U. Hydrogen sensors—A review. Sens. Actuators B Chem. 2011, 157, 329–352. [Google Scholar] [CrossRef]
  26. Ma, X.; Li, B.; Han, B.; Sun, D.; Dai, X.; Song, C.; Bai, J. Burst failure prediction and validation methodology for type III hydrogen tanks in fire scenarios. Fuel 2026, 410, 137876. [Google Scholar] [CrossRef]
  27. Li, Z.; Pan, X.; Meng, X.; Ma, J. Study on the harm effects of releases from liquid hydrogen tank by consequence modeling. Int. J. Hydrogen Energy 2012, 37, 17624–17629. [Google Scholar] [CrossRef]
  28. Cirrone, D.; Makarov, D.; Molkov, V. Rethinking “BLEVE explosion” after liquid hydrogen storage tank rupture in a fire. Int. J. Hydrogen Energy 2023, 48, 8716–8730. [Google Scholar] [CrossRef]
  29. Ma, X.; Li, B.; Han, B.; Jin, X.; Liu, Y.; Bi, M.-S.; Shu, C.-M. Thermodynamic analysis of high-pressure hydrogen storage tank discharge in fire scenarios: Experimental and theoretical modelling. Int. J. Hydrogen Energy 2025, 114, 355–367. [Google Scholar] [CrossRef]
  30. Chen, H.; Chen, G.; Xiong, C.; Wu, Y.; Li, X.; Gao, X. An inherent safety assessment tool for storage tank farm layout planning based on dynamic propagation modeling simulation of fire domino effects. Reliab. Eng. Syst. Saf. 2025, 256, 110797. [Google Scholar] [CrossRef]
  31. Camplese, D.; Scarponi, G.E.; Chianese, C.; Hajhariri, A.; Eberwein, R.; Otremba, F.; Cozzani, V. Modeling the performance of multilayer insulation in cryogenic tanks undergoing external fire scenarios. Process Saf. Environ. Prot. 2024, 186, 1169–1182. [Google Scholar] [CrossRef]
  32. Camplese, D.; Scarponi, G.E.; Eberwein, R.; Hajhariri, A.; Otremba, F.; Cozzani, V. Comparative performance assessment of multilayer insulation (MLI) systems for liquid hydrogen vessels in fire scenarios. Int. J. Hydrogen Energy 2025, 135, 537–552. [Google Scholar] [CrossRef]
  33. Nubli, H.; Wen, J.X. Pressure build-up in a liquid hydrogen storage tank when subject to fire attack—A numerical study with validation. Int. J. Hydrogen Energy 2025, 193, 152373. [Google Scholar] [CrossRef]
  34. Xin, Q.; Wang, J.; Mei, J.; Li, Z.; Tolj, I.; Korpebayev, D.; Bai, X.; Sun, C. Comprehensive performance analysis and optimization of the closed Brayton cycle for waste heat recovery and cooling in hydrogen aeroengines. Energy 2026, 349, 140647. [Google Scholar] [CrossRef]
  35. Lv, H.; Chen, L.; Zhang, Z.; Chen, S.; Hou, Y. A review of liquid hydrogen storage and transport equipment and associated key components: Advances, challenges, and prospects. Renew. Sustain. Energy Rev. 2026, 237, 117046. [Google Scholar] [CrossRef]
  36. Kan, A.; Wu, H.; Chen, Z.; Zhang, J.; Cao, D.; Yang, L. Thermal behavior exploration of liquid hydrogen carrier tank container supported with eight pillars. Appl. Therm. Eng. 2025, 279, 127806. [Google Scholar] [CrossRef]
  37. Wan, C.; Shi, C.; Zhu, S.; Fang, S.; Qiu, L.; Shi, G.; Li, D.; Shao, S.; Wang, K. Comprehensive design and preliminary experiments of liquid hydrogen storage tank for trucks. Int. J. Refrig. 2025, 169, 279–293. [Google Scholar] [CrossRef]
  38. Qiu, Y.; Xiao, J.; Ma, X.; Xu, Y.; Kang, H. Design and Simulation of Adiabatic–Damping Dual–Function Strut for LH2 Storage Tank. Energies 2024, 17, 3475. [Google Scholar] [CrossRef]
  39. McIntosh, G.E. Layer by layer MLI calculation using a separated mode equation. In Advances in Cryogenic Engineering; Kittel, P., Ed.; Springer: Boston, MA, USA, 1994; pp. 1683–1690. [Google Scholar] [CrossRef]
  40. EN 10027-2:2015; Designation Systems for Steels Part 2: Numerical System. European Committee for Standardization: Brussels, Belgium, 2015. Available online: https://standards.globalspec.com/std/9927212/en-10027-2 (accessed on 10 March 2026).
  41. Jeon, S.-M.; Kim, Y.-K.; Kim, S.-H.; Na, Y.-S. Simultaneously enhanced thermal insulation performance and mechanical properties in austenitic stainless steel for liquid hydrogen storage tank via microstructural tailoring. Int. J. Hydrogen Energy 2025, 138, 559–569. [Google Scholar] [CrossRef]
  42. Kim, C.S. Thermophysical Properties of Stainless Steels; Argonne National Laboratory: Argonne, IL, USA, 1975. [Google Scholar] [CrossRef]
  43. Lv, H.; Zhang, Z.; Chen, L.; Zhang, Z.; Chen, S.; Hou, Y. Thermodynamic analysis of vapor-cooled shield with para-to-ortho hydrogen conversion in composite multilayer insulation structure for liquid hydrogen tank. Int. J. Hydrogen Energy 2024, 50, 1448–1462. [Google Scholar] [CrossRef]
  44. Hastings, L.J.; Hedayat, A.; Brown, T.M. Analytical Modeling and Test Correlation of Variable Density Multilayer Insulation for Cryogenic Storage. 2004. Available online: https://api.semanticscholar.org/CorpusID:136605882 (accessed on 10 March 2026).
  45. Martin, J.J.; Hastings, L. Large-Scale Liquid Hydrogen Testing of a Variable Density Multilayer Insulation with a Foam Substrat; NASA Marshall Space Flight Center: Huntsville, AL, USA, 2001. Available online: https://ntrs.nasa.gov/citations/20010063699 (accessed on 10 March 2026).
  46. Liang, J.; Li, C.; Ma, Y.; Liu, X.; Zhang, S.; Zhou, Z.; Li, Y. Study on transient thermal performance of coupled vapor-cooled shield insulation for liquid hydrogen tank during the on-orbit period. Appl. Therm. Eng. 2025, 266, 125665. [Google Scholar] [CrossRef]
  47. Shi, C.; Zhu, S.; Wan, C.; Bao, S.; Zhi, X.; Qiu, L.; Wang, K. Performance analysis of vapor-cooled shield insulation integrated with para-ortho hydrogen conversion for liquid hydrogen tanks. Int. J. Hydrogen Energy 2023, 48, 3078–3090. [Google Scholar] [CrossRef]
  48. Leng, Y.; Zhang, S.; Wang, X.; Pu, L.; Xu, P. Comparative study on thermodynamic performance of liquid hydrogen storage insulation system incorporating vapor-cooled shield with para–ortho hydrogen conversion by one-dimensional and quasi-two-dimensional model. Energy Convers. Manag. 2024, 321, 119068. [Google Scholar] [CrossRef]
  49. Zhang, C.; Li, C.; Jia, W.; Pang, Y. Thermodynamic study on thermal insulation schemes for liquid helium storage tank. Appl. Therm. Eng. 2021, 195, 117185. [Google Scholar] [CrossRef]
  50. Yin, H.; Chen, G.; Lv, H.; Xu, Q.; Qu, S.; Zhang, G.; Deng, B.; Yang, G. Thermodynamic modeling and analysis of insulation structures for vehicle liquid hydrogen cylinder. J. Energy Storage 2025, 138, 118527. [Google Scholar] [CrossRef]
  51. Global Technical Regulations. Global Technical Regulation Concerning the Hydrogen and Fuel Cell Vehicles. UN GTR No.13. 2023. Available online: https://unece.org/transport/standards/transport/vehicle-regulations-wp29/global-technical-regulations-gtrs (accessed on 10 March 2026).
  52. ISO 13985; Liquid Hydrogen—Land Vehicle Fuel Tanks. International Organization for Standardization: Geneva, Switzerland, 2006. Available online: https://www.iso.org/standard/39892.html (accessed on 10 March 2026).
  53. ISO 11119-1; Gas Cylinders—Design, Construction and Testing of Refillable Composite Gas Cylinders and Tubes Part 1: Hoop Wrapped Fibre Reinforced Composite Gas Cylinders and Tubes Up to 450 L. International Organization for Standardization: Geneva, Switzerland, 2020. Available online: https://www.iso.org/standard/75815.html (accessed on 10 March 2026).
  54. Ma, X.; Chen, S.; Wang, X.; Zhang, W.; Wang, Z.; Mi, M.; Shi, C.; Zhang, S.; Li, J. Insulation excellence and storage dynamics in a 500-litre self-developed vehicular liquid hydrogen cylinder: Thermal leakage and status analysis. J. Phys. Conf. Ser. 2024, 2787, 012022. [Google Scholar] [CrossRef]
  55. Ma, X.; Chen, S.; Chen, L.; Wang, Y.; Jin, S.; Yu, Y.; Mi, M.; Shi, C.; Shi, Y. Experimental study on the factors affecting the insulation performance of flame-retardant multilayer insulation materials. Mater. Technol. 2023, 57, 217–226. [Google Scholar] [CrossRef]
  56. Wang, H.; Wang, B.; Xu, T.; Shen, X.; He, Y.; Zhou, W.; Pfotenhauer, J.; Jin, T.; Gan, Z. Thermal models for self-pressurization prediction of liquid hydrogen tanks: Formulation, validation, assessment, and prospects. Fuel 2024, 365, 131247. [Google Scholar] [CrossRef]
  57. Choi, H.; Lee, H.; Han, J.; Roh, K. Revisiting the cost analysis of importing liquefied green hydrogen. Int. J. Hydrogen Energy 2024, 82, 817–827. [Google Scholar] [CrossRef]
  58. Zhu, X.Y.; Lee, J.H.; Kim, K.-H.; Lim, C.-H.; Lee, S.H. Coupled CFD modeling and thermal analysis of multi-layered insulation structures in liquid hydrogen storage tanks for various vapor-cooled shields. Case Stud. Therm. Eng. 2024, 63, 105317. [Google Scholar] [CrossRef]
  59. Al Ghafri, S.Z.S.; Swanger, A.; Park, K.H.; Jusko, V.; Ryu, Y.; Kim, S.; Kim, S.G.; Zhang, D.; Seo, Y.; Johns, M.L.; et al. Advanced boil-off gas studies of liquefied natural gas used for the space and energy industries. Acta Astronaut. 2022, 190, 444–454. [Google Scholar] [CrossRef]
  60. Rahman, A.A.; Wang, H.; Wang, B.; Xu, T.; Li, J.; He, Y.; Jin, T.; Gan, Z. Prediction of pressure evolution in non-venting self-pressurized liquid hydrogen tanks using artificial neural network approach. Int. J. Hydrogen Energy 2024, 68, 428–439. [Google Scholar] [CrossRef]
  61. Wang, J.; Webley, P.A.; Hughes, T.J. Thermodynamic modelling of low fill levels in cryogenic storage tanks for application to liquid hydrogen maritime transport. Appl. Therm. Eng. 2024, 256, 124054. [Google Scholar] [CrossRef]
  62. Jusko, V.; Al Ghafri, S.; May, E.F. BoilFAST: Cryogenic Boil-Off Simulator v1.1.2; Fluid Sciences & Resources; The University of Western Australia: Crawley, Australia, 2026; Available online: https://www.fsr.ecm.uwa.edu.au/software/boilfast/ (accessed on 10 March 2026).
  63. Lv, H.; Chen, L.; Zhang, Z.; Zhang, Z.; Chen, S.; Hou, Y. Investigation of the non-equilibrium heat transfer and self-pressurization behavior of liquid hydrogen tanks. Int. J. Hydrogen Energy 2025, 122, 125–138. [Google Scholar] [CrossRef]
Figure 1. Diagram of insulation structure in the vehicle LH2 tank.
Energies 19 02620 g001
Figure 2. Thermal resistance network of the thermodynamic model.
Energies 19 02620 g002
Figure 3. Flow chart of calculation procedure.
Energies 19 02620 g003
Figure 4. Model validation for temperature distribution using the experimental data reported by Martin et al. [45].
Energies 19 02620 g004
Figure 5. Temperature profile under the NT and fire conditions.
Energies 19 02620 g005
Figure 6. Heat flux in VDMLI under the (a) NT condition and (b) fire condition.
Energies 19 02620 g006
Figure 7. Heat flux in cases with uniform layer densities under the (a) NT condition and (b) fire condition.
Energies 19 02620 g007
Figure 8. Heat flux at different Pg under the (a) NT condition and (b) fire condition.
Energies 19 02620 g008
Figure 9. Heat flux at different Te.
Energies 19 02620 g009
Figure 10. Pressure variation inside the LH2 tank.
Energies 19 02620 g010
Figure 11. Temperature variation inside the LH2 tank under the (a) NT condition and (b) fire condition.
Energies 19 02620 g011
Table 1. Detailed basic conditions and parameters.
SectionParametersValueSource
Liquid hydrogenTH220 K[48]
InnerMaterial316 L[45]
dinner0.002 m[32]
kinnerEquation (1)[41,42]
Number of grid cells1-
SOFIMaterialFoam[45]
dSOFI0.0353 m[45]
kSOFIEquation (2)[43]
εSOFI0.8[44]
Number of grid cells50[48]
VDMLIMaterial of the spacer materialDacron net[45]
Material of the radiation shieldAluminized mylar[45]
dVDMLI0.0375 m[45]
kVDMLIEquation (12)[47]
εVDMLI0.03[45]
Number of grid cells45[45]
Low-density8 layers/cm (10 layers)[45]
Medium-density12 layers/cm (15 layers)[45]
High-density16 layers/cm (20 layers)[45]
P2.67 × 10−5 Pa[45]
ShellMaterial316L[45]
dshell0.002 m[32]
kshellEquation (1)[41,42]
εshell_in0.44[32]
εshell_out0.5[31]
Number of grid cells1-
Outsideεfire1[32]
hfire10 W/(m2·K)[31]
ConditionsNT/Fire-
Te in the NT condition298.15 K-
Te in the fire condition863.15 K[52]
Number of grid cells1-
Table 2. Average temperature in each section under different external conditions.
SectionTemperature Under the NT Condition (K)Temperature Under the Fire Condition (K)
Inner20.0020.00
SOFI25.91126.68
VDMLI223.50680.71
Low-density in VDMLI39.8899.95
Medium-density in VDMLI220.89672.56
High-density in VDMLI275.57807.06
Shell298.16862.96
Table 3. qtotal under different dSOFI.
dSOFI (m)qtotal Under the NT Condition (W/m2)qtotal Under the Fire Condition (W/m2)
0.0250.210810.9174
0.030.210510.9138
0.0350.210310.9101
0.040.210010.9065
0.0450.209810.9028
0.050.209510.8992
0.10.207010.8601
Table 4. qtotal under different layer density distributions.
Low-Density (Layers/cm)Medium-Density (Layers/cm)High-Density (Layers/cm)Te (K)qtotal (W/m2)
12 (15 layers)12 (15 layers)12 (15 layers)298.150.2178
9.6 (12 layers)12 (15 layers)14.4 (18 layers)298.150.2137
8 (10 layers)12 (15 layers)16 (20 layers)298.150.2103
6.4 (8 layers)12 (15 layers)17.6 (22 layers)298.150.2064
12 (15 layers)12 (15 layers)12 (15 layers)863.1510.9329
9.6 (12 layers)12 (15 layers)14.4 (15 layers)863.1510.9191
8 (10 layers)12 (15 layers)16 (20 layers)863.1510.9099
6.4(8 layers)12 (15 layers)17.6 (22 layers)863.1510.9008
Table 5. Details of the cases with uniform layer densities.
CasesTotal Number of LayersLayer Density (Layers/cm)Temperature of the Hot Wall (K)
#1359.3298.15
#24010.7298.15
#34512298.15
#45013.3298.15
#5359.3863.15
#64010.7863.15
#74512863.15
#85013.3863.15
Table 6. qtotal under different TH2.
TH2 (K)qtotal Under the NT Condition (W/m2)qtotal Under the Fire Condition (W/m2)
200.210310.9099
250.209510.9097
300.208710.9095
350.208010.9093
400.207310.9091
450.206710.9090
500.206010.9087
550.205410.9085
600.204710.9082
650.203910.9080
700.203110.9077
750.202310.9073
800.201510.9070
Table 7. Characteristics of the LH2 tank.
SectionParametersValue
InnerDiameter650 mm
Head height162.5 mm
Working pressure0.8 MPa
Relief pressure0.96 MPa
ShellSurface area3.62 m2
Support structurens8
Do0.04 m
Di0.02 m
ks0.1568 W/(m·K)
Ls0.053 m
Accessory pipeline (No. 1)Ap,11.2174 × 10−4 m2
Lp,10.8 m
kp,114.9 W/(m·K)
Accessory pipeline (No. 2)Ap,27.5398 × 10−5 m2
Lp,20.8 m
kp,214.9 W/(m·K)
Accessory pipeline (No. 3)Ap,37.5398 × 10−5 m2
Lp,30.6 m
kp,314.9 W/(m·K)
Table 8. Heat leakage under different external conditions.
SectionHeat Leakage Under the NT Condition (W)ProportionHeat Leakage Under the Fire Condition (W)Proportion
Qtotal8.5069-62.9764-
Qi0.76029%39.494263%
Qs6.204673%18.807730%
Qp1.542118%4.67457%
Disclaimer/Publisher’s Note: The statements, opinions and data contained in all publications are solely those of the individual author(s) and contributor(s) and not of MDPI and/or the editor(s). MDPI and/or the editor(s) disclaim responsibility for any injury to people or property resulting from any ideas, methods, instructions or products referred to in the content.