Article

Modelling and Simulation of Low-Voltage Fault Behavior in Hybrid Multiterminal LCC-VSC HVDC System Integrated with Renewable Energy Sources


Department of Electrical Power Engineering, Durban University of Technology, Durban 4001, South Africa
*
Author to whom correspondence should be addressed.
Energies 2026, 19(11), 2577; https://doi.org/10.3390/en19112577
Submission received: 20 March 2026 / Revised: 16 April 2026 / Accepted: 17 April 2026 / Published: 27 May 2026
(This article belongs to the Section F1: Electrical Power System)

Abstract

Some previous studies argue that under the conditions of a double line to ground fault at the point of common coupling at the inverter end, the AC grid voltage of phases A and B will decrease along with the same level while the phase C will maintain at a stable steady state and this will lead to an excess increase in the voltage level of the high voltage direct current (HVDC) link. Presented in this paper is a model that comprises the hybrid multiterminal line commutated converters and the voltage source converter HVDC system. This model was mathematically modelled and implemented on Matlab/Simulink software in order to investigate the fault behavior, with a particular emphasis on double line to ground fault at different fault resistances. The system under study consists of a fault switch timer, photovoltaic solar array, wind energy conversion system, inverter control for the voltage source converter, Inductor–capacitor–inductor (LCL) filter and PI section line. The findings of this study indicated that during the double line to ground fault at varying fault resistances, the AC grid voltage in phase A will experience a more pronounced decrease compared to phase B. In contrast, phase C will exhibit only a slight reduction in voltage at the inverter end. Similarly, at the inverter end of the hybrid system, it was observed that the AC grid currents for the affected phases, specifically phases A and B, will experience an increase. It is further discovered that phase C will maintain relatively stable condition without increasing or decreasing during a double line to ground fault event. In addition, it is noted that the HVDC link voltage will decrease while the HVDC link current will increase depending on any fault resistance values. Thus, the inferences as a result of this study are presented in this paper.

1. Introduction

The integration of photovoltaic and wind energy into multiterminal HVDC networks [1] has gained traction. This system presents challenges in the area of fault events, and the modelling of hybrid renewable energy systems is essential for understanding their operational dynamics [2,3], evaluating their performance, predicting energy generation, and optimizing integration into existing energy grids. Several modelling techniques have been developed, spanning from theoretical energy models to advanced simulation software. Research conducted by Hamza et al. [4] centered around a plan that integrated this form of hybrid system into a HVDC transmission. The authors indicated that the integration provided a well-defined signal output that enhanced operational efficiency. Although their findings presented a baseline for understanding the system’s dynamics, they neglected an essential aspect that has to do with the potential impact of fault conditions on the hybrid power system. It can be argued that without a fault analysis that examines the system’s behavior during a double line to ground fault event, the robustness of their system design remains questionable. In their research, Hossain et al. [5] introduced a double line to ground fault, and they observed a significant voltage drop at the inverter end, and the other phase C remained stable without increasing or decreasing in voltage with an increase in the HVDC link voltage during 80% performance. Meanwhile, the researchers furthered their research at 50% performance, observing that the grid voltages outcome increases to 0.5 p.u., while the HVDC link voltage increases but not as pronounced as that of 80% performance. In the analysis of their findings, it can be ascertain that the fault resistance to this low-voltage fault was not given. Therefore, there remains an unanswered question regarding whether the grid current at the inverter end will collapse or decrease, a factor that is crucial for understanding the dynamics of the power system under fault conditions. The research conducted by Iqbal et al. [6] focused on frequency deviation and power oscillation. The researchers introduced a fault into their simulation that lasted for 0.5 s. Their findings revealed that, during this faulty condition, AC grid voltages and currents decreased near zero. The power output of the system experienced a collapse to zero, while the frequency of the system exhibited a downward trend, accompanied by undesirable oscillations. However, their work did not specify the type of fault that was implemented in their research—whether it is a symmetrical or unsymmetrical fault [7,8,9,10]—or what fault resistance value was used, leaving an essential aspect of the study an area that needs to be investigated. Liu et al. [11] proposed a fault ride-through strategy for hybrid systems, using a controllable line-commutated converter (CLCC) at the receiving end, which they noted provides forced commutation and ensures stable operation. In their research, the authors introduced a fault scenario involving a single line to ground fault with a resistance of 8 ohms, lasting 0.1 s at the receiving end. Their findings confirmed that the proposed CLCC effectively eliminates commutation failures and reduces stress during fault events when compared to conventional line-commutated converters (LCCs). However, the authors did not explore the implications of double line to ground fault on both receiving and sending ends in the hybrid cascaded system. The work of Shuo Yang et al. [12] advanced the development of a steady-state mathematical model alongside a small-signal model for a hybrid transmission system that integrates wind–photovoltaic–thermal power with HVDC technology [13,14]. In their findings, they observed that a decrease in the active power output of the thermal power plant leads to an increasing imbalance in the active power output ratio between wind and solar generation. Notably, their research also indicated that when the thermal power output falls below a desired per unit (p.u.) value, and when the active power outputs of both wind and PV systems are equivalent, the system, which operates under vector current control, becomes incapable of transmitting the rated active power requirements. However, their omission of fault condition analysis indicates an area that requires further investigation, especially when considering the vulnerability of power transmission systems to disturbances. Therefore, the question that arises is: how does the proposed hybrid system perform under the double line to ground fault condition? The work of Xu et al. [15] noted that the photovoltaic and wind models can utilize pumped storage power plants to mitigate power fluctuations arising from the characteristics of renewable energy output, thereby facilitating renewable energy consumption as well as enhancing the security of the system. However, the findings from the previous studies indicate that challenges may occur in the hybrid multiterminal HVDC system integrated with photovoltaic and wind energy sources during a double line to ground fault at the inverter end, and that the voltages of phases A and B at the inverter end will decrease, and phase C will remain unaffected, resulting in an increase in the direct current (DC) voltage, which is crucial for inverter operations [16,17]. It can therefore be argued that several performance issues will arise in the hybrid multiterminal HVDC link during the double line to ground fault at the side of the inverter, and that a slight decrease in AC grid voltages of phases A and B will occur, but phase A will have more of a decrease than phase B. This decrease in voltage will have effects on the other phase of phase C at the inverter end, and this will lead to a decrease not as compared to phases A and B. It is therefore evident that during the fault, AC grid currents that flow from the inverter will increase, and this will lead to a sinusoidal waveform. It can be established that a double line to ground fault will cause a reduction in the HVDC link voltage while HVDC link current will increase and will lead to further inefficiencies and increased stress on the system. At the rectifier side also, the AC grid currents will rise with unwanted noise, and a slight decrease in AC grid voltages will occur. In this study, a double line to ground fault at the inverter end of the AC system and their behavior on the DC link as well as on the AC system of the rectifier end with detailed simulations along with different fault resistance values was carried out. The model for an HVDC system integrated with photovoltaic and wind energy systems is modeled and implemented on Matlab/Simulink R2018b software; the simulation results for the models are presented later in this paper.

2. System Modelling

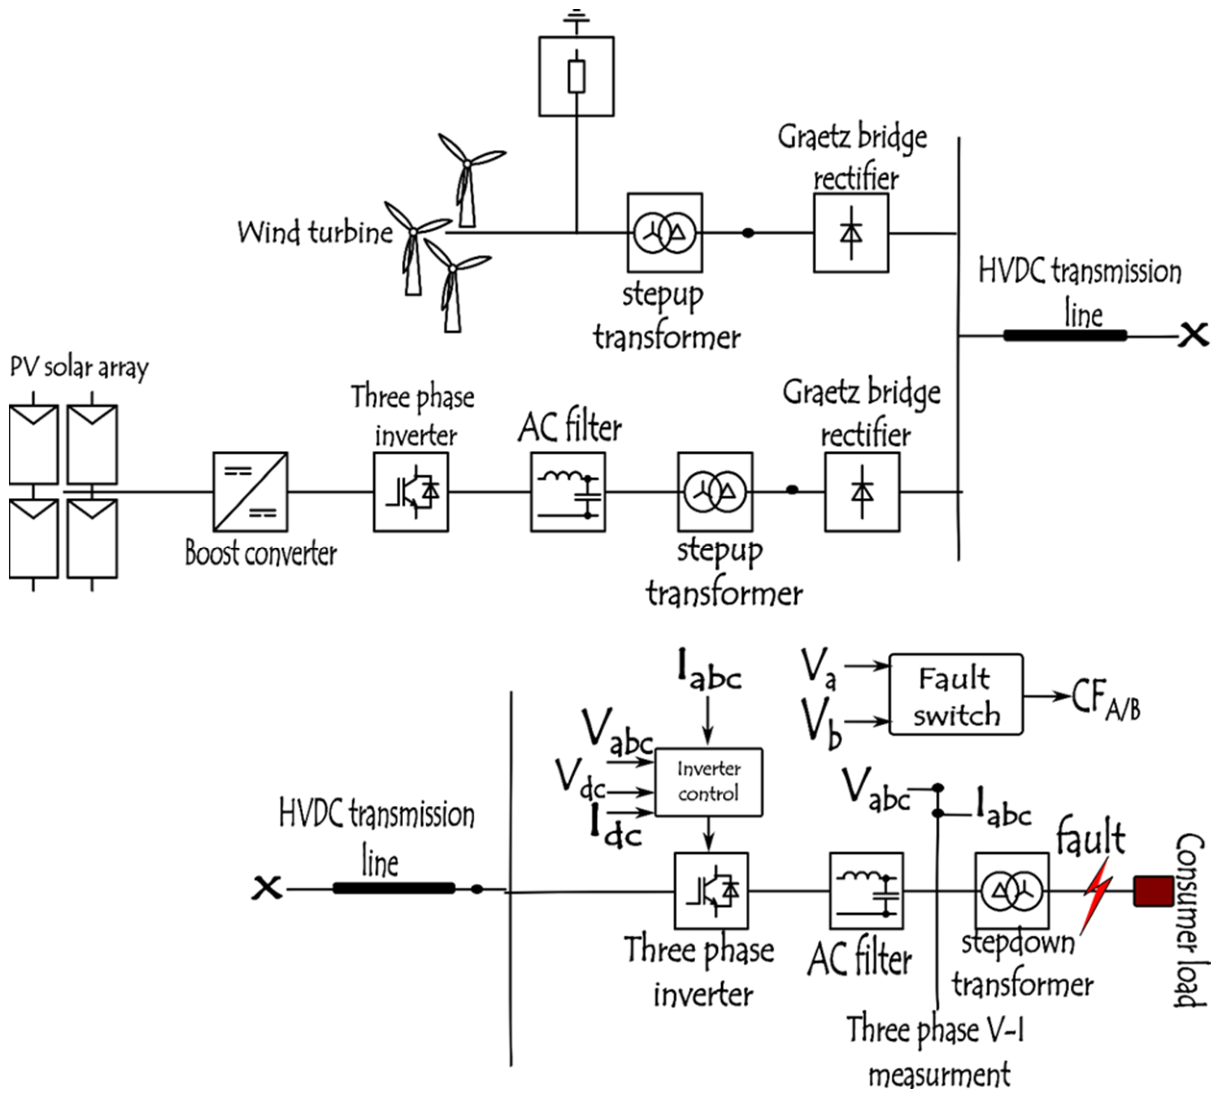
Figure 1 represents a framework where renewable energy sources are connected with line-commutated converters (LCCs) and a voltage source converter (VSC) HVDC system. The system under study consists of a photovoltaic solar array, wind energy conversion system, inverter control for the voltage source converter, fault switch timer, LCL filter and PI section line. The system model [18] shown in Figure 1 was formulated and implemented in Matlab/Simulink.

2.1. Photovoltaic Solar Array

Photovoltaic solar arrays consist of multiple interconnected solar panels that harness solar energy through the photovoltaic effect, a process that generates electrical power when sunlight strikes the semiconductor material within the solar cells [19,20]. The solar cells absorb photons from sunlight, causing electrons to be knocked loose and creating an electric current. The arrangement of multiple solar panels into an array allows for the efficient conversion of solar energy into electric power, which can be used locally or fed back into the grid. The photovoltaic solar array involved both series and parallel configurations to optimize energy production and efficiency. The equation of the solar array that was used in modelling the system is expressed in Equations (1)–(7):
V T o t a l _ C = V N _ c e l l 1 + V N _ c e l l 2 + V N _ c e l l n
I T o t a l _ C = I N _ c e l l 1 + I N _ c e l l 2 + I N _ c e l l 5
P T o t a l _ C = I T o t a l _ C × V T o t a l _ C
The current flowing out of the cell is given in Equation (4)
I o u t = I p h o t o c u r _ P V I r e v . s a t u r P V ( e x p q V K T 1 )
where,
I p h o t o c u r _ P V is the photocurrent;
I r e v . s a t u r P V refers to the reverse saturation current of the diode;
q represent the charge of electron ( 1.602 × 10 19 C );
K is Boltzmann’s constant;
T t e m p . is temperature;
represent a diode ideal factor.
I P V = I p h o t o c u r _ P V I d i o d e _ P V I s h u n t R _ P V
I P V = I p h o t o c u r _ P V I r e v . s a t u r P V ( e x p q V K T 1 ) V + I R s e r _ P V R s h _ P V
Equation (7) of the open circuit voltage is given as
V o p e n C _ P V = V T e m _ P V I s h o r t C _ P V I r e v . s a t u r _ P V + 1
where V T e m _ P V is the voltage equivalent of temperature, and I s h o r t C _ P V is the short circuit current.

2.2. Wind Energy Conversion System

A wind energy conversion system (WECS) can be expressed as a system designed to capture the kinetic energy from wind and convert it into mechanical or electrical energy [21], and it consists of several key components: the rotor, generator, transformer, transmission system, and control system. The efficiency of this process depends heavily on the design and material of the blades, as well as the wind speed. When the rotor spins, it drives a generator that converts mechanical energy into electrical energy. The transformer then increases the voltage of this electricity, making it suitable for transmission over long distances. The mechanical power output of the wind energy conversion system is given by Equation (8)
P m O = 1 2 ρ π R 2 v 2 C p ( λ , β )
where ρ is the air density, R is the turbine radius, λ is the tip speed ratio, β refers to the pitch angle, v is the wind speed, and C p is the power coefficient. For the power coefficient, Equation (9) is given by
C p λ , β = 0.5176 116 λ i 0.4 β 5 e 21 λ i + 0.0068 λ
1 λ i = 1 λ + 0.08 0.035 β 3 + 1
The mechanical torque is given in Equation (11)
T m = 1 2 ρ π R 3 v 2 C p ( λ , β ) λ
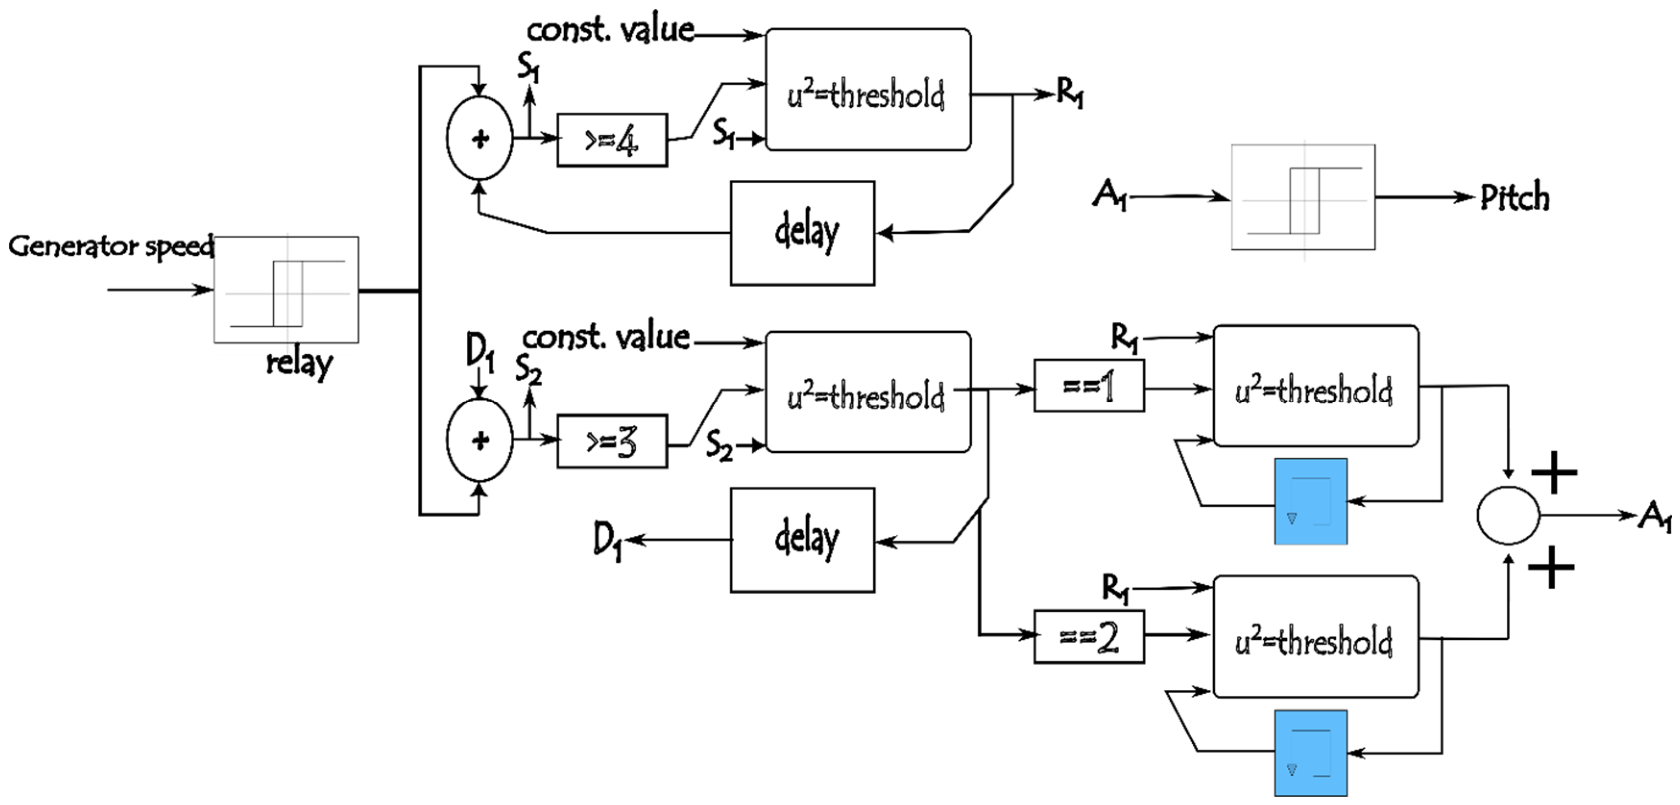
In addition, pitch control mechanisms were designed to adjust the angle of the turbine blades relative to the wind direction dynamically [22,23]. This adjustment was crucial for maximizing energy capture during varying wind speeds and preventing structural damage during gusts or storms. Essentially, when the wind was light, the blades were pitched to a steeper angle to capture more energy. In a typical pitch control system, the data from the turbine’s rotational dynamics were processed through a series of model stages. The first stage involved comparing the rotor signal from a permanent synchronous generator to a constant reference signal. The output from this comparison informed the next stage, where a multiple if–else statement processed the input and adjusted the blade pitch accordingly. Within this subsystem, the pitch control mechanism must operate with high precision. At the second stage, the system responded to the input conditions by evaluating a series of if–else conditions that decided how to adjust the pitch angle. The third stage, often referred to as an “if–else memory switch”, held the processed decisions and culminated in a final output that determined the exact angle by which the turbine blades must tilt, and the model is shown in Figure 2 below.
For the synchronous machine model, Zhang et al. [24] presented a machine by designating the magnetic axis of phase “a” as the reference axis while incorporating the transformation axes d and q. Based on the machine’s phases, the equations governing voltage and electromotive forces were articulated in the stationary reference frame and then adjusted using the Park transformation in Equations (12) and (13):
v p = L q ω r i q L d d i d d t R s i d
and
v q = λ m ω r L d ω r i d = L q d i q d t R s i q
It is noted that the electromotive force (EMF) is given by the Equations (14) and (15):
E d = L q ω r i q
and
E q = λ m ω r L d ω r i d

2.3. Inverter Control

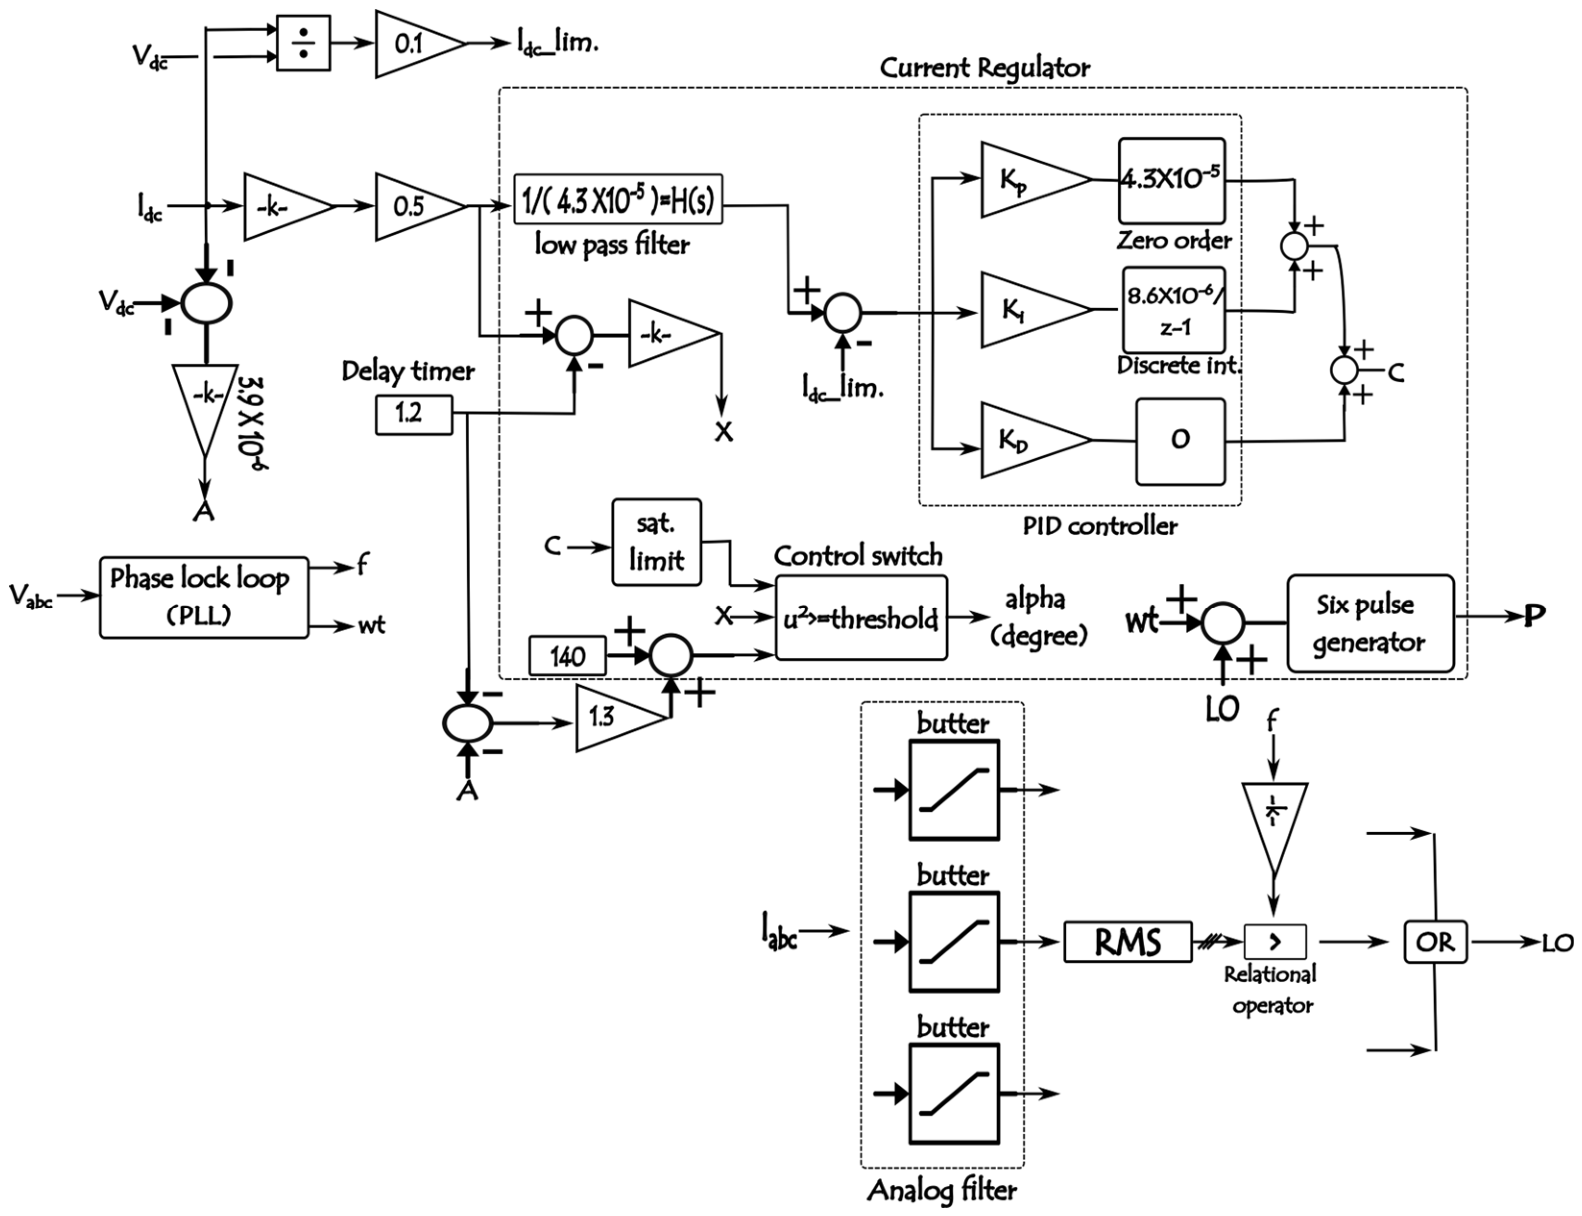
The proposed inverter control system, shown in Figure 3, relies on measurements of DC current, DC voltage, direct current (DC), direct voltage (DV), and grid voltages captured on the inverter side, as well as grid currents. To facilitate the control and regulation processes, both the direct current and direct voltage values are transformed into per unit (p.u) values. This transformation allows for a standard reference point, enabling more precise control over the system’s performance. These per unit values are then fed into a proportional-integral-derivative (PID) controller, where they are processed as negative error inputs within the current regulator unit. The PID controller processes negative error inputs derived from the per unit (p.u.) values of current and voltage. The proportional component reacts to the present error, the integral component addresses the accumulation of past errors, and the derivative component anticipates future errors based on the current rate of change. This three-fold approach allows for a finely tuned response that adjusts the output alpha firing angle of the inverter accordingly. The alpha firing angle directly influences the timing of the switching actions within the inverter, determining how effectively power is delivered to the grid. This dynamic response is vital for maintaining system stability, especially in scenarios where intermittent power sources like solar or wind present fluctuating output levels. Consequently, it generates a positive output value that corresponds to modifications in the input alpha firing angle, measured in degrees. Additionally, the system employs a phase-locked loop (PLL) [25,26], which generates a phase angle in radians, synchronizing the inverter’s output with the grid. The results of these processes are then sent to a 6-pulse generator, which effectively controls the gate signals for the three-phase bridge inverter.

2.4. Fault Switch Timer

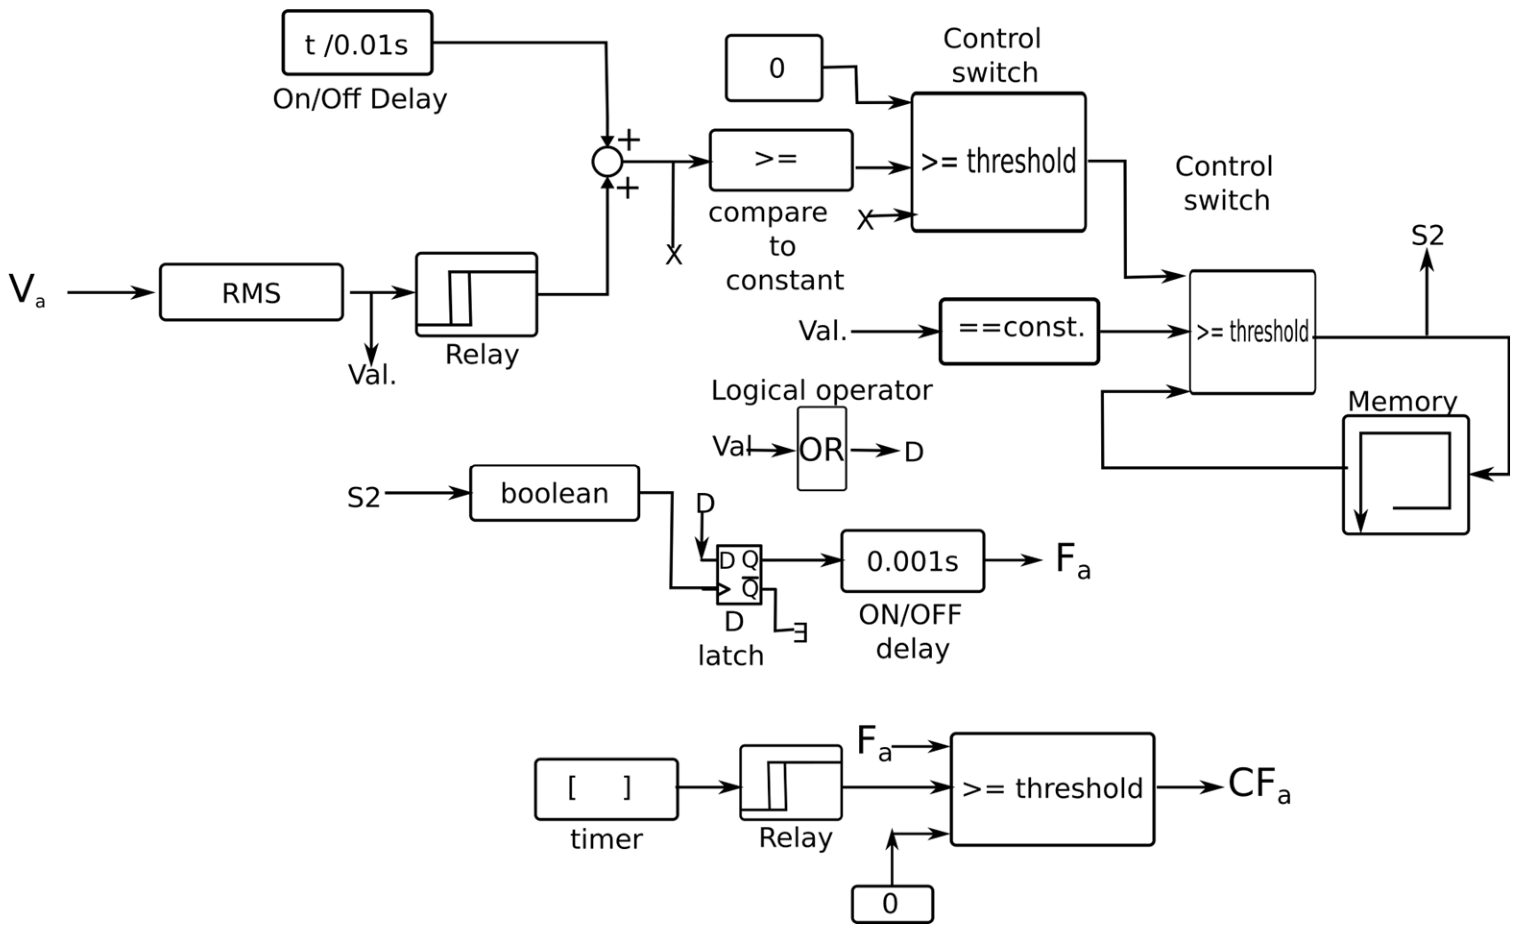
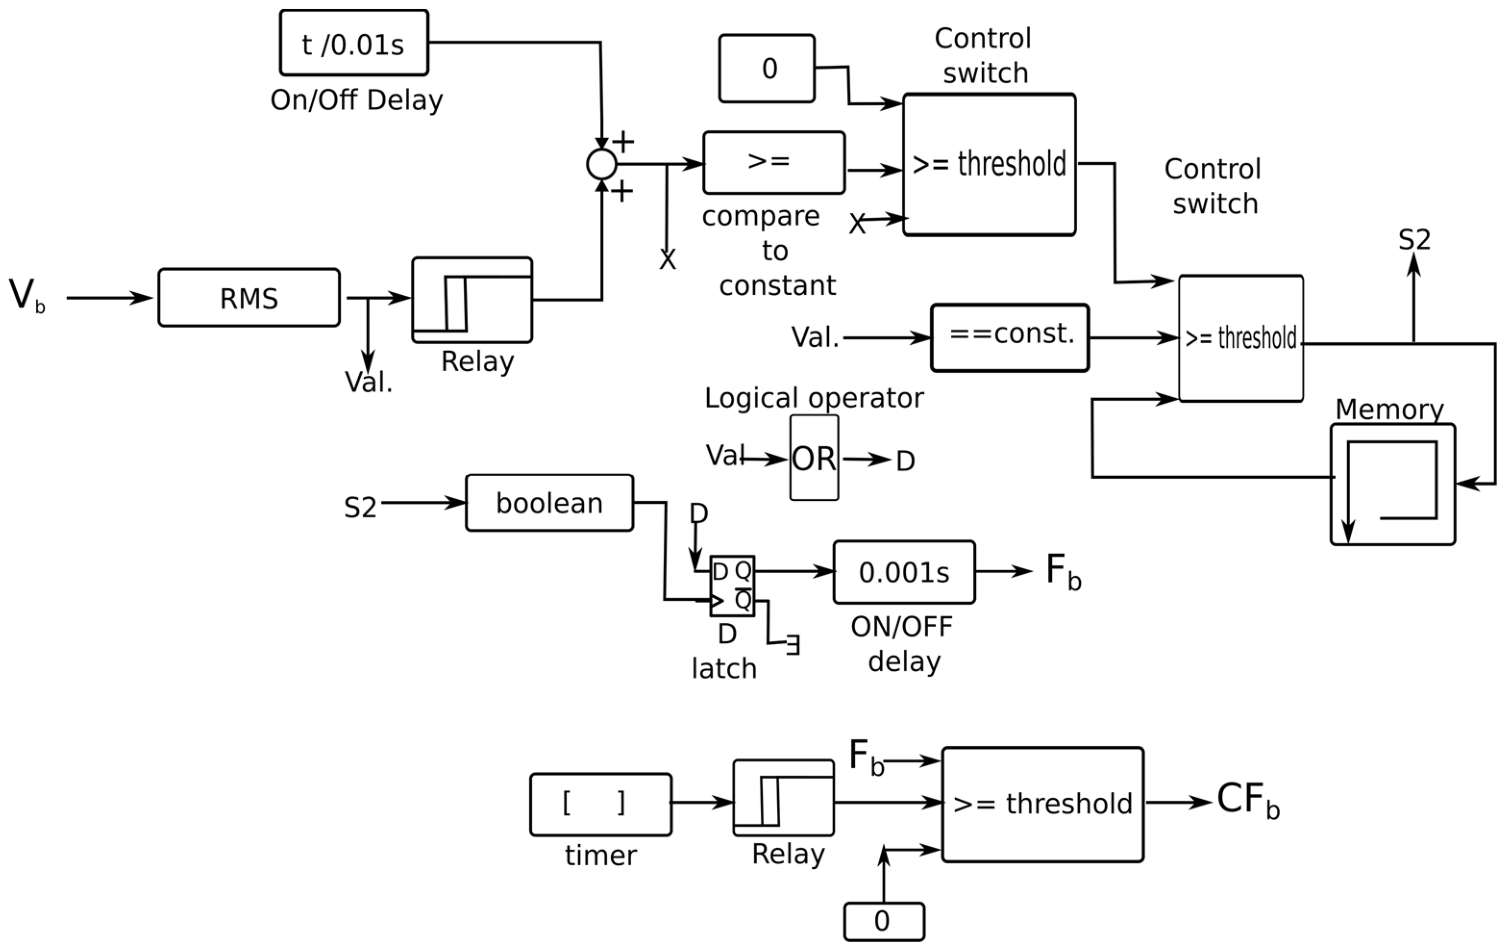
As shown in Figure 4 and Figure 5, the fault switch timer was designed to detect faults within the system network at the inverter side. Data from the three-phase V-I measurement of grid voltages (A and B) went through multiple processing stages. The initial stage involved converting the data into RMS (root mean square), after which it was routed to logical and relational operators. The decisions made during this process were stored in an if–else memory switch. Ultimately, the processed information was forwarded to the control switch, where a different desired timer was set before being sent to the relay, which acted as a threshold to ascertain the final output to control the fault blocks. In the case of the double-phase fault block, the fault resistance parameter is set at different values [27].

2.5. LCL Filter

Filters are integral components in grid-connected inverters [28,29] because they mitigate harmonics and ensure that the output current closely aligns with the requirements of the power grid. The output current from inverters, if left untreated, can exhibit substantial harmonic distortion. The choice of filter directly influences not only the quality of the current but also the operational efficiency of the entire system [30,31,32]. However, it offers several advantages that make them more suitable for various applications, particularly in renewable energy systems. It consists of an inverter side inductor L i I N V a grid side inductor L g , and a shunt capacitor C f with a damping resistor R d to prevent resonance. The equation used to mitigate the high frequency switching noise in grid-connected inverters is given in Equation (16):
C b a s e = P n 3 ω g r i d V p h 2
where C b a s e refers to base capacitance, ω g r i d is the grid angular frequency, V p h is the phase voltage, and P n represents the rated power. To calculate the filter capacitor, 5 % of C b a s e was used to limit power factor deviation, and the formula is given in Equation (17):
C f 0.05 C b a s e
Equation (18) was used to determine the inverter side inductor:
L i I N V = V d c 4 f s w Δ I m a x
where V d c is the DC link voltage, f s w is the switching frequency, and Δ I m a x is the current ripple, often 10–30% For the grid side inductor, Equation (19) is given as
L g = r L i I N V 0.2   t o   0.6
Equation (20) to suppress the resonance is given by
R d = 1 3 ω r e s C f

2.6. PI Section Line

Transmission lines are categorized into short, medium, and long lines. The classification depends on the electrical length relative to the wavelength of the signal being transmitted. The Pi section model is often used for medium and long transmission lines, where the effects are labelled as resistance R , inductance L , capacitance C , and sometimes conductance G [33,34]. The PI model consists of two capacitors placed in parallel followed by series inductance and resistance, which will represent the HVDC transmission line. This representation allows for simplification of complex line parameters.
The resistance R d c _ L per km is given in Equation (21):
R d c _ L = ρ a l u m . × L k m A C _ a r e a     ρ 2.8 × 10 8   Ω m
The total area A C _ a r e a was given as 1200   m m 2 so that it will keep the current density around 1.7   A / m m 2 , because higher current will be generated above 2 kA in the HVDC transmission line.
R d c _ L = 0.0233   Ω / k m
For the inductance L d c _ L calculation, by assuming the conductor radius 22   m m with an average of ≈15 mm, the equation is given in Equation (22):
L d c _ L = μ o _ L 2 π l i n 2 h r c o n d _ R μ o _ L = 4 π × 10 7   H / m
For the capacitance C d c _ L , the calculation in Equation (23) is given as
C d c _ L = 2 π ε o l i n 2 h r c o n d _ R ε o = 8.854 × 10 12   F / m

3. Simulation Model

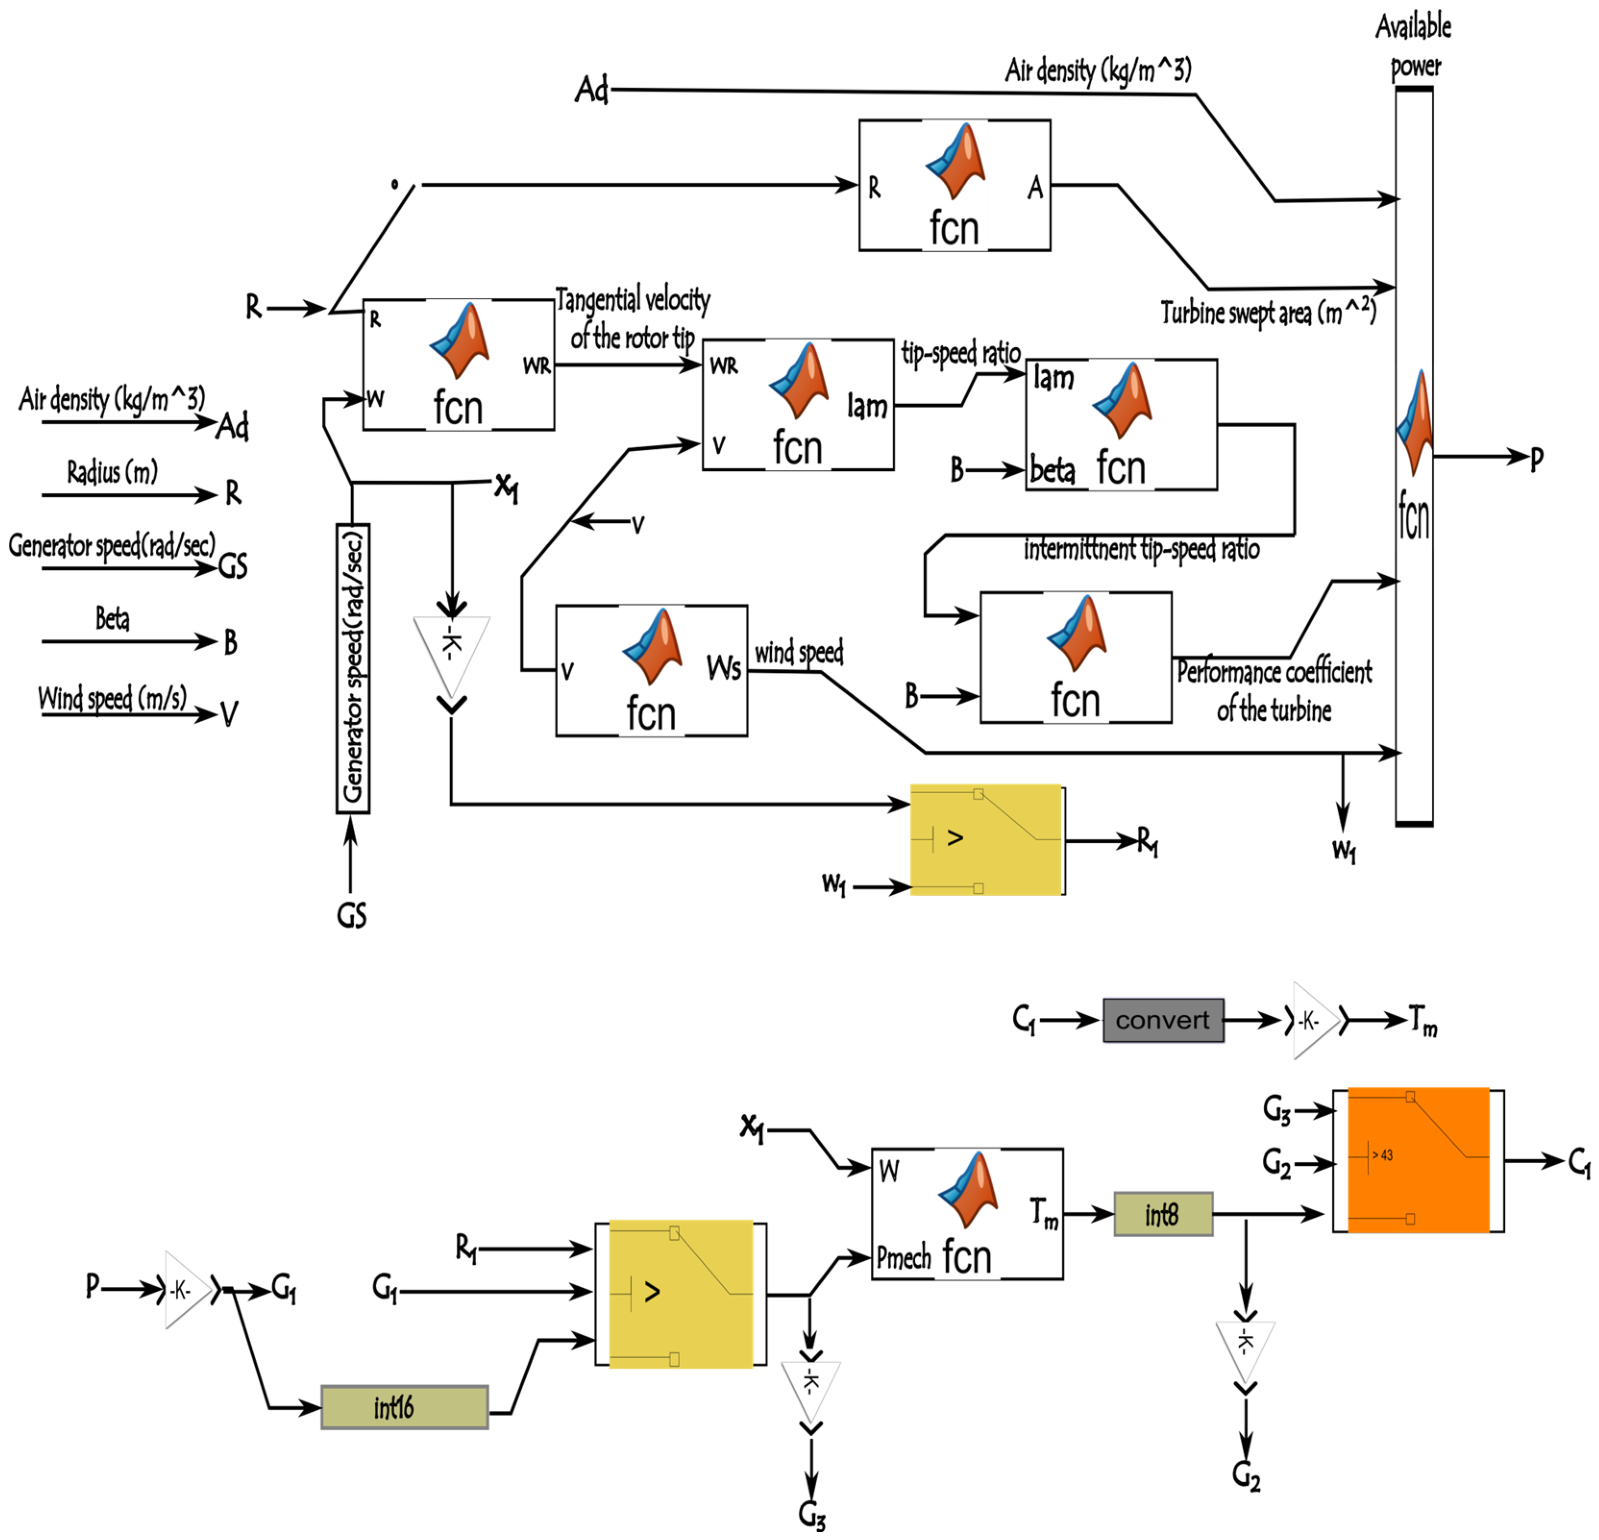
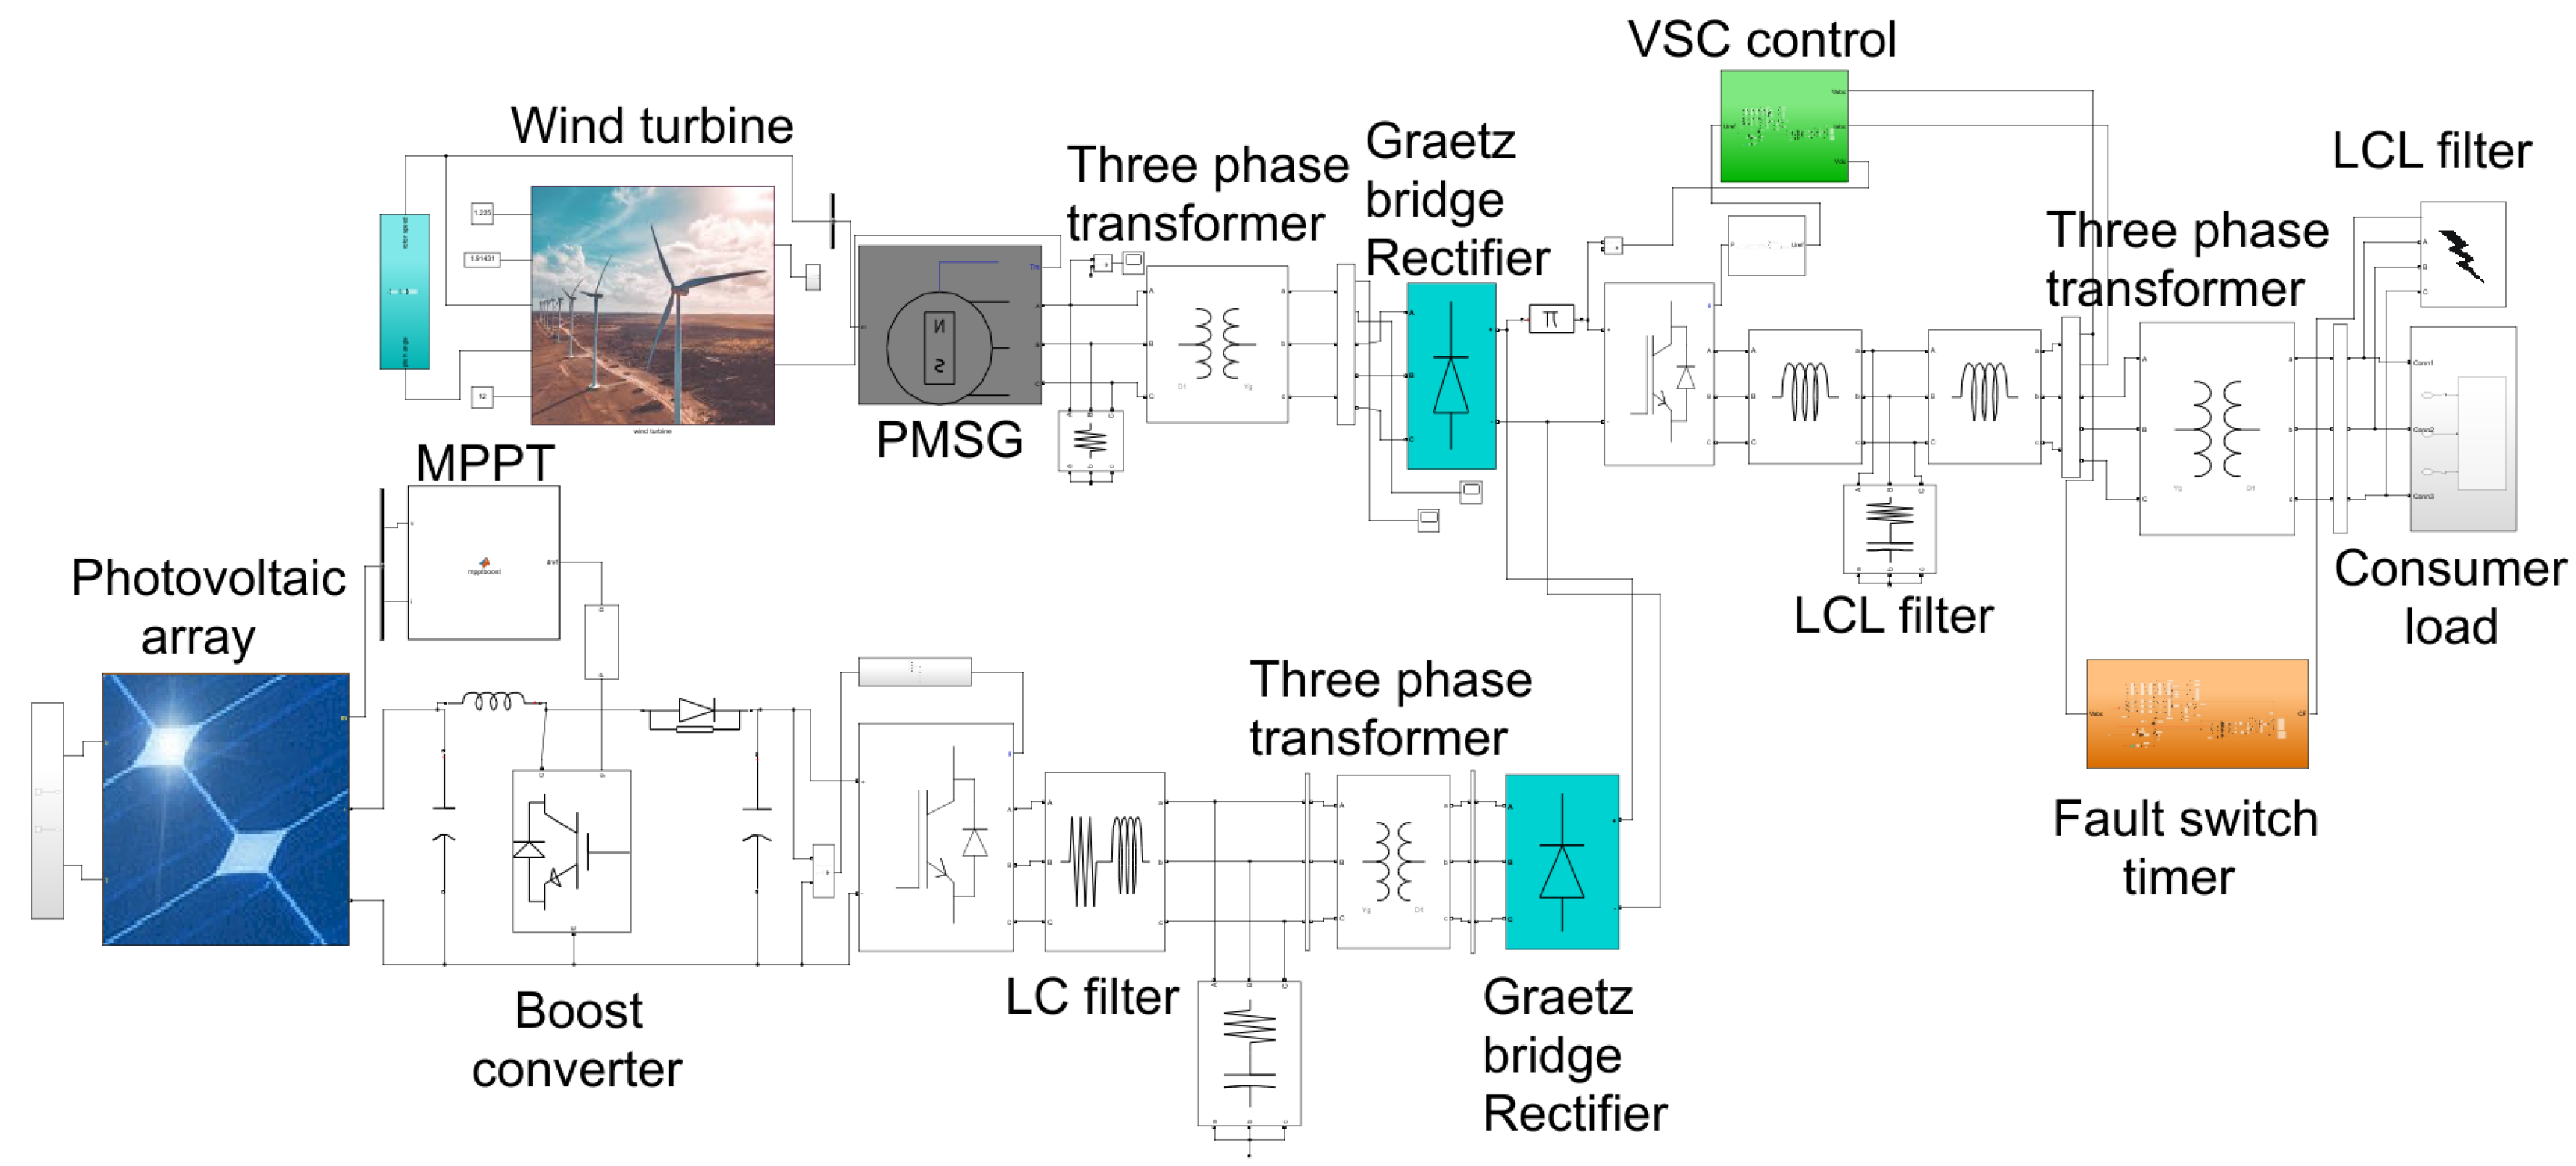
The hybrid multiterminal high voltage direct current (HVDC) model, which integrates photovoltaic and wind energy systems, consists of various technological components designed for long-distance power transmission. Furthermore, Figure 6 shows the subsystem block, while the Matlab function was used to carry out the Equations presented in Equations (8)–(11) of Section 2.2. The application of this function facilitated the efficient processing of five input parameters, resulting in the desired output. Nevertheless, the system’s topology strictly follows the circuit design, as shown in Figure 7.

4. Results and Discussion

The performance of the HVDC grid-connected hybrid PV–wind system and the effectiveness of the proposed control algorithms have been thoroughly evaluated using the Matlab/Simulink simulation platform. The model integrates a permanent magnet synchronous generator driven by a wind turbine and a photovoltaic (PV) generator. Under fault conditions, i.e., double line to ground fault with different fault resistance values [27] are applied at the receiving end of the point of common coupling, the simulation results for each scenario are presented in this section, and the detailed parameters are listed in Table 1.

4.1. 20 Ohms Fault Resistance Under Double Line to Ground Fault

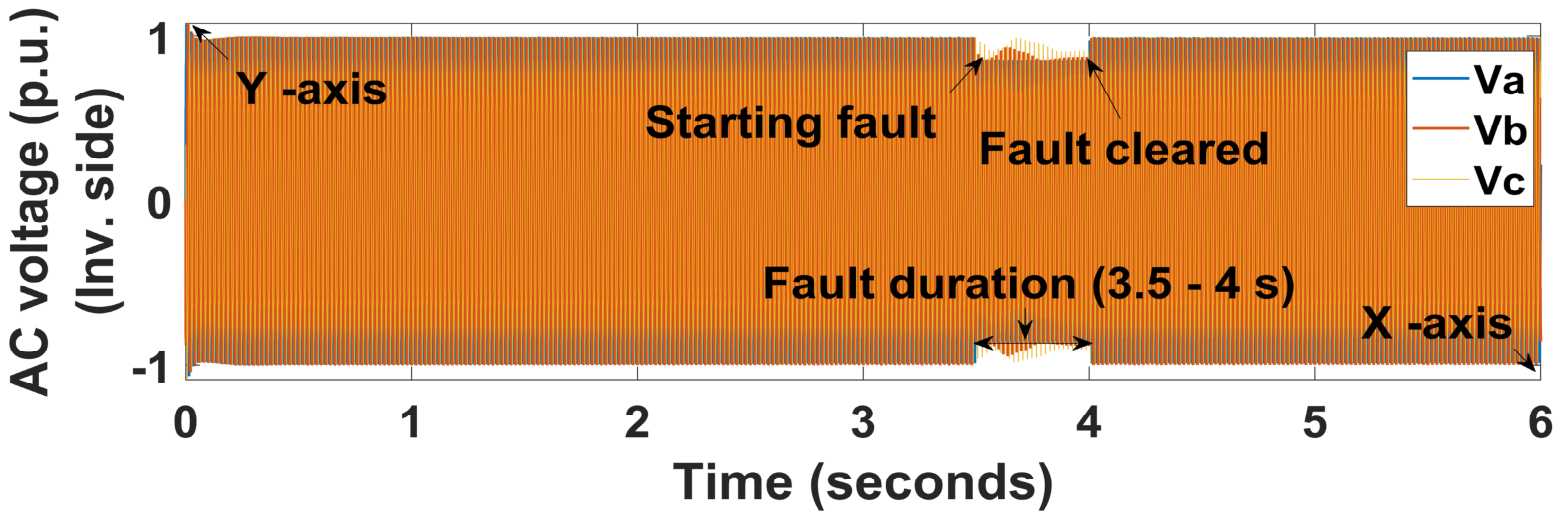
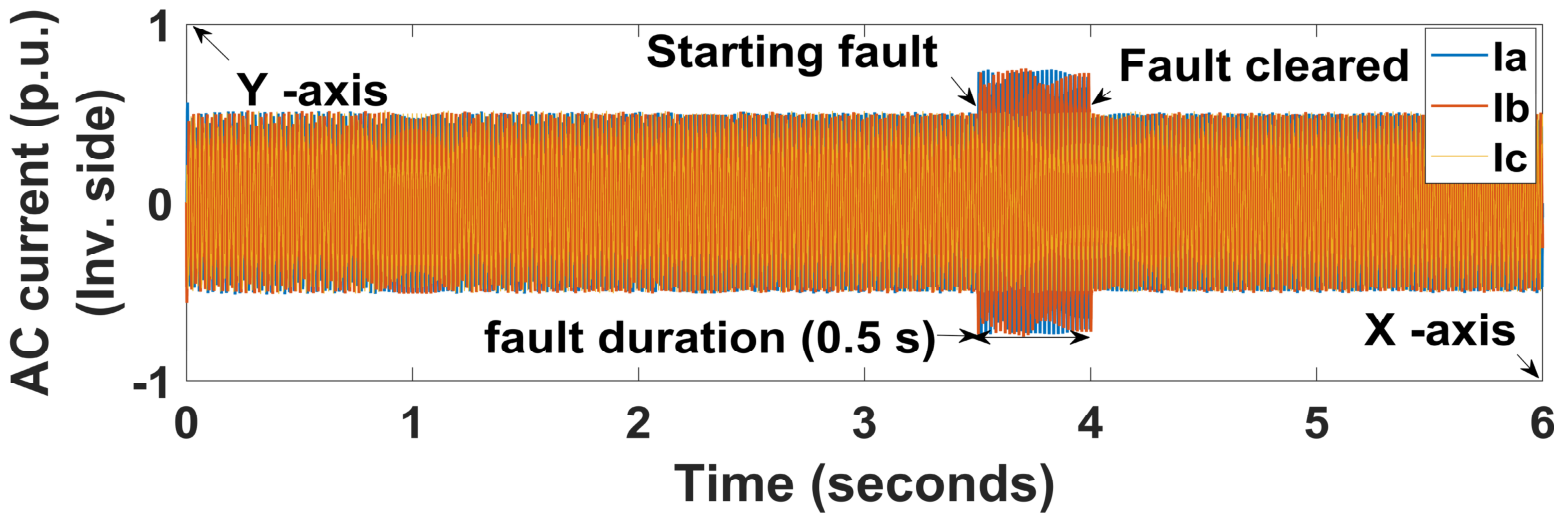
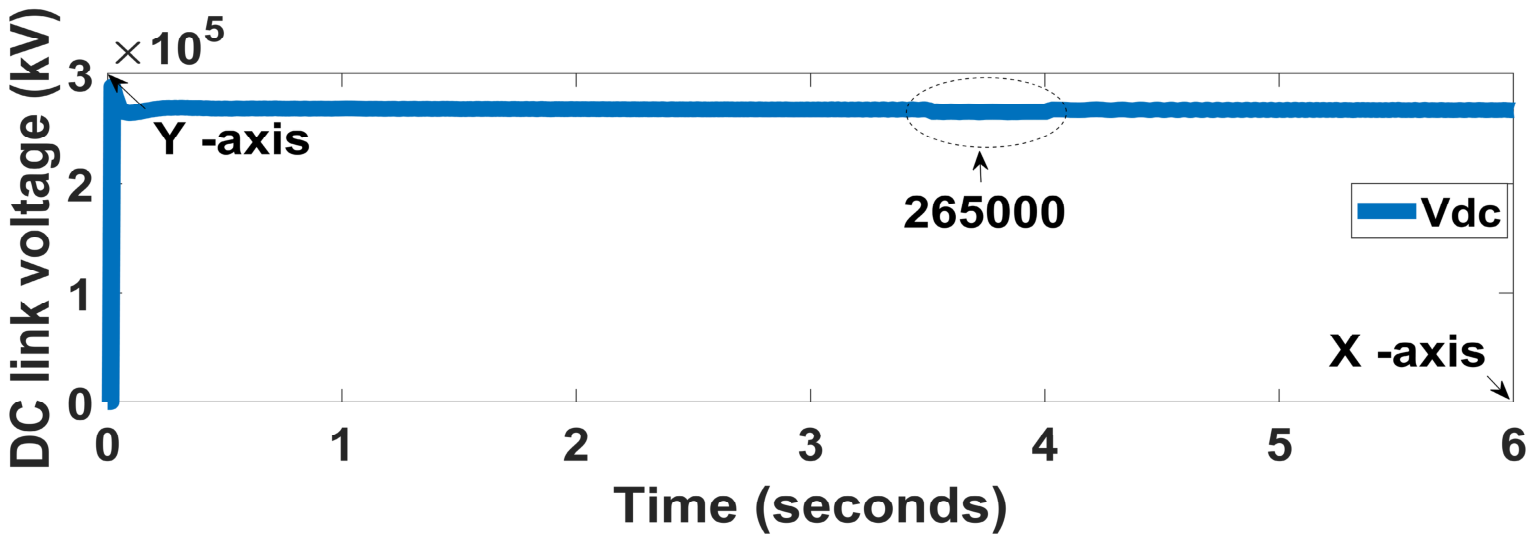
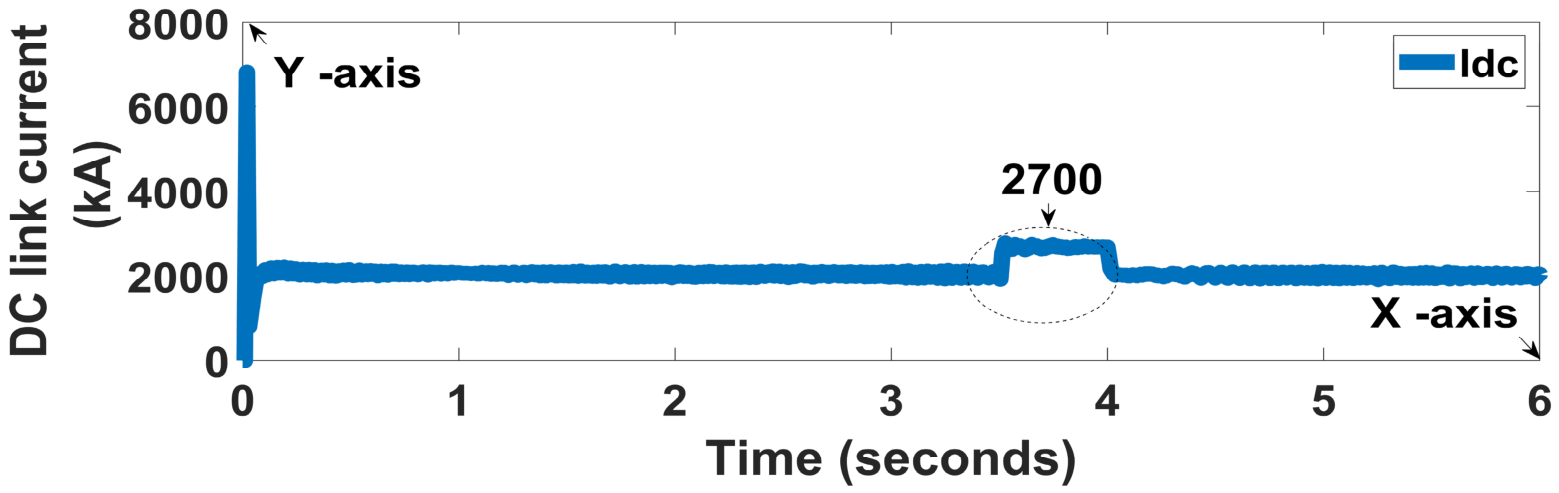
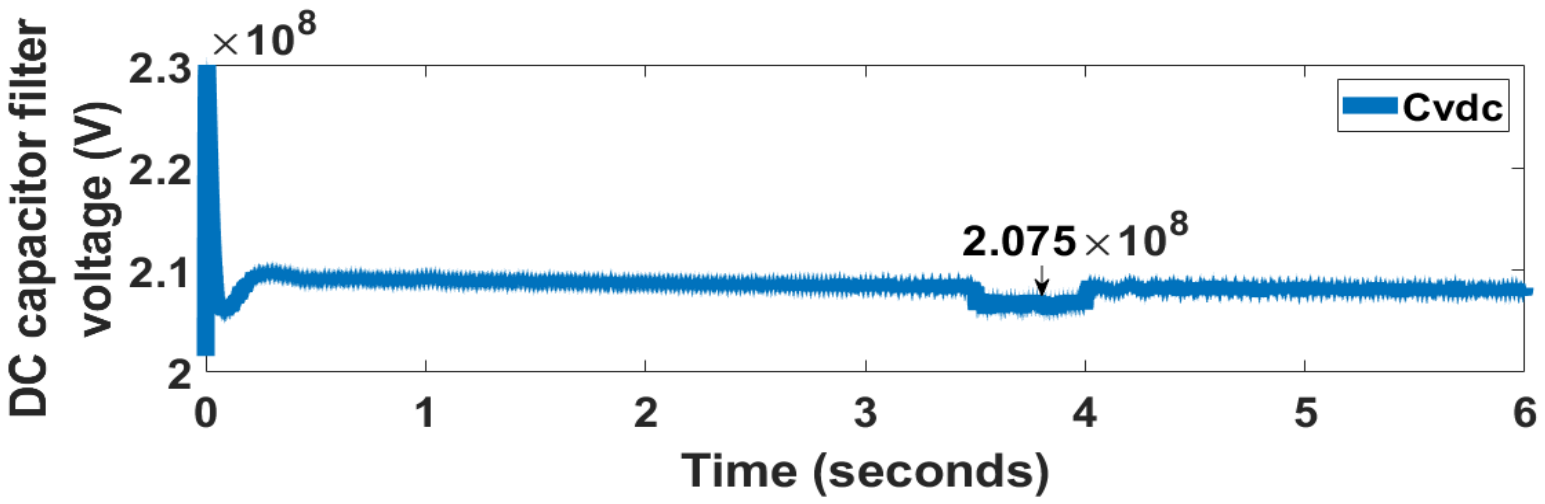
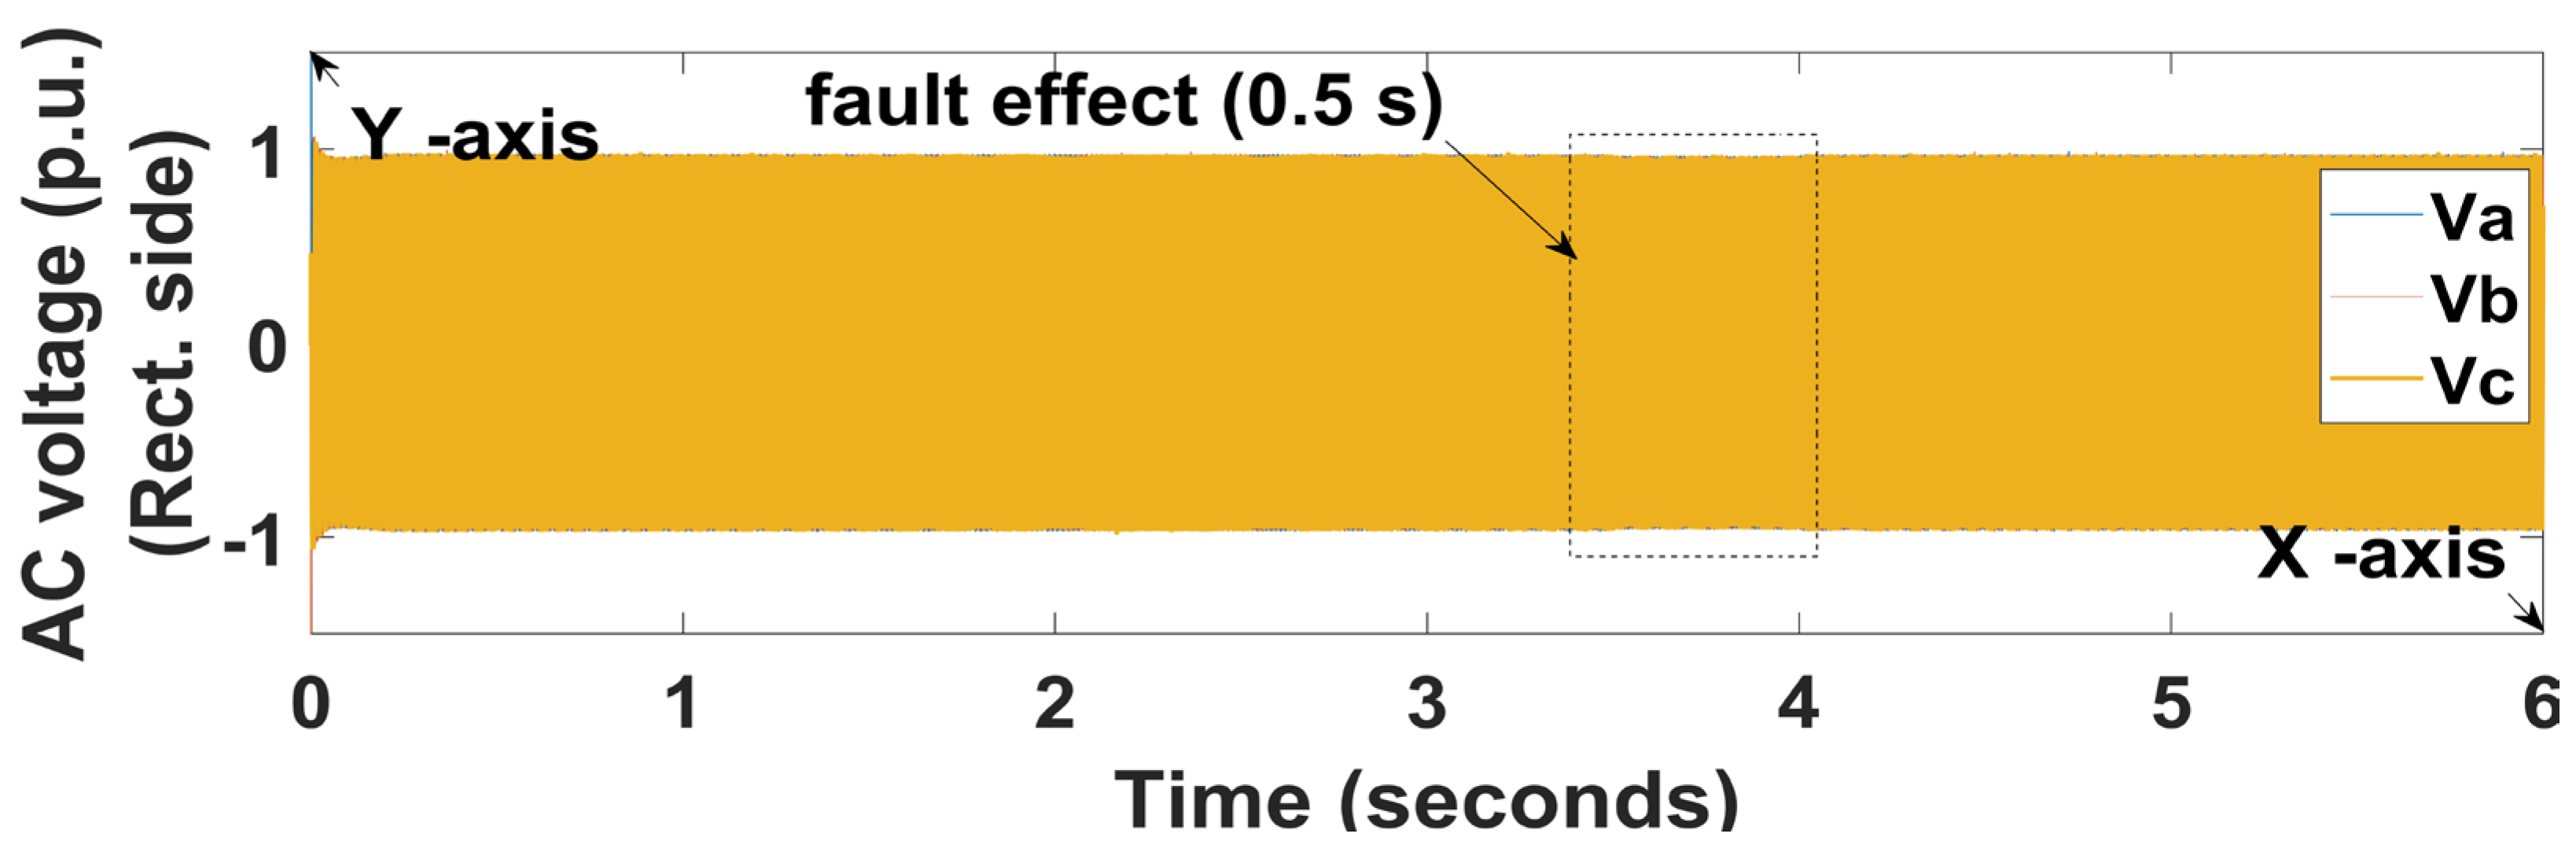
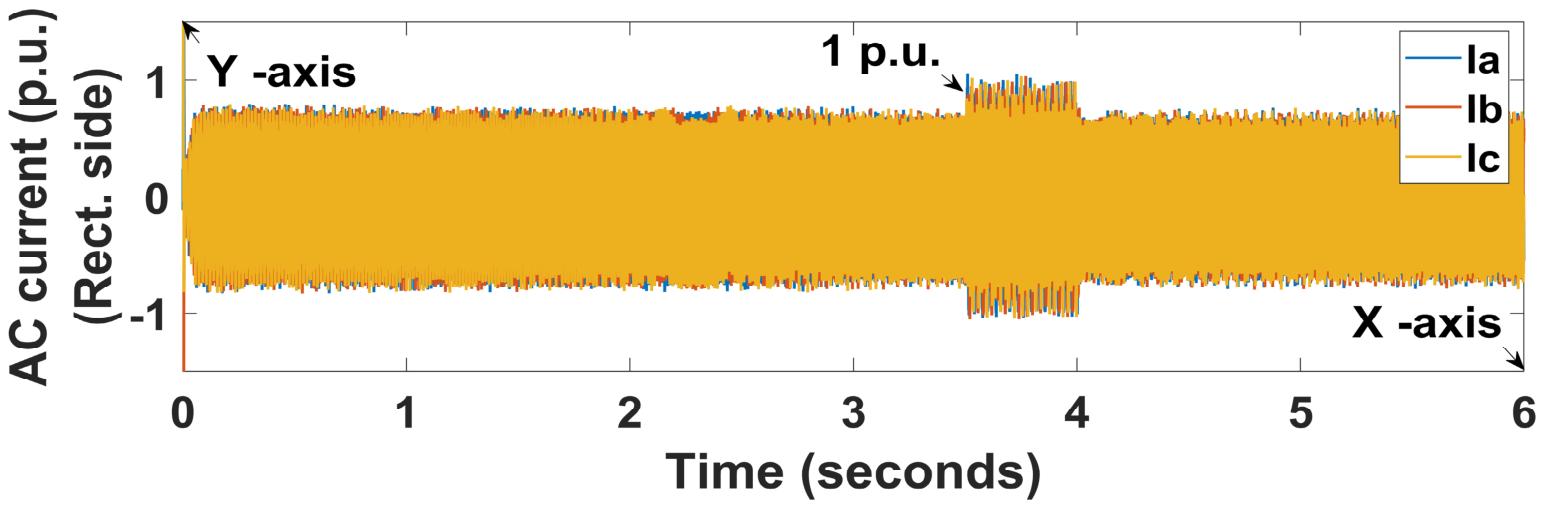
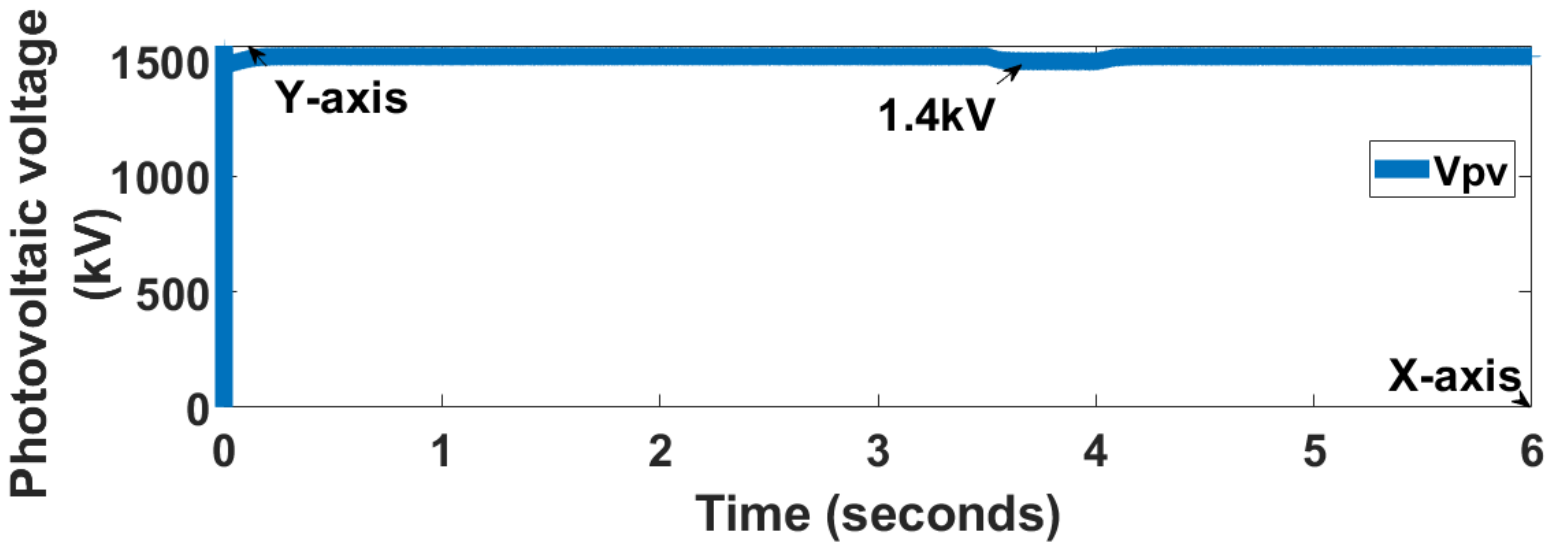
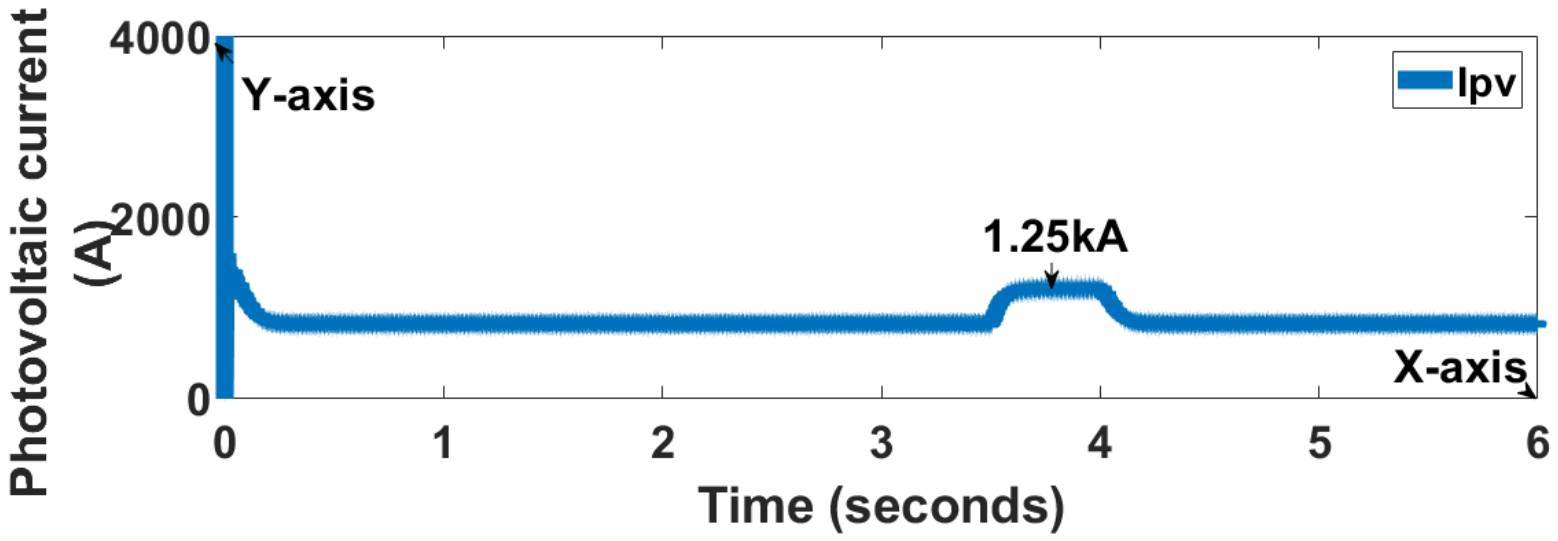
A double line to ground fault is a specific type of fault that occurs when two phases of an electrical system come into contact with the ground simultaneously. This fault will lead to significant disturbances in the electrical system’s operation. In this scenario, the fault develops at the inverter end with 20 Ohms fault resistance at the duration of 3.5–4 s. During the fault mentioned, an analysis reveals that the AC grid voltages for phase A and phase B will decrease significantly to 0.85 p.u. and 0.87 p.u. respectively, whereas phase C will experience a smaller reduction, stabilizing at 0.9 pu, as shown in Figure 8. This decline in voltage levels indicates that the fault results in an imbalance in the system, with phases A and B being disproportionately affected compared to phase C. The immediate implication of such a voltage drop is a potential deterioration in the quality and reliability of power supplied to the grid, as reduced voltage levels will lead to inefficient operation of connected equipment and appliances. Furthermore, the current in phases A and B is observed to increase to 0.7 p.u. during the fault, while phase C current remains unchanged at 0.5 p.u., as shown in Figure 9. However, when examining the HVDC line voltage, the normal operating value will slightly drop to 2.65 × 10⁵ kV, accompanied by oscillations, as shown in Figure 10, indicative of instability induced by the fault. Furthermore, the HVDC current will increase to 2700 A, also accompanied by slight oscillations, as shown in Figure 11. The escalation in current levels implies increased stress on the system and identifies the need for adequate measures to prevent damage. Furthermore, the capacitor filter voltage within the high voltage direct current transmission line will exhibit a decrease with oscillation, as shown in Figure 12. At the rectifier end, analysis shows that the AC grid voltages for phases A, B, and C will decrease slightly to 0.95 p.u., as shown in Figure 13, indicating a general degradation of voltage stability across the system. However, a noteworthy observation is that the AC currents at this end will increase to 1 p.u., as shown in Figure 14, indicating compensatory action by the system. This increase in current at the rectifier level suggests an enforcement of load balance aimed at mitigating further disruptions in the inverter’s output. Focusing next on the photovoltaic voltage and current, during the fault event, the voltage will experience a decrease to 1.49 kV, as shown in Figure 15, while the current will surge to 1.25 kA amidst slight oscillations, as shown in Figure 16. The decline in voltage reflects the overall effect of the fault on the system’s ability to maintain a stable output. However, the increase in current indicates that the PV modules are still contributing energy, perhaps illuminating their resilience and capacity to function under faulty conditions.

4.2. 10 Ohms Fault Resistance Under Double Line to Ground Fault

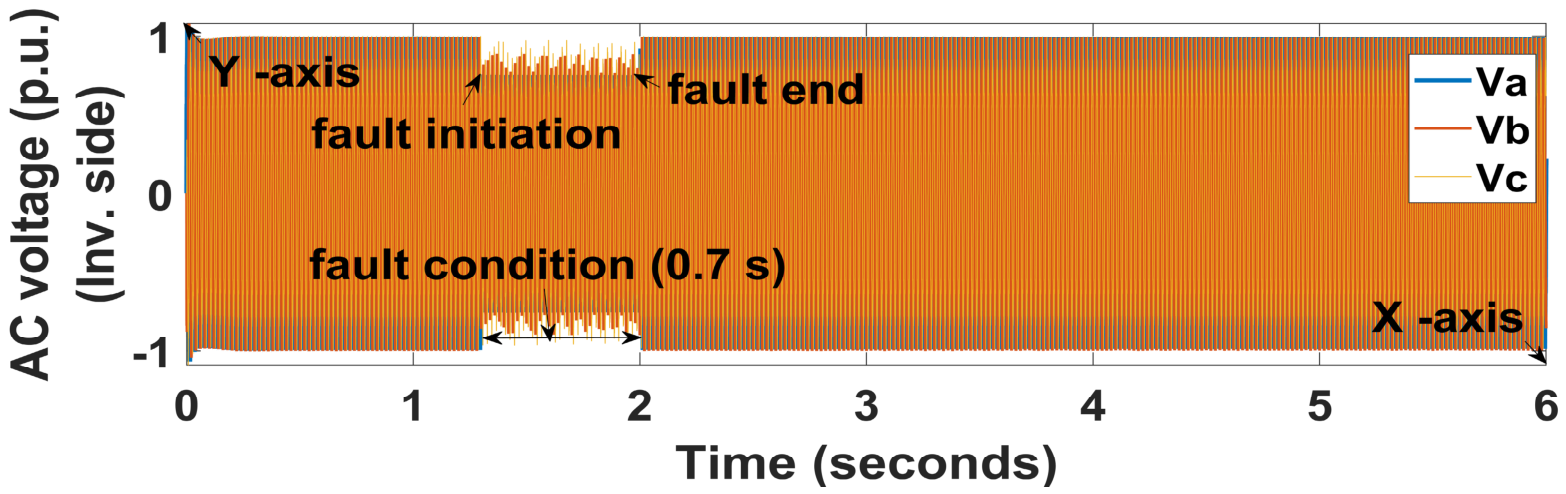
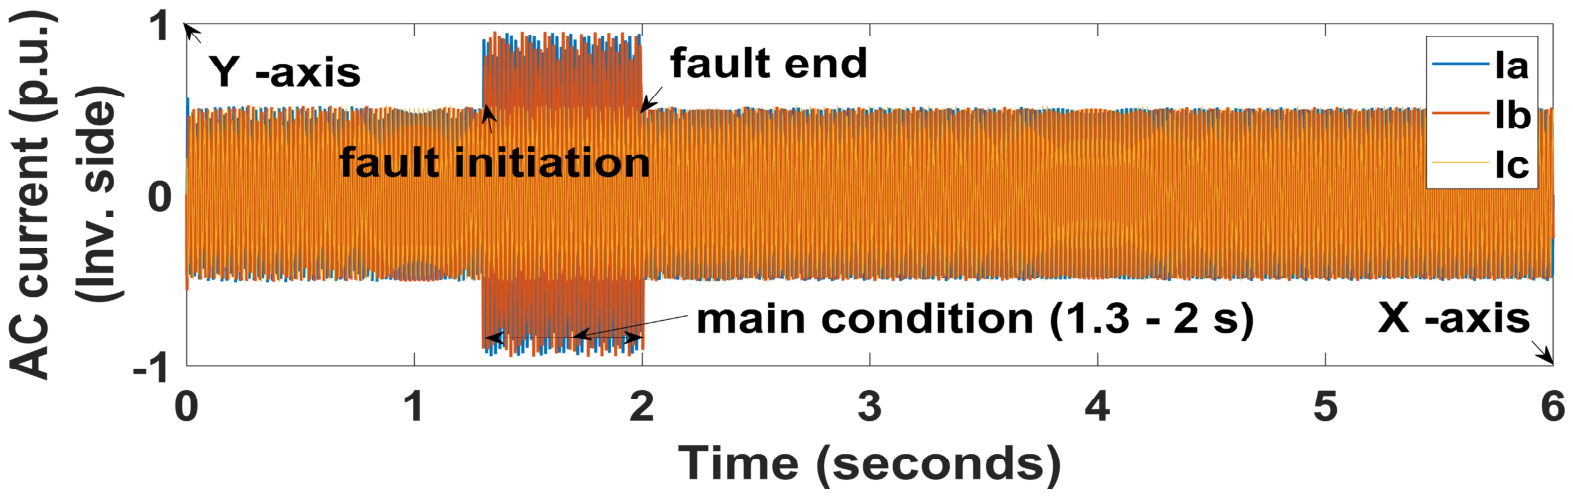
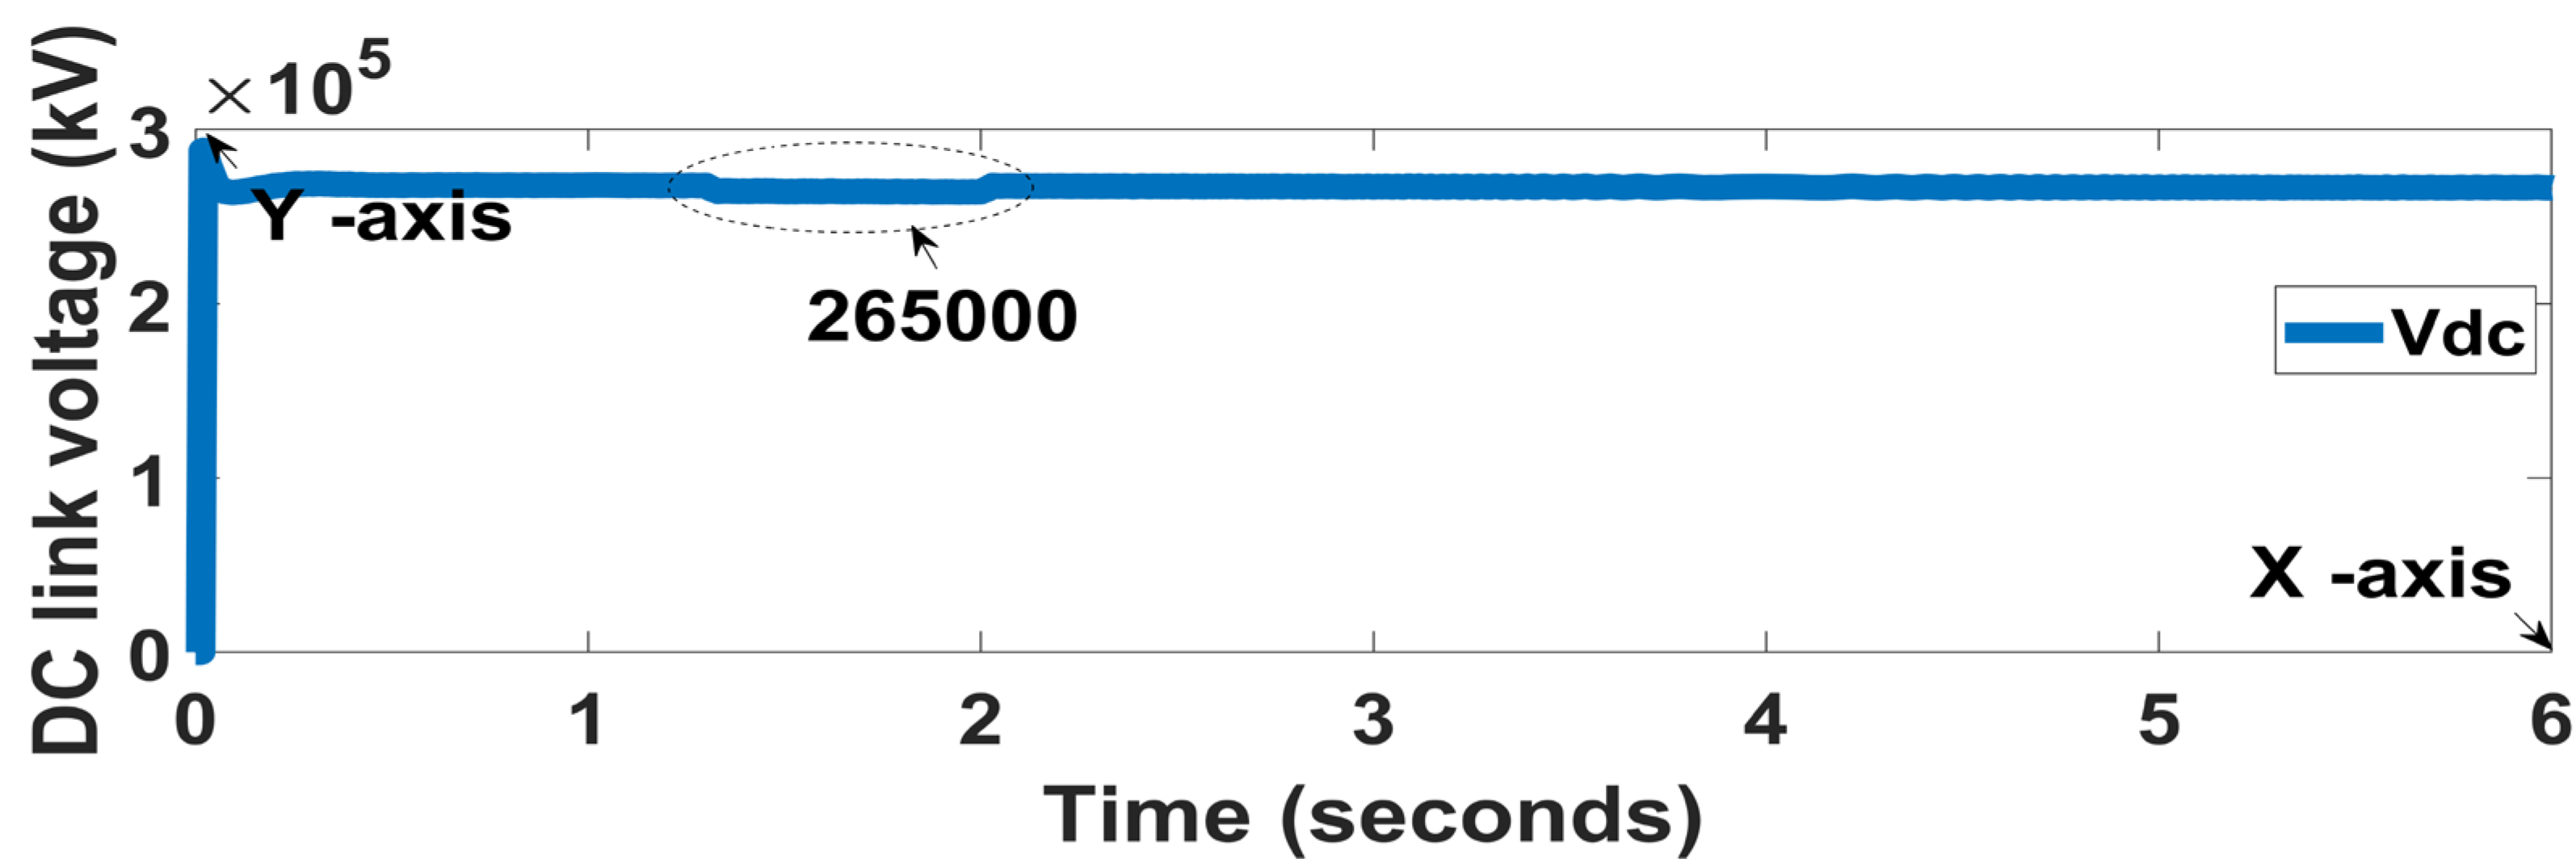
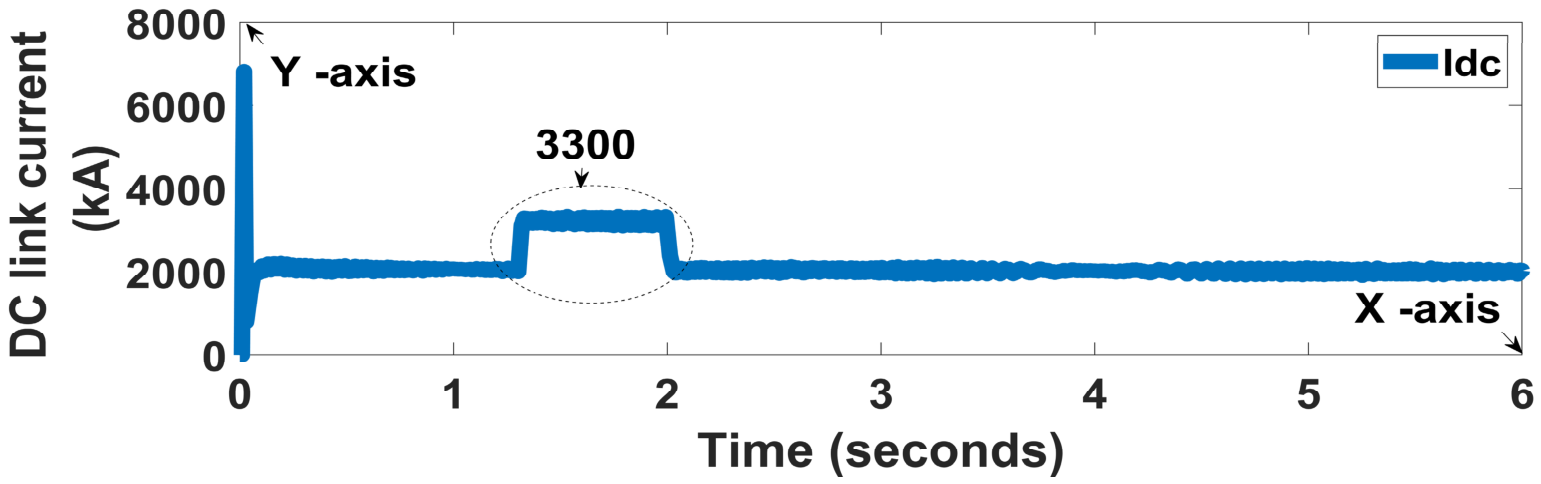
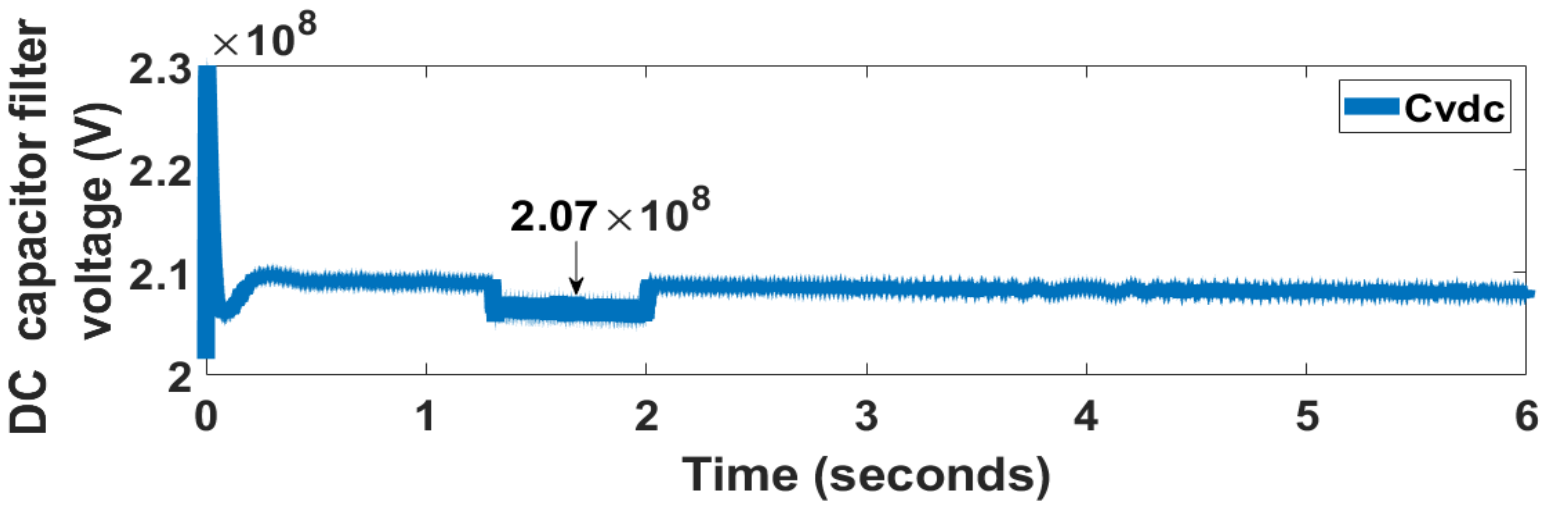
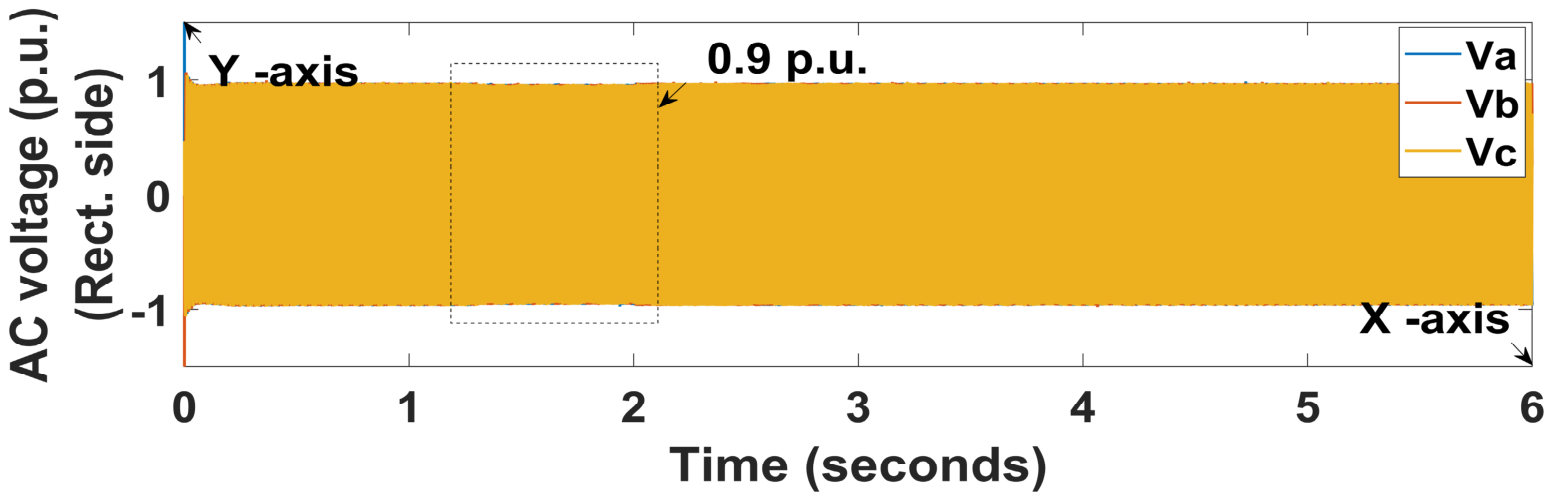
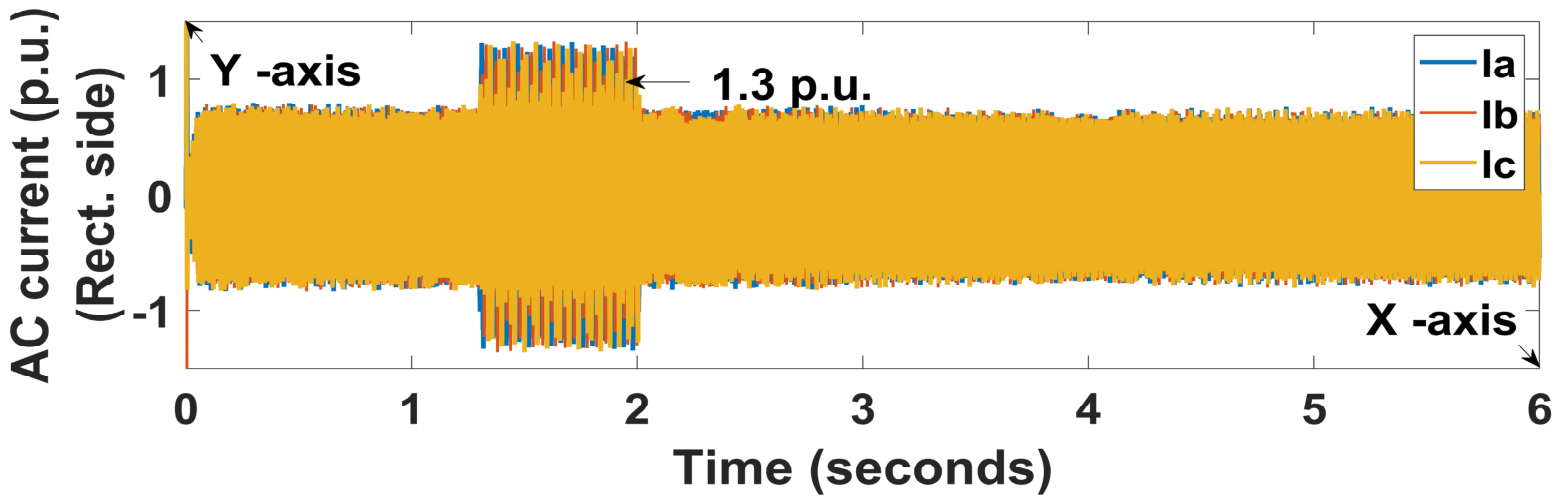
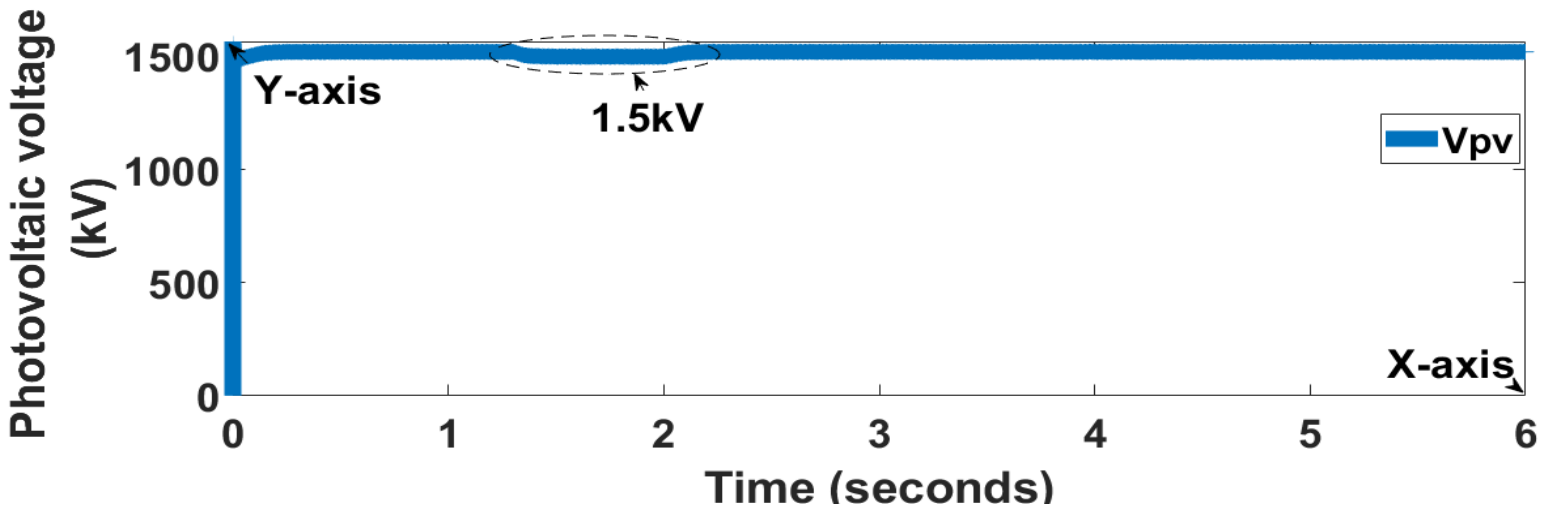
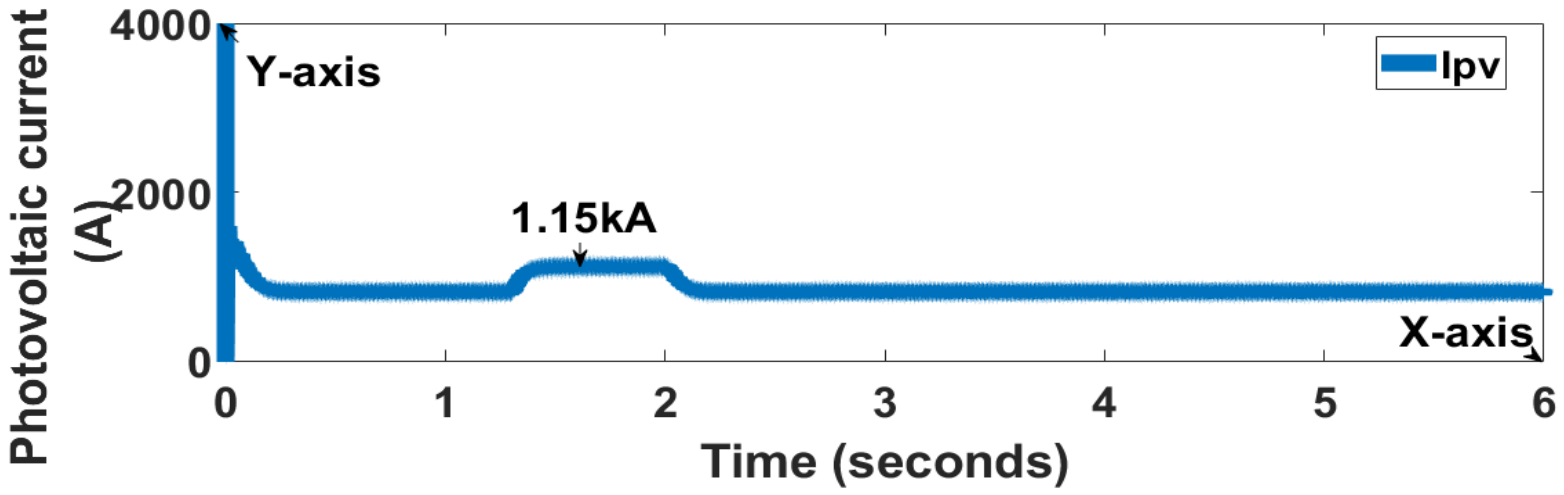
A 10 Ohms fault resistance indicates a relatively low impedance to ground, during which the occurrence of a double line to ground fault at the inverter end presents a notable variation at the duration of 1.3–2 s. The AC voltages for phase A and phase B are observed to decrease to 0.75 p.u. and 0.85 p.u., respectively. Phase C, however, will experience a lesser reduction, stabilizing at 0.95 p.u., as shown in Figure 17. This disparity in voltage behavior among the three phases reflects the imbalance introduced by the fault condition. Moreover, the fault significantly influences the phase currents in the system. In the same scenario, it is noted that the currents for phases A and B will escalate to 0.95 p.u. higher than the AC grid currents during 20 Ohms fault resistance at the inverter end. Conversely, phase C remains unaffected, maintaining a current of 0.5 p.u., which has the same result as phase C during the 20 Ohms fault resistance, as shown in Figure 18. In tandem with the AC system variations, the response of the HVDC line must also be accounted for during this fault scenario. Notably, the HVDC line voltage will reduce to 2.65 × 10⁵ V with oscillations, as shown in Figure 19. Alongside this, the HVDC current will rise to 3300 A, which is more pronounced than the HVDC current of 20 Ohms fault resistance, again exhibiting slight oscillation, as shown in Figure 20. However, the capacitor filter voltage within the high-voltage direct current transmission line will exhibit a decrease with oscillation, as shown in Figure 21. Upon analyzing the rectifier end, it is also significant to note the reaction of the AC grid voltages and currents under fault conditions. AC grid voltages for all three phases will experience a slight reduction to 0.95 p.u., while the corresponding AC currents will increase to 1.3 p.u., as shown in Figure 22 and Figure 23, respectively. Lastly, the performance of the PV system itself under fault conditions deserves analysis. The PV voltage observed during this fault will diminish slightly to 1.5 kV, while the current will escalate to 1.15 kA, as shown in Figure 24 and Figure 25, respectively. This indicates the ability of the PV system to respond to an external fault while still providing some degree of output, although in a compromised state.

4.3. 5 Ohms Fault Resistance Under Double Line to Ground Fault

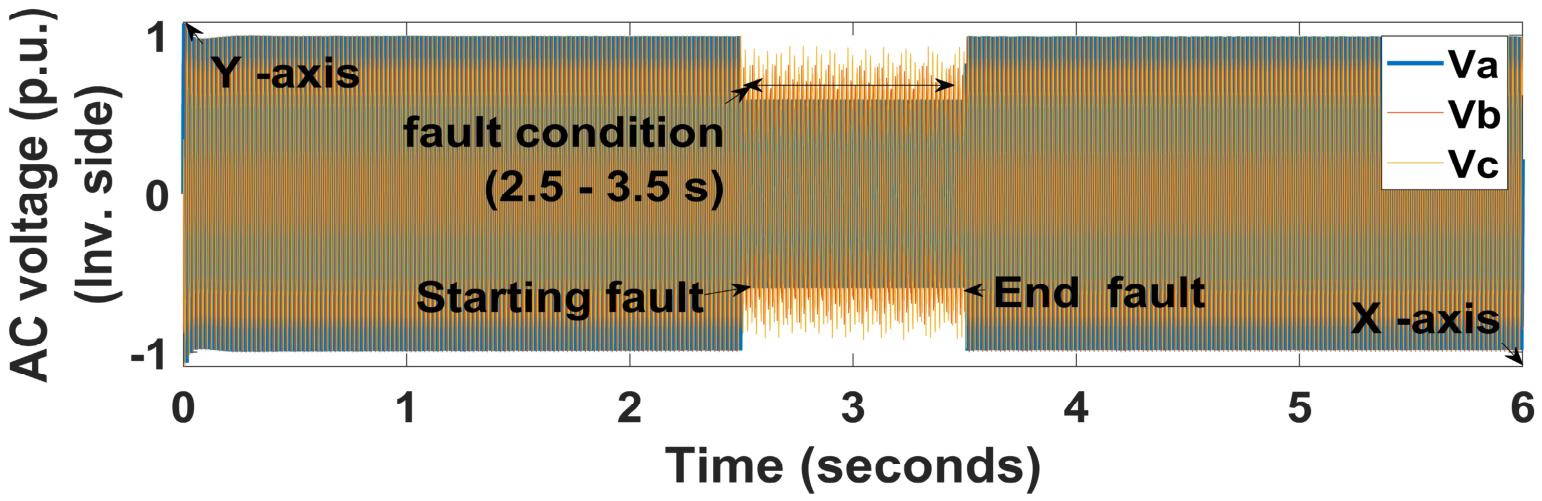
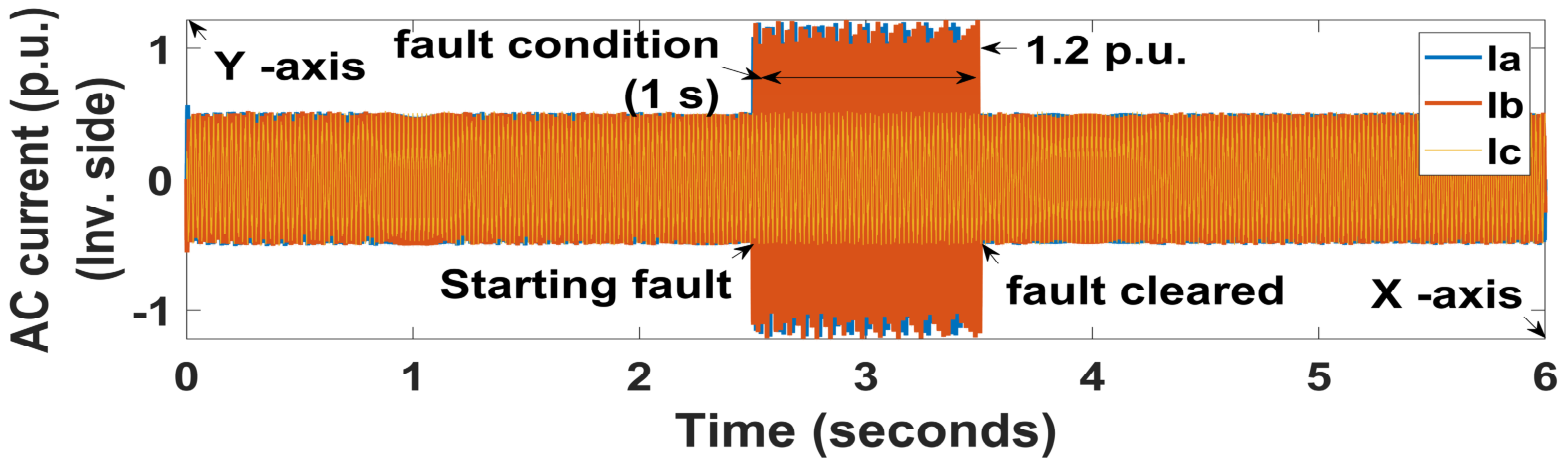
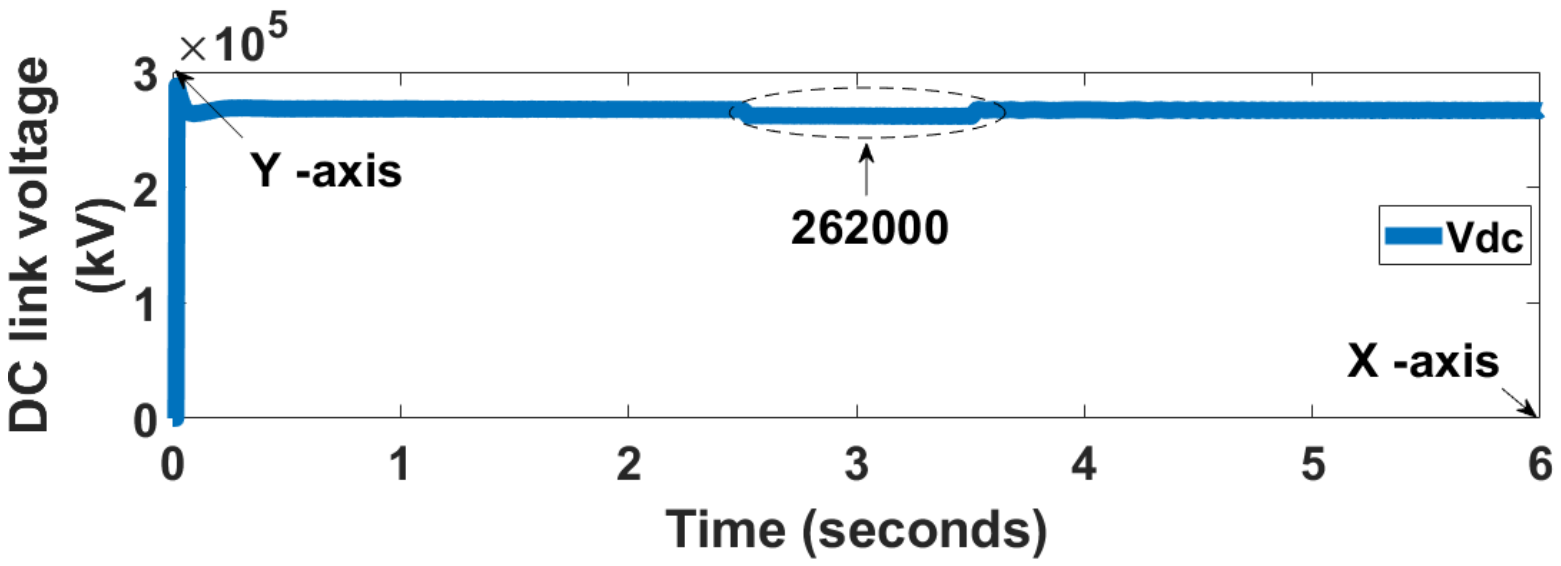
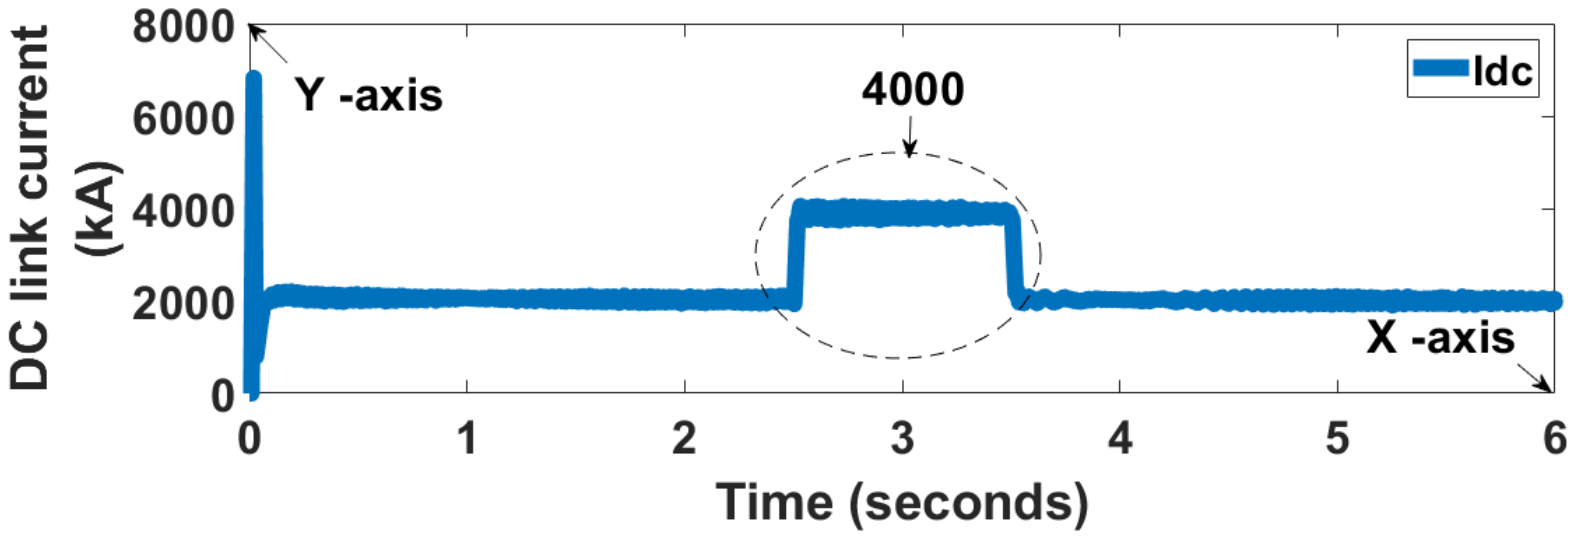
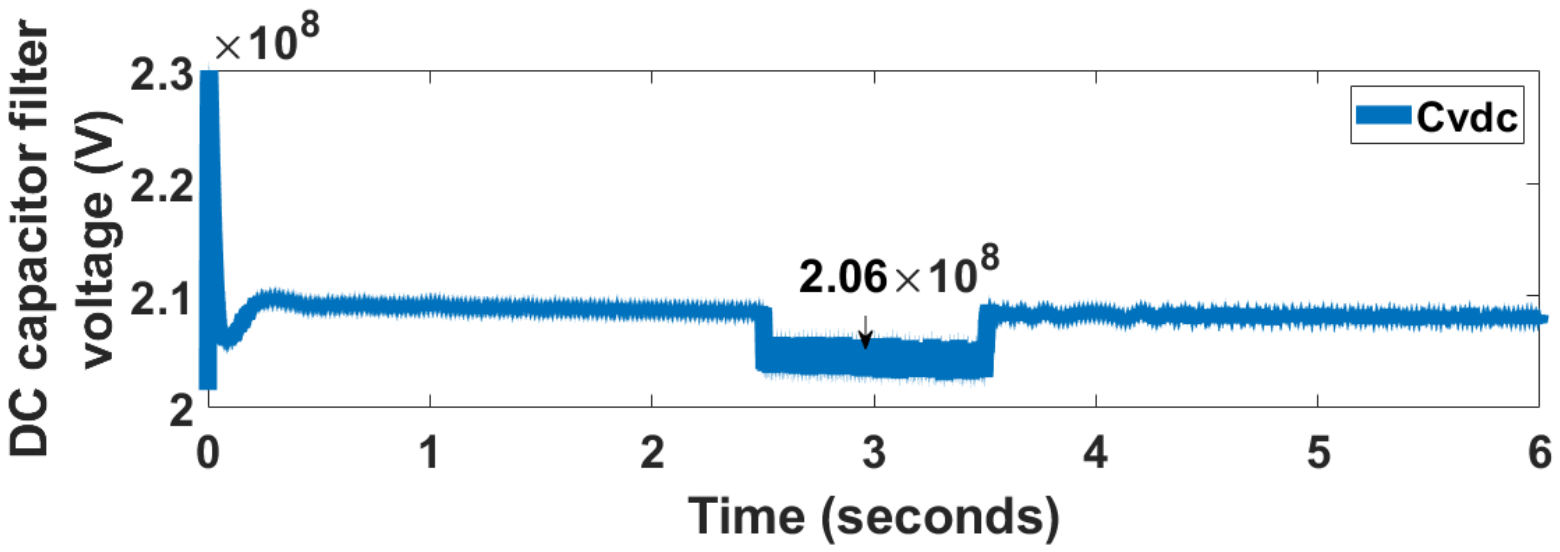
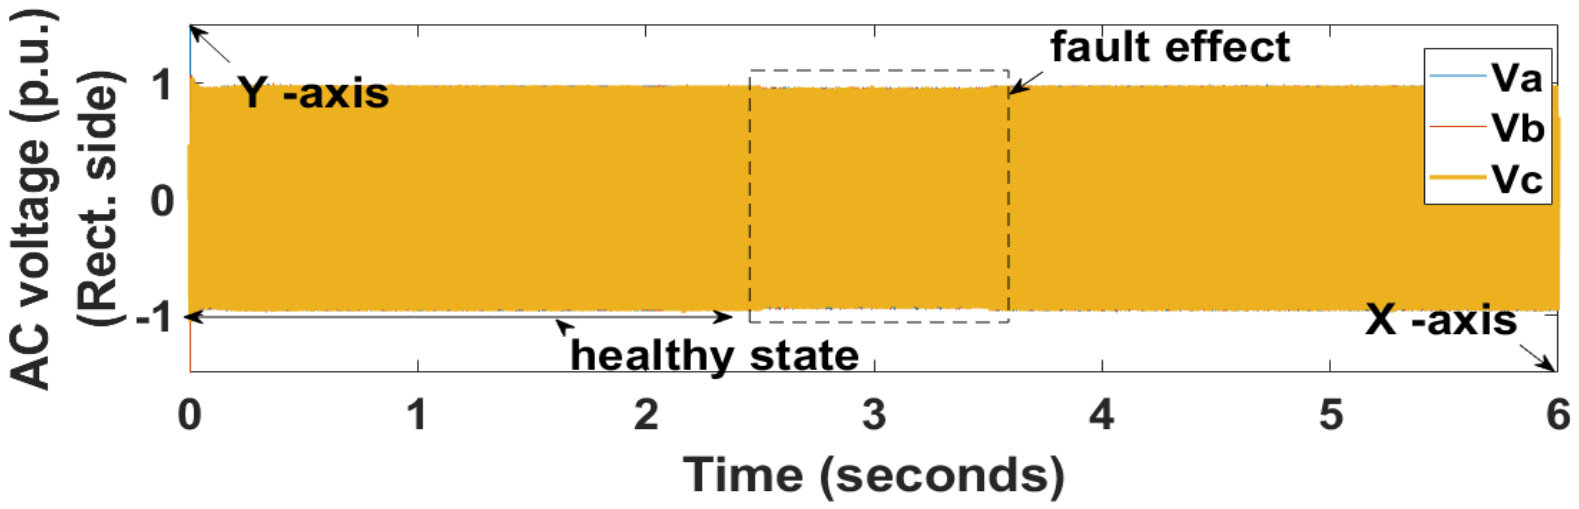
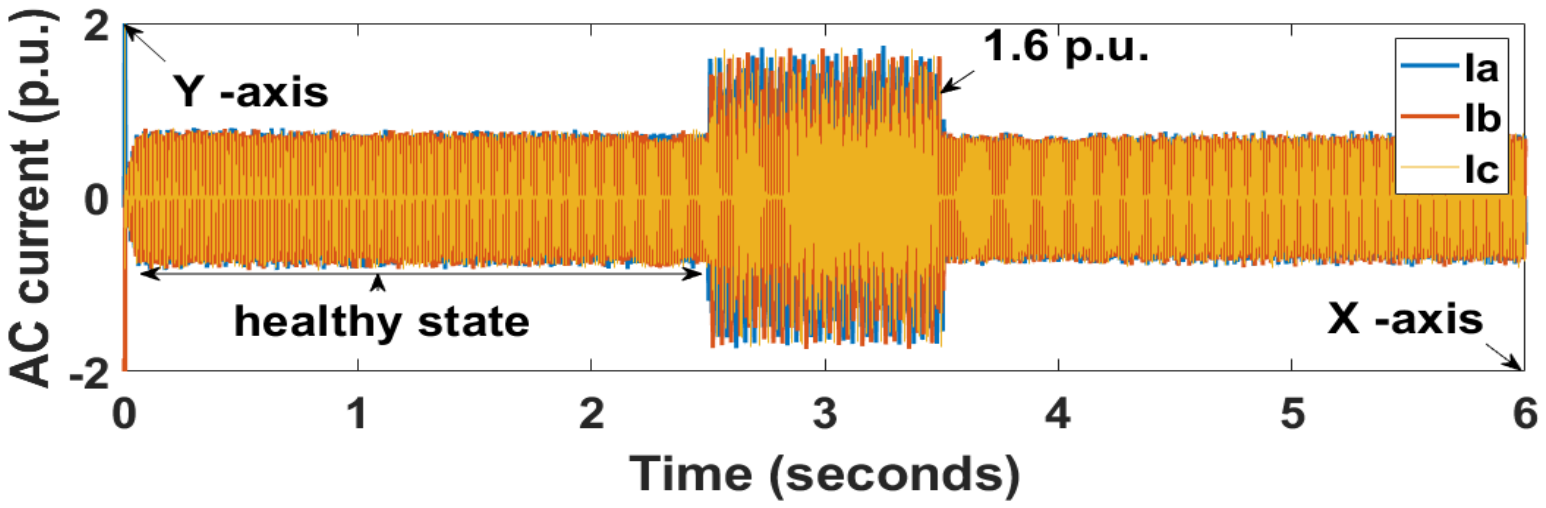
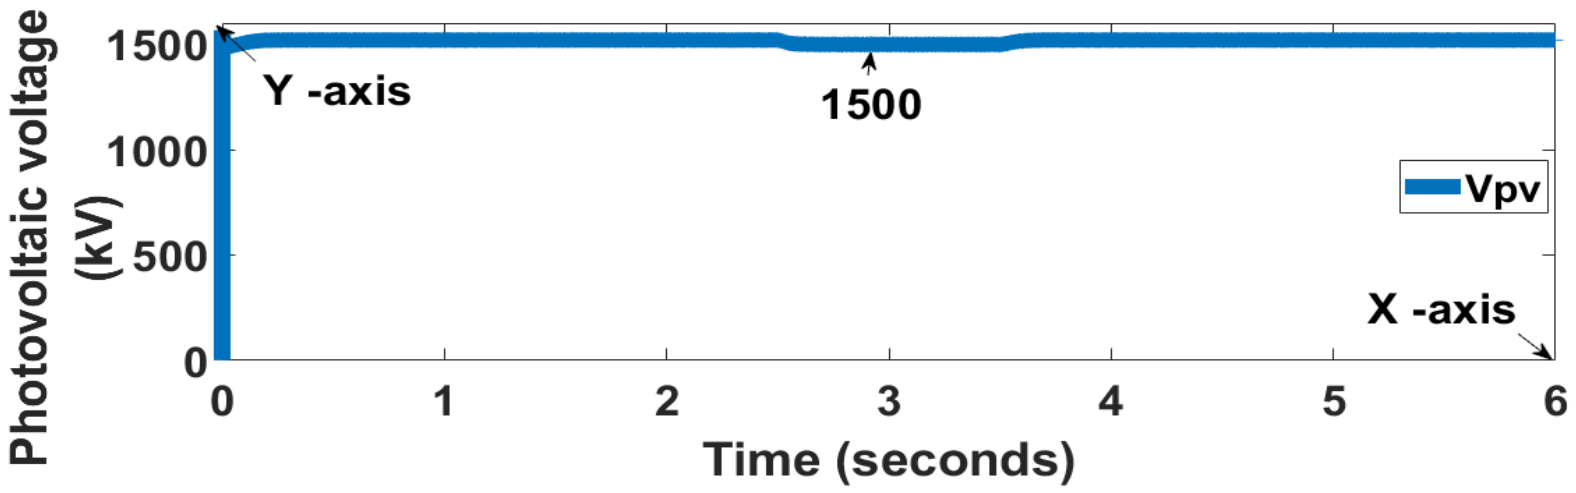
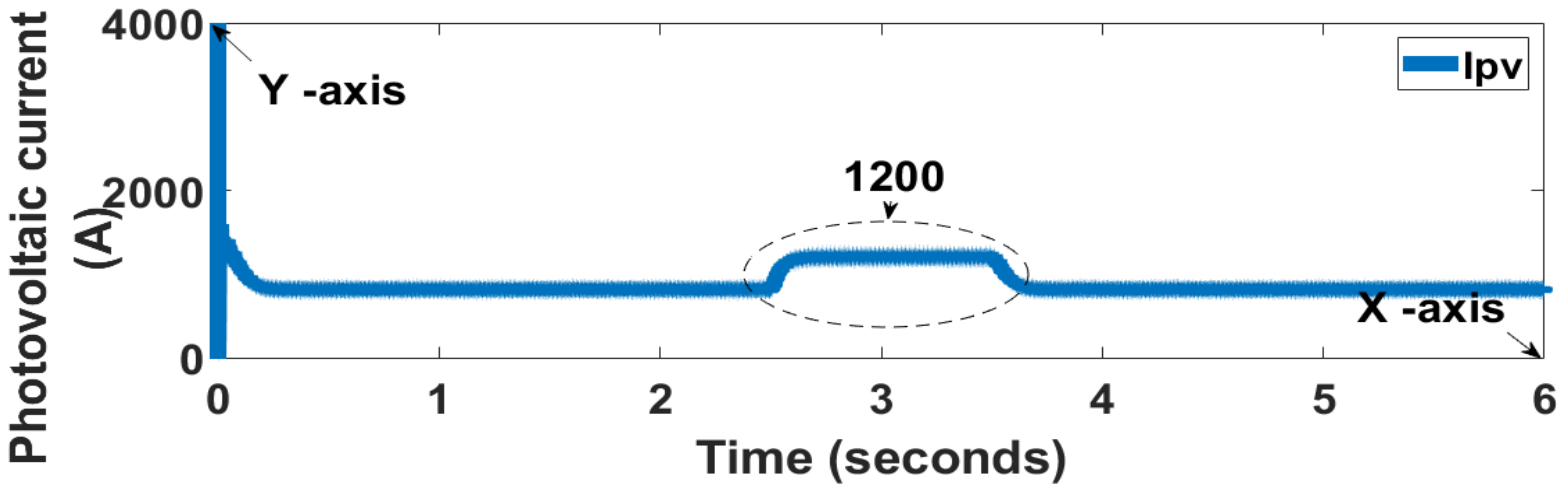
The occurrence of a double line to ground fault at the inverter end of the power system generates a myriad of complex dynamics, particularly when considering a fault resistance of 5 Ohms with a duration of 2.5–3.5 s. In such a fault condition, the phase voltages within the alternating current (AC) grid will manifest varied responses. Specifically, the voltages at phase A and phase B will decline to approximately 0.6 p.u. and 0.8 p.u., respectively. Meanwhile, phase C will experience a reduction, stabilizing at about 0.9 p.u., as shown in Figure 26. This differential voltage response underscores the inherent asymmetries that will arise during fault conditions. Turning the attention to the AC grid currents, the implications of the double line to ground fault become even more pronounced. Both phases A and B are significantly impacted, with their respective currents surging to 1.2 p.u. In contrast, phase C appears largely unaffected; its current will remain steady at 0.5 p.u., illustrating the fault’s selective influence on the grid, as shown in Figure 27. In addition to these observations, the HVDC line voltage will experience considerable alterations during the fault. Under normal conditions, the HVDC line voltage is expected to maintain a level around 2.666 × 10⁵ V. However, during this fault scenario, it will witness a decline to 2.62 × 10⁵ V, as shown in Figure 28. Concurrently, the HVDC current will escalate to 4000 A, as shown in Figure 29, resulting in electrical stresses through the power system infrastructure. Moreover, the capacitor filter voltage within the high-voltage direct current transmission line will exhibit a decrease with oscillation, as shown in Figure 30. At the rectifier end, the ramifications of the fault will extend to the phase voltages of the AC grid. Phases A, B, and C collectively respond to the fault with a minor decrease, stabilizing around 0.95 p.u., as shown in Figure 31. This marginal drop in voltage levels does not appear to disrupt the system but serves to show the interconnected nature of the grid’s various components under fault conditions. Furthermore, the AC currents corresponding to these phases will witness a notable rise, with values increasing to 1.6 p.u., as shown in Figure 32. Besides the effects observed in the AC grid of both inverter and rectifier sides, the performance of photovoltaic systems during a double line to ground fault is also noteworthy. In this case, the voltage originating from the PV array will experience a slight decline to 1.5 kV, as shown in Figure 33, reflecting the impact of the fault on generation sources. However, the photovoltaic current will diverge from the trends previously noted in the AC grid, as it will increase significantly to 1.2 kA, as shown in Figure 34.

5. Conclusions

In this study, a hybrid multiterminal HVDC system integrated with renewable energy sources (photovoltaic system and wind energy conversion system) was modelled and implemented using Matlab/Simulink software to examine the behavior of a double line to ground fault under varying fault resistance values [27]. Understanding the dynamics of these faults is vital for anticipating their effects on the operation and resilience of contemporary electrical power systems. When a double line to ground fault occurs, the resulting impact on system components can lead to substantial challenges, necessitating a thorough analysis of fault characteristics across different resistance levels. It is noted that under the incidence of a double line to ground fault with varying fault resistances, the AC grid voltage in phase A will experience a more pronounced decrease compared to phase B. In contrast, phase C will exhibit only a slight reduction in voltage at the inverter end. Moreover, at the inverter end of the hybrid system, it is submitted that the AC grid currents for the affected phases, specifically phases A and B, will experience an increase. Phase C, however, will maintain a relatively stable condition, without increasing or decreasing during faulty events. On analyzing the rectifier end of the system, it is also shown that the results indicated a slight decrease in the AC grid voltages across all three phases. Specifically, voltage reductions of approximately 0.05 per unit are observed. For the AC grid currents, phases A, B, and C will tend to rise in response to the fault, reinforcing the complex interplay between voltage and current dynamics during fault conditions in hybrid multiterminal HVDC systems.

Author Contributions

Conceptualization, O.I., E.E.O. and M.K.; Methodology, O.I., E.E.O. and M.K.; Software O.I., E.E.O. and M.K.; Validation, O.I., E.E.O. and M.K.; Formal analysis, O.I., E.E.O. and M.K.; Investigation, O.I., E.E.O. and M.K.; Resources, O.I., E.E.O. and M.K.; Data curation, O.I., E.E.O. and M.K.; Writing—original draft, O.I.; Writing—review and editing, O.I., E.E.O. and M.K.; Visualization, O.I., E.E.O. and M.K.; Supervision, O.I., E.E.O. and M.K.; Project administration, O.I., E.E.O. and M.K.; Funding acquisition, E.E.O. All authors have read and agreed to the published version of the manuscript.

Funding

This is funded by Durban University of Technology (DUT), directorate for research and postgraduate support.

Data Availability Statement

The contributions outlined in this study are detailed within the article. For additional questions, please reach out to the corresponding author.

Conflicts of Interest

The authors declare no conflicts of interest.

References

  1. Abbood, S.F. Hierarchical AI Control and Protection for Renewable Integrated MTDC Grids: Pengendalian dan Perlindungan AI Hierarkis untuk Jaringan MTDC Terintegrasi Energi Terbarukan. Acad. Open 2026, 11. [Google Scholar] [CrossRef]
  2. Bassey, K.E. Hybrid renewable energy systems modeling. Eng. Sci. Technol. J. 2023, 4, 571–588. [Google Scholar] [CrossRef]
  3. Deshmukh, M.K.; Deshmukh, S.S. Modeling of hybrid renewable energy systems. Renew. Sustain. Energy Rev. 2008, 12, 235–249. [Google Scholar] [CrossRef]
  4. Sahraoui, H.; Mellah, H.; Maafa, A.; Yahiou, A.; Drid, S.; Chrifi-Alaoui, L. Management and Control of Hybrid System WIND-PV Systems Integrated to the VSC-HVDC Grid. Eurasia Proc. Sci. Technol. Eng. Math. 2023, 26, 430–438. [Google Scholar]
  5. Hossain, M.I.; Shafiullah, M.; Al-Sulaiman, F.A.; Abido, M.A. Comprehensive analysis of PV and wind energy integration into MMC-HVDC transmission network. Sustainability 2022, 15, 253. [Google Scholar] [CrossRef]
  6. Iqbal, N.; Aswathy Vidyasagar, D.J.C. HVDC Interconnections with SMES Device for PV and Wind Hybrid Power Transmission System. Ijraset J. Res. Appl. Sci. Eng. Technol. 2022, 10. [Google Scholar] [CrossRef]
  7. Ghosh, A. Power System Fault Analysis. In Modern Power System; IEEE: Piscataway, NJ, USA, 2026; pp. 161–222. [Google Scholar] [CrossRef]
  8. Thakur, S.; Gupta, A.; Sharma, K.K. Automated fault detection and stability assessment using a eleven-level multi-level inverter for a grid-interfaced photovoltaic system. Res. Sq. 2026. [Google Scholar] [CrossRef]
  9. Mohapatra, S.P.; Dash, P.K.; Bisoi, R. Enhanced fault tolerance in DFIG system using an advanced active disturbance rejection control strategy. Discov. Appl. Sci. 2026, 8, 126. [Google Scholar] [CrossRef]
  10. Alam, M.S.; Jena, P. Adaptive Fault Detection and Communication-Based Fault Isolation in BSS to Prevent EV Battery Discharge. IEEE Trans. Ind. Electron. 2026, 1–13. [Google Scholar] [CrossRef]
  11. Liu, K.; Li, B.; Jiang, Q.; Zhang, Y.; Liu, T. Fault ride-through strategy for hybrid cascaded HVDC systems based on controllable LCC. IEEE Trans. Circuits Syst. II Express Briefs 2025, 73, 88–92. [Google Scholar]
  12. Yang, S.; Liu, Q.; Lu, Z.; Qiu, J. Study on the Power Transmission Capacity of Wind-Photovoltaic-Thermal Power Bundled MMC-HVDC Transmission System. In 2024 4th International Conference on Energy, Power and Electrical Engineering (EPEE); IEEE: Piscataway, NJ, USA, 2024; pp. 121–127. [Google Scholar]
  13. Zhang, Y.; Ravishankar, J.; Fletcher, J.; Li, R.; Han, M. Review of modular multilevel converter based multi-terminal HVDC systems for offshore wind power transmission. Renew. Sustain. Energy Rev. 2016, 61, 572–586. [Google Scholar] [CrossRef]
  14. Tang, C.; Li, Y.; Li, H.; Liu, R.; Liu, Z.; Pan, X.; Yang, Q.; Xiao, H. Coordinated Inertia Support Strategy for Offshore Wind Power-Integrated MMC-HVDC System. Electronics 2026, 15, 1063. [Google Scholar] [CrossRef]
  15. Xu, M.; Wu, L.; Liu, H.; Wang, X. Multi-objective optimal scheduling strategy for wind power, PV and pumped storage plant in VSC-HVDC grid. J. Eng. 2019, 2019, 3017–3021. [Google Scholar] [CrossRef]
  16. Zidi, S.-A.; Hadjeri, S.; Fellah, M.K. The performance analysis of an HVDC link. Texничecкaя Aкycmикa 2004, 4, 108–116. [Google Scholar]
  17. Li, G.; Li, C.; Van Hertem, D. HVDC technology overview. In HVDC Grids: For Offshore and Supergrid of the Future; IEEE: Piscataway, NJ, USA, 2016; pp. 45–78. [Google Scholar]
  18. Yang, Z.-C. PI-based simulation modeling for performance testing of the power transmission line. Energy 2024, 301, 131753. [Google Scholar] [CrossRef]
  19. Elkelawy, M.; Mohamed, A.E.; Seleem, H.E. Optimizing photovoltaic power plant efficiency: A comprehensive study on design, implementation, and sustainability. Pharos Eng. Sci. J. 2025, 2, 12–22. [Google Scholar] [CrossRef]
  20. Israr, M. A Review of Electrical Energy Generation Using Solar Power. J. Recent Trends Electr. Eng. 2025, 1, 5–11. [Google Scholar] [CrossRef]
  21. Seghrouchni, Y.; Yessef, M.; Motahhir, S.; Bossoufi, B.; Alqahtani, S.A.; El-Barbary, Z. V-Model Design and Experimental Validation for Robust Direct Power Control of Wind Energy Conversion Systems. IEEE Access 2026, 14, 32308–32325. [Google Scholar] [CrossRef]
  22. Biyikli, H.M.; Bayrak, M.; Yiğit, C.; Yeğin, E.M. A Novel Adaptive Pitch Angle Control to Enhance Wind Farm Power Management. Teh. Vjesn. 2026, 33, 549–554. [Google Scholar]
  23. Wan, A.; Gong, W.; Iqbal, A.; AL-Bukhaiti, K.; Ji, Y.; Duer, S.; Ma, S.; Yao, F. Robust loop shaping design pitch control of wind turbine for maximal power output and reduced loading. Energy 2025, 319, 135136. [Google Scholar] [CrossRef]
  24. Zhang, J.-Y.; Zhou, Q.; Wang, K. Dual three-phase permanent magnet synchronous machines vector control based on triple rotating reference frame. Energies 2022, 15, 7286. [Google Scholar] [CrossRef]
  25. Alanazi, A.; Marjanovic, O. Performance Comparison of PLL Techniques for Grid-Connected Inverters. In 2025 IEEE 16th International Symposium on Power Electronics for Distributed Generation Systems (PEDG); IEEE: Piscataway, NJ, USA, 2025; pp. 98–103. [Google Scholar]
  26. Khavaninzadeh, M.; Nahavandi, R.; Moti, M. A Model Reference Adaptive Control System for Phase-Locked Loop (PLL) in Grid-Connected Power Systems. In 2025 11th International Conference on Control, Instrumentation and Automation (ICCIA); IEEE: Piscataway, NJ, USA, 2025; pp. 1–6. [Google Scholar]
  27. Balamurali, V.; Balachander, K. MATLAB/Simulink study and implemetation of fault identification of ehv lines using wavelet transform based FLC. Int. J. Psychosoc. Rehabil. 2020, 23, 1866. [Google Scholar]
  28. Solatialkaran, D.; Zare, F.; Saha, T.K.; Sharma, R. A novel approach in filter design for grid-connected inverters used in renewable energy systems. IEEE Trans. Sustain. Energy 2018, 11, 154–164. [Google Scholar] [CrossRef]
  29. Parikshith, B. Integrated Approach to Filter Design for Grid Connected Power Converters. Master’s Thesis, Indian Institute of Science, Bangalore, India, 2009. [Google Scholar]
  30. Alrajhi, H.; Raza, S.A.; Babsail, H.; Alattas, A. Design, analysis and comprehensive assessment of LCL filters for VSC applications. J. Umm Al-Qura Univ. Eng. Archit. 2025, 16, 559–573. [Google Scholar] [CrossRef]
  31. Zhang, X.; Sun, J.; Zhou, Z.; Kang, Z.; Yao, W.; Kerekes, T.; Zhang, X.; Zhou, D. Evaluating the Reliability Degradation Caused by Resonant Current in Photovoltaic Inverters with LCL Filters. IEEE Trans. Ind. Appl. 2025, 62, 2869–2880. [Google Scholar] [CrossRef]
  32. Khaliq, A.; Zahloul, H.; Hamzehbahamani, H.; Salous, S. Optimized Design of LCL Filter for Grid Tied Inverters with Deployment of Large-Scale Grid Connected PV System for Harmonics Compensation and Stable Operation Under Sudden Changes in Weather Conditions. IEEE Access 2025, 13, 171327–171347. [Google Scholar] [CrossRef]
  33. Aluge, K.A.; Šedivý, T.; Drápela, J. Development of PI-Section-Based Model of Transmission Overhead Line for Disturbance Propagation Studies. In 2025 25th International Scientific Conference on Electric Power Engineering (EPE); IEEE: Piscataway, NJ, USA, 2025; pp. 1–6. [Google Scholar]
  34. Khatir, M.; Zidi, S.; Hadjeri, S.; Fellah, M.K. Comparison of HVDC line models in PSB/SIMULINK based on steady-state and transients considerations. Acta Electrotech. Inform. 2008, 8, 50–55. [Google Scholar]
Figure 1. Diagram of the system under study.
Energies 19 02577 g001
Figure 2. The proposed diagram of the pitch angle.
Energies 19 02577 g002
Figure 3. Proposed control for voltage source converter at the inverter side.
Energies 19 02577 g003
Figure 4. Proposed fault switch timer for phase A.
Energies 19 02577 g004
Figure 5. Proposed fault switch timer for phase B.
Energies 19 02577 g005
Figure 6. The Matlab function of the turbine model.
Energies 19 02577 g006
Figure 7. Circuit of the hybrid multiterminal HVDC network.
Energies 19 02577 g007
Figure 8. Simulation result of AC grid voltages at inverter end during 20 Ohms fault resistance under double line to ground fault that occurred at the inverter end.
Energies 19 02577 g008
Figure 9. Result of AC grid currents at the inverter end during 20 Ohms fault resistance under double line to ground fault that occurred at the inverter end.
Energies 19 02577 g009
Figure 10. DC voltage during 20 Ohms fault resistance under double line to ground fault that occurred at the inverter end.
Energies 19 02577 g010
Figure 11. DC current during 20 Ohms fault resistance under double line to ground fault that occurred at the inverter end.
Energies 19 02577 g011
Figure 12. DC capacitor filter during 20 Ohms fault resistance under double line to ground fault that occurred at the inverter end.
Energies 19 02577 g012
Figure 13. AC voltage at the rectifier end during 20 Ohms fault resistance under double line to ground fault that occurred at the inverter end.
Energies 19 02577 g013
Figure 14. AC current at the rectifier end during 20 Ohms fault resistance under double line to ground fault that occurred at the inverter end.
Energies 19 02577 g014
Figure 15. Photovoltaic voltage during 20 Ohms fault resistance under double line to ground fault that occurred at the inverter end.
Energies 19 02577 g015
Figure 16. Photovoltaic current during 20 Ohms fault resistance under double line to ground fault that occurred at the inverter end.
Energies 19 02577 g016
Figure 17. AC grid voltages at the inverter end during 10 Ohms fault resistance under double line to ground fault that occurred at the inverter end.
Energies 19 02577 g017
Figure 18. AC grid current at the end during 10 Ohms fault resistance under double line to ground fault that occurred at the inverter end.
Energies 19 02577 g018
Figure 19. DC voltage during 10 Ohms fault resistance under double line to ground fault that occurred at the inverter end.
Energies 19 02577 g019
Figure 20. DC current during 10 Ohms fault resistance under double line to ground fault that occurred at the inverter end.
Energies 19 02577 g020
Figure 21. DC capacitor filter during 10 Ohms fault resistance under double line to ground fault that occurred at the inverter end.
Energies 19 02577 g021
Figure 22. AC voltage at the rectifier end during 10 Ohms fault resistance under double line to ground fault that occurred at the inverter end.
Energies 19 02577 g022
Figure 23. AC current at the rectifier end during 10 Ohms fault resistance under double line to ground fault that occurred at the inverter end.
Energies 19 02577 g023
Figure 24. Photovoltaic voltage during 10 Ohms fault resistance under double line to ground fault that occurred at the inverter end.
Energies 19 02577 g024
Figure 25. Photovoltaic current during 10 Ohms fault resistance under double line to ground fault that occurred at the inverter end.
Energies 19 02577 g025
Figure 26. AC voltage at the inverter end during 5 Ohms fault resistance under double line to ground fault that occurred at the inverter end.
Energies 19 02577 g026
Figure 27. AC current at the inverter end during 5 Ohms fault resistance under double line to ground fault that occurred at the inverter end.
Energies 19 02577 g027
Figure 28. DC voltage during 5 Ohms fault resistance under double line to ground fault that occurred at the inverter end.
Energies 19 02577 g028
Figure 29. DC current during 5 Ohms fault resistance under double line to ground fault that occurred at the inverter end.
Energies 19 02577 g029
Figure 30. DC capacitor filter during 5 Ohms fault resistance under double line to ground fault that occurred at the inverter end.
Energies 19 02577 g030
Figure 31. AC grid voltage at the rectifier end during 5 Ohms fault resistance under double line to ground fault that occurred at the inverter end.
Energies 19 02577 g031
Figure 32. AC grid currents at the rectifier end during 5 Ohms fault resistance under double line to ground fault that occurred at the inverter end.
Energies 19 02577 g032
Figure 33. Photovoltaic voltage during 5 Ohms fault resistance under double line to ground fault that occurred at the inverter end.
Energies 19 02577 g033
Figure 34. Photovoltaic current during 5 Ohms fault resistance under double line to ground fault that occurred at the inverter end.
Energies 19 02577 g034
Table 1. System simulation model parameters.
ParametersValuesUnit
Photovoltaic solar array
Maximum power550W
Open circuit voltage50V
Voltage at maximum power point40V
Temperature coefficient of open circuit voltage−0.28%/°C
Cells per module144-
Temperature coefficient of short circuit current0.048%/°C
Series connected modules per string27-
Parallel strings67-
Wind energy conversion system
Mechanical power202MW
Rated voltage13.8kV
Frequency60Hz
Pole(s)6-
LCL filter
Capacitance5.480µF
Inductance22.02mH
Damping resistors12
PI section line
Capacitance0.0077µF/km
Inductance1.44mH/km
Resistance0.0233Ω/km
Cable length1000km
DC link voltage 266kV
DC link current2023A
Discrete PID controller
Proportional gain67-
Integral gain5500-
Derivative gain0-
Low pass filter1.088-
Disclaimer/Publisher’s Note: The statements, opinions and data contained in all publications are solely those of the individual author(s) and contributor(s) and not of MDPI and/or the editor(s). MDPI and/or the editor(s) disclaim responsibility for any injury to people or property resulting from any ideas, methods, instructions or products referred to in the content.