1. Introduction
Electric vehicles have received more attention in the automotive industry due to their eco-friendly operation and high fuel economy. In particular, since public transportation is largely responsible for greenhouse gas emissions, electric city buses are being used all around the world. Even though electric buses significantly contribute to the reduction in greenhouse gas emissions, seasonal dependence on fuel economy is still a barrier to be resolved. Electric city buses experience significant mileage reduction due to HVAC operation for thermal comfort. Particularly in cold-weather environments, the battery performance is not only significantly degraded, but the cabin heating system also requires more energy to maintain thermal comfort with a wide temperature difference between ambient air and cabin air [
1,
2].
Different from passenger vehicles, public buses require frequent passenger boarding and alighting, which makes it difficult to maintain cabin thermal comfort. As a result, HVAC operation in electric buses can lead to substantial parasitic power consumption, reducing the driving range by approximately 20–70% depending on heating conditions [
3,
4]. Furthermore, battery performance degradation under low-temperature environments exacerbates this issue. Experimental results have shown that at −18 °C, the charging capacity decreases by 51.7%, the discharging efficiency by 23.0%, and the driving range by as much as 77.2% compared with ambient temperature [
5]. Lithium-ion batteries not only experience a decrease in capacity and power density at low temperatures but also face an increased risk of damage [
1,
6]. This temperature sensitivity negatively impacts the overall efficiency of electric vehicles and the user experience, with performance degradation in low-temperature environments being recognized as a major challenge for electric vehicles [
7,
8,
9]. The fuel economy of a battery electric bus is then strongly coupled with the seasonal atmospheric environment. Hence, a key technology of the battery electric bus is meant to extend fuel economy by enhancing the performance of the HVAC or by adopting an auxiliary power source for the HVAC.
When a battery electric bus is designed to improve fuel economy, an auxiliary power source is a solution to operate the HVAC without consumption of the main power. A range-extended electric vehicle (REEV) is a concept to extend the driving range of the electric vehicle with an auxiliary power source [
10,
11,
12]. The hybrid engine system is one candidate for the REEV that has advanced technology in the hybrid system. Even though the engine hybrid REEVs possess very attractive features in performance, the hybrid engine REEV does not fully align with the goal of zero carbon emissions that electric vehicles aim to achieve [
13,
14]. On the other hand, Zhang et al. reported a range-extended battery electric passenger car with an auxiliary fuel cell power source for the heat pump. The coefficient of performance (COP) of HVAC and vehicle driving range can be significantly improved to ensure thermal comfort [
15].
Although the concept of fuel cell-based REEVs has received relatively limited attention in the literature, studies on fuel cell hybrid electric vehicles provide useful insights that can be extended to REEV configurations [
16,
17,
18,
19,
20]. Most of these works, however, have focused on cases where the fuel cell serves as the primary power source. In comparison, research explicitly addressing the auxiliary role of fuel cells to extend the range of battery electric buses is still limited, underscoring the need for further investigation into REEV architectures and energy management strategies.
As mentioned previously, public buses face greater challenges in maintaining cabin thermal comfort due to frequent passenger boarding and alighting, frequent stop-and-go driving patterns, and large cabin volumes. To address these challenges, various thermal management strategies have been employed. Internal combustion engine (ICE) buses typically utilize waste heat extracted from the engine coolant for cabin heating, which provides effective heating without additional energy consumption [
21,
22]. However, this approach is increasingly limited by its incompatibility with global carbon-neutrality objectives, and the available heat becomes unstable under low engine load conditions. In contrast, battery electric buses (BEBs) offer a zero-emission solution but rely on energy-intensive electric resistance heating, which significantly reduces driving range in cold environments [
23,
24]. Although some BEBs employ heat pumps, their coefficient of performance (COP) drops significantly in sub-zero temperatures [
25,
26]. More recently, research has moved toward integrated management that considers both thermal behavior and system health to extend longevity [
27,
28]. For instance, new paradigms suggest that managing the heat of the energy sources and the cabin together can significantly improve overall vehicle economy and life [
29]. Unlike these conventional approaches, PEMFC-based thermal integration provides a carbon-neutral alternative with fundamentally different thermal characteristics. The PEMFC operates at a relatively low temperature range (60–80 °C), generating limited and load-dependent waste heat. Therefore, effective utilization of this mid-grade heat requires active coordination with the electrical energy management system. By strategically allocating the available thermal energy to offset high-voltage PTC heater demand, the FC-REEB can reduce battery power consumption, maintain SOC levels, and extend driving range. This approach represents a more advanced and sustainable thermal–electrical integration strategy compared to traditional ICE-based waste heat recovery.
To evaluate the range extension with an auxiliary power generator, it is necessary to understand vehicle-level performance with the operation of a thermal comfort system. As the fuel cell is considered an auxiliary power source, the operation mode of the fuel cell should be evaluated to enhance the fuel economy of the battery electric bus. Various modeling studies have been conducted on battery electric passenger cars, fuel cell passenger cars, and fuel cell hybrid systems; however, research that explicitly investigates the auxiliary role of fuel cells in BEBs, particularly under cold climates with significant HVAC loads, remains limited. This clear research gap underscores the novelty and necessity of the present study. The battery electric vehicle has been studied with various modeling approaches. Doyle and Newman [
30] and Gomadam et al. [
31] established mathematical models for predicting the behavior of lithium-ion and polymer-based batteries under different conditions. Building on these works, Sakile et al. [
32] and Inoue et al. [
33] developed Simulink-based models for EV applications, enabling accurate prediction of state-of-charge (SOC) and vehicle energy consumption. More recently, Kumar et al. [
34] provided a comprehensive review of advanced battery management systems (BMS), including monitoring, protection, and thermal management functions for EV batteries. These studies offer a solid foundation for understanding battery characteristics, but they focus mainly on standalone batteries rather than fuel cell–battery integrated systems.
Since it is crucial to evaluate the operation of the fuel cell system, many modeling approaches have been introduced. Amphlett et al. [
35] proposed one of the earliest mechanistic PEMFC models, while Schumann et al. [
36] implemented parameterized fuel cell models using experimental validation. Woo et al. [
37] analyzed cooling-system configurations for dual-stack fuel cell trucks, Fan et al. [
38] summarized state-of-the-art PEMFC stack and system design, and Lee et al. [
39] investigated nonlinear water transport phenomena in PEMFCs. These contributions provide modeling tools essential for hybrid system design and performance evaluation.
Research on energy management strategies (EMS) further complements this modeling foundation. Lu et al. [
40] presented guidelines for optimal control strategies and structural design, Sinha et al. [
41] reviewed integration methods for fuel cell hybrid systems, and Xu et al. [
42] developed transient FC-battery hybrid models coupled with rule-based strategies. Ma et al. [
43] studied integrated energy management strategies, Cha et al. [
44] reviewed optimization-based EMS approaches for fuel cell and battery systems, and Han et al. [
45] analyzed operational strategies for durability improvement in commercial hydrogen vehicles. To further improve performance, advanced strategies focusing on efficient energy distribution and system durability have been explored [
46,
47]. Collectively, these studies emphasize the importance of EMS in achieving both efficiency and durability.
Nevertheless, most prior works consider fuel cells as the primary propulsion source. For instance, Molina et al. [
48] optimized the sizing of a fuel cell range extender for passenger cars, but their framework treated the fuel cell as a dominant power provider. Since carbon neutrality is an important paradigm in the auto industry, a battery electric bus with a fuel cell auxiliary power generator is a good candidate to improve the electric bus fuel economy in cold weather. The fuel cell is an electrochemical reactor that supplies electricity with thermal energy for battery electric buses. As fuel cell systems are applied for HVAC cabin heating, such a system can improve the fuel economy by charging the battery with heat generation in cabin heating. This configuration offers a promising solution to extend the driving range in cold environments and to improve overall system efficiency. Nevertheless, research on the application of fuel cell-based range-extended electric buses remains limited, particularly studies that investigate the auxiliary role of fuel cells for cabin heating and battery charging. Therefore, systematic investigations are required to explore effective operational strategies and potential system designs.
In this study, we developed a dynamic system model in the MATLAB/Simulink environment to simulate the thermal comfort of an electric bus equipped with a fuel cell auxiliary power source under the WHVC. Because the fuel cell produces both electrical and thermal energy, its operating strategy plays a critical role in improving the equivalent fuel economy of the bus. To address this, three operation modes were designed and evaluated with respect to cabin heating demand. The integrated model framework combines the fuel cell, battery, converter, and vehicle subsystems, allowing system-level analysis of both electrical and thermal performance. Based on this framework, case studies were conducted to investigate SOC variation, hydrogen consumption, and overall energy efficiency under each operating strategy.
2. System Modeling
In this study, a simulation model was employed as the core tool to evaluate the feasibility of a range-extended battery electric bus. Accordingly, the components of the battery electric bus were modeled as reference subsystems and integrated with an electric heater (PTC heater). The fuel cell system was modeled based on a fuel cell stack coupled with Balance of Plant (BOP) components, and all component models were integrated for simulation purposes. An integrated system model was developed in the MATLAB/Simulink environment to represent the key characteristics of the fuel cell, battery, and powertrain subsystems, capturing both dynamic behavior and energy management aspects. In addition, the city bus model was designed based on the publicly available specifications of the Hyundai Elec City bus, and the main specifications used in the simulation are summarized in
Table 1. The integrated simulation environment was developed by compiling performance data for each component and collecting extensive verification data for the fuel cell system model, with detailed validation results provided in our previous study [
45].
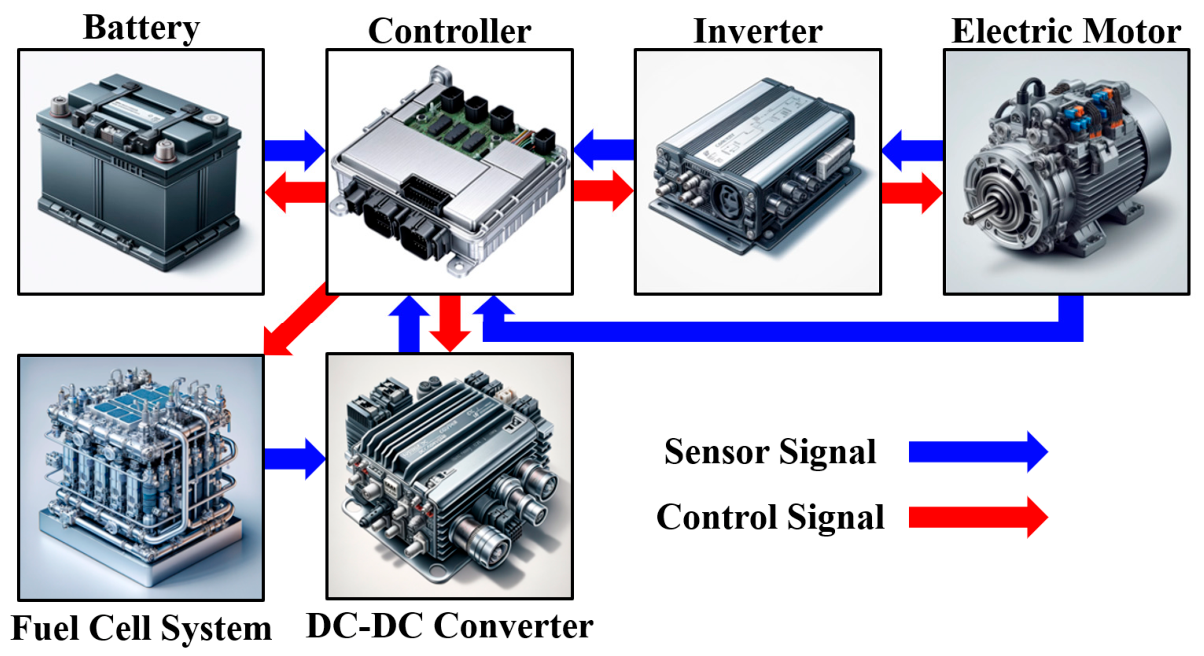
Figure 1 illustrates the signal flow configuration of the developed FC-REEB system. The framework consists of several sub-models, including the fuel cell system, battery, DC/DC converter, controller, inverter, motor, and heating system. These subsystems exchange electrical and thermal energy through sensor-based feedback and the heating balance loop, while the controller regulates power flow and overall system operation via control signals. The key input variables include the driving cycle (WHVC), heating load, and current control signals, whereas the main output indicators are the state of charge (SOC), equivalent fuel economy, and cabin heating performance. This signal flow diagram provides a clear representation of the interactions among the integrated sub-models.
2.1. Battery System Models
The battery serves as an energy storage device with high-capacity lithium-ion batteries. In this study, the battery operates differently in charging mode and discharging mode, and these operating modes are determined based on the SOC of the battery. In charging mode, the battery receives current from the converter to charge, while in discharging mode, the battery supplies current to power the system. The battery model allows for accurate calculation of the SOC, enabling efficient energy management of the battery based on this information [
49].
The converter is a power conversion device that primarily uses a DC-DC converter. This converter adjusts the output voltage by stepping up or stepping down the input voltage as needed. The duty ratio (D) is controlled through a voltage regulator and ensures that the battery voltage and converter voltage remain consistent. A PI controller is used as the voltage regulator, which adjusts the voltage between the battery and the converter to ensure a stable power supply and reduce voltage fluctuations, thereby enhancing system stability. The converter plays a crucial role in adjusting the voltage and current generated by the fuel cell, either storing it in the battery or delivering it to the inverter [
45]. The converter is assumed to be ideal in voltage-current transformation, while efficiency losses are considered separately through Equation (7).
The inverter is a device in an electric vehicle system that converts the DC power from the battery into AC power that can drive the electric motor. It is a key component of the power conversion system and is essential for controlling the speed and torque of the motor. The mathematical modeling of the inverter includes speed conversion, torque current control (
), flux control (
), and torque voltage control (
), with each controller generating control signals through a PI controller. These controllers allow for precise control of the electric motor’s speed and torque and play a crucial role in optimizing the vehicle’s performance and efficiency [
50].
In a BEB, the power conversion structure is relatively straightforward. The DC power stored in the battery is directly supplied to the inverter, which then drives the electric motor. All loads, including propulsion and cabin heating, rely solely on the battery, making the system sensitive to SOC depletion, especially in cold climates where heating demands are high. In contrast, the configuration of FC-REEBs incorporates a fuel cell system that supplies supplementary power through a DC-DC converter. This additional power path enables the fuel cell to charge the battery or directly assist the inverter during driving. As a result, FC-REEBs can achieve more stable voltage regulation and improved range performance while also allowing for more flexible energy distribution across various subsystems, namely, the motor and heating components.
2.2. A Model for Thermal Balance of a Battery Electric Bus with a PTC Heater in Cold Weather
The heating system model was designed to simulate the thermal balance inside the bus under low-temperature environments [
51]. The main thermal parameters and modeling assumptions, including the cabin thermal elements, heat-transfer characteristics, passenger metabolic heat, and door-opening heat loss, were determined based on Ref. [
51]. The thermal balance was calculated by considering heat conduction, convection, and radiation within the cabin. Specifically, the model considers heat conduction through the windows, walls, roof, floor, doors, and seats of the bus, convective heat transfer between the cabin surfaces and the interior air, external convective heat transfer influenced by vehicle speed, and solar radiation. The thermal balance inside the bus was calculated by dividing the cabin into eight thermal elements. In addition, the model includes the recovery of waste heat generated during fuel cell operation [
52].
For a conservative evaluation of heating performance, the number of passengers (
) was assumed to be 1, representing the driver only. The metabolic heat generation per person (
) was set to 108 W based on Ref. [
51]. Since additional passengers act as internal heat sources, this assumption minimizes passenger heat generation and increases the net heating demand. Therefore, the heating system was evaluated under a conservative thermal condition. The target cabin temperature and ambient temperature were set to
and
, respectively. The ambient temperature of
was selected to represent a severe winter operating condition in South Korea, where heating demand increases and battery performance degradation becomes critical.
The door-opening heat loss (
) was calculated by considering the total cumulative heat exchange over the entire driving cycle. Because real-time bus stop intervals and door-opening events vary depending on the route and operating conditions, a representative door-opening interval was assumed. The corresponding heat loss was integrated over the cycle to estimate the overall thermal impact of door operation. In this study, battery power under low-temperature conditions was calculated by considering battery performance loss. To estimate the power required for electric bus operation under low-temperature conditions, battery output was calculated based on the experimental results reported in Ref. [
5].
2.3. Fuel Cell System Models
The fuel cell stack model applied in this study is composed of three main components: the anode, the electrolyte membrane, and the cathode. The gas flow within the channels is described using the mass conservation equation and is calculated based on the mole fractions of each gas species [
53]. The gas flow models for the anode and cathode channels analyze the partial pressure of the gases within the channels in response to dynamic load variations and predict the humidity within the channels according to changes in the relative humidity at the inlet [
34].
In the electrolyte membrane model, the flow of water vapor within the membrane is determined by the balance of two driving forces. These two forces consist of the electro-osmotic drag caused by hydrogen ions and the back-diffusion due to the difference in water concentration [
54]. The water vapor concentration within the electrolyte membrane is calculated through the water content, and based on this, a correlation for the membrane’s water diffusion coefficient can be derived [
55].
The electrochemical reaction is calculated based on the reduced thermodynamic potential due to actual irreversible voltage losses. The thermodynamic potential of the electrochemical reaction is determined by the Nernst voltage equation [
32,
56]. The actual cell voltage of the fuel cell is calculated by considering each loss from the theoretical voltage. These voltage losses are categorized as activation loss (
), ohmic loss (
), and concentration loss (
). Therefore, the actual voltage of the fuel cell is calculated as follows [
56].
where
,
, and
, which are empirically derived constants in the fuel cell model and reflect the relationships between activation losses, the maximum current density in the diffusion process, and the limiting current density.
A lumped capacitance method was adopted for the dynamic thermal model of the fuel cell stack to ensure computational efficiency at the system level. The spatial temperature gradient within the fuel cell stack is neglected based on the assumption that the high-flow cooling system maintains the stack temperature within a narrow operational range (typically less than 10 K between inlet and outlet). Although this simplification may introduce minor deviations in local heat transfer estimation, it is considered sufficiently accurate for evaluating the overall waste heat recovery performance at the system level. The temperature of the stack is calculated by considering the heat generated by the electrochemical reactions within the stacked cells (
), heat transfer by the coolant (
), heat transfer due to gas flow within the stack (
), and heat transfer to the surrounding environment (
). In Equation (45),
represents the externally exposed surface area of the fuel cell stack, and the internal heat exchange between adjacent cells was assumed to be thermally insulated within the lumped stack model. This temperature calculation is determined according to the principle of energy balance [
57].
2.4. Vehicle Equivalent Fuel Economy Modeling
The equivalent fuel economy model is defined by the relationship between the driving distance and the total equivalent energy consumption. The total equivalent energy consumption is calculated as the sum of battery energy consumption and LHV-based hydrogen energy consumption. Battery energy consumption is determined based on the battery’s charging current, discharging current, and voltage, considering the thermal balance inside the bus and the recovery of waste heat from the fuel cell. Hydrogen energy consumption is determined by the amount of hydrogen consumed and the lower heating value (LHV) of hydrogen. In this study, the energy efficiency model was used as a crucial indicator for comparing the performance of the vehicle [
45].
2.5. Bus Driving Mode
In this study, the WHVC driving mode was adopted to reflect the driving characteristics of FC-REEBs. The WHVC mode is commonly used for evaluating the driving performance of medium- and heavy-duty commercial vehicles [
58]. A typical city bus in South Korea operates on a single one-way route of approximately 30 km from terminal to terminal [
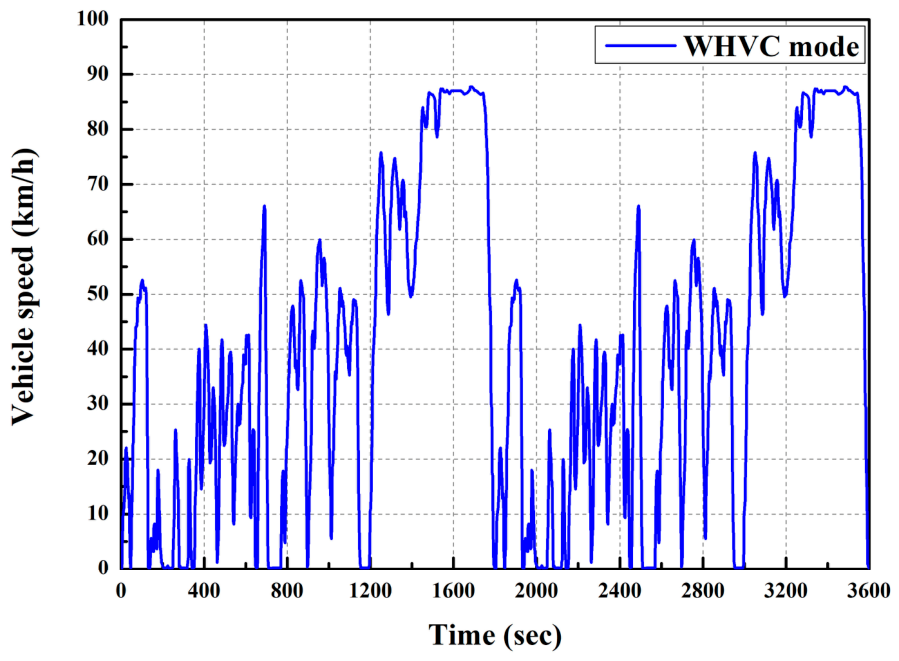
59]. In contrast, a single cycle of WHVC covers 19.98 km. When this mode is repeated twice, the total driving distance reaches 39.96 km, which exceeds the typical one-way operation distance of a city bus in South Korea. This allows for a more stable and reliable analysis. Therefore, in this study, the WHVC mode was repeated twice to simulate the actual driving characteristics of an FC-REEB. The resulting two-cycle WHVC driving profile is illustrated in
Figure 2.
2.6. Operation Strategy of the Fuel Cell System
In this study, three fuel cell operation strategies were designed to enhance both the energy efficiency and cabin heating performance of an electric bus operating under low-temperature conditions. Each strategy differs in the extent and purpose of fuel cell utilization, particularly regarding its contribution to battery charging and cabin heating. The operation of the fuel cell is dynamically controlled based on either the SOC or heating demand using logic-based or feedback-based methods.
Table 2 summarizes the characteristics of each strategy in terms of fuel cell usage, energy flow, and control logic.
The first strategy is the 20 kWe Active Cabin Heating + Passive Battery Charging, which aims to reduce battery energy consumption by prioritizing the use of the fuel cell’s waste heat and electrical power for cabin heating. The system operates in either the heating mode or charging mode based on the thermal load, with mode transitions governed by switch-based logic. In the heating mode, the fuel cell operates to satisfy the cabin heating load using both waste heat and direct electrical power. In the charging mode, when the heating demand is lower than the available waste heat, the excess fuel cell output is directed toward charging the battery. Fuel cell current is regulated using a PI controller, which calculates the error between the required heating power () and the actual heat recovered from the fuel cell (). This strategy improves heating performance in cold environments and lowers battery load but may result in decreased system efficiency when the fuel cell operates at high output levels to meet heating demands.
The second strategy is the 20 kWe Active Cabin Heating + Active Battery Charging, which aims to optimize energy distribution by coordinating the fuel cell and battery for both heating and charging. In this strategy, the fuel cell provides waste heat for cabin heating and simultaneously supplies electrical power for battery charging and motor assistance. Fuel cell current is controlled through a PI controller, which adjusts output based on the error between the target SOC and the measured SOC. When the SOC is high, the battery primarily supports propulsion and heating, while the fuel cell output is minimized. When the SOC drops below a predefined threshold, the fuel cell output increases to support charging and reduce battery depletion. This strategy balances thermal and electrical energy demands across subsystems and improves the overall system flexibility. However, it may involve partial operation in the low-efficiency region of the fuel cell.
The third strategy is the 40 kWe Active Cabin Heating + Active Battery Charging, which extends the previous concept by operating the fuel cell at a higher capacity. This allows the fuel cell to actively support cabin heating, battery charging, and motor propulsion simultaneously. As in Case 2, the fuel cell current is regulated with a PI controller based on SOC error. However, the fuel cell is sized and operated to maintain high output across a broader range of conditions to ensure stable power and thermal supply. While this strategy offers improved robustness in cold weather by minimizing the burden on the battery, continuous high-power operation may lead to increased hydrogen consumption and reduced system efficiency.
To address energy distribution between the fuel cell and the battery, this study intentionally employed rule-based control strategies rather than optimization-based tools such as dynamic programming or model predictive control. The rationale was to ensure real-time applicability and computational simplicity for city bus operations. All major loss mechanisms including fuel cell generation losses, DC/DC converter efficiency, and battery charge discharge efficiency were explicitly incorporated into the system model. Although charging the battery through the fuel cell involves additional conversion losses, the results demonstrate that maintaining a stable SOC mitigates deep battery depletion, reduces performance degradation under cold conditions, and extends the overall driving range. Therefore, the proposed strategies represent a practical compromise, balancing system efficiency with feasibility for real-world applications.
2.7. Estimation of the Heating Load and Capacity of the Fuel Cell System
In general, the operating power of fuel cells applied to extend the driving range of fuel cell range-extended medium and heavy-duty vehicles ranges between 50 kW and 100 kW [
48]. In this study, a 290.4 kWh electric bus was modeled, and the fuel cell capacity was determined based on the heating load estimated using the fuel cell system model.
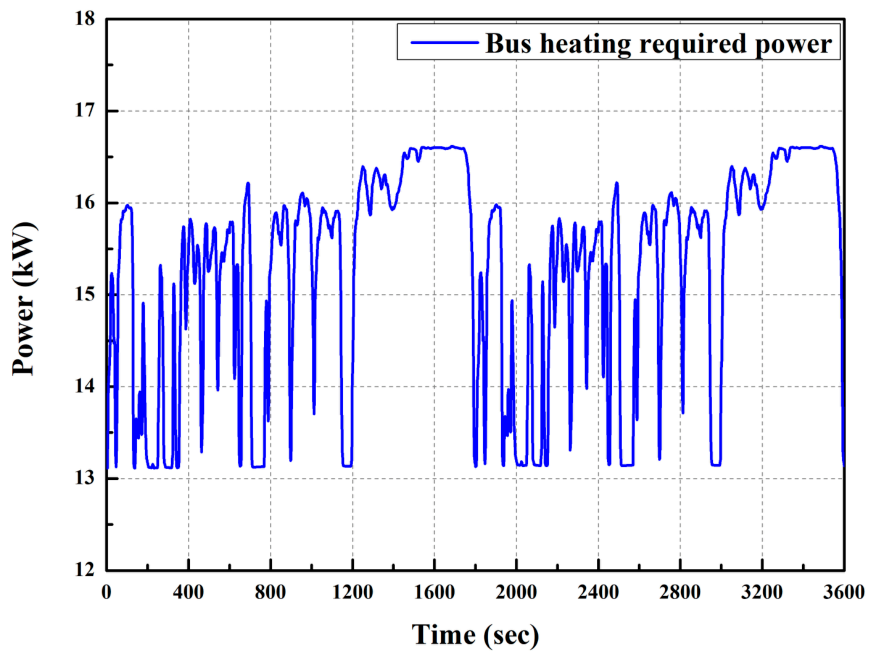
To meet the heating requirements in low-temperature environments through waste heat recovery from the fuel cell, the thermal power demand of the heating system was calculated based on the cabin thermal balance model described in
Section 2.2. As shown in
Figure 3, the resultant total heating load ranged from 13 kW to 17 kW, and this value was used as the direct criterion for selecting the representative fuel cell capacity. Based on the maximum heating demand, the baseline fuel cell capacity was set to 20 kW to ensure sufficient thermal supply under worst-case conditions. In addition, a 40 kW fuel cell was considered to investigate the effect of increased power capacity on system performance by enabling operation at a lower load ratio.
Accordingly, a 20 kW fuel cell was applied for the baseline strategies, while a 40 kW fuel cell was adopted for Case 3 (40 kWe Active Cabin Heating + Active Battery Charging). To regulate the fuel cell output according to the heating demand, a PI controller was employed. The amount of recoverable waste heat was quantitatively estimated by considering the efficiency variation under different fuel cell load conditions.
3. Results
In this study, we designed and analyzed three different operating strategies to optimize the performance of the fuel cell and battery system in an FC-REEB under low-temperature conditions and to maximize overall energy efficiency. This section presents the simulation results of the three proposed fuel cell operation strategies, focusing on key performance indicators, namely the variation in the SOC of the battery, fuel cell current, power consumption characteristics, and driving energy efficiency. A quantitative comparison was conducted to evaluate the impact of each control strategy on the overall energy management and driving performance of the system.
3.1. Performance Analysis of the Electric Bus and FC-REEB
This section presents a comparative analysis of the performance of an electric bus and an FC-REEB under different ambient temperature conditions. The fuel cell capacity was set to 20 kW and 40 kW based on the heating load analysis described in
Section 2.7, which indicated that the required heating power under low-temperature conditions ranges approximately from 13 kW to 17 kW. Through this comparison, we examined the impact of the fuel cell on the hybrid system, emphasizing the necessity of identifying an optimal operating strategy for improving the performance of FC-REEB systems in cold environments.
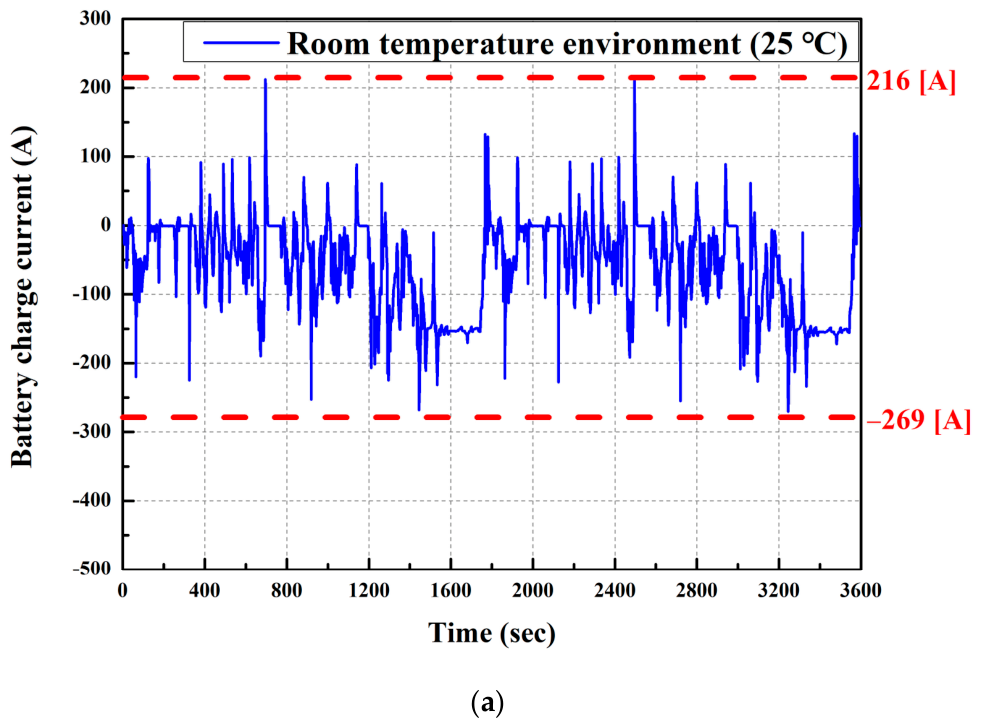
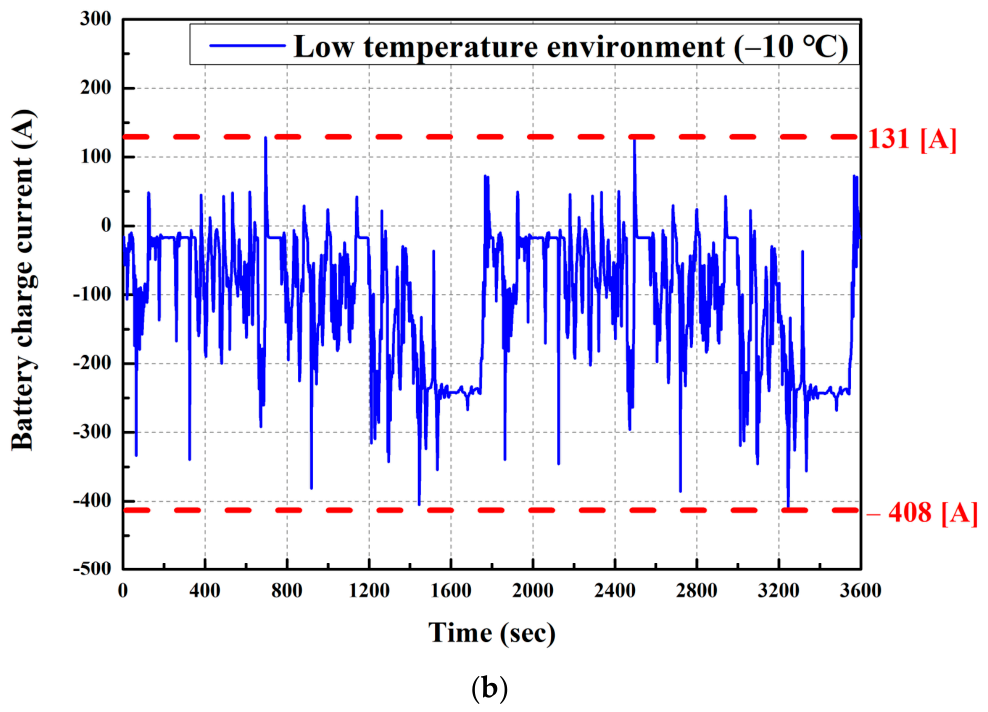
Figure 4 compares the battery charging current in the WHVC driving mode at 25 °C and −10 °C. In low-temperature environments, the maximum and minimum peak currents decrease significantly, leading to performance degradation. The discharge capacity is −58.64 [Ah] at 25 °C and −106.13 [Ah] at −10 °C, showing that the battery discharges approximately 1.8 times faster. Battery discharge in low-temperature environments leads to a decline in system performance. To mitigate this performance decline, it is essential to develop effective charging strategies for hybrid systems to ensure stable and reliable operation in cold conditions.
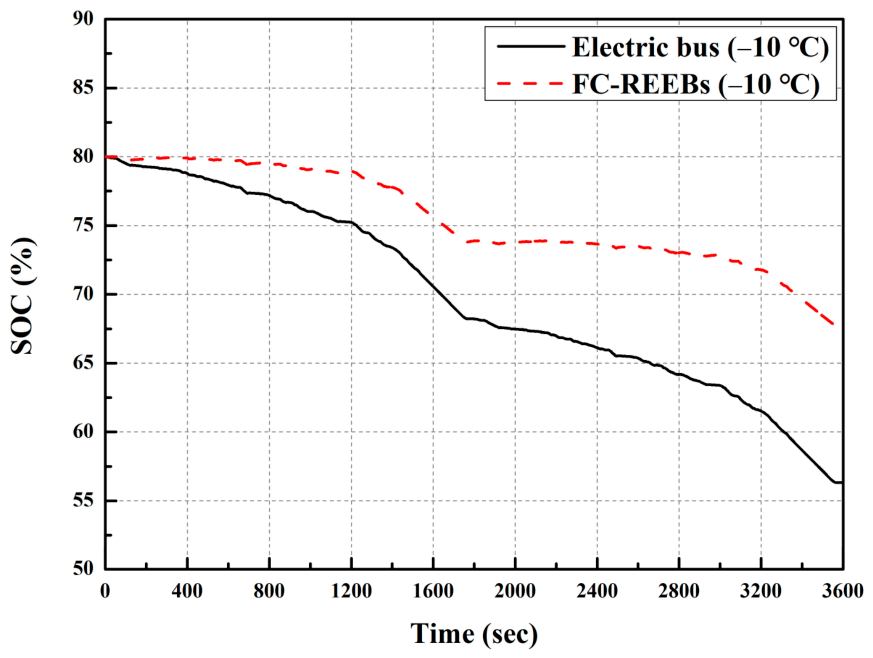
Figure 5 illustrates the SOC variation in the electric bus and the FC-REEB under low-temperature conditions. The electric bus exhibited a rapid decrease in the SOC under low-temperature environments. This was due to the degradation of the battery’s electrical performance in cold conditions and the additional battery consumption caused by the operation of the heating system. In contrast, the FC-REEB showed approximately half the SOC reduction compared to the electric bus. This improvement was due to the utilization of waste heat from the fuel cell to meet the energy demand of the heating system, thereby minimizing additional battery consumption. These findings suggest that the fuel cell–battery hybrid system enables more efficient energy consumption and provides stable performance, even under low-temperature conditions.
3.2. Analysis of System Behavior According to Fuel Cell Operating Strategies
This section analyzes the dynamic behavior of key variables within the hybrid system for different fuel cell operating strategies. The analysis focuses on SOC variation, fuel cell current response, battery charging and discharging power, and battery power consumption for heating. The objective is to compare how each strategy affects control stability and energy management characteristics of the system.
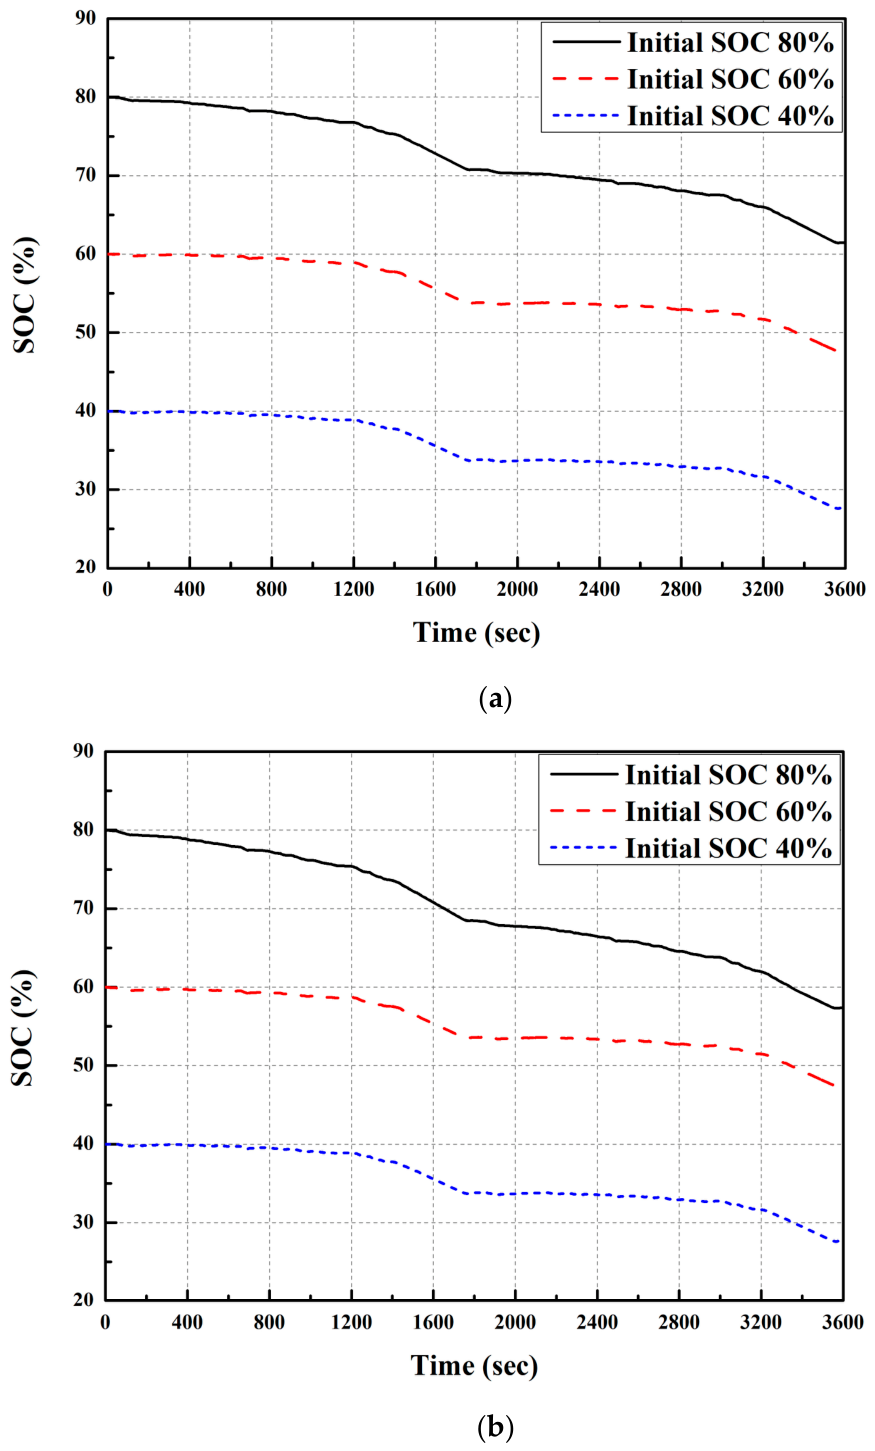
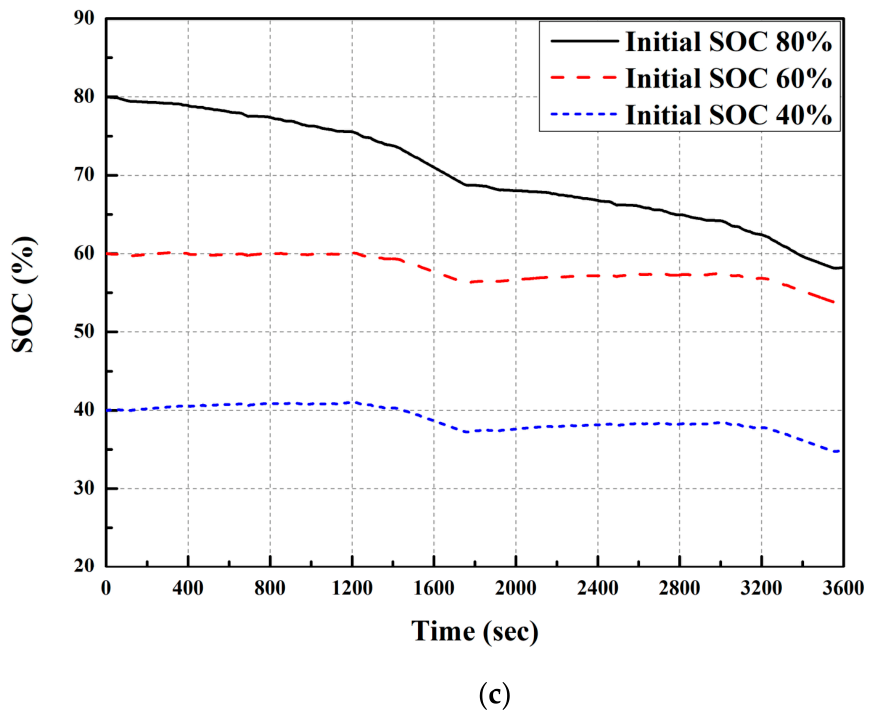
Figure 6 illustrates the variation in the SOC over time for different operating strategies and initial SOC conditions. In both Case 1 and Case 2, where the fuel cell capacity is set to 20 kW, the battery experiences a gradual decrease in the SOC throughout the entire driving cycle. This is due to the discharge rate exceeding the fuel cell’s limited charging contribution. In Case 3, which employs a 40 kW fuel cell, partial battery charging is observed during low-load periods; however, under high-load conditions, the discharge still dominates, resulting in a continuous decline in the SOC.
For both Case 2 and Case 3 with an initial SOC of 80%, the SOC falls below 60% during the latter half of the cycle, indicating the need for active fuel cell charging intervention. Since battery performance remains most stable within the SOC range of 80% to 40%, operating with an initial SOC of 80% or 60% provides a practical advantage for maintaining efficient system operation.
While Case 3 demonstrates improved SOC maintenance due to continuous operation of a high-power fuel cell, this comes at the cost of increased overall energy consumption. In contrast, Case 1, despite utilizing a smaller fuel cell, focuses on responding to the heating load. Although the SOC depletion is more pronounced, the strategy effectively minimizes unnecessary fuel consumption by actively utilizing fuel cell waste heat, thereby improving the system’s energy efficiency.
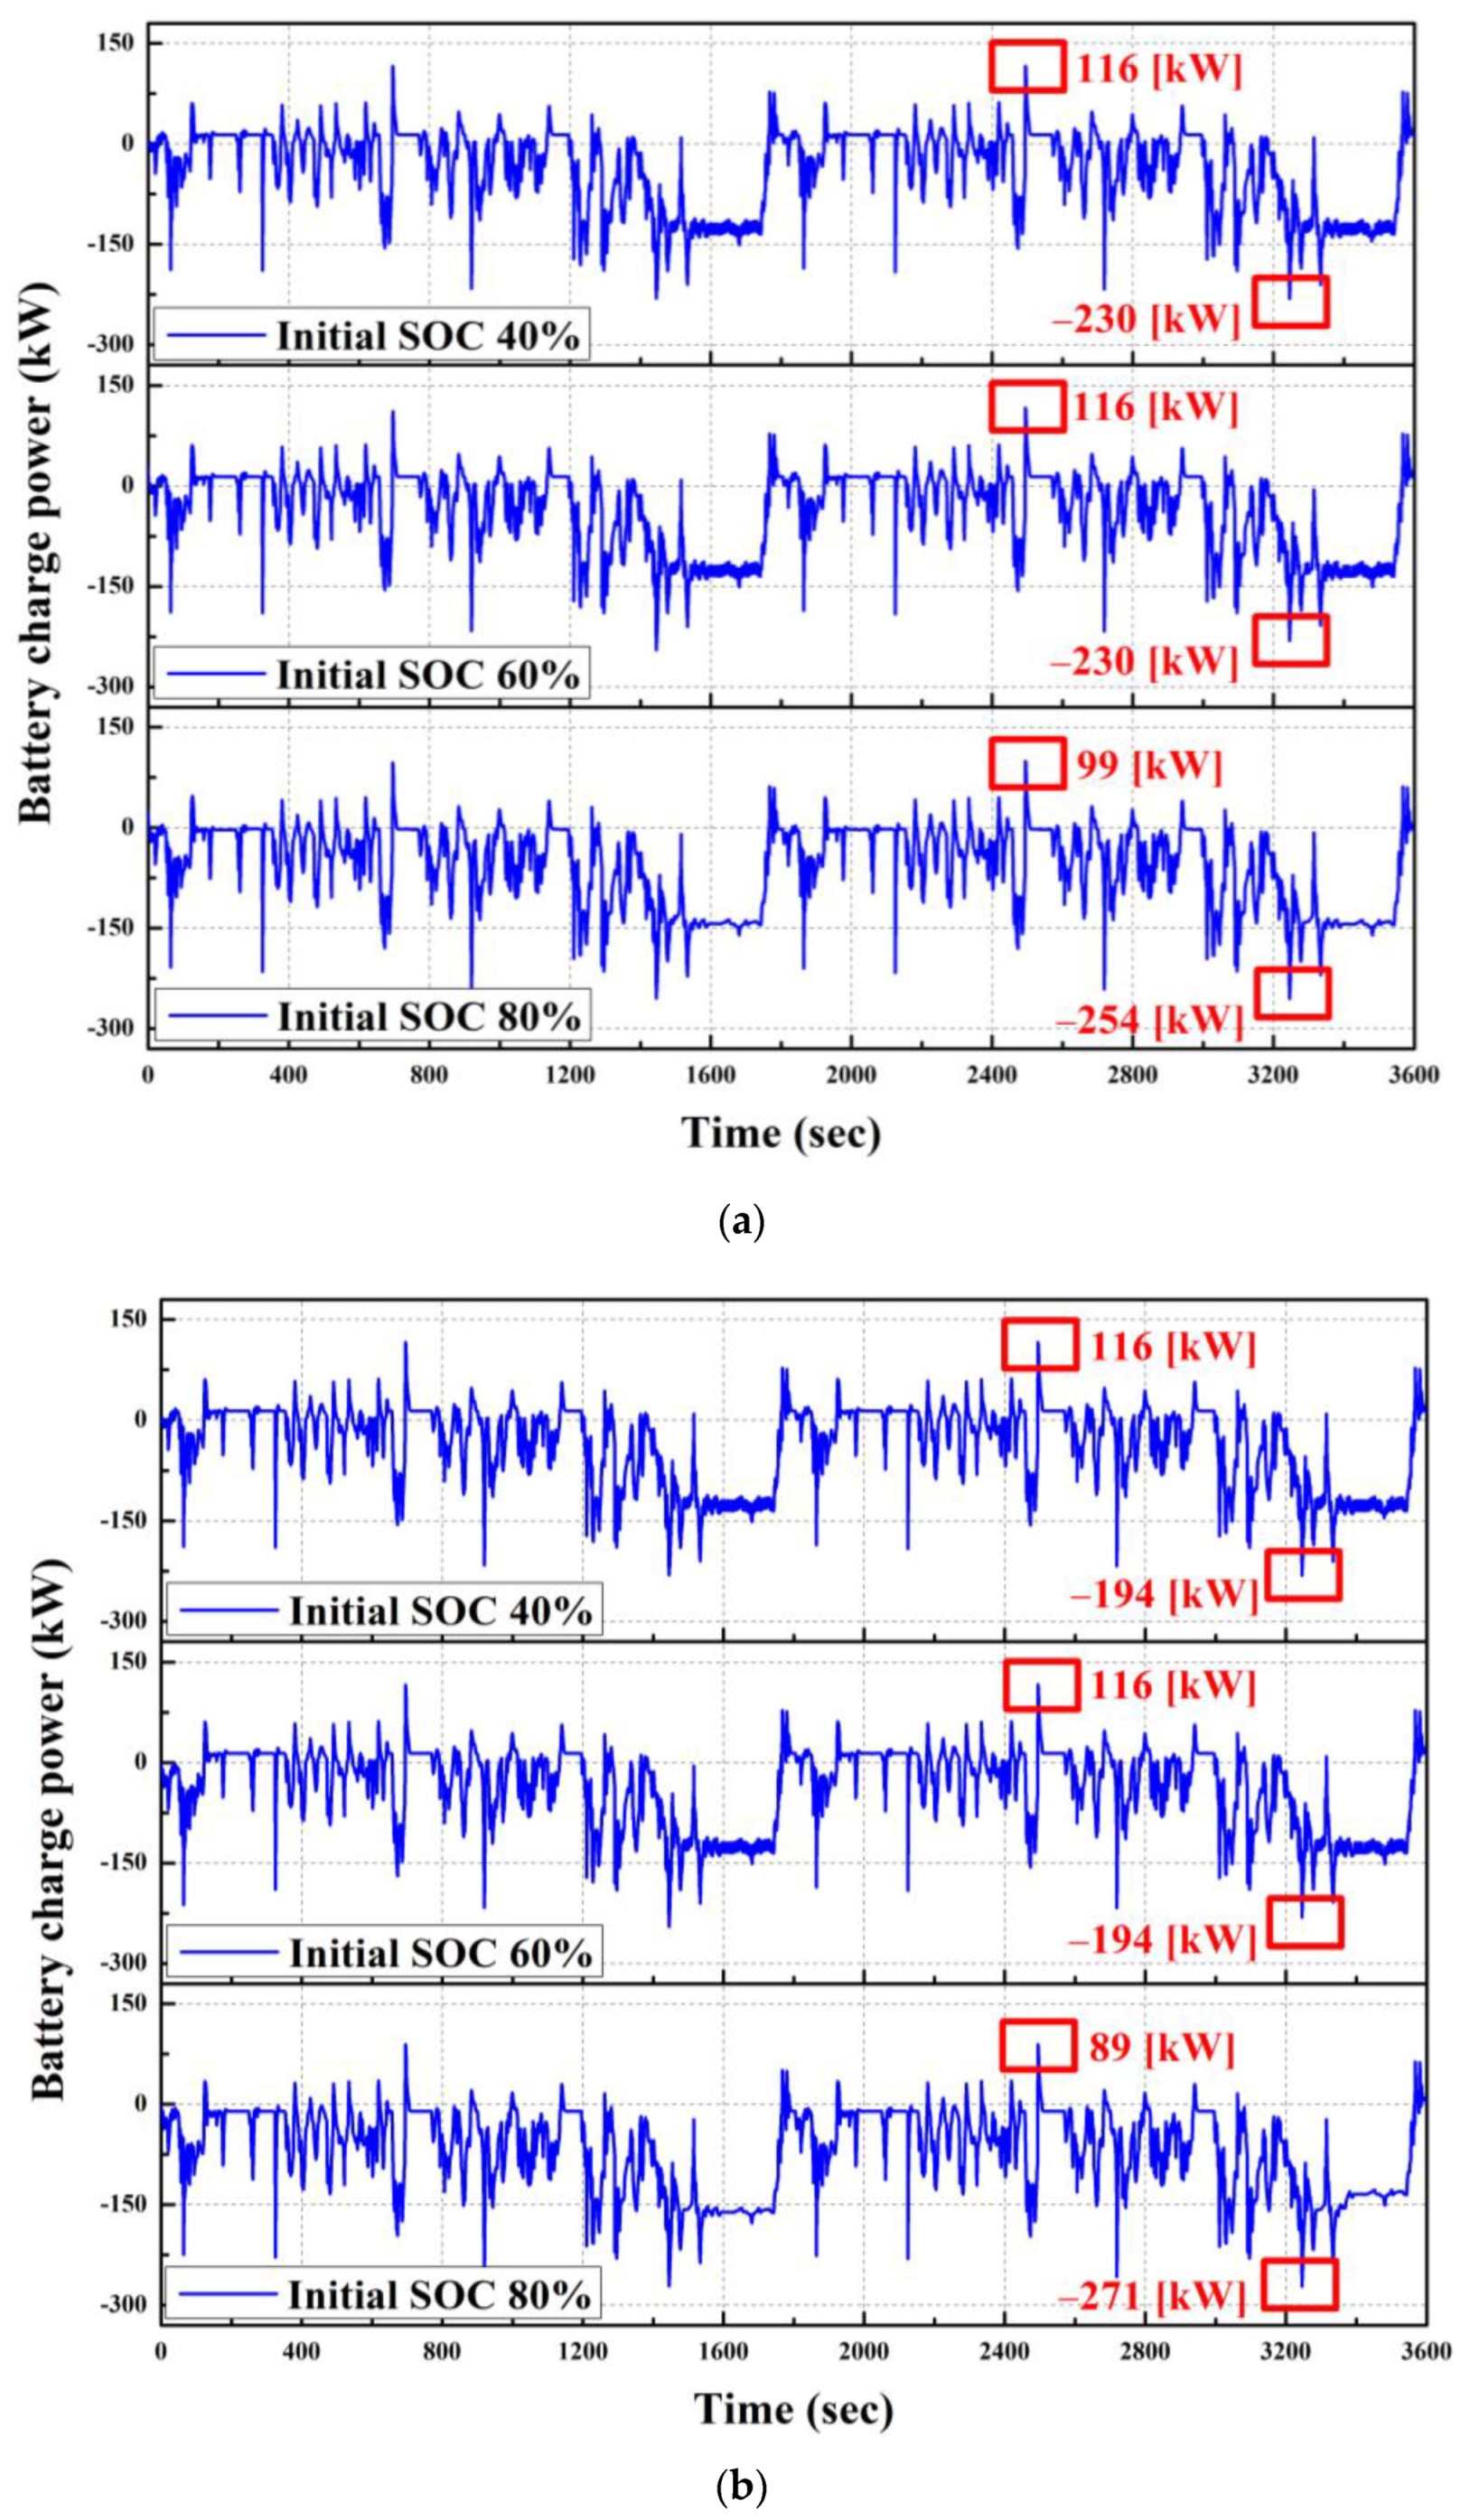
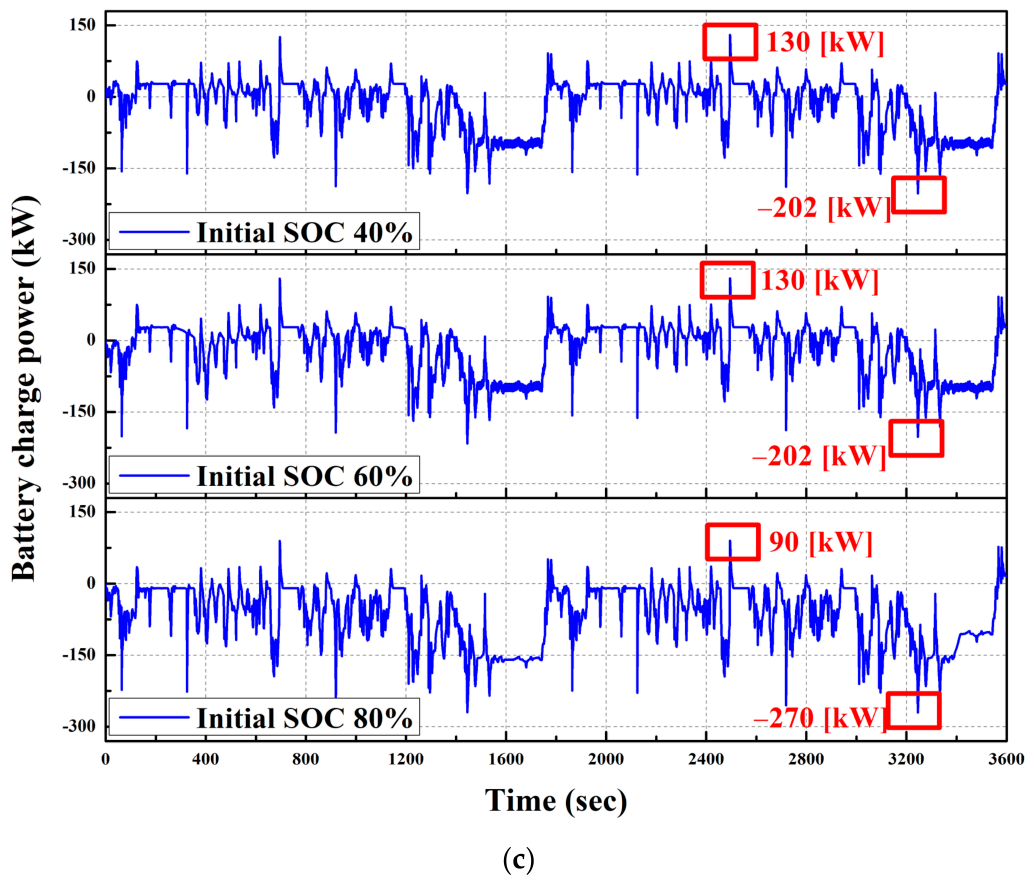
Figure 7 illustrates the variation in battery charge power over time for different operating strategies under initial SOC conditions of 40%, 60%, and 80%. Battery charge power is a key indicator for quantitatively evaluating the effectiveness of fuel cell intervention strategies and overall energy management efficiency. Across all cases, charge and discharge fluctuations remain within a range of approximately ±300 kW, indicating comparable dynamic responses among the strategies. Under the initial SOC condition of 80%, Case 1 exhibits relatively lower battery discharge levels compared to the other strategies. This behavior results from the operating strategy that prioritizes the utilization of fuel cell waste heat to satisfy heating demands, thereby minimizing the use of fuel cell power for battery charging and reducing additional battery energy consumption. On average, Case 1 shows a battery power consumption of −55.93 kW, which is notably lower than that of Case 2 (−68.21 kW) and Case 3 (−65.63 kW), demonstrating a more efficient energy management performance under high SOC conditions. In contrast, under lower initial SOC conditions of 60% and 40%, Case 3 exhibits the highest overall charging power throughout the driving cycle. This trend is attributed to the application of a high-power fuel cell, which enhances the battery charging capability when the state of charge is relatively low, thereby supporting stable operation and improved energy balance under these conditions.
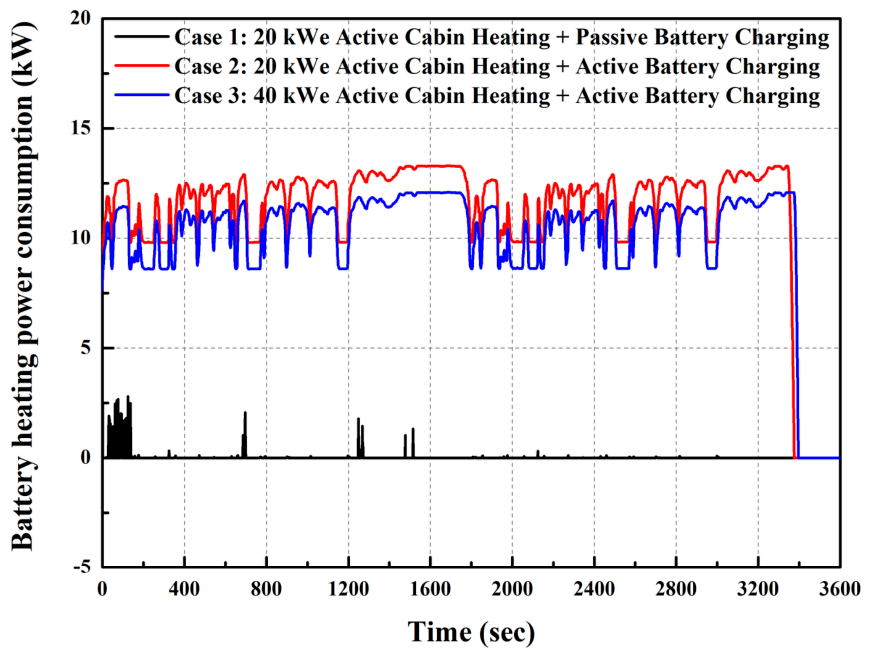
Figure 8 illustrates the battery power consumption for heating in each fuel cell operating strategy, assuming an initial SOC of 80%. Heating load accounts for a significant portion of total energy consumption during winter driving, and the utilization of fuel cell waste heat plays a critical role in reducing the battery’s additional energy burden.
In Case 1, battery power consumption for heating remains nearly zero throughout the entire driving period, indicating that the heating demand is sufficiently met by the fuel cell’s direct output and waste heat. In contrast, Case 2 and Case 3 show a continuous heating power consumption of approximately 8–13 kW, which reflects a high dependence on the battery for thermal load support.
Additionally, after around 3350 s, both Case 2 and Case 3 exhibit a sharp drop in heating power consumption, which corresponds to a transition of the fuel cell into charging mode as the SOC falls below 60%. This results in an increase in output power and waste heat recovery. Meanwhile, Case 1 consistently utilizes the waste heat from the fuel cell throughout the entire cycle, effectively minimizing the battery’s thermal load and demonstrating superior energy efficiency.
3.3. Study on the Application and Analysis of Fuel Cell Capacity
This section quantitatively evaluates the impact of fuel cell operating strategies on overall system performance. The analysis focuses on fuel cell and battery energy consumption, fuel cell contribution rate, and equivalent fuel economy (km/kWh). In this study, fuel cell energy consumption is calculated by multiplying the total hydrogen consumption by the LHV of hydrogen. Therefore, the hydrogen consumption is converted into an equivalent energy basis and combined with the battery energy consumption for system-level performance evaluation. Based on these metrics, we compare the operational efficiency and energy distribution characteristics of each strategy and identify their respective advantages and limitations.
Table 3 presents a quantitative comparison of battery and fuel cell energy consumption, as well as fuel cell contribution rates, for different operating strategies under initial SOC conditions of 80% and 60%. The fuel cell contribution rate, defined as the proportion of fuel cell energy consumption relative to total energy consumption, serves as an important indicator for evaluating overall system efficiency and thermal management performance.
Under an initial SOC of 80%, all strategies exhibit a battery-dominant energy consumption pattern. Among them, Case 1 shows the highest fuel cell contribution rate at 21.63%, reflecting its strategy of actively utilizing the fuel cell to meet heating demands. In contrast, Case 2 and Case 3 display lower contribution rates of 5.74% and 10.42%, respectively, indicating a heavier reliance on the battery for power supply.
When the initial SOC is reduced to 60%, the differences among strategies become more distinct. Case 1 and Case 2 show relatively balanced power sharing between the battery and fuel cell, with contribution rates of 52.18% and 51.31%, respectively. Case 3, on the other hand, achieves a fuel cell contribution rate of 80.29%, indicating that the fuel cell functions as the dominant power source for charging. This outcome is due to the use of a high-capacity fuel cell and its continuous high-power operation throughout the driving cycle.
Table 4 presents the key quantitative data for each charging strategy (Case 1–3) under different initial SOC conditions, namely 80%, 60%, and 40%, while
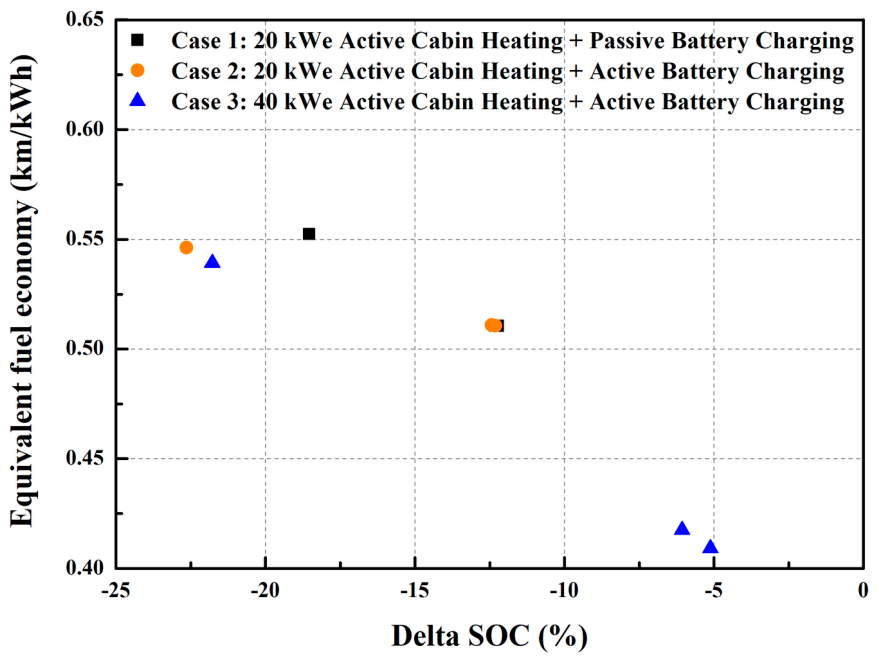
Figure 9 visualizes the trend of equivalent fuel economy with respect to Delta SOC. Delta SOC is defined as the difference between the final SOC and the initial SOC; a positive value indicates charging, whereas a negative value indicates discharging, as expressed in Equation (50). The comparison includes Delta SOC, fuel cell energy consumption, battery energy consumption, driving distance, and equivalent fuel economy, thereby providing insight into the differences in energy management strategies and overall efficiency. Delta SOC and equivalent fuel economy vary across the strategies depending on fuel cell capacity, power distribution architecture, and the utilization of waste heat.
Under the initial SOC conditions of 60% and 40%, where the fuel cell primarily operates in the charging mode, significant differences emerge between the strategies. In this range, Case 1 and Case 2 maintain similar levels of equivalent fuel economy, whereas Case 3 exhibits the smallest SOC depletion, with Delta SOC values closest to zero (−6.06% and −5.11%), but shows the lowest equivalent fuel economy. This result suggests that although Case 3 employs a high-power fuel cell for aggressive charging, thereby securing a greater charging amount than the other strategies, it simultaneously results in excessive hydrogen consumption. The main reason for this increased consumption is that the 40 kW fuel cell operates continuously at high-load points, where its efficiency significantly decreases compared with the optimal operating range. Consequently, while Case 3 effectively recovers battery energy, the overall system efficiency is compromised by the low-efficiency operation of the fuel cell.
In contrast, Case 1 achieves the highest equivalent fuel economy across all initial SOC conditions. In particular, under the initial SOC condition of 80%, Case 1 exhibits the smallest SOC depletion, with a Delta SOC of −18.54%, while recording the highest equivalent fuel economy of 0.552 km/kWh among the three strategies. This result indicates that the Case 1 approach, which minimizes unnecessary charging and maximizes waste heat utilization for cabin heating, effectively reduces energy consumption and suppresses battery SOC depletion under this condition. Under the initial SOC of 80%, Case 1 achieves approximately 1.1% and 2.4% higher equivalent fuel economy than Case 2 and Case 3, respectively, while also maintaining a Delta SOC closer to zero.
4. Conclusions
This study analyzed the impact of different FC and battery operating strategies on the performance of FC-REEBs under low-temperature conditions. A comprehensive MATLAB/Simulink model was developed by integrating the FC system, battery, power conversion unit, vehicle dynamics, and cabin heating load. Simulations were conducted under the WHVC driving cycle, and three operating strategies were comparatively evaluated. The key conclusions are as follows:
(1) Case 1 achieved the highest equivalent fuel economy of 0.552 km/kWh at an initial SOC of 80%, while also showing the smallest SOC depletion among the three strategies under this condition, with a Delta SOC of −18.54%. By effectively utilizing FC waste heat, Case 1 reduced battery energy consumption by approximately 12.27 kWh and 9.68 kWh compared with Case 2 and Case 3, respectively.
(2) Case 2 showed intermediate characteristics between Case 1 and Case 3. At an initial SOC of 80%, Case 2 recorded an equivalent fuel economy of 0.546 km/kWh and a Delta SOC of −22.63%. Although this strategy actively supported battery charging, the system still partially relied on the battery to meet the heating and driving demands.
(3) Case 3, operating with a 40 kW FC, improved SOC retention under the initial SOC conditions of 60% and 40%, with Delta SOC values of −6.06% and −5.11%, respectively. However, this improvement was achieved at the expense of equivalent fuel economy, which decreased to 0.418 km/kWh and 0.409 km/kWh under the same conditions. This result reflects the trade-off between SOC retention and energy efficiency.
(4) These results highlight clear trade-offs among equivalent fuel economy, SOC retention, and hydrogen consumption. Case 1 provided the highest equivalent fuel economy through effective FC waste heat utilization, Case 2 showed intermediate operating characteristics between Case 1 and Case 3, and Case 3 improved SOC retention under low initial SOC conditions at the cost of increased hydrogen consumption and reduced equivalent fuel economy.
(5) This study has limitations in that battery and FC lifetime degradation, economic feasibility, and broader ambient-temperature sensitivity were not considered. Future work should incorporate these factors along with global optimization benchmarks, such as Dynamic Programming (DP), to provide a theoretical performance upper bound based on the design parameters identified in this study.
In conclusion, among the three strategies, Case 1 proved to be the most effective energy-efficient strategy for improving equivalent fuel economy under low-temperature conditions. However, Case 3 was more effective in retaining SOC under low initial SOC conditions, although this benefit was accompanied by lower equivalent fuel economy and increased hydrogen consumption. By establishing a methodological framework through rigorous thermal load analysis, this study provides a foundational baseline for future global optimization studies. Finally, this work offers quantitative evidence for the trade-offs among equivalent fuel economy, SOC retention, and hydrogen consumption that must be considered in future FC-REEB energy management strategies.