Article

Mechanistic Investigation of Enhanced Oil Recovery via CO2 Synchronous Huff-and-Puff and Asynchronous Injection–Production in Low-Permeability Reservoirs

State Key Laboratory of Oil and Gas Reservoir Geology and Exploitation, Southwest Petroleum University, Chengdu 610500, China
*
Author to whom correspondence should be addressed.
Energies 2026, 19(11), 2532; https://doi.org/10.3390/en19112532
Submission received: 23 April 2026 / Revised: 15 May 2026 / Accepted: 21 May 2026 / Published: 25 May 2026

Abstract

CO2 injection for enhanced oil recovery and carbon sequestration in low-permeability reservoirs has become a major research focus, driven by growing global energy demand and carbon-emission reduction targets. Among available development strategies, synchronous huff-and-puff and asynchronous injection–production show considerable field application potential; however, large-scale physical simulation experiments to validate these approaches remain lacking. In this study, large-scale high-temperature, high-pressure, two-dimensional physical simulation experiments were conducted under CO2 miscible flooding conditions to compare the displacement mechanisms of these two strategies in a low-permeability reservoir. Numerical simulation was employed to history-match the experimental results, confirming their accuracy and reliability. The results show that CO2 exhibited strong adaptability under the investigated reservoir conditions. It effectively replenished formation energy and, upon dissolution in crude oil, induced pronounced swelling and viscosity-reduction effects that enhanced oil mobility. Under miscible conditions, interfacial tension was significantly reduced, further improving displacement efficiency. Compared with synchronous huff-and-puff, asynchronous injection–production established a unidirectional pressure gradient by injecting CO2 into the low-permeability zone while producing from the high-permeability zone, substantially enlarging the swept volume and mobilizing residual oil. The final oil recovery under this mode reached 41.56%, an improvement of 21.78% over synchronous huff-and-puff. Reservoir heterogeneity was identified as the key factor controlling CO2 flooding effectiveness and residual oil distribution. The high-permeability zone served as the preferential CO2 migration pathway, while the low-permeability zone retained considerable residual oil. Therefore, rational optimization of the injection–production direction and pressure regime is essential for overcoming heterogeneity constraints and improving overall recovery performance.

1. Introduction

Against the backdrop of sustained global energy demand growth and increasing pressure to reduce carbon emissions, the efficient development of low-permeability reservoirs has become a critical research focus in hydrocarbon exploration and production [1,2,3,4]. Low-permeability reservoirs are widely distributed in China and exhibit significant heterogeneity and low permeability. Conventional waterflooding often faces challenges such as low oil recovery, high water cut, and non-uniform displacement efficiency, which further complicate reservoir development [5,6,7]. The implementation of carbon capture, utilization, and storage (CCUS) technologies offers a promising approach for the sustainable development of these reservoirs. CO2 injection not only improves oil displacement efficiency but also enables CO2 geological sequestration [8,9,10,11,12]. In this context, two distinct injection–production strategies, synchronous CO2 huff-and-puff and asynchronous injection–production, have attracted considerable research attention. Systematic studies on the applicability, displacement mechanisms, and optimization strategies of these operational modes in low-permeability reservoirs are therefore essential for enhancing oil recovery and maximizing the benefits of CCUS, combining both enhanced oil recovery and CO2 storage.
As an important development strategy within CO2-EOR, the CO2 huff-and-puff technique has been systematically investigated, yielding substantial research outcomes [13,14,15]. CO2 huff-and-puff has been systematically investigated at the core and numerical simulation scales. Mao et al. [16] compared multiple displacement media and confirmed that CO2 effectively reduces interfacial tension and induces oil swelling and viscosity reduction, making it suitable for ultra-low-permeability cores. Khanal et al. [17] conducted extensive numerical simulations and showed that optimized CO2 huff-and-puff can achieve over 32% recovery in 30 years, compared to 22% under natural depletion. Nasser et al. [18] reported that rapid CO2 dissolution in crude oil causes volume expansion, viscosity reduction, and pressure support, thereby mitigating production decline. Han et al. [19] used online NMR to show that CO2 first invades large pores during injection, redistributes oil during soaking, and expands the mobilized region during production. Afari et al. [20] applied response surface methodology and found that producing bottomhole pressure and production period are the most influential factors on recovery. Badrouchi et al. [21] observed that CO2 exposure alters wettability toward more water-wet conditions. Badrouchi et al. [22] further demonstrated that sample size and water presence significantly affect recovery evaluation and CO2 penetration. Zhumakhanova et al. [23] used numerical simulation to show that CO2 huff-and-puff can enhance methane recovery and enable CO2 sequestration when diffusion and adsorption are considered. Kang et al. [24] characterized pore structure and found that mesopores dominate, while higher injection pressure above the MMP improves recovery from larger pores. Despite these advances, existing studies are predominantly confined to the core scale or one-dimensional models. Macroscopic sweep behavior, inter-zone fluid redistribution, and dynamic pressure field evolution cannot be adequately captured at these scales. Large-scale experimental validation remains critically lacking.
Asynchronous injection–production is a development mode distinct from continuous displacement, characterized by shutting in the production well during injection and reopening it after a soaking period [25]. It has been widely applied in tight sandstones, shale oil, and complex fault-block reservoirs. Yuan et al. [26] applied this technique to fault-block reservoirs and showed that injected fluid redistributes the remaining oil from central zones to boundaries, improving sweep efficiency. Gao et al. [27] conducted inter-fracture physical simulations and confirmed the feasibility of asynchronous injection–production for fractured horizontal wells. Based on field practice, Chen et al. [28] identified key controlling factors and demonstrated that artificial fractures enhance imbibition and oil–water exchange, improving recovery. Kang et al. [29] optimized injection–production parameters through numerical simulation and validated them with field tests. Yu et al. [30] proposed intra-well segmented asynchronous injection–production and confirmed the superiority of natural gas over N2, extending the technique to single-well applications. Yang et al. [31] showed that asynchronous adjustment can stabilize production, control water cut, and enhance recovery in high water-cut stages. Li et al. [32] used numerical simulation to reveal that asynchronous injection–production reduces oil saturation more effectively than cyclic or synchronous modes and promotes flow into smaller pores. Chen et al. [33] extended the method to CO2 flooding and demonstrated that pressure fluctuations suppress channeling and enhance oil mobilization in low-permeability regions. However, existing studies have largely focused on waterflooding or conventional gas flooding. A systematic mechanistic comparison between CO2 asynchronous injection–production and synchronous huff-and-puff under low-permeability miscible flooding conditions has not been reported.
As hydrocarbon exploration extends into deep, unconventional, and strongly heterogeneous reservoirs, traditional small-scale core and sand-pack experiments are increasingly inadequate to represent complex multi-field coupling processes. Large-scale two- and three-dimensional physical simulation has therefore become a critical tool linking theory, numerical simulation, and field practice. Hou et al. [34] used large-scale specimens to study fracture initiation and propagation under reservoir-like conditions. Li et al. [35] developed an experimental system to investigate interlayer interference during commingled coalbed methane production, revealing the role of pressure gradients and production schemes. Yang et al. [36] analyzed the effects of stress, cement content, and grain size, establishing a model for controllable large-scale heterogeneous physical models. Zhao et al. [37] built a true triaxial large-scale system to simulate multi-well injection–production processes. Fang et al. [38] employed a three-dimensional model to examine water invasion in gas reservoirs, identifying fractures and high-permeability zones as dominant pathways. However, existing large-scale studies lack effective monitoring of fluid saturation and pressure fields.
Although extensive research has been conducted, current efforts still exhibit two notable limitations. First, existing experiments are largely confined to the small core scale, with few large-scale physical simulations reported. Second, the dynamic evolution of pressure and saturation fields during the oil displacement process has yet to be systematically monitored or quantitatively characterized. To address these issues, this study focuses on low-permeability reservoirs. The phase behavior of the CO2–crude oil system is first analyzed. Subsequently, a large-scale, high-temperature, high-pressure, two-dimensional physical profile experiment of CO2 miscible displacement is performed [39], and a comparative analysis is conducted on the mechanisms governing the displacement efficiency of synchronous huff-and-puff versus asynchronous injection–production. Numerical simulation is then employed to history-match the experimental results, thereby validating the accuracy and reliability of the experiments. The present study scales up the experimental platform from the core level to the meter scale, overcoming the spatial limitations of conventional small-scale experiments. A self-developed acoustic–electric scanning system, combined with a distributed pressure monitoring system, enables dynamic tracking of fluid saturation fields and pressure distributions throughout the displacement process. Building on this experimental platform, the oil displacement performance of two promising development strategies, CO2 huff-and-puff and asynchronous injection–production, is systematically evaluated. The findings provide theoretical support for the efficient development of low-permeability reservoirs.

2. Methodology

2.1. Analysis of Blended Crude Oil Phase Behavior

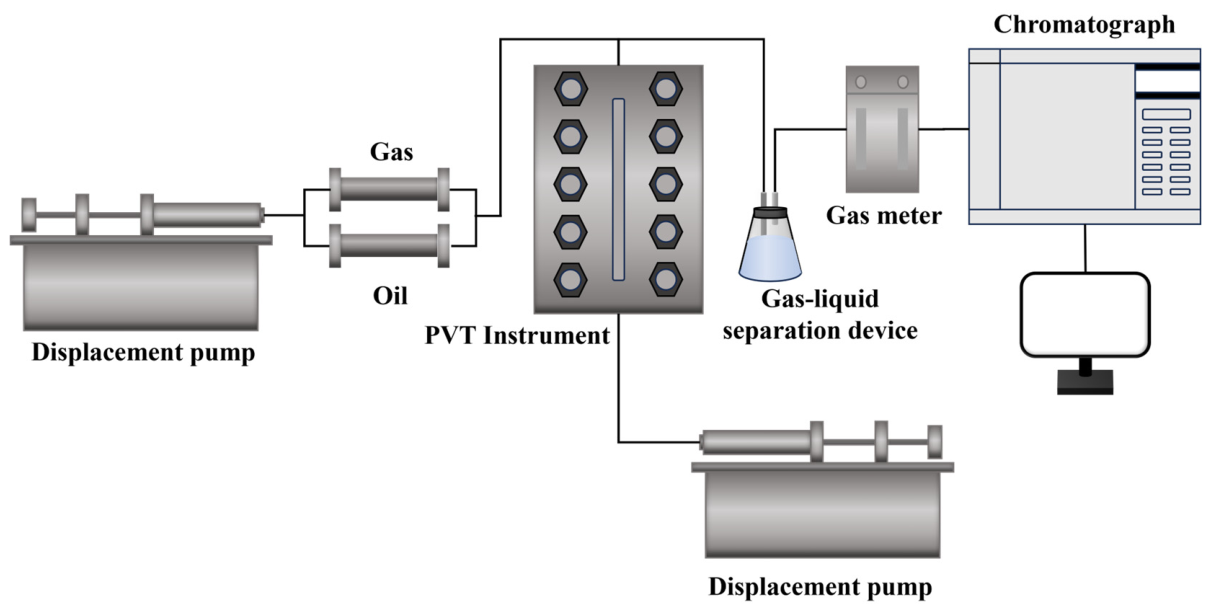
The original reservoir temperature was 110 °C, and the formation pressure was 33 MPa. The solution gas–oil ratio of the crude oil measured at the oilfield site was 29.95 m3/m3. Under the above temperature and pressure conditions, the crude oil was recombined according to this solution gas–oil ratio to obtain live oil representative of formation conditions. Subsequently, the physical properties of the recombined oil were measured, and the specific testing procedure is shown in Figure 1.

2.2. PVT Property Measurements

The constant composition expansion (CCE) experiment was conducted to investigate the pressure–volume relationship of crude oil with a fixed mass at reservoir temperature. The experiment was performed at a formation temperature of 110 °C. First, the simulated crude oil sample was injected into the PVT cell, and the system pressure was increased to the initial pressure of 35 MPa to ensure that the fluid remained in a single-phase state. The system pressure was then stepwise reduced from 35 MPa to 2 MPa. After the system had fully stabilized at each preset pressure point, the crude oil volume was measured and recorded. Based on the experimental results, the relationship between crude oil volume and pressure was obtained.
The swelling test was conducted to investigate the variation in the physical properties of reservoir crude oil under different gas injection amounts. This experiment allows the key parameters of crude oil, including saturation pressure, gas–oil ratio, expansion coefficient, and viscosity, to be characterized at different gas injection levels. The experiment was performed at 110 °C. First, an appropriate amount of the prepared simulated crude oil was transferred into the PVT cell, and the key parameters under the initial condition, including saturation pressure, expansion coefficient, gas–oil ratio, and viscosity, were measured. Subsequently, CO2 was injected into the system stepwise, and the injection amount was expressed as a molar percentage. The injection proportions were set sequentially at 0, 10%, 20%, 30%, 40%, and 50%. After each gas injection step, the oil and gas phases were brought into full contact by pressurization and stirring to form a single-phase system. Once the system had fully stabilized, the saturation pressure, expansion coefficient, gas–oil ratio, and other relevant parameters under the corresponding condition were remeasured. The measured data were carefully recorded at each experimental step.

2.3. Measurement of MMP

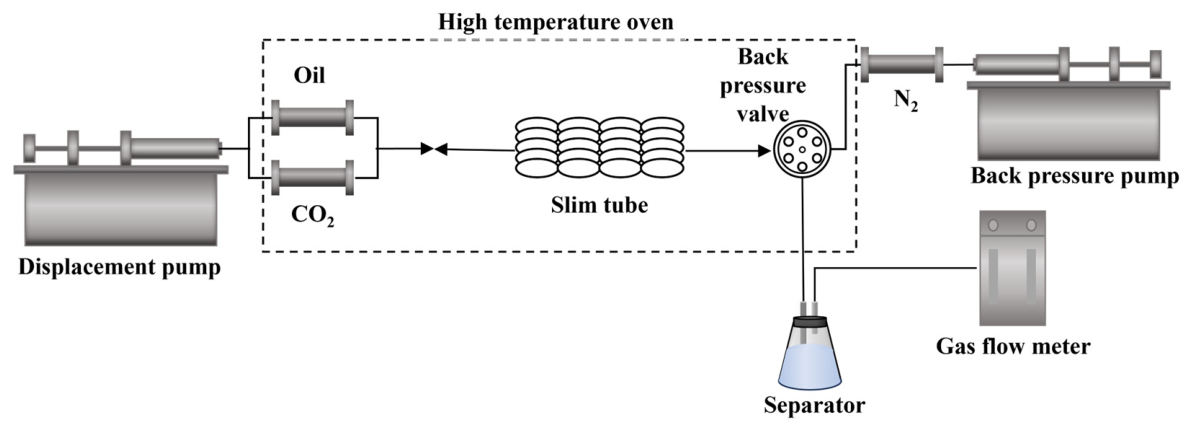
The minimum miscibility pressure (MMP) of crude oil is commonly determined using a slim tube test. This method can realistically reflect the phase behavior evolution of fluids and the formation and development of the miscible zone during gas displacement and is therefore regarded as a classical approach for distinguishing miscible flooding from immiscible flooding. In this study, the slim tube apparatus mainly consisted of a displacement pump, an intermediate container, a slim tube model, a constant-temperature oven, a back-pressure valve, a gas–liquid separation unit, and a gas meter. The experimental oil was recombined reservoir crude oil prepared in the laboratory, and the injected gas was pure CO2. The slim tube used in the experiment had a length of 15 m, an inner diameter of 3.8 mm, a porosity of 23.46%, and a pore volume of 39.91 cm3. With reference to the formation pressure, 15 MPa, 20 MPa, 27 MPa, 30 MPa, 33 MPa, and 35 MPa were selected as the experimental pressure points. The experimental procedure is shown in Figure 2.
During the experiment, degassed crude oil was first injected into the slim tube model using the displacement pump, while the system temperature and pressure were maintained at 110 °C and the preset experimental pressure, respectively. Subsequently, the prepared live reservoir crude oil was injected to displace the degassed crude oil initially contained in the model. When the gas–oil ratio of the produced crude oil measured at the outlet was identical to that of the prepared live oil for three consecutive measurements, the crude oil in the slim tube model was considered to have been restored to its original reservoir state. CO2 was then injected into the slim tube model through the intermediate container at a constant flow rate of 0.125 mL/min to conduct the gas flooding experiment. During the test, the oil and gas production volumes were recorded at regular intervals. The experiment was terminated when the cumulative CO2 injection reached 1.20 PV.

2.4. Large-Scale Physical Simulation Experiment

The large-scale two-dimensional physical simulation experiment was used to observe the distribution characteristics of residual oil saturation. The experimental gas was CO2 with a purity of 99.99%, and the water sample was simulated formation water with a salinity of 13,379 mg/L. The experimental apparatus mainly consisted of an automatic displacement pump (0–70 MPa), a large-scale high-temperature high-pressure two-dimensional plate model system (Chengdu Haohan Completion Rock-Electric Co., Ltd., Chengdu, China; maximum operating pressure of 70 MPa and maximum temperature of 150 °C), a confining pressure pump (0–90 MPa), a back-pressure pump, a gas–liquid separator, an intermediate container, a back-pressure valve, and pressure sensors. The acoustic–electric scanning system integrated into the large-scale high-temperature high-pressure two-dimensional plate model was used to monitor the acoustic transit time and resistivity within the model in real time. Based on a self-developed real-time monitoring platform, the acoustic transit time and resistivity data were converted into gas–water distribution information, which was then used to further calculate the distribution of residual oil saturation.
The acoustic–electric scanning system comprises four core components:
  • The acoustic detection unit transmits compressional waves through the rock plate via acoustic probes and records the transit time (ΔT), from which gas saturation is derived using the calibration Equation (1).
S g = a Δ T + b
2.
The resistivity detection unit generates an alternating magnetic field through an induction coil, inducing eddy currents within the rock plate. The resulting resistivity values are obtained through bridge circuit processing and combined with the Archie Equation (2) to calculate water saturation. Oil saturation is subsequently determined as Equation (3). Both probes operate in a non-contact mode, eliminating the risk of seal leakage associated with conventional electrode contact, and the acoustic and resistivity signals are fully independent to ensure data integrity.
R 0 R t = b S w n
S o = 1 S g S w
3.
A stepper-motor-driven X/Y dual-axis scanning system moves the probes along a “z” path across the full model surface, achieving millimeter-level resolution for high-density spatial sampling and accurate probe positioning.
4.
Real-time data acquisition and imaging are achieved through a VB-based monitoring platform, which integrates acoustic and resistivity data and converts them into pseudo-color images to visualize the dynamic distribution of residual oil saturation throughout the experiment.
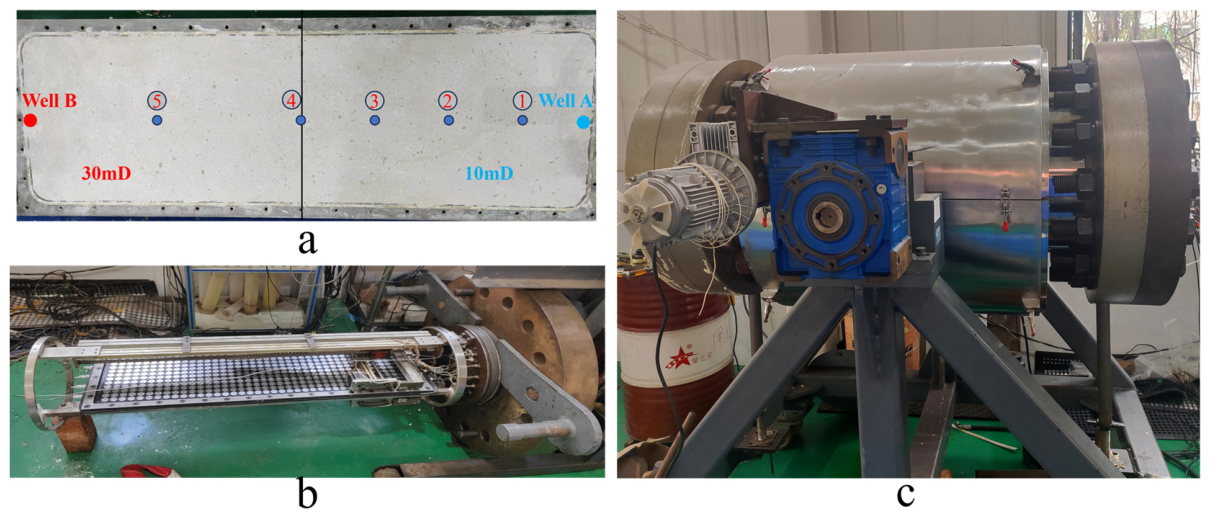
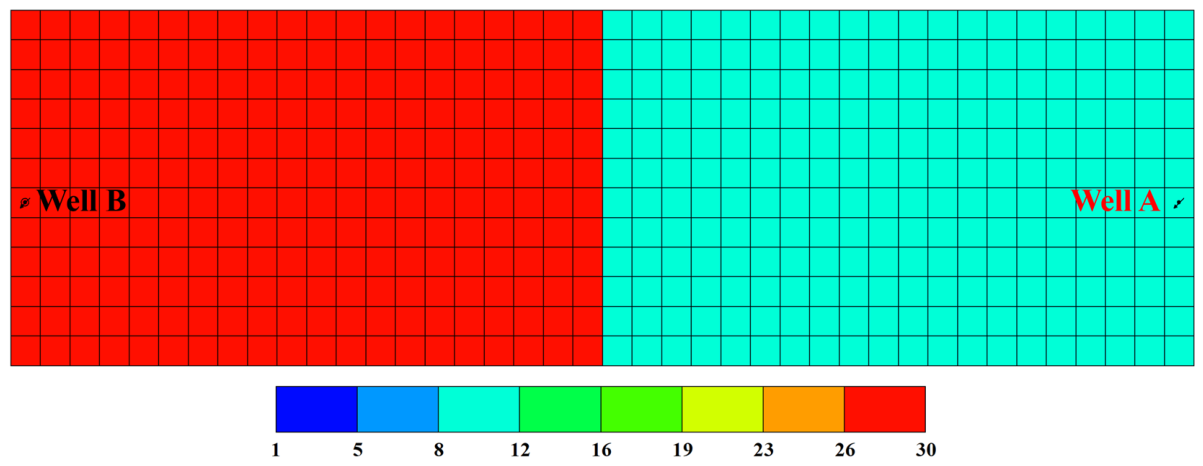
In this experiment, the rock plate was divided into two equal-area regions with permeabilities of 30 mD and 10 mD, respectively, and five pressure sensors were installed within the model to monitor pressure variations in real time. The simulated CO2 injection well group consisted of two wells, designated Well A and Well B. The model design is shown in Figure 3a. The plate mold used in this experiment had dimensions of 100 cm (length) × 30 cm (width) × 1 cm (height). It was internally packed with artificial sand bodies, with an adjustable permeability range of 0.1–5000 mD, enabling a reasonable simulation of the pore structure of real reservoirs. The fabrication procedure was relatively complex. First, 70–140 mesh quartz sand was thoroughly mixed with a cementing agent and packed into the mold, followed by air drying for shaping. Small plug cores were then drilled from the prepared material to measure petrophysical properties such as permeability and porosity, and the formulation was repeatedly adjusted based on the test results. After obtaining the formulation ratio that satisfied the target porosity and permeability required for the experiment, the final rock plate model was prepared through formal sand packing, air drying, and polishing in the mold.
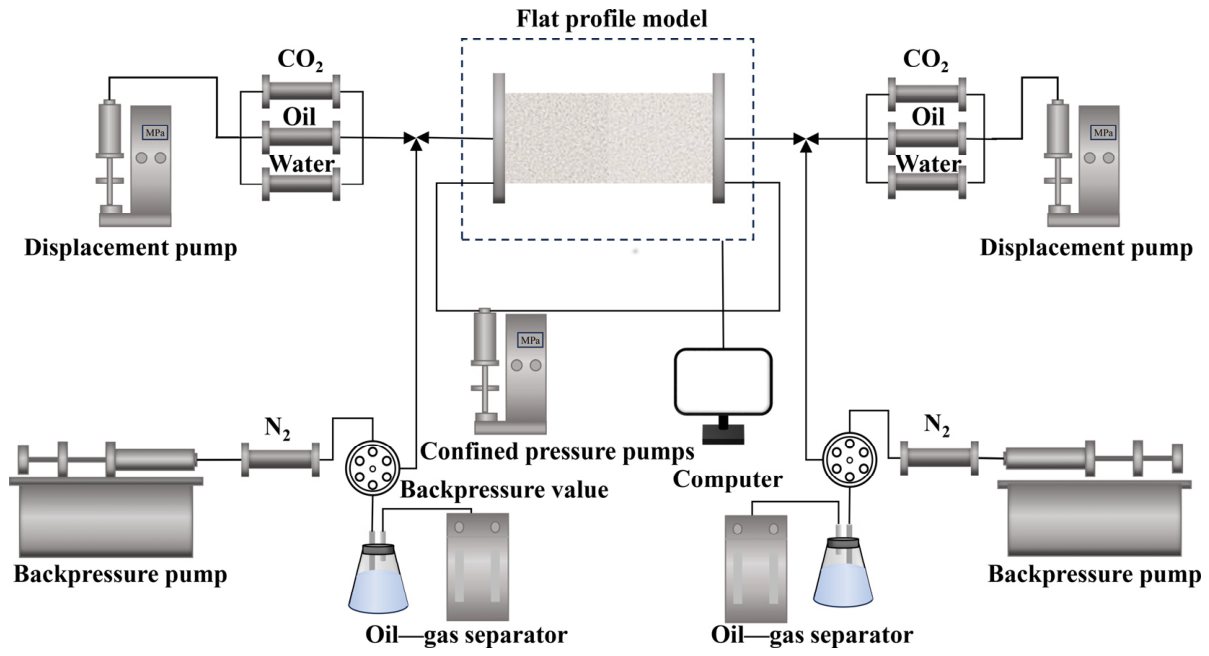
The experimental procedure is shown in Figure 4. First, the recombined crude oil, CO2 gas, and water sample were separately loaded into intermediate containers for subsequent use. Meanwhile, the prepared rock plate was placed horizontally inside the vessel and secured with nuts to ensure good sealing performance of the vessel. The experimental equipment was then connected according to the flowchart, after which the formal experiment commenced.
First, the experimental temperature was set at 110 °C, and the rock plate was subjected to vacuum treatment for 3 h to completely remove residual fluids from the pore space. Nitrogen was then introduced into the vessel, and the valve of Well A was opened. The sealing performance of the system was verified by checking whether nitrogen was produced at the outlet. After confirming that the system was well sealed, hydraulic oil was gradually injected into the vessel using a displacement pump to establish a confining pressure of 33 MPa, while the water sample was simultaneously injected into the rock plate to complete the water saturation process. Throughout the experiment, the confining pressure was maintained at 5 MPa higher than both the inlet and outlet pressures.
After the rock plate had been fully saturated with water, recombined crude oil was injected at a constant pressure of 33 MPa to displace the water phase until the rock plate reached a fully oil-saturated state, thereby establishing the irreducible water condition in the model. During the saturation process, the rock plate was monitored in real time using the acoustic–electric scanning system to ensure uniform distribution of crude oil within the pore space. Under the reservoir temperature of 110 °C and the formation pressure of 33 MPa, CO2 synchronous huff-and-puff and asynchronous injection–production oil displacement experiments were carried out according to the predefined schemes. The detailed procedures of the two experimental schemes are described as follows:
Synchronous huff-and-puff: First, Wells A and B were synchronously depleted at a pressure decline rate of 1 MPa/h until the pressure inside the model decreased to 20 MPa, after which four cycles of synchronous huff-and-puff were carried out. In each cycle, CO2 was simultaneously injected into the model through Wells A and B at a constant rate of 1 mL/min. When the inlet pressure reached 33 MPa, the injection mode was switched to constant-pressure injection, allowing the pressure inside the rock plate to recover to 33 MPa and thereby replenish formation energy. After gas injection, the model was shut in for 7 h. During the shut-in period, the model pressure reaches equilibrium. Upon completion of the shut-in period, the model pressure was again synchronously depleted to 20 MPa at a pressure decline rate of 1 MPa/h, thus completing one huff-and-puff cycle. After four consecutive cycles of this process, the experiment was terminated.
Asynchronous injection–production: First, Wells A and B were synchronously depleted at a pressure decline rate of 1 MPa/h until the pressure inside the model decreased to 20 MPa, after which the experiment entered the stage of four cycles of asynchronous injection–production. During each cycle, injection and production were not allowed to occur simultaneously; that is, no production was permitted during the injection stage, and no injection was allowed during the production stage. In addition, the injection direction was always from the low-permeability zone (10 mD) toward the high-permeability zone (30 mD). The specific procedure was as follows: First, Well B, located in the high-permeability zone, was shut in, while Well A, located in the low-permeability zone, was opened for CO2 injection into the model. When the injection-well pressure reached 33 MPa, the injection mode was switched to constant-pressure injection, allowing the pressure inside the model to recover to 33 MPa. After gas injection, Well A was shut in, and the model entered a 7 h shut-in period. After the shut-in stage, Well B was opened for depletion production until the internal model pressure declined to 20 MPa, thus completing one cycle of asynchronous injection–production. After four consecutive cycles of this process, the experiment was terminated. Throughout all stages of the experiment, the oil saturation in the rock plate was monitored in real time using the acoustic–electric scanning system so as to accurately characterize the residual oil saturation and its spatial distribution.
The following boundary conditions and simplifying assumptions were applied throughout the experiments: The experimental temperature was fixed at 110 °C, and the confining pressure was maintained at 33 MPa and held at 5 MPa above both the inlet and outlet pressures at all times. During injection, a constant rate of 1 mL/min was applied until the inlet pressure reached 33 MPa, after which the mode was switched to constant-pressure injection. During depletion, pressure was reduced at a controlled rate of 1 MPa/h until the internal model pressure reached 20 MPa, and the shut-in period was fixed at 7 h per cycle. No fluid communication was permitted at the model perimeter except at the designated well locations. Regarding simplifying assumptions, each permeability zone was treated as laterally homogeneous, with heterogeneity represented solely by the binary permeability contrast between the two zones (10 mD and 30 mD). Gravitational effects were considered negligible given the 1 cm model thickness and horizontal placement. Capillary end effects at the model boundaries were assumed to be negligible under the high operating pressures applied. Finally, the recombined crude oil was taken as representative of the original reservoir fluid.

2.5. Numerical Simulation Study

A mechanistic model was established using the c, and history matching was performed separately for the crude oil phase behavior experiments and the large-scale physical simulation experiments to verify the accuracy and reliability of the experimental results. First, the Winprop module in CMG was used to regress and match the crude oil phase behavior data in order to examine the variation in key fluid-property parameters after crude oil recombination. On this basis, the pressure–volume (P-V) relationship obtained from the constant-mass expansion test, the variation patterns of fluid-property parameters during the gas-injection expansion test, and the minimum miscibility pressure were further analyzed. The fluid-property parameters mainly included saturation pressure, differential liberation gas–oil ratio, formation volume factor, density, and viscosity. Subsequently, a mechanistic model was built using the Builder module in CMG, and the large-scale physical simulation experiments were numerically simulated on the basis of this model. The numbers of grid blocks in the I, J, and K directions were 12, 40, and 1, respectively, with corresponding grid dimensions of 2.5 cm, 2.5 cm, and 1 cm. The geometric dimensions of the model were consistent with those of the experimental rock plate, and the model parameters were set in accordance with the experimental conditions. The permeability distribution of the model is shown in Figure 5. In the numerical model, the outer boundaries of the model domain were treated as no-flow boundaries, consistent with the sealed perimeter of the physical rock plate. Well constraints were implemented to replicate the experimental operating conditions: constant-rate injection (1 mL/min) switching to constant-pressure injection at 33 MPa during injection stages, and constant pressure-decline production at 1 MPa/h during depletion stages. The EOS-based compositional simulation framework in CMG was used to compute phase equilibrium and fluid properties as continuous functions of local pressure and composition, implicitly capturing the miscible-to-immiscible transition across the MMP. Rock compressibility and thermal effects were assumed to be negligible given the rigid artificial sand-pack construction and isothermal operating conditions.

3. Results and Discussion

3.1. Phase Behavior Analysis of Recombined Crude Oil

The results of crude oil recombination and numerical simulation matching are presented in Table 1. It can be seen that the fluid-property parameters of the recombined crude oil are generally consistent with those of the original reservoir crude oil, indicating that the recombined crude oil can effectively represent the original reservoir fluid. Meanwhile, the numerical simulation matching results are in good agreement with the measured properties of the recombined crude oil, suggesting that the established numerical model is reasonably reliable and can be used for subsequent matching analyses.
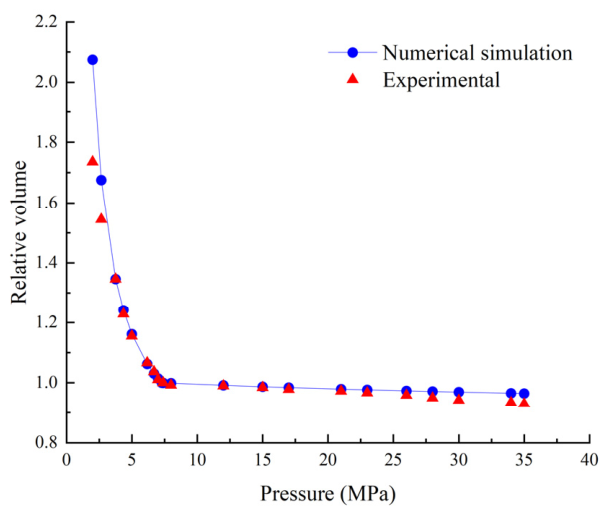
Figure 6 illustrates the variation in the relative volume of crude oil with pressure obtained from the constant-mass expansion test. As shown in Figure 6, when the pressure was higher than 7.40 MPa, the relative volume of crude oil exhibited no obvious change as the pressure decreased, indicating that the system remained in a single liquid phase. When the pressure declined to 7.40 MPa, the slope of the curve changed markedly, and the crude oil volume increased sharply, suggesting that a large amount of dissolved gas began to evolve and that the system gradually transitioned from a single liquid phase to a two-phase oil–gas state. Therefore, 7.40 MPa was identified as the saturation pressure of the reservoir crude oil. Meanwhile, the experimental curve showed good agreement with the history-matched numerical simulation curve, which further confirms the reliability of the experimental results.
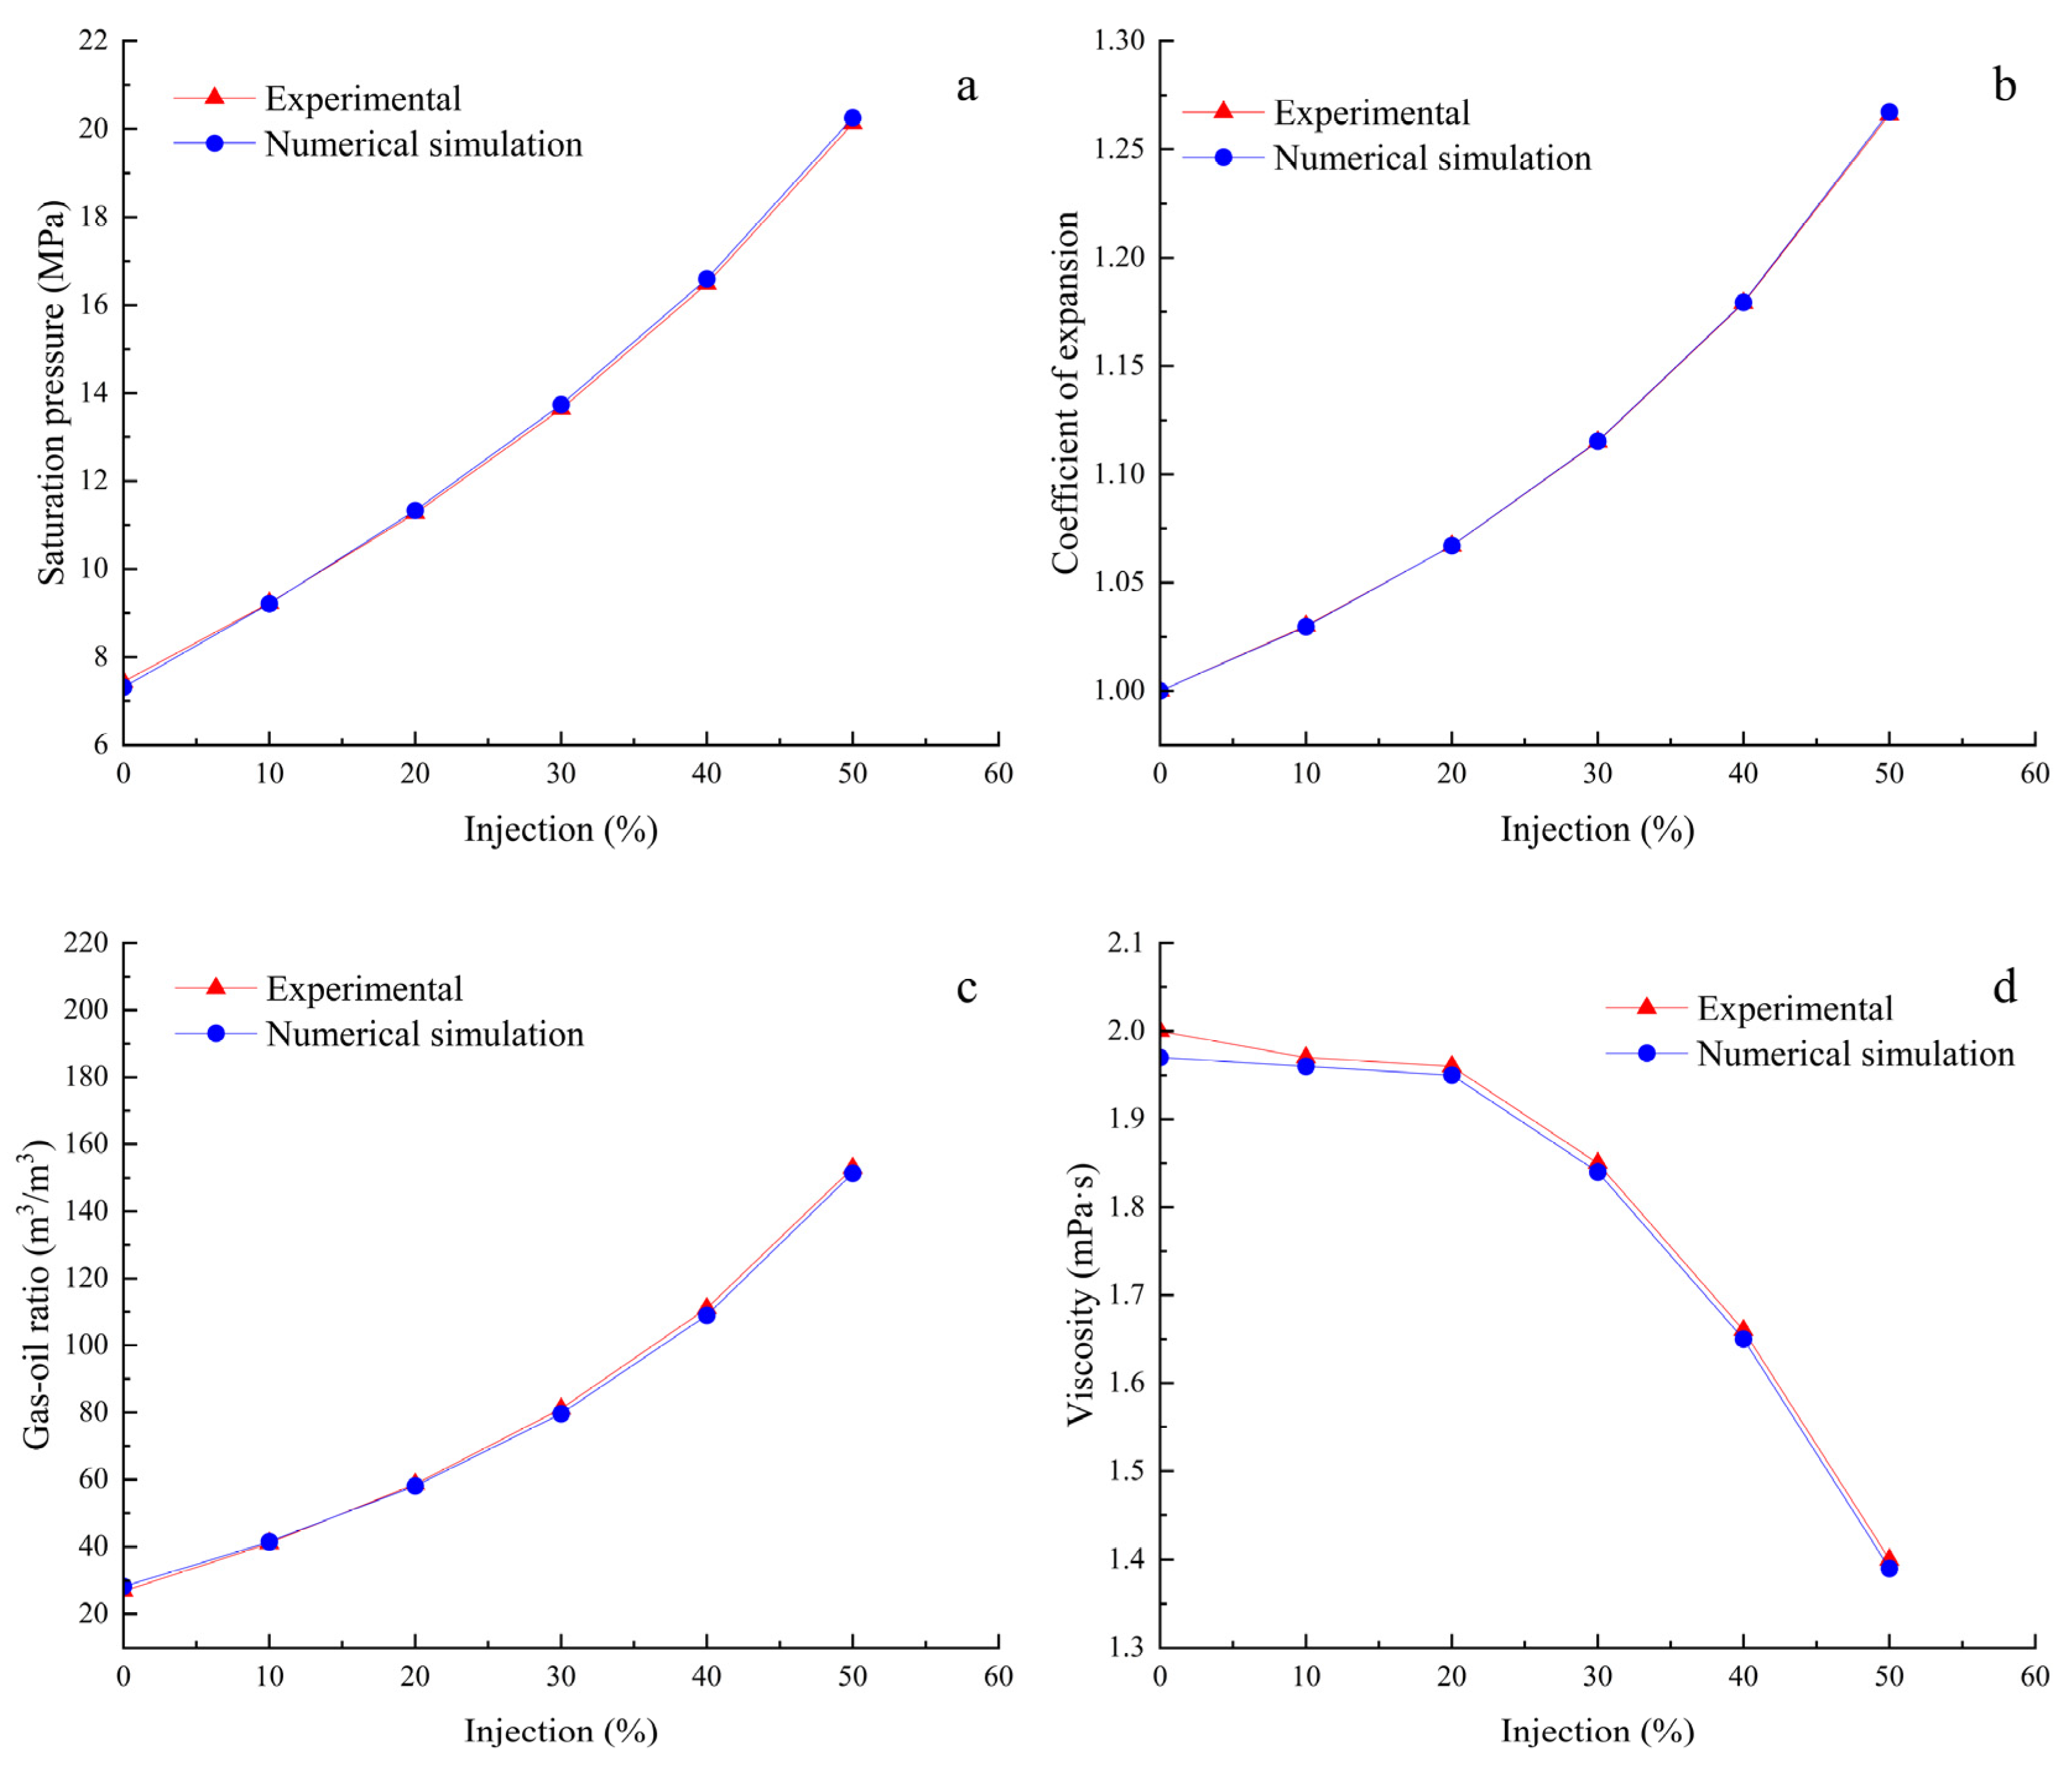
Figure 7 shows the variation in crude oil physicochemical properties with increasing CO2 injection. As shown in Figure 7, the saturation pressure of the oil sample increased continuously with increasing CO2 injection. Under the initial condition, the saturation pressure of the simulated oil sample was 7.40 MPa. When the CO2 injection amount increased to 50 mol%, the saturation pressure rose to 20.12 MPa, which was 2.7 times the initial value. As gas injection proceeded, the crude oil composition continuously changed, and the saturation pressure kept increasing without reaching a critical condition, indicating that the minimum miscibility pressure of this crude oil sample for CO2 miscible flooding should be higher than 20.12 MPa. Meanwhile, the solution gas–oil ratio also increased continuously with increasing CO2 injection. Under the initial condition, the solution gas–oil ratio of the crude oil was 26.95 m3/m3. When the CO2 injection amount reached 50 mol%, the solution gas–oil ratio increased to 152.94 m3/m3, representing a 5.67-fold increase. The pronounced increase in gas–oil ratio indicates that CO2 has a high dissolution capacity in crude oil. The oil expansion factor likewise showed a continuous upward trend with increasing CO2 injection. Under the initial condition, the expansion factor was 1.000, and when the CO2 injection amount reached 50 mol%, it increased to 1.266, indicating that CO2 dissolution effectively enhanced the swelling capacity and elastic energy of the reservoir crude oil. In contrast, the viscosity of crude oil decreased continuously with increasing CO2 injection. Under the initial condition, the crude oil viscosity was 2.0 mPa·s, and when the CO2 injection amount reached 50 mol%, the viscosity decreased to 1.4 mPa·s. As the gas injection amount further increased, the magnitude of viscosity reduction became more pronounced, indicating that CO2 exhibited a stronger viscosity-reduction effect under higher-pressure conditions. The experimental curves showed good agreement with the history-matched numerical simulation curves, further confirming the accuracy of the experimental results.
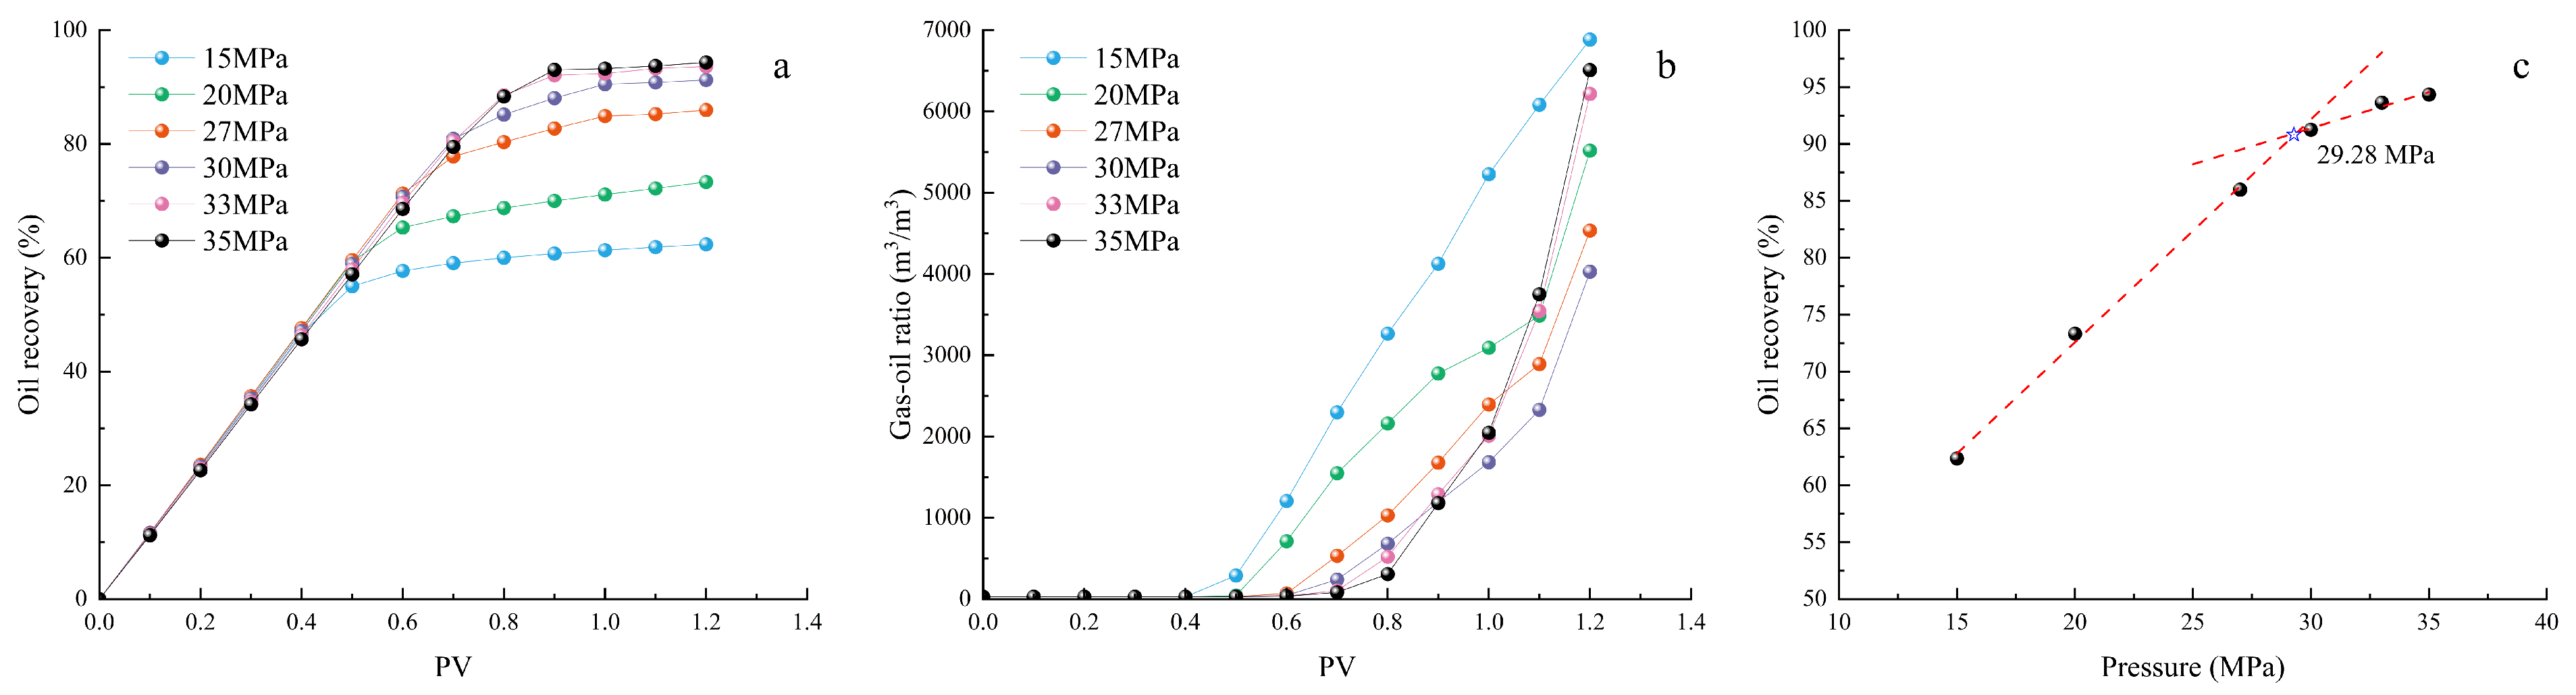
The results of the minimum miscibility pressure test are shown in Figure 8. The results indicate that before gas breakthrough, the gas–oil ratio changed only slightly, while the oil recovery increased steadily with increasing injected volume. After gas breakthrough, as gas channeling pathways gradually developed, the gas–oil ratio increased sharply, and the growth in oil recovery slowed markedly before eventually approaching a stable level. With increasing experimental pressure, the CO2 breakthrough point was significantly delayed, and the differences in final oil recovery among the various pressure conditions gradually decreased. As shown in Figure 8a, during the immiscible flooding stage, the oil recovery increased significantly from 62.36% to 85.98% with increasing experimental pressure, indicating a substantial improvement. When the pressure increased to approximately 30 MPa, the system transitioned from an immiscible state to a miscible state, with the corresponding oil recovery reaching 91.25%. After entering the miscible flooding stage, a further increase in pressure to 35 MPa resulted in only a limited increase in oil recovery, from 91.25% to 94.35%, indicating a clear slowdown in the growth trend. According to the inflection point in the slope of the recovery curve shown in Figure 8c, the minimum miscibility pressure of the recombined crude oil–CO2 system was determined to be 29.28 MPa. This value is lower than the original reservoir pressure of 33 MPa, indicating that CO2 injection under actual reservoir conditions is feasible for achieving miscible displacement.

3.2. Development Performance of Synchronous Huff-And-Puff Mode

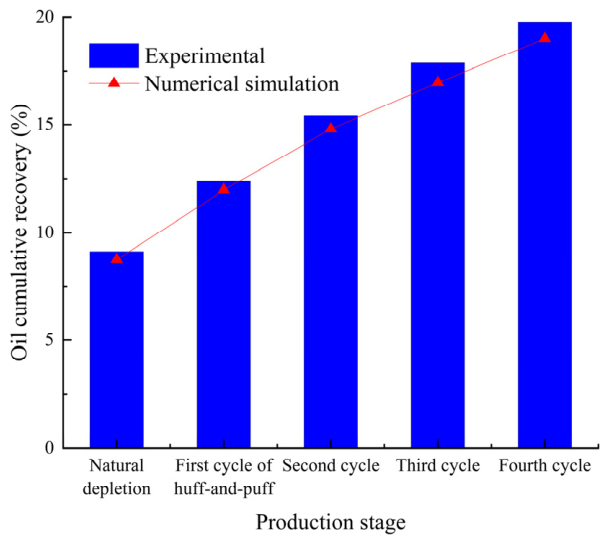
Figure 9 presents the variation in cumulative oil recovery obtained from the experiments. The results show that the cumulative recoveries after natural depletion and the subsequent four huff-and-puff cycles were 9.11%, 12.39%, 15.41%, 17.86%, and 19.77%, respectively. This indicates that four cycles of synchronous CO2 huff-and-puff further improved oil recovery by 10.66% on the basis of natural depletion; however, the incremental recovery decreased progressively with increasing cycle number.
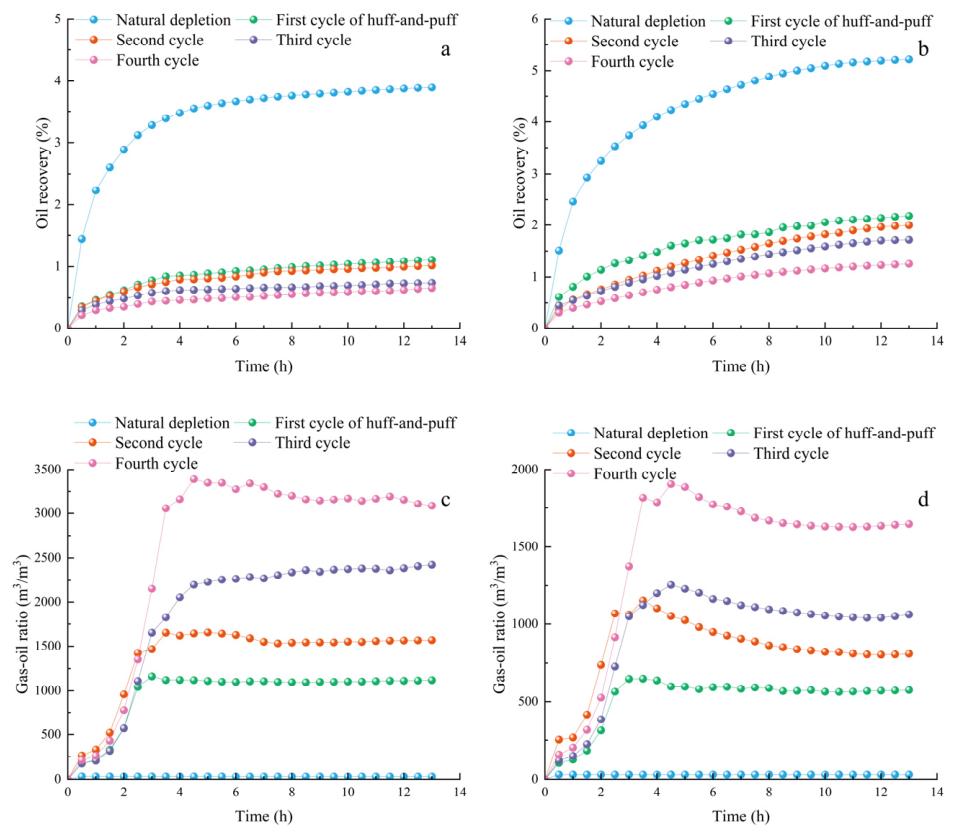
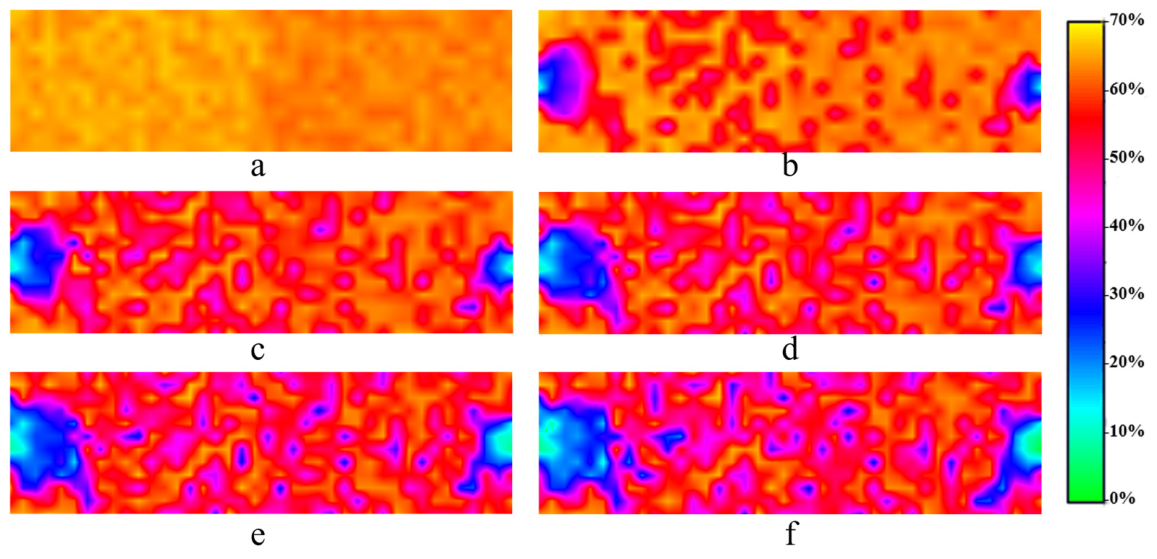
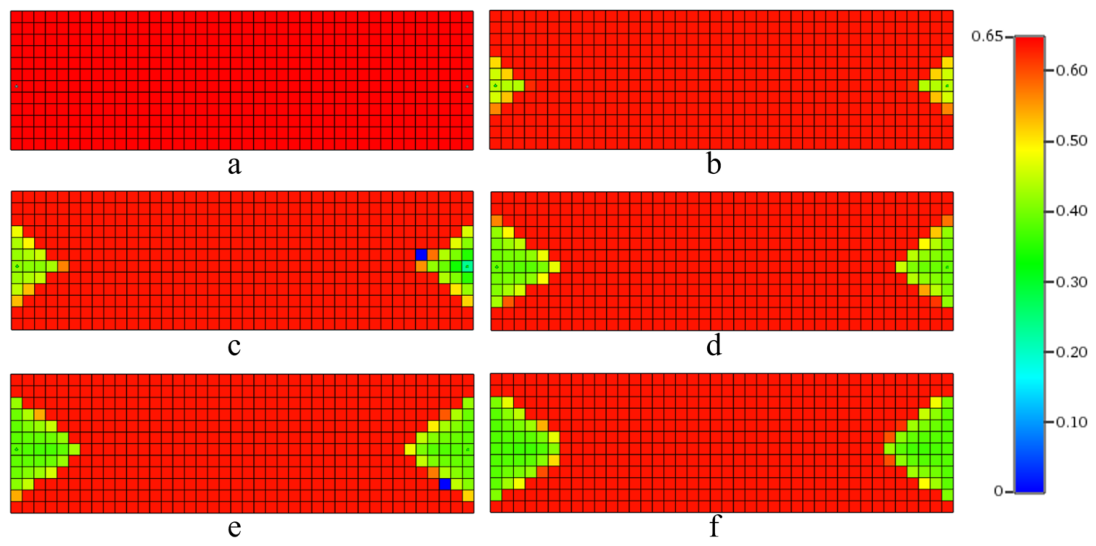
During the natural depletion stage, when the pressure declined from 33 MPa to 20 MPa, the elastic energy stored in the reservoir fluids and rock was released, resulting in substantial mobilization of residual oil in the near-well and interwell regions. As can be seen from Figure 10, with the increase of huff-and-puff cycles, the gas-oil ratio gradually rises, gas breakthrough gradually occurs, and the recovery factor decreases cycle by cycle. Well A shows a lower recovery factor and a higher gas-oil ratio than Well B in each cycle, indicating severe gas channeling in the low-permeability zone and poorer oil recovery performance compared with the high-permeability zone. The corresponding oil-saturation distribution shown in Figure 11b indicates that extensive low-oil-saturation zones were formed inside the model, suggesting relatively sufficient mobilization of residual oil around the wells. In this stage, the recovery of Well A was lower than that of Well B (Figure 10a,b), and the recovery in the high-permeability zone was higher than that in the low-permeability zone. The gas–oil ratios of both Wells A and B remained at approximately 30 m3/m3, indicating that the produced gas was mainly controlled by dissolved gas release, with only minor differences between the two wells. After entering the synchronous CO2 huff-and-puff stage, both the injection pressure and the shut-in pressure were higher than the minimum miscibility pressure, allowing relatively sufficient miscible mass transfer between CO2 and crude oil. As a result, the gas–oil ratios of both wells increased significantly. With increasing huff-and-puff cycles, the gas–oil ratio of Well A increased from 1121.23 m3/m3 to 3086.05 m3/m3, while that of Well B increased from 576.54 m3/m3 to 1646.16 m3/m3. Both wells exhibited a cycle-by-cycle increasing trend, although the increase in Well A was more pronounced. This suggests that, during multiple huff-and-puff cycles, the oil-phase supply capacity of the low-permeability zone declined more rapidly, while CO2-rich gas continued to be produced, thereby causing the gas–oil ratio to rise sharply. By contrast, because of the higher degree of movable oil mobilization in the high-permeability zone, its gas–oil ratio remained consistently lower than that of the low-permeability zone, indicating better huff-and-puff development performance. The oil-saturation-field results shown in Figure 11 further demonstrate that, with increasing cycle number, the low-oil-saturation zones around the wells expanded progressively, the oil saturation in the interwell region decreased cycle by cycle, and the difference in mobilization degree between the high-permeability and low-permeability zones became increasingly pronounced. The experimental recovery curves and oil saturation distributions showed good agreement with the history-matched numerical simulation results (Figure 12), with an R2 of 0.9702 between the simulated and experimental cumulative oil recovery values, further confirming the accuracy of the experimental results.
The above differences can be mainly attributed to the stronger flow capacity and faster pressure-transmission efficiency of the high-permeability zone, which enabled it to preferentially establish effective flow channels and thus caused a rapid decline in oil saturation. In contrast, the low-permeability zone was constrained by its weaker flow capacity and the restraining effect of capillary forces, resulting in limited oil mobilization and a consistently higher residual oil saturation. During the synchronous huff-and-puff process, this heterogeneity-induced zonal contrast became further amplified. The oil-saturation-field results show that CO2 achieved a wider swept region in the high-permeability zone, where the residual oil in the central part of the reservoir was substantially mobilized, and the low-oil-saturation region gradually expanded. By contrast, in the low-permeability zone, the areal sweep of CO2 remained limited, the residual oil in the far-well region was mobilized to a much lesser extent, and the reduction in oil saturation was comparatively small. Therefore, throughout the successive huff-and-puff cycles, the high-permeability zone maintained a relatively high stage recovery, whereas the contribution of the low-permeability zone to the overall oil recovery remained limited.
The dynamic variation of pressure within the reservoir helps to further elucidate the controlling mechanism of reservoir heterogeneity on pressure propagation. As shown in Figure 13, during the gas injection stage, pressure transmission was relatively efficient in the near-well region, and the pressures recorded by Sensor 5 in the high-permeability zone and Sensor 1 near the wellbore in the low-permeability zone increased rapidly. As the distance between the monitoring points and the injection well increased, the pressurization rates of Sensors 2 and 3 located in the deeper part of the low-permeability zone exhibited a clear gradient attenuation trend. In contrast, Sensor 4, located at the center of the model, showed the most delayed pressure response and did not gradually approach equilibrium with the formation pressure until the shut-in stage. This phenomenon indicates that the low-permeability medium exerts a significant retarding effect on pressure-wave propagation.
At the initial stage of gas injection, the pressure system was established preferentially in the high-permeability zone, causing the pressure difference between Monitoring Points 4 and 5 to increase rapidly to 1.4 MPa. In contrast, within the low-permeability zone, the pressure difference exhibited a stepwise decreasing trend from the near-well region toward the center of the model, namely, ΔP3,4 < ΔP2,3 < ΔP1,2. By the middle stage of gas injection, as the pressure in the high-permeability zone gradually approached a stable state, ΔP3,4 began to decrease progressively. During the depletion stage, the pressures recorded by Sensor 5 in the high-permeability zone and Sensor 1 near the wellbore in the low-permeability zone both declined rapidly. However, within the low-permeability zone, the pressure-lag phenomenon became increasingly pronounced with increasing distance from the production well. The pressure-decline rates at Monitoring Points 2 and 3 decreased successively, while the pressure release at Monitoring Point 4, located in the center of the model, was hindered most severely. Because the high-permeability zone underwent pressure depletion first, ΔP4,5 increased rapidly. By the middle stage of depletion, as the delayed pressure decline at Monitoring Point 4 became more pronounced, ΔP3,4 gradually decreased and tended toward stabilization.
In summary, the cycle-by-cycle decline in oil recovery during the synchronous huff-and-puff process resulted from the coupled effects of multiple factors. On the one hand, as the residual oil was progressively produced in successive cycles, the movable crude oil in the high-permeability zone and the near-well region was preferentially recovered, causing the remaining oil in the later stages to become concentrated mainly in the low-permeability zone and the central part of the model. This substantially increased the difficulty of mobilizing crude oil in subsequent huff-and-puff cycles. On the other hand, reservoir heterogeneity caused the injected CO2 to preferentially migrate along high-permeability pathways, resulting in repeated cycling of the injected gas through already swept regions and making it difficult to establish new effective displacement fronts. In addition, during the production stage, as the reservoir pressure gradually declined from 33 MPa to below the minimum miscibility pressure, the system progressively transitioned from a miscible state to an immiscible state. As a result, the interfacial tension increased and the microscopic oil displacement efficiency decreased, further limiting the incremental oil production capacity in the later stages of huff-and-puff. Under the combined influence of these factors, the extent of expansion of the low-oil-saturation zone in the saturation field decreased from cycle to cycle, which was ultimately manifested as a pronounced cycle-by-cycle decline in the recovery curve.

3.3. Development Performance of Asynchronous Injection–Production Mode

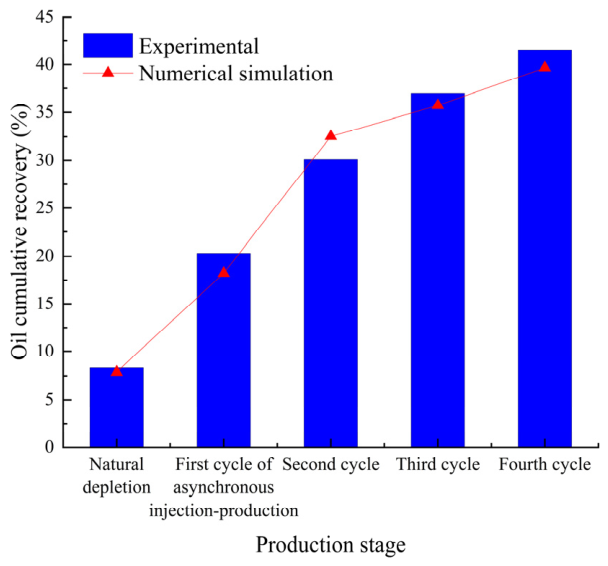
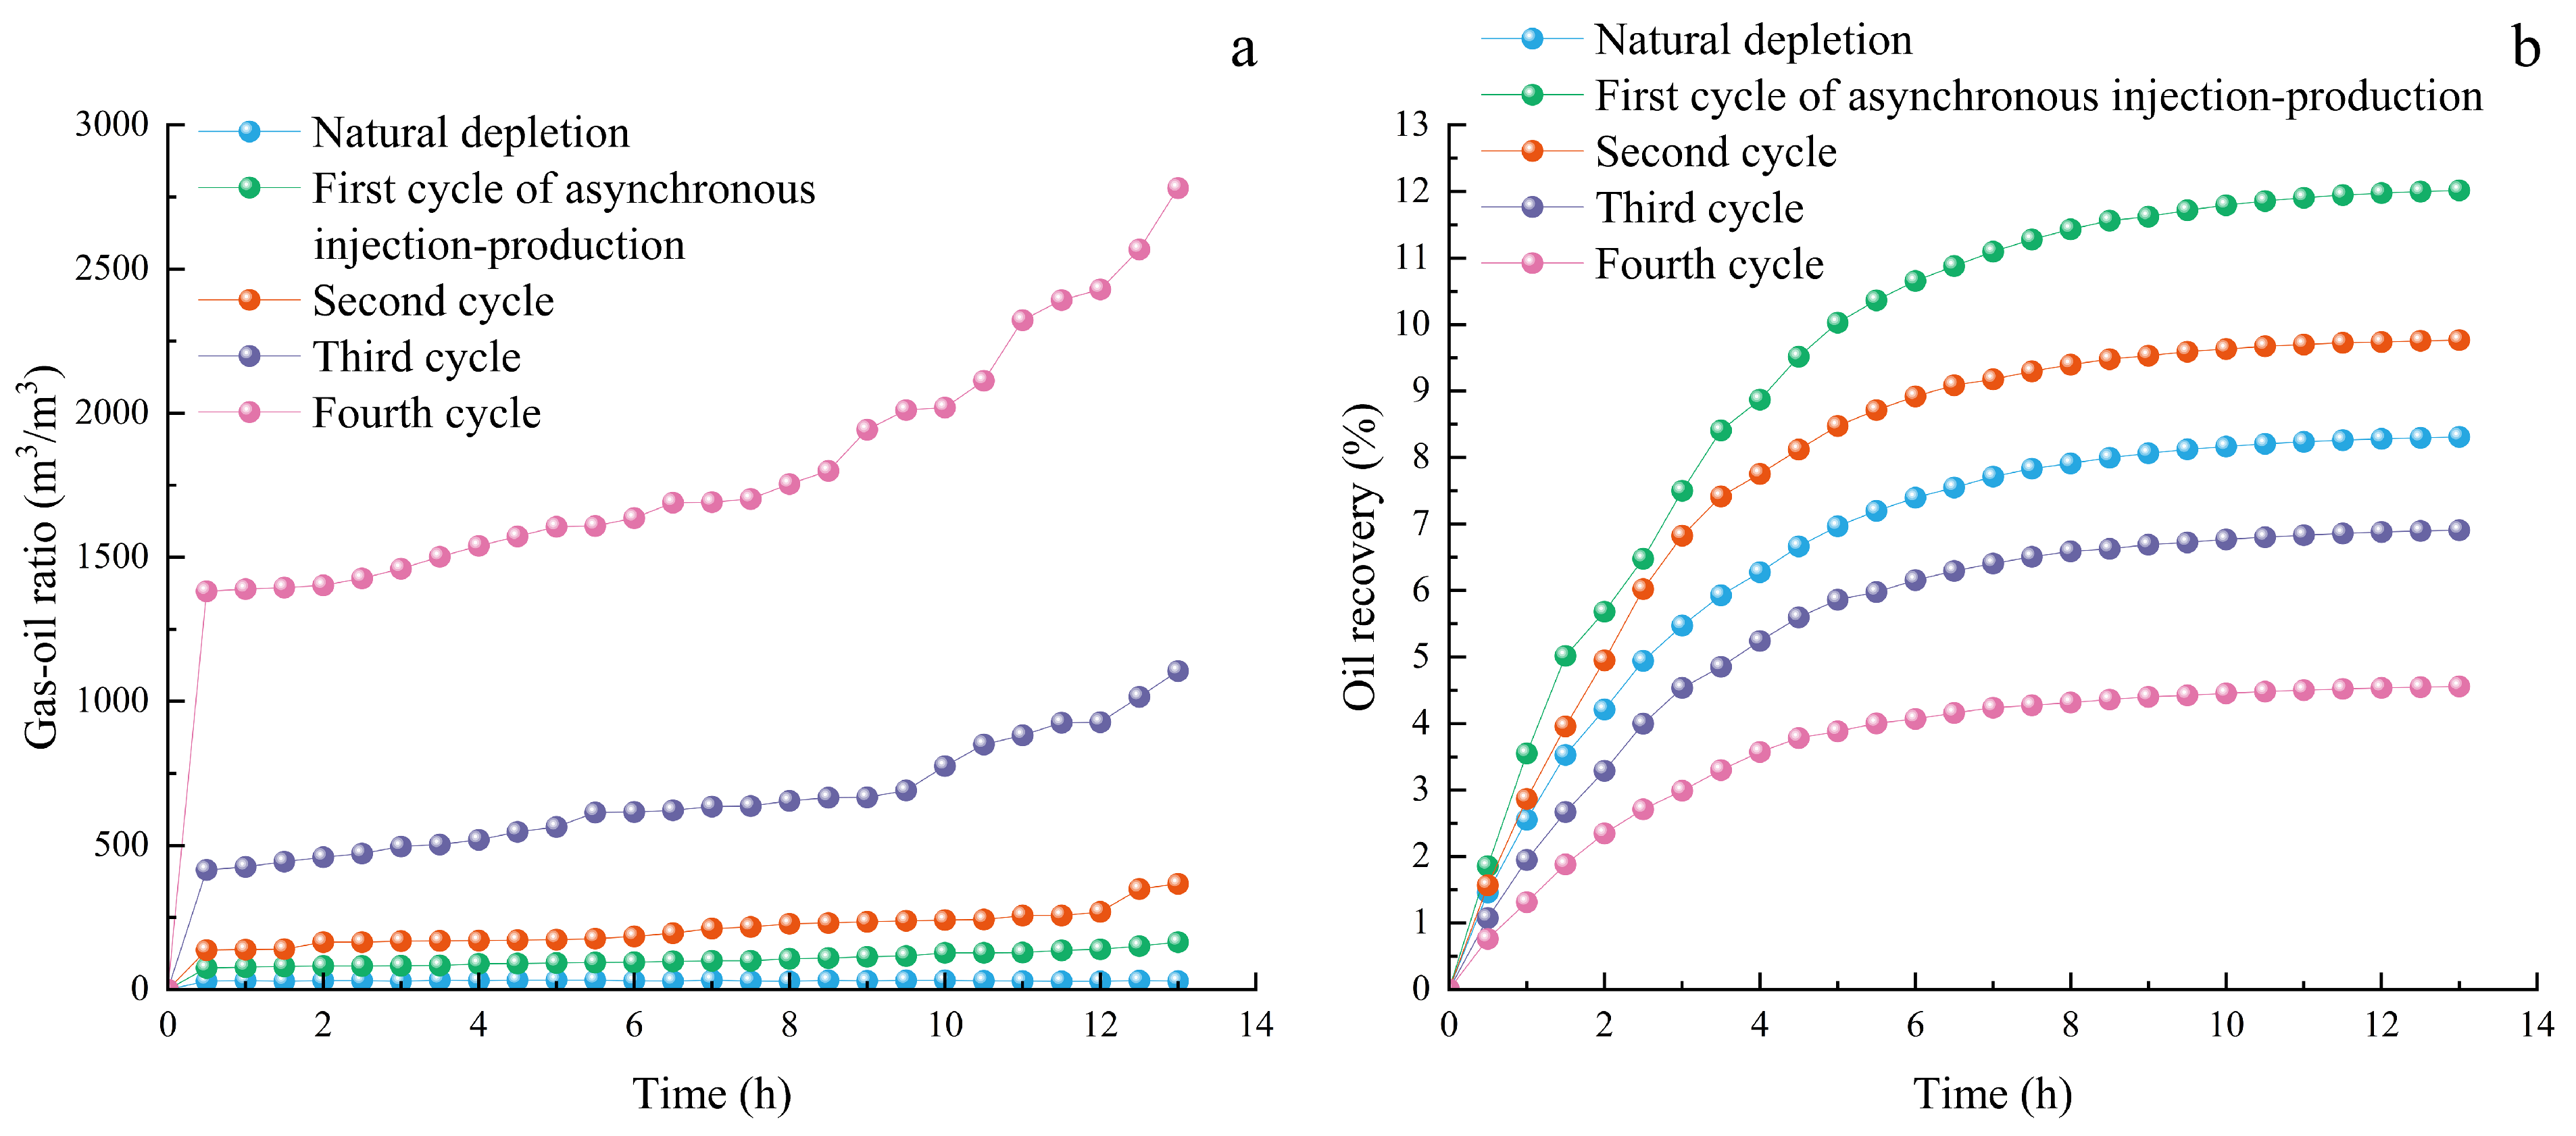
Figure 14, Figure 15 and Figure 16 present the cumulative oil recovery, the relationship between stage recovery and gas–oil ratio during each production stage, and the variation in oil saturation during CO2 asynchronous injection–production, respectively. The results show that when CO2 asynchronous injection–production was implemented after natural depletion, the final oil recovery reached 41.56%. The first injection–production cycle was conducted under conditions of relatively high residual oil saturation. After dissolving into the crude oil, CO2 effectively reduced the oil viscosity and significantly improved oil mobility, thereby enlarging the swept volume. As a result, the stage recovery in the first cycle reached 12.02%, which was the highest among all production stages, while the corresponding gas–oil ratio remained relatively low, with a maximum value of only 164.33 m3/m3, indicating that only a small amount of CO2 channeling occurred.
As the number of injection–production cycles increased, the movable crude oil in the high-permeability zone was preferentially produced. In the later stages, the remaining oil mainly consisted of residual oil in the low-permeability zone and movable oil migrating from the low-permeability zone to the high-permeability zone. Because the amount of remaining oil gradually decreased and its mobilization became increasingly difficult, the stage recovery of each subsequent cycle declined progressively, with recoveries of 9.77%, 6.91%, and 4.56% in the second to fourth cycles, respectively. In contrast, the gas–oil ratio increased cycle by cycle and eventually reached 2781.20 m3/m3, indicating that gas breakthrough and channeling became evident in the final stage of the experiment.
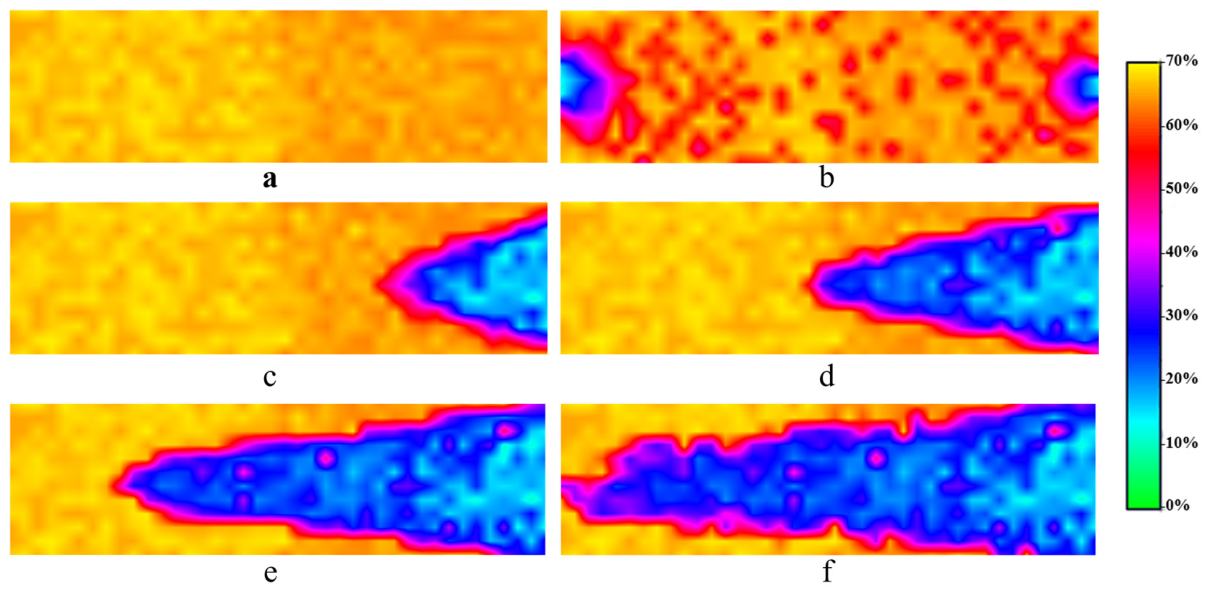
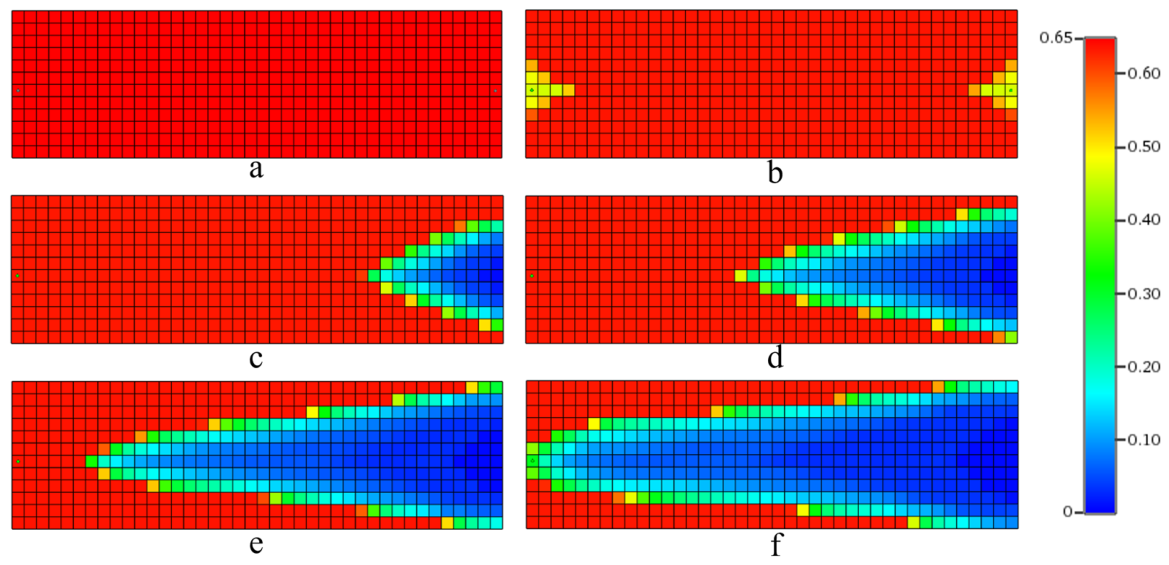
Figure 16 further reveals the dynamic evolution of the internal oil saturation field during natural depletion and multiple cycles of asynchronous injection–production. As shown in Figure 16b, after natural depletion, the oil saturation near the production well decreased noticeably, whereas a large amount of residual oil still remained inside the model. After the first cycle of asynchronous injection–production (Figure 16c), the oil saturation within the reservoir decreased further, and the low-oil-saturation zone exhibited an obvious tonguing pattern. During the subsequent asynchronous injection–production cycles (Figure 16d–f), the low-oil-saturation zone continued to expand outward, but the extent of expansion gradually diminished. This indicates that, with increasing degree of development, the increment in swept volume became progressively limited, which is consistent with the cycle-by-cycle decline in stage recovery observed in the later injection–production stages. The experimental recovery curves and oil saturation distributions showed good agreement with the history-matched numerical simulation results (Figure 17), with an R2 of 0.9778 between the simulated and experimental cumulative oil recovery values, further confirming the accuracy of the experimental results.
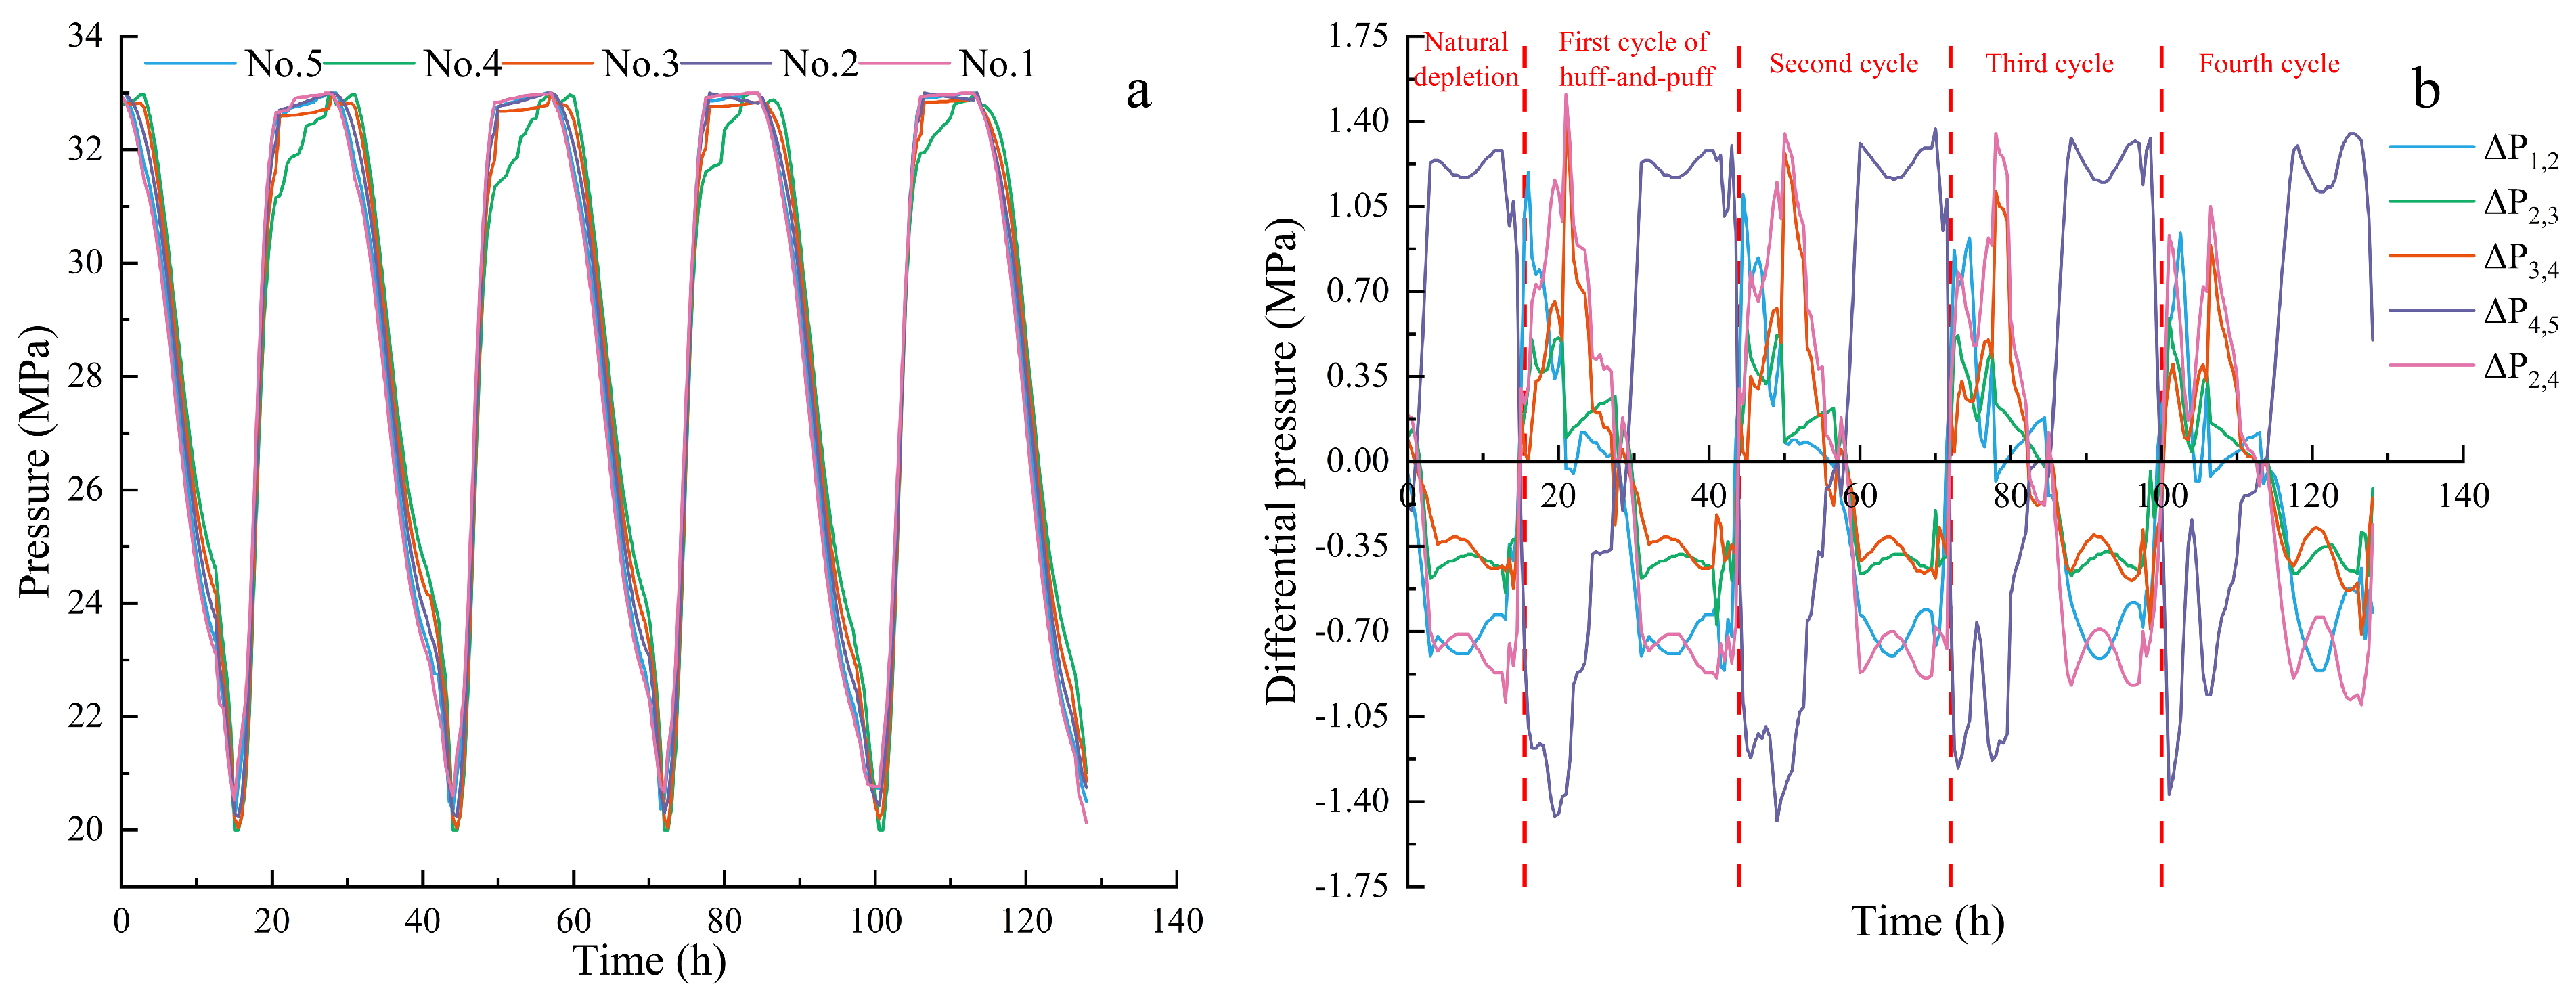
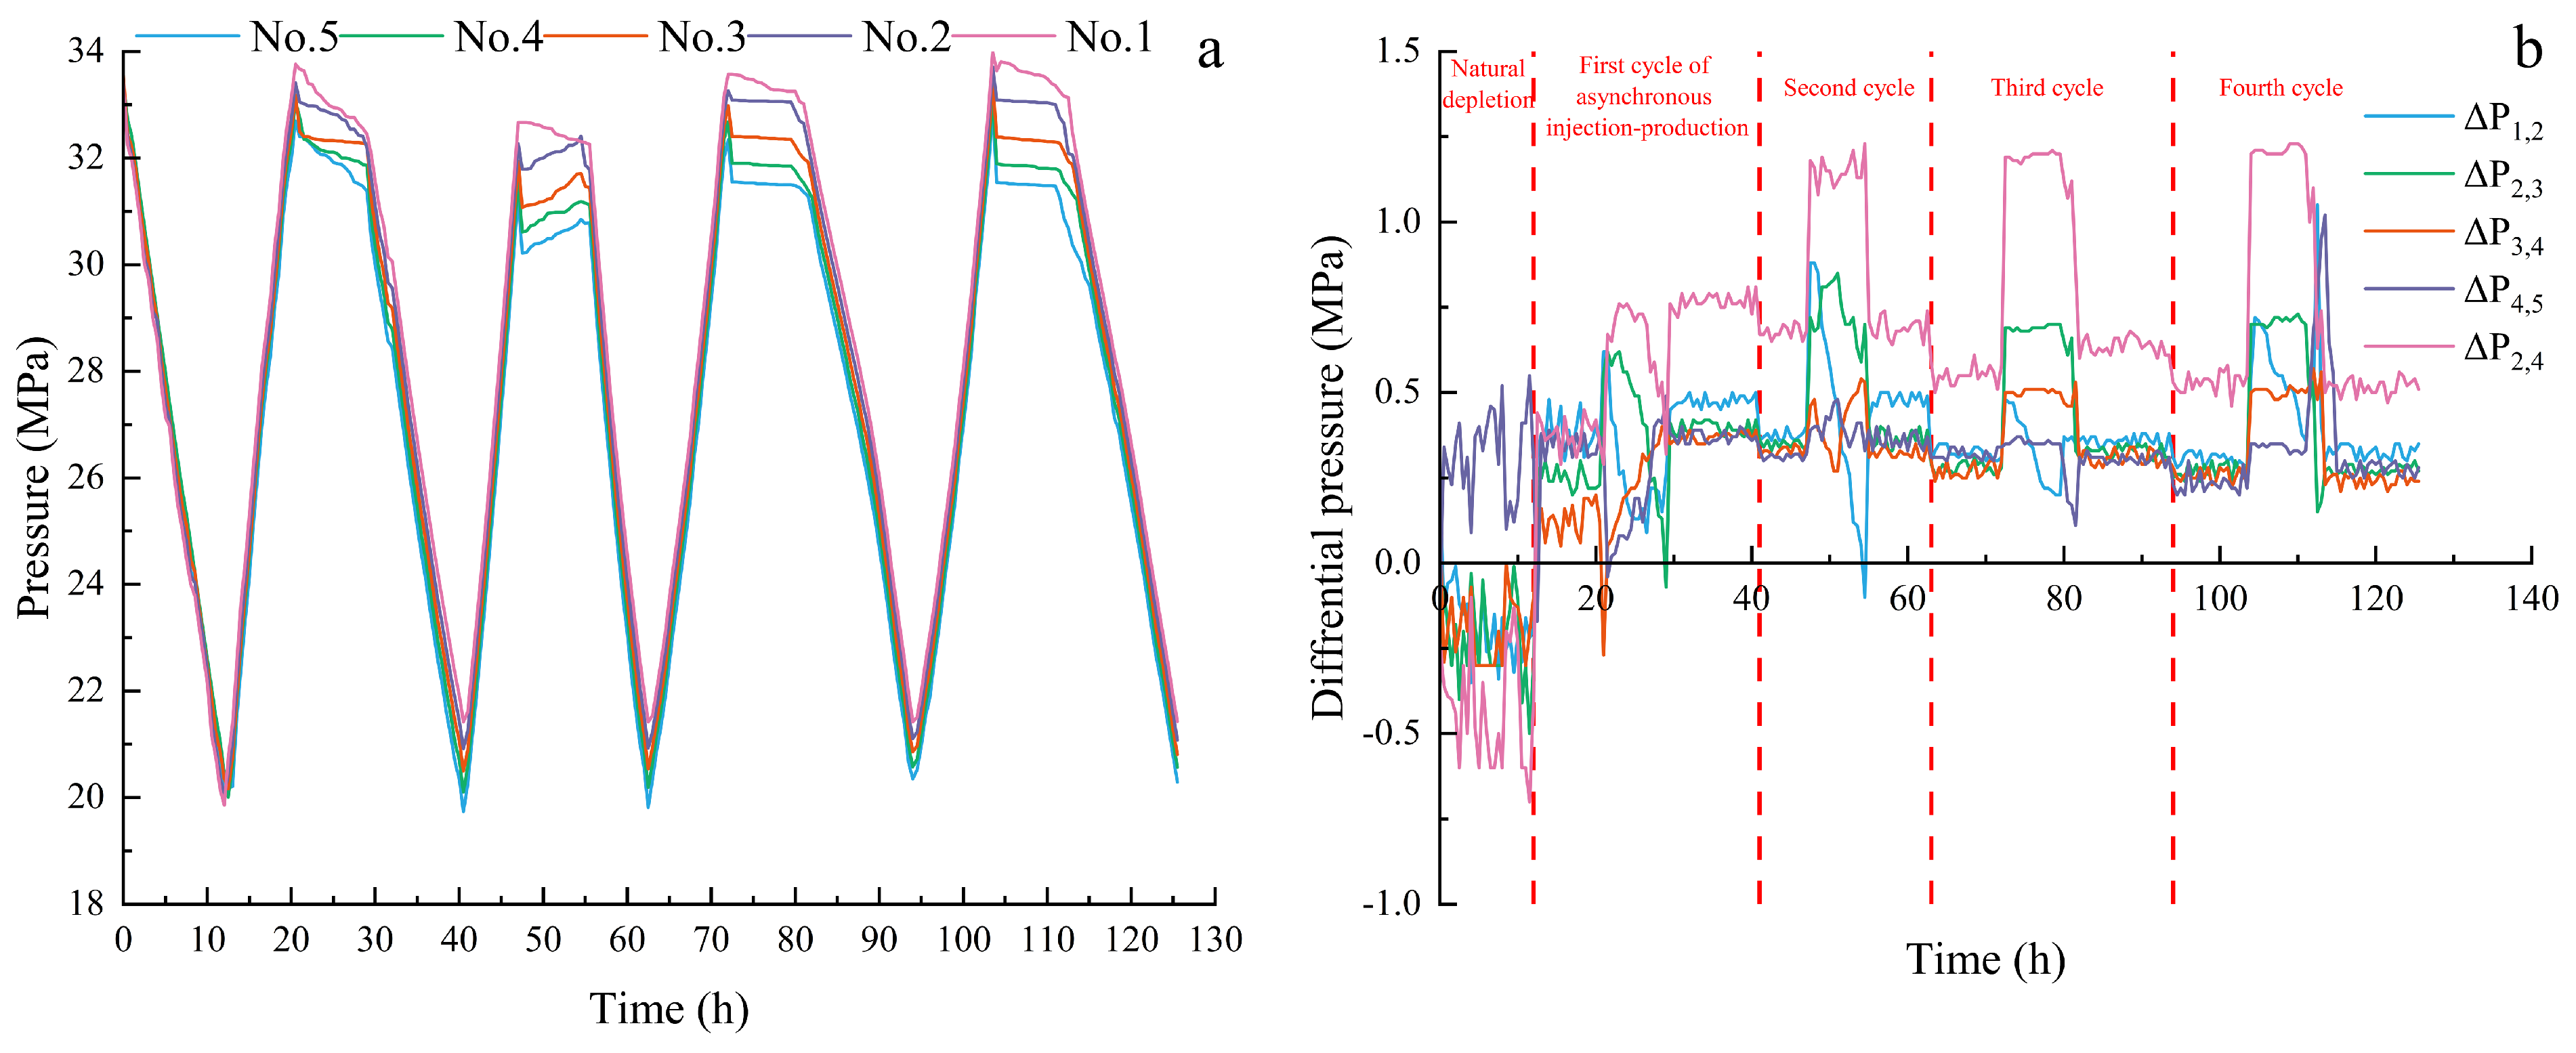
Combined with the pressure and pressure-difference variation curves shown in Figure 18, the pressure transmission behavior of the reservoir under the asynchronous injection–production mode can be further analyzed. Under the operating mode of “injection without production and production without injection,” a distinct pressure gradient was established between the two ends of the model. During the gas-injection pressurization stage, the pressures at Monitoring Points 1 and 2, located in the low-permeability zone on the right-hand side, increased most rapidly. In contrast, the pressure response at Monitoring Point 5, located in the high-permeability zone on the left-hand side, lagged behind because of its greater distance from the injection end and the barrier effect of the heterogeneous interface. During the shut-in stage, CO2 continuously diffused into and dissolved in the crude oil under the combined driving forces of concentration and pressure gradients, and the pressures at the various monitoring points gradually approached equilibrium. During the subsequent pressure-depletion production stage, opening the production well on the left-hand side caused the pressure at Monitoring Point 5 to decline rapidly, whereas in the low-permeability zone on the right-hand side, pressure release at Monitoring Points 1 and 2 was relatively slow because of the confinement imposed by the tight matrix.
Further insight can be obtained from the pressure-difference variation shown in Figure 18. At the early stage of production, the low-permeability zone on the right-hand side remained at a relatively high pressure, while the high-permeability zone on the left-hand side was at a lower pressure, thereby creating a large pressure differential between the two regions. This pressure differential drove the crude oil in the low-permeability zone to overcome capillary forces and migrate toward the high-permeability zone. In the later stage of the experiment, however, as repeated injection–production cycles altered the effective permeability of the reservoir, the injected gas began to channel through the high-permeability pathways. As a result, the system’s ability to establish an effective displacement pressure differential was progressively weakened, as reflected by the gradual reduction and attenuation of the peaks in the pressure-difference curves.
Under the CO2 asynchronous injection–production mode with injection in the low-permeability zone and production from the high-permeability zone, the natural depletion stage mainly mobilized the movable crude oil in the high-permeability zone. During the first cycle of asynchronous injection–production, the combined effects of miscibility and CO2-induced swelling and viscosity reduction expanded the mobilized oil volume to the greatest extent, resulting in the highest recovery in this stage. In the subsequent injection–production cycles, however, oil recovery declined progressively from cycle to cycle because of the increasing influence of gas channeling.

3.4. Comparison of Enhanced Oil Recovery Performance Between Two Development Strategies

To more intuitively illustrate the difference between the two development strategies, we compare their recovery factors in Table 2. As can be clearly seen, across all four cycles, asynchronous injection–production achieves higher recovery factors than synchronous huff-and-puff, with the final recovery factor exceeding that of synchronous huff-and-puff by 21.78%. This demonstrates that asynchronous injection–production achieves superior enhanced recovery performance compared to synchronous huff-and-puff.

4. Conclusions

This study focused on low-permeability reservoirs and, based on an analysis of the phase behavior characteristics of the CO2–crude oil system, conducted large-scale high-temperature and high-pressure two-dimensional physical simulation experiments under CO2 miscible flooding conditions for two development modes, namely synchronous huff-and-puff and asynchronous injection–production. The differences between these two modes in enhancing oil recovery were systematically clarified, and the accuracy and reliability of the experimental results were further validated through numerical simulation. The main conclusions are as follows:
1. CO2 injection exhibited good adaptability and considerable application potential under the reservoir conditions investigated in this study. Injected CO2 can effectively replenish formation energy and maintain the stability of the reservoir pressure system. After dissolving into crude oil, CO2 produces pronounced swelling and viscosity-reduction effects, thereby significantly improving crude oil mobility. In addition, once CO2 and crude oil reach a miscible state, the interfacial tension is markedly reduced, which further enhances oil displacement efficiency.
2. Compared with synchronous huff-and-puff, asynchronous injection–production established a unidirectional injection–production pressure gradient through “gas injection in the low-permeability zone and oil production in the high-permeability zone.” This configuration strengthened the withdrawal effect in the high-permeability zone, significantly enlarged the swept volume, and effectively mobilized the residual oil in the low-permeability zone. Under this mode, the final oil recovery reached 41.56%, representing an improvement of 21.78% over synchronous huff-and-puff.
3. Reservoir heterogeneity is the key factor controlling the effectiveness of CO2 flooding, the decline pattern of oil recovery, and the macroscopic distribution of residual oil. Owing to its superior flow capacity and higher pressure-transmission efficiency, the high-permeability zone consistently served as the preferential pathway for CO2 migration and the primary region for oil production. In contrast, because of its greater flow resistance, the low-permeability zone exhibited limited oil mobilization, resulting in the retention of a large amount of residual oil. Therefore, rational optimization of the injection–production direction and pressure regime is essential for overcoming the constraints imposed by reservoir heterogeneity and improving overall development performance. In future work, we will conduct multiple sets of comparative experiments under varying degrees of heterogeneity, combined with field-scale numerical simulations, to further evaluate the field applicability of this technology.

Author Contributions

Conceptualization, P.Y. and P.G.; Methodology, Z.W., P.Y. and P.G.; Software, Z.W., P.Y. and P.G.; Validation, Z.W., P.Y., P.G. and Y.Z.; Formal analysis, Z.W., P.Y., P.G. and Y.Z.; Investigation, P.G. and P.Y.; Resources, P.G. and Z.W.; Data curation, P.Y. and P.G.; Writing—original draft, P.Y. and Y.Z.; Writing—review and editing, P.G. and P.Y.; Supervision, Z.W.; Project administration, P.G.; Funding acquisition, P.G. All authors have read and agreed to the published version of the manuscript.

Funding

This work was supported by the National Science and Technology Major Project for Novel Oil and Gas Exploration and Development: “Gas Flooding Technology for Enhanced Oil Recovery in Offshore Sandstone Reservoirs” (2025ZD1402903).

Data Availability Statement

The original contributions presented in the study are included in the article; further inquiries can be directed to the corresponding author.

Conflicts of Interest

The authors declare no conflicts of interest.

Nomenclature

SgGas saturation
TAcoustic transit time (μs)
RtResistivity of oil/gas-bearing rock (Ω·m)
RResistivity of rock 100% saturated with formation water (Ω·m)
BRock electrical constant
SwWater saturation (%)
NReservoir exponent
SoOil saturation (%)

References

  1. Wang, X.; Wang, P.; Tang, K.; Dong, P.; Cui, C.; Yang, Z.; Sun, Z. Optimization of carbon sequestration and carbon displacement in fractured horizontal wells in low permeability reservoirs. Processes 2024, 12, 145. [Google Scholar] [CrossRef]
  2. Ji, B.; Fang, J. An overview of efficient development practices at low permeability sandstone reservoirs in China. Energy Geosci. 2023, 4, 100179. [Google Scholar] [CrossRef]
  3. Kang, W.L.; Zhou, B.B.; Issakhov, M.; Gabdullin, M. Advances in enhanced oil recovery technologies for low permeability reservoirs. Pet. Sci. 2022, 19, 1622–1640. [Google Scholar] [CrossRef]
  4. Muther, T.; Qureshi, H.A.; Syed, F.I.; Aziz, H.; Siyal, A.; Dahaghi, A.K.; Negahban, S. Unconventional hydrocarbon resources: Geological statistics, petrophysical characterization, and field development strategies. J. Pet. Explor. Prod. Technol. 2022, 12, 1463–1488. [Google Scholar] [CrossRef]
  5. Cao, X.; Liu, H.; Ren, Y.; Jia, Y.; Niu, X.; Sun, C. Progress and prospects of development technologies for low-permeability oil reservoirs in Shengli oilfield. Youqi Dizhi Yu Caishoulu 2024, 31, 48–55. [Google Scholar] [CrossRef]
  6. Cao, J.; Hao, M.; Chen, Y.; Li, B.; Liu, Z.; Liu, Y.; Xu, J. Advancing PetroChina’s development strategies for low-permeability oil reservoirs. Processes 2024, 12, 351. [Google Scholar] [CrossRef]
  7. Zhao, X.; Qi, X. Exploration and application of natural gas injection, water injection and fracturing technologies in low-permeability reservoirs in China. Processes 2025, 13, 855. [Google Scholar] [CrossRef]
  8. Fan, Z.; Tian, M.; Li, M.; Mi, Y.; Jiang, Y.; Song, T.; Cao, J.; Liu, Z. Assessment of CO2 sequestration capacity in a low-permeability oil reservoir using machine learning methods. Energies 2024, 17, 3979. [Google Scholar] [CrossRef]
  9. Yuan, S.; Ma, D.; Li, J.; Zhou, T.; Ji, Z.; Han, H. Progress and prospects of carbon dioxide capture, EOR-utilization and storage industrialization. Pet. Explor. Dev. 2022, 49, 955–962. [Google Scholar] [CrossRef]
  10. Gao, C.; Jia, J.; Fan, W.; Chen, S.; Hu, T.; Wang, X.; Du, K.; Zhao, Y.; Rui, Z. Optimization of CO2 flooding under dual goals of oil recovery and CO2 storage: Numerical case studies of the first-ever CCUS pilot in Changqing oilfield. Geoenergy Sci. Eng. 2024, 240, 213063. [Google Scholar] [CrossRef]
  11. Song, T.; Li, Y.; Sun, T.; Cao, J.; Zhang, Y.; Liu, Z.; Chai, M.; Sun, Y.; Yan, Z. Effects of miscibility on CO2-EOR efficiency and long-term geological storage in fractured low-permeability reservoirs. Fuel 2026, 411, 138052. [Google Scholar] [CrossRef]
  12. Qian, C.; Rui, Z.; Liu, Y.; Zhou, K.; Du, K.; Zhao, Y.; Zhou, J.; Song, K.; Li, X. Microfluidic investigation on microscopic flow and displacement behavior of CO2 multiphase system for CCUS-EOR in heterogeneous porous media. Chem. Eng. J. 2025, 505, 159135. [Google Scholar] [CrossRef]
  13. Yin, Y.; Zhang, H. Advances in tight oil reservoir development: A review of CO2 huff and puff technology. Adv. Resour. Res. 2024, 4, 280–299. [Google Scholar]
  14. Wan, Y.; Jia, C.; Lv, W.; Jia, N.; Jiang, L.; Wang, Y. Recovery mechanisms and formation influencing factors of miscible CO2 huff-n-puff processes in shale oil reservoirs: A systematic review. Adv. Geo-Energy Res. 2024, 11, 88–102. [Google Scholar] [CrossRef]
  15. Pei, E.; Xu, C.; Wang, C. Macro-Micro-Analysis of Injection Media Pore Utilization in Tight Oil Reservoirs. Arab. J. Sci. Eng. 2025, 1–12. [Google Scholar] [CrossRef]
  16. Mao, C.; Feng, X.; Li, X.; Zhang, M.; Sun, Y.; Liu, L.; Li, N.; Liang, B. Mechanism study of enhanced oil recovery by CO2 huff-n-puff in ultralow-permeability reservoirs based on nuclear magnetic resonance. ACS Omega 2025, 10, 51584–51594. [Google Scholar] [CrossRef]
  17. Khanal, A.; Shahriar, M. Optimization of CO2 huff-n-puff in unconventional reservoirs with a focus on pore confinement effects, fluid types, and completion parameters. Energies 2023, 16, 2311. [Google Scholar] [CrossRef]
  18. Nasser, S.M.M.; Ramalingam, V.; Verma, A.; Madhavan, N. Enhancing CO2 huff-n-puff recovery in tight sandstone via hybrid nanofluid wettability alteration and fracturing. Energy Geosci. 2026, 7, 100559. [Google Scholar] [CrossRef]
  19. Han, X.; Song, Z.; Deng, S.; Xian, C.; Li, B.; Li, P.; Song, Y.; Jiang, J.; Lyu, B.; Zhang, L. Diffusion, mass transfer and oil mobilization mechanisms of CO2 huff-n-puff in Gulong shale oil reservoirs. Pet. Explor. Dev. 2025, 52, 1581–1592. [Google Scholar] [CrossRef]
  20. Afari, S.; Ling, K.; Sennaoui, B.; Maxey, D.; Oguntade, T.; Porlles, J. Optimization of CO2 huff-n-puff EOR in the bakken formation using numerical simulation and response surface methodology. J. Pet. Sci. Eng. 2022, 215, 110552. [Google Scholar] [CrossRef]
  21. Badrouchi, N.; Pu, H.; Smith, S.; Badrouchi, F. Evaluation of CO2 enhanced oil recovery in unconventional reservoirs: Experimental parametric study in the Bakken. Fuel 2022, 312, 122941. [Google Scholar] [CrossRef]
  22. Badrouchi, N.; Pu, H.; Smith, S.; Yu, Y.; Badrouchi, F. Experimental investigation of CO2 injection side effects on reservoir properties in ultra tight formations. J. Pet. Sci. Eng. 2022, 215, 110605. [Google Scholar] [CrossRef]
  23. Zhumakhanova, N.; Sepehrnoori, K.; Delikesheva, D.; Ismailova, J.; Khagag, F. Reservoir Simulation of CO2 Flooding vs. CO2 Huff-and-Puff in Shale Formations: Comparative Analysis of Storage and Recovery Mechanisms. Energies 2025, 18, 3337. [Google Scholar] [CrossRef]
  24. Kang, J.; Yang, S.; Zhang, W.; Zhang, H.; He, C.; Wang, X.; Wei, S.; Yang, K.; Wang, L. Research on micropore development characteristics and influencing factors during CO2 huff-n-puff. Processes 2024, 12, 1665. [Google Scholar] [CrossRef]
  25. Chen, J.; Cai, D.; Zhang, T.; Yu, L.; Zhou, D.; Cheng, S. Asynchronous Injection–Production Method in the High Water Cut Stage of Tight Oil Reservoirs. Energies 2024, 17, 4838. [Google Scholar] [CrossRef]
  26. Yuan, S.; Wang, R.; Jiang, H.; Xie, Q.; Chen, S.; Xu, B.; Li, L.; Zhang, Y. Asynchronous Injection-Production Process: A Method to Improve Water Flooding Recovery in Complex Fault Block Reservoirs. Math. Probl. Eng. 2020, 2020, 5207430. [Google Scholar] [CrossRef]
  27. Gao, S.; Yang, Y.; Liao, G.; Xiong, W.; Liu, H.; Shen, R.; Ye, L.; Zhu, W.; An, W. Experimental research on inter-fracture asynchronous injection-production cycle for a horizontal well in a tight oil reservoir. J. Pet. Sci. Eng. 2022, 208, 109647. [Google Scholar] [CrossRef]
  28. Chen, X. Research and application of asynchronous injection-production in ultra-low permeability horizontal well area. IOP Conf. Ser. Earth Environ. Sci. 2021, 651, 032045. [Google Scholar] [CrossRef]
  29. Kang, S.; Pu, C.; Wang, Y.; Liu, W.; Wang, K.; Huang, F.; Fan, Q.; Gao, X.; Yang, Q. Parameter Optimization of Asynchronous Cyclic Waterflooding for Horizontal–Vertical Well Patterns in Tight Oil Reservoirs. ACS Omega 2022, 7, 11226–11239. [Google Scholar] [CrossRef]
  30. Yu, H.; Song, J.; Chen, Z.; Zhang, Y.; Wang, Y.; Yang, W.; Lu, J. Numerical study on natural gas injection with allied in-situ injection and production for improving shale oil recovery. Fuel 2022, 318, 123586. [Google Scholar] [CrossRef]
  31. Guang, Y. Study on asynchronous injection and production of horizontal Wells in ultra-low permeability thin layer low abundance oil field. E3S Web Conf. 2022, 358, 01029. [Google Scholar]
  32. Li, J.; Wei, J.; Chen, Y.; Wang, A.; Zhou, X. Analysis of asynchronous/inter-fracture injection-production mechanism under the condition of five-spot vertical and horizontal well combination in low permeability oil reservoirs. Energy 2024, 308, 132923. [Google Scholar] [CrossRef]
  33. Chen, Z.; Li, L.; Su, Y.; Liu, J.; Hao, Y.; Zhang, X. Investigation of CO2-EOR and storage mechanism in Injection-Production coupling technology considering reservoir heterogeneity. Fuel 2024, 368, 131595. [Google Scholar] [CrossRef]
  34. Hou, Z.; Guo, Y.; Liang, S.; Zhang, K.; Ren, G.; Cheng, H.; Xu, F. Shale Gas Stimulation Technology: Large-Scale Triaxial Physical Simulation Tests on Longmaxi Formation Shale. Soil Mech. Found. Eng. 2022, 58, 491–499. [Google Scholar] [CrossRef]
  35. Li, Q.; Shu, L.; Xu, J.; Peng, S.; Yan, F.; Huo, Z.; Liu, D.; Li, C.; Zhou, B. Experimental study on interlayer interference effect of CBM commingled production in a multi-pressure system under output control mode. Fuel 2023, 350, 128812. [Google Scholar] [CrossRef]
  36. Yang, S.; Hu, S.; Qi, Z.; Qi, H.; Zhao, G.; Li, J.; Yan, W.; Huang, X. Experiment and prediction for dynamic storage capacity of underground gas storage rebuilt from hydrocarbon reservoir. Renew. Energy 2024, 222, 119908. [Google Scholar] [CrossRef]
  37. Zhao, P.; Zhu, H.; Li, G.; Chen, Z.; Chen, S.; Shangguan, S.; Qi, X. Large-scale physical simulation of injection and production of hot dry rock in Gonghe Basin, Qinghai Province, China. Pet. Explor. Dev. 2024, 51, 741–752. [Google Scholar] [CrossRef]
  38. Fang, F.; He, S.; Zhuang, J.; Zhang, J.; Bian, Y. Large-Scale Physical Simulation Experiment of Water Invasion Law for Multi-Well Development in Sandstone Gas Reservoirs with Strong Water Drive. Appl. Sci. 2024, 14, 8067. [Google Scholar] [CrossRef]
  39. Yang, L.; Hu, Y.; Liu, G.; Guo, P.; Yang, B. Experimental of Water Drive Sweep Efficiency for Typical Stacking Mode of Deep Water Channel. J. Southwest Pet. Univ. 2022, 44, 71–80. [Google Scholar]
Figure 1. Experimental flowchart for crude oil property measurements.
Energies 19 02532 g001
Figure 2. Schematic workflow for minimum miscibility pressure determination via slim tube experiment.
Energies 19 02532 g002
Figure 3. Design of the rock-plate model. (ac) show the plate model design, the installation schematic of the plate, and the autoclave apparatus, respectively. In (a), numbers 1–5 indicate the locations of pressure sensors, where sensors 1–4 are evenly spaced with an interval of 12.5 cm, and the distance between sensors 4 and 5 is 25 cm.
Energies 19 02532 g003
Figure 4. Schematic workflow of the large-scale physical simulation experiment.
Energies 19 02532 g004
Figure 5. Permeability distribution of the model. The values in the legend denote permeability in mD. The red region corresponds to 30 mD, and the blue region corresponds to 10 mD.
Energies 19 02532 g005
Figure 6. Relative volume as a function of pressure. Red triangles denote experimental results, and blue circles represent numerical simulation results.
Energies 19 02532 g006
Figure 7. Variation of physical property parameters during the swelling test. Red triangles denote experimental results, and blue circles represent numerical simulation results. (a) Saturation pressure fitting results; (b) Expansion coefficient fitting results; (c) Gas-oil ratio fitting results; (d) Viscosity fitting results.
Energies 19 02532 g007
Figure 8. Determination of minimum miscibility pressure. (a,b) illustrate the evolution of oil recovery and gas–oil ratio, respectively, as a function of injected pore volume at various experimental pressures. The blue star in (c) indicates the determined minimum miscibility pressure.
Energies 19 02532 g008
Figure 9. Comparison of recovery factor fitting for the synchronous huff-and-puff mode. Blue bars represent experimental results, and red triangles denote numerical simulation results.
Energies 19 02532 g009
Figure 10. Variations in recovery factor and gas–oil ratio for Wells A and B during each production stage of the synchronous huff-and-puff process. (a,c) correspond to experimental results for Well A, while (b,d) correspond to experimental results for Well B.
Energies 19 02532 g010
Figure 11. Evolution of model oil saturation during the experiment. (a) represents the oil saturation at the initial of the crude oil, while (bf) correspond to the oil saturations after natural depletion and at the end of the first, second, third, and fourth huff-and-puff cycles, respectively.
Energies 19 02532 g011
Figure 12. Evolution of model oil saturation obtained from numerical simulation. (a) represents the oil saturation at the initial of the crude oil, while (bf) correspond to the oil saturations after natural depletion and at the end of the first, second, third, and fourth huff-and-puff cycles, respectively.
Energies 19 02532 g012
Figure 13. Pressure variations recorded by sensors during the experiment. (a) represents the pressure changes at Sensors 1 through 5, and (b) illustrates the variations in pressure differentials between the sensors.
Energies 19 02532 g013
Figure 14. Comparison of recovery factor fitting for the asynchronous injection–production mode. Blue bars represent experimental results, and red triangles denote numerical simulation results.
Energies 19 02532 g014
Figure 15. Variations in recovery factor and gas–oil ratio during each production stage of the asynchronous injection–production process. (a) Gas-oil ratio variation at different production stages of asynchronous injection-production. (b) Recovery factor variation at different production stages of asynchronous injection-production.
Energies 19 02532 g015
Figure 16. Evolution of oil saturation during the experiment. (a) represents the oil saturation at the initial of the crude oil, while (bf) correspond to the oil saturations after natural depletion and at the end of the first, second, third, and fourth cycles of asynchronous injection–production, respectively.
Energies 19 02532 g016
Figure 17. Evolution of oil saturation obtained from numerical simulation. (a) represents the oil saturation at the initial of the crude oil, while (bf) correspond to the oil saturations after natural depletion and at the end of the first, second, third, and fourth cycles of asynchronous injection–production, respectively.
Energies 19 02532 g017
Figure 18. Pressure variations recorded by sensors during the experiment. (a) represents the pressure changes at Sensors 1 through 5, and (b) illustrates the variations in pressure differentials between the sensors.
Energies 19 02532 g018
Table 1. Parameters of the recombined crude oil.
Physical PropertyGas–Oil Ratio
/(m3/m3)
Saturation Pressure /(MPa)Oil Viscosity
/(mPa·s)
Formation Volume Factor
Original condition29.9507.3732.8681.162
Recombined crude oil30.1207.4002.9121.160
Numerical simulation35.1607.3002.9041.160
Table 2. Comparison of oil recovery between two modes.
Development ModeSynchronous Huff-and-PuffAsynchronous Injection–Production
Production Stage
Natural depletion8.74%8.31%
Frist cycle3.24%12.02%
Second cycle2.81%9.77%
Third cycle2.17%6.91%
Fourth cycle2.02%4.56%
Cumulative oil recovery19.78%41.56%
Disclaimer/Publisher’s Note: The statements, opinions and data contained in all publications are solely those of the individual author(s) and contributor(s) and not of MDPI and/or the editor(s). MDPI and/or the editor(s) disclaim responsibility for any injury to people or property resulting from any ideas, methods, instructions or products referred to in the content.