1. Introduction
Children spend a substantial share of their lives in classrooms, reported as nearly 12%, more time than in any building type except their homes [
1]. Ensuring adequate indoor air quality (IAQ) in educational spaces is therefore critical, as classroom environmental conditions influence both students’ health and their learning outcomes [
2,
3,
4]. In practice, classroom IAQ is frequently assessed using carbon dioxide (CO
2) concentration, mainly used as a proxy indicator for ventilation with outdoor air, assuming higher ventilation results in better IAQ. CO
2 itself is not considered a harmful pollutant at typical indoor concentrations but is widely used as an indicator of occupancy-related emissions and ventilation effectiveness [
5].
Elevated CO
2 levels and insufficient ventilation have been associated with symptoms such as headache, fatigue, discomfort, and reduced concentration, which may impair learning performance [
6,
7,
8,
9,
10,
11]. Experimental and field evidence consistently indicates that student performance deteriorates when ventilation is low, as indicated by higher CO
2 levels, particularly above approximately 2000–3000 ppm, compared with conditions below 1000 ppm [
8,
10]. Reported symptoms include fatigue and discomfort; at and above 5000 ppm, more severe physiological effects can occur [
8]. These findings underscore the importance of maintaining adequate ventilation conditions in educational buildings.
Indoor air quality in schools is determined by a combination of environmental, building-related, and occupant-related factors [
12,
13]. Environmental drivers include climate and seasonality; building-related determinants include airtightness, classroom geometry and window design, ventilation type and outdoor air supply rate, and indoor temperature; occupant-related determinants include the number of occupants, activity levels and CO
2 generation rates, schedules, maintenance and operation practices, and adaptive behaviors such as window opening [
12,
13]. Children are recognized as a particularly sensitive population because they inhale more air per unit body mass and undergo intensive developmental processes, which may increase vulnerability to indoor pollutants and adverse thermal–humidity conditions [
14].
A substantial body of field research indicates that inadequate IAQ in schools is a widespread and persistent problem. Measurements conducted in schools in the United States showed that CO
2 concentrations frequently exceed 1000 ppm and may approach 3000 ppm, indicating insufficient ventilation [
15]. Similar results have been reported in Minnesota schools [
1]. In naturally ventilated classrooms in Athens, CO
2 concentrations ranged approximately from 893 to 2082 ppm, with strong dependence on occupancy and ventilation rate [
16]. Studies conducted in Serbian schools during the heating season also reported mean CO
2 levels exceeding 1000 ppm [
17], while in Hong Kong, CO
2 concentrations exceeded this threshold for a significant portion of occupied time and reached values close to 5900 ppm under full occupancy [
18]. In Norway, CO
2 concentrations in naturally ventilated classrooms ranged from approximately 601 to 3827 ppm and were associated with adverse symptoms and reduced performance [
10]. Extensive analysis and measurements have been done in Poland, and results are reported in [
19,
20,
21,
22].
Health-oriented studies further confirm the relationship between inadequate ventilation and adverse respiratory outcomes. Simoni et al. reported increased prevalence of symptoms such as wheezing, dry cough, and rhinitis in poorly ventilated classrooms, where CO
2 concentrations frequently exceeded 1000 ppm [
11]. These findings are consistent with broader evidence indicating that children are particularly sensitive to indoor environmental conditions due to higher inhalation rates relative to body mass and ongoing physiological development [
6,
14].
Large-scale studies conducted in Central Europe confirm that this problem is also highly relevant in the regional context. The InAirQ study, covering schools in the Czech Republic, Hungary, Italy, Poland, and Slovenia, showed that approximately 80% of schools did not meet the recommended CO
2 concentration limit of 1000 ppm during the heating season [
23]. These findings highlight the need for effective and reliable ventilation strategies in educational buildings.
Despite the recognized importance of IAQ, practical constraints related to building operation and energy retrofits, as well as first and operational costs often limit the effectiveness of ventilation in schools. In many cases, ventilation rates are reduced to decrease heating demand, leading to reduced IAQ, as marked by the elevated CO
2 concentrations during occupancy [
24]. In addition, window opening, commonly used as a natural ventilation strategy, is often limited by outdoor temperature, noise, and air pollution, making it an insufficiently robust solution for maintaining acceptable IAQ [
18,
25]. Studies on occupant behavior indicate that window operation is influenced by both environmental conditions and habitual patterns, with indoor temperature being a key driver [
25,
26,
27,
28,
29,
30,
31].
In Poland, a large number of school buildings were constructed in the 1960s as a part of the post-war nationwide program of standardized educational infrastructure development [
22]. It is estimated that over a thousand such buildings were erected using similar construction technologies, many of which are still in operation today. Current energy retrofit efforts primarily focus on improving the building envelope and reducing energy consumption, often without addressing ventilation systems, among others, due to financial constraints. As a result, indoor air quality frequently remains unsatisfactory despite improvements in thermal performance [
22,
32,
33].
This study should be interpreted as a case study of a representative classroom in a Polish primary school building. In the 1960s, more than a thousand schools were constructed in Poland using standardized building technologies, many of which are still in operation today. They can be retrofitted using the principles outlined in the present work, especially as the current energy retrofit efforts primarily focus on improving thermal insulation and reducing energy consumption, frequently neglecting ventilation due to financial constraints. Since the modeled classroom represents a broader group of similar rooms in similar buildings, the findings provide practical insights into feasible ventilation improvement strategies that can be implemented selectively, for example, at the level of individual classrooms in comparable school facilities.
A key issue in the buildings described above is the interaction between airtightness and natural ventilation. When ventilation is provided by gravity through shafts, exhaust terminals are typically present, while outdoor air is supplied through uncontrolled infiltration. Airtightness will strongly influence this process and, subsequently, the air exchange: if it is high, IAQ deteriorates, while if it is too low, energy losses increase. After energy retrofits, increased airtightness typically reduces infiltration, which may further worsen indoor air quality if no other ventilation system is present. This highlights the importance of considering ventilation and airtightness jointly during the energy retrofit of buildings.
To ensure an adequate outdoor air supply rate, mechanical ventilation systems are increasingly considered in school buildings, because studies comparing ventilation strategies indicate that achieving adequate ventilation rates often requires mechanical systems [
22]. The introduction of heat recovery (HRV) systems can significantly reduce heating energy demand while maintaining the outdoor air supply at the prescribed rate [
19,
20,
22,
34]. Simpler solutions than mechanical ventilation, such as trickle ventilators or humidity-sensitive air inlets, have also been shown to improve IAQ, but often, they fail to meet the prescribed ventilation rates [
35,
36].
CO
2 measurements are widely used as a practical tool for assessing ventilation performance. Since CO
2 is generated by occupants, it can serve as a natural tracer gas, enabling estimation of air exchange rates without the need for additional tracers [
5,
37,
38,
39,
40,
41,
42,
43]. In addition, CO
2 concentration can be used as an input signal in demand-controlled ventilation (DCV) systems, where it serves as a proxy indicator of ventilation demand rather than a pollutant itself.
Despite the extensive body of research, there is a lack of integrated studies that combine ventilation rates and CO2 modeling with seasonal energy analysis under real climatic conditions. Many studies address individual aspects, such as measurements, ventilation performance, or energy consumption, but fewer provide comprehensive analyses particularly for typical school buildings in Central Europe.
This study presents such analyses through an integrated measurement–modeling–energy assessment of a primary school classroom in Poland. A previously validated CONTAM model of a classroom [
44] is further advanced and used to compare natural ventilation, mechanical exhaust ventilation, and balanced mechanical ventilation with heat recovery. In all cases except natural ventilation, demand-controlled ventilation is applied using CO
2 concentration as a proxy indicator of ventilation demand. The resulting air exchange profiles are subsequently implemented in EnergyPlus to evaluate seasonal energy performance and to support the assessment of the relationship between indoor air quality and energy use.
While numerous studies have investigated indoor air quality in school buildings or evaluated ventilation strategies, most of them address either IAQ or energy performance separately. There is still a lack of integrated analyses that combine airflow modeling, CO2-based assessment, and seasonal energy performance under real climatic conditions, particularly for existing school buildings in Central Europe.
In our previous work [
44], the focus was placed on the analysis of CO
2 concentration and ventilation performance under natural ventilation conditions. However, the relationship between improved ventilation strategies and their impact on seasonal energy demand has not been addressed.
The aim of the present study is therefore to provide a combined assessment of indoor air quality and energy performance using a coupled simulation approach. A validated CONTAM model is used to simulate ventilation strategies, while EnergyPlus is applied to evaluate seasonal heating and primary energy demand. Particular attention is given to CO2-based demand-controlled ventilation and the role of heat recovery in balancing IAQ improvement and energy use.
2. Methods and Measurements
2.1. Standard Requirements
The following standards and guidelines were used in this study to define ventilation requirements and to interpret indoor air quality conditions.
Polish governmental regulations do not specify acceptable CO
2 concentrations for rooms intended for permanent human occupancy. Current legislation defines only permissible exposure limits for occupational environments, including the Permissible Exposure Limit (NDS), the Short-Term Exposure Limit (NDSCh), and the Maximum Exposure Limit (NDSP) [
45]. These limits refer to workplace safety rather than indoor environmental quality in buildings such as schools or childcare facilities.
Guidelines concerning acceptable indoor CO
2 concentrations are instead provided in the international standards and widely adopted recommendations, including those developed by ASHRAE and ASTM International [
46,
47]. These documents commonly indicate that carbon dioxide concentrations in spaces occupied for extended periods should not exceed approximately 1000 ppm, which is generally associated with adequate ventilation conditions [
2]. To maintain such levels, an outdoor airflow rate of approximately 27 m
3/h per person is typically required [
47].
In Poland, ventilation design in public buildings has traditionally followed the PN-B-03430 standard [
48]. According to this standard, the minimum required outdoor air supply rate is 20 m
3/h per person. However, in rooms intended for nurseries and kindergartens, the standard allows the airflow rate to be reduced to 15 m
3/h per child. It should be noted that such rooms are also occupied by adult caregivers, for whom the air supply rate should remain at 20 m
3/h per person.
An overview of ventilation requirements applied in different countries can be found in [
48]. Detailed guidance for educational buildings, adapted to the age of occupants, is provided in ASHRAE Standard 62.1 [
47]. In this standard, the required outdoor air supply rate is calculated as the sum of the rate for occupants (depending on activity level) and the rate for the emissions from building materials and equipment. For educational facilities, the recommended outdoor air supply rates per person are as follows: nursery rooms (children up to 4 years old)—18 m
3/(h·person); classrooms for children aged 5–8—18 m
3/(h·person); classrooms for children aged 9 and older—18 m
3/(h·person); and lecture rooms—13.4 m
3/(h·person) [
38].
CO
2 concentration levels in non-residential buildings are further defined in EN 16798-1 [
49], which provides guidance for national regulations (
Table 1). The standard defines four categories of indoor air quality based on the CO
2 concentration above the one outdoors. These categories correspond to different expectations of indoor environmental quality and occupant comfort. Category II represents a normal level of indoor air quality, while Category I corresponds to a higher standard recommended for sensitive groups of occupants, such as children, the elderly, or individuals with health conditions.
Based on the above standards, the ventilation scenarios analyzed in this study were defined using two outdoor air supply rates: 20 m
3/h per person, corresponding to the minimum requirements according to the Polish regulations, and 50 m
3/h per person, representing a higher indoor air quality level according to EN 16798-1 [
49].
2.2. Description of the Classroom
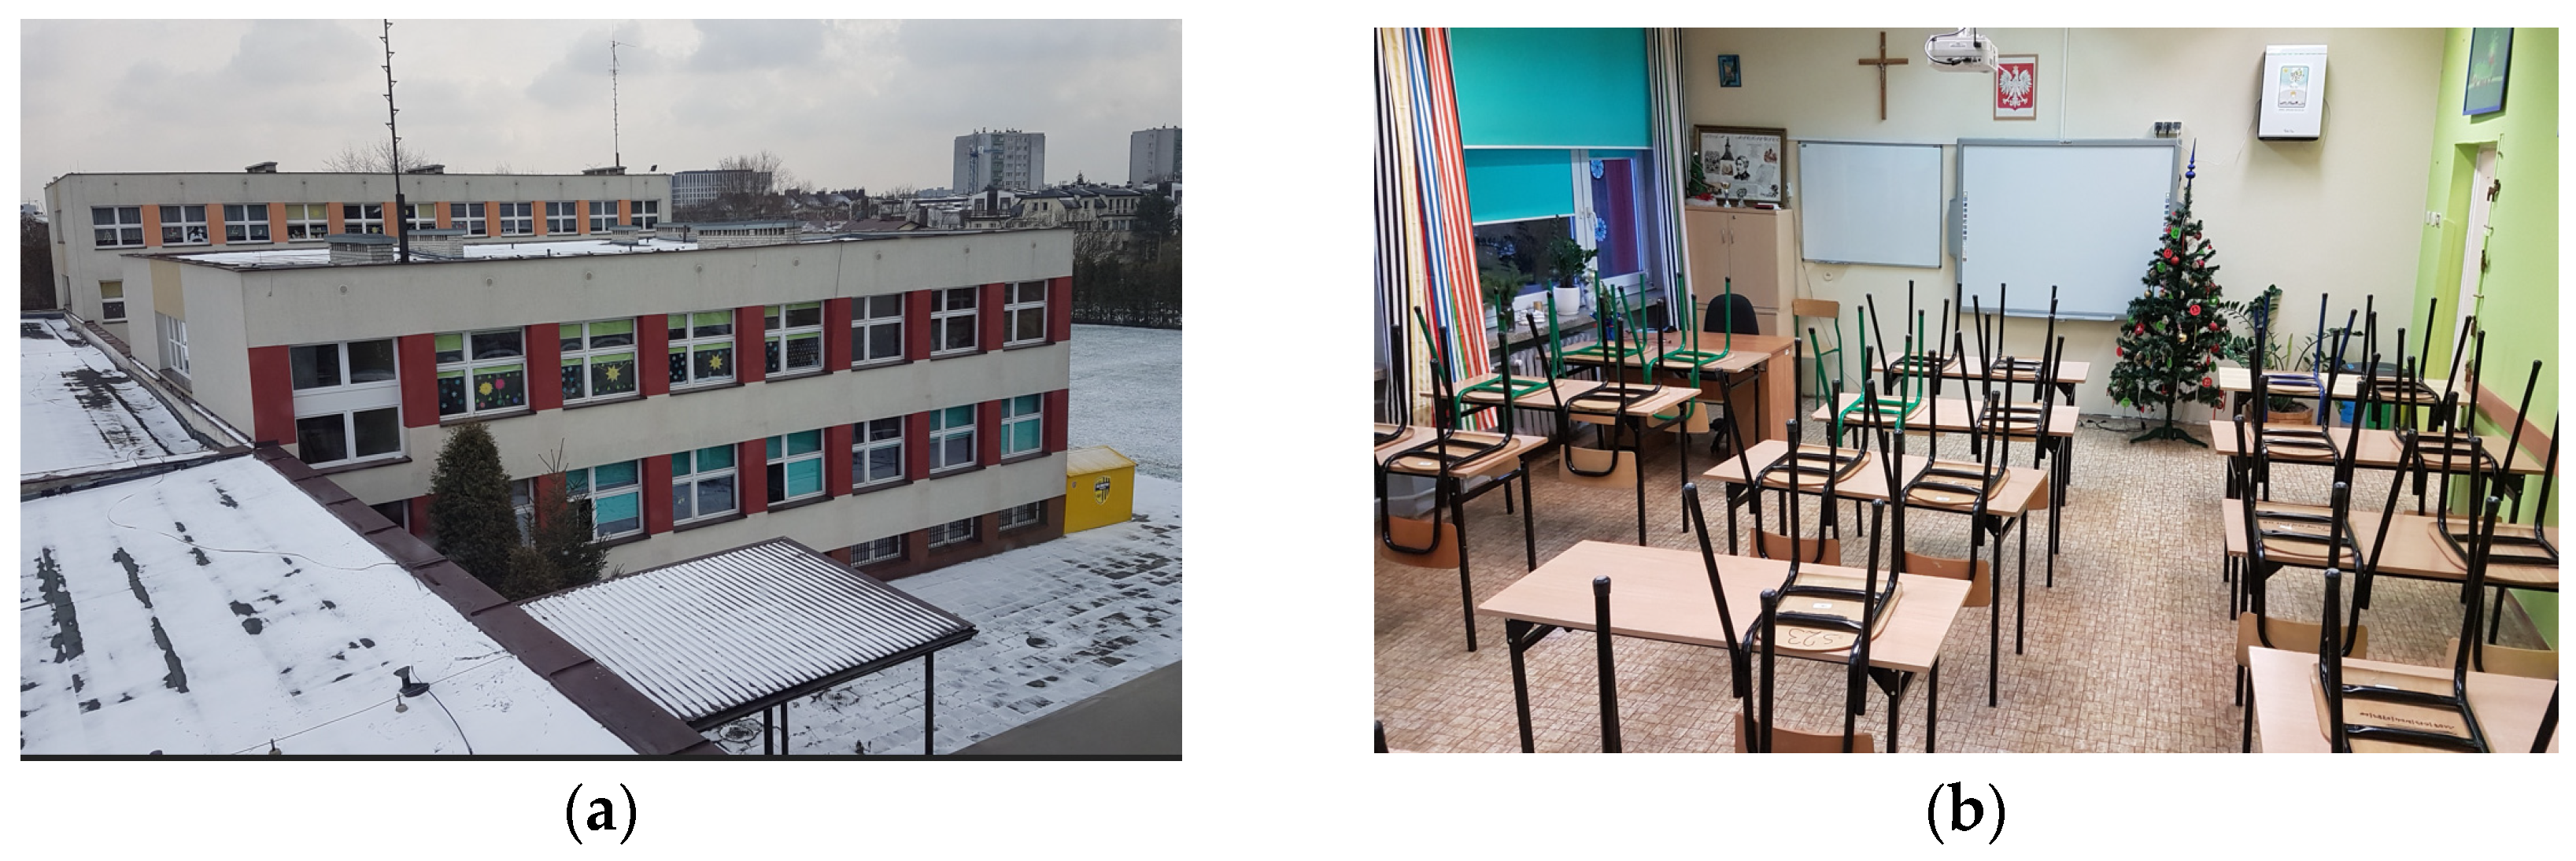
The measurements were conducted in a classroom located on the ground floor of a two-story primary school building in Kraków, Poland, approximately 2 km from the historic city center (
Figure 1a). The classroom is designed for a maximum occupancy of 31 persons (30 pupils and one teacher), while the typical occupancy during simulations was 26 persons (25 pupils and one teacher).
The classroom had one external wall with three windows (width 2.55 m × height 1.80 m) facing the western façade of the building. Ventilation was provided exclusively by natural ventilation; there were four vertical ventilation ducts (10 cm × 10 cm) and air exhaust openings at a height of 3 m above the floor. Outdoor air entered the classroom through window infiltration. The classroom’s total floor area was 52 m
2, and its volume was 166 m
3 (
Figure 1b). The occupants were the only source of indoor CO
2.
2.3. Measurement Equipment and Sensor Arrangement
Indoor environmental parameters were measured using a set of iBros remote sensors enabling the continuous monitoring and data logging of CO2 concentration, air temperature, and relative humidity. Measurements were recorded at 30 s intervals. According to the manufacturer’s specifications, the measurement accuracy was ±50 ppm for CO2 concentration, ±0.4 °C for air temperature, and ±5% for relative humidity. Prior to the measurement, all sensors were calibrated in accordance with the manufacturer’s instructions to ensure measurement consistency and reliability.
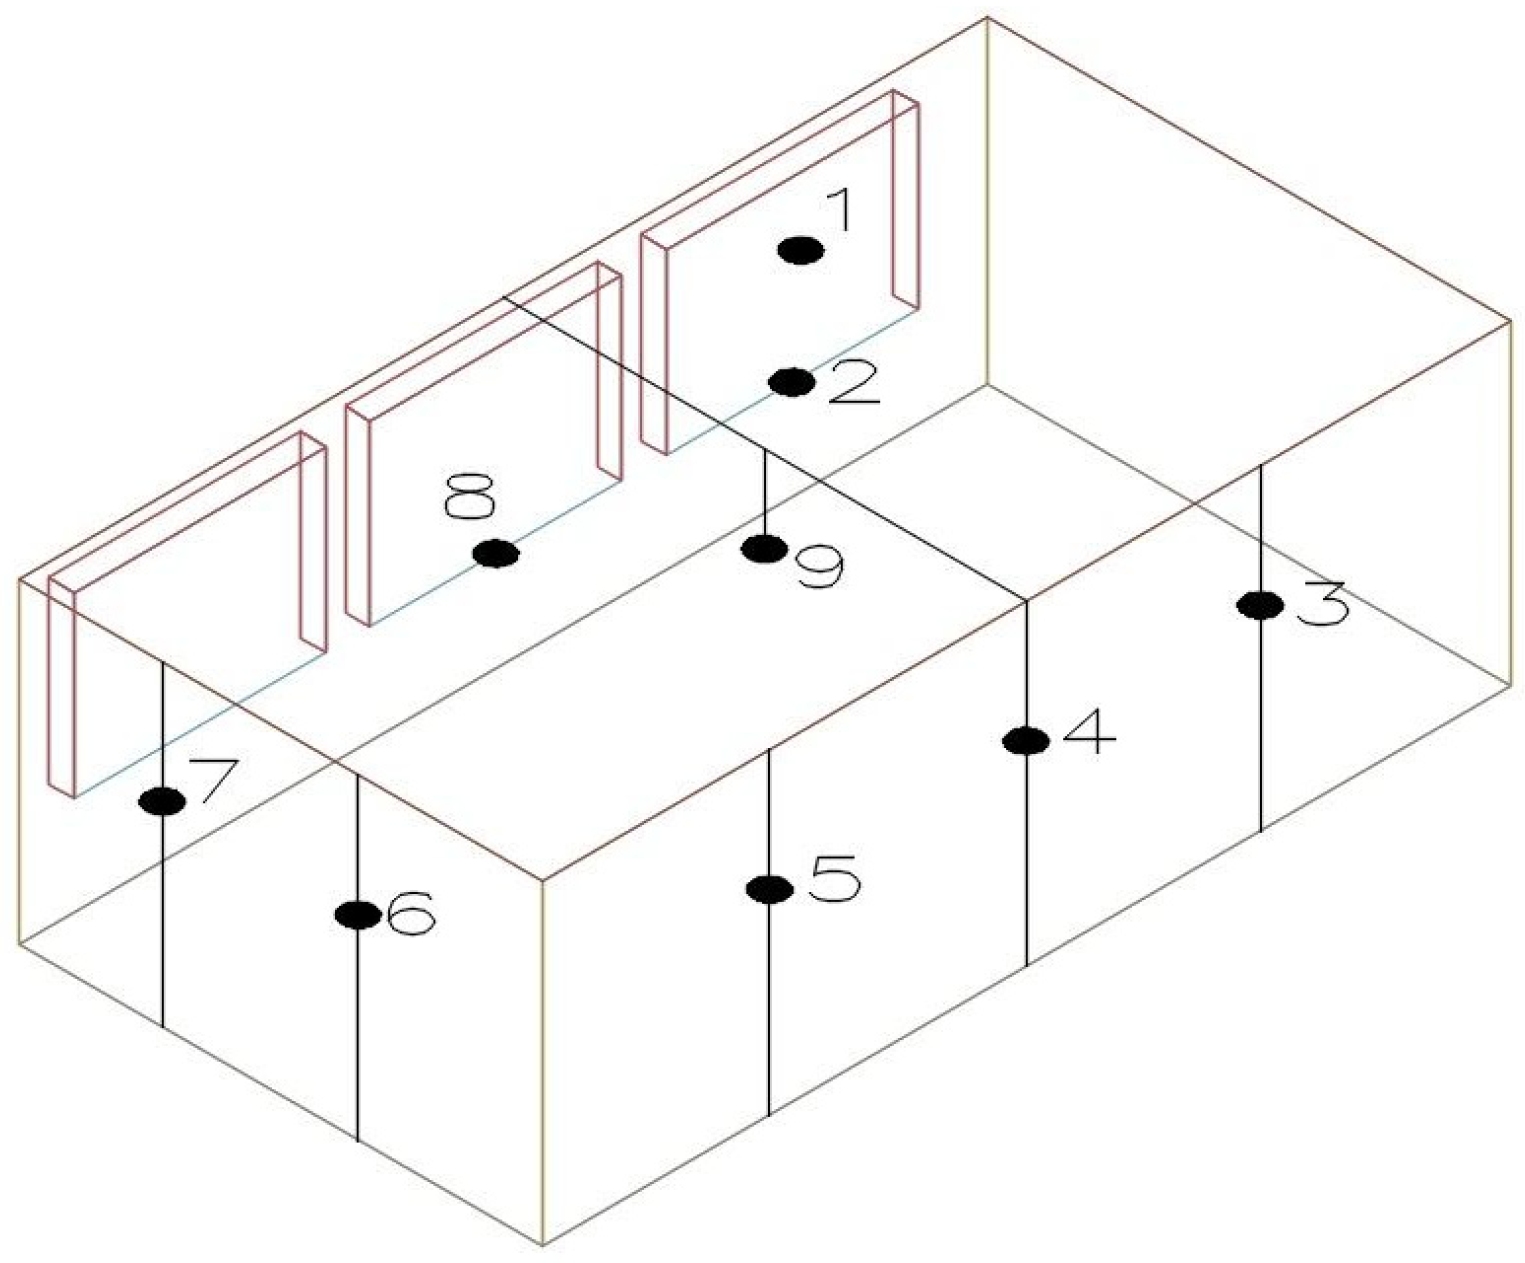
Nine sensors were installed at different locations within the classroom (
Figure 2). This arrangement enabled the assessment of both the spatial distribution and temporal variations in CO
2 concentration, air temperature, and relative humidity.
2.4. Measurements
Measurements were conducted on three separate days: 4 January 2019, 11 January 2019, and 1 February 2019. All measurements were performed during morning hours while regular classes were in session. Due to the similarity in CO2 concentration and indoor temperature trends across all measurement days, detailed results are presented only for one representative day, namely, 4 January 2019.
On this day, the classroom was occupied by 21 pupils and two adults. School activities started at 8:55, with pupils entering the classroom between 8:40 and 8:50. Each lesson lasted 45 min and was followed by a 10 min break.
Sensor No. 2 was located on the external windowsill and was used to monitor the outdoor background CO2 concentration near the façade.
2.5. Simulation Methodology
The measurement results were used to validate the model in the CONTAM program. This process was described in [
44]. The assumptions listed in
Table 2 were used in the simulations.
Air supply rates obtained from CONTAM simulations were subsequently used as input for EnergyPlus energy demand calculations. The simulations aimed to estimate energy losses and gains associated with ventilation during the analyzed period.
The following assumptions were made with regard to the EnergyPlus analysis:
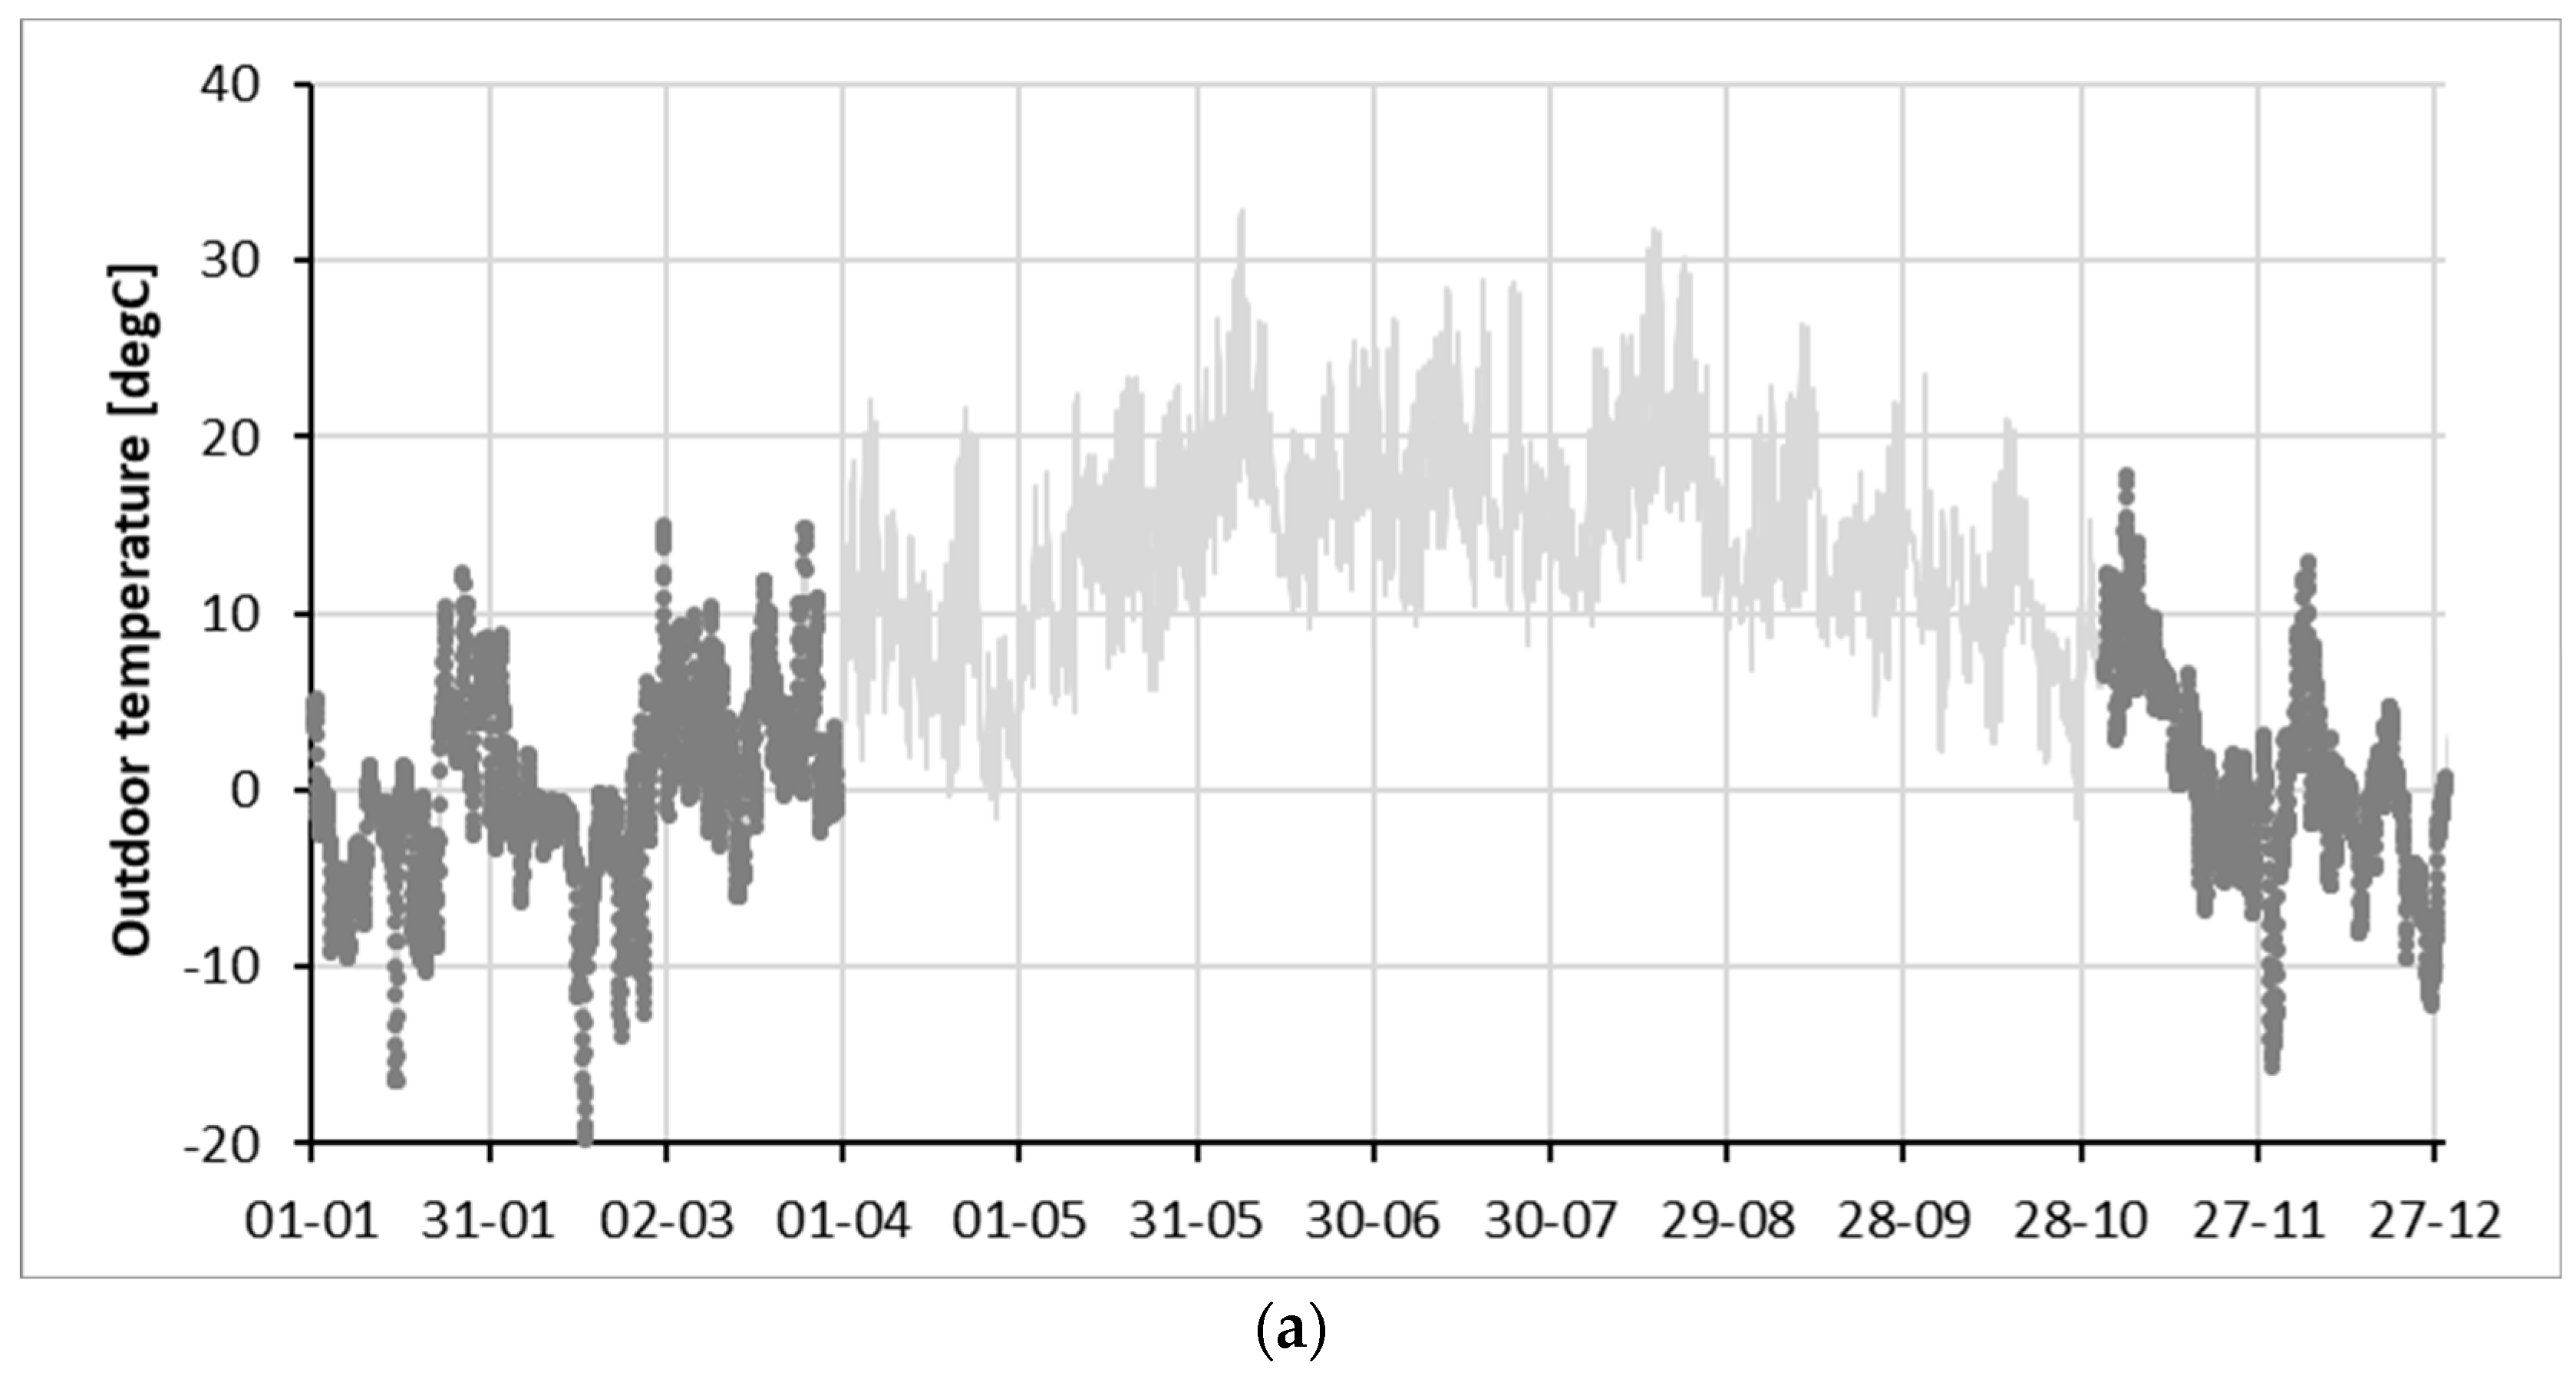
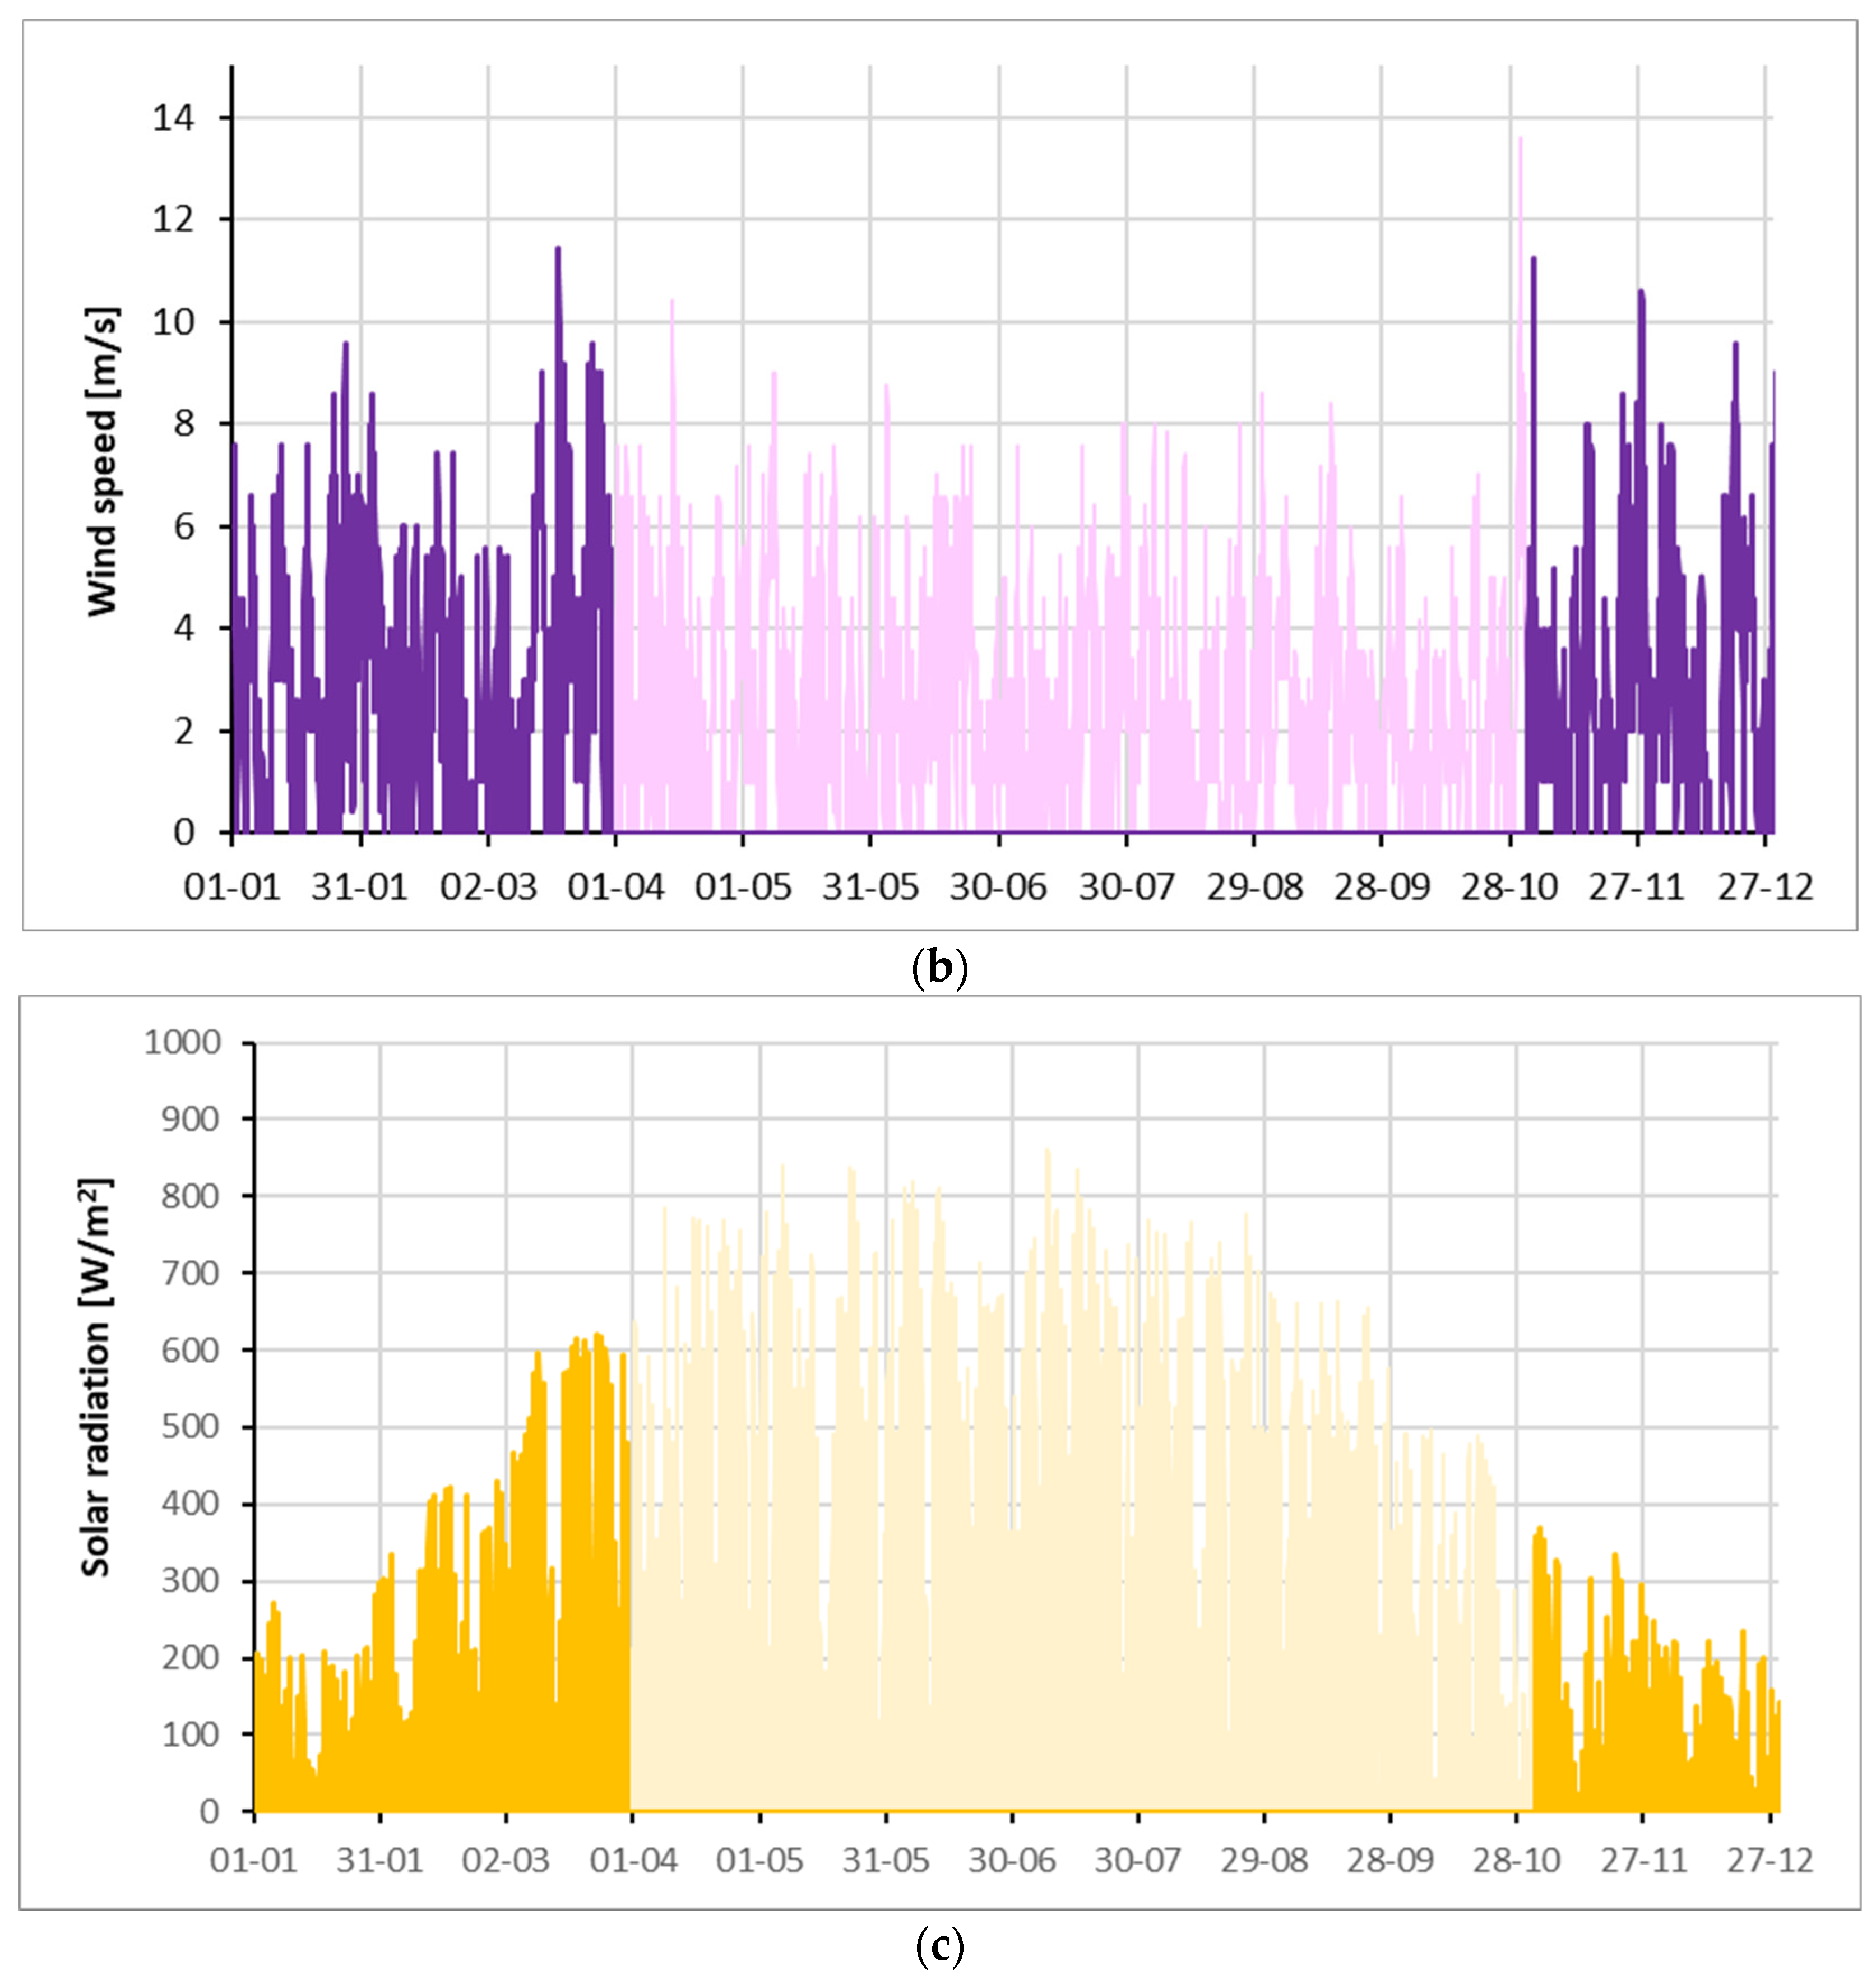
Climate data: hourly weather data for Kraków. Changes in climate parameters, air temperature, wind speed, and solar radiation are presented in
Figure 3a–c.
Occupancy profile: 26 occupants, 25 pupils, and 1 teacher.
Occupancy schedule: classroom occupied from 8:00 to 13:35.
Internal heat gains: equipment: 300 W, lighting: 5 W/m2, with daylight control maintaining an illuminance level of 500 lx.
Windows: three windows with dimensions of 2.55 m × 1.80 m each; thermal transmittance U = 1.6 W/(m2·K).
Building envelope: external wall construction: standard type (U = 0.42 W/(m2·K); remaining three walls treated as adiabatic.
Heating setpoints: 21 °C between 07:00 and 16:00; 16 °C during unoccupied hours.
Heating system: district heating; non-renewable primary energy factor for Kraków equal to 0.8.
Electricity supply: electricity from the national power grid; non-renewable primary energy factor for Poland equal to 2.5.
Figure 3a–c present the annual distribution of climatic conditions for Kraków, including outdoor temperature, wind speed, and solar radiation, which were used as input data for the EnergyPlus simulations.
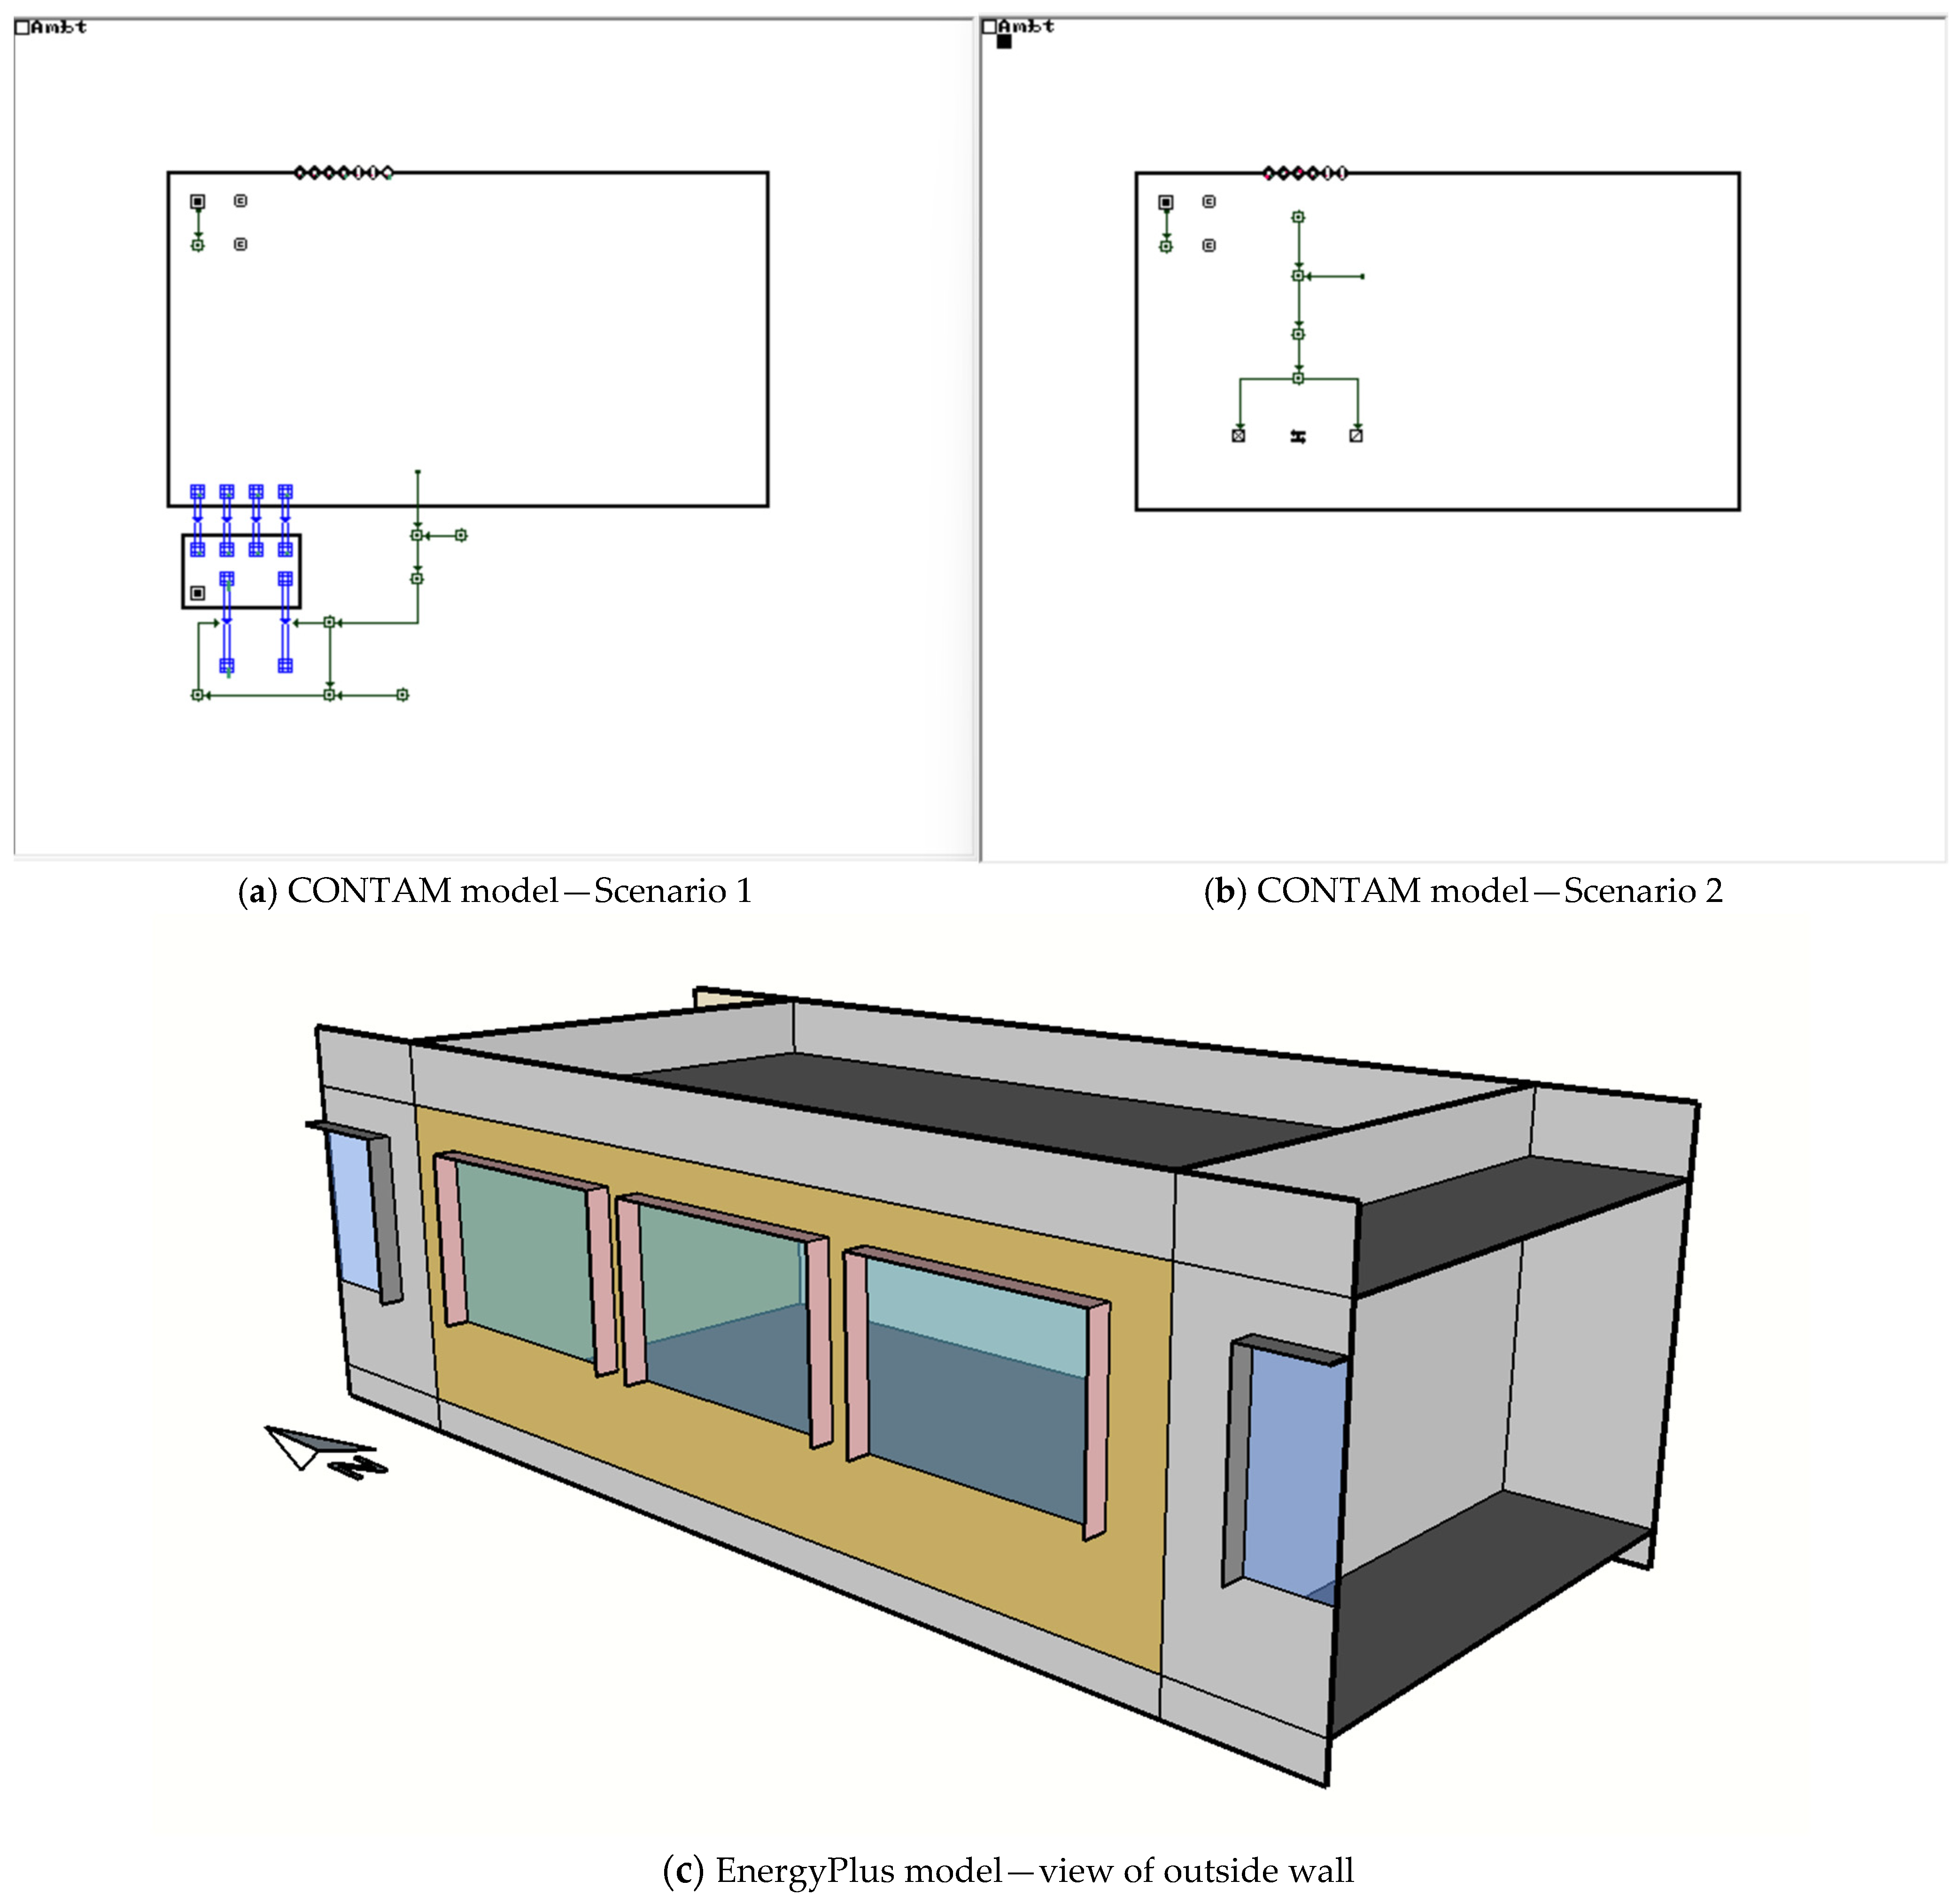
To ensure consistent analysis of both indoor air quality and energy demand, a coupled simulation approach was used with CONTAM and EnergyPlus. First, the CONTAM model was developed to represent the classroom geometry, occupancy patterns, and natural ventilation characteristics and was calibrated using the measured indoor CO
2 concentrations; we used a previously developed model [
44]. The air supply rates obtained from CONTAM simulations (
Figure 4a,b), reflecting realistic ventilation scenarios under winter conditions, were subsequently exported to EnergyPlus as time-dependent ventilation inputs (
Figure 4c). This one-way coupling approach enabled the evaluation of heating energy demand associated with different ventilation strategies while preserving airflow patterns consistent with the measured indoor air quality conditions.
In the previous analyses [
44], the indoor CO
2 concentration in the classroom was simulated for the heating season (1 November–31 March) when the classroom was naturally ventilated with typical occupancy conditions, using hourly climatic data for Kraków. The results of these analyses serve as the reference scenario in the present analysis. The same calibrated simulation model was subsequently applied in the present analyses to assess different mechanical ventilation configurations.
The CO2-based demand-controlled ventilation (DCV) strategy was implemented. The supply airflow rate was modulated to maintain indoor CO2 concentration below 1300 ppm. In the heat recovery variants, the fan operation was additionally stopped when the CO2 concentration dropped below 750 ppm.
The analyzed configurations were designed to enable a systematic comparison of the effects of ventilation airflow rate and heat recovery on indoor air quality and seasonal energy performance under identical boundary conditions and occupancy schedules.
According to the EN 16798-1 [
49] standard, the outdoor airflow rate was calculated as the sum of two components: one connected with the minimum airflow per person and the second one with the emission from building materials.
where
qtot—the total outdoor airflow rate;
qp—the minimum airflow per person;
n—the number of people;
AR—the room area; and
qB—the airflow to dilute emissions from building materials.
By substituting n = 25, q
p = 36 m
3/h, A
R= 52 m
2, and q
B = 7.2 m
3/h, we obtain q
tot = 1274 m
3/h, which yields 50.1 m
3/h per person; for further investigation, 50 m
3/h per person was taken. The component q
B represents the airflow required to dilute pollutants emitted from building materials, furnishings, and indoor surfaces, as specified in EN 16798-1 [
49].
2.6. Simulation Scenarios
Two mechanical ventilation systems were analyzed: mechanical exhaust ventilation and balanced mechanical ventilation with heat recovery (HRV). For each system, two design outdoor airflow rates were considered:
In all cases, ventilation was controlled using a CO2-based demand-controlled ventilation (DCV) strategy. The outdoor airflow rate was modulated to maintain indoor CO2 concentration below 1300 ppm. The system operation was reduced when CO2 concentration dropped below 750 ppm.
As a result, four simulation variants were defined, exhaust ventilation (Scenarios 1A and 1B) and balanced ventilation with heat recovery (Scenarios 2A and 2B), allowing for a systematic comparison of the effects of airflow rate and heat recovery on indoor air quality and energy performance:
Scenario 1A—mechanical exhaust ventilation (MEV), 20 m3/h per person;
Scenario 1B—mechanical exhaust ventilation (MEV), 50 m3/h per person;
Scenario 2A—balanced mechanical ventilation with heat recovery (HRV), 20 m3/h per person;
Scenario 2B—balanced mechanical ventilation with heat recovery (HRV), 50 m3/h per person.
3. Results
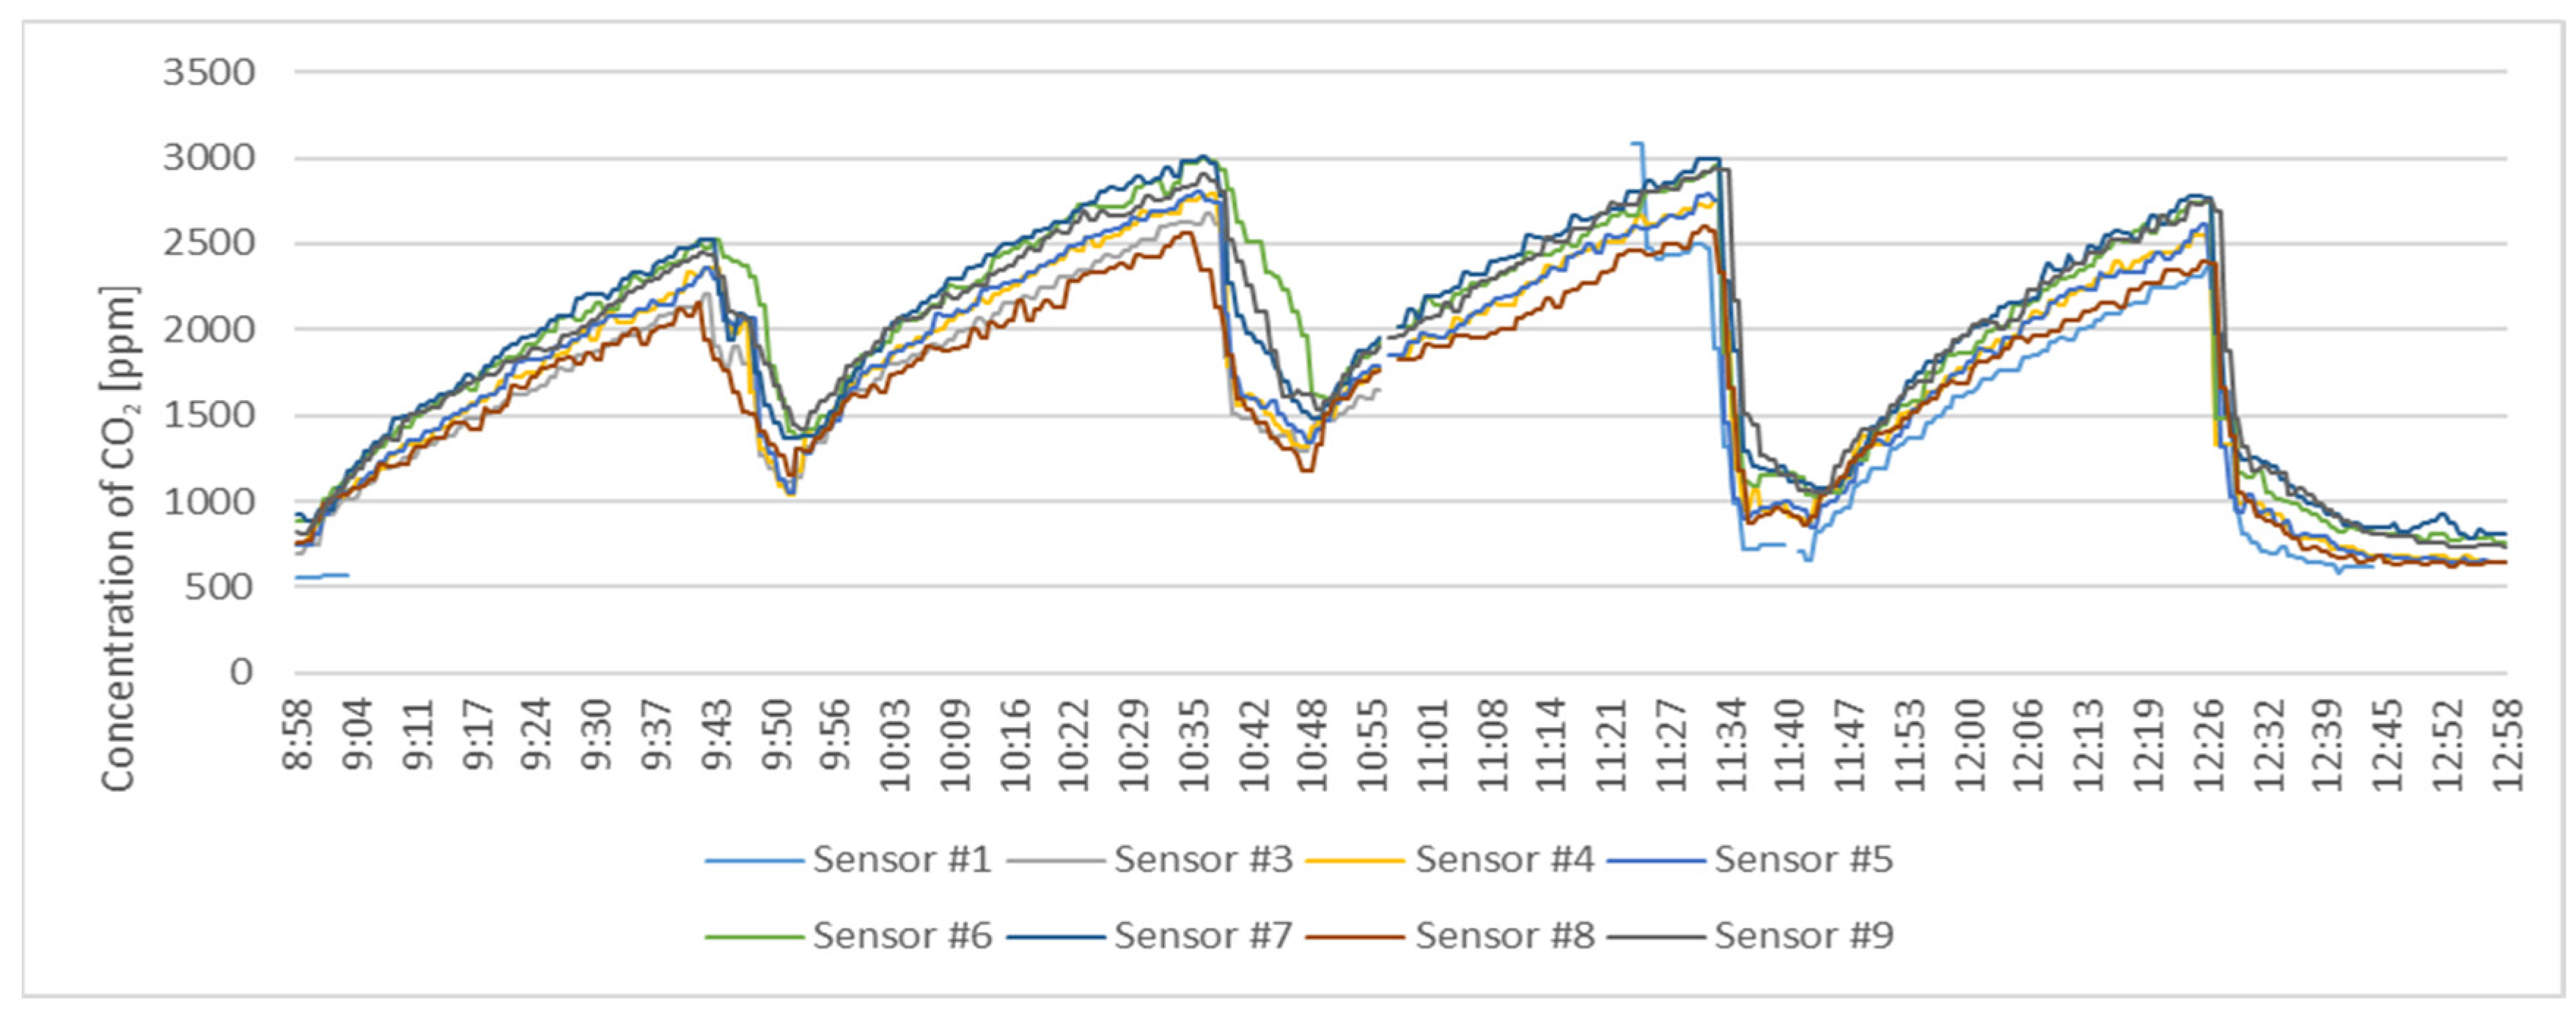
Figure 5 presents the measured temporal variation in indoor CO
2 concentration during a typical winter school day under natural ventilation conditions. A rapid increase in indoor CO
2 concentration was observed during the first lesson, with the mean value reaching approximately 2500 ppm before the first break.
During the break, partial window opening reduced CO2 concentration to approximately 1250 ppm, corresponding to an average reduction rate of about 125 ppm/min. However, despite intermittent airing during breaks, the CO2 concentration did not decrease below 1000 ppm. During subsequent lessons, CO2 levels continued to increase, exceeding 3000 ppm.
Windows were generally kept closed during lessons due to low outdoor temperatures and external noise from nearby traffic. This behavior is typical for winter conditions in Polish schools and considerably limits the effectiveness of natural ventilation.
It should also be noted that the measured concentrations were obtained under partial occupancy conditions and would likely be higher if the classroom were occupied by the maximum designed number of 31 persons.
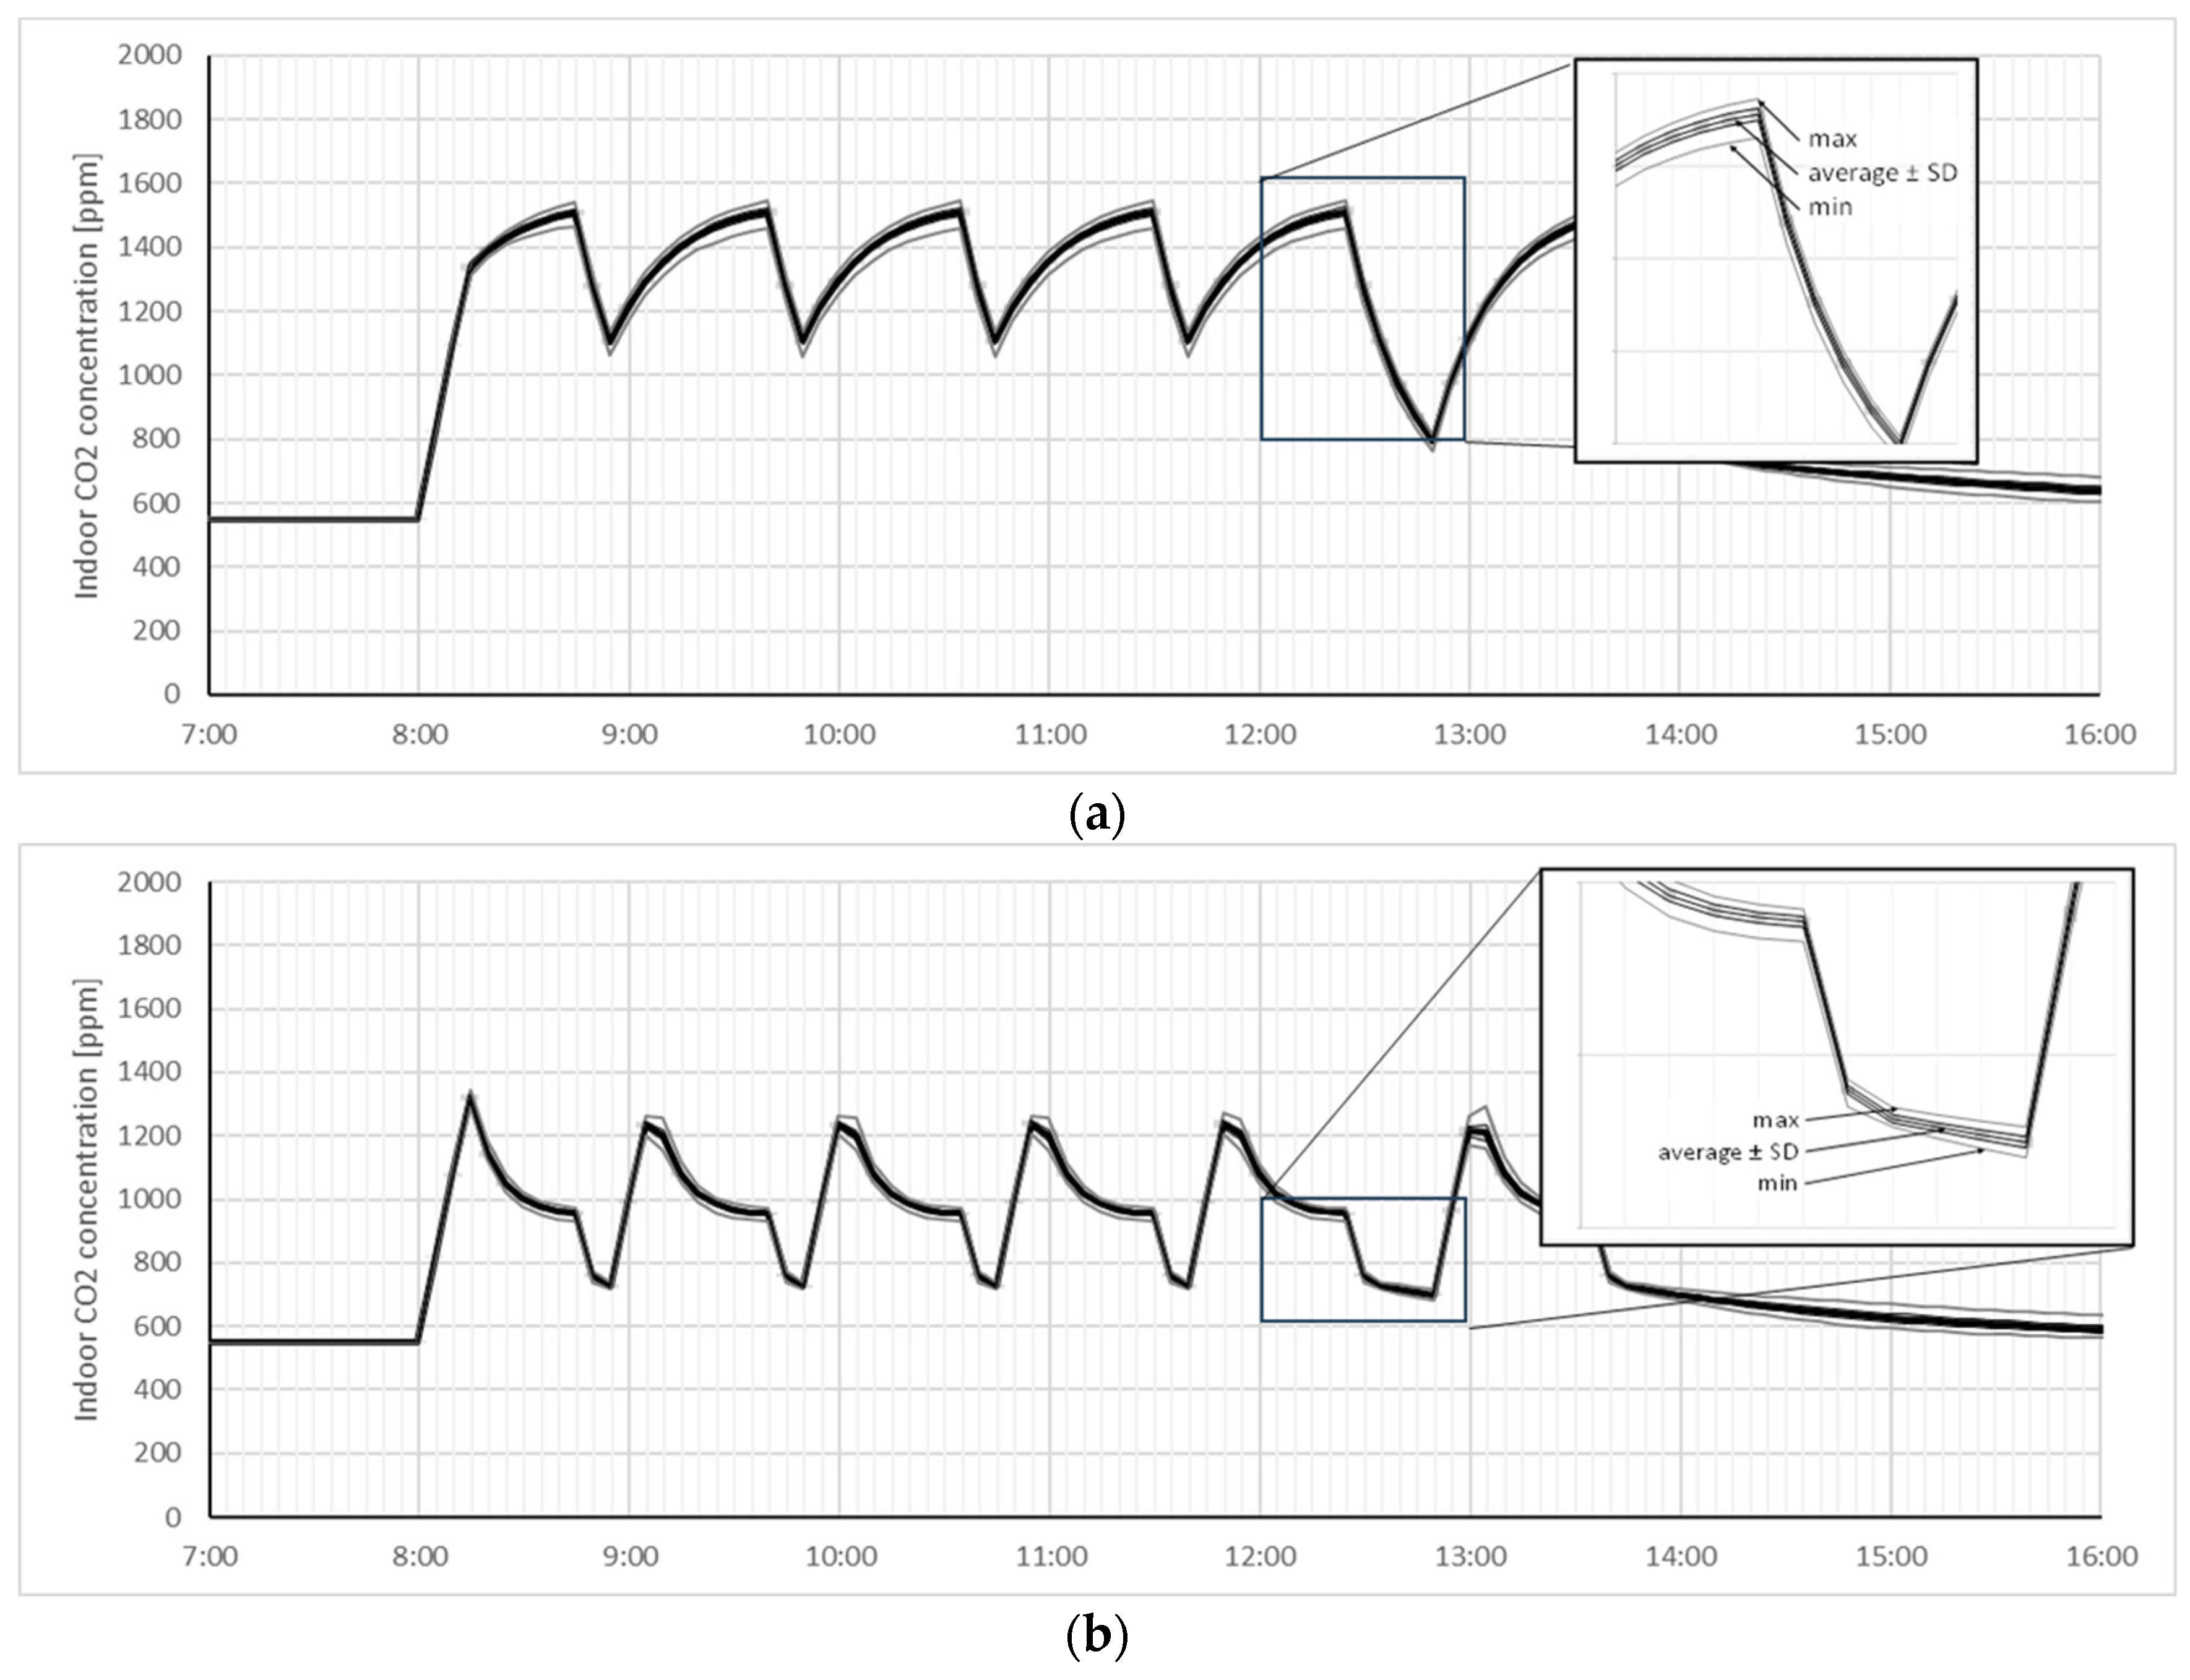
The daily profiles of indoor CO
2 concentration are shown in
Figure 6; they illustrate the dynamic response of the demand-controlled ventilation systems during typical classroom operation. In all analyzed variants, cyclic patterns corresponding to periods with pupils in the classroom and breaks are clearly visible. A comparison of the airflow scenarios indicates that the higher design airflow rates in Scenarios 1B and 2B (
Figure 6b–d) lead to lower peak concentrations and quicker reductions during breaks. In contrast, the lower airflow variants in Scenarios 1A and 2A (
Figure 6a–c) operate closer to the control limit of 1300 ppm, resulting in slightly higher concentration levels during intensive occupancy periods.
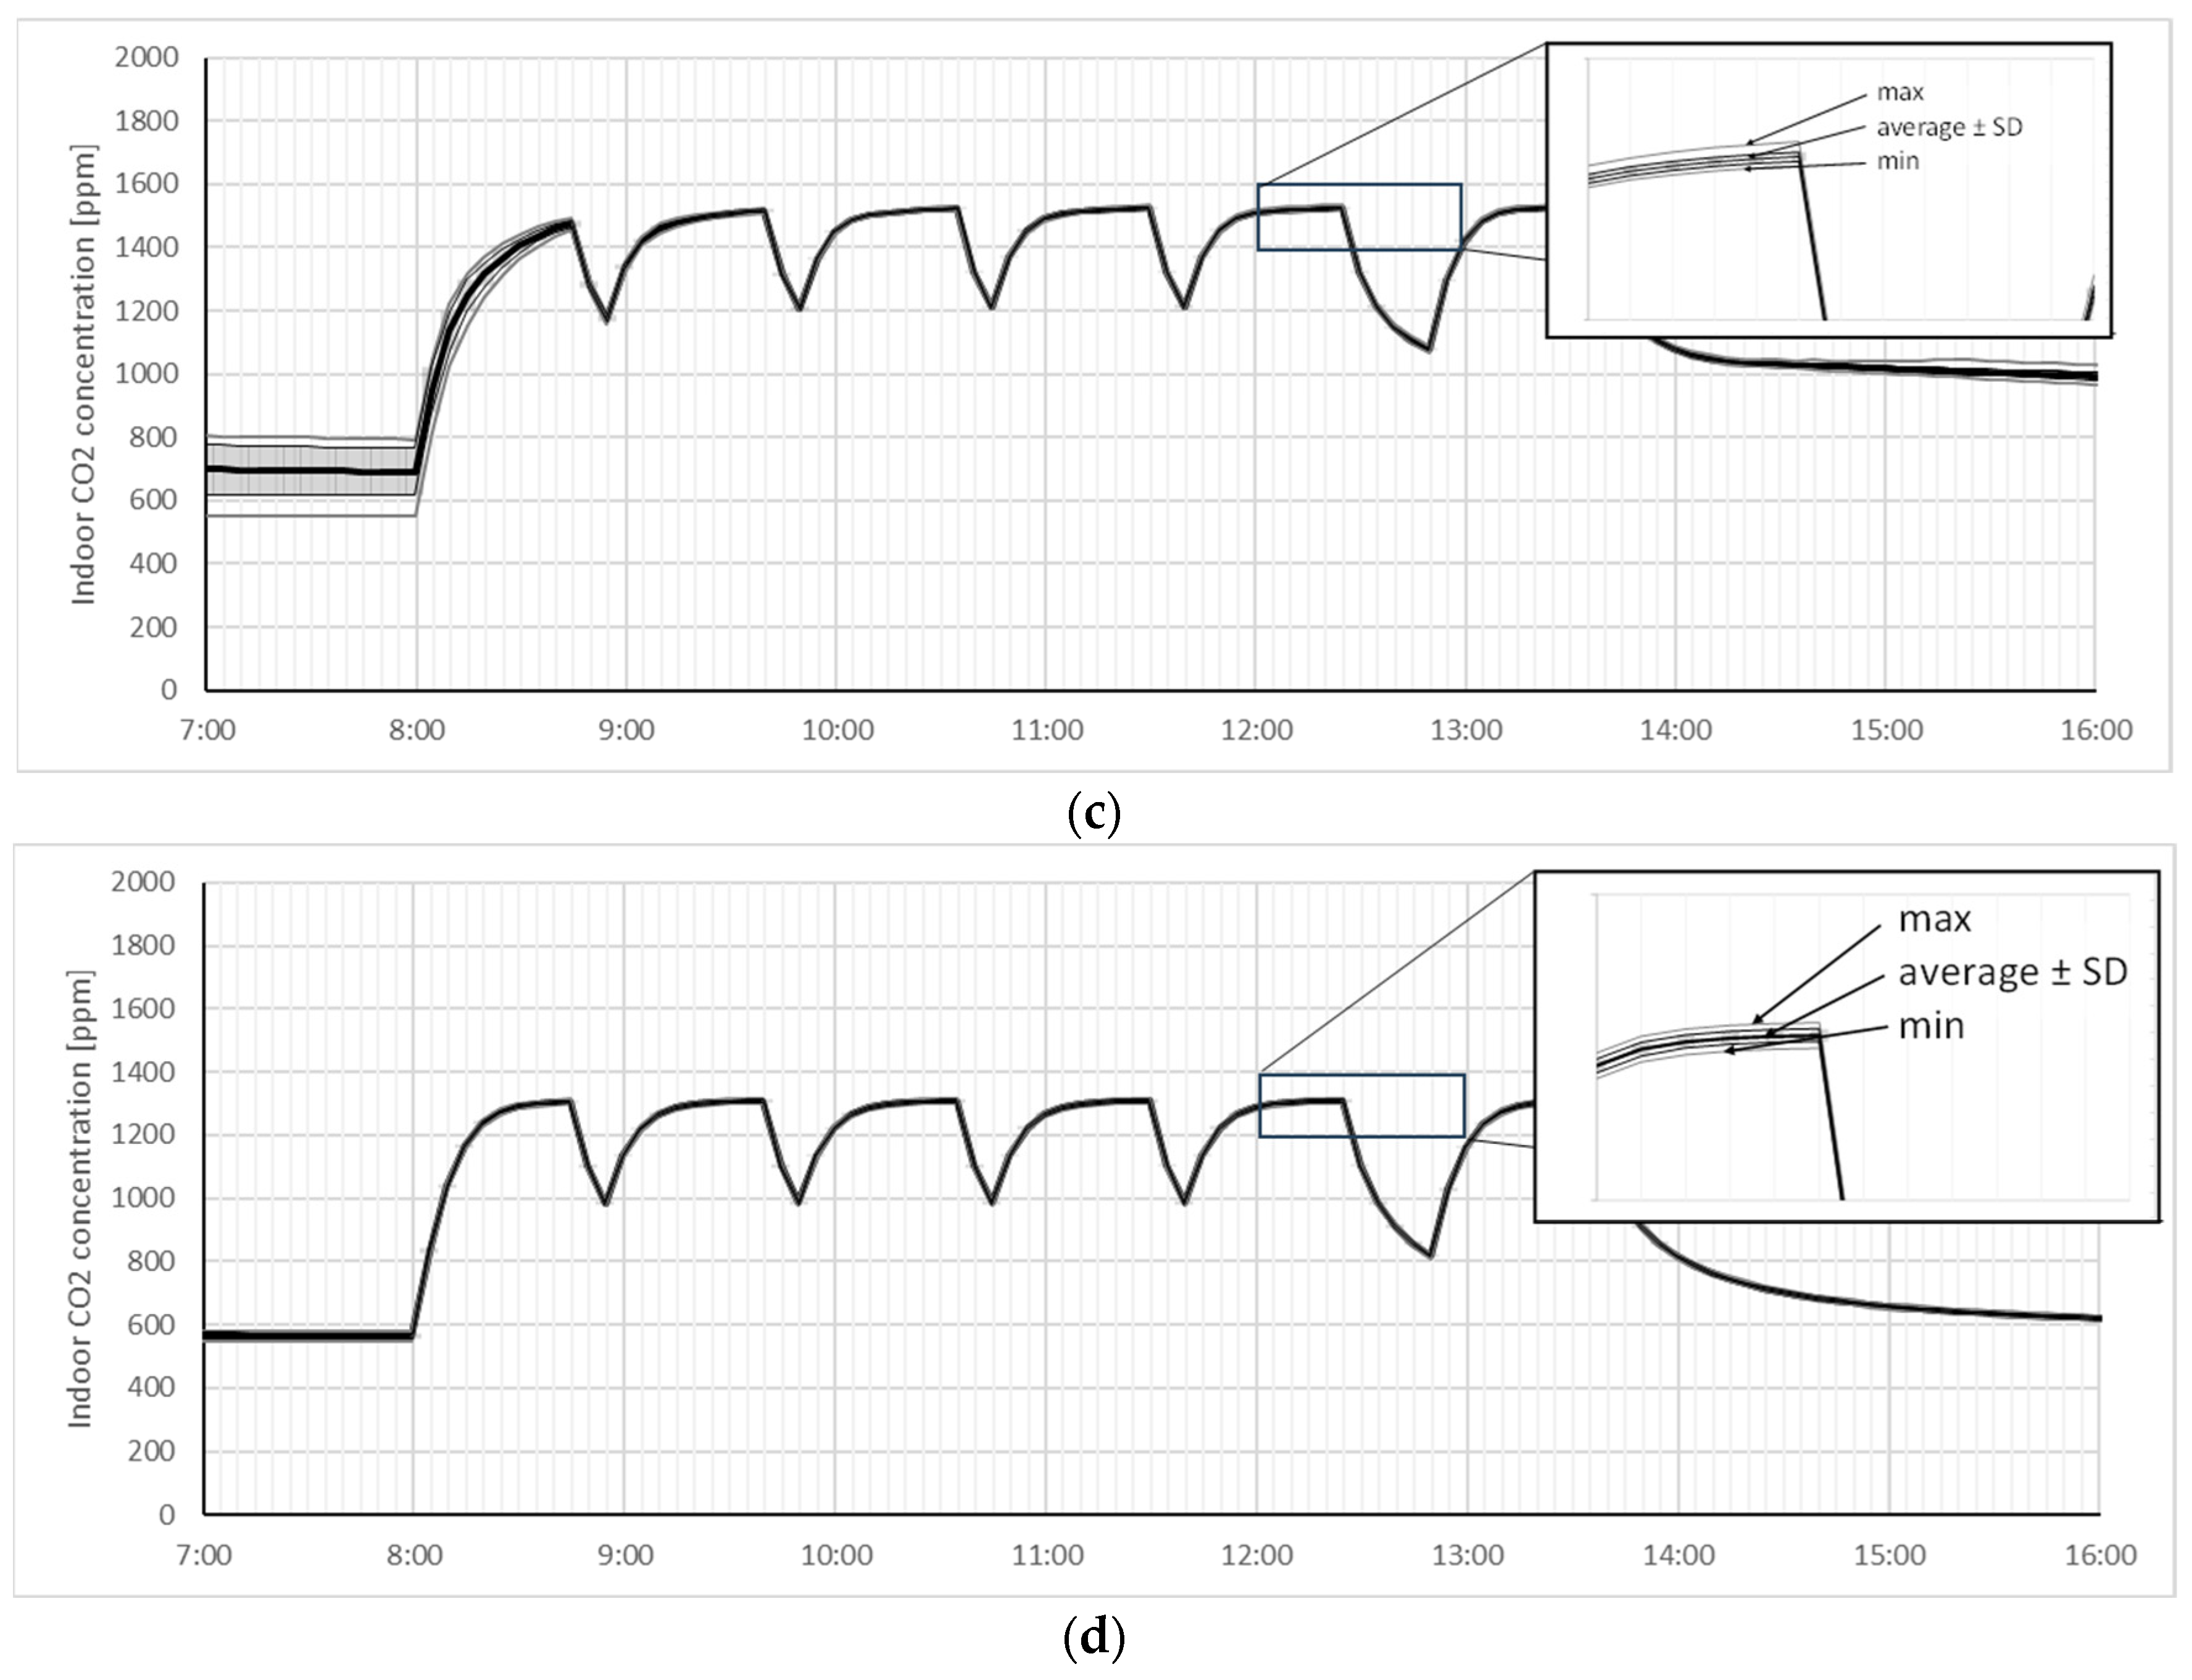
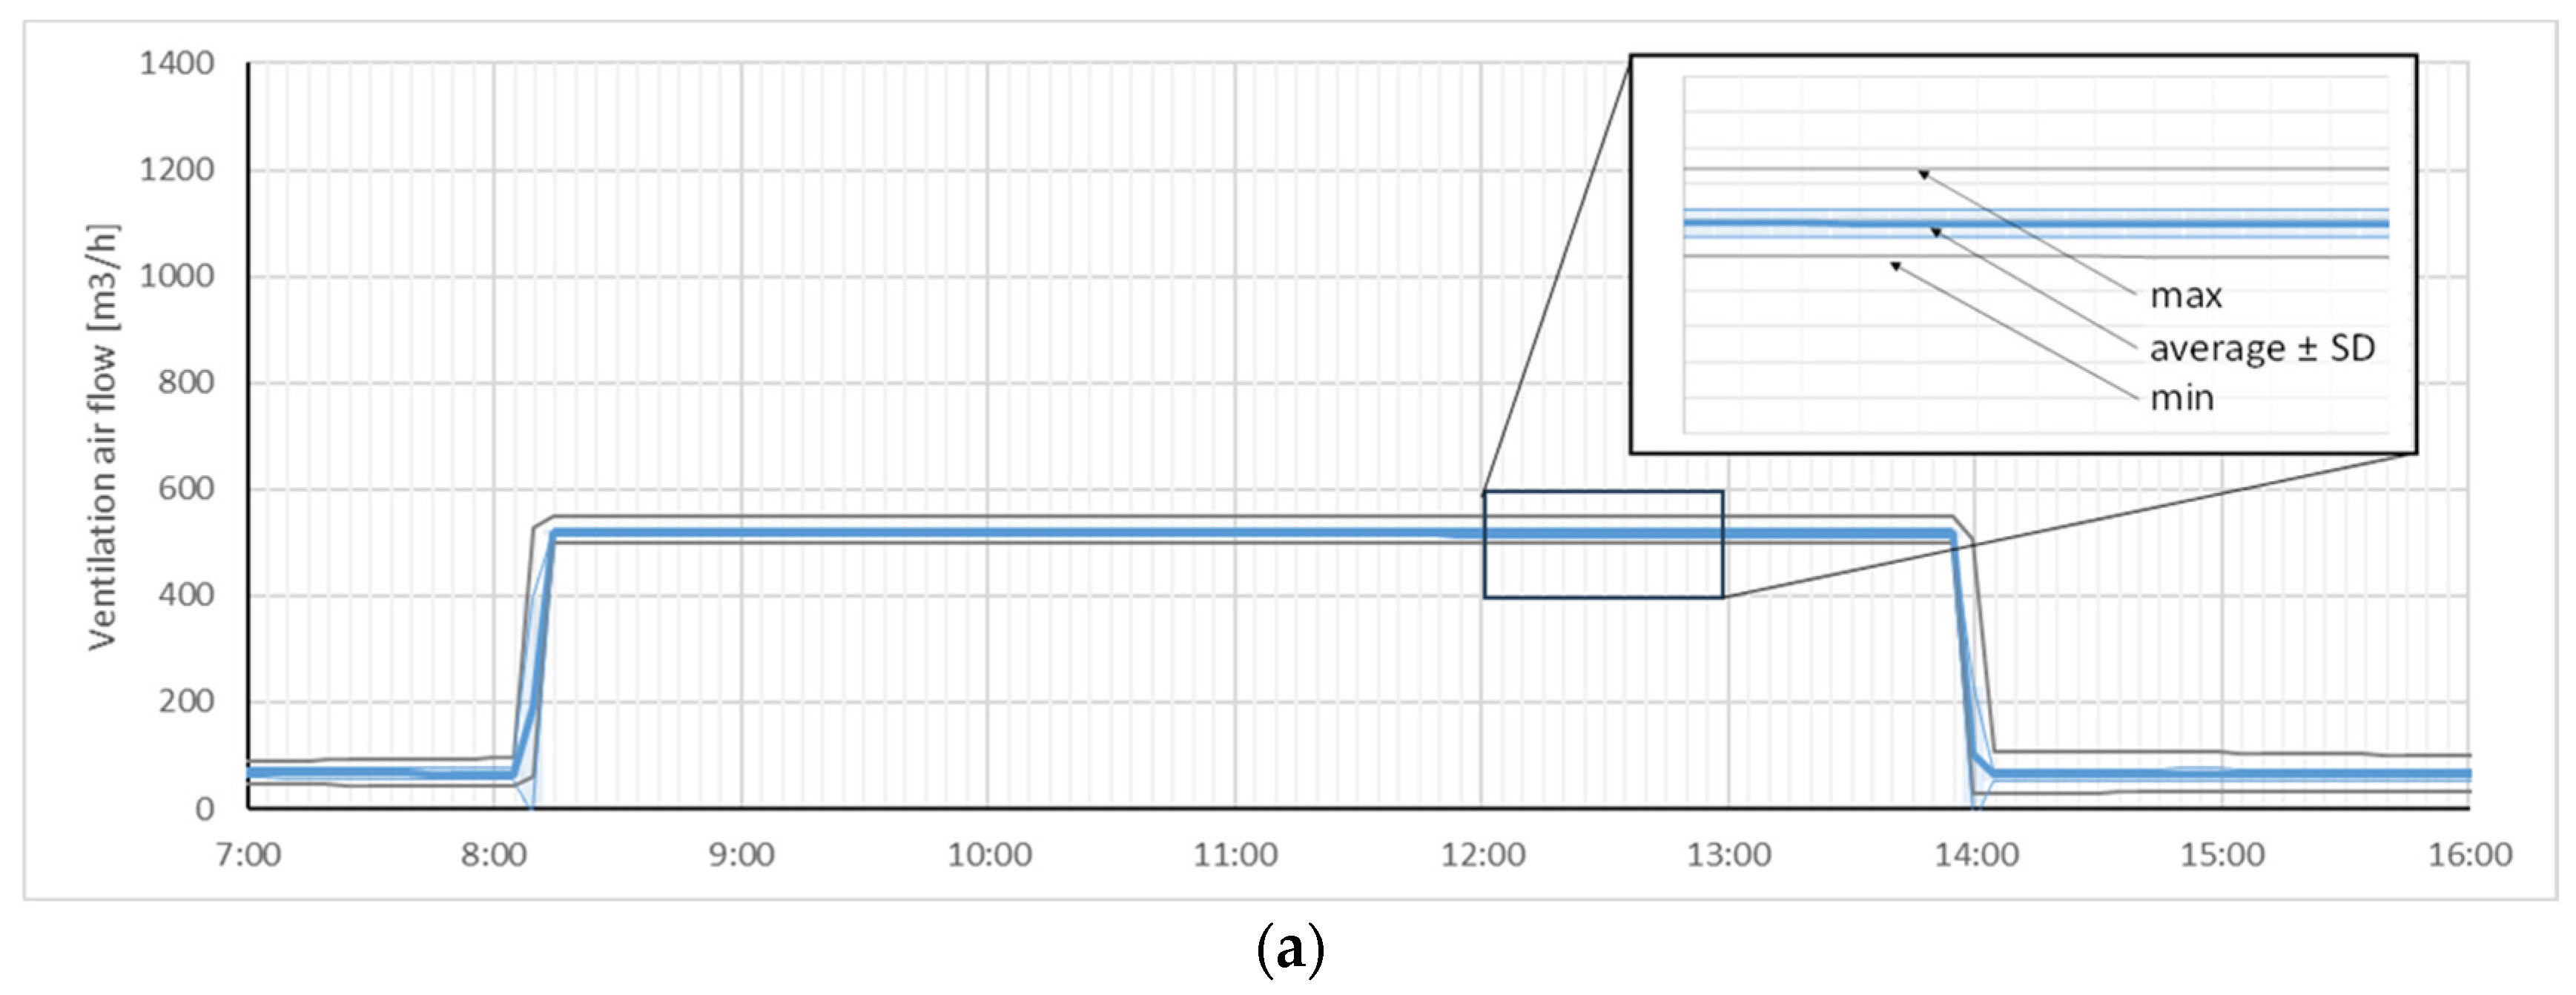
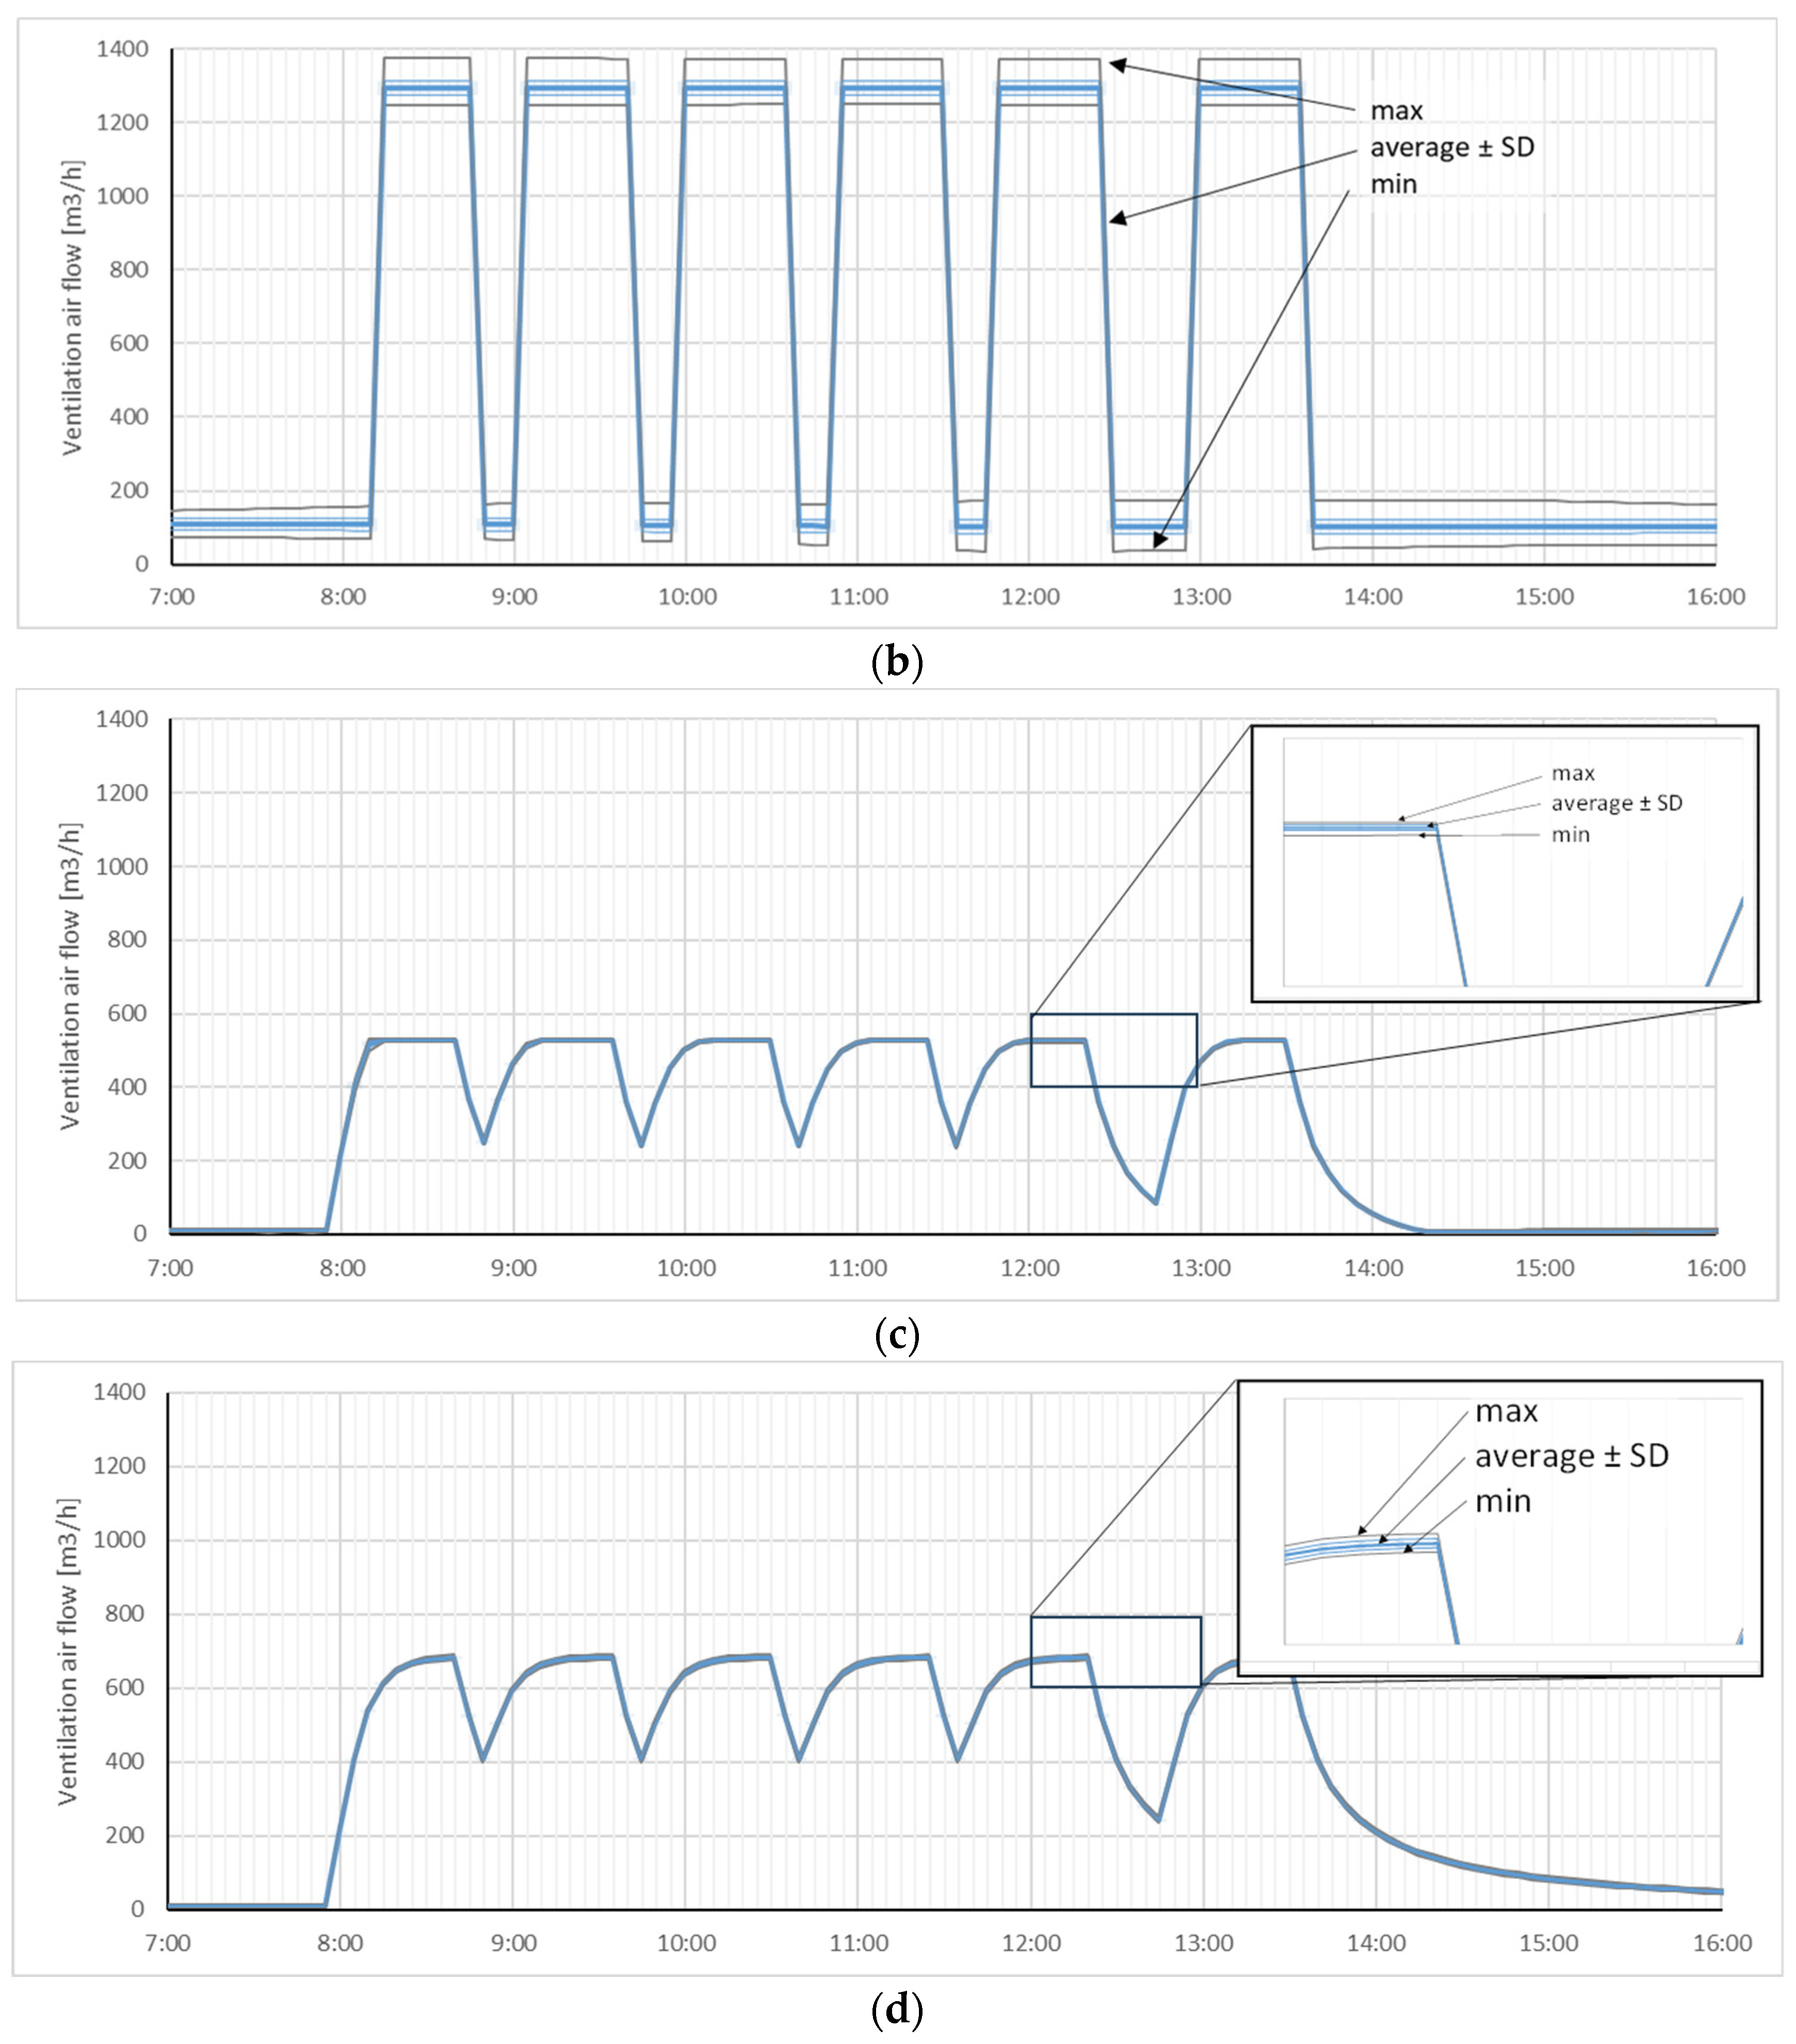
The airflow profiles are shown in
Figure 7. They reflect the operation of the CO
2 based DCV strategy. In the exhaust-only Scenarios 1A and 1B (
Figure 7a,b), airflow modulation tracks the increase and decrease in indoor CO
2 concentration relatively smoothly. In the heat recovery Scenarios 2A and 2B (
Figure 7c,d), the airflow behavior is more discontinuous due to the additional control condition that switches the fan off when CO
2 concentrations fall below 750 ppm. As a result, airflow drops to zero during periods of low occupancy, producing a more distinct on–off operational pattern. These results confirm that DCV control can effectively adjust ventilation rates to the actual occupancy-related emission load.
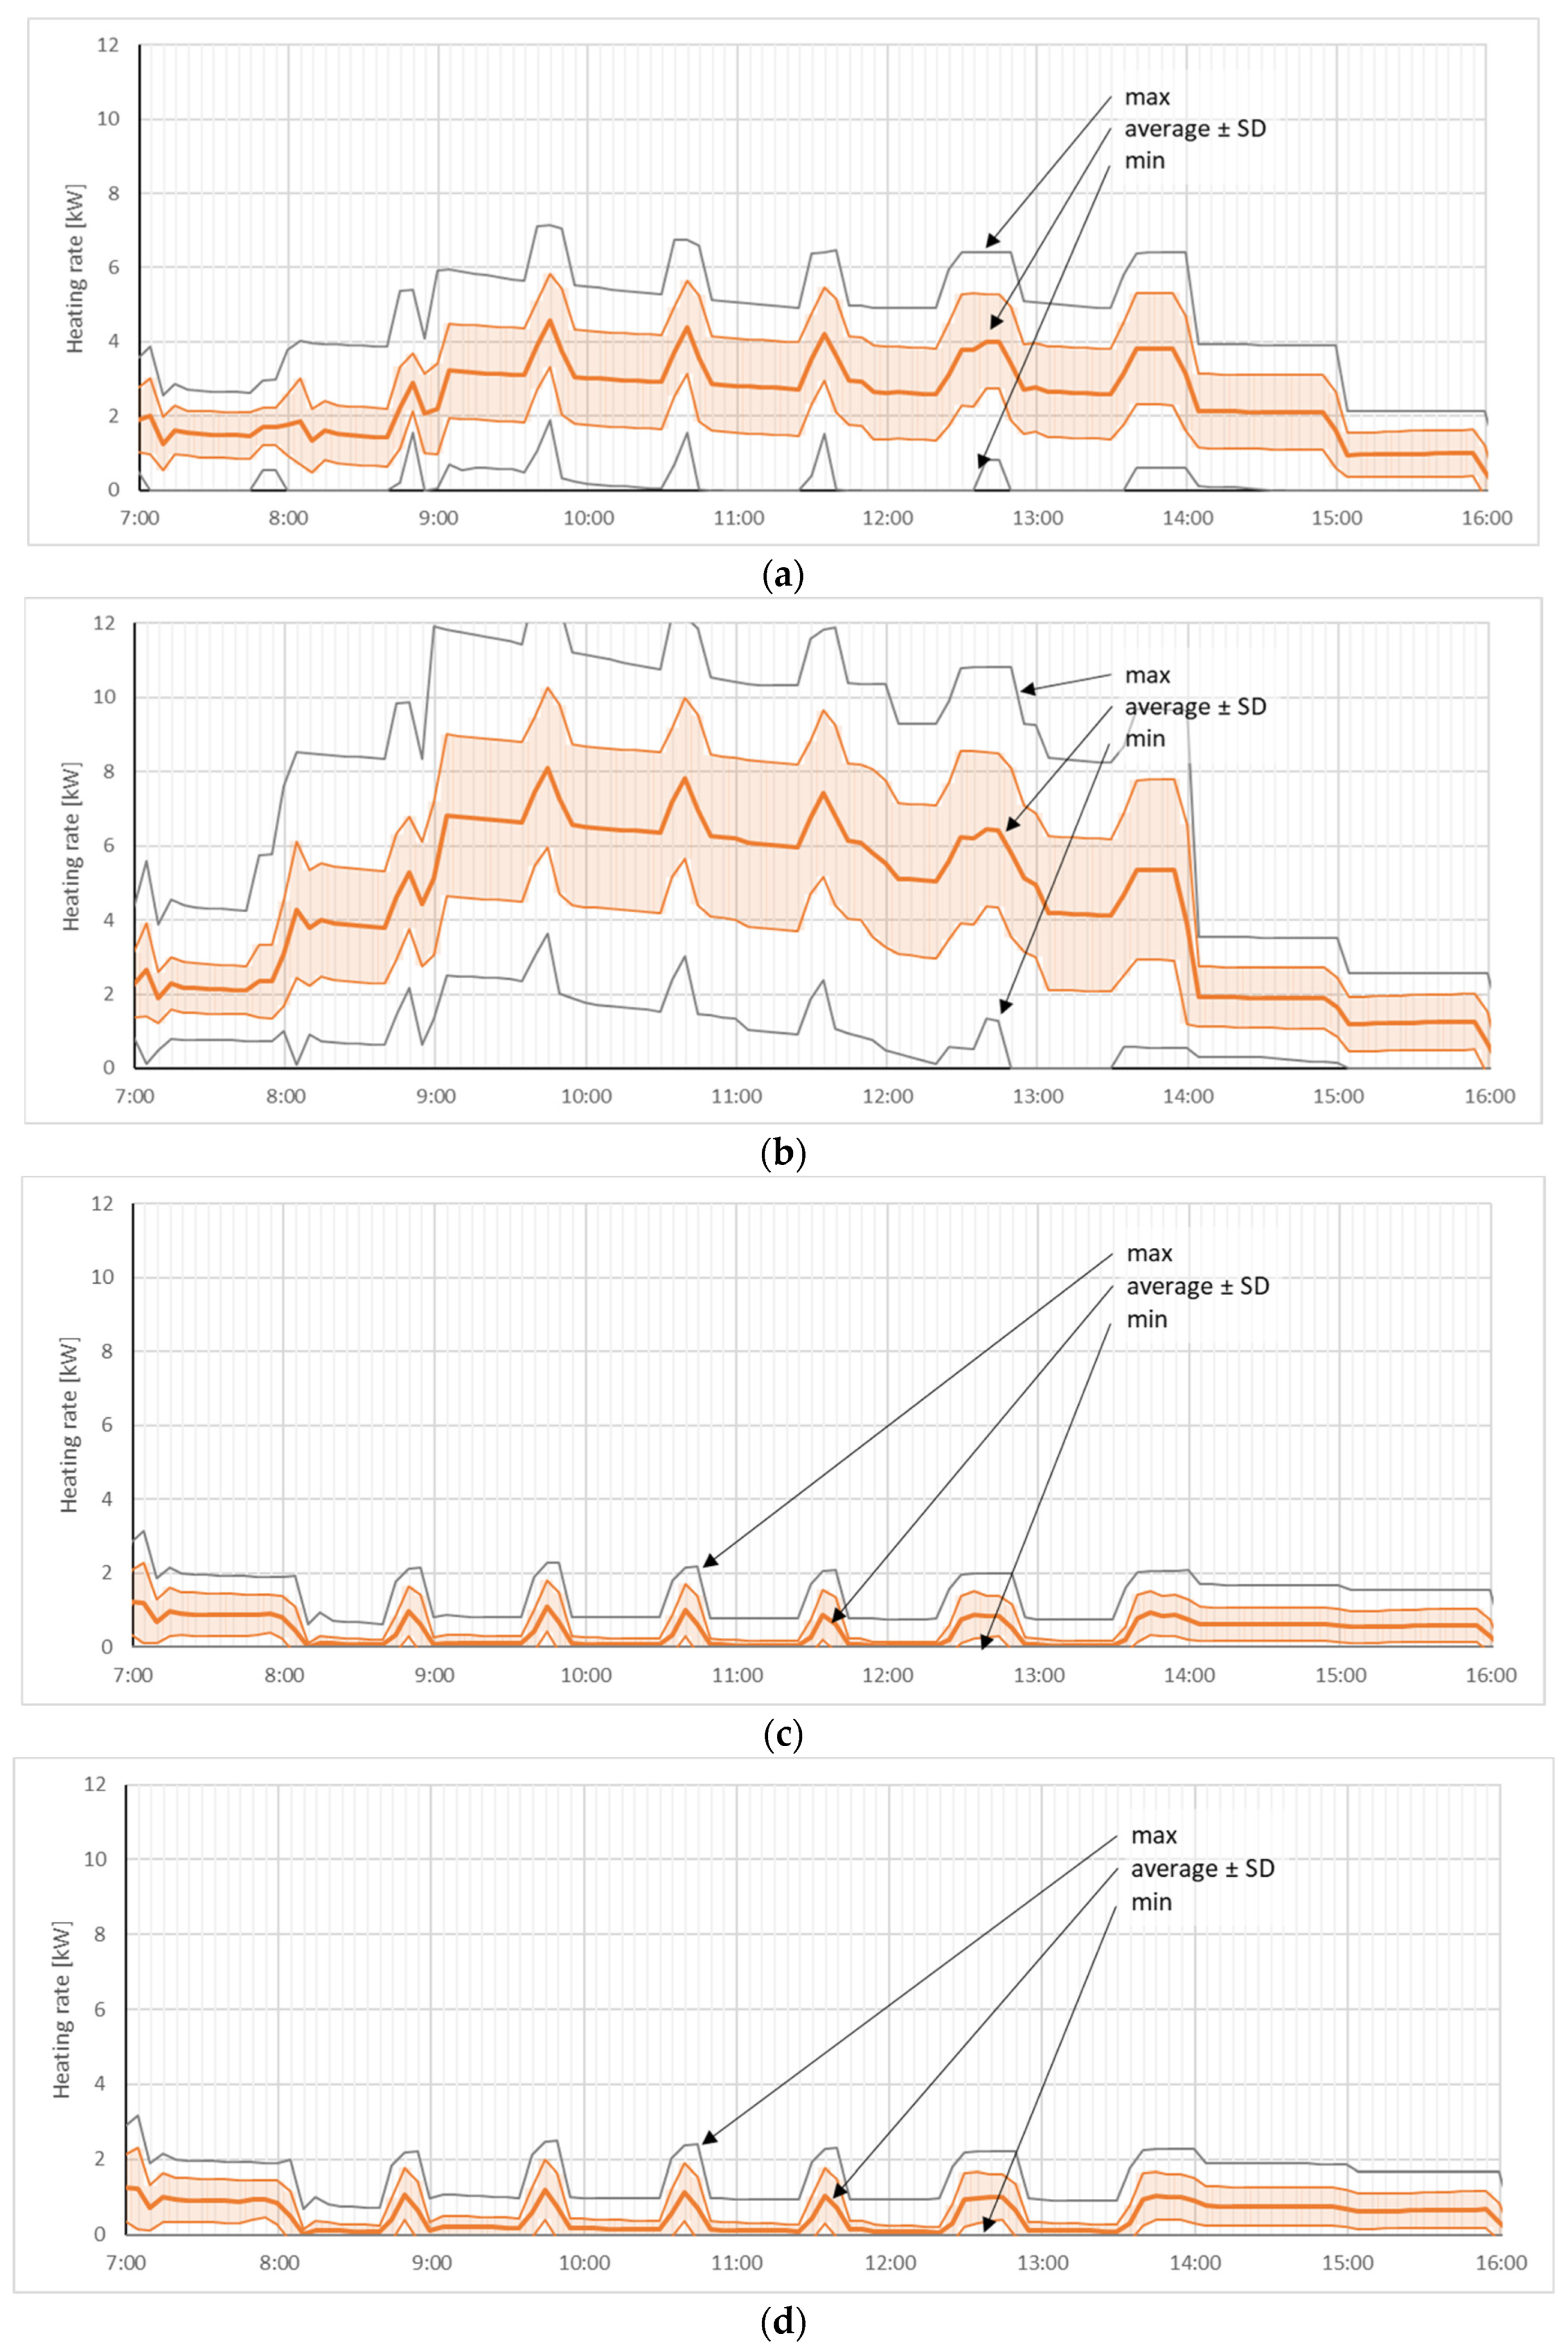
The heating rate profiles are shown in
Figure 8. They demonstrate the direct influence of ventilation airflow on thermal load. In the exhaust-only Scenarios 1A and 1B (
Figure 8a,b), heating demand increases significantly during periods of higher outdoor airflow rates. The higher design airflow in Scenario 1B (
Figure 8b) shows peak heating loads that are noticeably higher than those in Scenario 1A. In contrast, the heat recovery Scenarios 2A and 2B (
Figure 8c,d) show substantially lower heating rates despite similar airflow dynamics. This confirms that the heat recovery unit effectively reduces ventilation heat losses during operation.
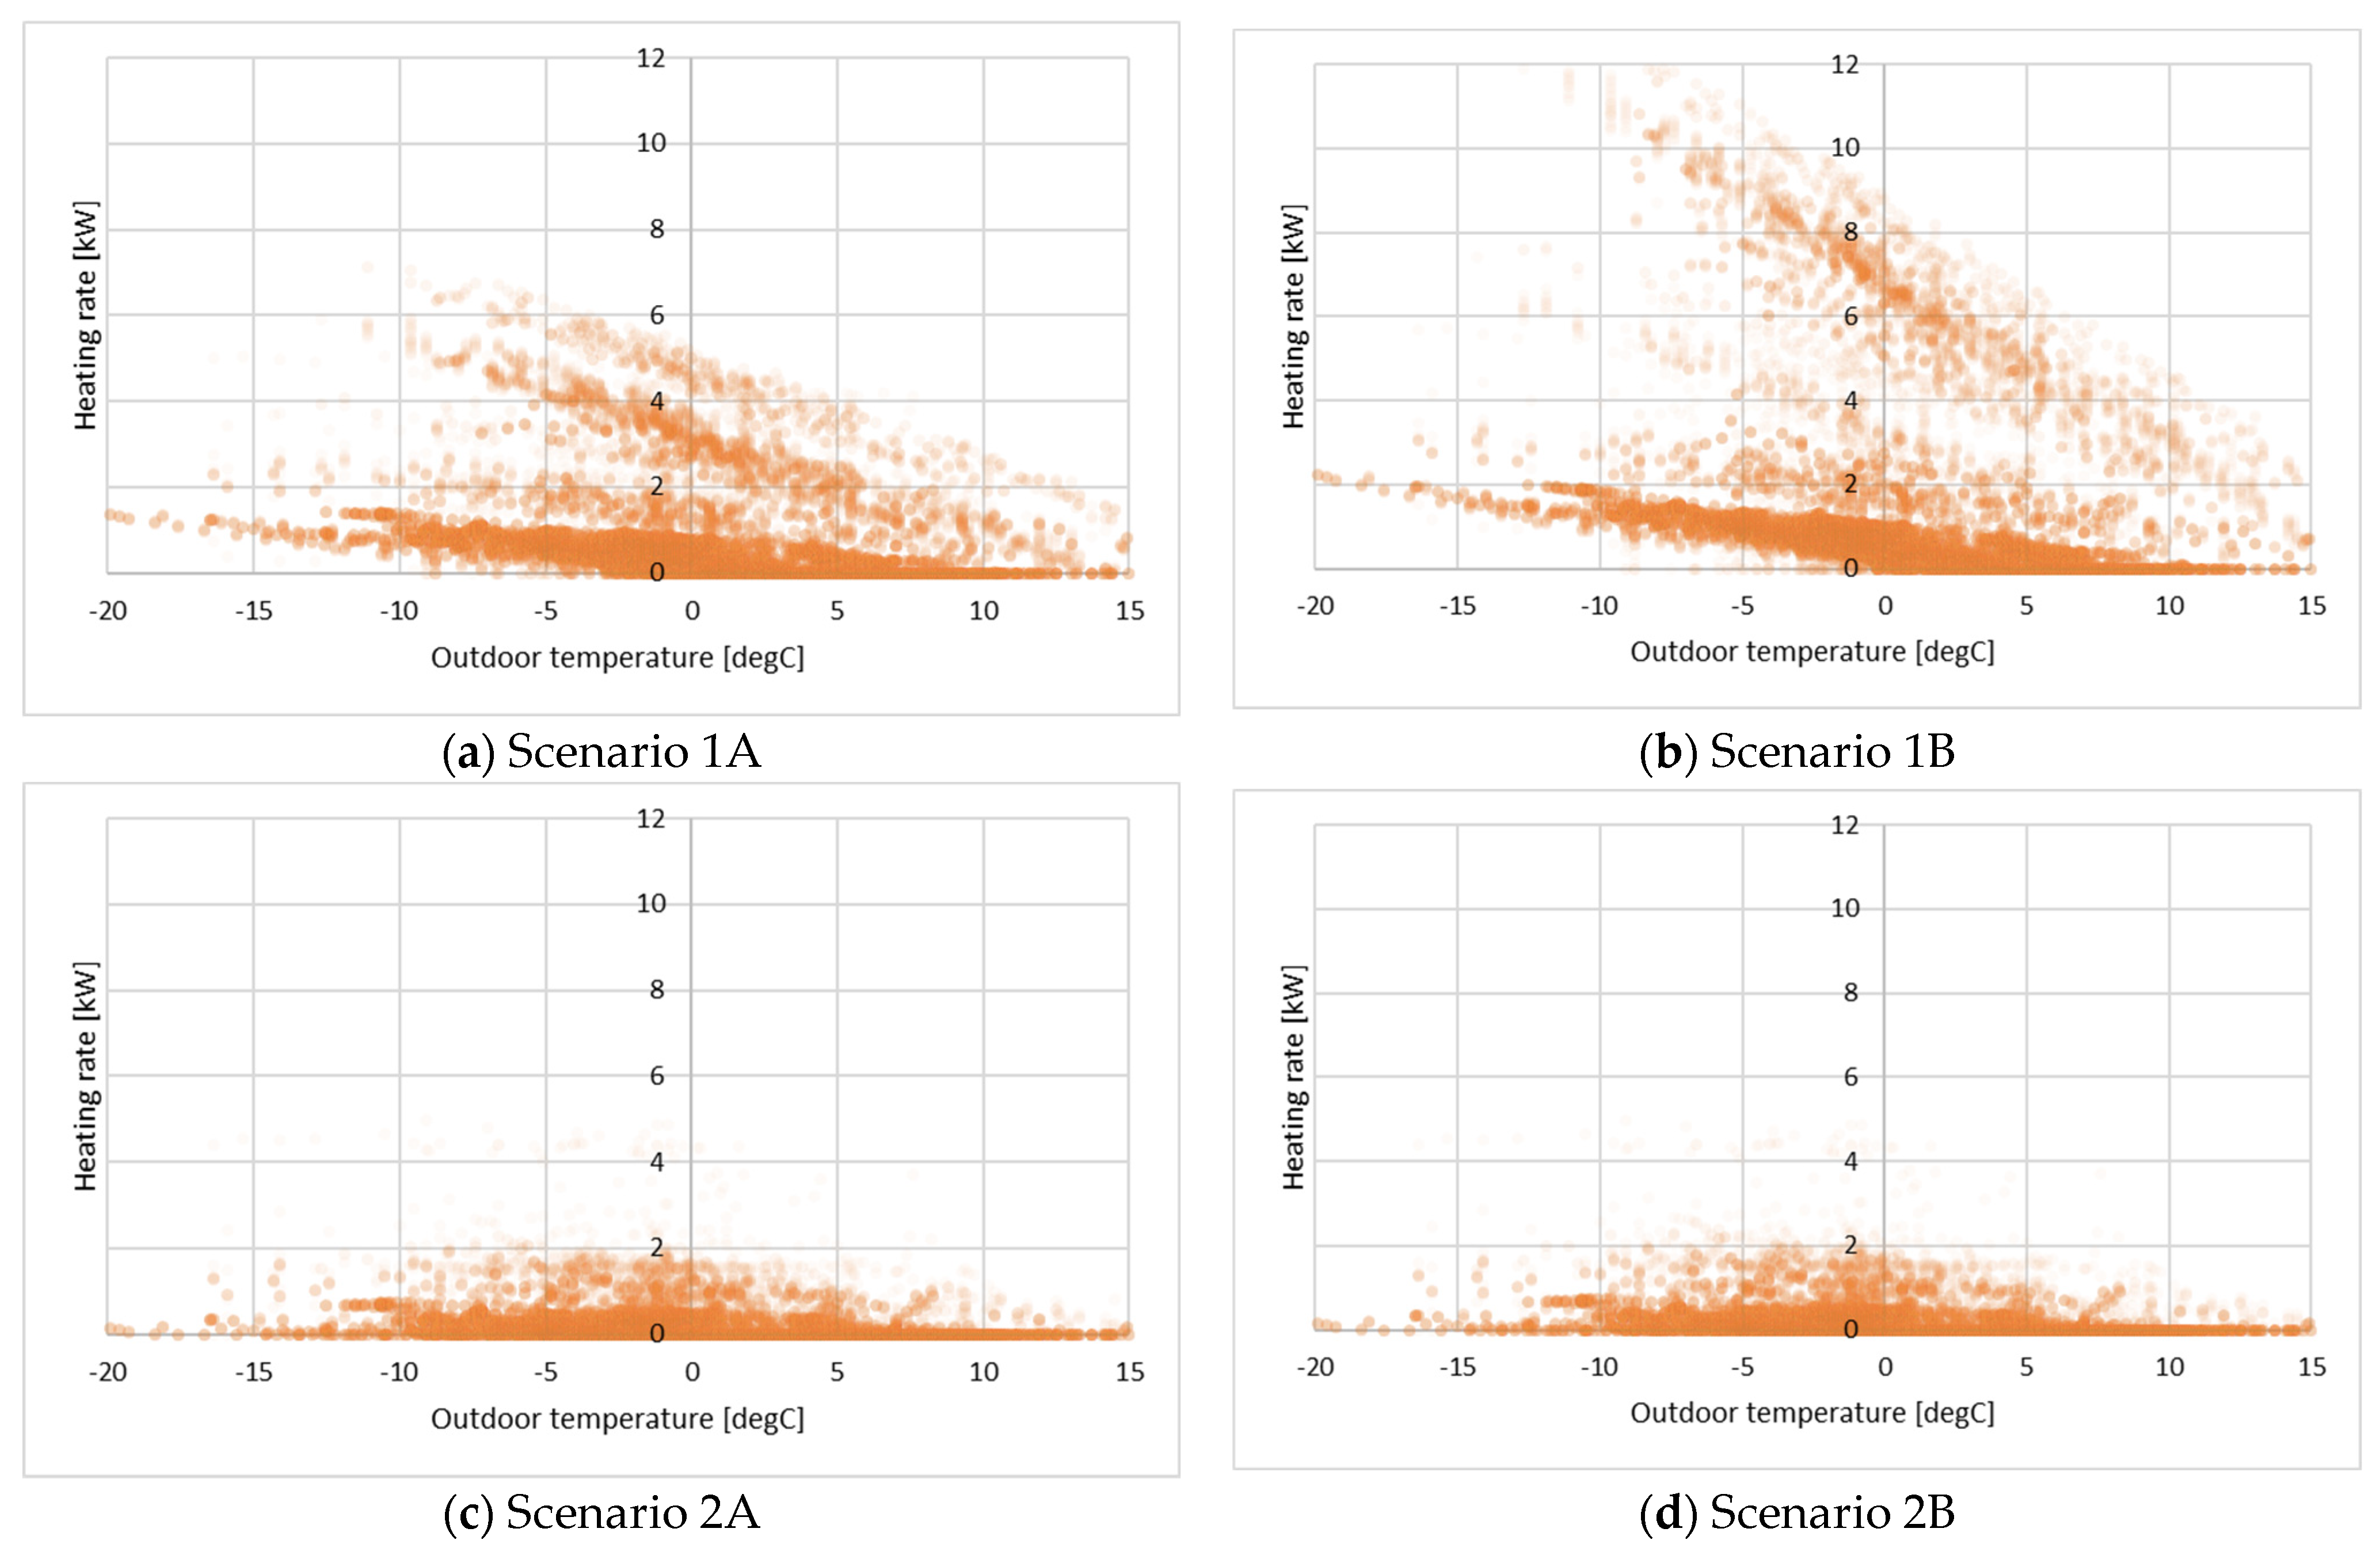
The relationship between heating power demand and outdoor temperature is presented in
Figure 9a–d. In the exhaust-only Scenarios 1A and 1B, heating demand shows a clear dependence on outdoor temperature. As outdoor temperature decreases, heating power increases due to higher transmission and ventilation heat losses. The higher airflow scenario (Scenario 1B) results in significantly higher peak loads compared with Scenario 1A, reaching approximately 12 kW.
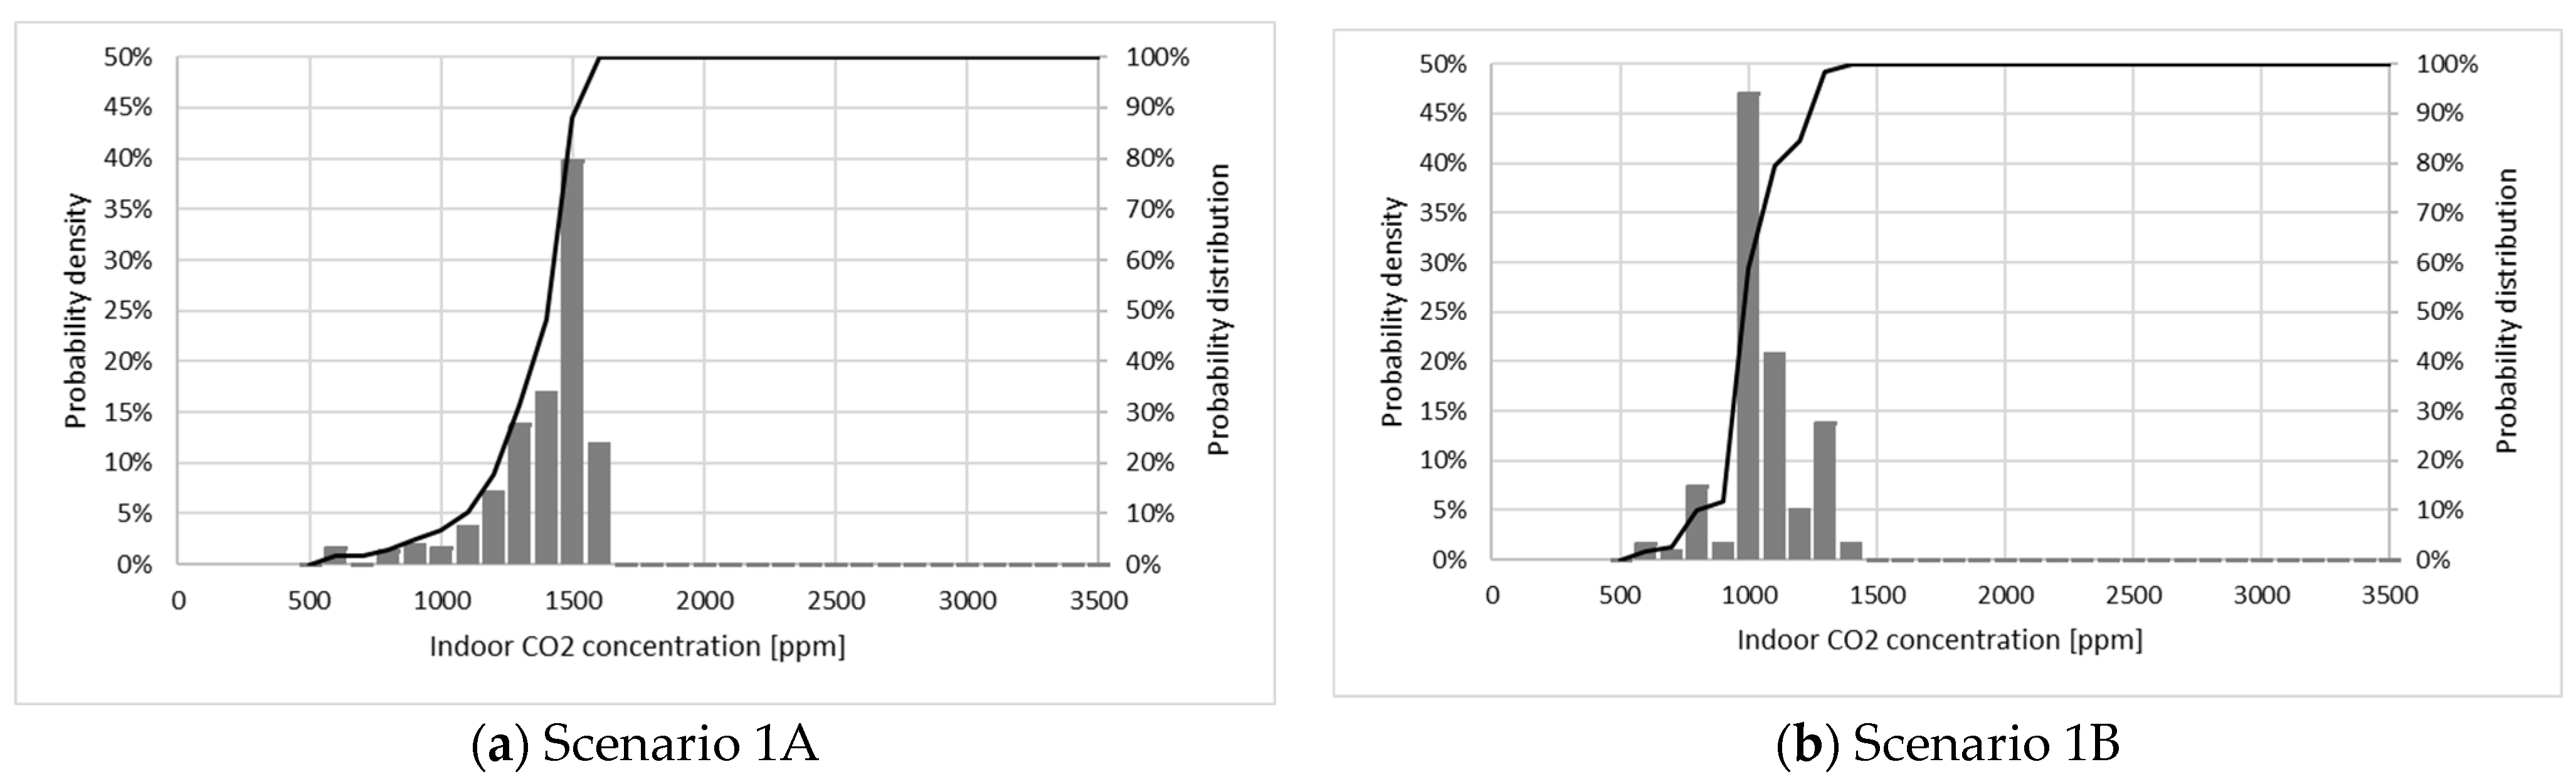
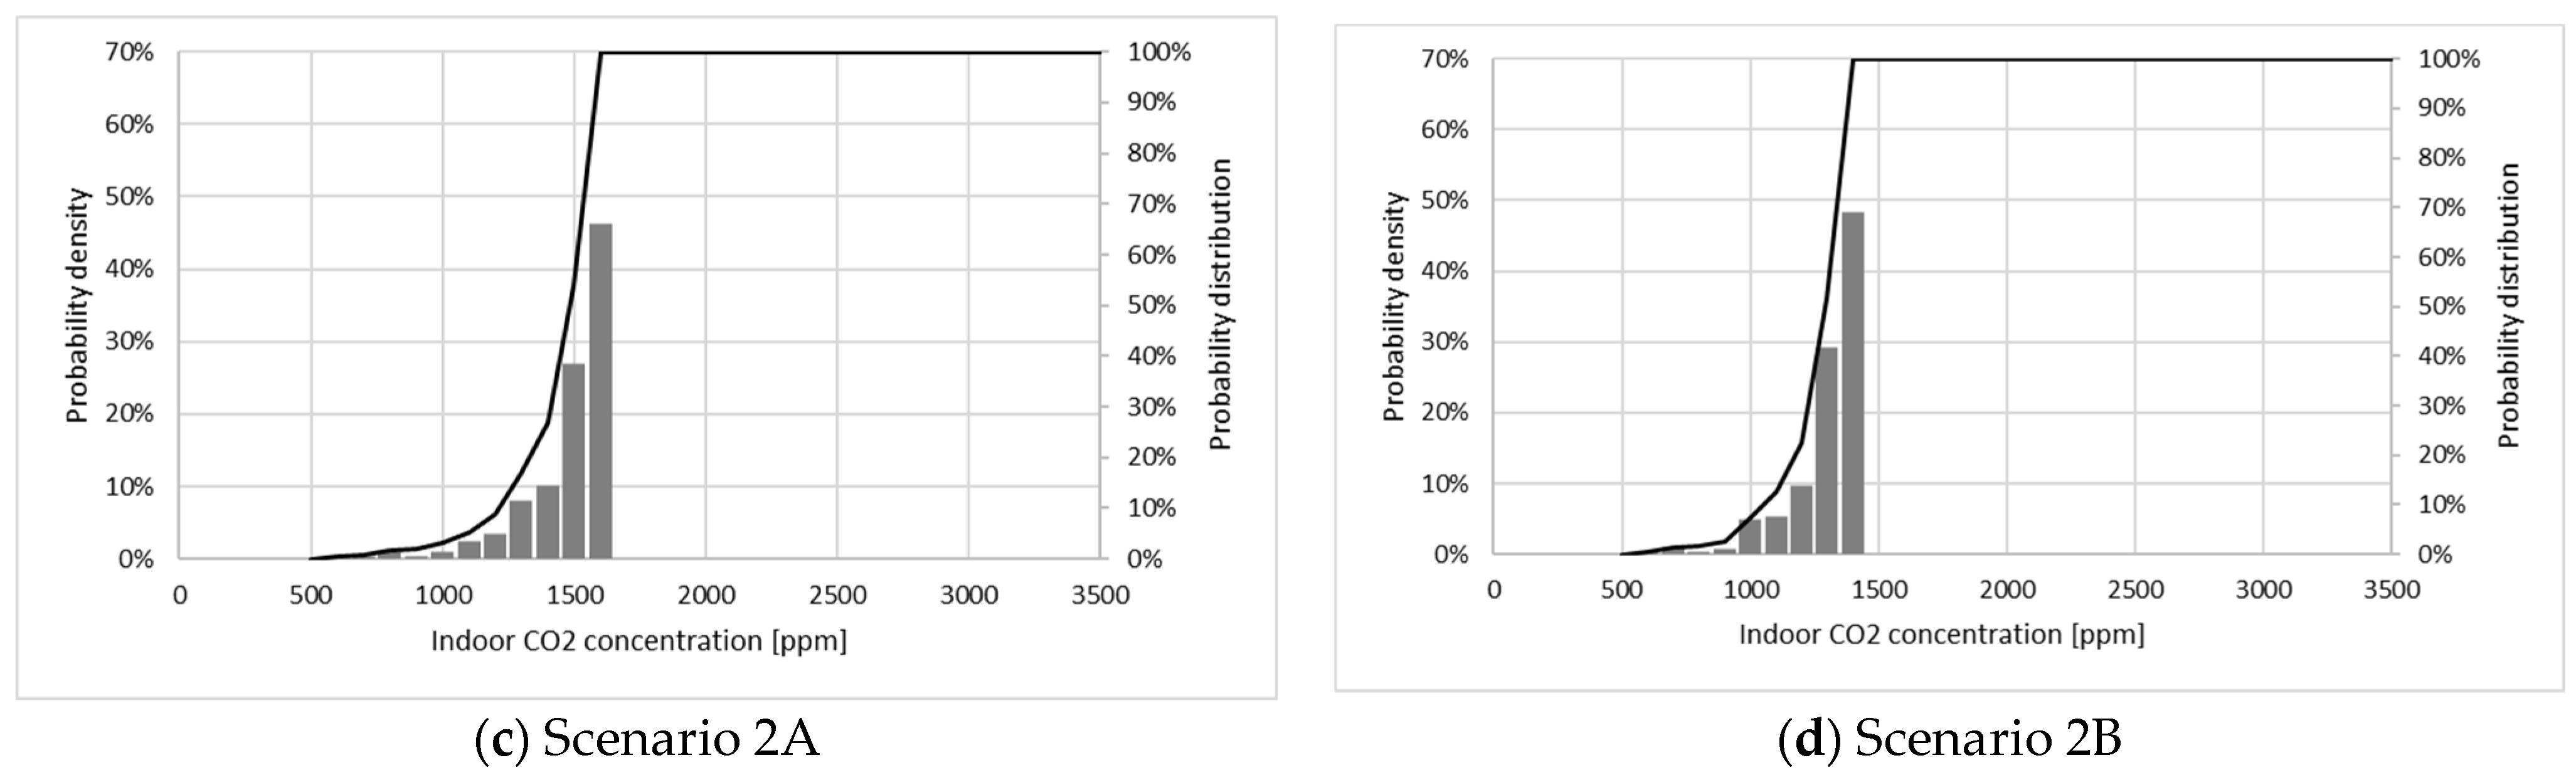
The probability density and cumulative distributions of indoor CO
2 concentration are shown in
Figure 10a–d. For both ventilation systems, increasing the design air supply rate shifts the CO
2 distribution toward lower concentration levels. In the exhaust-only scenarios, the average CO
2 concentration decreases from approximately 1336 ppm in Scenario 1A to about 1007 ppm in Scenario 1B. A similar trend is observed in the heat recovery variants, although the difference between airflow rates is less pronounced. The average concentration decreases from approximately 1419 ppm in Scenario 2A to about 1216 ppm in Scenario 2B. This is also shown in
Table 3. These results indicate that outdoor air supply rates influence indoor CO
2 concentrations, whereas the presence of heat recovery affects the system’s energy balance.
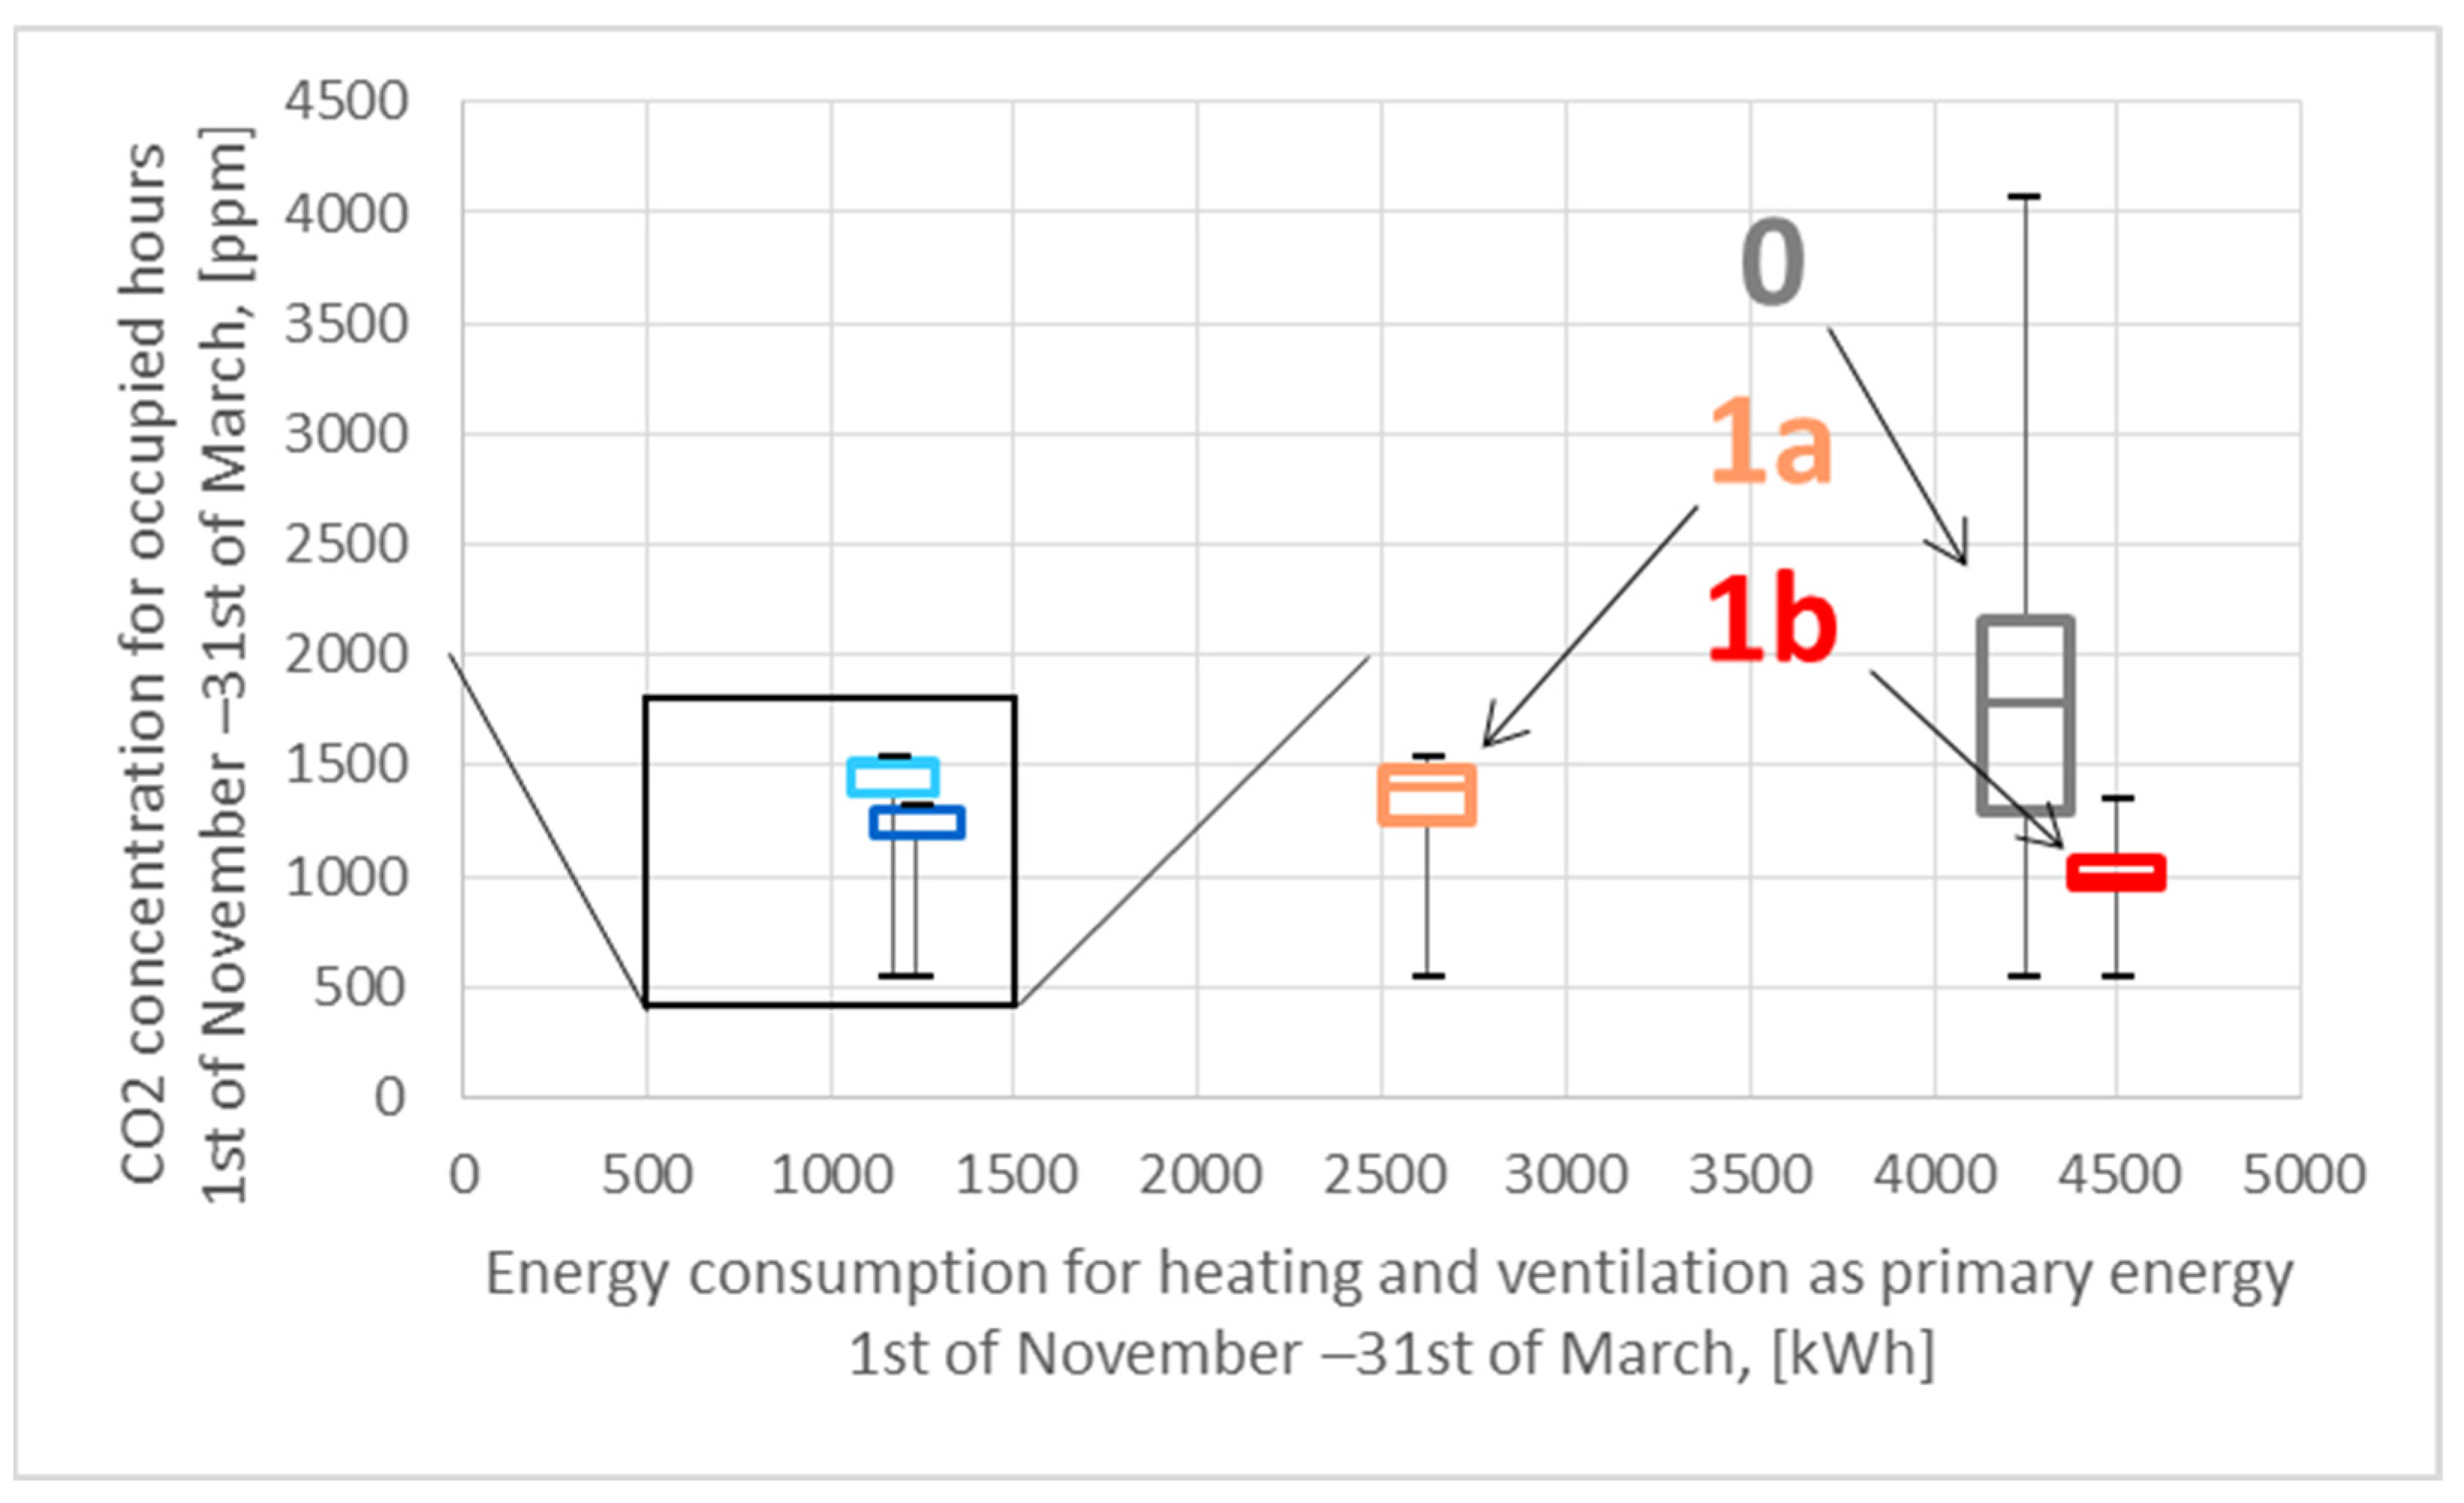
The integrated comparison of seasonal CO
2 concentration and primary energy consumption is presented in
Figure 11 and
Table 3. The results show that the exhaust-only ventilation system improves indoor air quality with increasing outdoor air supply rate, but at the expense of a significantly higher heating energy demand. Heat recovery reduces heating energy consumption by a substantial amount while maintaining comparable indoor air quality. Although the heat recovery variants require additional electricity for fan operation, the reduction in heating demand outweighs the additional electricity use.
Among the analyzed configurations, Scenario 2B provides the most favorable balance between indoor air quality and energy performance, achieving low CO2 concentrations with only a marginal increase in primary energy consumption compared with Scenario 2A.
A summary of the main indoor air quality and energy performance indicators for all analyzed scenarios is presented in
Table 3. The results confirm that increasing the outdoor air supply rate reduces CO
2 concentration but also considerably increases heating energy demand in systems without heat recovery.
For comparison, the reference case with natural ventilation shows the highest CO2 concentrations, with a maximum value of 4080 ppm which fails to meet even Category III, and an average of 1728 ppm, confirming the limited effectiveness of natural ventilation in maintaining acceptable indoor air quality during the heating season.
4. Discussion
The results of the present analyses confirm that ventilation strategy and outdoor air supply rates have a decisive impact on indoor air quality in classrooms. Increasing the outdoor air supply rate from 20 to 50 m
3/h per person significantly reduced indoor CO
2 concentrations, which is consistent with previous studies reporting that inadequate ventilation is the main cause of elevated CO
2 levels in school environments [
12,
13,
14,
15]. The simulations also demonstrated that CO
2-based demand-controlled ventilation (DCV) can effectively adapt ventilation rates to occupancy conditions, maintaining acceptable indoor air quality while limiting unnecessary ventilation during unoccupied periods. This observation agrees with previous studies indicating the effectiveness of CO
2-based DCV in educational buildings [
25,
29].
The results further highlight the strong influence of heat recovery on energy performance. In the case of mechanical exhaust ventilation, increasing the design airflow rate from 20 m3/h per person (Scenario 1A) to 50 m3/h per person (Scenario 1B) reduced the average CO2 concentration from 1336 ppm to 1007 ppm but simultaneously increased heating energy demand from 3120 kWh to 5321 kWh. In contrast, the application of heat recovery substantially reduced heating demand. In the balanced ventilation scenarios with heat recovery, heating energy demand decreased to 683 kWh (Scenario 2A) and 760 kWh (Scenario 2B), representing a reduction of approximately 85% compared with the exhaust-only system at comparable airflow rates.
Although the heat recovery system required additional electricity consumption due to fan operation (approximately 250 kWh), the reduction in heating demand clearly dominated the overall energy balance. As a result, the total primary energy consumption remained low. The lowest primary energy consumption was observed for Scenario 2A (1171 kWh), while Scenario 2B provided improved indoor air quality with only a minor increase in primary energy consumption (1235 kWh).
From a practical perspective, Scenario 2B appears to provide the most favorable balance between indoor air quality and energy performance. Although Scenario 2A resulted in slightly lower energy consumption, the higher CO2 concentrations make it less suitable in terms of indoor air quality. In contrast, the exhaust ventilation scenarios either failed to ensure acceptable indoor air quality or resulted in substantially higher energy demand.
The results also highlight the limitations of natural ventilation during the heating season. Despite intermittent window opening, indoor CO
2 concentrations remained above recommended levels, confirming observations from previous field studies conducted in naturally ventilated classrooms [
7,
13,
14]. This indicates that relying solely on natural ventilation may be insufficient to ensure acceptable indoor air quality in school buildings located in temperate climates.
The novelty of this study lies in the integrated approach combining field measurements, validated airflow modeling (CONTAM), and seasonal energy simulations (EnergyPlus) under real climatic conditions. Unlike many previous studies that focus either on indoor air quality or energy performance separately, the present work provides a coupled assessment of both aspects using consistent boundary conditions. Furthermore, this study extends previous research by evaluating CO2-based demand-controlled ventilation strategies, including heat recovery, in terms of both indoor air quality and primary energy consumption. This combined perspective is particularly relevant for existing school buildings, where improving ventilation often conflicts with energy efficiency objectives. The results therefore provide practical insights into ventilation retrofit strategies that can be implemented at the classroom level in similar educational buildings.
Several limitations of this study should be acknowledged. Firstly, the analysis is based on a single classroom within one school building, which limits the generalizability of the results. Secondly, the simulations were performed using a calibrated model based on selected measurement periods and therefore represent typical but not all possible operating conditions. Occupant behavior, particularly window-opening patterns, was simplified and may differ under real conditions. Thirdly, CO2 concentration was used as an indicator of ventilation effectiveness, while other indoor air pollutants, such as particulate matter, VOCs, and bioaerosols, were not analyzed. In addition, the EnergyPlus model was not validated against measured heating energy consumption due to the lack of available operational energy data for the analyzed classroom. Therefore, the energy simulation results should be interpreted primarily as comparative rather than absolute values. Finally, the energy analysis was performed for the climatic conditions of Kraków and may differ under other climatic contexts.
Despite these limitations, this study provides useful insights into the performance of ventilation strategies in existing school buildings and supports the application of demand-controlled ventilation with heat recovery as an effective solution for improving indoor air quality while limiting energy consumption.
5. Conclusions
This paper presents analyses of the impact of different demand-controlled mechanical ventilation strategies on indoor air quality and seasonal energy performance in a primary school classroom during the heating season (1 November–31 March). Two ventilation concepts were considered: mechanical exhaust ventilation and balanced mechanical ventilation with heat recovery, each analyzed for two design outdoor airflow rates (20 and 50 m3/h per person).
The results show that increasing the outdoor air supply rate significantly improved indoor air quality. Increasing the airflow from 20 to 50 m3/h per person reduced the average indoor CO2 concentration from 1336 ppm to 1007 ppm in the exhaust ventilation system and from 1419 ppm to 1216 ppm in the heat recovery system.
Mechanical exhaust ventilation improved indoor air quality but led to a substantial increase in heating energy demand. In this case, increasing the air supply rate from 20 to 50 m3/h per person increased energy demand for heating from 3120 kWh to 5321 kWh.
The introduction of heat recovery significantly reduces heating energy consumption. In the analyzed variants, heating demand decreased to 683–760 kWh, representing a reduction of more than 80% compared with the exhaust-only system.
Although heat recovery systems require additional electricity (approximately 250 kWh per heating season), the reduction in heating demand outweighed the additional electricity use. As a result, the lowest primary energy consumption was observed for the mechanical ventilation system with 20 m3/h/person (1171 kWh), while increasing the air supply rate to 50 m3/h/person provided further improved indoor air quality with only a small increase in primary energy use (1235 kWh). This solution seems to provide the most favorable balance between indoor air quality and energy performance.
This study provides new insights into the combined impact of ventilation control strategies and heat recovery on both indoor air quality and seasonal energy performance under realistic operating conditions. Future research should focus on validating the energy simulation results with measured data and extending the analysis to other indoor air pollutants.




 ,
,