Article

Investigation of Fatigue Failure and Electrical Insulation Properties of Glass Fiber-Reinforced Epoxy Resin (EPGF) Composites Under Different Temperatures


1
Department of Civil Engineering, School of Design, Xi’an Jiaotong-Liverpool University, Suzhou 215000, China
2
Department of Chemistry and Materials Science, School of Science, Xi’an Jiaotong-Liverpool University, Suzhou 215000, China
3
School of Electrical Engineering, Shenyang University of Technology, Shenyang 110027, China
*
Author to whom correspondence should be addressed.
Energies 2026, 19(11), 2497; https://doi.org/10.3390/en19112497
Submission received: 30 January 2026 / Revised: 22 April 2026 / Accepted: 27 April 2026 / Published: 22 May 2026
(This article belongs to the Special Issue Advanced Control and Monitoring of High Voltage Power Systems)

Abstract

This study investigates the influence of temperature on the bending properties, fatigue life, and breakdown voltage of glass fiber/epoxy composites (EPGF). The three-point bending tests were conducted at room temperature (RT) and 60 °C, and the bending fatigue tests were carried out under three displacement amplitudes (0.80, 0.75, 0.70). At the same time, fatigue life prediction was conducted using the Weibull distribution fitting, microscopic structure analysis by scanning electron microscopy (SEM), and breakdown voltage tests in accordance with the GB/T1408-2006 standard. The results show that at 60 °C, the ultimate bending strength and flexural modulus of EPGF decreased by 52.67% and 65.45%, respectively. At high displacement amplitudes (S = 0.80, 0.75), 60 °C leads to a sharp rise in data dispersion with the coefficient of variation (CV) surging by 1.56 and 2.32 times separately. S and temperature exert a significant synergistic degradation effect on fatigue life, and the two-parameter Weibull distribution (R2 > 0.85) can well characterize the fatigue life of EPGF. In terms of dielectric properties, 60 °C reduces the initial breakdown voltage of EPGF by 4.23% (p < 0.05). Fatigue damage causes a continuous drop in breakdown voltage. At RT with 80% damage, the reduction rate increases from 16.28% to 26.95% as S rises, showing a synergistic characteristic between amplitude and fatigue damage. Moreover, 60 °C only affects the initial breakdown voltage and has no significant effect on the fatigue-induced decrease in breakdown voltage. SEM observations indicate that 60 °C induces matrix cracking, fiber curling and interfacial debonding in EPGF. This study provides key experimental data and theoretical support for the fatigue life prediction and insulation performance evaluation of EPGF under different temperature fatigue conditions.

1. Introduction

Glass fiber epoxy resin (EPGF), as an important insulating material, holds a significant position [1]. It has excellent mechanical properties, electrical insulation performance and high-temperature resistance [2], and is widely used in high-voltage circuit breakers [3]. However, during the use of EPGF in electrical equipment, it needs to endure repetitive opening and closing operations, which cause cyclic mechanical stress [4]. In addition, during the operation of the equipment, there is heat accumulation [4]. Moreover, in special environments, it may also be affected by wet heat corrosion [5], all of which impair the fatigue durability of EPGF and subsequently its insulation performance.
Regarding the research on the performance of EPGF, current studies mainly focus on the separate research of its mechanical properties, temperature effects, and electrical properties.
In the aspect of fatigue behavior research, insulation pull rods in high-voltage electrical equipment tend to exhibit buckling instability during reciprocating operation, resulting in significant bending deformation of the rod, which is the main cause of material failure [6]. Therefore, the bending fatigue performance under cyclic loading is critical for evaluating the long-term reliability of such components. Separately, Turan et al. performed nine displacement-controlled bending fatigue tests and, integrating Weibull statistical analysis, predicted the critical structural transitions in composites during fatigue failure [7]. Hemanth et al. conducted rotating bending fatigue tests on EPGF materials, demonstrating that fatigue life decreases with increasing stress levels, and observed matrix cracking, interfacial debonding, and interfacial splitting of fibers [8]. However, these studies have remained limited to the mechanical fatigue perspective and have not incorporated analysis of electrical performance.
Meanwhile, temperature exerts a certain influence on the properties of EPGF. Jiang et al. demonstrated experimentally that an increase in temperature significantly reduces the interlaminar shear strength, with a minimum retention rate of merely 89.37% at 60 °C [9]. Kosedag conducted thermal aging experiments on EPGF at 70 °C and found that the energy absorption capacity of the composites under bending load significantly degraded after aging [10].Zhao et al. [11] used scanning electron microscopy (SEM) to reveal the fracture characteristics of EPGF materials after a 100 °C heat treatment; they found that high temperature caused the GF to completely detach from the matrix, and there was a large gap between the fibers and the matrix.
In the research on the dielectric properties of materials, it was pointed out [12] that the dielectric breakdown strength of EPGF tended to diminish as the fatigue tests were conducted. Zhang et al. [13] investigated the changes in electrical properties of fiber-reinforced composite materials under different degrees of tension, they found that when the applied tensile stress reached 45% of the ultimate tensile stress, electric field distortion was formed around defects, resulting in a sudden decrease in breakdown strength [14]. It has been found that the long-term operation of AC insulating pull rods under a 60 °C temperature gradient will exacerbate space charge accumulation, which in turn induces local electric field distortion and ultimately leads to premature aging and breakdown of insulating materials [15]. Current studies have preliminarily revealed the correlations among mechanical fatigue, temperature and dielectric properties. However, the differential effects of damage at different fatigue levels and stages on the dielectric properties of materials have not been thoroughly explored, and research on analyzing the evolution law of dielectric properties under the effect of fatigue and temperature by incorporating temperature factors remains relatively scarce.
Although existing studies have preliminarily revealed the correlations among mechanical fatigue, temperature and the dielectric properties of EPGF, notable research gaps remain. First, most studies focus on the single-factor analysis of mechanical fatigue behavior, temperature effects and dielectric properties of EPGF, lacking systematic investigations into the performance evolution of EPGF under the combined action of fatigue and temperature. Second, the differential effects of damage at different fatigue levels and stages on dielectric properties have not been clarified. In addition, the existing literature has indicated that the performance of EPGF exhibits a certain degree of degradation at 60 °C [9,10,15]; combined with engineering practice, the upper limit of the long-term working temperature of the insulating pull rod is 40 °C (GB/T 11022-2020 [16]), while the temperature in the vicinity of the fault area can rise to 60 °C under extreme conditions caused by partial discharge and other faults, and there are few studies on the fatigue life evolution law of this component at 60 °C. To preliminarily explore the influence law of temperature on EPGF performance, 60 °C was selected as the test temperature in this paper, with room temperature (RT) as the control group. Under these two temperature conditions, the influence mechanism of temperature on the flexural strength and fatigue life of EPGF was quantitatively analyzed, and the variation law of the insulation strength under different temperatures and damage states was tested, which ultimately provides a scientific basis for the fatigue life prediction of EPGF.

2. Experimental Procedure

2.1. Materials and Overall Scheme

In the early stage of this study, the EPGF molded sheets with the most stable performance were screened out through multiple sets of static three-point bending pre-tests. The EPGF was supplied by Qiyu Plastic Co., Ltd. in Dongguan, China, and all test specimens were taken from the same production batch of this material. Its specific composition is shown in Table 1.
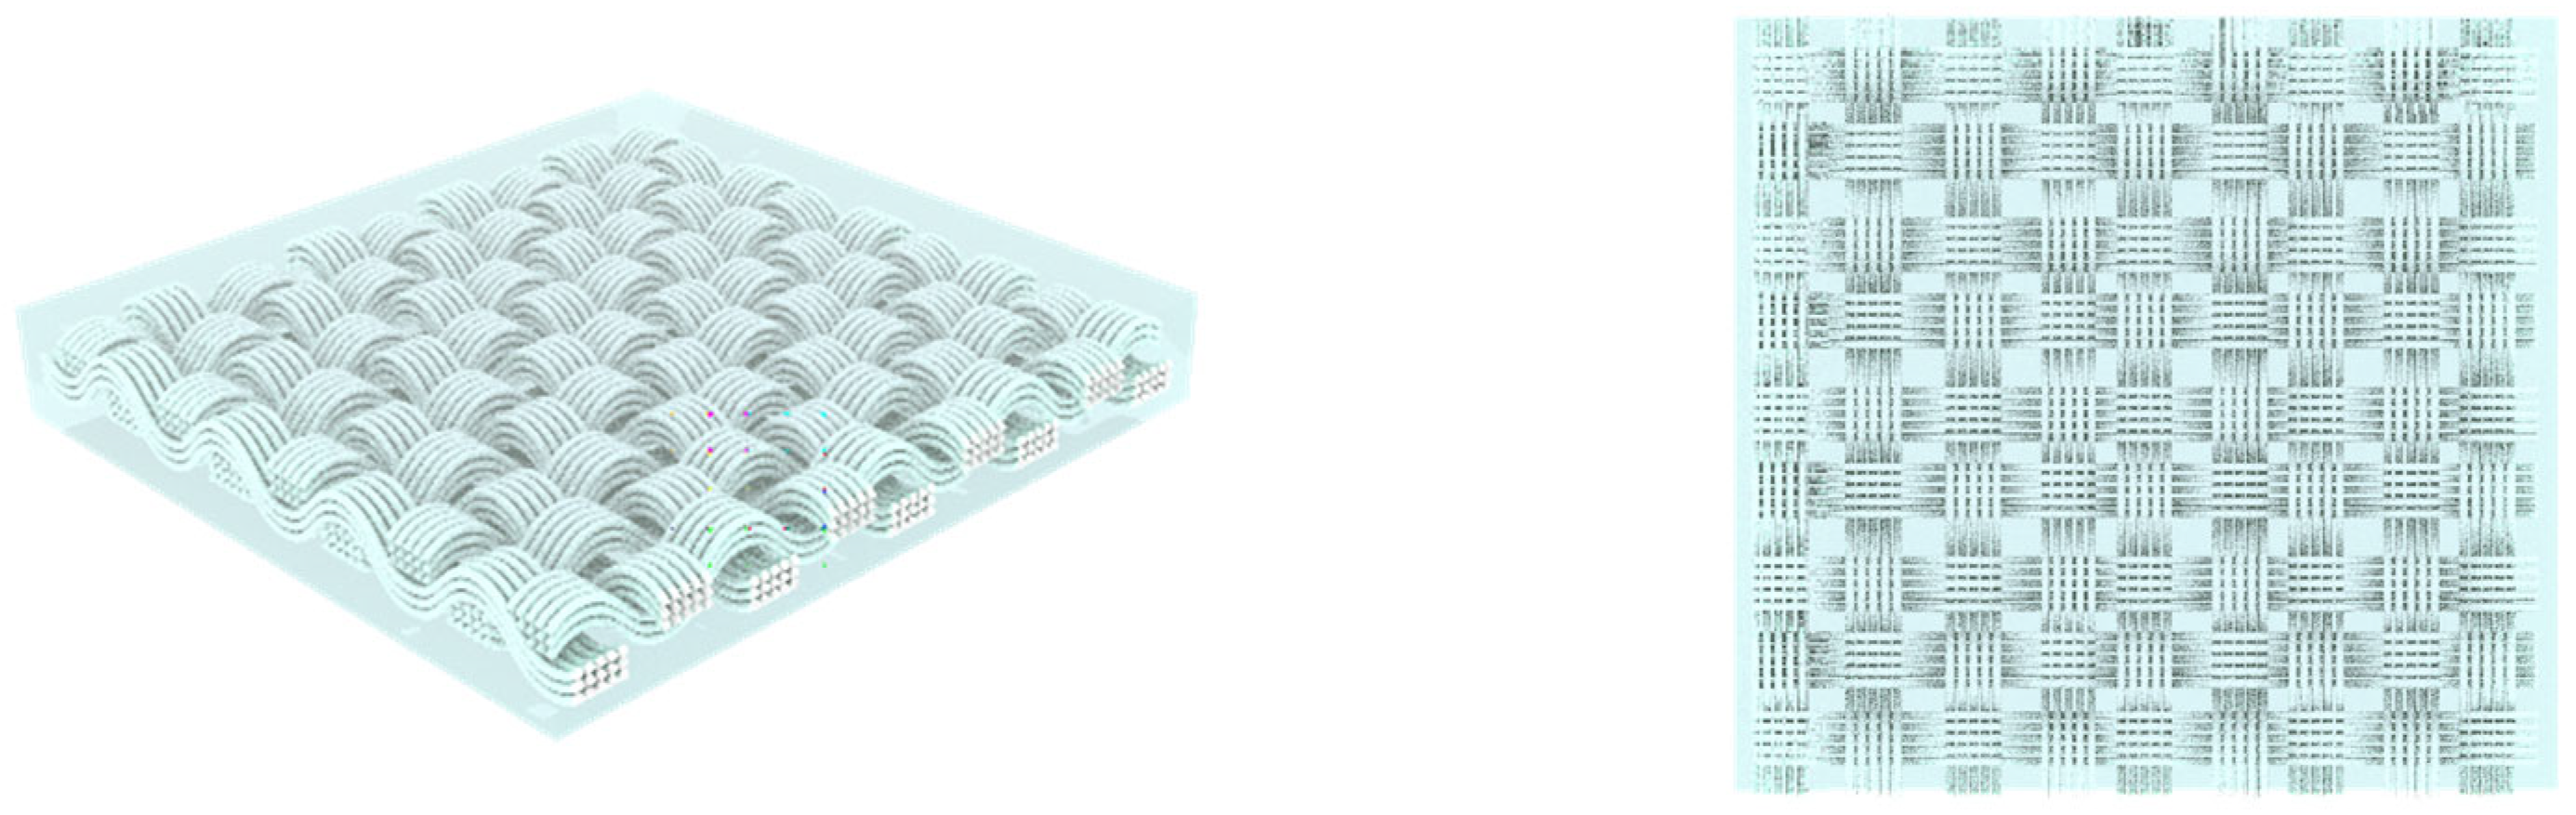
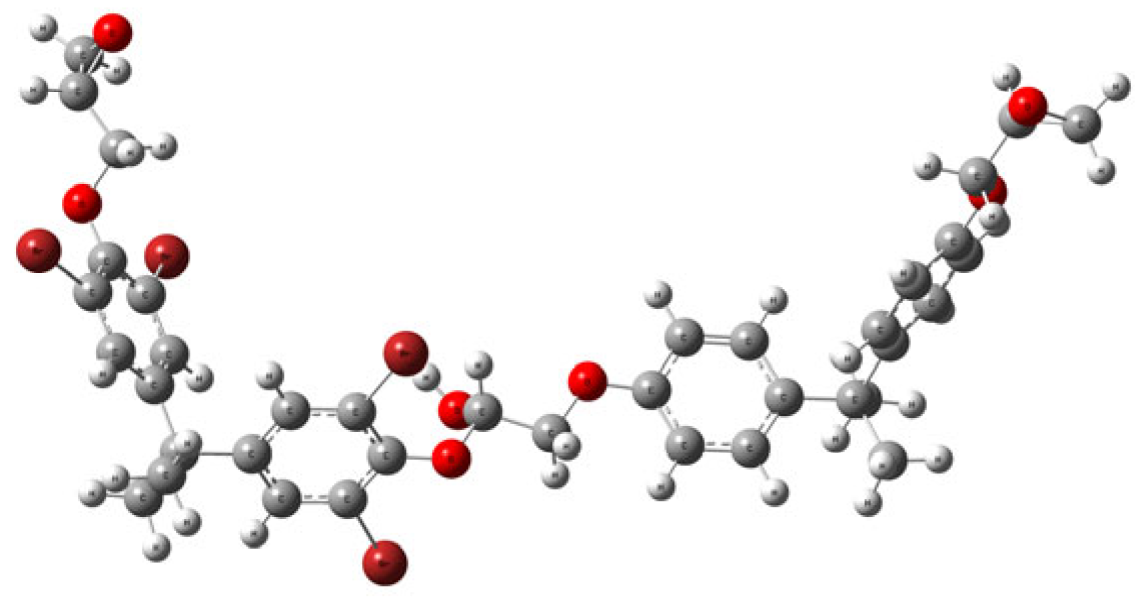
Autodesk 3ds Max 2024 was used to conduct three-dimensional modeling and visual characterization of the internal fiber lay-up orientation of the EPGF sheets, and the results are presented in Figure 1; ChemDraw 3D 2022 was used to construct the three-dimensional molecular chain of epoxy resin, as shown in Figure 2.
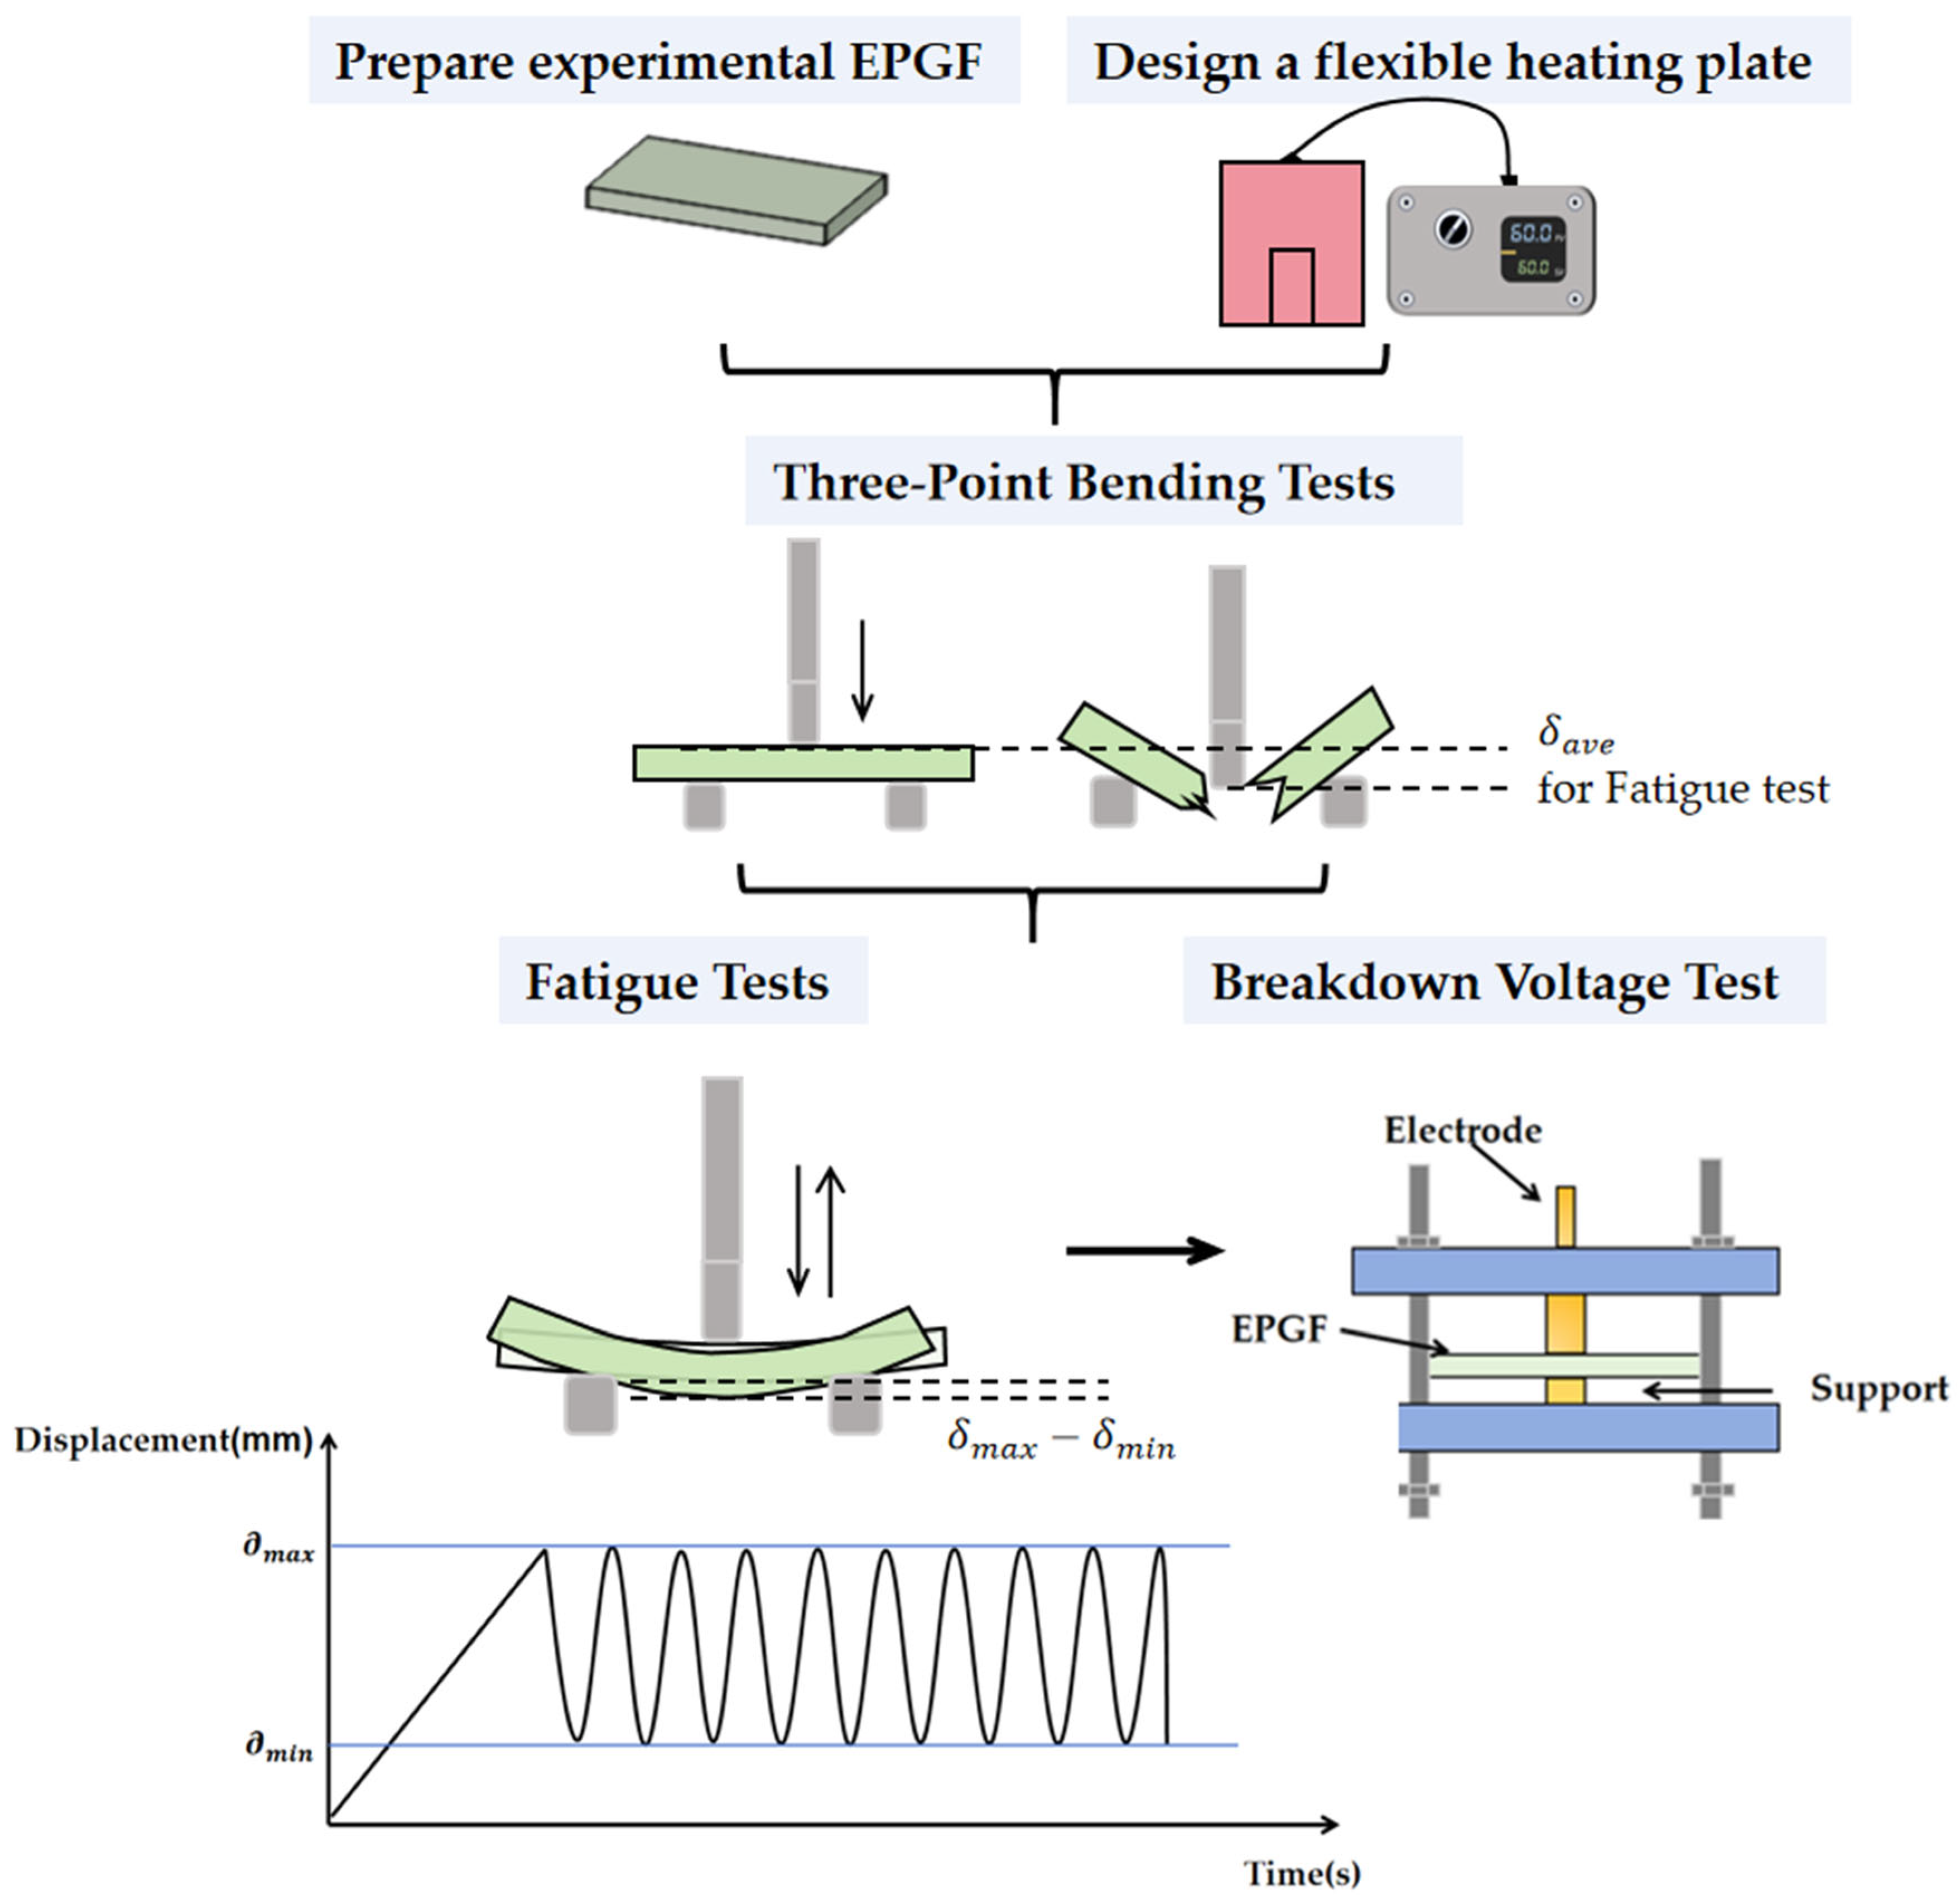
The overall experimental procedure is illustrated in Figure 3. First, the preliminary preparation stage involves designing EPGF sheets and a flexible heating plate. Subsequently, three-point bending tests are performed to derive the key displacement parameter (δave) that underpins the subsequent fatigue tests. Building on these results, fatigue tests with distinct displacement amplitudes are conducted on the specimens. Finally, breakdown voltage tests are conducted on fatigued specimens with varying degrees of damage.

2.2. Three-Point Bending Test Procedure Under Different Temperatures

The designed specimens for three-point bending measure 200 mm × 70 mm × 2 mm with a span of 140 mm, and the tests are carried out on a universal testing machine (UTM) with a maximum load capacity of 100 KN. The maximum machining deviation of the specimen thickness is 0.008 mm, with a corresponding relative thickness error of 0.4%. The device error mainly arises from load cell indication deviation, fixture alignment offset, and displacement control lag, and the comprehensive system error is controlled within ±5%. The pressing head speed is 5 mm/min. Two different temperature conditions (RT and 60 °C) are adopted for the experiments.
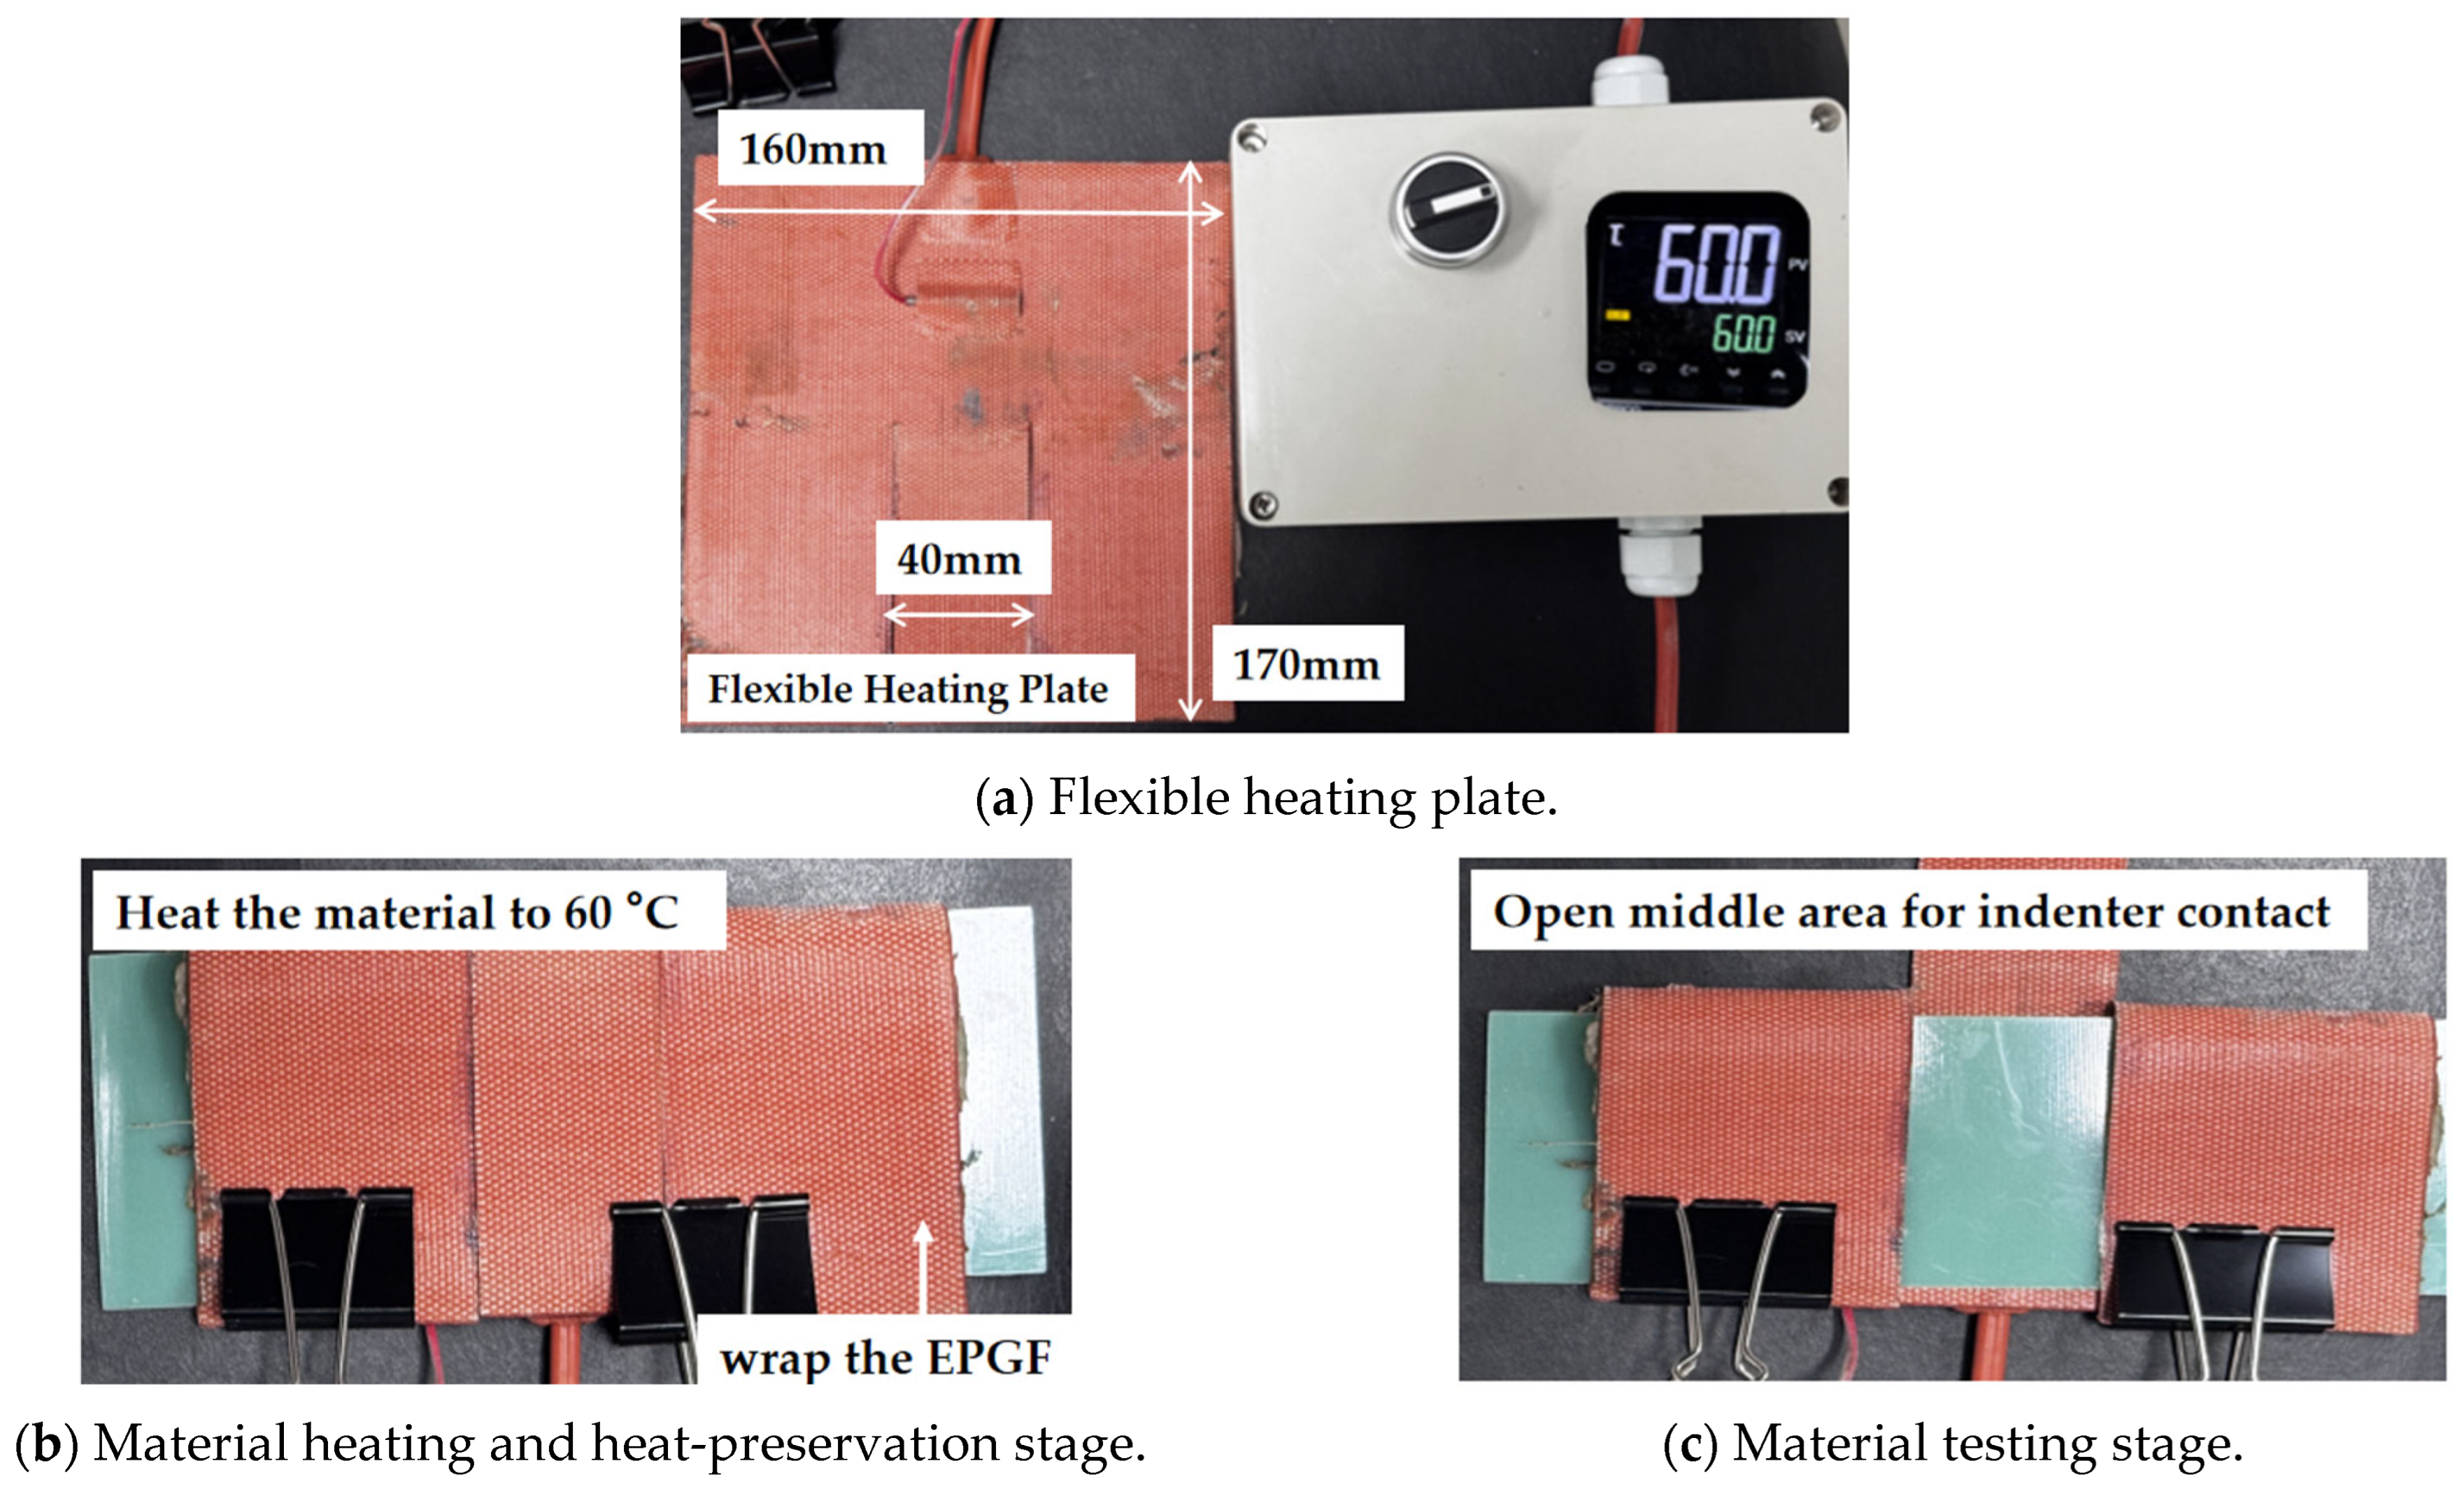
Regarding temperature control, this section designs a flexible heating plate that meets the requirements of the sample size, as shown in Figure 4a below. The surface temperature was monitored at multiple points using a K-type thermocouple thermometer. The measured results show that the maximum temperature difference on the heating plate surface is approximately ±2.1 °C under steady-state operation. At the set temperature of 60 °C, the actual surface temperature range of the specimen is 57.9 °C to 62.1 °C, with a corresponding relative temperature error of about ±3.5%. During the experiment, the sample is first placed inside the heating plate to ensure complete coverage. After the sample is uniformly heated at 60 °C for 15 min, it is held for 10 min to ensure uniform and stable internal temperature, as shown in Figure 4b.
When entering the three-point bending test stage, the middle area of the heating plate is opened (as shown in Figure 4c) to ensure that the sample comes into direct contact with the indenter and the lower support points. This prevents the heating plate from exerting a buffering effect on the sample during the bending test, thereby reducing experimental errors. In addition, an Omron PID temperature control box is connected to the system to achieve precise control of the target heating temperature.
Place the sample on the carrier. Before the experiment begins, set the lowering speed of the upper pressure head to 50 mm/min for a rapid descent until it is a few millimeters away from the upper surface of the material. Then, switch the speed to 5 mm/min to ensure that the upper pressure head is just in contact with the upper surface of the sample. Perform the three-point bending at the same 5 mm/min speed until the EPGF is damaged. Record the experimental results and draw the curve. To reduce experimental dispersion and systematic error, 5 parallel tests were performed for each condition, and the average value was adopted.

2.3. Fatigue Test Plan and Methodology

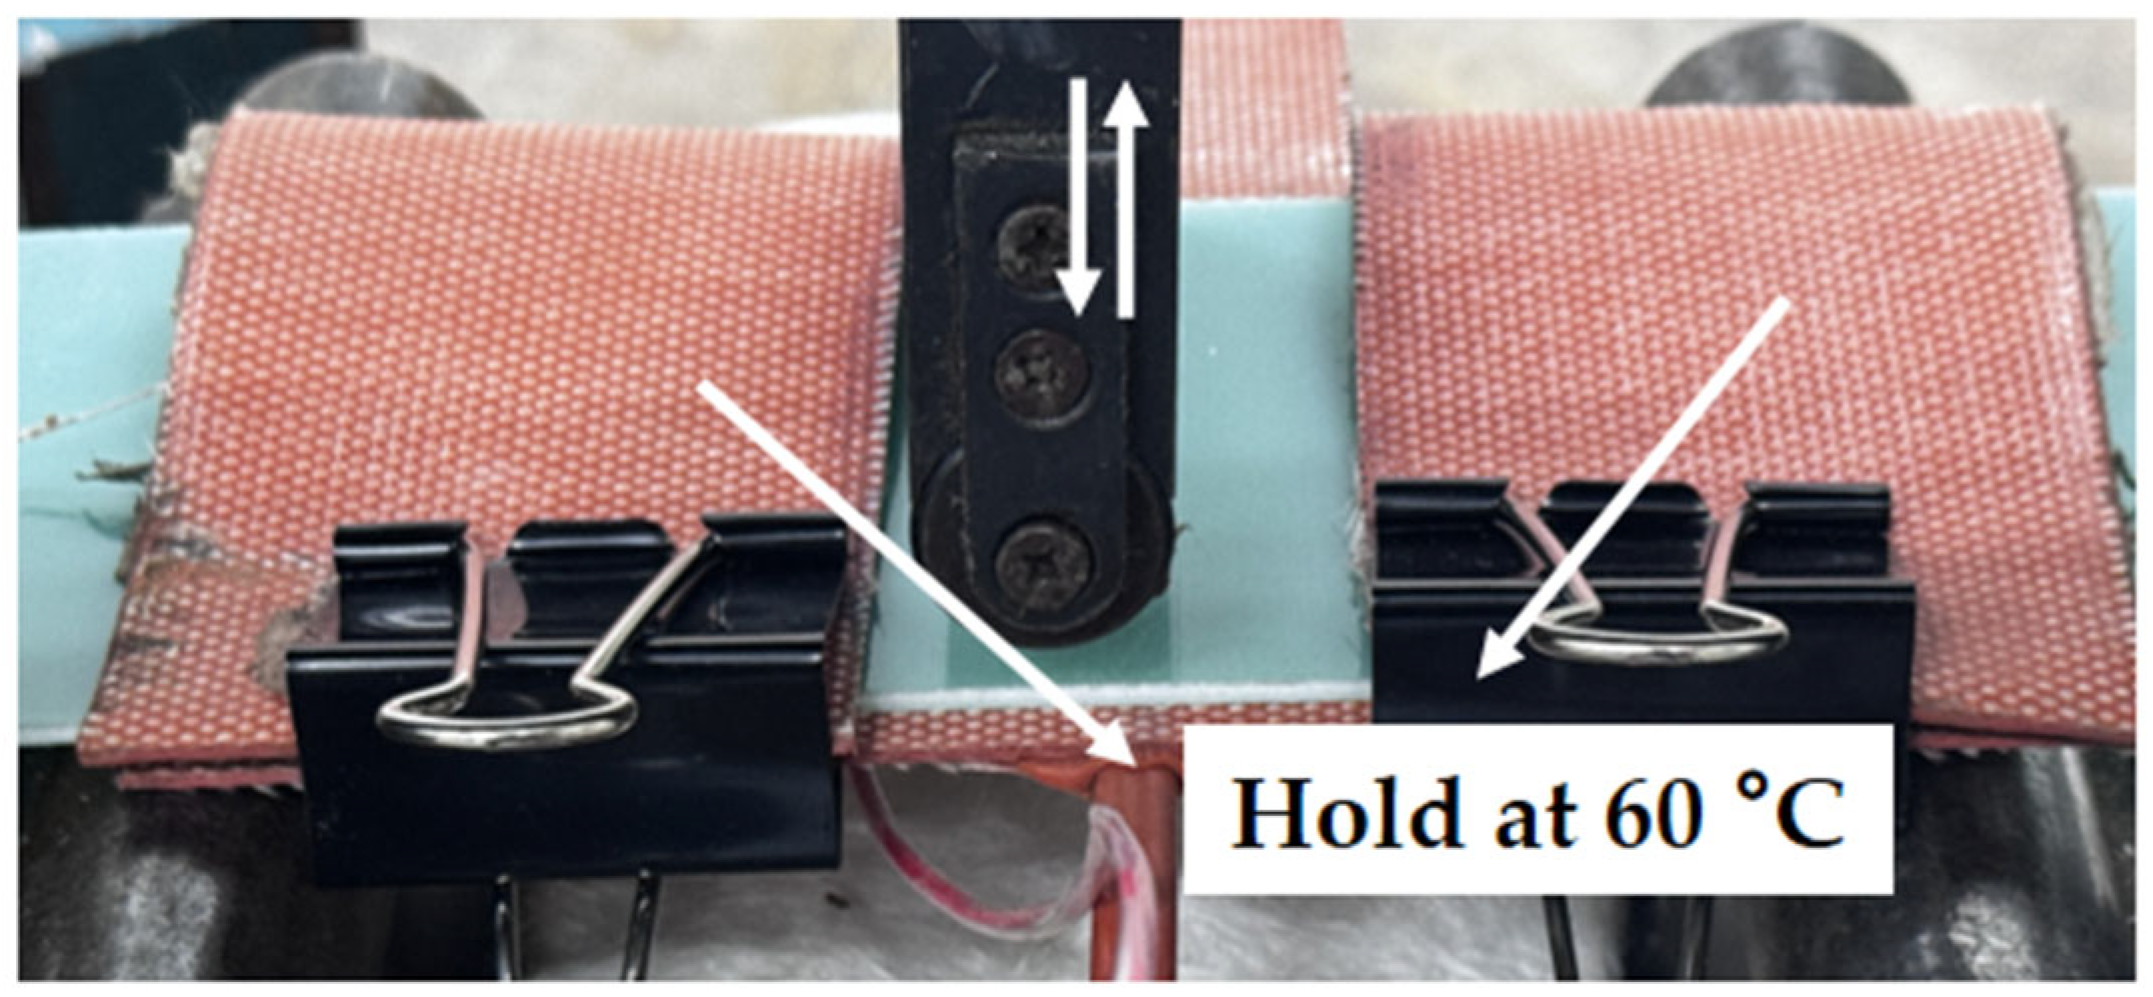
When conducting fatigue tests on the EPGF at different temperatures, two issues need to be addressed: temperature control and fatigue parameter setting. In terms of temperature control, this section adopts the flexible heating plate designed in Section 2.2, which is uniformly heated for 15 min and then kept at a constant temperature for 10 min for the fatigue test, as shown in the following Figure 5.
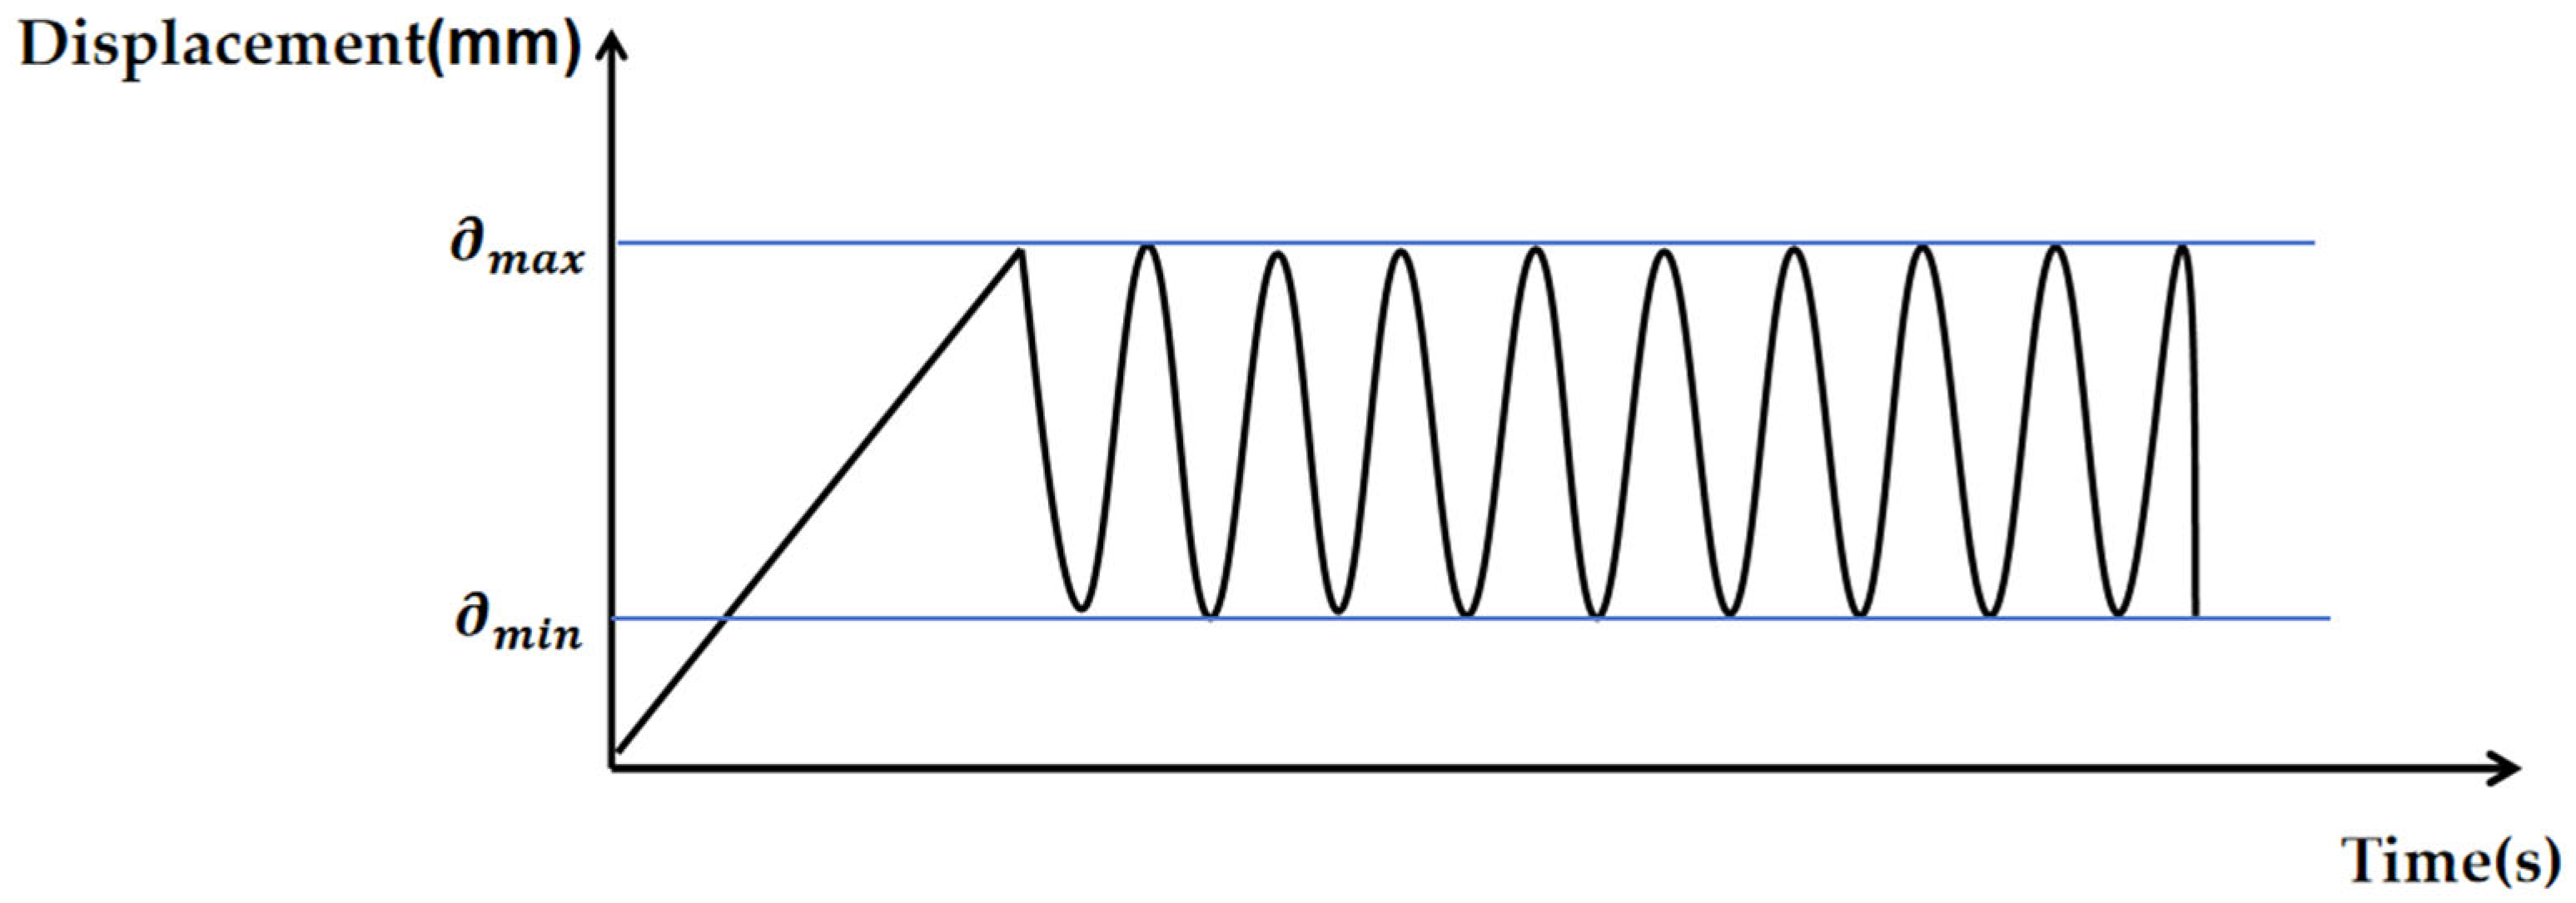
In terms of fatigue parameter setting, fatigue tests were performed using a universal testing machine, and a span of 140 mm was set. The fatigue tests were carried out in displacement control mode by applying a sinusoidal load waveform (as shown in Figure 6) at a frequency of 0.4 Hz on EPGF composite boards for three different displacement amplitudes (S = δmax/δave), where δave is the fixed average displacement corresponding to the maximum bending force obtained from the static tests in Section 2.2, and δmax is the preset maximum displacement applied to the material during fatigue tests. Three displacement amplitudes (S) (0.70, 0.75, and 0.80) were adopted in this study, with 10 replicate specimens tested for each amplitude [17] in accordance with ASTM D7264 standard. During parameter setting, δmax was adjusted according to the three amplitudes respectively, while δmin was uniformly kept as the average displacement corresponding to 20% of the maximum bending force obtained in Section 2.2. In a typical displacement-controlled fatigue test, δmax and δmin remain constant, while the reduction in peak load is caused by the accumulated mechanical damage generated during cycling [18].
The loading rate in the cyclic fatigue test corresponds to that of the static three-point bending test. In this paper, we set it to 0.4 Hz [18,19]. Before the fatigue experiment, the material surface was pre-contacted at a speed of 50 mm/min. After the start of the experiment, the initial loading rate was 10 mm/min. The upper indenter moves downward toward the EPGF specimen according to the preset δmax. Upon reaching the target displacement, the upper indenter retracts upward to δmin. The displacement range was controlled between δmax and δmin. This loading cycle repeats continuously until complete fracture of the specimen occurs, at which point the test stops and the number of fatigue cycles is recorded.

2.4. Scanning Electron Microscopy (SEM) Analysis Steps After Bending Fatigue Test

The fatigue failure materials at two temperatures were cut into 1 cm small pieces and observed using a scanning electron microscope. Due to the poor conductivity of the samples, when the electron beam contacted the sample surface, the charges could not form a circuit and accumulated on the surface, thereby affecting secondary electron emission and making imaging unclear. Therefore, the samples were first fixed on a solid conductive adhesive tape and then placed in the KYKY-SBC-12 type ion sputtering instrument for gold spraying. The gold spraying conditions were voltage 25 KV, vacuum degree 6 Pa, and time 30 s. After the gold spraying was completed, the dust on the sample surface was blown away with a swab and then placed in the electron microscope for observation.

2.5. Experimental Method for Breakdown Voltage Test

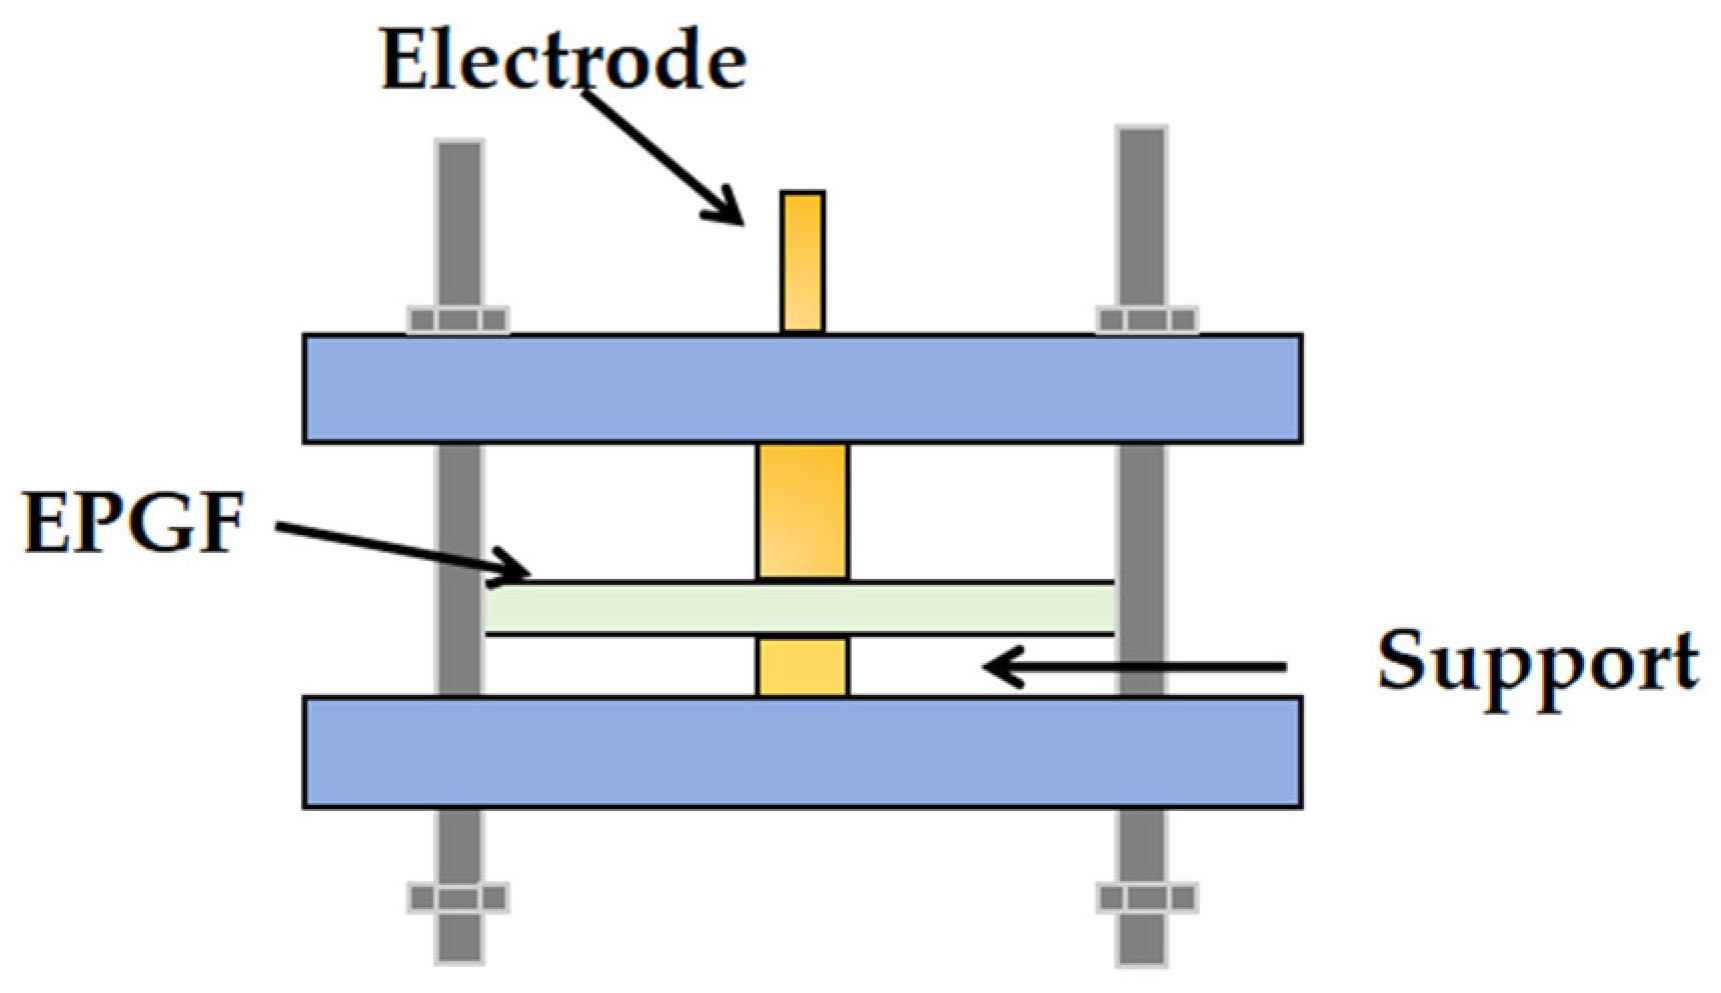
To investigate the combined effects of fatigue and temperature on the insulation properties of the material, breakdown voltage tests were performed on specimens with varying degrees of damage. First, the sample was cut to an appropriate size to ensure that the test sample could be accurately placed in the oil box, as shown in Figure 7. The experiment used cylindrical electrodes with a diameter of 15mm for the electrodes [20] because if the electrode size is too small, the electric field will be significantly concentrated at the electrode edges, leading to edge effects, which makes it impossible to reflect the true breakdown performance of the material; the electrodes were composed of two metal cylinders with rounded edges, placed coaxially and connected to the electrode support. According to GB/T1408-2006 [21], during the experiment, a continuous voltage increase method was selected, with a voltage increase rate of 1 KV/s, until the sample was broken down. An alternating current (AC) voltage was adopted for the test; meanwhile, Student’s t-test and one-way analysis of variance (ANOVA) were adopted for the statistical analysis of the subsequent breakdown voltage data. Specifically, t-test was used for the comparison of the mean values of two independent sample groups, and one-way ANOVA was applied for the mean value comparison of multiple independent sample groups. The p-value was taken as the core judgment index for statistical analysis. In this study, a p-value of less than 0.05 was regarded as the criterion for a statistically significant difference between groups. A p < 0.05 indicated that the probability of the observed differences between groups being caused by random errors was less than 5%, meaning the differences were statistically significant; a p ≥ 0.05 indicated that there was no statistically significant difference between the groups of data.

3. Results and Discussion

3.1. Three-Point Bending Test Results Under Different Temperatures

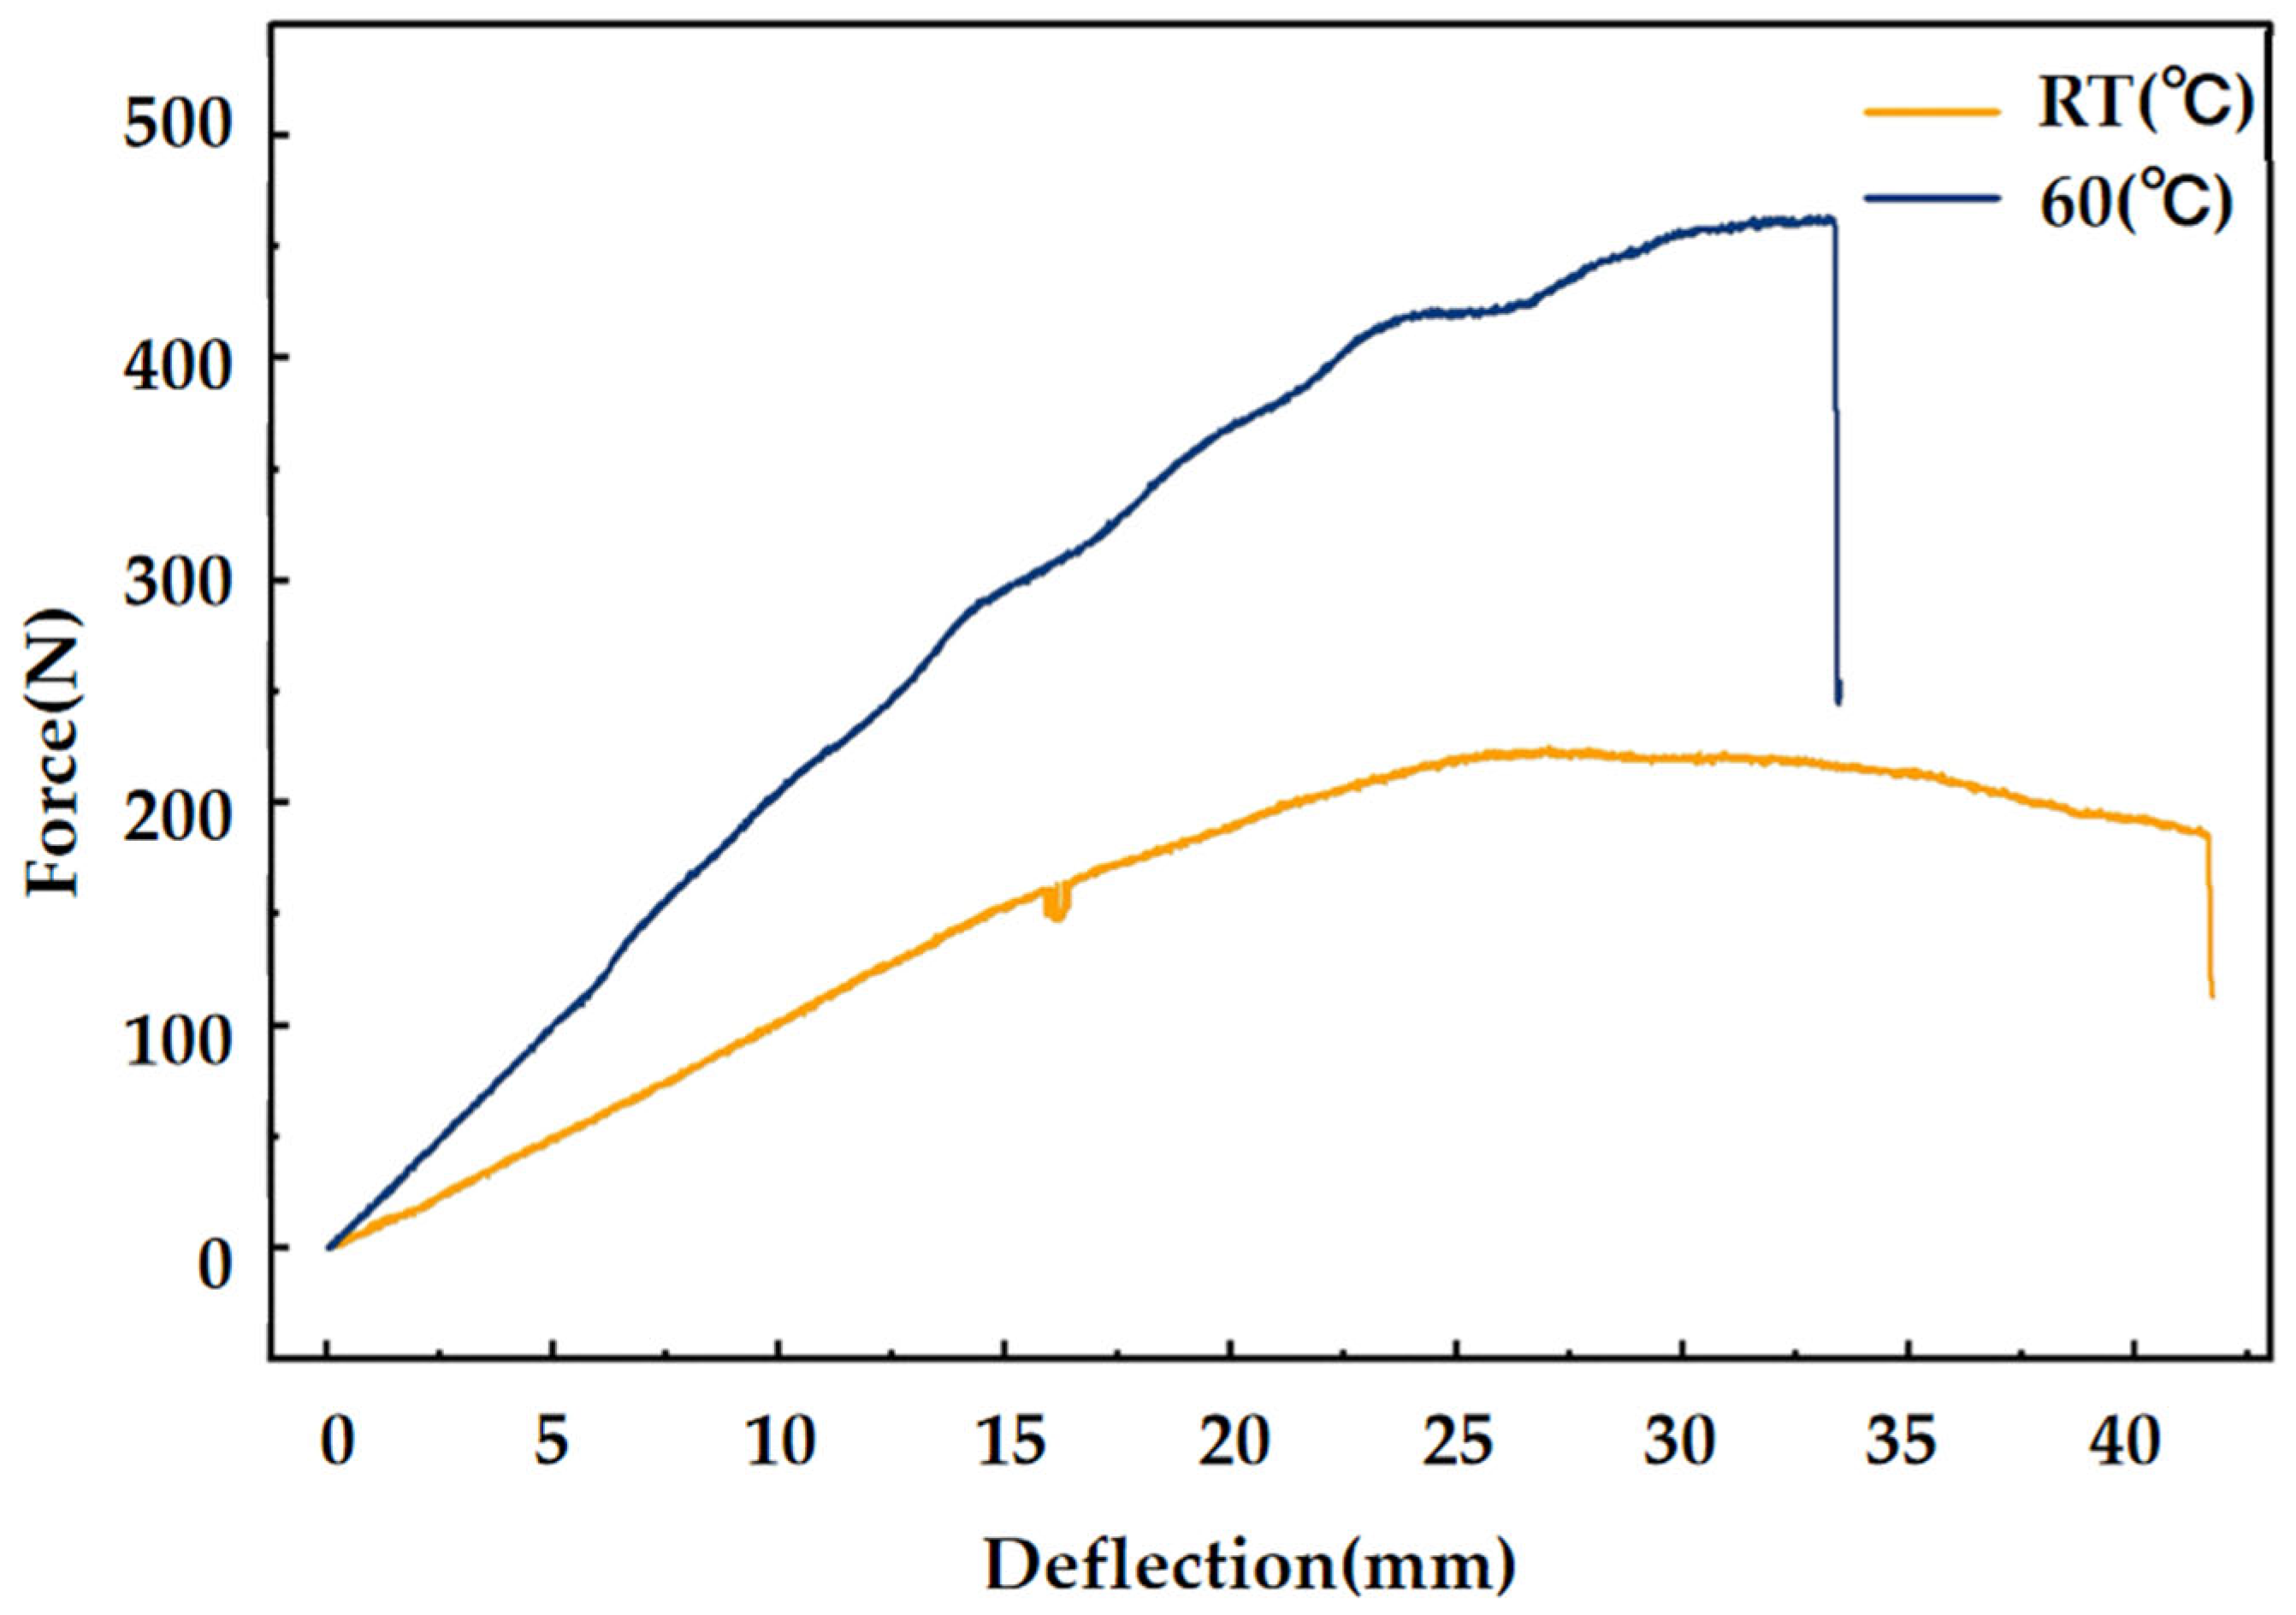
The three-point bending curve is drawn as shown in the Figure 8. At RT, the three-point bending force is 462 N. At 60 °C, the three-point bending force significantly decreases to approximately 225.2 N.
According to the following formula, calculate the ultimate bending strength and modulus of the material:
σ = 3 P L 2 b h 2
Among them, P represents the application of a vertically downward load at the midpoint of the two fulcrums to the sample to be tested.
L represents the distance between the two supporting points of the lower fixture.
b and h respectively represent the width and thickness of the specimen.
E = L 3 P 4 b h 3 f
Among them, ∆P represents the load increment of the initial straight-line segment on the load–deflection curve.
f represents the deflection at the midpoint of the span corresponding to the load increment ∆P.
It can be calculated that at RT, the ultimate bending strength (σ) is 361.5 MPa, and the bending elastic modulus (E) is 14.85 GPa. However, at a temperature of 60 °C, both the ultimate bending strength (σ) and the bending elastic modulus (E) decrease significantly, to 171.15 MPa (a reduction of 52.67%) and 5.13 GPa (a reduction of 65.45%) respectively. This indicates that the increase in temperature significantly reduces the material’s ability to resist bending failure, and the damage displacement of the heated EPGF increases. As the temperature rises, the molecular thermal motion inside the material intensifies, the activity of molecular chains enhances, and the intermolecular interaction force weakens, causing the originally closely arranged molecular structure to become loose, resulting in a decrease in the overall strength and stiffness of the material [22].

3.2. Experimental Results of Bending Fatigue Test

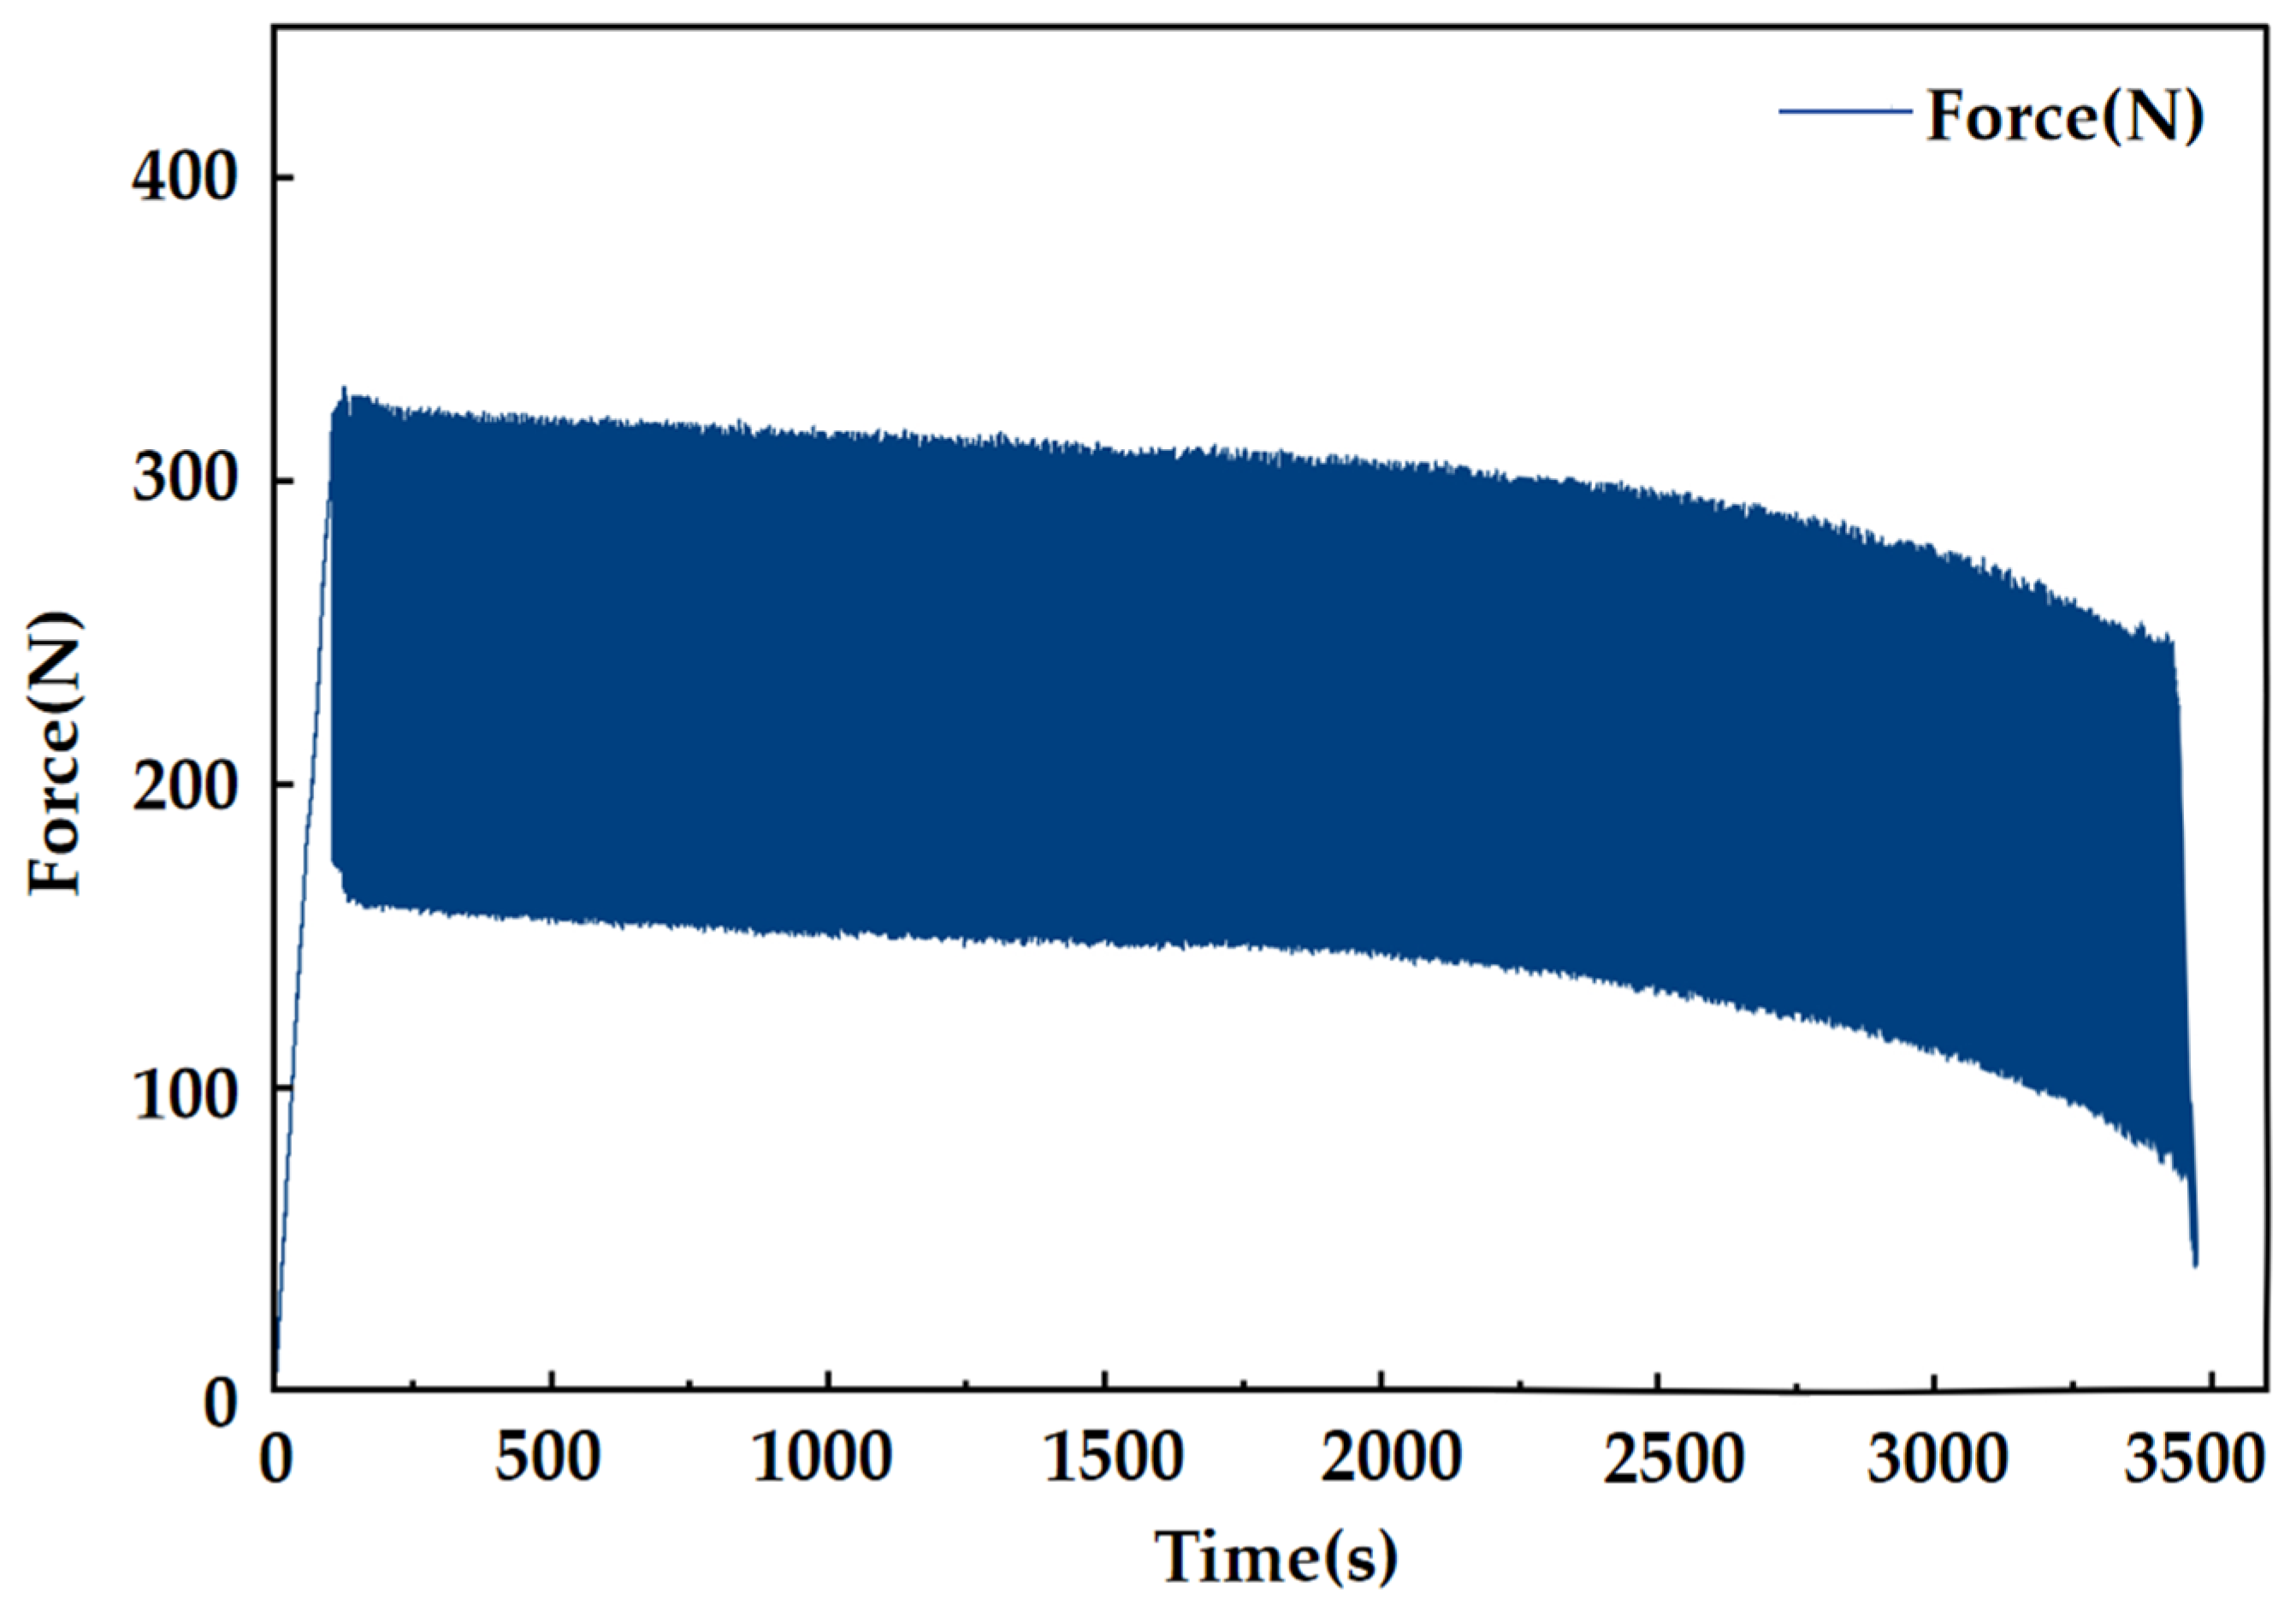
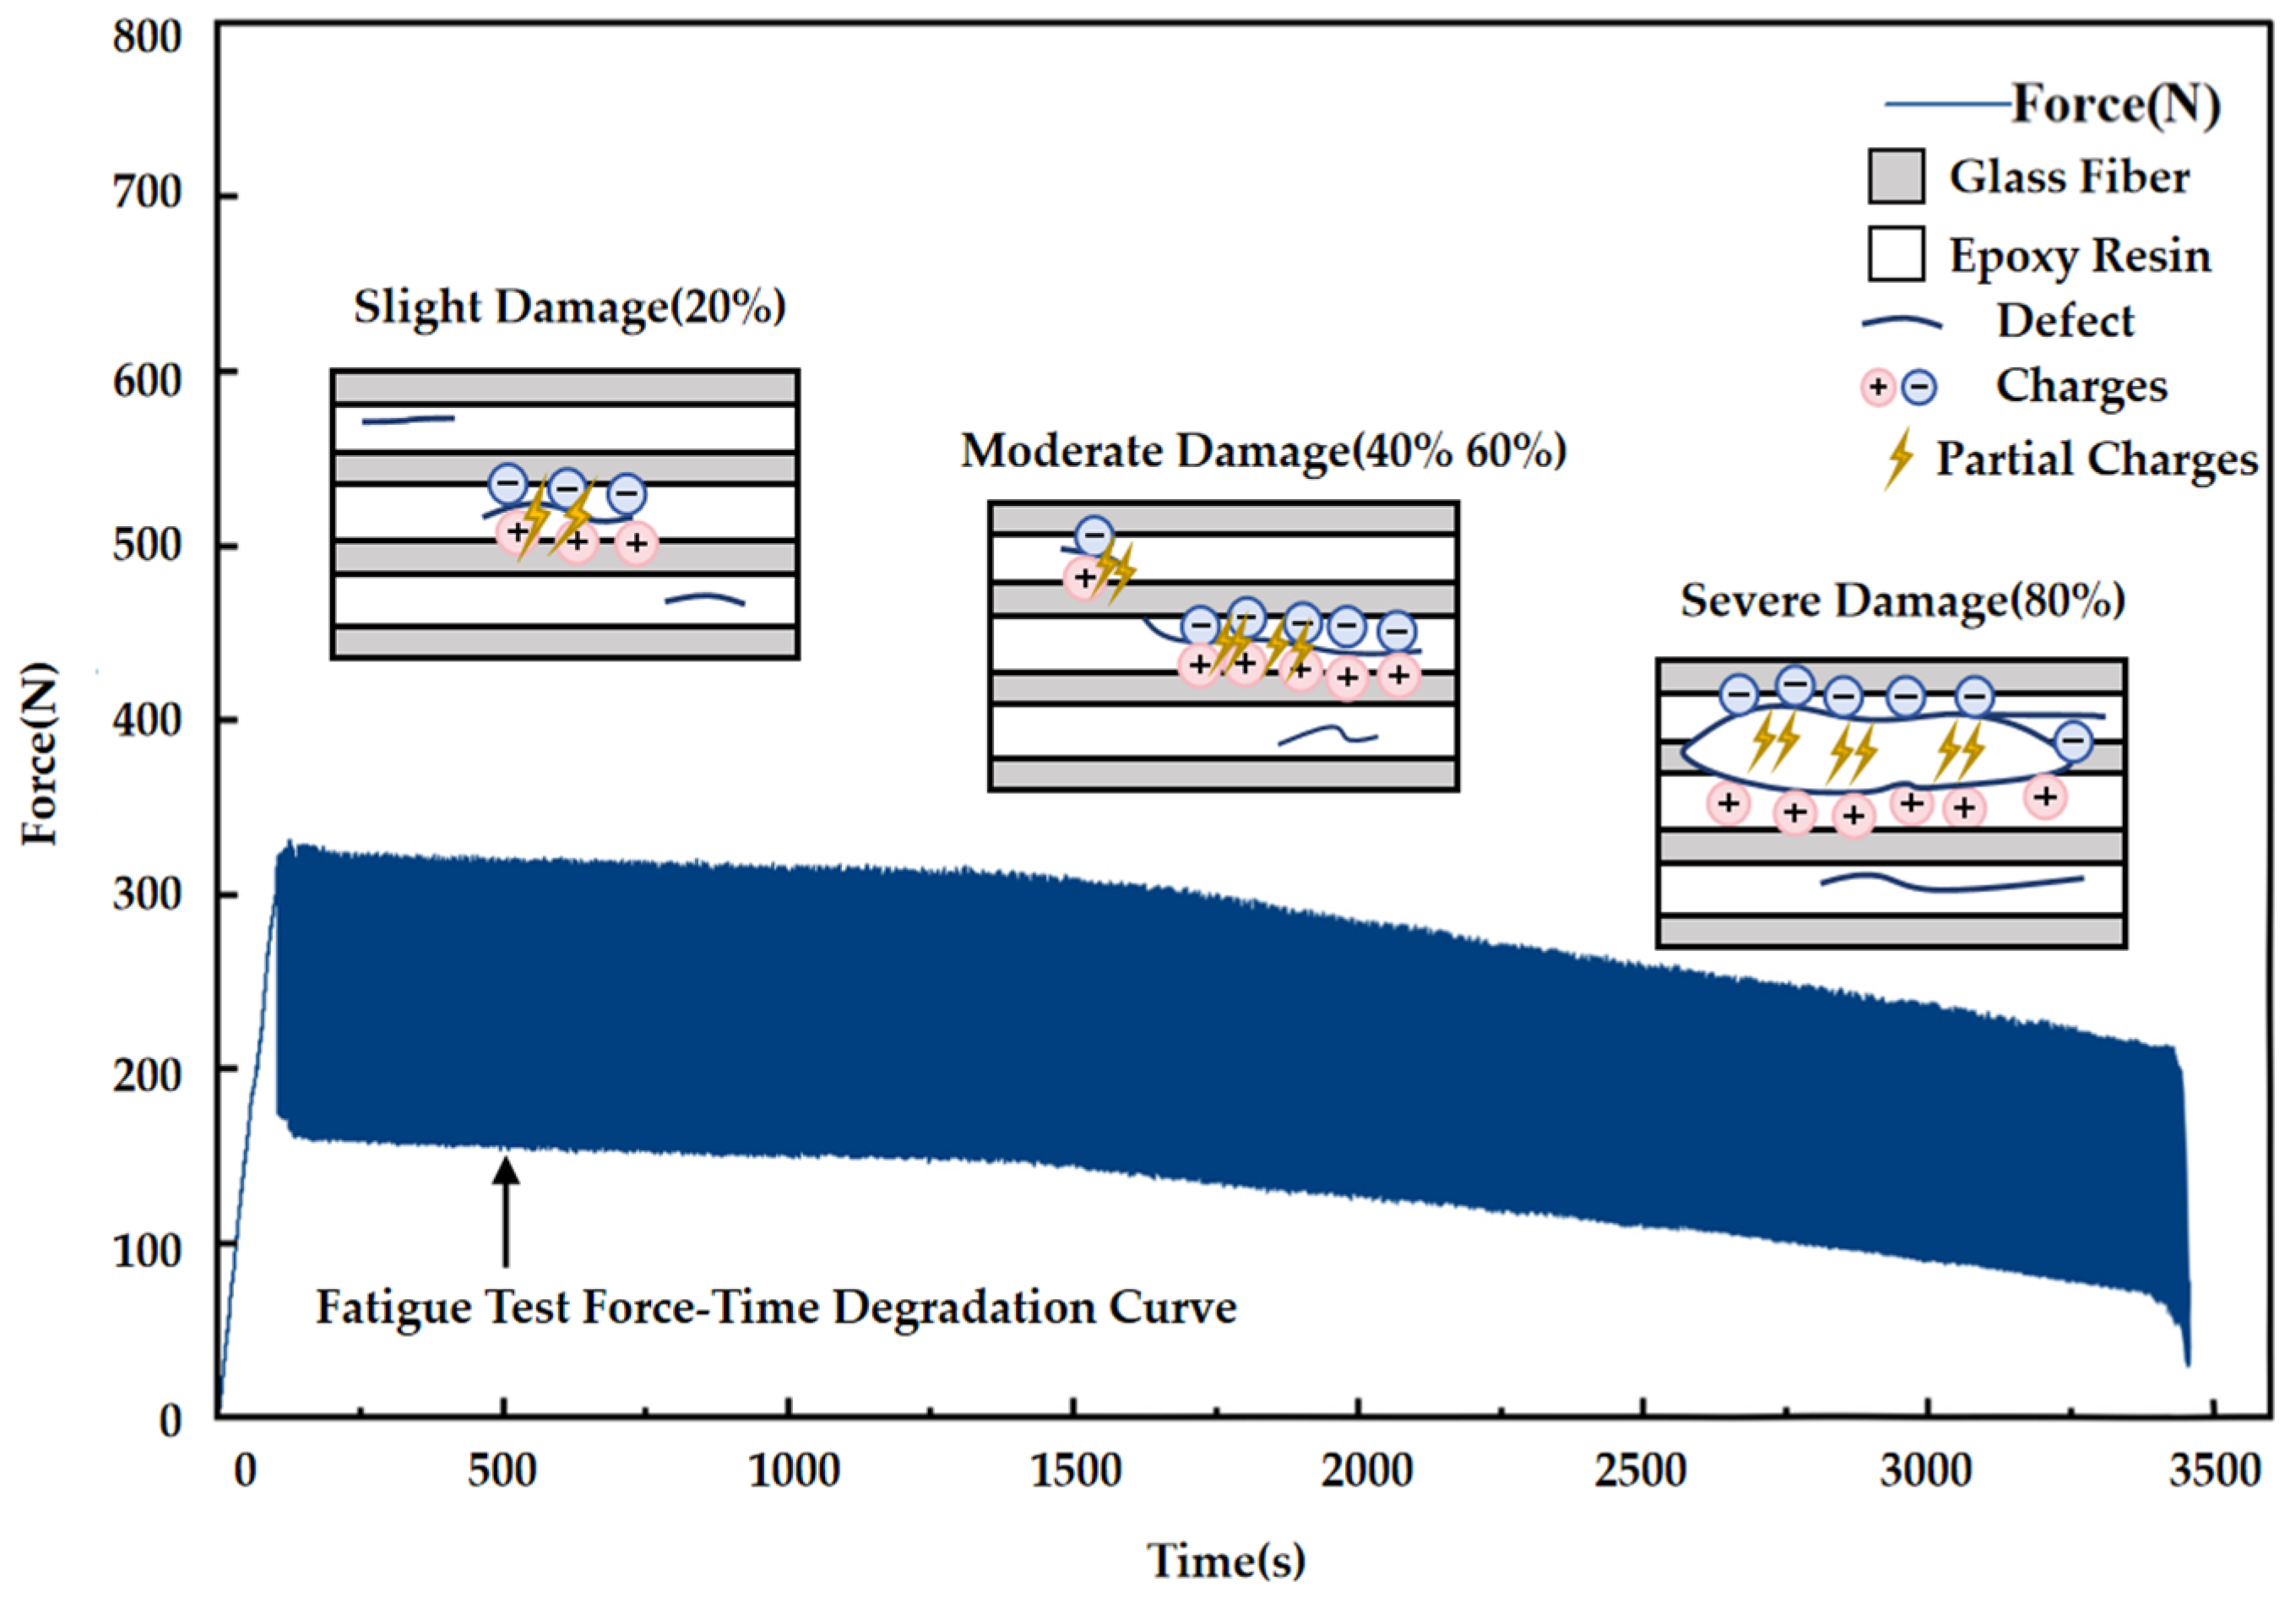
During the fatigue test, the applied force exhibits a gradual decay trend over time, as shown in Figure 9, remaining relatively stable in the initial stage, then decreasing significantly with accumulated material damage in the later stage, and finally dropping abruptly upon specimen failure.
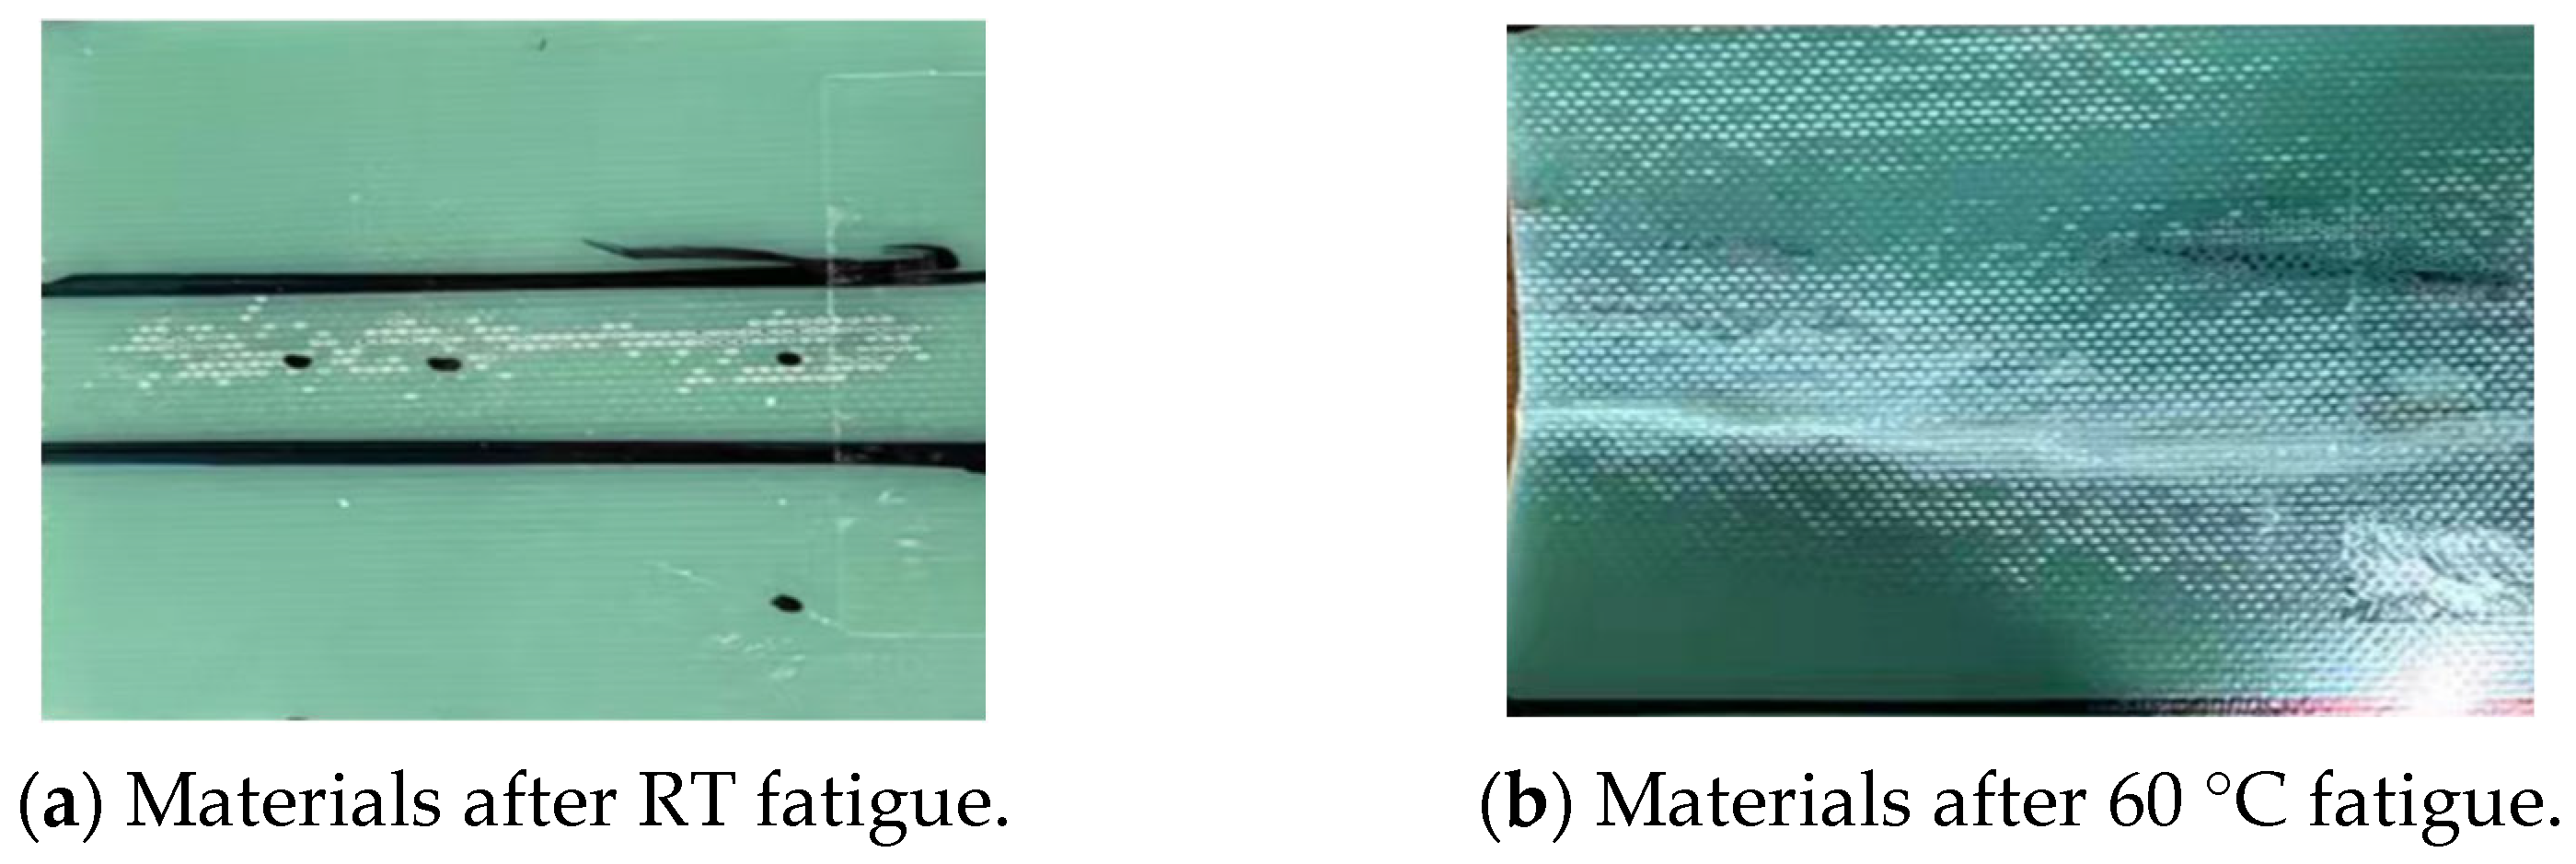
At different temperatures, the characteristics of the sample after fatigue failure are as follows. It can be seen that at 60 °C, the surface resin matrix softens, the interface layering is obvious, and the surface glass fibers become white and raised. The recorded data are as shown in Figure 10 below.
It can be clearly seen from Table 2 data that at RT, the dispersion of failure cycles is relatively consistent under all displacement amplitudes, with a 100% data validity rate.
At RT, the dispersion of fatigue life for each group remains approximately in the range of 20–40%. Such dispersion originates on the one hand from minor systematic errors described in Section 2, including specimen thickness deviation and test assembly errors. On the other hand, it is dominated by the inherent random characteristics of glass fiber fracture and stochastic crack initiation, which is an intrinsic feature of fatigue failure for quasi-brittle composite materials. Under large displacement amplitudes (0.80 and 0.75), a dramatic order-of-magnitude jump in data dispersion occurs when comparing the fatigue failure cycles at RT and 60 °C: the coefficient of variation (CV) rises from 41.50% to 106.70% and from 30.40% to 100.90%, with increases of 1.56 and 2.32 times respectively, exhibiting extreme data dispersion. Meanwhile, the data validity rates drop to only 80% and 90%, indicating that the heated material (60 °C) undergoes complete fracture before reaching the corresponding m a x , which means that the specimens failed before the first full fatigue cycle was applied; this is attributed to the softening of the epoxy resin matrix at 60 °C [9] and the weakened interfacial bonding between fibers and the resin. At 60 °C, apart from the steady-state temperature fluctuation of ±2.1 °C of the flexible heating plate, large displacement deformation greatly amplifies the inherent micro-defects inside specimens. These defects act as random crack initiation sites, increasing the stochasticity of fatigue failure and eventually resulting in prominent dispersion of fatigue life, which is the primary reason for the elevated dispersion degree.
Under the small displacement amplitude (0.70), the effect of temperature rise on data dispersion is relatively limited.

3.3. Analysis and Discussion of the Mathematical Model of Bending Fatigue Resistance

According to fracture mechanics theory [23], the fatigue life failure of composite materials usually follows the weakest-link model. That is, the failure essentially originates from the unstable propagation of the main internal cracks, and the processes of crack initiation, propagation, and failure exhibit significant statistical dispersion. Therefore, mathematical models with statistical probability significance must be adopted for characterization. The statistical strength theory proposed by Weibull based on the weakest-link model is suitable for the simulation and prediction of EPGF strength distribution [24]. Therefore, the Weibull distribution was used as the mathematical fitting method in this study to describe the fatigue life and failure rules of the materials.
For the fitting graph using the two-parameter Weibull distribution function, the Weibull probability distribution function can be expressed as
F t = 1 exp t η β
Among them, t represents the lifespan.
β is the shape parameter, which determines the shape of the failure rate curve; the larger the value is, the better the uniformity of the fatigue lifespan of the material is.
η is the scale parameter, indicating the characteristic lifespan of the material when the cumulative damage reaches 63.2%.
By fitting the experimental results, the fitting results of β and η at the two temperature levels were obtained, as shown in the following Table 3:
The goodness-of-fit indicators (R2) of Weibull fitting for fatigue life data are all greater than 0.85 under all conditions, verifying the reliability of the statistical analysis. Among them, the pre-failed specimens at 60 °C (those that fractured before the first full fatigue cycle) do not constitute valid fatigue life data and were not included in the Weibull fitting.
The shape parameter indicates that, regardless of normal temperature or 60 °C conditions, the β value increases as the displacement amplitude decreases, suggesting that the fatigue life of the material becomes more dispersed as the amplitude increases, and it shows a premature failure state. A comparison of the shape parameter β at RT and 60 °C reveals a decreasing trend at 60 °C, indicating that 60 °C leads to early fatigue failure of the material. The scale parameter shows that as the amplitude increases, the fatigue life of the material decreases, and this reduction is further exacerbated under elevated temperature conditions, with a more pronounced decline in fatigue life observed at high temperatures.
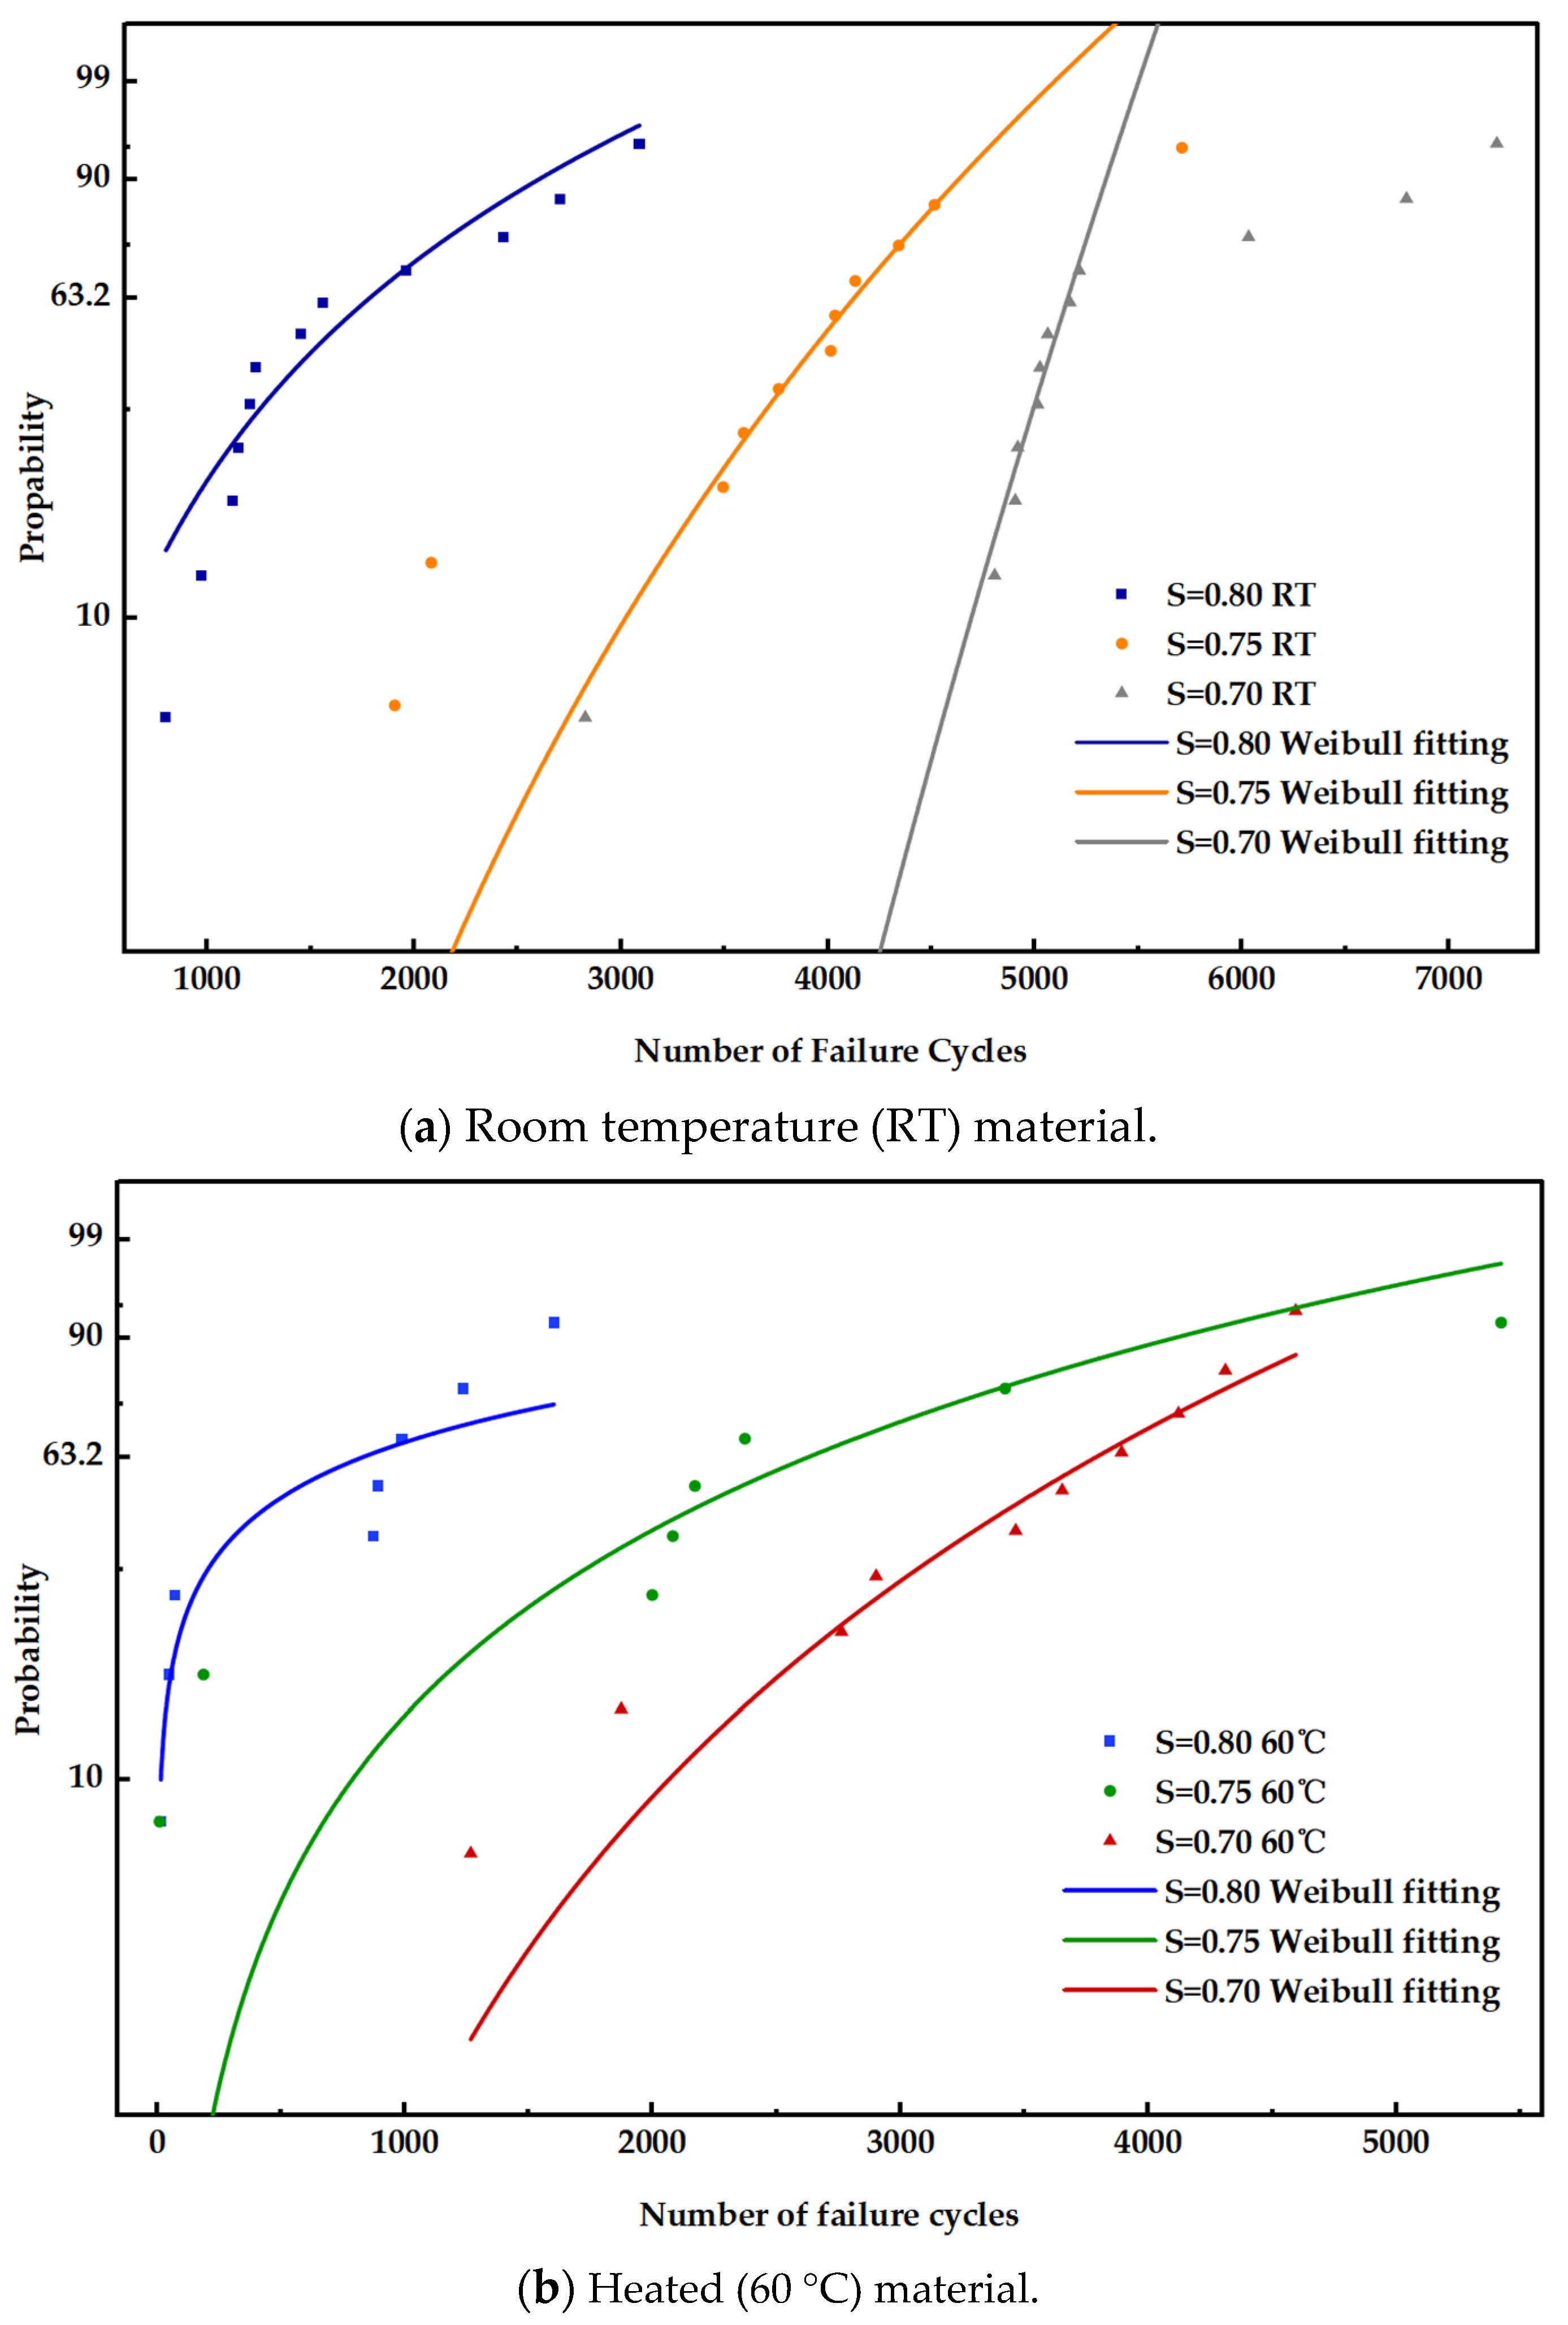
From the above table, the fatigue probability distribution models of the material under different displacement amplitudes and different temperatures are as follows. These models can be used to predict the fatigue life probability of the material under different temperatures and different displacement amplitudes. Then, the fatigue life data will be fitted with Weibull and plotted to obtain the following groups of graphs, which visualize the variation pattern of the material’s fatigue life.
F t S = 0.80 , R T = 1 exp t 1780.51 2.21
F t S = 0.75 , R T = 1 exp t 4121.69 7.23
F t S = 0.70 , R T = 1 exp t 5156.10 23.77
F t S = 0.80 , 60   ° C = 1 exp t 819.67 0.56
F t S = 0.75 , 60   ° C = 1 exp t 2619.29 1.87
F t S = 0.70,60   ° C = 1 exp t 3782.29 3.71
In Figure 11, the experimental data points fit well with the fitted curve (R2 > 0.85). This shows that the two-parameter Weibull distribution can effectively depict the distribution pattern of fatigue life. It also confirms the reliability of the model in predicting the decline of material fatigue life.
Moreover, the fitted curve further clearly reflects that as the displacement amplitude decreases, the material fatigue life is prolonged. When the displacement amplitude decreases from 0.80 to 0.70, 63.2% of the materials at RT increase their fatigue life from 1780.51 to 5156.10, and the characteristic fatigue life increases by approximately 190.1%. The influence of 60 °C on material fatigue life is significant, causing a reduction in life, when the displacement amplitude is 0.80, the scale parameter at 60 °C is only 819.67, which is approximately 54.0% lower than the same amplitude at RT. When the displacement amplitude is 0.70, the scale parameter at 60 °C is 3782.29, which is approximately 26.6% lower than the same amplitude at RT. This also indicates that the weakening effect of 60 °C on the characteristic life is significantly amplified with the increase in displacement amplitude, and there is a significant synergistic deteriorating effect between displacement amplitude and temperature on the characteristic life of EPGF.
In summary, based on the two-parameter Weibull distribution, this section systematically established a fatigue life prediction model for EPGF under different temperatures and displacement amplitudes. This model provides a quantitative basis for the fatigue life evaluation of EPGF in high-voltage electrical equipment, helping to reduce the risk of sudden fatigue failure and improve the long-term operational stability of power equipment.

3.4. Analysis of SEM After Bending Fatigue Test

The results are as follows.
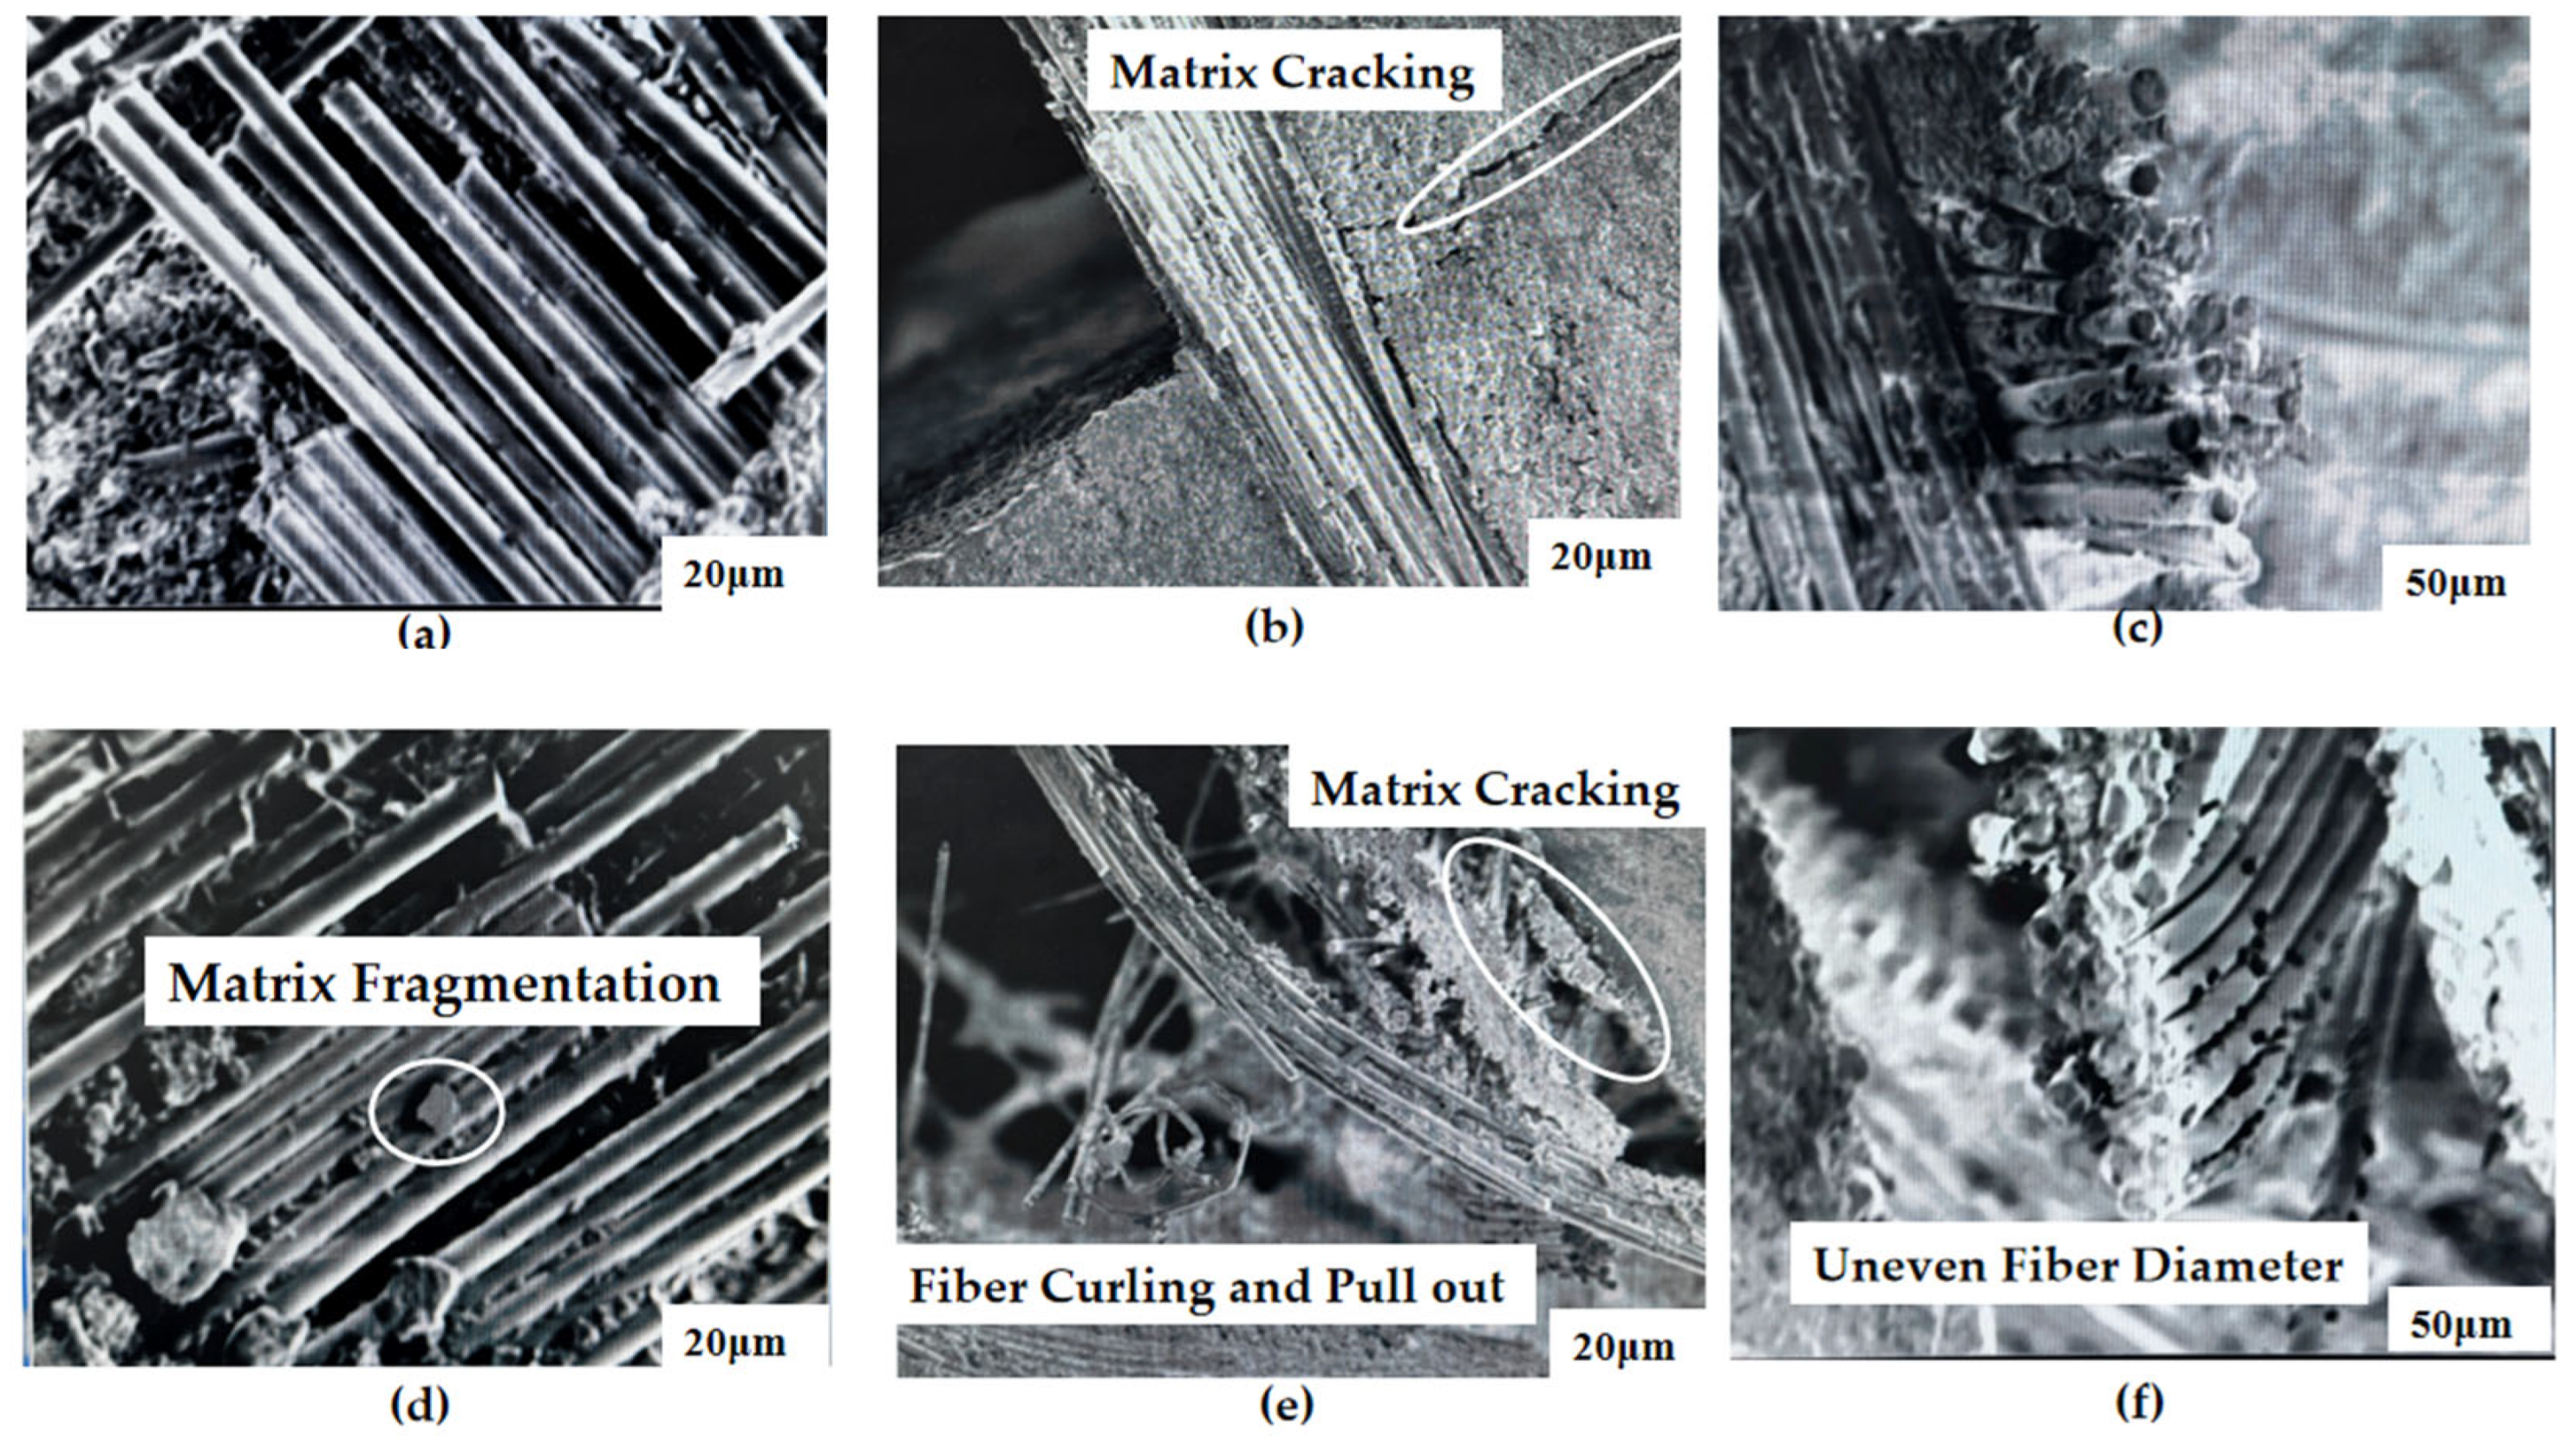
The SEM observations reveal fiber pull-out, matrix cracking, and interfacial debonding.
At RT (Figure 12a), fatigue fracture is characterized by fiber pull-out, with relatively smooth fiber surfaces and uniform fiber diameter (Figure 12c). The matrix exhibits slight interlaminar fracture (Figure 12b), accompanied by fine cracks propagating through the resin matrix, while interfacial gaps are present but not obvious (Figure 12b). At 60 °C (Figure 12e), matrix cracking is severe, accompanied by matrix fragmentation near the cracks. In addition, during fatigue fracture at 60 °C, small amounts of matrix fragments remain attached to the fiber surface after fiber pull-out (Figure 12d), accompanied by fiber curling (Figure 12e), and interfacial debonding is evident (Figure 12e).
This indicates that 60 °C softens the resin matrix, reduces the interfacial bonding strength, and accelerates interfacial failure. Macroscopically, this corresponds to faster fatigue damage accumulation, lower fatigue life, and a more pronounced coefficient of variation (CV) in fatigue life, which is consistent with the findings reported in reference [25].

3.5. Analysis and Discussion of the Breakdown Voltage

The breakdown voltage of the material under RT and undamaged conditions is 45.42 kV. At 60 °C, the breakdown voltage is 43.5 kV under no mechanical damage, indicating that the breakdown voltage of the material decreases by approximately 4.23% at 60 °C. Student’s t-test was performed on the breakdown voltage at the two temperatures, yielding a p-value of 0.01364 (p < 0.05). This result indicates that the 4.23% reduction in breakdown voltage of EPGF caused by 60 °C is statistically significant. To test the breakdown voltage under different temperatures, displacement amplitudes and fatigue damage degrees, breakdown voltage tests were conducted on fatigue specimens under three displacement amplitudes (S) at two different temperatures, with a single temperature and a single amplitude defined as one group (six groups in total). The complete fracture of the material after fatigue was regarded as 100% damage. For each group of EPGF specimens, the breakdown characteristics were tested at the fatigue damage degrees of 0% (undamaged), 20%, 40%, 60% and 80%. Each test was repeated five times for each group, and the collected breakdown voltage data was processed and summarized in Table 4, with the results reported as mean ± standard error (SE) alongside the corresponding standard deviation (SD); comparing the results of the same group of experiments, the breakdown voltage data generally shows an intra-group dispersion fluctuation of 0.5–1 kV. On the one hand, such dispersion stems from the minor experimental setup errors described in Section 2, including specimen thickness machining deviation and steady-state temperature fluctuation of the flexible heating plate. On the other hand, the random heterogeneity of the internal matrix, fibers and micro-pore defects inside EPGF, together with the inherent stochastic nature of electrical breakdown failure, couples with the above system errors and further aggravates the dispersion of the measured breakdown voltage.
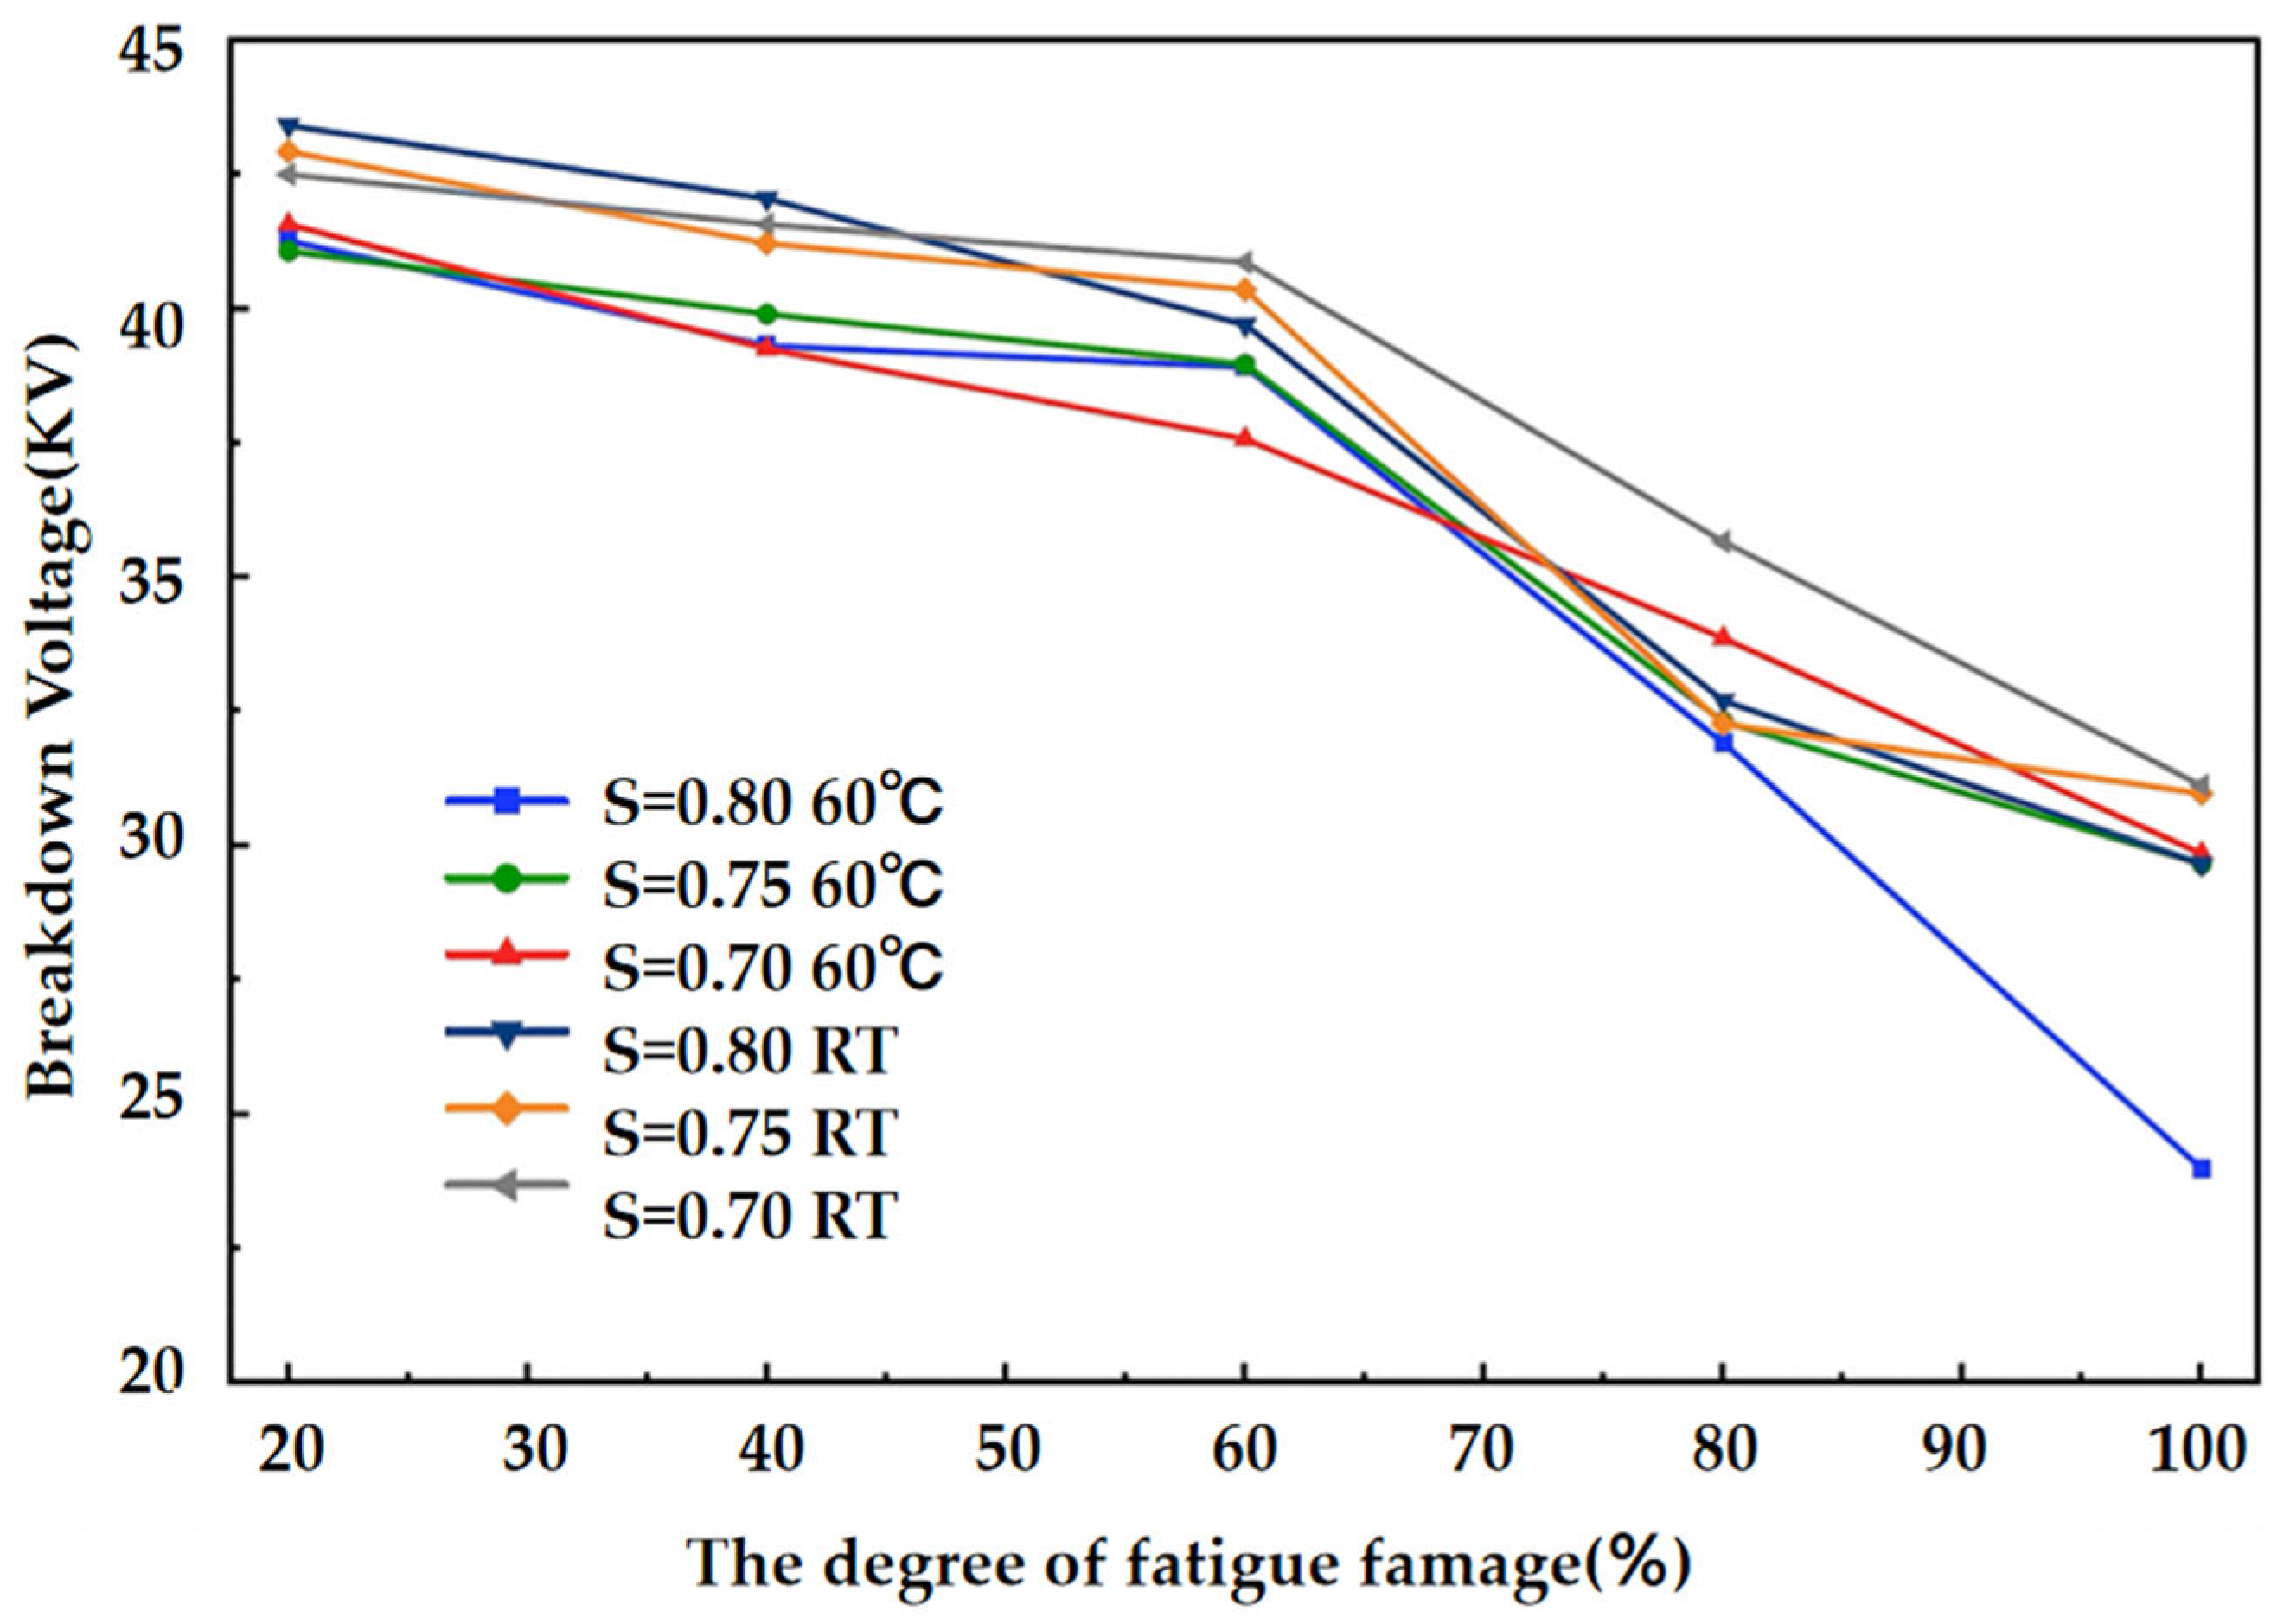
The curves illustrate the variation in breakdown characteristics with the increase in fatigue damage degree for the six groups of materials that were plotted, as shown in Figure 13.
As can be seen from the curves, the breakdown voltage of EPGF decreases significantly with the increase in fatigue damage degree under all displacement amplitudes and test temperatures (RT, 60 °C). Further one-way analysis of variance (ANOVA) results (Table 4) show that the differences in all groups are statistically significant at p < 0.05, which fully demonstrates that fatigue damage has an extremely significant effect on the dielectric breakdown performance of the EPGF.
Specifically (as shown in Table 4), at RT, when S = 0.80, the breakdown voltage decreases from 43.42 kV to 31.72 kV, with a reduction rate of 26.95%. For the 0.75 group, the breakdown voltage drops from 42.94 kV to 32.28 kV, representing a decrease of 24.83%. For the 0.70 group, the breakdown voltage declines from 42.50 kV to 35.58 kV, with a reduction of 16.28%. This is consistent with the finding of Kong et al. [26] on epoxy-based glass fiber reinforced plastics (GFRPs), where the breakdown strength decreased by up to 22.27% under 80% fatigue damage, showing a highly similar trend to the degradation of EPGF’s dielectric properties with the intensification of fatigue damage in this study. Meanwhile, this paper further reveals an obvious synergistic degradation effect between S and fatigue damage. Based on the initial breakdown voltage of 45.42 kV at RT, under 80% fatigue damage, the reduction rate of breakdown voltage was 21.66% at the low amplitude of S = 0.70; as the amplitude increased to 0.75 and 0.80, the reduction rate rose to 28.93% and 30.16% respectively. The synergistic effect caused an additional decrease of 7.27% and 8.50% in the breakdown voltage, indicating that a higher amplitude would aggravate the degradation of EPGF’s breakdown voltage induced by fatigue damage.
At the same S, the breakdown voltage at 60 °C is generally lower than that at RT, while the relative reduction percentages are similar between the two conditions. At RT, the breakdown voltage decreases to 73–84% of its initial value, whereas at 60 °C, it decreases to approximately 77–81%. This indicates that at 60 °C, temperature mainly affects the initial breakdown voltage but exerts little influence on the relative reduction amplitude caused by fatigue damage.
To further clarify the link between fatigue damage evolution and EPGF breakdown voltage decline, the degradation mechanism is analyzed by combining the structural and mechanical property changes in the material during cyclic fatigue loading. At the initial stage of fatigue loading, corresponding to the initial phase in Figure 9, the material retains good mechanical properties after repeated fatigue stress. Internal damage at this stage is mainly characterized by microcracks forming in the matrix, which act as insulation weak points and promote charge accumulation at these sites [27,28]. This in turn induces local electric field concentration and partial discharge, leading to an initial drop in breakdown voltage.
With the increase in fatigue cycles and damage degree, the damage focus gradually shifts from the matrix to the fibers [29], corresponding to the middle phase in Figure 9. The material exhibits an initial decline in mechanical properties after repeated stress. As shown in Figure 14, the growth of internal microcracks expands the distribution range of internal charges under electric fields, resulting in fields with a gradual reduction in breakdown strength.
As fatigue cycles further increase, the material shows a rapid drop in mechanical properties in a short time as depicted in Figure 9. Cracks propagate rapidly at this stage, and some fibers may fracture. Large cracks and fiber fractures lead to the formation of interlayer cavities, which further enhance the local electric field in interlayer regions. At this point, the sample interior is no longer dominated by microcracks but by these large cavities, which causes a sharp decrease in breakdown strength [26].
In summary, this section systematically investigates the breakdown voltage characteristics of EPGF under various fatigue damage degrees and clarifies the synergistic degradation law between mechanical fatigue and electrical insulation performance. The breakdown voltage data obtained under different working conditions can provide a reliable reference for the safety evaluation of high-voltage insulation components, help reduce the risk of insulation failure induced by fatigue damage, and enhance the long-term operational safety of high-voltage electrical systems.

4. Conclusions

This study systematically investigated the effects of temperature (RT, 60 °C) and displacement amplitude (S = 0.70, 0.75, 0.80) on the flexural mechanical properties, fatigue life and AC breakdown voltage of EPGF. The microscopic failure mechanism of EPGF after fatigue degradation was explored via scanning electron microscopy (SEM), and a fatigue life prediction model was established based on the two-parameter Weibull distribution. The derived degradation laws of fatigue and dielectric properties can provide measured data support for the service life evaluation of insulating structural components under multiple working conditions and possess practical engineering value for improving the operational stability under cyclic loading. The main conclusions are as follows:
(1)
A temperature of 60 °C significantly degrades the flexural mechanical properties of EPGF. Calculations show that the ultimate flexural strength and flexural modulus of EPGF at RT are 361.5 MPa and 14.85 GPa, respectively, while these two indicators drop to 171.15 MPa and 5.13 GPa at 60 °C, with a reduction of 52.67% and 65.45% accordingly. This is because the thermal motion of molecules in the epoxy resin matrix is intensified at high temperatures and the intermolecular forces are weakened, leading to the loose internal structure of the material and a significant decrease in its flexural resistance and stiffness.
(2)
Displacement amplitude and temperature exert a significant synergistic degradation effect on the fatigue life of EPGF, and the two-parameter Weibull distribution can reliably characterize the distribution characteristics of its fatigue life (R2 > 0.85). At RT, the coefficient of variation (CV) of the fatigue failure cycle data of EPGF is relatively consistent; at high amplitudes (S = 0.80, 0.75), 60 °C causes a sharp increase in data dispersion, with the CV surging by 1.56 times (41.50% to 106.70%) and 2.32 times (30.40% to 100.90%), and the data validity rate dropping to 80% and 90% as well. The characteristic fatigue life of EPGF is significantly reduced at 60 °C, with a decrease of 54.0% at S = 0.80 and 26.6% at S = 0.70, indicating that the weakening effect of high temperature on fatigue life is amplified with the increase in displacement amplitude.
(3)
The microscopic structural damage of EPGF under the coupling effect of temperature and fatigue is the intrinsic cause of the degradation of its macroscopic mechanical properties, and the evolution of microscopic structure is highly consistent with the variation law of macroscopic mechanical properties. SEM observations show that RT fatigue only induces slight matrix cracking and a small amount of fiber pull-out in EPGF, and the fiber–matrix interfacial debonding is not obvious. In contrast, at 60 °C, the material suffers from matrix fragmentation, significant fiber curling and pull-out, and aggravated interfacial debonding. The intensification of microscopic structural damage directly corresponds to the sharp decline in flexural properties and the significant shortening of fatigue life of the material at the macroscopic level. Fatigue damage leads to a continuous decrease in the breakdown voltage of EPGF, and there is a synergistic degradation effect between displacement amplitude and fatigue damage. A temperature of 60 °C only affects the initial breakdown voltage of the material and has no significant effect on the relative reduction in breakdown voltage caused by fatigue. The initial breakdown voltage of EPGF at RT is 45.42 kV, which decreases to 43.5 kV at 60 °C with a reduction of 4.23% (p = 0.01364 < 0.05), and the difference between groups is statistically significant. Under all test conditions, the breakdown voltage of EPGF decreases significantly with the increase in fatigue damage degree (p < 0.05). At RT with 80% fatigue damage, the reduction rate of breakdown voltage rises from 16.28% (S = 0.70) to 26.95% (S = 0.80) as the amplitude increases. Meanwhile, at 60 °C, the residual breakdown voltage of EPGF with 80% fatigue damage accounts for 77~81% of the initial value, which is similar to the relative reduction rate of 73~84% at RT. The evolution of fatigue damage gradually induces the initiation and propagation of matrix microcracks as well as fiber cracking; the formed microdefects and interlayer cavities act as insulation weak points, which promote charge accumulation and induce local electric field concentration, ultimately leading to a continuous decrease in the breakdown voltage of the material with the aggravation of damage degree.
(4)
This study has certain limitations, and in-depth research needs to be carried out in multiple aspects in the future. The temperature gradient is set singly, with only 60 °C selected as the high-temperature test condition, which does not cover the glass transition temperature (Tg) of EPGF. In the future, additional temperature gradients such as 80 °C and 100 °C need to be set up to Tg to systematically explore the evolution laws of material fatigue life and breakdown voltage in a wide temperature range.
In conclusion, this study used the Weibull distribution model to measure how temperature and amplitude work together. This gives key experimental evidence and theoretical backing for predicting the lifespan and evaluating the performance of glass fiber epoxy resin composites when they face 60 °C fatigue.

Author Contributions

Conceptualization, J.W.; Methodology, B.X. and C.C.; Validation, C.W.; Formal analysis, C.W. and C.C.; Investigation, B.X.; Writing—original draft, J.W.; Writing—review & editing, J.W.; Visualization, C.C. All authors have read and agreed to the published version of the manuscript.

Funding

This research received no external funding.

Data Availability Statement

The original contributions presented in this study are included in the article. Further inquiries can be directed to the corresponding author.

Conflicts of Interest

The authors declare no conflicts of interest.

References

  1. Zhang, X.; Xu, P.; Dong, B. Study on properties of glass fiber-reinforced epoxy resin composites. Henan Sci. Technol. 2024, 51, 80–83. [Google Scholar]
  2. Zhi, M.; Ma, Z.; Su, B.; Fan, R.; Wang, M. Study on combustion characteristics of glass fiber-reinforced epoxy resin composites. In Proceedings of the 2nd Building Fire Protection Conference; China Association for Engineering Construction Standardization Building Fire Protection Professional Committee, Ed.; China Association for Engineering Construction Standardization Building Fire Protection Professional Committee: Beijing, China, 2024. [Google Scholar]
  3. State Energy Administration. Blue Book on the Development of New Power Systems; State Energy Administration: Beijing, China, 2023. [Google Scholar]
  4. Jiang, S.B. Finite Element Analysis of Key Parts of Outdoor Vacuum Circuit Breakers. Doctoral Dissertation, Kunming University of Science and Technology, Kunming, China, 2012. [Google Scholar]
  5. Xie, J.; Chen, K.; Yan, M.; Guo, J.; Xie, Q.; Lü, F. Effect of temperature and water penetration on the interfacial bond between epoxy resin and glass fiber: A molecular dynamics study. J. Mol. Liq. 2022, 350, 118424. [Google Scholar] [CrossRef]
  6. Wang, H.; Chen, Y.; Wu, Z.; Zhang, P.; Liao, W.; Peng, Z. Dynamic characteristics test of insulation pull rod for circuit breakers. Trans. China Electrotech. Soc. 2021, 36, 312–319. [Google Scholar]
  7. Turan, F.; Gurkan, K.; Guclu, M.; Durmus, A.; Taskin, Y. A statistical approach to predict fatigue failure of leaf springs manufactured with nanotube incorporated epoxy-woven glass fiber composites. Polym. Compos. 2023, 44, 2925–2940. [Google Scholar] [CrossRef]
  8. Hemanth Kumar, C.; Sachit, T.S.; Bongale, A. Formulation of constant life diagram for fatigue life prediction of glass-carbon/epoxy composites. J. Fail. Anal. Prev. 2023, 23, 361–377. [Google Scholar] [CrossRef]
  9. Jiang, Y.; Xu, F.; Guo, J.; Ju, A.; Cui, Y.; Sun, Y.; Liu, L. Experimental study on interlaminar shear properties of carbon/epoxy composites with weft-knitted electro-thermal layers. Compos. Sci. Eng. 2026, 1–9. [Google Scholar]
  10. Kosedag, E. Effect of artificial aging on 3-point bending behavior of glass fiber/epoxy composites. J. Reinf. Plast. Compos. 2023, 42, 1147–1153. [Google Scholar] [CrossRef]
  11. Zhao, Y.Z.; Shui, X.Y.; Dong, Y.B.; Fu, Y.Q. Effect of hybrid coating on the interfacial property of glass fiber/epoxy composites under high temperature. J. Zhejiang Sci.-Tech Univ. (Nat. Sci.) 2017, 37, 785–789. [Google Scholar]
  12. Nishijima, S.; Hara, M. Mechanical influence on long-term dielectric performance of insulants. Cryogenics 1998, 38, 1105–1113. [Google Scholar] [CrossRef]
  13. Zhang, J.; Qi, S. Mechanical, thermal, and dielectric properties of aluminum nitride/glass fiber/epoxy resin composites. Polym. Compos. 2014, 35, 381–385. [Google Scholar] [CrossRef]
  14. Zuo, H.-M.; Li, D.-S.; Jiang, L. Transverse bending fatigue behaviors and failure mechanisms of 3D five-directional braided composites at different temperatures. Mater. Lett. 2022, 316, 132030. [Google Scholar] [CrossRef]
  15. Dong, J.; Shao, Z.; Wang, Y.; Lv, Z.; Wang, X.; Wu, K.; Li, W.; Zhang, C. Effect of temperature gradient on space charge behavior in epoxy resin and its nanocomposites. IEEE Trans. Dielectr. Electr. Insul. 2017, 24, 1537–1546. [Google Scholar] [CrossRef]
  16. GB/T 11022-2020; High-Voltage Switchgear and Controlgear. Standards Press of China: Beijing, China, 2020.
  17. Lü, X.; Qin, F.; Li, W. Experimental study on the fatigue damage characteristics of materials and components under different loading frequencies. Eng. Test 2026, 66, 12–15+79. [Google Scholar]
  18. Kravchenko, O.G.; Pedrazzoli, D.; Bonab, V.S.; Manas-Zloczower, I. Conductive interlaminar interfaces for structural health monitoring in composite laminates under fatigue loading. Mater. Des. 2018, 160, 1217–1225. [Google Scholar] [CrossRef]
  19. Harris, B. Fatigue in Composites; CRC Press: Boca Raton, FL, USA, 2003. [Google Scholar]
  20. Xu, T.L.; Wang, Q.Y.; Song, S.X.; Zhang, M.Y.; Peng, Z.R.; Liu, P. Preparation and performance analysis of bamboo insulating paper/epoxy composites. High Volt. Eng. 2023, 49, 4535–4546. [Google Scholar]
  21. GB/T 1408-2006; Electrical Strength Test Methods for Solid Insulating Materials. Standards Press of China: Beijing, China, 2006.
  22. Jabbari, A.H.; Sabet, A.S.; Sedighi, M.; Jahed, H.; Sommitsch, C. Low cycle fatigue behavior of magnesium matrix nanocomposite at ambient and elevated temperatures. Mater. Sci. Eng. A 2020, 793, 139890. [Google Scholar] [CrossRef]
  23. Chen, H.R.; Qin, S.Q.; Xue, L. Characterization of brittle failure of rock and limitation of Weibull distribution. Prog. Geophys. 2017, 32, 2200–2206. [Google Scholar]
  24. Nandagopal, R.A.; Chai, G.B.; Narasimalu, S. An empirical model to predict the strength degradation of the hygrothermal aged CFRP material. Compos. Struct. 2020, 236, 111876. [Google Scholar] [CrossRef]
  25. Kadotani, K. Electrical properties of the glass/epoxy interface. Composites 1980, 11, 199–204. [Google Scholar] [CrossRef]
  26. Kong, X.X.; Hou, C.Y.; Chen, Y.; Li, Q.; Xing, Y.Q.; Du, B.X. Dielectric behavior and breakdown strength of glass fiber reinforced epoxy composites under dynamic mechanical fatigue. Compos. Struct. 2025, 351, 118569. [Google Scholar] [CrossRef]
  27. Kchaou, B.; Turki, C.; Salvia, M.; Fakhfakh, Z.; Tréheux, D. Role of fibre-matrix interface and fibre direction on dielectric behaviour of epoxy composites. Compos. Sci. Technol. 2004, 64, 1467–1475. [Google Scholar] [CrossRef]
  28. Kechaou, B.; Salvia, M.; Benzarti, K.; Turki, C.; Fakhfakh, Z.; Tréheux, D. Role of fiber/matrix interphases on dielectric, friction, and mechanical properties of glass fiber-reinforced epoxy composites. J. Compos. Mater. 2012, 46, 131–144. [Google Scholar]
  29. Ansari, M.T.A.; Singh, K.K.; Azam, M.S. Fatigue damage analysis of fiber-reinforced polymer composites—A review. J. Reinf. Plast. Compos. 2018, 37, 636–654. [Google Scholar] [CrossRef]
Figure 1. The fiber orientation of EPGF.
Energies 19 02497 g001
Figure 2. The structure of epoxy resin. Gray spheres represent carbon atoms (C), white spheres represent hydrogen atoms (H), red spheres represent oxygen atoms (O), and dark red spheres represent bromine atoms (Br).
Energies 19 02497 g002
Figure 3. Schematic diagram of the overall experimental procedure.
Energies 19 02497 g003
Figure 4. The design of flexible heating plate.
Energies 19 02497 g004
Figure 5. Fatigue test of EPGF at 60 °C, the vertical double-headed arrow indicates the up-and-down movement of the upper indenter.
Energies 19 02497 g005
Figure 6. Displacement-controlled fatigue test with sinusoidal loading waveform.
Energies 19 02497 g006
Figure 7. Breakdown voltage test schematic.
Energies 19 02497 g007
Figure 8. Three-point bending curve.
Energies 19 02497 g008
Figure 9. Fatigue test force–time degradation curve.
Energies 19 02497 g009
Figure 10. Characteristics after fatigue failure.
Energies 19 02497 g010
Figure 11. Weibull fitting curve.
Energies 19 02497 g011
Figure 12. SEM after fatigue test: (ac) room temperature (RT) material; (df) 60 °C material.
Energies 19 02497 g012
Figure 13. Breakdown voltage curve.
Energies 19 02497 g013
Figure 14. Dielectric damage evolution of EPGF composites.
Energies 19 02497 g014
Table 1. The composition of EPGF.
Serial NumberComponent NameMolecular FormulaVolume Fraction %Function
1Glass FiberSiO252–57%Reinforcing material
2Epoxy ResinEnergies 19 02497 i00127–31%Bonding and insulating material
3Aluminum HydroxideAl(OH)313.5–15.5%Flame retardant filler
4DMFEnergies 19 02497 i002800–1000 ppmResidual solvent
Table 2. Bending fatigue failure diagram.
MaterialsAmplitudeSpecimen and Number of Failure CyclesCoefficient of Variation (CV)
Room Temperature (RT) Material0.808001557114712321119120796930882430196041.50%
0.75434041303760349140123591190545134033570930.40%
0.70480467945167490450605023491628267231501221.00%
Heated
(60 °C)
Material
0.807016001234871499878911500106.70%
0.755422010217020812371018719983421100.90%
0.70459434642762365141204310290118733891126532.90%
Table 3. Fitting results of β and η.
Material ConditionAmplitudeShape Parameter
β (Mean ± SE)
95% CI (β)Scale Parameter
η (Mean ± SE)
95% CI (η)Goodness of
Fit Indicators
R2
Room Temperature (RT) Material0.80β = 2.21 ± 0.28(1.57, 2.86)η = 1780.51 ± 79.03(1598, 1963)0.93
0.75β = 7.23 ± 0.92(5.11, 9.35)η = 4121.69 ± 39.43(4031, 4213)0.96
0.70β = 23.77 ± 4.86(12.55, 34.99)η = 5156.10 ± 30.16(5087, 5226)0.91
Heated
(60 °C)
Material
0.80β = 0.56 ± 0.15(0.17, 0.95)η = 819.67 ± 212.47(272, 1365)0.85
0.75β = 1.87 ± 0.75(0.00, 3.80)η = 2619.29 ± 239.73(2003, 3236)0.87
0.70β = 3.71 ± 0.39(2.70, 4.72)η = 3782.29 ± 61.40(3625, 3940)0.97
Table 4. Breakdown voltage data of EPGF under different fatigue damage levels.
TemperatureDisplacement Amplitude (S)Fatigue Damage Degree20%40%60%80%p
Room temperature (RT)0.80Breakdown voltage43.42 ± 0.7742.06 ± 0.6537.70 ± 0.6531.72 ± 0.54<0.05
Standard deviation (SD)1.711.461.461.20
0.75Breakdown voltage42.94 ± 0.7641.22 ± 0.6740.28 ± 0.6832.28 ± 0.70<0.05
Standard deviation (SD)1.701.491.531.56
0.70Breakdown voltage 42.50 ± 0.7341.48 ± 0.6840.78 ± 0.7235.58 ± 0.68<0.05
Standard deviation (SD)1.641.531.621.53
60 °C0.80Breakdown voltage 41.30 ± 0.7339.30 ± 0.7038.92 ± 0.7531.92 ± 0.75<0.05
Standard deviation (SD)1.641.571.671.67
0.75Breakdown voltage 41.06 ± 0.7839.92 ± 0.7738.96 ± 0.7832.28 ± 0.75<0.05
Standard deviation (SD)1.751.72 c1.751.67
0.70Breakdown voltage41.56 ± 0.7839.24 ± 0.7737.48 ± 0.7933.82 ± 0.80<0.05
Standard deviation (SD)1.751.721.781.79
Disclaimer/Publisher’s Note: The statements, opinions and data contained in all publications are solely those of the individual author(s) and contributor(s) and not of MDPI and/or the editor(s). MDPI and/or the editor(s) disclaim responsibility for any injury to people or property resulting from any ideas, methods, instructions or products referred to in the content.