Article

Opportunities and Challenges for China–Japan Cooperation Regarding Renewable Hydrogen: A 3E Perspective


1
Graduate School of Policy Science, Ritsumeikan University, Osaka 567-8570, Japan
2
College of Policy Science, Ritsumeikan University, Osaka 567-8570, Japan
*
Author to whom correspondence should be addressed.
Energies 2026, 19(10), 2475; https://doi.org/10.3390/en19102475
Submission received: 14 April 2026 / Revised: 12 May 2026 / Accepted: 19 May 2026 / Published: 21 May 2026
(This article belongs to the Special Issue Sustainable Energy Systems: Progress, Challenges and Prospects)

Abstract

China is the world’s largest producer of hydrogen, and it has the potential to export renewable hydrogen and its derivatives. Japan has set ambitious targets for developing a hydrogen-based society but is facing cost challenges. There is strong potential for China and Japan to cooperate regarding renewable hydrogen across the value chain. This study evaluates the cooperation opportunities from the 3E perspective (energy security, economics, and the environment). It estimates the renewable hydrogen production potential in both countries, as well as the economics and greenhouse gas (GHG) emissions associated with the production and export of renewable hydrogen from China to Japan using proton exchange membrane (PEM) technology. The renewable hydrogen production potential in China is estimated to be 12.00 Mt/year by 2035 in the base case of this study, providing a strong foundation for exports to Japan. The levelized cost of hydrogen (LCOH) using PEM technology and onshore wind is estimated at 4.27 USD/kg H2 in China and 11.01 USD/kg H2 in Japan for projects built in 2025. Even after accounting for liquefaction costs in China, transport costs from China to Japan (Chifeng—Dalian—Kobe) and regasification costs in Japan, renewable hydrogen produced in China remains more cost-effective than that produced in Japan. In terms of GHG emissions, when renewable hydrogen is produced using wind power, and wind power is also used for liquefaction and other electricity-consuming processes, the total emissions within the case study boundary amount to 2.24 kg CO2-eq/kg H2, below Japan’s low-carbon hydrogen threshold of 3.4 CO2-eq/kg H2. This study also discusses the challenges which are critical to facilitating cooperation, particularly in regards to coordinating standards and certification systems between the two countries.

1. Introduction

Hydrogen, especially renewable hydrogen, is considered an important tool to decarbonize hard-to-abate sectors, since electrification alone is not a viable solution for achieving carbon neutrality goals in either Japan or China. Karmaker et al. indicate that a balanced pathway that integrates electrification and hydrogen strategies represents the most feasible and sustainable way for Japan to achieve carbon neutrality by 2050 [1]. The same strategy also applies to China.
China is the world’s largest hydrogen producer and consumer, producing 36.5 million tons of hydrogen in 2024. Of this total, only 320 thousand tons (less than 1%) were derived from water electrolysis. Meanwhile, China’s renewable energy-based electrolysis capacity reached approximately 125 thousand tons/year by the end of 2024 [2]. Even though its renewable hydrogen production capacity is currently limited, China has significant potential to become a major producer and exporter of renewable hydrogen in the future due to its abundant renewable energy resources.
Japan’s current hydrogen consumption is around 2 million tons/year [3], but it has set very ambitious targets for future hydrogen consumption. According to Japan’s Basic Hydrogen Strategy, the country has set hydrogen consumption targets of 3 million tons/year for 2030, 12 million tons/year for 2040, and 20 million tons/year for 2050 [4]. Hydrogen, including renewable hydrogen, imported from other countries will be important for Japan to meet its consumption targets, but China is not explicitly identified as a prospective source in the primary Japanese government hydrogen strategy documents.
Given that Japan is expected to become an important renewable hydrogen consumer in the future and that China has the potential to become a renewable hydrogen exporter, this study aims to examine the opportunities and challenges of China–Japan cooperation regarding renewable hydrogen.
In general, there are three main technologies for producing hydrogen from renewable sources: alkaline water electrolysis (AWE), proton exchange membrane water electrolysis (PEMWE), and solid oxide electrolyzer cells (SOECs). In terms of technology readiness level (TRL), AWE is more mature than PEMWE, which in turn is more mature than SOECs. Although SOECs have the potential to achieve higher efficiency, they are still far from commercialization-ready. PEMWE technology is more flexible and thus better able to cope with fluctuations in renewable energy supply. For this reason, this study focuses on PEMWE technology.
Energy supply security, economics and environment, often referred to as 3E, are “commonly identified as three major objectives of energy policy” [5], although the exact wording for the three components varies across documents. For example, Japan’s Basic Hydrogen Strategy uses terms such as energy security, economic efficiency and the environment in its “S + 3E” framework, with safety added as an additional element [4]. This study mainly studies the opportunities and challenges for China–Japan cooperation regarding renewable hydrogen from a 3E perspective, while giving limited attention to safety.
In addition to the introduction, this paper consists of the following sections: Literature Review, Methodology, Results, Discussion, and Conclusion.

2. Literature Review

For safety considerations, China has introduced new legislation to relax regulations for the production sites of renewable hydrogen to promote its development, while Japan has issued a hydrogen safety strategy to harmonize regulations and support the development of a hydrogen society. In China, hydrogen is traditionally treated as a hazardous chemical and under the Regulation on Safe Management of Hazardous Chemicals, it must be produced within chemical industrial parks. However, since 2023, several provinces—including Hebei Province, Inner Mongolia, and Shandong Province—have allowed renewable hydrogen production projects to be constructed outside of chemical parks. In addition, in December 2025, the Law of the People’s Republic of China on Safe Management of Hazardous Chemicals was passed to replace the previous regulation. Article 18 of this law stipulates that “Newly-built or expanded construction projects for the production of hazardous chemicals shall be located in chemical industrial parks, except for auxiliary construction projects matched with production facilities of other industries and other projects that meet the provisions of the state” [6]. Renewable hydrogen production is considered to fall under “auxiliary construction projects matched with production facilities of other industries” and can therefore be located outside chemical industrial parks. This is regarded as an encouragement to the development of renewable hydrogen. In contrast to China, Japan has never required hydrogen production to be located within chemical industrial parks. In addition to legal regulations, China has also issued the Guidelines for the Development of a Hydrogen Energy Industry Standard System (2023 Edition), which aim to establish a comprehensive standards system for hydrogen, including safety standards [7]. Japan’s hydrogen safety regulation is mainly based on the High Pressure Gas Safety Law. Furthermore, Japan has issued the Interim Report for the Hydrogen Safety Strategy in 2023. This strategy outlines three action policies and nine means, emphasizing efforts based on scientific data and evidence, the rationalization and optimization of rules, and building a hydrogen utilization environment [8]. This study does not focus on hydrogen safety issues.
China exhibits strong potential for producing and exporting renewable hydrogen. Liu et al. estimated that renewable hydrogen production capacity and production would reach 80 GW and 5 million tons per year, respectively, in 2030; renewable hydrogen production would then increase to 15 million tons per year in 2035 and 100 million tons per year in 2060 [9]. T. Li et al. estimated that renewable hydrogen production capacity and production would reach 100 GW and 7.7 million tons per year, respectively, in 2030, while production would increase to 75 to 100 million tons per year in 2060 [10]. J. Li et al. estimated that the wind-based hydrogen production potential as 902.96 million tons per year in 2060, equivalent to 6.94–10.04 times China’s total hydrogen demand in that year [11]. However, the estimates reported by J. Li et al. represent theoretical potential rather than realistic potential. Moreover, clearly stated national estimates of renewable hydrogen production capacity specifically for 2035 appear to be limited in the literature. The main estimates of renewable hydrogen production capacity and production in China reported in the literature are presented in Table 1.
Regarding China’s potential exports of renewable hydrogen to Japan, Song et al. analyzed hydrogen production from offshore wind power in China and its export to Japan [12]. They concluded that China could supply enough hydrogen to meet Japan’s demand targets for 2030 (3 Mt/year) and 2050 (20 Mt/year) and that methylcyclohexane (MCH), as a hydrogen carrier, is the most economical transport method, with potential costs below Japan’s targets of 30 JPY/Nm3 (approximately 3 USD/kg H2 [12]) in 2030 and 20 JPY/Nm3 (approximately 2 USD/kg H2 [12]) in 2050. However, the offshore wind power generation potential reported in the paper (e.g., 12 petawatt hours of electricity annually, equivalent to 4000 GW, assuming 3000 utilization hours per year for offshore wind) is based on idealized assumptions and is therefore more optimistic than the realistic potential.
For the economic dimension, there is a broad range of estimates for both the cost of renewable hydrogen and the cost of PEM electrolyzers. Kikuchi et al. predicted that the cost of hydrogen in Japan could be as low as 17–27 JPY/Nm3 (approximately 1.25–1.99 USD/kg H2, assuming 1 kg H2 = 11.13 Nm3 and 1 USD = 151 JPY) using a combination of batteries, PV, and PEM electrolyzers in Nagoya city, Japan [13], which is based on idealized assumptions. In this study, exchange rates of 1 USD = 7.19 CNY and 1 USD = 151 JPY are used unless otherwise specified, based on 2024 exchange rates [14]. Zhu et al. estimate that the levelized cost of hydrogen (LCOH) for a PEM electrolyzer using solar power and wind power is 894.4 JPY/kg H2 (approximately 5.92 USD/kg H2) and 798.6 JPY/kg H2 (approximately 5.29 USD/kg H2), respectively, based on data from the Kyushu area in Japan [15]. Y. Wang et al. calculated the production cost of hydrogen using PEMWE technology in China, projecting a decrease from 7.26 USD/kg H2 (for a hydrogen production system operating during 2020–2040) to 2.60 USD/kg H2 (for a hydrogen production system operating during 2040–2060) [16]. Man et al. calculated the levelized cost of hydrogen (LCOH) for AWE and PEM in different provinces in China, with AWE ranging from 3.18 to 8.74 USD/kgH2 and PEM ranging from 3.33–10.24 USD/kg [17]. Y. Wang et al. reported that the price ranges are 10,000–15,000 CNY/kW (approximately 1492.5–2238.8 USD/kW) and 2500–4000 CNY/kW (approximately 373.1–597.0 USD/kW) for PEMWE and AWE, respectively, using an exchange rate of 1 USD = 6.7 CNY [16]. Japan’s Basic Hydrogen Strategy mentions a 2030 target of 52,000 JPY/kW (approximately 344.37 USD/kW) for alkaline electrolyzers and 65,000 yen/kW (approximately 430.46 USD/kW) for PEM electrolyzers [4]. NEDO’s Water Electrolysis Technology Development Roadmap in 2025 indicates that the total system capital cost for PEMWE (comprising uninstalled cost, installation costs and indirect costs) is currently 400,000 JPY/kW (approximately 2649.01 USD/kW) and is projected to decrease to 57,000 JPY/kW (377.48 USD/kW) by 2040 [18].
For the GHG emissions of renewable hydrogen production, Ajeeb et al. summarize findings from the literature, showing that GHG emissions from PEM electrolysis using wind power (excluding offshore wind) range from 0.094 kg CO2-eq/kg H2 to 1.8 kg CO2-eq/kg H2, while those using solar power range from 0.61 kg CO2-eq/kg H2 to 2.8 kg CO2-eq/kg H2 across different locations [19]. Studies specifically focusing on the GHG emissions of renewable hydrogen production using PEM technologies in China and Japan remain relatively limited in the literature. The China Electricity Council proposed the Clean and Low-Carbon Hydrogen Evaluation Standard (Draft for Comments) in 2025, an industry standard based on a previous association standard developed by the China Hydrogen Alliance but with more stringent thresholds. It defines low-carbon hydrogen as having a carbon footprint (CF) of 3.86 kg CO2-eq/kg H2 < CF ≤ 13.23 kg CO2-eq/kg H2, clean hydrogen as having a CF ≤ 3.86 kg CO2-eq/kg H2, and renewable hydrogen as having a CF ≤ 2.00 kgCO2-eq/kg H2 on a well-to-gate basis [20]. Japan’s Hydrogen Society Promotion Act of 2024 defines the threshold for low-carbon hydrogen as 3.4 kg CO2-eq/kg H2, also based on a well-to-gate boundary, but does not establish specific thresholds for renewable hydrogen [21].
To secure the environmental and climate benefits of renewable hydrogen, certification systems and their associated chain-of-custody models should be considered. At present, there is no globally recognized certification system. A report by IRENA and RMI in 2023 states that “None of the existing hydrogen certification systems are suitable for cross-border trade” [22]. The Environmental Coalition on Standards (ECOS) suggests that the chain-of-custody model of mass balance should be applied to gaseous hydrogen (GH2) in pipelines, while segregation or identity-preserved models should be used for liquid hydrogen (LH2) and LH2 carriers [23]. In Japan, the Chubu Area Low-Carbon Hydrogen Certification System (CA-LCHCS), which covers Aichi Prefecture, Gifu Prefecture and Mie Prefecture, issues certificates for hydrogen that meets certain requirements, such as being produced from renewables or biogas, or with environmental values validated by documents such as Green Power Certificates or J-Credits. The CA-LCHCS evolved from the previous Aichi Prefecture Low-Carbon Hydrogen Certification System (AP-LCHCS) of 2018. The implementation guidelines of the CA-LCHCS (amended on April 1, 2025) state that they maintain the previous “zero” CO2 emission criterion and do not adopt the 3.4 kg CO2-eq/kg H2 threshold defined in Japan’s Hydrogen Society Promotion Act of 2024, while aligning the boundary with the Act, well-to-gate [21]. The chain-of-custody model used in the CA-LCHCS is Book & Claim [24]. In China, the Clean and Low-Carbon Hydrogen Evaluation Standard (Draft for Comments) proposed by the China Electricity Council recommends the use of the mass balance model [20].
Japan’s hydrogen import strategy includes multiple hydrogen and hydrogen carrier forms, such as liquid hydrogen, ammonia, and other synthetic carriers, to diversify supply and meet its decarbonization goals. Ammonia imported into Japan is used in industrial processes and is planned for wider application such as for co-firing in thermal power generation to reduce carbon emissions. Japanese companies are also taking action to import ammonia from China. For example, the Japanese company Marubeni, headquartered in Tokyo, signed a long-term offtake agreement with the Chinese company Envision Energy, headquartered in Shanghai, to receive ammonia produced from renewable energy (green ammonia) in Inner Mongolia in 2025 [25].
However, for the direct use of high-purity hydrogen, LH2 is preferred over other forms. Japan has conducted pilot projects to demonstrate the feasibility of importing LH2. For example, the Japanese company Kawasaki Heavy Industries (KHI), headquartered in Kobe, built the LH2 carrier Suiso Frontier, which has completed pilot shipments of liquefied hydrogen from the Port of Hastings, Australia, to the Port of Kobe, Japan, as part of international supply chain demonstrations.
Previous studies have generally not analyzed cooperation opportunities between China and Japan in the field of renewable hydrogen. A limited number of studies have examined such cooperation, but they often rely on idealized assumptions and omit GHG emissions analysis. To meet Japan’s need for importing LH2, China should also begin evaluating the feasibility of exporting LH2, in addition to ammonia, to Japan. Against this background, this study aims to address the gap by making two contributions: (1) analyzing the renewable hydrogen production potential, economics, and GHG emissions in China and Japan using a unified methodological framework, i.e., the 3E framework; and (2) employing a real-world case study (Chifeng—Dalian—Kobe) to compare the economics and GHG emissions of renewable hydrogen produced in China and exported to Japan in the form of LH2.

3. Methodology

Safety issues have been discussed in Section 2, and Section 3 focuses on energy security (the renewable hydrogen production potential), economics and environment (GHG emissions).

3.1. Methodology for Analyzing the Renewable Hydrogen Production Potential

In this study, the renewable hydrogen production potential is determined by renewable electricity generation and the share of renewable electricity used to produce hydrogen.
For China, this study assumes a total wind and solar power capacity of 3600 GW for 2035, based on China’s national targets. The 2024 data come from the national electricity statistics released by China’s National Energy Administration [26]. The compound annual growth rate (CAGR) is calculated using data from 2024 and 2035 and is used to estimate the capacity for the years between 2024 and 2035. This study assumes that all solar power capacity is in the form of solar photovoltaic (PV) systems. The installed capacities of wind and solar power in China are shown in Table 2. The estimates from Zhang et al. and from Lin and Peng are also included in Table 2 for comparison [27,28].
For Japan, this study assumes that the wind and solar power capacities will be 80 GW and 280 GW, respectively, in 2035, based on predictions from Japan’s Renewable Energy Institute (REI) [30]. According to IRENA’s Renewable Capacity Statistics 2025, Japan’s installed solar and wind energy capacities were 91,610 MW and 5832 MW in 2024, respectively [31]. The installed capacities of wind and solar power in Japan are shown in Table 3. The estimates from REI’s study in 2023 are also included in Table 3 for comparison [32].
The electricity generation from solar power and wind power is calculated using Equation (1).
G r e = C p v · h p v + C w · h w
where G r e is the electricity generated from renewables, C p v is the installed capacity of solar PV, h p v is the utilization hours of solar PV, C w is the installed capacity of wind power, and h w is the utilization hours of wind power. In this study, 1200 h/year is adopted for h p v and 2200 h/year for h w , based on data from 2023 and 2024 in China [33]; 1250 h/year is adopted for h p v and 1850 h/year for h w , based on data from 2023 and 2024 in Japan [34,35].
The calculation method for renewable hydrogen production is given by Equation (2), adapted from the equation proposed by Jung et al. [36]:
P h = G r e · p · η m s e · η s e L H V h
where P h is the renewable hydrogen production potential, G r e is the electricity generated from renewables, p is the percentage of renewable electricity that can be used for hydrogen production, η m s e is the efficiency of the electrolyzer-power matching system (accounting for losses in the electrolyzer-power matching system due to temporal and operational mismatches) [37], η s e is the system efficiency of the electrolyzers, and L H V h is the lower heating value of hydrogen (33.3 kWh/kg H2).
Jung et al. assumed 90% efficiency for the electrolyzer-power matching system [36], which is also adopted in this study. C. R. Wang et al. reported the 2024 status of 65% and proposed 2030 and 2050 targets for PEM system efficiency of 70%, and 75%, respectively [38]. This study adopts 65% for 2024 and 75% for 2035 for the PEM system efficiency, with the CAGR calculated and applied to the years between 2024 and 2035.
According to the China Energy Transition Outlook 2023, electricity used to produce hydrogen constitutes 9.5%, 10.9%, and 15.2% of the total electricity consumption in 2035 under three different scenarios [39]. This study adopts the assumption that 10% of renewable electricity will be used to produce hydrogen by 2035, as the base case for China. Due to limitations in Japan, such as land availability and higher electricity prices, this study adopts the assumption that 5% of renewable electricity—half of China’s share—will be used to produce hydrogen by 2035, as the base case for Japan. As mentioned in the introduction, the renewable energy-based installed capacity of electrolyzers in China is 125 kt/year, with hydrogen production from water electrolysis reaching 300 kt/year (including both grid electricity and renewable electricity) in 2024 [2]. In Japan, the largest renewable hydrogen production project is the Fukushima Hydrogen Energy Research Field (FH2R), which has a capacity of 900 t/year [40]. However, there are no official data on renewable hydrogen production for either China or Japan in 2024. Based on these facts, this study assumes that 0.3% of renewable electricity (approximately 116.4 kt/year) was used to produce hydrogen in China in 2024, and 0.15% (half of China’s share, approximately 3 kt/year) was used in Japan. It should be noted that the assumptions about the share of renewable electricity used to produce hydrogen in 2024 are for modeling purposes only; as long as the share is below 1%, the impact on predictions for future years is limited under the methodology of this study. The CAGR is calculated based on the percentage of renewable electricity used in 2024 and 2035 and is applied to the years between 2024 and 2035.
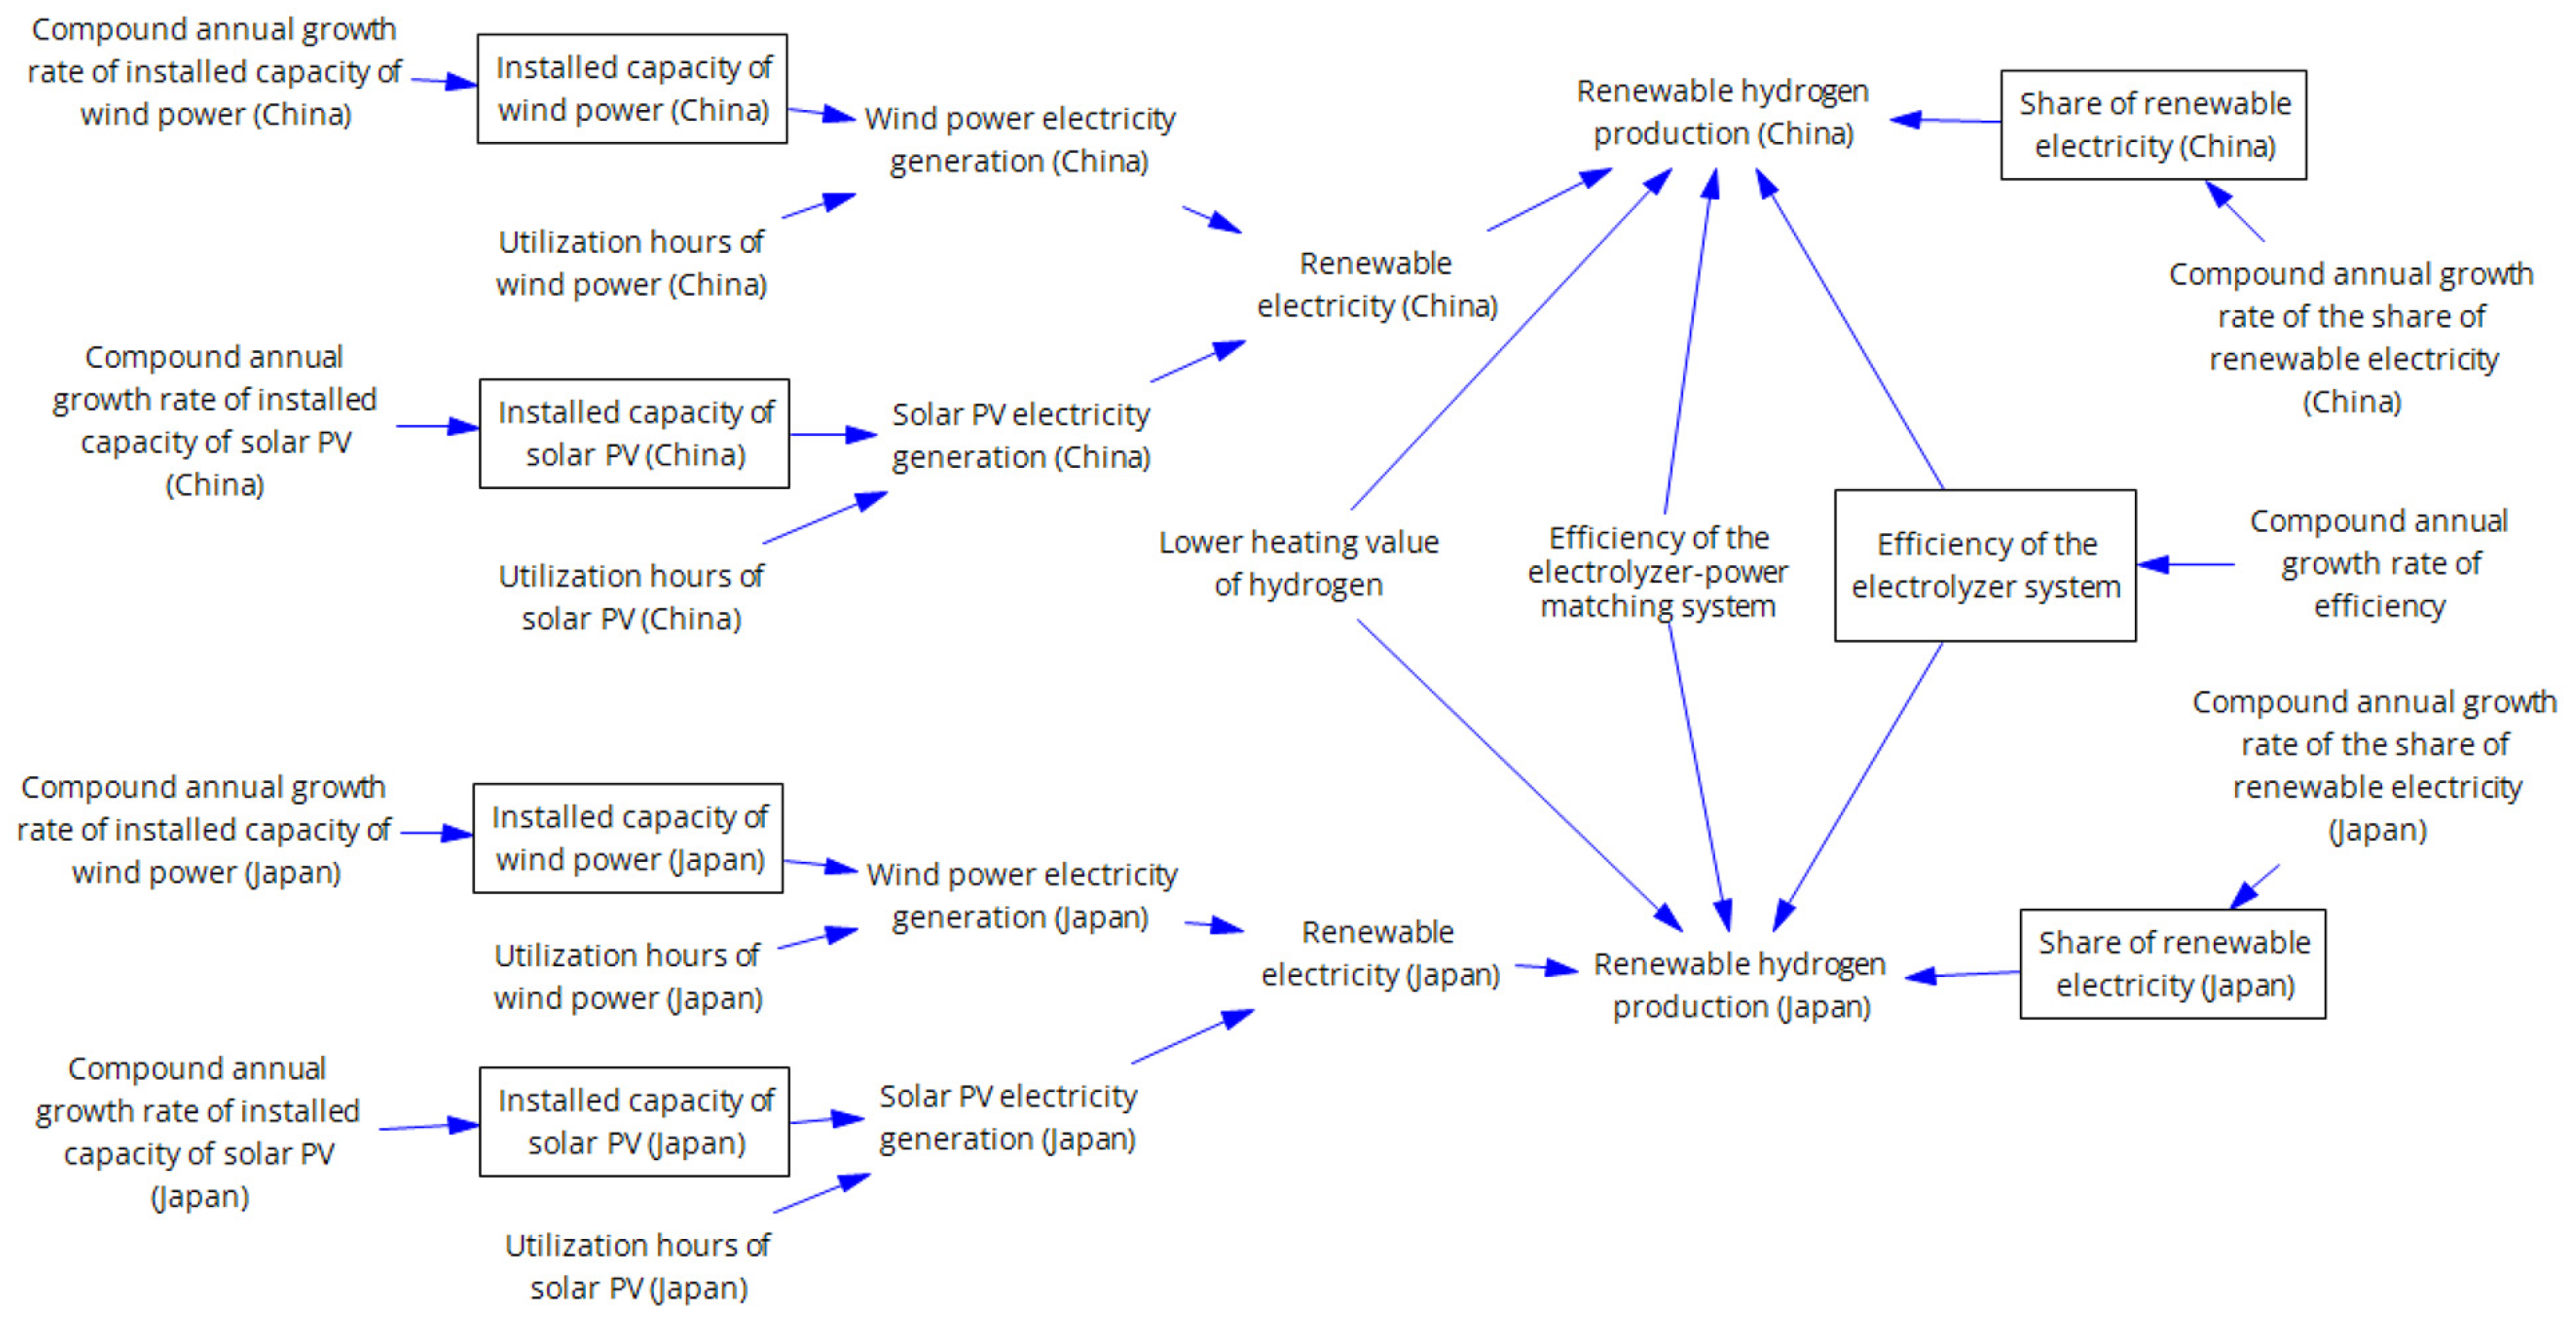
The overview of the relationships among renewable hydrogen metrics in China and Japan is shown in Figure 1.

3.2. Methodology for Analyzing the Economics of Renewable Hydrogen

For economics, this study compares the economics of producing renewable hydrogen in China and in Japan. This study assumes that a single PEM electrolyzer has a capacity of 1 MW, producing hydrogen at a rate of 200 Nm3/h (approximately 18 kg/h). A renewable hydrogen plant typically uses multiple electrolyzers. For example, the green ammonia plant in Da’an, Jilin Province, China, which uses renewable hydrogen, operates 50 PEM electrolyzers, each with a capacity of 200 Nm3/h, along with 39 ALK electrolyzers [41]. The full-load hours (FLH) of the PEM electrolyzer are assumed to be 2200 h for China and 1850 h for Japan [34], based on the on-grid utilization hours of wind power in each country. If solar PV is used, the full-load hours of the PEM electrolyzer are assumed to be 1200 h for China and 1250 h for Japan. According to data from REI, the utilization hours of solar PV in Japan were close to 1250 h in 2023 and 2024 [35]. The levelized cost of hydrogen is defined in Equation (3).
L C O H = P V C A P E X + P V O P E X P V H
where P V C A P E X is the present value of capital expenditure (CAPEX), P V O P E X is the present value of operational expenditure (OPEX), and P V H is the present value of hydrogen production.
The present value of CAPEX is defined in Equation (4).
P V C A P E X = C 0 + C s t a c k , 7 ( 1 + r ) 7 + C s t a c k , 14 ( 1 + r ) 14
where C 0 is the capital cost in year 0, C s t a c k , 7 is the stack replacement cost in year 7, C s t a c k , 14 is the stack replacement cost in year 14, and r is the discount rate, which is set as 6% in this study.
C 0 is defined in Equation (5).
C 0 = C s t a c k , 0 + C n o n s t a c k
where C s t a c k , 0 is the stack cost in year 0, and C n o n s t a c k is the non-stack cost in year 0. The World Bank estimates that the complete Chinese PEM system costs 700–1000 USD/kW [42]. This study adopts 850 USD/kW as the PEM electrolyzer system cost for China in 2025. Assuming that the stack and non-stack costs account for 45% and 55% of the total system, respectively, C s t a c k , 0 is 382.5 USD/kW, and C n o n s t a c k is 467.5 USD/kW. For Japan, the 2025 target PEM electrolyzer system cost set by Hitachi Zosen is 250,000 JPY/kW (approximately 1656 USD/kw). Using the same 45%/55% split for stack and non-stack costs, C s t a c k , 0 is 745 USD/kW, and C n o n s t a c k is 911 USD/kW.
The cost of stack in year t is defined in Equation (6).
C s t a c k , t = C s t a c k , 0 ( P R ) n t
where P R is the progress ratio, and n t is the number of doublings by year t .
P R is defined in Equation (7).
P R = 1 L R
where L R is the learning rate of the whole industry, which is set as 20% in this study.
n t is defined in Equation (8).
n t = log 2 ( Q t Q 0 )
where Q t is the cumulative hydrogen production capacity in year t , and Q 0 is the hydrogen production capacity in year 0.
Q t is defined in Equation (9).
Q t = Q 0 ( 1 + g ) t
where g is the growth rate of cumulative deployment of hydrogen production capacity, which is set as 25% in this study.
The present value of OPEX is defined in Equation (10).
P V O P E X = t = 1 20 O P E X t ( 1 + r ) t
where O P E X t is the operational cost in year t .
O P E X t is defined in Equation (11).
O P E X t = P e , t H t E C t + f C 0
where P e , t is the electricity price in year t , H t is the hydrogen production in year t , E C t is the electricity needed to produce 1 kg of hydrogen in year t , and f is the fixed operation and maintenance (O&M) fraction, which is set as 3% in this study. According to Wood Mackenzie, the levelized cost of electricity (LCOE) of onshore wind and utility-scale PV in China will be 0.025 USD/kWh and 0.027 USD/kWh by 2025 [43]. For Japan, the LCOE of onshore wind and utility-scale PV is 12.1 JPY/kWh (approximately 0.08 USD/kWh) and 10.0 JPY/kWh (approximately 0.066 USD/kWh), based on the 2023 value reported by METI [44]. For the LCOE of utility-scale PV, it will be 0.027 USD/kWh in China and Japan, respectively, by 2025. These values are adopted as the electricity price P e , t in this study. E C t is assumed to be 51 kWh/kg H2 for the system, based on the study by DOE [45]. This study assumes that both P e , t and E C t remain constant over the project lifetime. The water cost is considered negligible per kilogram of hydrogen and is therefore not included in the calculations in this study.
The present value of hydrogen production is defined in Equation (12).
P V H = t = 1 20 H t ( 1 + r ) t
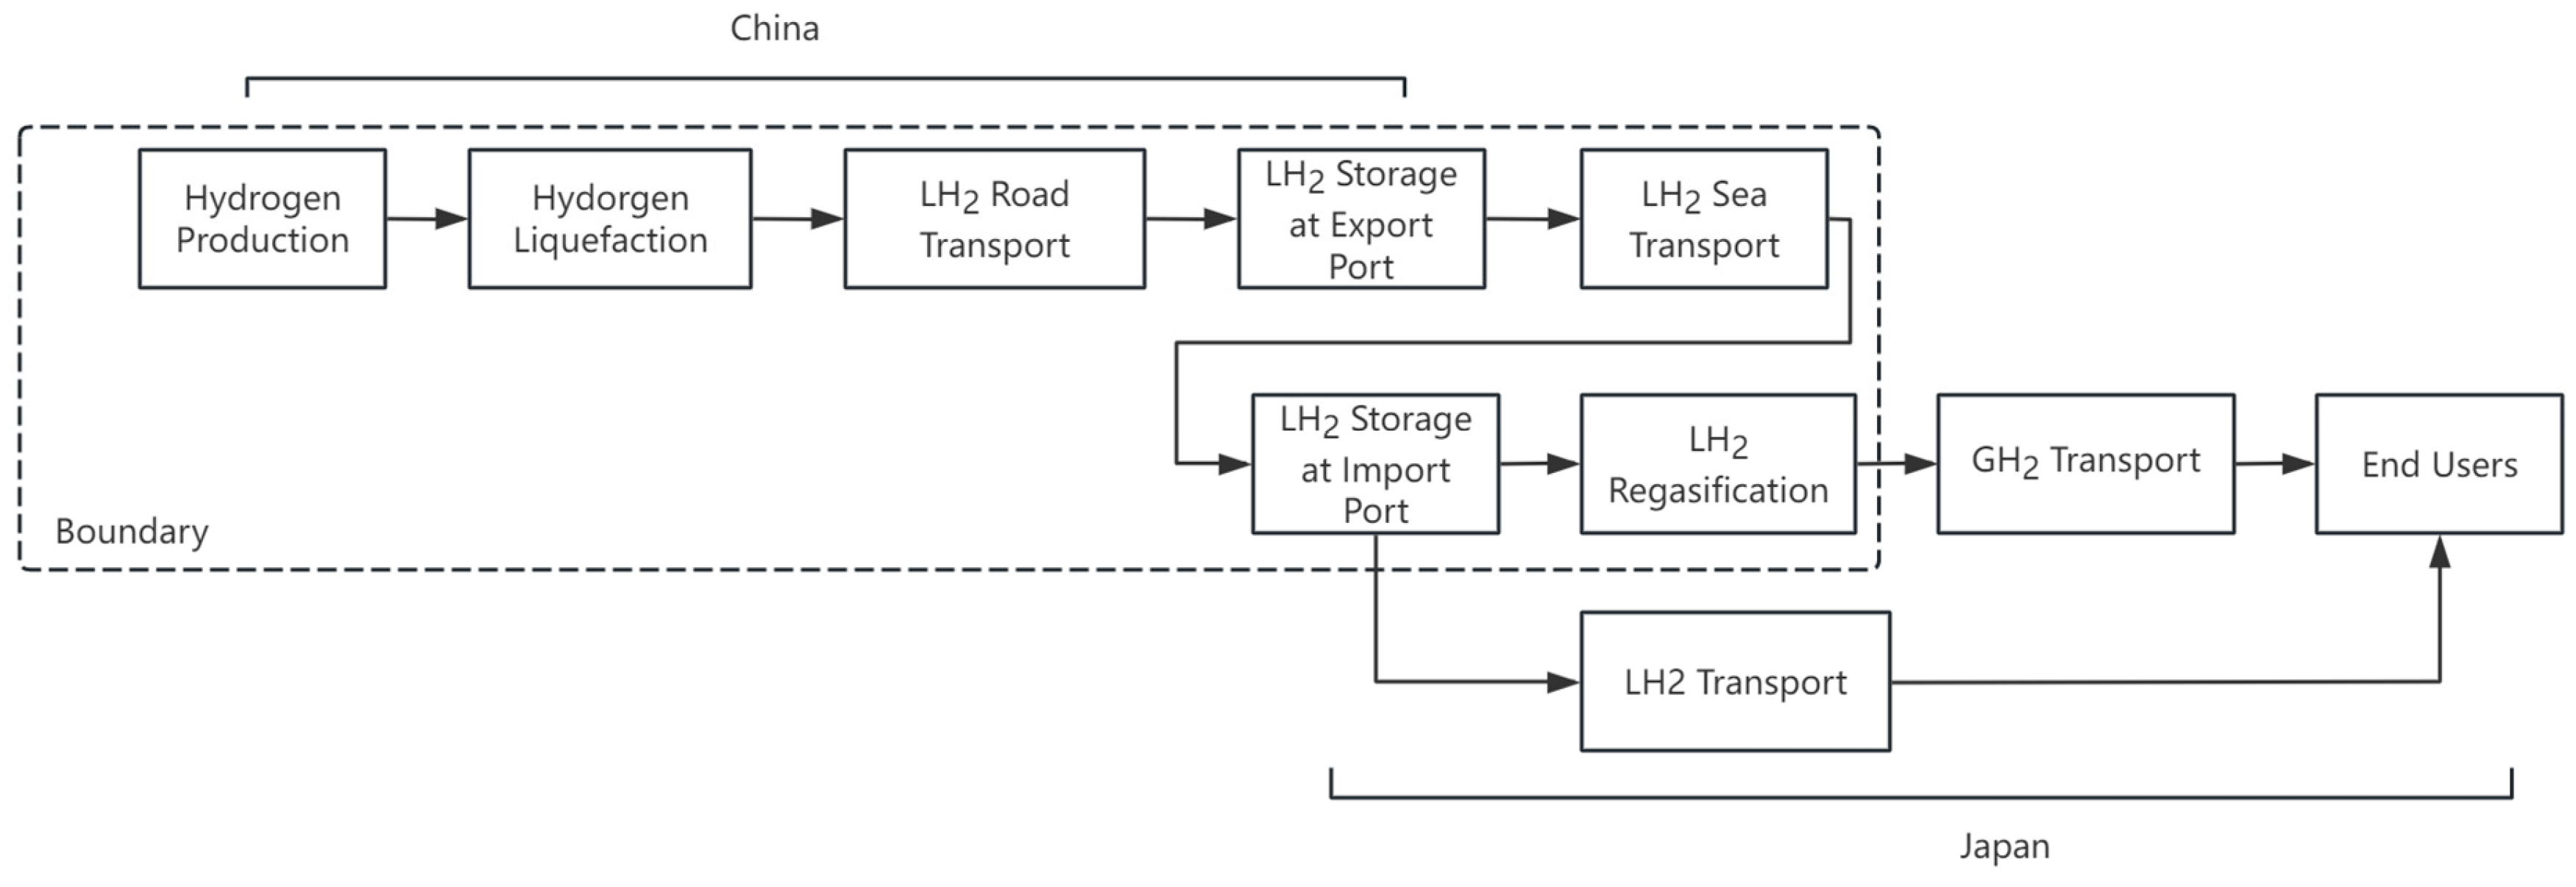
After the calculation of the LCOH, a case study is carried out to compare the cost of renewable hydrogen produced in China and exported to Japan (Chifeng–Dalian–Kobe) in the form of LH2 with the cost of renewable hydrogen produced domestically in Japan. Since most end users use gaseous hydrogen (GH2), the regasification stage is included as well. The case study boundary is shown in Figure 2. It should be noted that there is an LH2 storage facility at Kobe Port, but there is currently no LH2 storage facility at Dalian Port. To enable regular LH2 exports, it will be necessary to construct LH2 storage facilities at the export port in the future.

3.3. Methodology for Analyzing GHG Emissions of Renewable Hydrogen

For the environment, this study analyzes whether the GHG emissions of renewable hydrogen produced in China and exported to Japan meet the requirements of the 3.4 kg CO2-eq/kg H2 threshold defined in Japan’s Hydrogen Society Promotion Act in 2024. The boundary for calculating GHG emissions is consistent with the boundary shown in Figure 2. The total GHG emissions and related details are defined in Equation (13).
E m t o t a l = E m p r o d + E m l i q + E m r o a d + E m s t o r , C h i n a + E m s e a + E m s t o r , J a p a n + E m r e g a s E m p r o d = E l e c p r o d · E F e , C h i n a E m l i q = E l e c l i q · E F e , C h i n a E m r o a d = D r o a d · E F r o a d E m s e a = D s e a · E F s e a E m r e g a s = E l e c r e g a s · E F e , J a p a n
where E m t o t a l is the total GHG emissions, E m p r o d is the GHG emissions from renewable hydrogen production, E m l i q is the GHG emissions from the liquefaction of hydrogen, E m s t o r , C h i n a is the GHG emissions from LH2 storage in China, E m r o a d is the GHG emissions from road transport, E m s e a is the GHG emissions from sea transport, E m s t o r , J a p a n is the GHG emissions from LH2 storage in Japan, E m r e g a s is the GHG emissions from the process of regasification, E l e c p r o d is the electricity needed for water electrolysis, E F e , C h i n a is the emission factor of electricity in China, E l e c l i q is the electricity needed to liquefy hydrogen, D r o a d is the road distance, E F r o a d is the emission factor for road transport, D s e a is the sea distance, E F s e a is the emission factor for sea transport, E l e c r e g a s is the electricity needed for hydrogen regasification, and E F e , J a p a n is the emission factor of electricity in Japan.
For LH2 storage, the existing Hy touch Kobe LH2 storage facility at Kobe Port is taken as an example. Hy touch Kobe is a spherical LH2 storage tank, with a capacity of 2250 m3 [46]. Since the tank is highly insulated, no external energy is required to maintain the low temperature. However, boil-off gas (BOG) is still generated, although the boil-off rate (BOR) of the tank is only 0.06% per day [47]. The BOG from the tank is stored in a BOG holder for future use. Since the BOG is not reliquefied, liquefaction is not considered as part of the storage process. Therefore, this study only considers the GHG emissions associated with the electricity needed to compress BOG from 0.1 MPa to 2.5 MPa into the BOG holder, based on data from Schiaroli et al. [48]. The electricity required to compress 1 kg of BOG is calculated using Equation (14), following the equation provided by the Clean and Low-Carbon Hydrogen Evaluation Standard (Draft for Comments). This method is applied to both China and Japan.
E l e c c m p = n · R · T · ( ln P 2 ln P 1 ) 3.6 × 10 6 · η c m p
where E l e c c m p is the electricity required to compress BOG (kWh), n is the number of moles of hydrogen per 1 kg (value: 500 mol), R is the gas constant (value: 8.314 J/(mol·K)), T is the gas temperature (value: 293.15 K), P1 is the pressure before compression (Pa), P2 is the pressure after compression (Pa), and η c m p is the compressor efficiency (value: 85%).
Therefore, the GHG emissions from LH2 storage in China and Japan are defined in Equation (15).
E m s t o r , C h i n a = E l e c c m p · E F e , C h i n a E m s t o r , J a p a n = E l e c c m p · E F e , J a p a n
For the sea transport of LH2, the world’s first LH2 transport ship, Suiso Frontier, is taken as an example. Suiso Frontier is powered by diesel–electric propulsion, and LH2 is stored in an insulated tank. In other words, Suiso Frontier is powered by diesel rather than hydrogen, despite transporting LH2. The BOR of the tank is only 0.3% per day, which is higher than that of the Hy touch Kobe facility, but remaining very low [47]. The BOG is not reliquefied, so liquefaction is not considered for shipping either. Due to the lack of public data on the emissions of Suiso Frontier, this study uses the average emission factor for container ships, 0.01612 kg CO2-eq/ton-km, as published by the UK government [49].
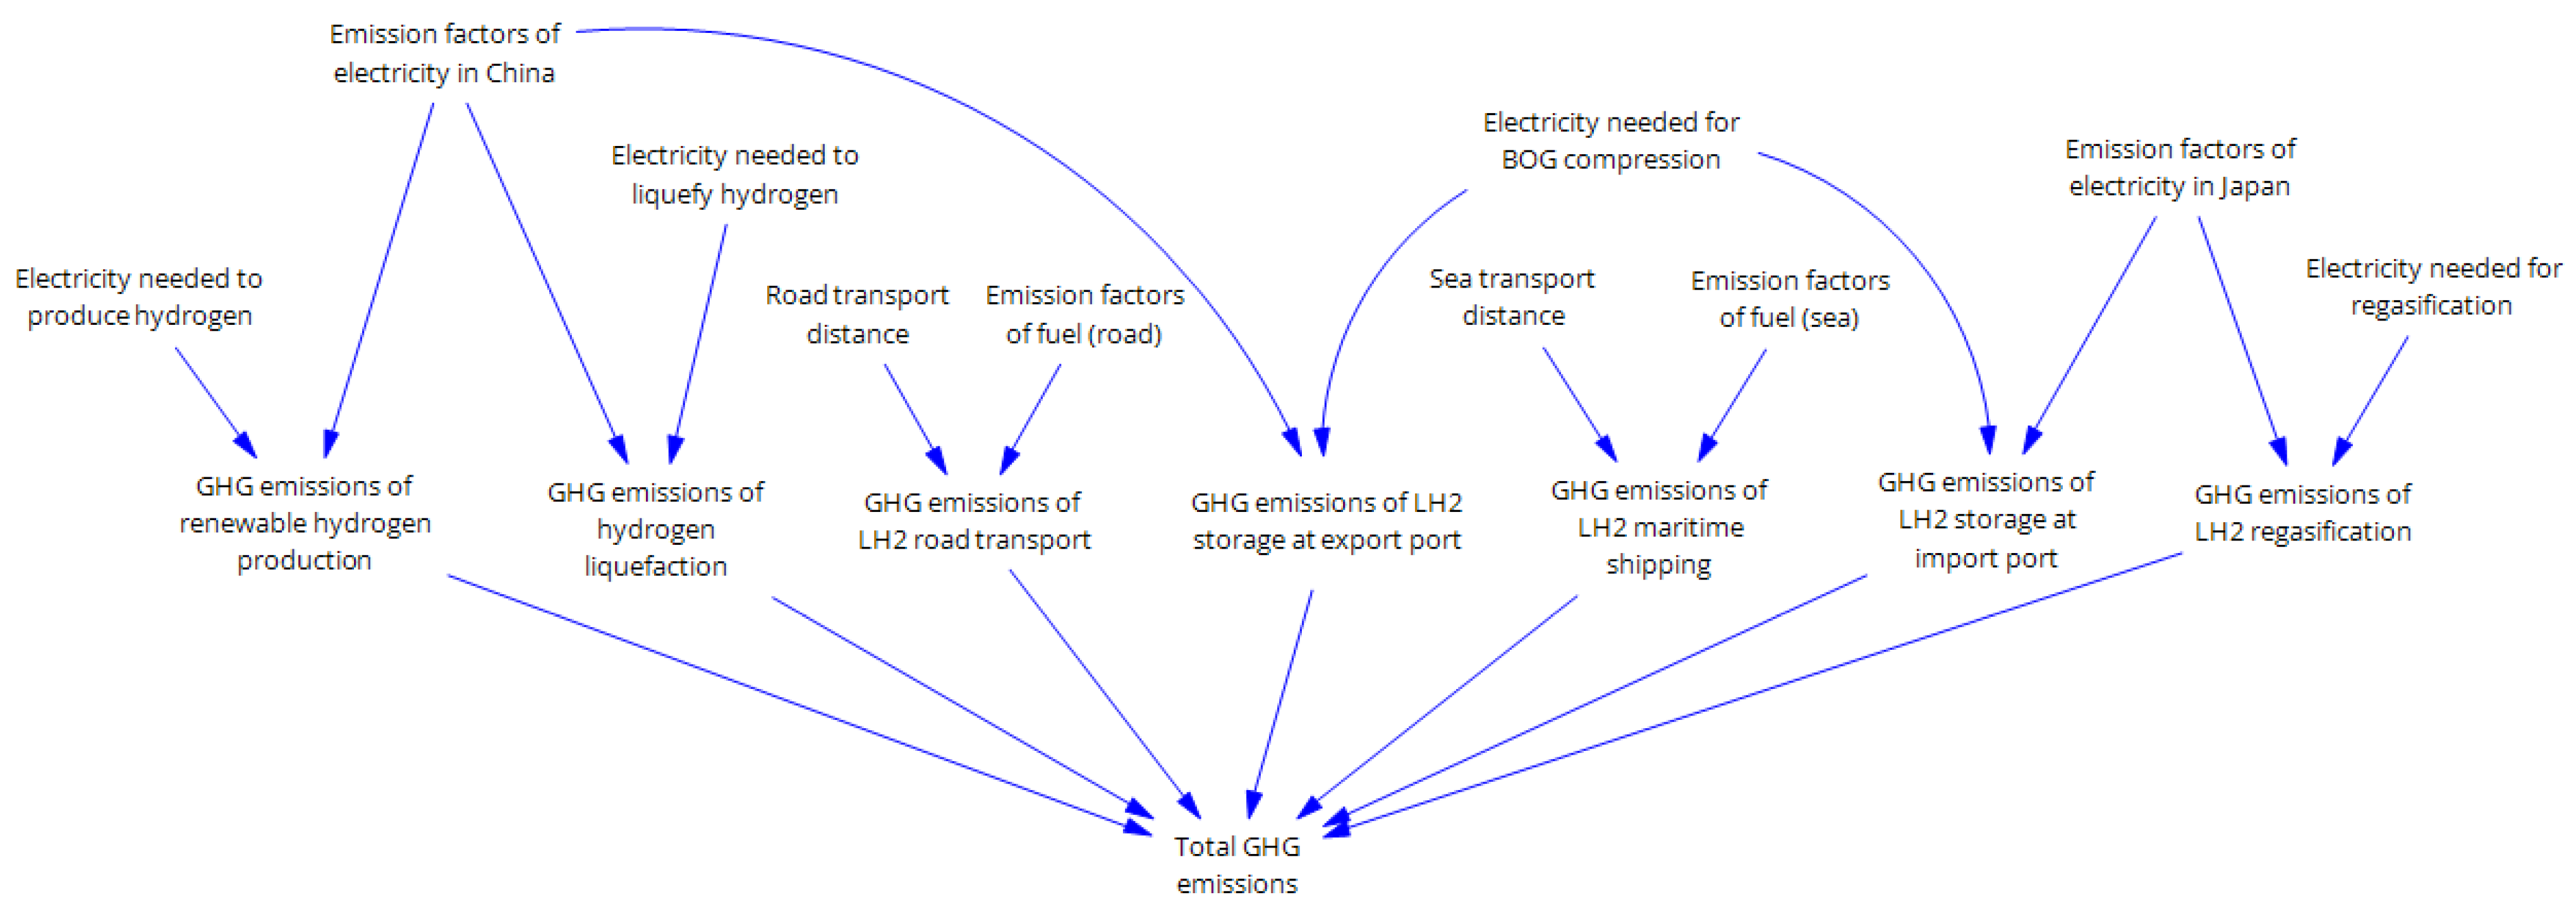
The overview of the relationships among GHG emission metrics within the case study boundary is shown in Figure 3.

4. Results

4.1. The Renewable Hydrogen Production Potential

Based on the calculations using the methodology in this study, China’s renewable hydrogen production potential is estimated at 12 Mt/year by 2035, while Japan’s is 0.5 Mt/year by 2035 for the base case (as shown in Table 4).
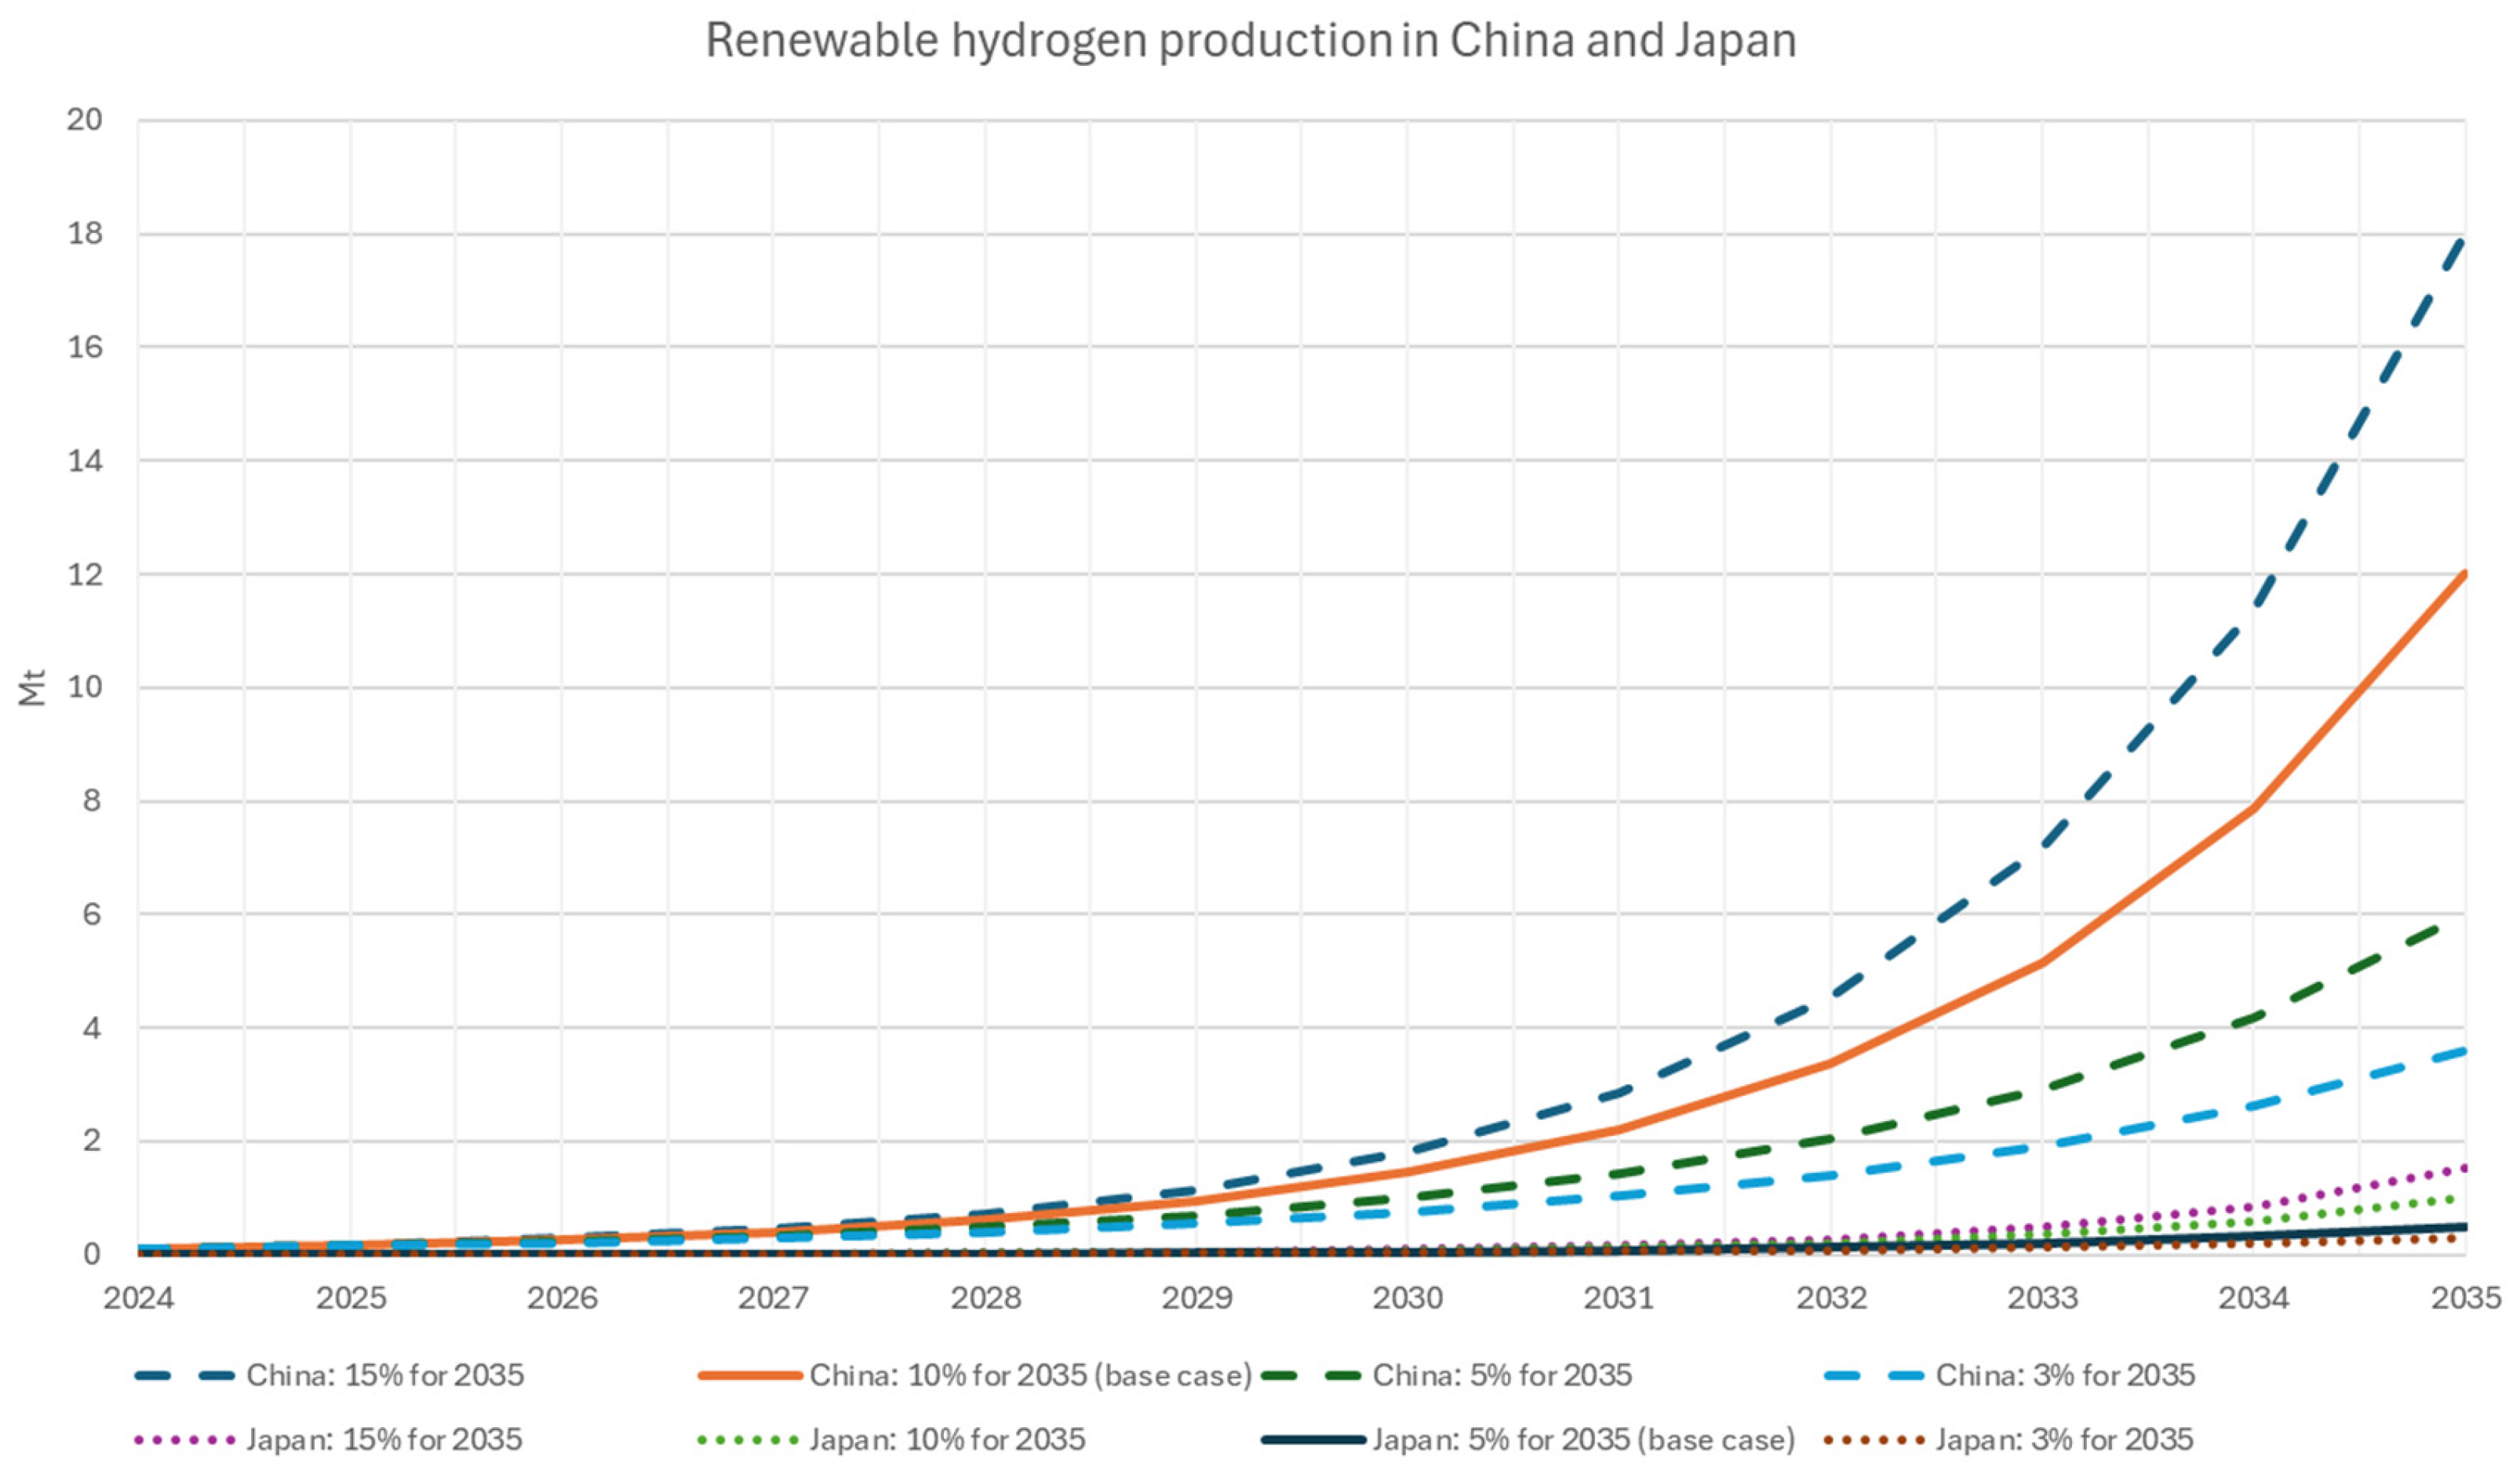
Since the percentage of renewable electricity used to produce hydrogen is uncertain, this study carried out the sensitivity analysis based on different scenarios. Percentages of 3%, 5%, 10%, and 15% for 2035 are simulated for China and Japan. The results are shown in Figure 4 and Table 5.
Based on the results shown in Table 5, in the base case, China’s renewable hydrogen production in 2030 is nearly 50% of Japan’s 2030 target for total hydrogen consumption (3 Mt/year), while China’s renewable hydrogen production in 2035 reaches Japan’s 2040 target (12 Mt/year). There is no official consumption target for 2035 in Japan. Assuming the 2035 hydrogen consumption is the average of the 2030 target and the 2040 target, the hydrogen consumption in 2035 in Japan is calculated to be 8 Mt/year. Moreover, Japan’s renewable hydrogen production remains very limited compared to its demand targets, accounting for only about 6% of the assumed target (8 Mt/year) in 2035 in the base case. In other words, if Japan seeks to accelerate the decarbonization of hard-to-abate sectors through renewable hydrogen, most of this hydrogen will need to be imported. Japan is also considering importing blue hydrogen (i.e., fossil-fuel-based hydrogen with carbon capture), but imported renewable hydrogen would result in lower carbon emissions, all other parameters being equal. China’s renewable hydrogen production will be used to meet its domestic demand first, but since China’s renewable hydrogen production potential is so large and China has abundant renewable energy sources, as shown in Table 5, it also has considerable export potential. It should also be noted that China’s national target of 3600 GW for total wind and solar power capacity by 2035 is relatively conservative, as China often achieves its targets earlier than projected. In summary, if Japan plans to import renewable hydrogen from China, China has the capacity to export renewable hydrogen to Japan.

4.2. Economics of Renewable Hydrogen

The LCOH using onshore wind in China and Japan is calculated to be 4.27 USD/kg H2 and 11.01 USD/kg H2, respectively. For the utility-scale PV case, the LCOH in China and Japan is calculated to be 6.86 USD/kg H2 and 13.62 USD/kg H2. The LCOH for the onshore wind case is lower than that for the utility-scale PV case, mainly due to the low utilization hours of solar PV. In these cases, the LCOH in Japan is approximately 2.0–2.6 times that in China. Key assumptions and the LCOH for PEM projects in China and Japan in 2025 are shown in Table 6.
A sensitivity analysis of the LCOH using onshore wind in China and Japan is presented in Table 7. In both China and Japan, the LCOH is most sensitive to the electrolyzer system cost, followed by the full-load hours of the PEM electrolyzer and the LCOE. Therefore, it is important to reduce the cost of the PEM system and increase the full-load hours of the PEM electrolyzer to achieve lower LCOH.
The transport cost of hydrogen from China to Japan should also be taken into account. In this study, the following case is used as an example: renewable hydrogen is assumed to be produced and liquefied in an industrial park in Chifeng City, Inner Mongolia; transported to Dalian Port Liaoning Province by LH2 trucks; and then shipped from Dalian Port to Kobe Port, Japan, by LH2 tanker ship.
The transport distance from Chifeng to Dalian Port is around 650 km. The levelized cost of hydrogen transport (LCOT) for liquid hydrogen trucks (including liquefaction and other logistics) is estimated at 10.16 CNY/ton-km (approximately 1.41 USD/ton-km) for a transport distance of 800 km [51]. For 650 km, it is about 12 CNY/ton-km (approximately 1.67 USD/ton-km). Using this value, the transport cost from Chifeng to Dalian Port is calculated to be 1.08 USD/kg H2.
For LH2 storage, Burke et al. report that the levelized cost of hydrogen storage for LH2 is 0.055–0.091 USD/kg H2 if LH2 is stored for one week [52]. An average value of 0.073 USD/kg H2 is applied to LH2 storage at Dalian Port and Kobe Port.
For sea transport, Singh and Viswanathan report that the LCOT of LH2 shipping is 0.272 USD/kg for short routes (≤2500 NM, approximately 4630 km) [53]. The distance from Dalian to Kobe is approximately 1640 km, as calculated by the SEARATES calculator. Since the distance of 1640 km is within the short-route range (≤4630 km), this study adopts 0.272 USD/kg as the shipping cost of LH2 from Dalian to Kobe. The regasification cost at Kobe is taken as 0.74 USD/kg H2, as reported by Incer-Valverde et al. for the levelized cost of regasification [54].
The total cost of hydrogen produced in Chifeng and exported to Kobe in the form of liquid hydrogen is 6.51 USD/kg H2, which is still much lower than 11.01 USD/kg H2, as shown in Table 8.

4.3. GHG Emissions for Renewable Hydrogen Produced in China and Exported to Japan

For renewable hydrogen production, the electricity requirement for the PEM electrolyzer system is assumed to be 51 kWh/kg H2, consistent with the assumption in Section 3.2. When powered by solar PV, with a carbon footprint factor of 0.052 kg CO2-eq/kWh [55], the emissions are 2.652 kg CO2-eq/ kg H2. When powered by wind, with a carbon footprint factor of 0.032 kg CO2-eq/kWh [55], the emissions are 1.632 kg CO2-eq/kg H2. In this study, the carbon footprint factors for solar and wind in China are also applied to Japan when renewable electricity is used for BOG compression and LH2 regasification.
For the liquefaction stage, this study assumes an electricity consumption of 13.8 kWh/kg H2 [56]. The national average carbon footprint factor of electricity in China in 2024 is 0.5777 kg CO2-eq/kWh [55]. Therefore, the GHG emissions for the liquefaction stage using grid electricity are 7.97 kg CO2-eq/kg H2. When powered by solar PV, the emissions are 0.72 kg CO2-eq/ kg H2. When powered by wind, the emissions are 0.44 kg CO2-eq/kg H2.
For LH2 storage, only the GHG emissions from BOG compression are considered, as described in Section 3.3. The electricity required to compress 1 kg of BOG from 0.1 MPa to 2.5 MPa is calculated to be 1.28 kWh. The GHG emissions of BOG compression at Dalian Port are 0.74 kg CO2-eq/kg H2 when using grid electricity, while at Kobe Port, they are 0.57 kg CO2-eq/kg H2. This study uses Japan’s grid electricity emission factor of 0.448 kg CO2-eq/kWh from ABB’s 2025 Electricity Emission Factors (based on IEA data) [57]. The GHG emissions from BOG compression are 0.067 kg CO2-eq/kg when using solar PV and 0.041 kg CO2-eq/kg when using wind power, and these are applied to both Dalian Port and Kobe Port.
The emission factor for road transport is set at 0.057 kg CO2-eq/ton-km for diesel heavy-duty trucks transporting liquid hydrogen, based on emissions factors provided in the Clean and Low-Carbon Hydrogen Evaluation Standard (Draft for Comments). For a road transport distance of 650 km, this results in emissions of 0.037 kg CO2-eq/kg H2.
The emissions from sea transport are calculated to be 0.026 kg CO2-eq/kg H2 over a distance of 1640 km, based on the assumptions in Section 3.3.
For the regasification of liquid hydrogen, electricity consumption is set at 0.85 kWh/kg H2, the midpoint of the range of 0.03–1.665 kWh/kg H2 reported by Fraunhofer ISI [58]. The emissions for the regasification stage are calculated to be 0.38 kg CO2-eq/ kg H2 when using Japan’s grid electricity, 0.044 kg CO2-eq/kg H2 when using solar PV, and 0.027 kg CO2-eq/kg H2 when using wind power.
These results are shown in Table 9. If grid electricity is used for liquefaction, the total GHG emissions of renewable hydrogen produced from solar PV in China and exported to Japan in the form of liquid hydrogen are 12.37 kg CO2-eq/ kg H2 (case 1), failing to meet Japan’s low-carbon hydrogen threshold. When wind power is used for liquefaction and other processes that consume electricity, the total emissions drop to 2.24 kg CO2-eq/kg H2 (case 8), complying with Japan’s low-carbon hydrogen threshold. When wind power is used for liquefaction and Japan’s grid electricity is used for BOG compression and LH2 regasification at Kobe, the total emissions are 3.12 kg CO2-eq/kg H2 (case 6), still meeting Japan’s low-carbon hydrogen threshold. When solar PV is used for liquefaction and other processes that consume electricity, the total emissions are 3.61 kg CO2-eq/ kg H2 (Case 7), slightly above Japan’s low-carbon hydrogen threshold.
Since hydrogen liquefaction consumes a tremendous amount of energy, a sensitivity analysis of liquefaction is conducted, and the results are presented in Table 10. When the electricity required for hydrogen liquefaction is reduced to 9.66 kWh, the total emissions are 3.39 kg CO2-eq/ kg H2 if solar PV is used for liquefaction and other processes that consume electricity (Case 7, as shown in Table 10), also meeting Japan’s low-carbon hydrogen threshold.

5. Discussion

There is significant potential for cooperation between China and Japan, as renewable hydrogen produced in China is abundant, economically viable, and capable of meeting Japan’s low-carbon hydrogen threshold. In the case study, the focus is on the transport of LH2 from China to Japan, as LH2 has the advantage of high purity, and Japanese companies are actively pursuing its import. However, Chinese policymakers and companies have not paid sufficient attention to the potential for exporting LH2, and the existing infrastructure is quite limited. Both Chinese and Japanese companies should collaborate to explore the possibility of exporting LH2 from China to Japan. If demand is secured, infrastructures, such as LH2 storage facilities at Dalian Port, should be constructed.
In addition to exporting renewable hydrogen and its derivatives, China also has a vast domestic market. Chinese and Japanese companies can cooperate to explore opportunities in China’s domestic market as well. For example, the Japanese company Toyota Motor Corporation, headquartered in Toyota City, and five Chinese companies established an R&D joint venture for commercial vehicle fuel cell systems in 2020 [59]. Toyota and the Chinese company SinoHytec, headquartered in Beijing, also established a joint venture to produce fuel cell systems in 2021 [60]. Beyond the Chinese market, Chinese and Japanese companies can also work together to explore opportunities in other regions, such as Southeast Asia and the Middle East.
The cost of renewable hydrogen remains high, especially in Japan, due to the high cost of electrolyzers and electricity. This is a key challenge for the development of renewable hydrogen in both countries. However, it also creates opportunities for cooperation between Chinese and Japanese companies to work together to drive the cost down. Chinese and Japanese companies can collaborate on production, transportation, and utilization technologies through establishing joint ventures, while also exploring markets in Japan, China and other regions. Although some companies have already taken action, these cases are still very limited, and the potential for further cooperation remains substantial.
Regarding the standards for and certification of renewable hydrogen, there is still a long way to go in aligning China and Japan, as the two countries have different standards, and neither has established a national certification system. This is also one of the challenges that should be addressed between the two countries. For the export of China’s renewable hydrogen or its derivatives to Japan, when the traded volume is small, the chain-of-custody identity preserved or segregation models are recommended to ensure the green attributes of the product. In other words, the products should be transported separately or should only be mixed with equally certified products under the same standards. However, when the traded volume increases, the chain-of-custody models of controlled blending or mass balance should be considered, under which certified and non-certified products may be physically blended at a fixed ratio or allocated on the basis of an accounting system. The Book & Claim model across national borders should be considered only when a robust system is in place to ensure that the risk of double accounting can be avoided. In the absence of an official agreement between the two countries, companies exporting renewable hydrogen or its derivatives from China to Japan should adhere to the identity preserved or segregation model.
This study has several limitations. The share of renewable electricity used for hydrogen production is highly uncertain, depending on factors such as demand, global net-zero ambitions and geopolitical situations. Estimates of the cost of transporting LH2 from China to Japan are primarily based on literature data, and GHG emissions are calculated using simplified assumptions, due to limited data regarding LH2 exports. Geopolitical factors, which are not analyzed in this study, also present significant challenges to China–Japan cooperation involving renewable hydrogen. Despite these limitations, the potential for exporting hydrogen and its derivatives, including LH2, from China to Japan is substantial and deserves greater attention from both policymakers and companies in the two countries.

6. Conclusions

Japan is advancing towards a hydrogen-based society, while China is promoting the development of renewable hydrogen and its derivatives. There are significant opportunities for cooperation between China and Japan regarding renewable hydrogen, as supported by the findings of this study.
For safety considerations, China has relaxed its regulations for renewable hydrogen production and begun to establish its comprehensive standards system, while Japan has introduced its hydrogen safety strategy to harmonize regulations and promote a hydrogen-based society.
From the energy security perspective, Japan’s domestic renewable hydrogen production cannot meet its demand targets, whereas China has the capacity to supply renewable hydrogen to Japan.
From the economic perspective, China has a significant advantage in producing renewable hydrogen at a lower cost compared to that incurred by Japan. Renewable hydrogen produced in China via PEM technology and transported to Japan (Chifeng–Dalian–Kobe) in the form of LH2 is more cost-effective than hydrogen domestically produced in Japan.
From the environmental perspective, renewable hydrogen produced in China using wind power and exported to Japan as LH2 can readily meet Japan’s low-carbon hydrogen standard requirement.
While there are geopolitical concerns, Chinese and Japanese companies can play an active role by cooperating across the hydrogen value chain to reduce costs and explore the markets in Japan, China and other regions. To secure climate benefits, the coordination of standards and certification systems between the two countries needs to be addressed.

Author Contributions

Z.R.: Writing—original draft, Methodology, Formal Analysis, Conceptualization. W.Z.: Writing—Review and editing, Supervision. All authors have read and agreed to the published version of the manuscript.

Funding

This research received no external funding.

Data Availability Statement

Data are contained within the article. The original contributions presented in this study are included in the article. Further inquiries can be directed to the corresponding author.

Conflicts of Interest

The authors declare no conflict of interest.

References

  1. Karmaker, S.C.; Chapman, A.J.; Sen, K.K.; Saha, B.B. Electrification or Hydrogen? A strategic pathway for Japan’s energy transition. Int. J. Hydrogen Energy 2026, 201, 152989. [Google Scholar] [CrossRef]
  2. National Energy Administration; Guoneng Qingchuang Technology. China Hydrogen Energy Development Report 2025; People’s Daily Press: Beijing, China, 2025. (In Chinese)
  3. METI. The Current Domestic and International Situation Surrounding Hydrogen and the Status of Hydrogen Policy. Available online: https://www.meti.go.jp/shingikai/sankoshin/green_innovation/energy_structure/pdf/024_04_00.pdf (accessed on 29 December 2025). (In Japanese)
  4. The Ministerial Council on Renewable Energy, Hydrogen and Related Issues. Basic Hydrogen Strategy; METI: Tokyo, Japan, 2023. Available online: https://www.meti.go.jp/shingikai/enecho/shoene_shinene/suiso_seisaku/pdf/20230606_5.pdf (accessed on 29 December 2025).
  5. Manley, D.K.; Hines, V.A.; Jordan, M.W.; Stoltz, R.E. A survey of energy policy priorities in the United States: Energy supply security, economics, and the environment. Energy Policy 2013, 60, 687–696. [Google Scholar] [CrossRef]
  6. Standing Committee of the National People’s Congress. Law of the People’s Republic of China on Safe Management of Hazardous Chemicals; The National People’s Congress of the People’s Republic of China: Beijing, China, 2025. Available online: http://www.npc.gov.cn/c2/c30834/202512/t20251227_450708.html (accessed on 29 December 2025). (In Chinese)
  7. National Standardization Administration of China; National Development and Reform Commission; Ministry of Industry and Information Technology; Ministry of Ecology and Environment; Ministry of Emergency Management; National Energy Administration. Guidelines for the Development of a Hydrogen Energy Industry Standard System; The Central People’s Government of the People’s Republic of China: Beijing, China, 2023. (In Chinese)
  8. METI. Hydrogen Safety Portal Website Launched. Available online: https://www.meti.go.jp/english/press/2023/0630_002.html (accessed on 12 April 2026).
  9. Liu, W.; Wan, Y.; Xiong, Y.; Liu, J. Outlook of low-carbon and clean hydrogen in China under the goal of “carbon peak and neutrality”. Energy Storage Sci. Technol. 2022, 11, 635–642. [Google Scholar] [CrossRef]
  10. Li, T.; Liu, W.; Wang, Z.; Wan, Y.; Zhang, M.; Zhang, Y.; Li, J.; Zhang, L. China’s Green Hydrogen New Era: A 2030 Renewable Hydrogen 100 GW Roadmap; Rocky Mountain Institute (RMI); China Hydrogen Alliance Research Institute: Beijing, China, 2022. (In Chinese) [Google Scholar]
  11. Li, J.; Wei, Y.-M.; Liu, L. Hydrogen production potential from wind power in China by 2060. Resour. Conserv. Recycl. 2025, 222, 108492. [Google Scholar] [CrossRef]
  12. Song, S.; Lin, H.; Sherman, P.; Yang, X.; Nielsen, C.P.; Chen, X.; McElroy, M.B. Production of hydrogen from offshore wind in China and cost-competitive supply to Japan. Nat. Commun. 2021, 12, 6953. [Google Scholar] [CrossRef]
  13. Kikuchi, Y.; Ichikawa, T.; Sugiyama, M.; Koyama, M. Battery-assisted low-cost hydrogen production from solar energy: Rational target setting for future technology systems. Int. J. Hydrogen Energy 2019, 44, 1451–1465. [Google Scholar] [CrossRef]
  14. Internal Revenue Service. Yearly Average Currency Exchange Rates. Available online: https://www.irs.gov/individuals/international-taxpayers/yearly-average-currency-exchange-rates (accessed on 12 December 2025).
  15. Zhu, P.; Mae, M.; Matsuhashi, R. Techno-Economic Analysis of Grid-Connected Hydrogen Production via Water Electrolysis. Energies 2024, 17, 1653. [Google Scholar] [CrossRef]
  16. Wang, Y.; Wen, C.; Tu, J.; Zhan, Z.; Zhang, B.; Liu, Q.; Zhang, Z.; Hu, H.; Liu, T. The multi-scenario projection of cost reduction in hydrogen production by proton exchange membrane (PEM) water electrolysis in the near future (2020–2060) of China. Fuel 2023, 354, 129409. [Google Scholar] [CrossRef]
  17. Man, J.; Ma, T.; Yu, Y.; Ren, H. Levelized costs and potential production of green hydrogen with wind and solar power in different provinces of mainland China. J. Renew. Sustain. Energy 2024, 16, 025902. [Google Scholar] [CrossRef]
  18. NEDO. Water Electrolysis Technology Development Roadmap (Explanatory Document); NEDO: Kawasaki, Japan, 2025. (In Japanese)
  19. Ajeeb, W.; Costa Neto, R.; Baptista, P. Life cycle assessment of green hydrogen production through electrolysis: A literature review. Sustain. Energy Technol. Assess. 2024, 69, 103923. [Google Scholar] [CrossRef]
  20. China Electricity Council. Clean and Low-Carbon Hydrogen Evaluation Standard (Draft for Comment). Available online: https://www.cec.org.cn/detail/index.html?3-345330 (accessed on 8 April 2026). (In Chinese)
  21. Chubu Area Hydrogen and Ammonia Social Implementation Promotion Council. Guidelines for the Implementation of the Chubu Area Low-Carbon Hydrogen Certification System; Chubu Area Hydrogen and Ammonia Social Implementation Promotion Council: Nagoya, Japan, 2025. (In Japanese) [Google Scholar]
  22. IRENA; RMI. Creating a Global Hydrogen Market: Certification to Enable Trade; IRENA: Abu Dhabi, United Arab Emirates, 2023; Available online: https://www.irena.org/-/media/Files/IRENA/Agency/Publication/2023/Jan/IRENA_Creating_a_global_hydrogen_market_2023.pdf (accessed on 13 April 2026).
  23. Cornelis, E. The True Face of Hydrogen; Environmental Coalition on Standards (ECOS): Brussels, Belgium, 2023. [Google Scholar]
  24. Gale, F.; Goodwin, D.; Lovell, H.; Murphy-Gregory, H.; Beasy, K.; Schoen, M. Renewable hydrogen standards, certifications, and labels: A state-of-the-art review from a sustainability systems governance perspective. Int. J. Hydrogen Energy 2024, 59, 654–667. [Google Scholar] [CrossRef]
  25. Marubeni Corporation. Marubeni Signs a Long-Term Offtake Agreement for Green Ammonia Produced in Inner Mongolia, China. Available online: https://www.marubeni.com/en/news/2025/info/00028.html (accessed on 13 April 2026).
  26. National Energy Administration. National Power Industry Statistics for 2024. Available online: https://www.nea.gov.cn/20250121/097bfd7c1cd3498897639857d86d5dac/c.html (accessed on 13 January 2026). (In Chinese)
  27. Zhang, Z.; Zhu, Z.; Lu, X.; Zhang, D.; Davidson, M.R. Ratcheting up wind and solar targets for decarbonizing the power sector in China and beyond. Cell Rep. Sustain. 2025, 2, 100389. [Google Scholar] [CrossRef]
  28. Lin, J.; Peng, L. Benchmarking China’s power system transition: Why China should set ambitious new goals for its share of non-fossil electricity generation. Next Energy 2025, 9, 100409. [Google Scholar] [CrossRef]
  29. United Nations Framework Convention on Climate Change. China’s 2035 National Determined Contributions; United Nations Framework Convention on Climate Change: Bonn, Germany, 2025. [Google Scholar]
  30. REI. Energy Transition Scenarios for Decarbonization Based on 80% Renewables Electricity by 2035; Renewable Energy Institute (REI): Tokyo, Japan, 2024. [Google Scholar]
  31. IRENA. Renewable Capacity Statistics 2025; International Renewable Energy Agency: Abu Dhabi, United Arab Emirates, 2025. [Google Scholar]
  32. REI. Proposal for the 2035 Energy Mix, 1st ed.; Renewable Energy Institute (REI): Tokyo, Japan, 2023. [Google Scholar]
  33. China Electricity Council. 2024–2025 National Electricity Supply and Demand Situation Analysis and Forecast Report; China Electricity Council: Beijing, China, 2025. (In Chinese) [Google Scholar]
  34. Watanabe, Y. IEA Wind TCP Japan 2023; IEA: Paris, France, 2024. [Google Scholar]
  35. REI. RE Trends in Japan. Available online: https://www.renewable-ei.org/en/statistics/re/ (accessed on 6 April 2026).
  36. Jung, C.; Nagel, L.; Schindler, D.; Grau, L. Fossil fuel reduction potential in Germany’s transport sector by wind-to-hydrogen. Int. J. Hydrogen Energy 2018, 43, 23161–23167. [Google Scholar] [CrossRef]
  37. Honnery, D.; Moriarty, P. Estimating global hydrogen production from wind. Int. J. Hydrogen Energy 2009, 34, 727–736. [Google Scholar] [CrossRef]
  38. Wang, C.R.; Stansberry, J.M.; Mukundan, R.; Chang, H.-M.J.; Kulkarni, D.; Park, A.M.; Plymill, A.B.; Firas, N.M.; Liu, C.P.; Lang, J.T.; et al. Proton Exchange Membrane (PEM) Water Electrolysis: Cell-Level Considerations for Gigawatt-Scale Deployment. Chem. Rev. 2025, 125, 1257–1302. [Google Scholar] [CrossRef] [PubMed]
  39. Energy Research Institute of Chinese Academy of Macroeconomic Research. China Energy Transformation Outlook 2023; Energy Research Institute of Chinese Academy of Macroeconomic Research: Beijing, China, 2023. (In Chinese) [Google Scholar]
  40. NEDO. Construction of One of the World’s Largest Renewable Energy-Powered Hydrogen Energy Systems Begins. Available online: https://www.nedo.go.jp/news/press/AA5_101007.html (accessed on 4 May 2026). (In Japanese)
  41. Nengyuan Zhiku. World’s Largest Green Hydrogen Ammonia Project Starts Production Today. Available online: https://finance.sina.com.cn/roll/2025-07-26/doc-infhuzhs1992164.shtml (accessed on 5 May 2026). (In Chinese)
  42. World Bank. Electrolyzers for Hydrogen Production: Technical and Economic Characteristics; The World Bank: Washington, DC, USA, 2026. [Google Scholar]
  43. Wood Mackenzie. Renewable Levelized Cost of Electricity Competitiveness Reaches New Milestone Across Global Markets in 2025. Available online: https://www.woodmac.com/press-releases/renewable-levelized-cost-of-electricity-competitiveness-reaches-new-milestone-across-global-markets-in-2025/ (accessed on 6 April 2026).
  44. METI. Summary of Power Generation Cost Verification; METI: Tokyo, Japan, 2025. (In Japanese) [Google Scholar]
  45. DOE. Technical Targets for Proton Exchange Membrane Electrolysis. Available online: https://www.energy.gov/eere/fuelcells/technical-targets-proton-exchange-membrane-electrolysis (accessed on 20 March 2026).
  46. Naquash, A.; Agarwal, N.; Lee, M. A Review on Liquid Hydrogen Storage: Current Status, Challenges and Future Directions. Sustainability 2024, 16, 8270. [Google Scholar] [CrossRef]
  47. Kawasaki Heavy Industries. Kawasaki Proves Excellent Thermal-insulation Performance for Liquefied Hydrogen Storage Tanks. Available online: https://global.kawasaki.com/en/corp/newsroom/news/detail/?f=20231211_8742 (accessed on 6 May 2026).
  48. Schiaroli, A.; Campari, A.; Paltrinieri, N.; Cozzani, V.; Ustolin, F. Consequence Analysis of a Bunkering Facility for Liquid Hydrogen Loading and Unloading. In Proceedings of the ASME 2024 43rd International Conference on Ocean, Offshore and Arctic Engineering, Singapore, 9–14 June 2024. [Google Scholar]
  49. Department for Energy Security and Net Zero. UK Government GHG Conversion Factors for Company Reporting 2024; Department for Energy Security and Net Zero: London, UK, 2024.
  50. Izumiya, K. Development of Large Scale PEM Type Water Electrolyzer for Power to Gas; Hitachi Zosen Corporation: Osaka, Japan, 2023. [Google Scholar]
  51. Miao, H.; Yu, Y.; Wan, Y.; Zhang, Y.; Ma, T. Levelized cost of long-distance large-scale transportation of hydrogen in China. Energy 2024, 310, 133201. [Google Scholar] [CrossRef]
  52. Burke, A.; Ogden, J.M.; Fulton, L.; Cerniauskas, S. Hydrogen Storage and Transport: Technologies and Costs; UC Davis: Davis, CA, USA, 2024. [Google Scholar]
  53. Singh, K.; Viswanathan, S. Techno-economic modelling of liquid hydrogen tankers: Capex, Opex, scale economies, and emission trade-offs. Int. J. Hydrogen Energy 2026, 204, 153259. [Google Scholar] [CrossRef]
  54. Incer-Valverde, J.; Lyu, Y.; Tsatsaronis, G.; Morosuk, T. Economic evaluation of a large-scale liquid hydrogen regasification system. Gas Sci. Eng. 2023, 119, 205150. [Google Scholar] [CrossRef]
  55. Ministry of Ecology and Environment; National Bureau of Statistics; National Energy Administration. Announcement on Issuing the 2024 Electricity Carbon Footprint Factor Data; Ministry of Ecology and Environment (MEE): Beijing, China, 2025. (In Chinese)
  56. Zhang, T.; Uratani, J.; Huang, Y.; Xu, L.; Griffiths, S.; Ding, Y. Hydrogen liquefaction and storage: Recent progress and perspectives. Renew. Sustain. Energy Rev. 2023, 176, 113204. [Google Scholar] [CrossRef]
  57. ABB. 2025 Electricity Emission Factors; ABB: Zurich, Switzerland, 2025. [Google Scholar]
  58. Riemer, M.; Schreiner, F.; Wachsmuth, J. Conversion of LNG Terminals for Liquid Hydrogen or Ammonia; Fraunhofer Institute for Systems and Innovation Research ISI: Karlsruhe, Germany, 2022. [Google Scholar]
  59. Toyota Motor Corporation. Six Companies Establish R&D Joint Venture for Commercial Vehicle Fuel Cell Systems for the Creation of a Hydrogen-Based Society in China. Available online: https://global.toyota/en/newsroom/corporate/32732372.html (accessed on 13 April 2026).
  60. Cattel, M. Toyota Invests in Hydrogen Fuel Cell Joint Venture with Beijing SinoHytec. Available online: https://www.world-energy.org/article/16818.html (accessed on 13 April 2026).
Figure 1. Relationships among renewable hydrogen metrics in China and Japan.
Energies 19 02475 g001
Figure 2. Case study boundary of renewable hydrogen produced in China and exported to Japan in the form of LH2.
Energies 19 02475 g002
Figure 3. Relationships among GHG emission metrics within the case study boundary.
Energies 19 02475 g003
Figure 4. Projections for renewable hydrogen production in China and Japan.
Energies 19 02475 g004
Table 1. Renewable hydrogen production capacity and production in China as reported in the literature.
Production Capacity 2030Production 2030Production Capacity 2035Production 2035Production Capacity 2060Production 2060
Renewable hydrogen80 GW [9]
100 GW [10]
5 Mt/year [9]
7.7 Mt/year [10]
Limited estimates in the literature15 Mt/year [9]500 GW [9]
500–750 GW [10]
100 Mt/year [9]
75–100 Mt/year [10]
Table 2. Installed capacities of wind and solar power in China.
ItemsCapacity 2024Capacity 2035CAGR
Wind power520.68 GW [26]1448 GW [27]
1600 GW (adopted by this study)
10.74%
Solar power886.66 GW [26]1528 GW [27]
2000 GW (adopted by this study)
7.68%
Total1407.34 GW2976 GW [27]
2723–4399 GW [28]
3600 GW [29] (adopted by this study)
Table 3. Installed capacities of wind and solar power in Japan.
ItemsCapacity 2024Capacity 2035CAGR
Wind power5.83 GW [31]59.8 GW [32]
80 GW [30] (adopted by this study)
26.88%
Solar power91.61 GW [31]280.2 GW [32]
280 GW [30] (adopted by this study)
10.70%
Total97.44 GW360 GW
Table 4. Projections for renewable hydrogen production in China and Japan (base case).
Items2035
ChinaJapan
Wind power1600 GW80 GW
Utilization hours of wind power2200 h/year1850 h/year
Solar power2000 GW280 GW
Utilization hours of solar power1200 h/year1250 h/year
Renewable electricity generation5920 TWh498 TWh
Share of renewable electricity used to produce hydrogen10%5%
PEM system efficiency75%75%
Efficiency of the electrolyzer-power matching system90%90%
Renewable hydrogen production12.00 Mt/year0.50 Mt/year
Table 5. Projections for renewable hydrogen production in China and Japan (quantitative data).
Scenarios202420252026202720282029203020312032203320342035
China: 15% for 20350.1160.1840.2910.4590.7261.1481.8152.8714.5427.18611.37218.000
China: 10% for 2035 (base case)0.1160.1770.2700.4110.6270.9551.4552.2183.3825.1577.86612.000
China: 5% for 20350.1160.1660.2380.3400.4870.6970.9971.4272.0432.9254.1896.000
China: 3% for 20350.1160.1590.2170.2960.4040.5520.7551.0311.4091.9262.6333.600
Japan: 15% for 20350.0030.0060.0100.0170.0300.0520.0900.1570.2750.4840.8551.515
Japan: 10% for 20350.0030.0050.0090.0150.0260.0430.0720.1210.2050.3480.5911.010
Japan: 5% for 2035 (base case)0.0030.0050.0080.0130.0200.0310.0490.0780.1240.1970.3150.505
Japan: 3% for 20350.0030.0050.0070.0110.0160.0250.0370.0560.0850.1300.1980.303
Table 6. Key assumptions and LCOH for PEM projects in China and Japan in 2025.
ItemsChinaJapan
C s t a c k , 0 (USD/kW)382.5 (based on the World Bank report [42])745 (based on the 2025 target of Hitachi Zosen [50])
C n o n s t a c k (USD/kW)467.5 (based on the World Bank report [42])911 (based on the 2025 target of Hitachi Zosen [50])
C s t a c k , 7 (USD/kW)231451
C s t a c k , 14 (USD/kW)140273
Full-load hours of the PEM electrolyzer using onshore wind (h)2200 [33]1850
LCOE of onshore wind (USD/kWh)0.025 [43]0.08 (based on the 2023 value) [44]
L C O H using onshore wind (USD/kg H2)4.2711.01
Full-load hours of the PEM electrolyzer using utility-scale PV (h)12001250
LCOE of utility-scale PV (USD/kWh)0.027 [43]0.066 (based on the 2023 value) [44]
L C O H using utility-scale PV (USD/kg H2)6.8613.62
Table 7. Sensitivity analysis for the LCOH using onshore wind in China and Japan.
FactorsScenariosChina LCOH (USD/kg H2)Change from BaseJapan LCOH (USD/kg H2)Change from Base
Base0%4.270%11.010%
Full-load hours of the PEM electrolyzer+10%3.99−6.6%10.38−5.7%
Full-load hours of the PEM electrolyzer+20%3.77−11.7%9.85−10.5%
Full-load hours of the PEM electrolyzer+30%3.58−16.2%9.41−14.5%
LCOE (onshore wind)−10%4.14−3.0%10.60−3.7%
LCOE (onshore wind)−20%4.01−6.1%10.19−7.4%
LCOE (onshore wind)−30%3.88−9.1%9.78−11.2%
Electrolyzer system cost−10%3.97−7.0%10.31−6.4%
Electrolyzer system cost−20%3.67−14.1%9.62−12.6%
Electrolyzer system cost−30%3.37−21.1%8.93−18.9%
Table 8. The total cost of hydrogen produced in China and exported to Japan (Dalian–Kobe case).
ItemsCosts (USD/kg H2)
LCOH using onshore wind in China4.27
Road transport from Chifeng to Dalian (including liquefaction)1.08
LH2 storage at Dalian Port0.073
Sea transport from Dalian to Kobe0.272 [53]
LH2 storage at Kobe Port0.073
Regasification at Kobe0.74 [54]
Total6.51
Comparison: LCOH using onshore wind in Japan11.01
Table 9. Total GHG emissions of renewable hydrogen produced in China and exported to Japan.
ItemsGHG Emissions (Case 1)
(kg CO2-eq/kg H2)
GHG Emissions (Case 2)
(kg CO2-eq/kg H2)
GHG Emissions (Case 3)
(kg CO2-eq/kg H2)
GHG Emissions (Case 4)
(kg CO2-eq/kg H2)
GHG Emissions (Case 5)
(kg CO2-eq/kg H2)
GHG Emissions (Case 6)
(kg CO2-eq/kg H2)
GHG Emissions (Case 7)
(kg CO2-eq/kg H2)
GHG Emissions (Case 8)
(kg CO2-eq/kg H2)
Renewable hydrogen produced in China 2.65 (solar)1.63 (wind)2.65 (solar)1.63 (wind)2.65 (solar)1.63 (wind)2.65 (solar)1.63 (wind)
Liquefaction7.97 (grid electricity in China)7.97 (grid electricity in China)0.72 (solar)0.44 (wind)0.72 (solar)0.44 (wind)0.72 (solar)0.44 (wind)
Road transport from Chifeng to Dalian0.0370.0370.0370.0370.0370.0370.0370.037
BOG compression at Dalian Port LH2 storage facility (no reliquefaction of BOG)0.74 (grid electricity in China)0.74 (grid electricity in China)0.74 (grid electricity in China)0.74 (grid electricity in China)0.067 (solar)0.041 (wind)0.067 (solar)0.041 (wind)
Sea transport from Dalian to Kobe (no reliquefaction of BOG)0.0260.0260.0260.0260.0260.0260.0260.026
BOG compression at Kobe Port LH2 storage facility (no reliquefaction of BOG)0.57 (grid electricity in Japan)0.57 (grid electricity in Japan)0.57 (grid electricity in Japan)0.57 (grid electricity in Japan)0.57 (grid electricity in Japan)0.57 (grid electricity in Japan)0.067 (solar)0.041 (wind)
Regasification at Kobe0.38 (grid electricity in Japan)0.38 (grid electricity in Japan)0.38 (grid electricity in Japan)0.38 (grid electricity in Japan)0.38 (grid electricity in Japan)0.38 (grid electricity in Japan)0.044 (solar)0.027 (wind)
Total12.3711.355.123.824.453.123.612.24
Table 10. Sensitivity analysis of the impact of hydrogen liquefaction on the total GHG emissions of renewable hydrogen produced in China and exported to Japan.
Electricity Required for Hydrogen LiquefactionCase 1Case 2Case 3Case 4Case 5Case 6Case 7Case 8
Base (13.8 kWh)12.3711.355.123.824.453.123.612.24
−10% (12.42 kWh)11.5810.565.053.784.383.083.542.20
−20% (11.04 kWh)10.749.724.943.704.273.003.432.12
−30% (9.66 kWh)9.988.964.913.694.232.993.392.11
Disclaimer/Publisher’s Note: The statements, opinions and data contained in all publications are solely those of the individual author(s) and contributor(s) and not of MDPI and/or the editor(s). MDPI and/or the editor(s) disclaim responsibility for any injury to people or property resulting from any ideas, methods, instructions or products referred to in the content.