1. Introduction
As a petroleum-dependent sector, road freight constitutes a primary source of energy-related carbon dioxide (CO
2) emissions globally. China hosts the world’s largest truck industry [
1], with road freight emissions accounting for over 50% of the nation’s total transport-related CO
2 emissions [
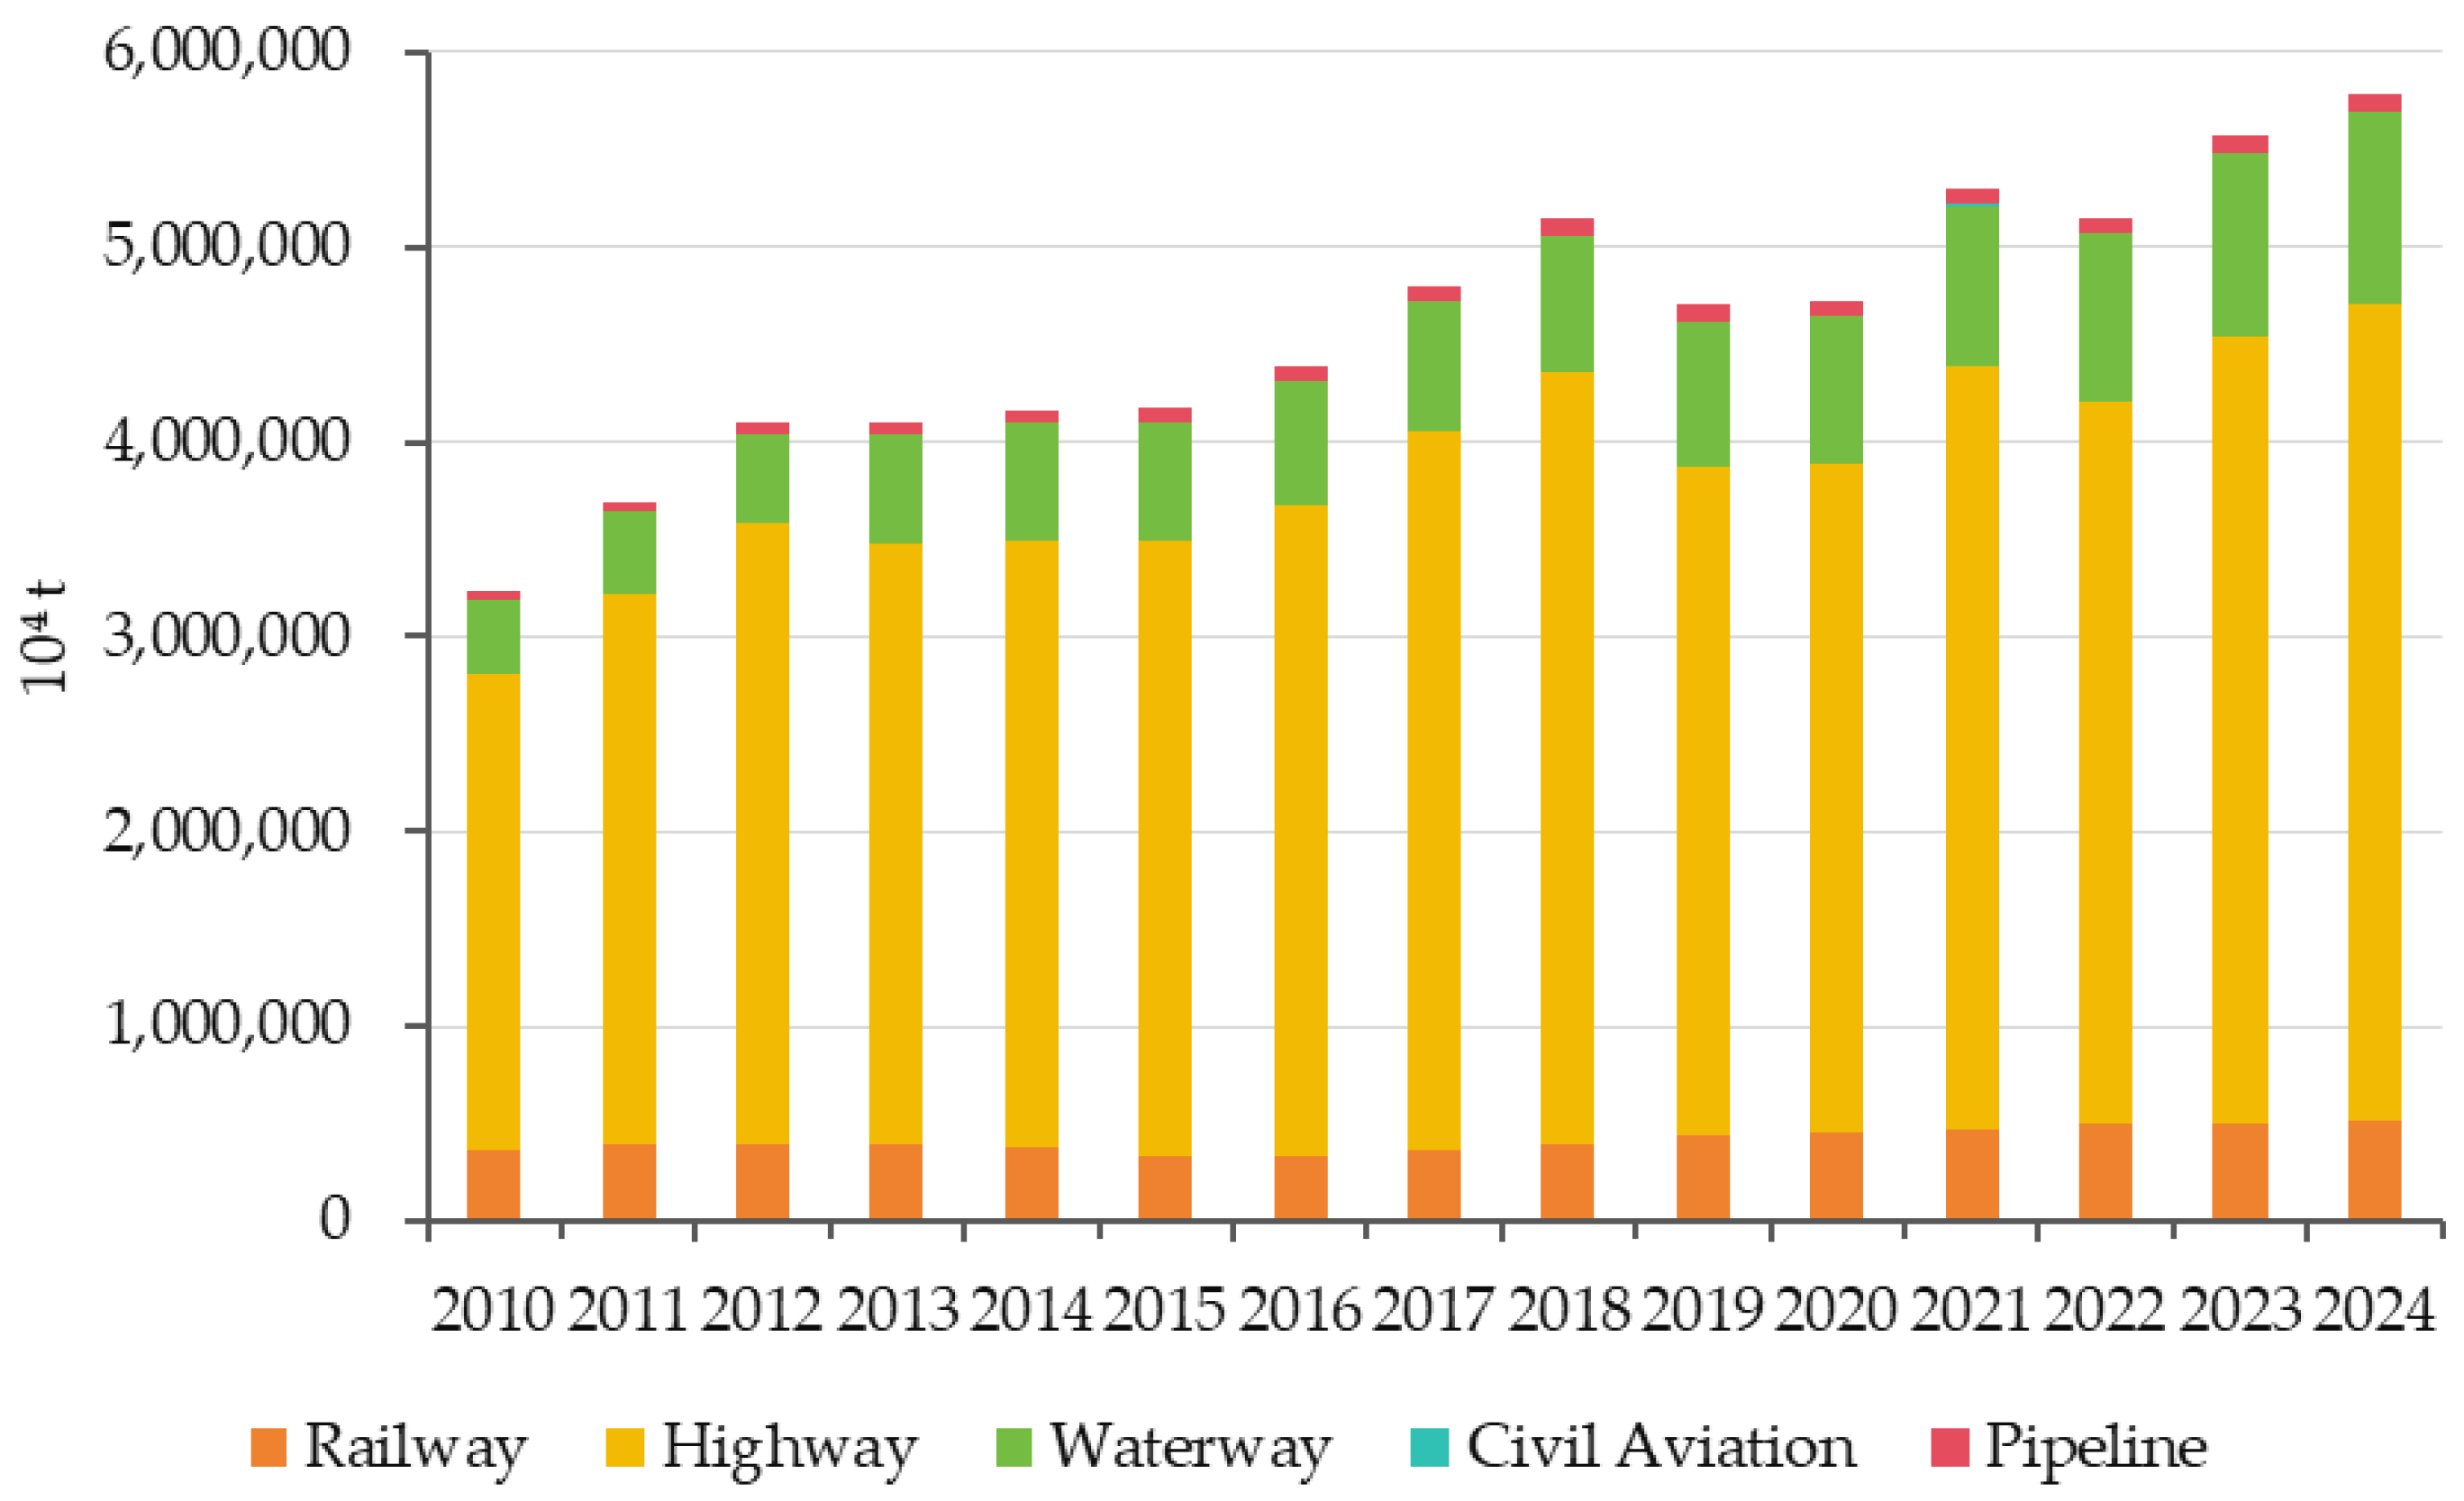
2]. In 2024, China’s road freight volume reached 41.88 billion tons, representing 72.4% of the country’s total social freight volume, underscoring the sector’s irreplaceable role in the national economy and its critical position in China’s carbon neutrality roadmap (
Figure 1).
With the global trend of transport electrification and low-carbon transition, battery electric and hydrogen fuel cell trucks have emerged as core alternatives to conventional diesel trucks for road freight decarbonization [
3]. Electric powertrains are well suited for short-distance freight, while hydrogen fuel cell technology is more applicable for long-haul operations owing to its fast refueling and long driving range (
Table 1) [
4,
5]. China has become the global leader in zero-emission truck deployment, with battery electric models dominating the new energy truck market, supported by a suite of policy incentives, including diesel truck operation restrictions and new energy vehicle purchase subsidies [
6,
7].
However, two critical unresolved issues remain for the low-carbon transition of China’s road freight sector:
- (1)
The economic feasibility and real emission reduction effects of alternative fuel trucks across different vehicle types lack systematic, quantitative evaluation;
- (2)
The long-term fleet-level emission reduction potential, realistic technology deployment pathways, and targeted policy strategies for China’s full road freight fleet are not yet fully clarified.
To address these gaps, in this study, an integrated analysis framework was constructed, combining total cost of ownership (TCO) and life cycle assessment (LCA) to evaluate the economic and environmental performance of diesel, electric, and hydrogen fuel cell trucks across four vehicle categories. Combined with an LSTM neural network and vehicle ownership model, this framework forecasts the fleet emission reduction potential of China’s road freight sector from 2020 to 2050 under multiple scenarios.
The main contributions of this study are threefold:
- (1)
A combined environment–economic benefit analysis model was developed, integrating TCO and LCA, to avoid subjectivity in vehicle and fuel technology selection in single-model studies;
- (2)
A comprehensive analysis of the full road freight fleet in China was conducted, quantifying the economic feasibility and emission reduction performance of alternative fuels across all truck types, to support differentiated policy-making;
- (3)
The long-term cumulative emission reduction benefits of China’s truck fleet under dynamic market and energy structure changes were simulated, and the short- and long-term drivers of freight decarbonization were clarified in the context of China’s carbon neutrality objectives.
2. Literature Review
This section systematically reviews existing research on the decarbonization of road freight trucks from three dimensions: economic feasibility evaluation, life cycle emission assessment, and fleet-level emission reduction potential forecasting. A summary table of representative studies is provided to clarify the research gaps and position this work against the existing literature (
Table 2).
2.1. Economic Feasibility Evaluation of New Energy Trucks
Total cost of ownership (TCO) analysis is the most widely used method for the economic evaluation of freight trucks, covering full life cycle costs including purchase, operation, and residual value. Existing studies have conducted TCO comparisons between new energy and diesel trucks, but with inconsistent conclusions and limited scope. Sen et al. (2017) demonstrated the cost competitiveness of heavy-duty electric trucks in the U.S. market [
8], while Yang et al. (2018) found that light-duty plug-in electric trucks are cost-competitive in China, but battery-swap models are not [
9]. For hydrogen fuel cell trucks, most studies have confirmed their current cost disadvantage relative to diesel trucks, with cost parity only achievable with significant reductions in hydrogen production and fuel cell system costs [
10,
11,
12]. However, existing studies mostly focus on a single truck type (e.g., heavy-duty trucks) and lack a systematic TCO analysis covering the full range of freight truck categories in China.
2.2. Life Cycle GHG Emission Assessment of Alternative Fuel Trucks
Reliable emission reduction evaluation requires a full life cycle assessment (LCA) covering the well-to-wheel fuel cycle. Existing research has confirmed that the emission reduction performance of electric and hydrogen trucks is highly dependent on the upstream energy structure [
13,
14,
15]. El Hannach et al. (2019) and Lao et al. (2021) evaluated the emission reduction potential of hydrogen-fueled heavy-duty trucks, focusing on specific hydrogen production pathways such as industrial by-product hydrogen and offshore wind-powered electrolysis [
13,
14]. Huang and Ren (2013) highlighted that the share of clean energy in the power grid is the key determinant of electric trucks’ life cycle emissions [
15]. However, most studies only cover 1–2 hydrogen production pathways, lacking a comprehensive comparison of all mainstream hydrogen production routes in China, and few have dynamically forecasted emission changes along with China’s energy structure transition.
Table 2.
Summary of representative previous studies.
Table 2.
Summary of representative previous studies.
| Study | Research Scope | Core Methods | Key Assumptions | Main Advantages | Key Limitations |
|---|
| Sen et al. (2017) [8] | Heavy-duty electric trucks in the U.S. | TCO + LCA | Fixed vehicle service life, constant fuel and electricity prices | Comprehensive externality cost analysis | Single vehicle type focus, not adapted to China’s market and policy context |
| Yang et al. (2018) [9] | Light-duty electric trucks in China | TCO + LCA | Fixed battery cost, constant annual mileage | Detailed comparison of plug-in and battery-swap models | Limited to light-duty trucks, no full-fleet analysis |
| Wang et al. (2023) [11] | Heavy-duty fuel cell trucks in China | TCO analysis | Linear hydrogen price decline, fixed fuel cell system cost | Scenario-based cost parity analysis | No LCA emission assessment, no fleet-level forecasting |
| Liu et al. (2018) [5] | China’s full road vehicle fleet | Scenario analysis + emission forecasting | Fixed new energy vehicle penetration rate | Full fleet coverage, multi-scenario comparison | No TCO-based economic feasibility demonstration for technology adoption |
| Khanna et al. (2021) [16] | China’s heavy-duty trucks | Energy consumption simulation + scenario analysis | Fixed technology penetration timeline | Long-term forecasting through 2050 | No systematic TCO analysis, limited hydrogen pathway coverage |
| Lao et al. (2021) [14] | Heavy-duty trucks in Beijing–Tianjin–Hebei-Shandong region | LCA + scenario analysis | Single offshore wind electrolysis hydrogen pathway | Regional targeted analysis | Only one hydrogen production pathway, no full-fleet coverage |
| This study | China’s full road freight fleet (4 truck types, 3 fuel pathways) | Integrated TCO-LCA model + LSTM sales forecast + multi-scenario analysis | TCO parity-driven technology adoption, dynamic energy structure transition, China-specific policy and market parameters | Full-fleet systematic analysis, integrated economic-environmental framework, dynamic long-term forecasting with realistic constraints | - |
2.3. Fleet-Level Emission Reduction Potential Forecasting
Existing studies on freight fleet decarbonization can be divided into two categories: research focused on a single type of vehicle and research on national/provincial transport sector forecasting. Liu et al. (2018) and Khanna et al. (2021) simulated the emission reduction potential of new energy heavy-duty trucks in China and identified the key role of zero-emission vehicle deployment in long-term decarbonization [
5,
16]. Wang et al. (2021) and Fan et al. (2017) forecasted the carbon reduction potential of China’s transport sector and Beijing’s public transport system, respectively, using macro-level scenario analysis [
17,
18]. However, most existing studies conduct static emission comparisons at a single point in time, lacking long-term dynamic forecasting of the full freight truck fleet based on vehicle sales and retirement rules. In addition, the link between economic feasibility (TCO parity) and technology adoption in the forecasting model is often insufficiently addressed.
2.4. Summary of Existing Research and Research Gaps
Table 2 systematically summarizes the core methods, assumptions, advantages, and limitations of representative studies in this field. Based on the review, five key research gaps are identified:
- (1)
Alternative fuel technology selection in most studies lacks a quantitative demonstration based on full-scope TCO economic feasibility;
- (2)
Most studies focus on a single truck type or fuel pathway, lacking a systematic analysis of the entire road freight fleet in China;
- (3)
The majority of LCA studies cover only 1–2 hydrogen production pathways, without a comprehensive comparison of emission differences across all mainstream routes in China;
- (4)
Most studies conduct static emission comparisons at a single time point, lacking long-term dynamic forecasting of overall fleet emissions linked to TCO-based technology adoption;
- (5)
Emission analysis mostly focuses on the vehicle use phase, lacking a full life cycle perspective covering fuel production, vehicle manufacturing, and scrapping.
This study addresses these gaps by constructing an integrated TCO-LCA framework, conducting a full-fleet analysis covering all truck types and hydrogen production pathways, and forecasting long-term fleet emission dynamics based on TCO parity-driven technology adoption rules.
3. Environment–Economic Benefit Analysis Model of Trucks
To comprehensively cover all freight vehicle types, this study classifies freight trucks into four categories based on the maximum design gross mass according to the GA802-2019 Motor Vehicle Types for Road Traffic Management issued by the Ministry of Public Security: mini truck (MT), light-duty truck (LDT), medium-duty truck (MDT), and heavy-duty truck (HDT). Three power types are considered: diesel, fuel cell, and electric.
3.1. Total Cost of Ownership Model for New Energy Trucks
From the user’s perspective, costs incurred by truck owners include purchase cost, operating cost, and residual value. The formula for calculating the total cost of ownership is
where C
p represents the total vehicle purchase cost; C
o, the core operating cost (including fuel/energy cost routine maintenance, battery degradation, and replacement cost for electric trucks and downtime-related productivity loss cost); and C
s, the residual value of the vehicle at the end of service life.
Truck total purchase cost C
p consists of two parts: the base vehicle hardware cost and the financing cost incurred during the purchase process. The base vehicle hardware cost C
p,base includes the glider, electric drive unit, and energy storage pack costs, which vary across powertrains:
The glider cost C
glider equals the diesel truck price minus the cost of diesel-specific components (engine, transmission, etc.), typically accounting for 48.3% of the diesel truck price [
19]. The electric drive unit cost C
ED is the product of the electric drive system cost, motor power, and system integration coefficient. The energy storage pack cost C
b refers to the battery or fuel cell system cost for electric and fuel cell trucks, respectively. For electric trucks, energy storage pack cost is the product of power battery cost, battery capacity, and system integration coefficient; required capacity is the product of fuel economy and minimum driving range. For fuel cell trucks, the fuel cell system cost is the sum of the fuel cell and hydrogen storage costs, both multiplied by the system integration coefficient; hydrogen storage capacity is the product of fuel cell truck fuel economy and minimum driving range.
Financing cost reflects the interest expenses and capital opportunity costs incurred by fleet operators for vehicle purchase loans, which is a core non-negligible cost in the actual procurement of commercial trucks in China. This study assumes a mainstream commercial vehicle financing scheme in the Chinese market: 30% down payment, five-year loan term, and an annualized loan interest rate of 4.35% (benchmark LPR for commercial vehicle loans in China). The total financing cost is calculated as the sum of interest expenses over the loan term, converted to a net present value in the TCO calculation.
Operating cost includes various expenses incurred during truck operation, such as fuel, maintenance, battery degradation, and downtime costs. Fuel cost constitutes a major part of road transport companies’ operating costs due to the high average fuel consumption of long-haul trucks. Fuel accounts for 20–30% of operating costs in the UK and US, while in China, it can reach 40–50% or even higher. Battery degradation cost is specifically set for battery electric trucks, reflecting the capacity fade of power batteries and the required replacement expenses during the vehicle service life. Based on the performance of lithium iron phosphate batteries widely used in China’s commercial vehicle market, we assume that the battery needs to be replaced once the remaining capacity drops to 80% of the initial capacity after 6000 charge–discharge cycles, which corresponds to the mid-term of the 15-year service life for light/medium/heavy-duty trucks. The replacement cost is dynamically calculated based on the declining trend of power battery system costs, consistent with the baseline assumptions in
Section 3.3.1. Downtime cost measures the productivity loss caused by vehicle out-of-service time, including energy replenishment (refueling/charging/hydrogen refueling) downtime and routine maintenance downtime. The cost is quantified based on the annual operational mileage, average hourly revenue of freight trucks in China, and the difference in downtime across different powertrain types: diesel trucks have the shortest refueling downtime, followed by hydrogen fuel cell trucks, while battery electric trucks have longer charging downtime. The parameter settings are calibrated based on the actual operational data of China’s freight market and ICCT’s research on China’s heavy-duty truck market [
20].
Residual value refers to the estimated book value of a truck after depreciation, based on the expected return from selling or dismantling the asset at the end of its service life. As residual value belongs to the truck owner, it is subtracted from the total cost of ownership and is also depreciated in calculations.
All future values are converted to a net present value (NPV) at the time of vehicle purchase. The formula for the net present value of the total cost of ownership is
where
is the net present value of total financing cost, r is the discount rate of truck fleet operators (set to 5% in this study), and N is the service life of the truck.
3.2. Life Cycle Carbon Emission Analysis of New Energy Trucks
In this study, the life cycle assessment (LCA) method is employed to evaluate the carbon emissions of China’s road freight trucks. The goals of this LCA study are to (1) establish a localized LCA database for hydrogen fuel cell, battery electric, and diesel trucks in China, collect and sort parameters for production, storage, and transportation technologies from multiple sources, and build a detailed truck life cycle inventory; (2) evaluate the GHG emissions of different truck types over the fuel life cycle, compare the environmental performance of traditional diesel, electric, and hydrogen fuel cell heavy-duty trucks, and provide a scientific basis for future alternative fuel selection; and (3) review and compare commonly used hydrogen production pathways in China and forecast emission changes over time considering power structure transformation and technological progress to support subsequent fleet emission research.
This study focuses on the well-to-wheel (WTW) fuel cycle greenhouse gas emissions of China’s truck fleet, which is the dominant emission source of China’s road freight sector and the core target of decarbonization policy regulation. The fuel cycle includes two main stages: Well-to-Pump (WTP, the upstream fuel production stage covering raw material production, transportation, fuel production, and refueling) and Pump-to-Wheel (PTW, the downstream fuel use stage covering energy consumption and emissions during driving).
SimaPro 10.1 (developed by PRé Consultant, The Netherlands) was used to estimate GHG emission intensity, with all core life cycle emission factors updated to the latest GREET® 2024 database developed by Argonne National Laboratory, which provides the most up-to-date full life cycle modeling framework for transport fuels, powertrains, and hydrogen production pathways. Fuel types include traditional diesel, grid electricity, and hydrogen.
To calculate GHG emissions, CO
2, CH
4, and N
2O are converted to CO
2 equivalents based on the latest 100-year global warming potential (GWP) values from the IPCC Sixth Assessment Report (AR6), which is also adopted in the GREET
® 2024 model:
In LCA, the functional unit is the core basis for standardized accounting and result comparison. Our setting strictly follows the ISO 14040/14044 LCA international standards [
21,
22] and aligns with the mainstream well-to-wheel (WTW) accounting framework of the GREET
® model—the global authoritative benchmark for transport fuel life cycle research. We adopt staged functional units matched to the core attributes of each accounting stage and fully eliminate potential comparability issues by unifying the final result dimension:
Well-to-Pump (WTP): A functional unit is 1 MJ of fuel. This is the global mainstream practice for upstream fuel production accounting, ensuring consistent emission intensity comparison across different fuel types (diesel, electricity, hydrogen) with different physical properties.
Pump-to-Wheels (PTW): A functional unit is 1 km of truck travel, which accurately reflects emission performance under the same transport service output—the core function of freight trucks.
To eliminate potential comparability issues between staged functional units, we link the WTP and PTW stages through the vehicle fuel economy (FE) parameter with a unified energy dimension (MJ/km) and convert all full WTW emission results to a unified final functional unit: grams of CO
2 equivalent per kilometer of truck travel (g CO
2eq/km), ensuring the full consistency and comparability of all cross-technology, cross-model comparisons in this study. The standardized calculation formula is as follows:
where FE is vehicle fuel economy (MJ/km), GHG
WTW is full life cycle emissions (g CO
2,eq/km), GHG
WTP is WTP GHG emissions (g CO
2,eq/MJ), and GHG
PTW is PTW GHG emissions (g CO
2,eq/km).
Table 3 provides the necessary lower heating value parameters for standardized unit conversion across fuel types.
GHG emissions include direct and indirect components:
where G denotes emission type (CO
2, CH
4, N
2O), p is the number of sub-stages, i is fuel type, j is process fuel type, GHG
G,direct,i is direct emissions of gas G (g/MJ), GHG
G,indirect,i is indirect emissions of gas G (g/MJ), EN
i,p,j is energy i consumed to produce fuel j at sub-stage p (MJ/MJ fuel), DE
G,j is the direct emission coefficient of process fuel j (g/MJ fuel), and IE
G,j is the indirect emission coefficient of process fuel j (g/MJ fuel).
3.3. Data and Key Assumptions
3.3.1. Cost Data and Key Assumptions
Annual mileage uses 2020 baseline values from the 2019 China Energy-Saving and New Energy Development Report, with dynamic time-varying trends set based on long-term monitoring data from the China Federation of Logistics and Purchasing (CFLP), to reflect the evolution of vehicle utilization with logistics development up to 2050: heavy-duty trucks: 0.5% annual growth (corresponding to lower empty driving rates from intermodal transport and logistics intensification); light/medium-duty trucks: 0.3% annual decline (corresponding to fragmented urban last-mile logistics demand); mini trucks: stable mileage over the forecast period.
Driving range data refer to the Hydrogen Energy Parity Roadmap 2020. Fuel cell power for light-, medium-, and heavy-duty trucks is 100–200 kW, 100–200 kW, and 150–400 kW, respectively [
23]. Motor power data are derived from the literature [
24,
25,
26]. According to current national vehicle service life regulations, mini freight trucks have a service life of 12 years, and heavy-, medium-, and light-duty freight trucks have a service life of 15 years [
27]. Data are adjusted based on actual truck parameters from Truck Home, as shown in
Table 4.
Purchase cost refers to the total vehicle price. Diesel truck purchase costs are determined based on official guide prices or authoritative website references. New energy truck costs are calculated based on the glider cost of the corresponding diesel model (total price minus diesel-specific components such as engine and transmission) plus the price of new energy-specific components such as electric drive units and energy storage packs [
18]. The system integration coefficient (1.15–1.5) is introduced to account for integration, overhead, and profit costs [
25]. In addition, diesel trucks are subject to a 10% vehicle purchase tax and an annual usage fee of 96 CNY/ton.
Financing cost: 30% down payment, five-year loan term, 4.35% annualized interest rate, consistent with the mainstream commercial vehicle financing scheme in China.
Truck operating costs include fuel, maintenance, battery degradation, and downtime costs. For fuel costs, diesel and electricity prices are set as constant baseline values at 6.5 CNY/L and 0.675 CNY/kW·h, respectively, consistent with the long-term average level of China’s energy market. For the hydrogen price, to address the uncertainty of technological progress and industrial development, we abandon the single linear interpolation setting in the original manuscript and construct a scenario-based forecasting system for hydrogen prices covering 2022–2050, with linear interpolation for intermediate years in each scenario. The scenario settings are calibrated based on the IEA Net Zero Emissions Scenario, China Hydrogen Energy Industry Development Report 2024, and China’s Medium- and Long-term Plan for Hydrogen Energy Industry Development (2021–2035), with the following scenarios:
Conservative Scenario: Hydrogen technology progress and industrial scale-up are slower than expected, with lagged cost reduction in renewable hydrogen and incomplete supporting infrastructure. The hydrogen price is set at 35 CNY/kg in 2022, 32 CNY/kg in 2025, and 25 CNY/kg in 2050, with linear interpolation for intermediate years.
Baseline Scenario: This scenario considers neutral forecasting consistent with the national hydrogen energy development planning, with steady technological progress and gradual improvement of the industrial chain. The hydrogen price is set at 35 CNY/kg in 2022, 30 CNY/kg in 2025, and 20 CNY/kg in 2050, with linear interpolation for intermediate years (consistent with the original baseline setting of the manuscript).
Accelerated Scenario: This scenario considers rapid technological breakthroughs in electrolyzers, significant scale effects of renewable hydrogen production, and strengthened supportive policies. The hydrogen price is set at 35 CNY/kg in 2022, 25 CNY/kg in 2025, and 15 CNY/kg in 2050, with linear interpolation for intermediate years.
Maintenance costs are set at 0.325 CNY/km, 0.218 CNY/km, and 0.228 CNY/km for diesel, battery electric, and fuel cell trucks, respectively [
28]. Battery degradation cost: One-time battery replacement during a 15-year service life for light/medium/heavy-duty electric trucks, with the replacement cost decreasing year by year in line with the power battery cost decline trend. Downtime cost: The average hourly revenue of freight trucks is set to 120 CNY/hour for mini/light-duty trucks and 180 CNY/hour for medium/heavy-duty trucks, based on the average freight rate in China’s road transport market. The annual downtime is 22 h for diesel trucks, 126 h for electric trucks, and 38 h for hydrogen fuel cell trucks.
Residual value ratios from depreciation depend on powertrain technology and application. This study assumes residual values of 10%, 15%, and 15% for the glider, battery, and fuel cell system at the end of service life, respectively [
20,
29,
30]. The discount rate is a key parameter in the TCO calculation, which reflects the time value of money, capital opportunity cost, and operational risk of freight fleet operators. In this study, a baseline discount rate of 5% was adopted for core analysis, consistent with mainstream research on China’s commercial vehicle market [
31]. To test the robustness of the TCO results and core conclusions to changes in capital cost, we further conducted a one-way sensitivity analysis with a discount rate ranging from 3% to 10%, covering the actual financing cost range of different types of fleet operators in China (from large state-owned logistics enterprises with low financing costs to small private fleets with high capital costs).
3.3.2. Battery Production Data
This study assumes lithium iron phosphate batteries for electric trucks, with an energy density of 0.159 kWh/kg [
32]. Each battery pack weighs 203 kg and provides 23.5 kWh of electricity [
33]. Key life cycle parameters for a 1 kg battery pack are shown in
Table 5.
3.3.3. Key Data for Hydrogen Production Pathways
To better reflect the GHG intensity of hydrogen produced in China, this study customized basic data in SimaPro, with reference to key parameters of different hydrogen production pathways as summarized by ICCT (2021) [
34]. Considering China’s resource structure and hydrogen technology development, five mainstream hydrogen production pathways in China are covered: coal gasification, natural gas reforming, grid electricity water electrolysis, solar photovoltaic electricity water electrolysis, and coke oven gas (COG) by-product hydrogen production.
Life cycle inventory data are mainly sourced from the latest GREET
® 2024 database, supplemented by the Ecoinvent database, peer-reviewed academic studies, and authoritative industry reports for China-localized parameter calibration.
Table 6 lists the compiled life cycle data for hydrogen production, with all emission-related coefficients updated to align with GREET
® 2024’s latest hydrogen pathway modeling results.
For hydrogen storage and transportation, gaseous hydrogen transported via pipeline was selected in this study. According to the China Hydrogen Energy Industry Development Report 2020 [
35] and China Hydrogen Energy and Fuel Cell Industry White Paper 2020 [
36], pipeline transportation is suitable for long-distance, large-scale hydrogen delivery from centralized production plants, with advantages of large capacity, low energy consumption, and long-term cost compared with tube trailers (low long-distance efficiency) and liquid hydrogen (immature technology). Based on actual operation data of China’s hydrogen pipelines, the average distance from plant to refueling station is assumed to be 35 km.
Table 6.
LCI of hydrogen production process.
Table 6.
LCI of hydrogen production process.
| Hydrogen Pro-duction Pathways | Input | Output |
|---|
| Parameter | Unit | Value | Parameter | Unit | Value |
|---|
| Natural Gas Re-forming [37] | Natural Gas (53.68 kJ/kg), Feedstock | MJ | 157 | C6H6 | kg | 1.40 × 10⁻³ |
| Natural Gas, Fuel | MJ | 17.2 | CO2 | kg | 10.62 |
| Steam Consumption (2.6 MPa) | kg | 9.65 | CO | kg | 5.70 × 10⁻³ |
| Steam Output (4.8 MPa) 2.75 MJ/kg | kg | 13.86 | CH4 | kg | 5.98 × 10⁻² |
| Electricity | kWh | 0.318 | NOₓ as NO2 | kg | 1.23 × 10⁻² |
| Water, Reforming Consumption | kg | 4.8 | N2O | kg | 4.00 × 10⁻⁵ |
| Water, Hydrogen Production Consumption | kg | 14.1 | NMHCs | kg | 1.68 × 10⁻² |
| / | / | / | PM | kg | 2.00 × 10⁻³ |
| / | / | / | SOₓ as SO2 | kg | 9.50 × 10⁻³ |
| Coal Gasification [38,39,40] | Coal | kg | 10 | Electricity | kWh | 0.75 |
| Oxygen | kg | 5.92 | CO2 | kg | 11.44 |
| Steam | kg | 12.29 | / | / | / |
| Coke Oven Gas (COG) Reforing [41] | Coke Oven Gas | kg | 10,000 | H2S | kg | 6.00 × 10⁻³ |
| Compressed Air | m3 | 60 | C6H6 | kg | 0.01 |
| Nitrogen | m3 | 0.12 | Total Non-Methane Hydrocarbons | kg | 0.09 |
| Adsorbent | kg | 33.88 | Suspended Solids | kg | 0.04 |
| Deoxidizer | kg | 0.05 | COD | kg | 0.08 |
| Ceramic Balls | kg | 2.38 × 10⁻³ | Ammonia Nitrogen | kg | 2.46 × 10⁻³ |
| Fresh Water | t | 5.28 | Wastewater Treatment | t | 2 |
| Electricity | kWh | 1426.7 | Municipal Solid Waste Landfill | t | 1.43 × 10⁻⁴ |
| Steam | t | 1.04 | Industrial Hazardous Waste Incineration | t | 3.00 × 10⁻⁴ |
| Electricity | kWh | 56.04 | / | / | / |
| Water Electrolysis [42,43] | Water | kg | 12.24 | Oxygen | kg | 3.93 |
| Electricity | kWh | 56.04 | / | / | / |
3.3.4. Emission Data of Diesel Trucks During Operation
Diesel truck operation generates CO2, NOₓ, PM, and HCs, with all emission factors updated to the GREET® 2024 heavy-duty diesel vehicle module and China’s latest National VI b emission standard measurement data. This study adopted the following updated emission factors: a CO2 emission factor of 3.16 kg CO2/L (tank-to-wheels), an NOₓ emission factor of 46.2 g/kg fuel, a PM emission factor of 6.91 g/kg fuel, and an HC emission factor of 2.18 g/kg fuel. These factors are consistent with the latest real-world operation measurement results of China’s heavy-duty freight trucks.
3.3.5. Power Structure Forecast
With the accelerated decarbonization of China’s power system, the share of renewable energy power generation continues to rise, and the GHG emission factor of grid electricity shows a clear downward trend.
Table 7 presents the updated power generation structure forecast based on China Energy Outlook 2024 and the National Energy Administration’s latest official power statistics, with grid GHG emission intensity calculated using the GREET
® 2024 grid electricity life cycle modeling framework.
3.3.6. Fuel Consumption Coefficients
Fuel consumption of road freight trucks depends on vehicle characteristics, driving conditions, cargo type, and loading. No dedicated government or industry agency collects nationwide fuel consumption data for freight trucks. This study adopted fuel consumption coefficients for mini and light-, medium-, and heavy-duty trucks from the Argonne National Laboratory Autonomie Vehicle Simulation Team and GREET
® 2024 heavy-duty vehicle module (
Table 8), which were calibrated to the real-world operation data of China’s freight trucks. Although heavy-duty trucks consume more fuel per kilometer than smaller trucks, they are more efficient in freight transport: on average, 3.8 L of fuel is needed to transport 1 ton of cargo over 100 km for heavy-duty trucks, 4.3 L for medium-duty trucks, and 19.5 L for light-duty trucks.
3.3.7. Key Uncertain Parameters: Range Setting and Justification
To address the uncertainty of core input parameters in the modeling framework and avoid over-reliance on single-point estimates, this study defines the fluctuation range of key uncertain parameters based on authoritative industry forecasts, national policy planning, and mainstream research. The baseline values, fluctuation ranges, and justification for each parameter are detailed in
Table 9.
4. Environment–Economic Benefit Analysis Results of Trucks
4.1. Total Cost of Ownership Results
4.1.1. Total Cost of Ownership of Different Truck Types in the Base Year (2020)
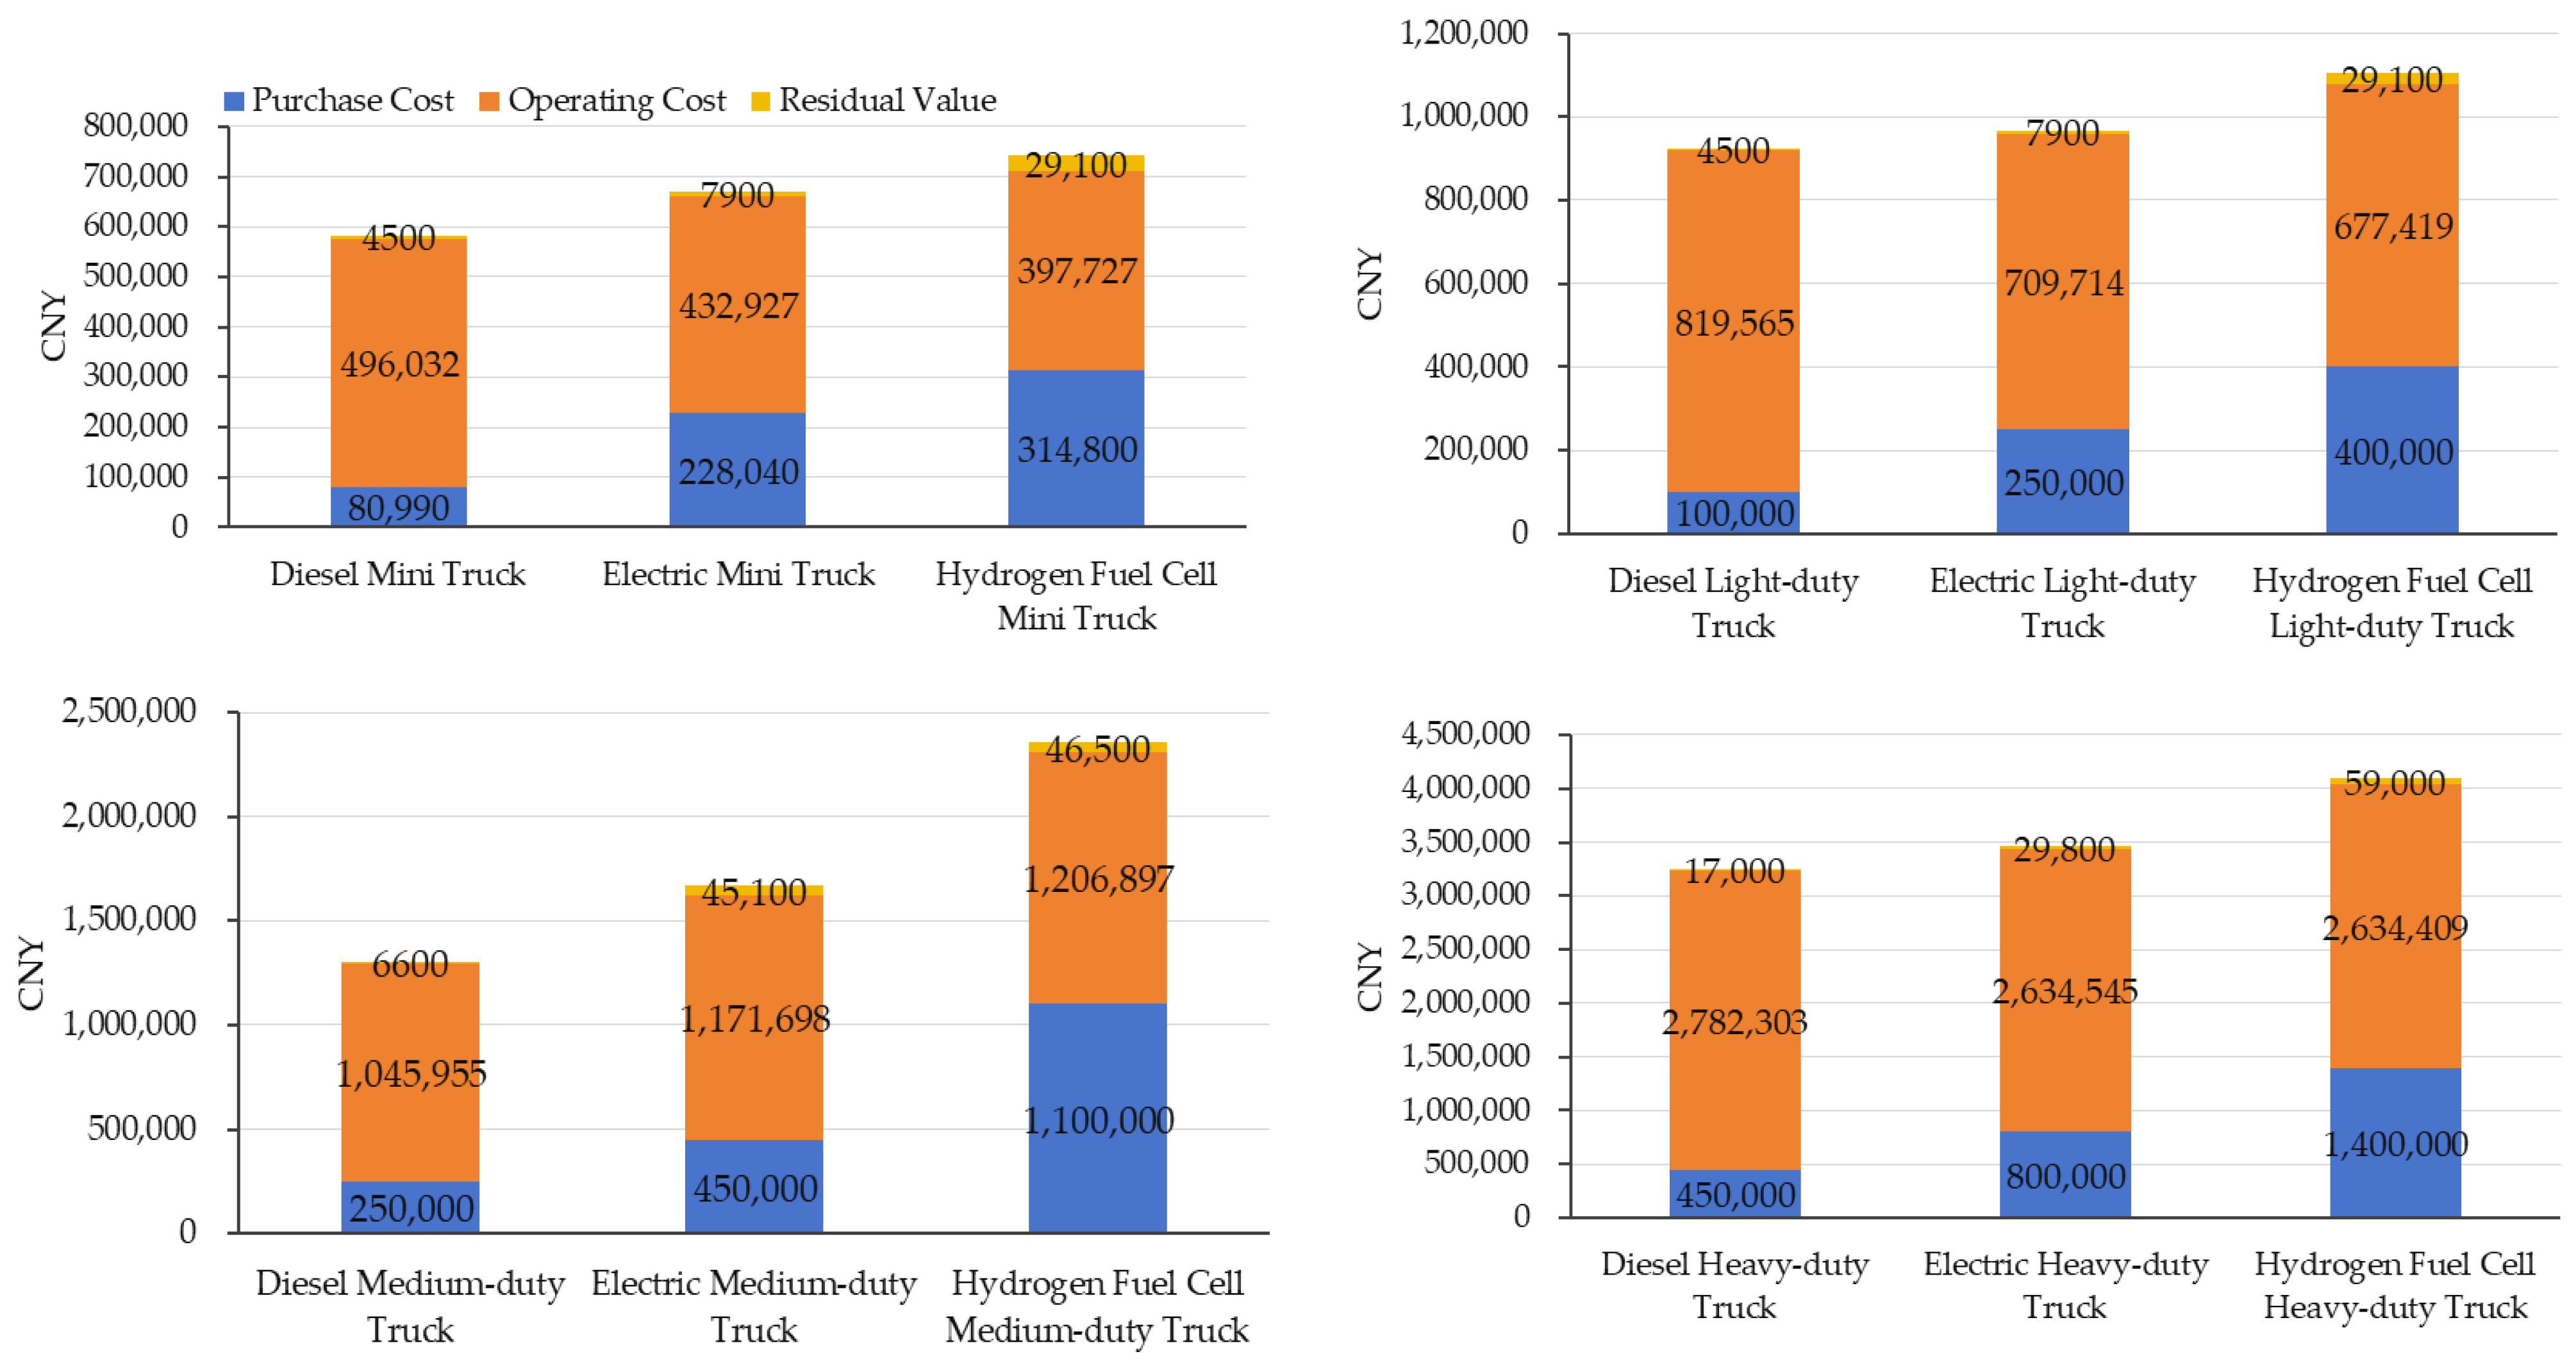
Figure 2 shows that new energy trucks are not yet cost-competitive in the 2020 base year: the TCO of fuel cell and electric trucks is about 1.04–1.22 times and 1.14–1.75 times that of traditional diesel trucks, respectively. This is due to China’s new energy truck industry remaining in the early industrialization stage in 2020, with no large-scale production effect to reduce the cost of core components (power batteries/fuel cell stacks), and the high upfront cost cannot be offset by operating cost advantages within the full service life. Diesel trucks have a higher share of operating costs due to high fuel prices and maintenance fees, while electric and hydrogen trucks have a higher share of purchase costs due to additional powertrain and energy storage pack expenses.
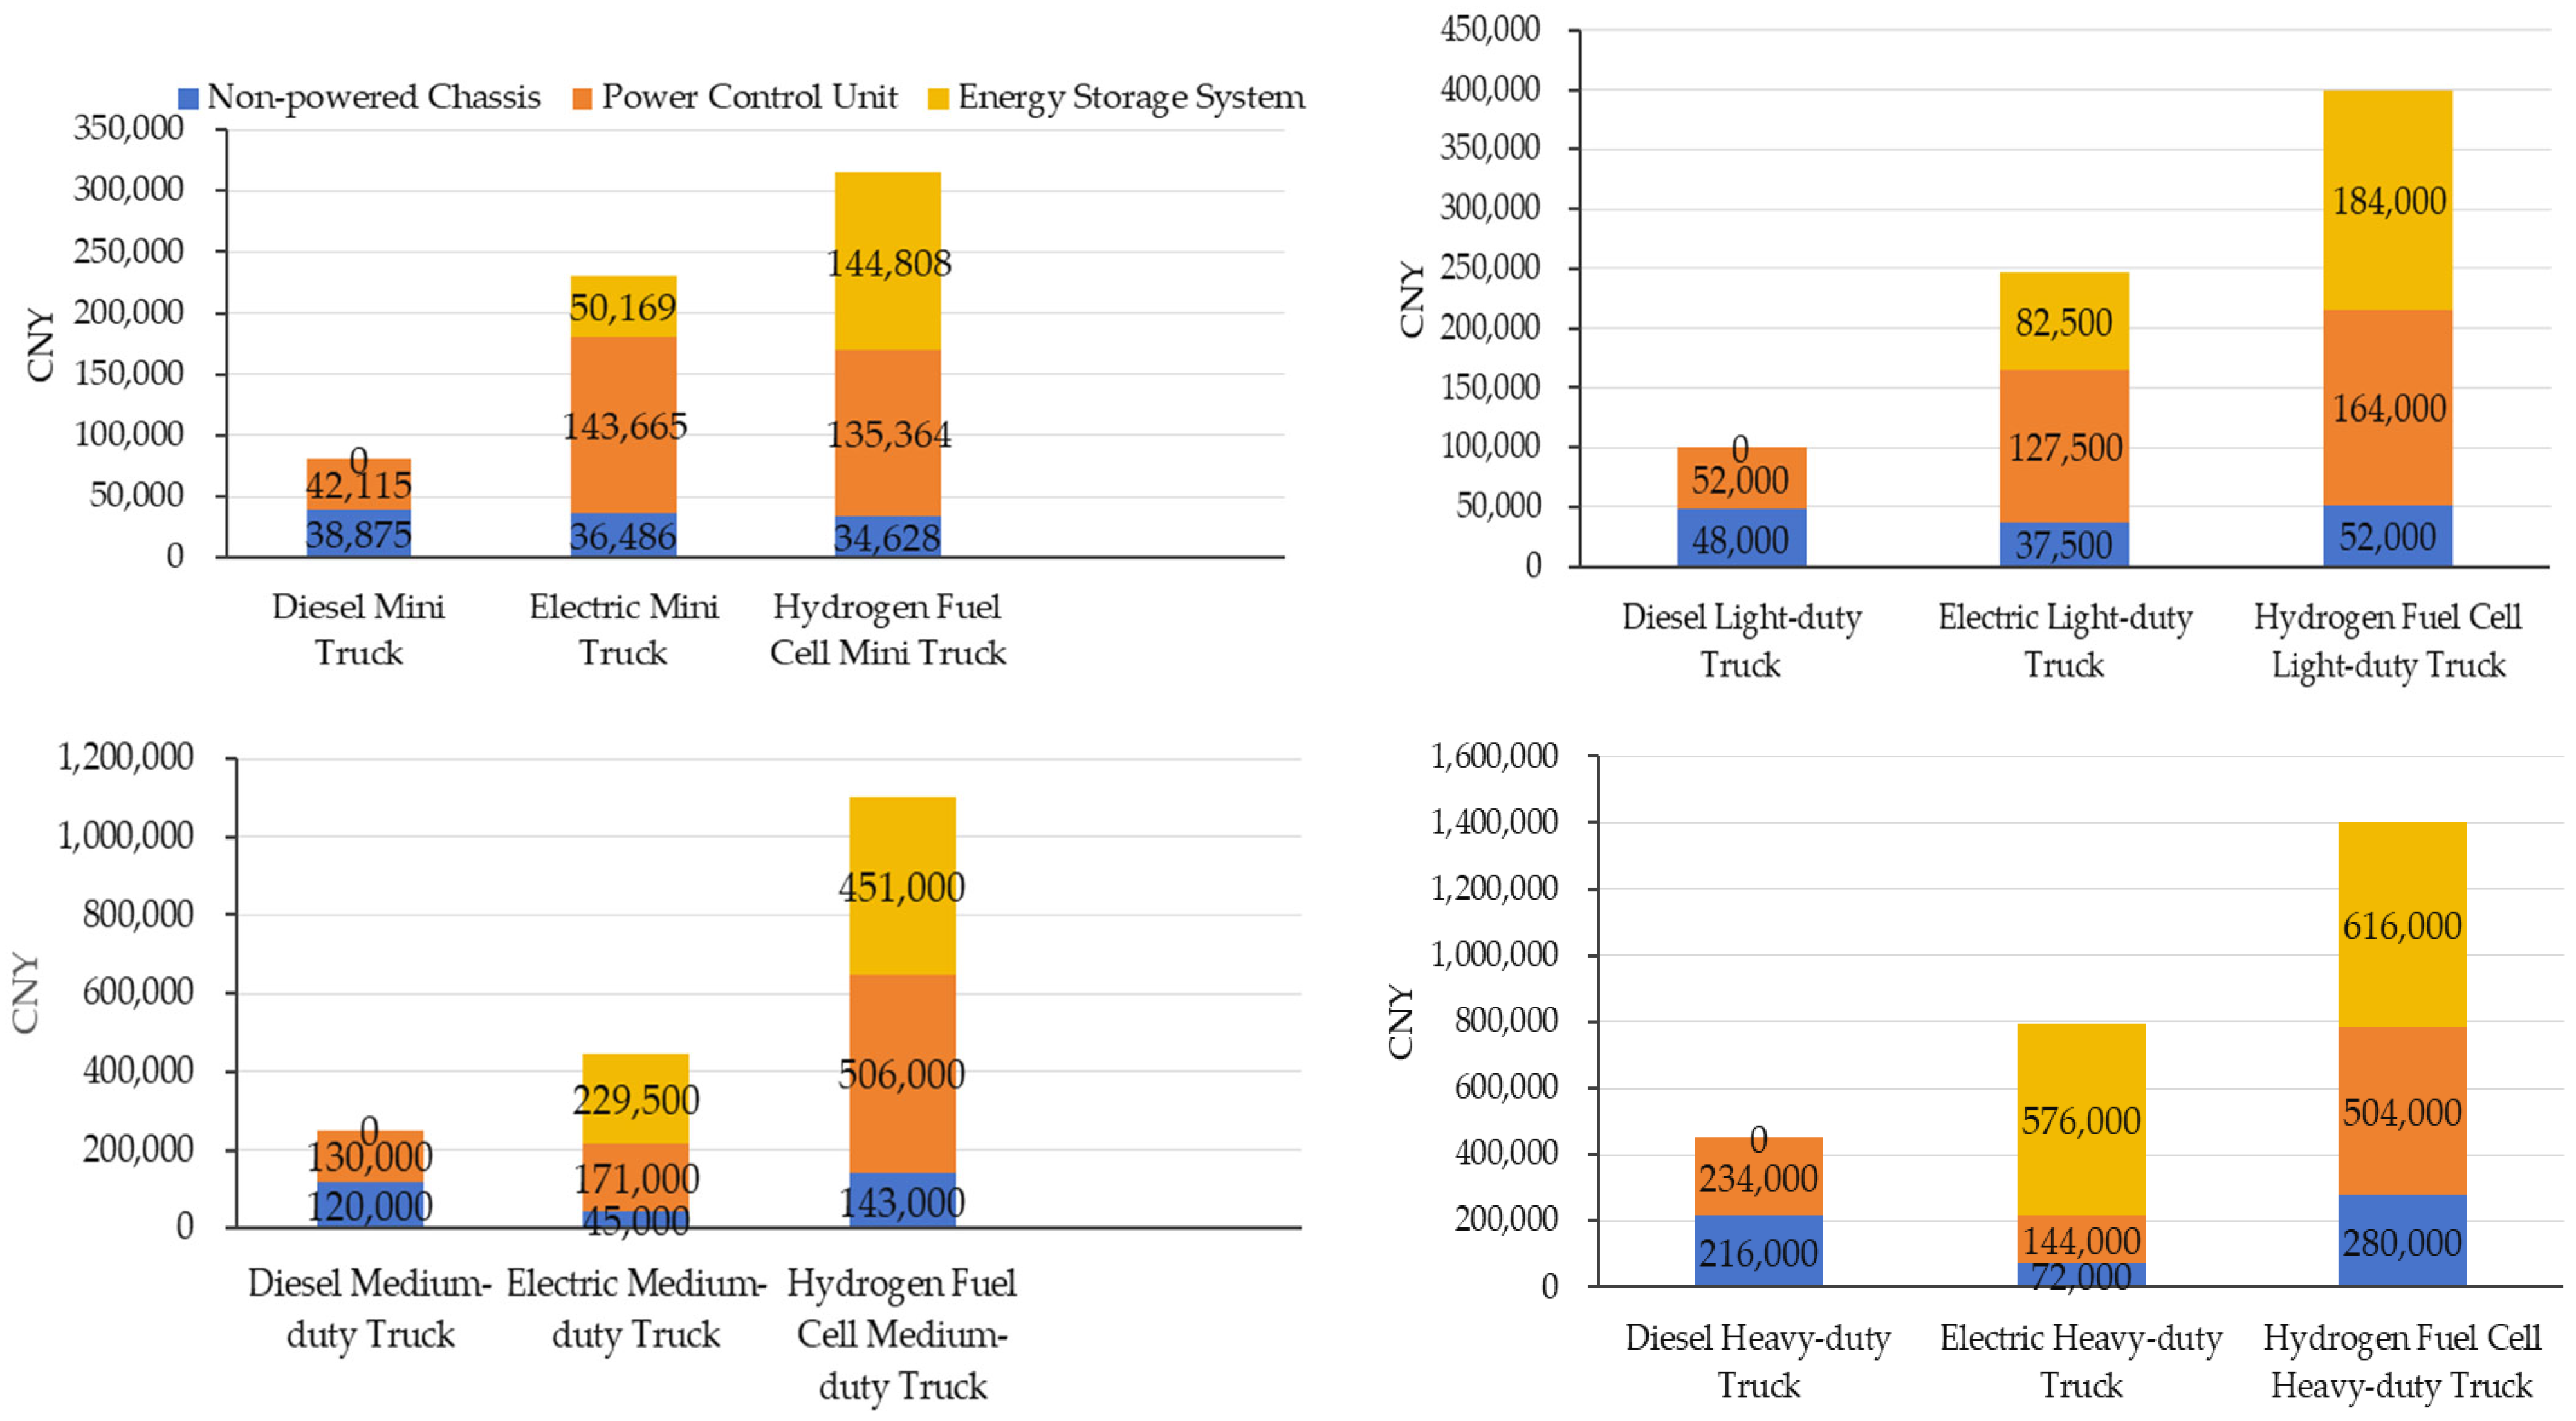
Figure 3 breaks down purchase costs for the glider, electric drive unit, and energy storage pack. The main cost difference between traditional and new energy trucks lies in the energy storage pack. This is because the energy storage pack contributes more than 70% of the total purchase cost gap between new energy and diesel trucks, which is the core source of the upfront cost difference and the key driver of future TCO parity with technology maturity and scale expansion.
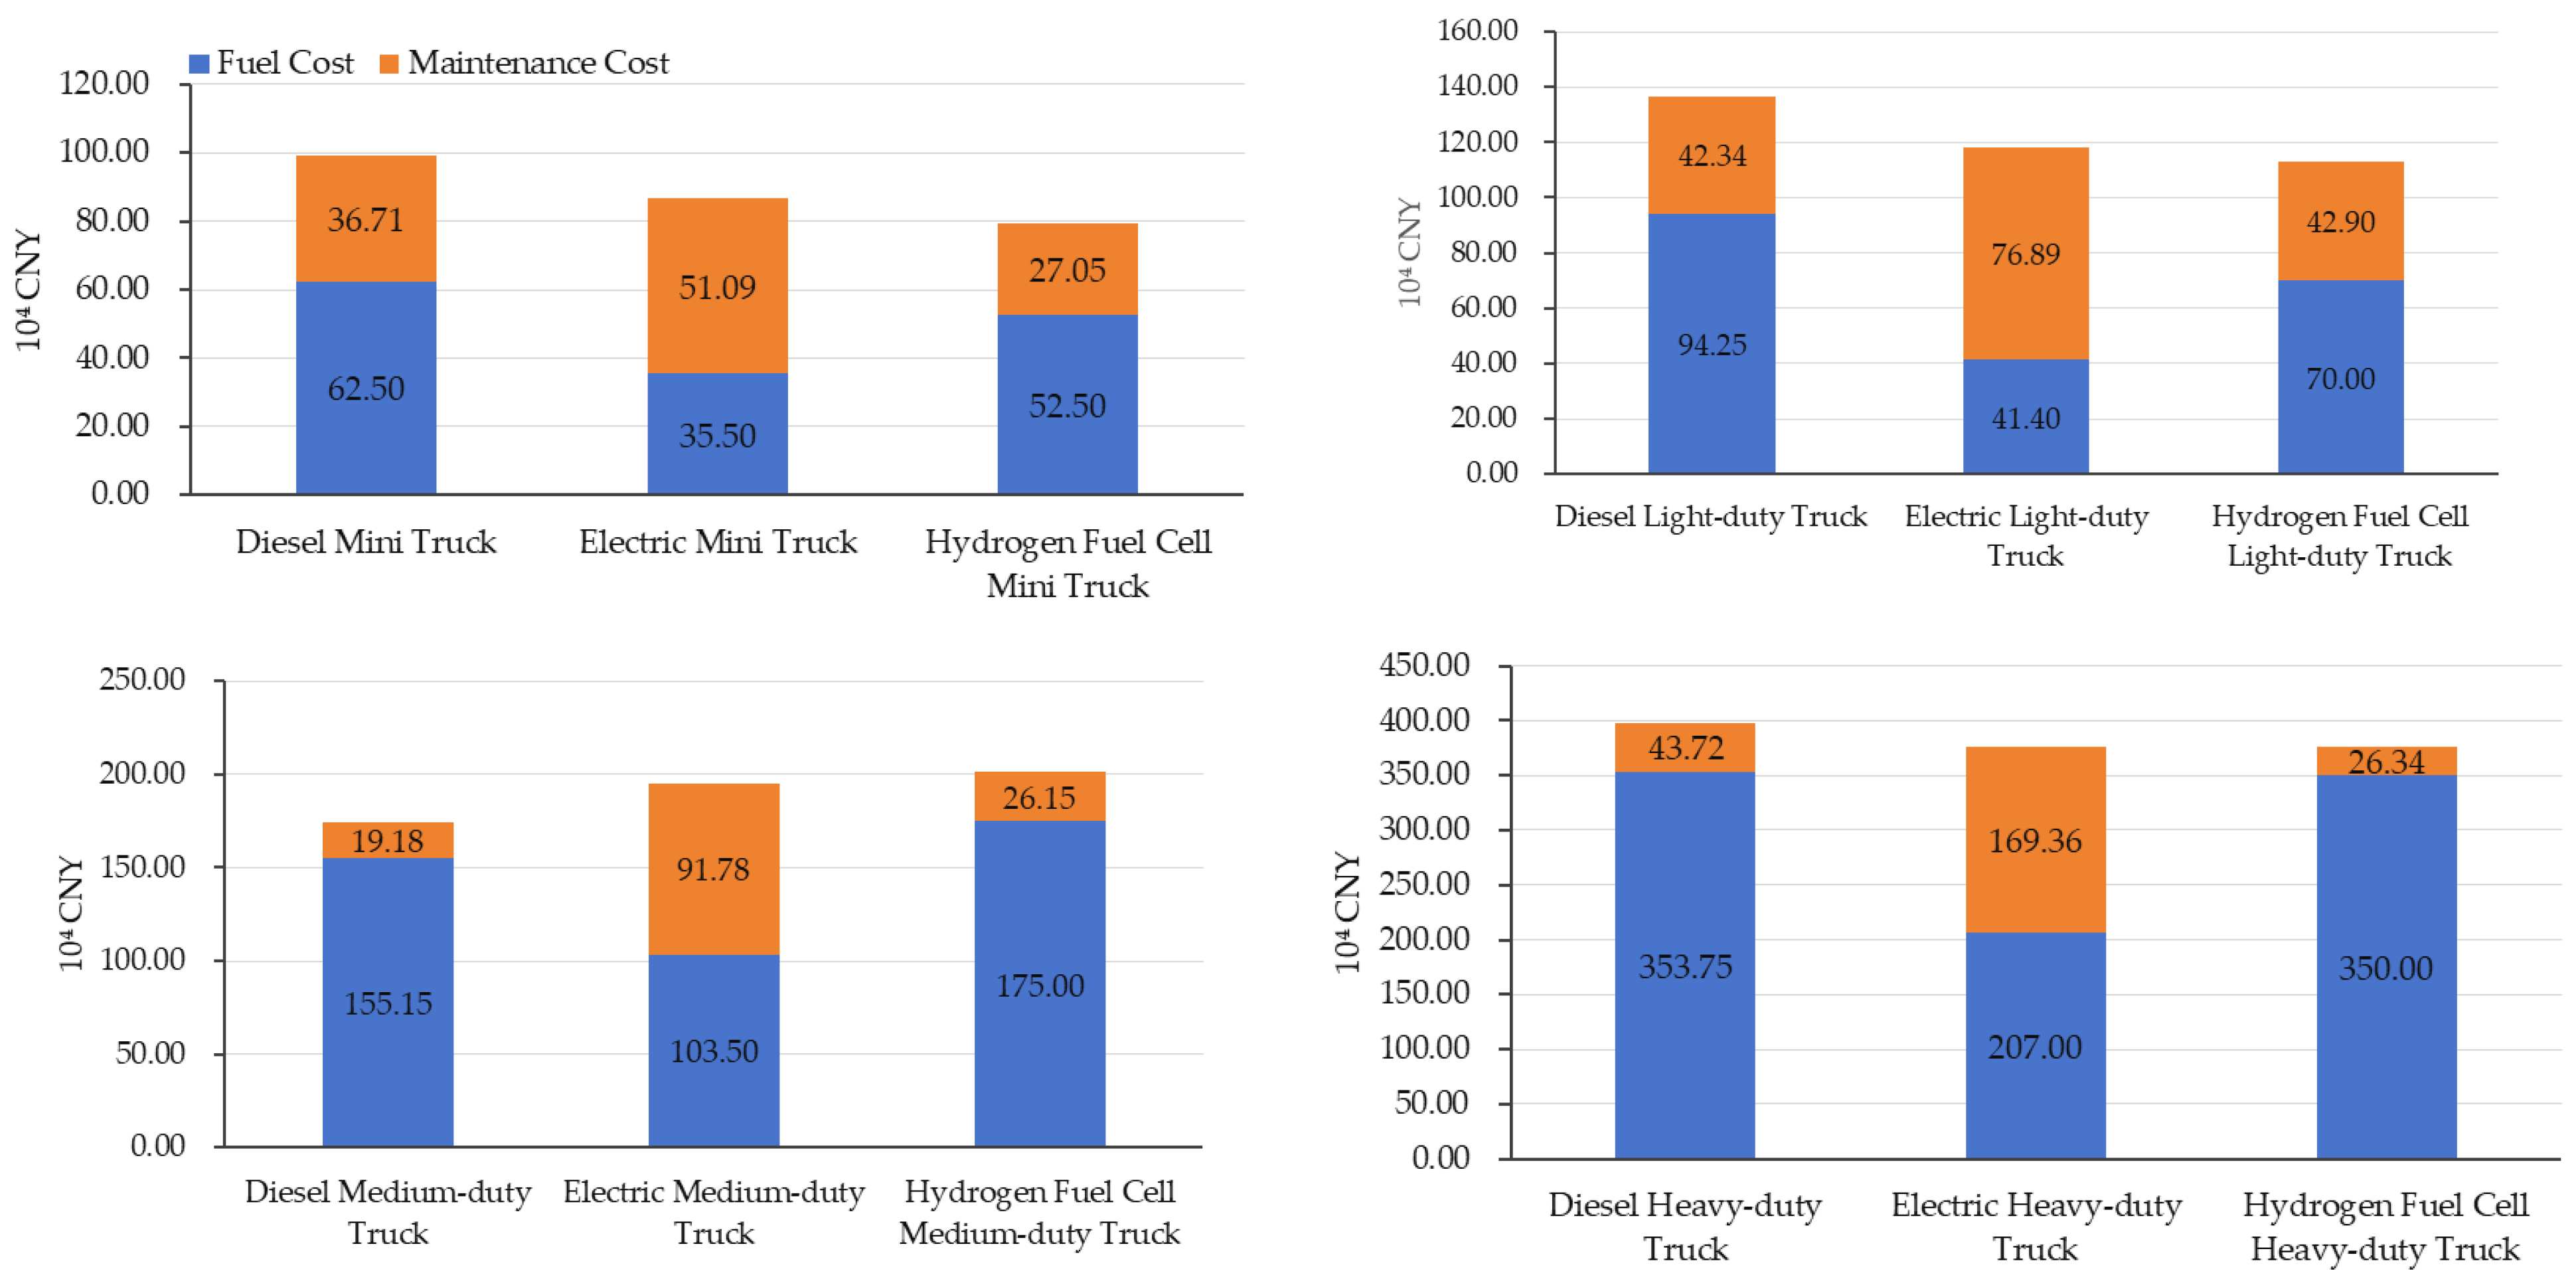
Figure 4 breaks down operating costs into fuel and maintenance expenses. Operating costs are higher for traditional diesel trucks than for most new energy models. This is because the energy conversion efficiency of electric motors (over 90%) is far higher than that of diesel internal combustion engines (less than 40%), which directly reduces per-kilometer energy costs under China’s current electricity and diesel price system. New energy models also have lower maintenance costs due to their simpler powertrain structure and fewer wearing parts.
4.1.2. Year of TCO Parity
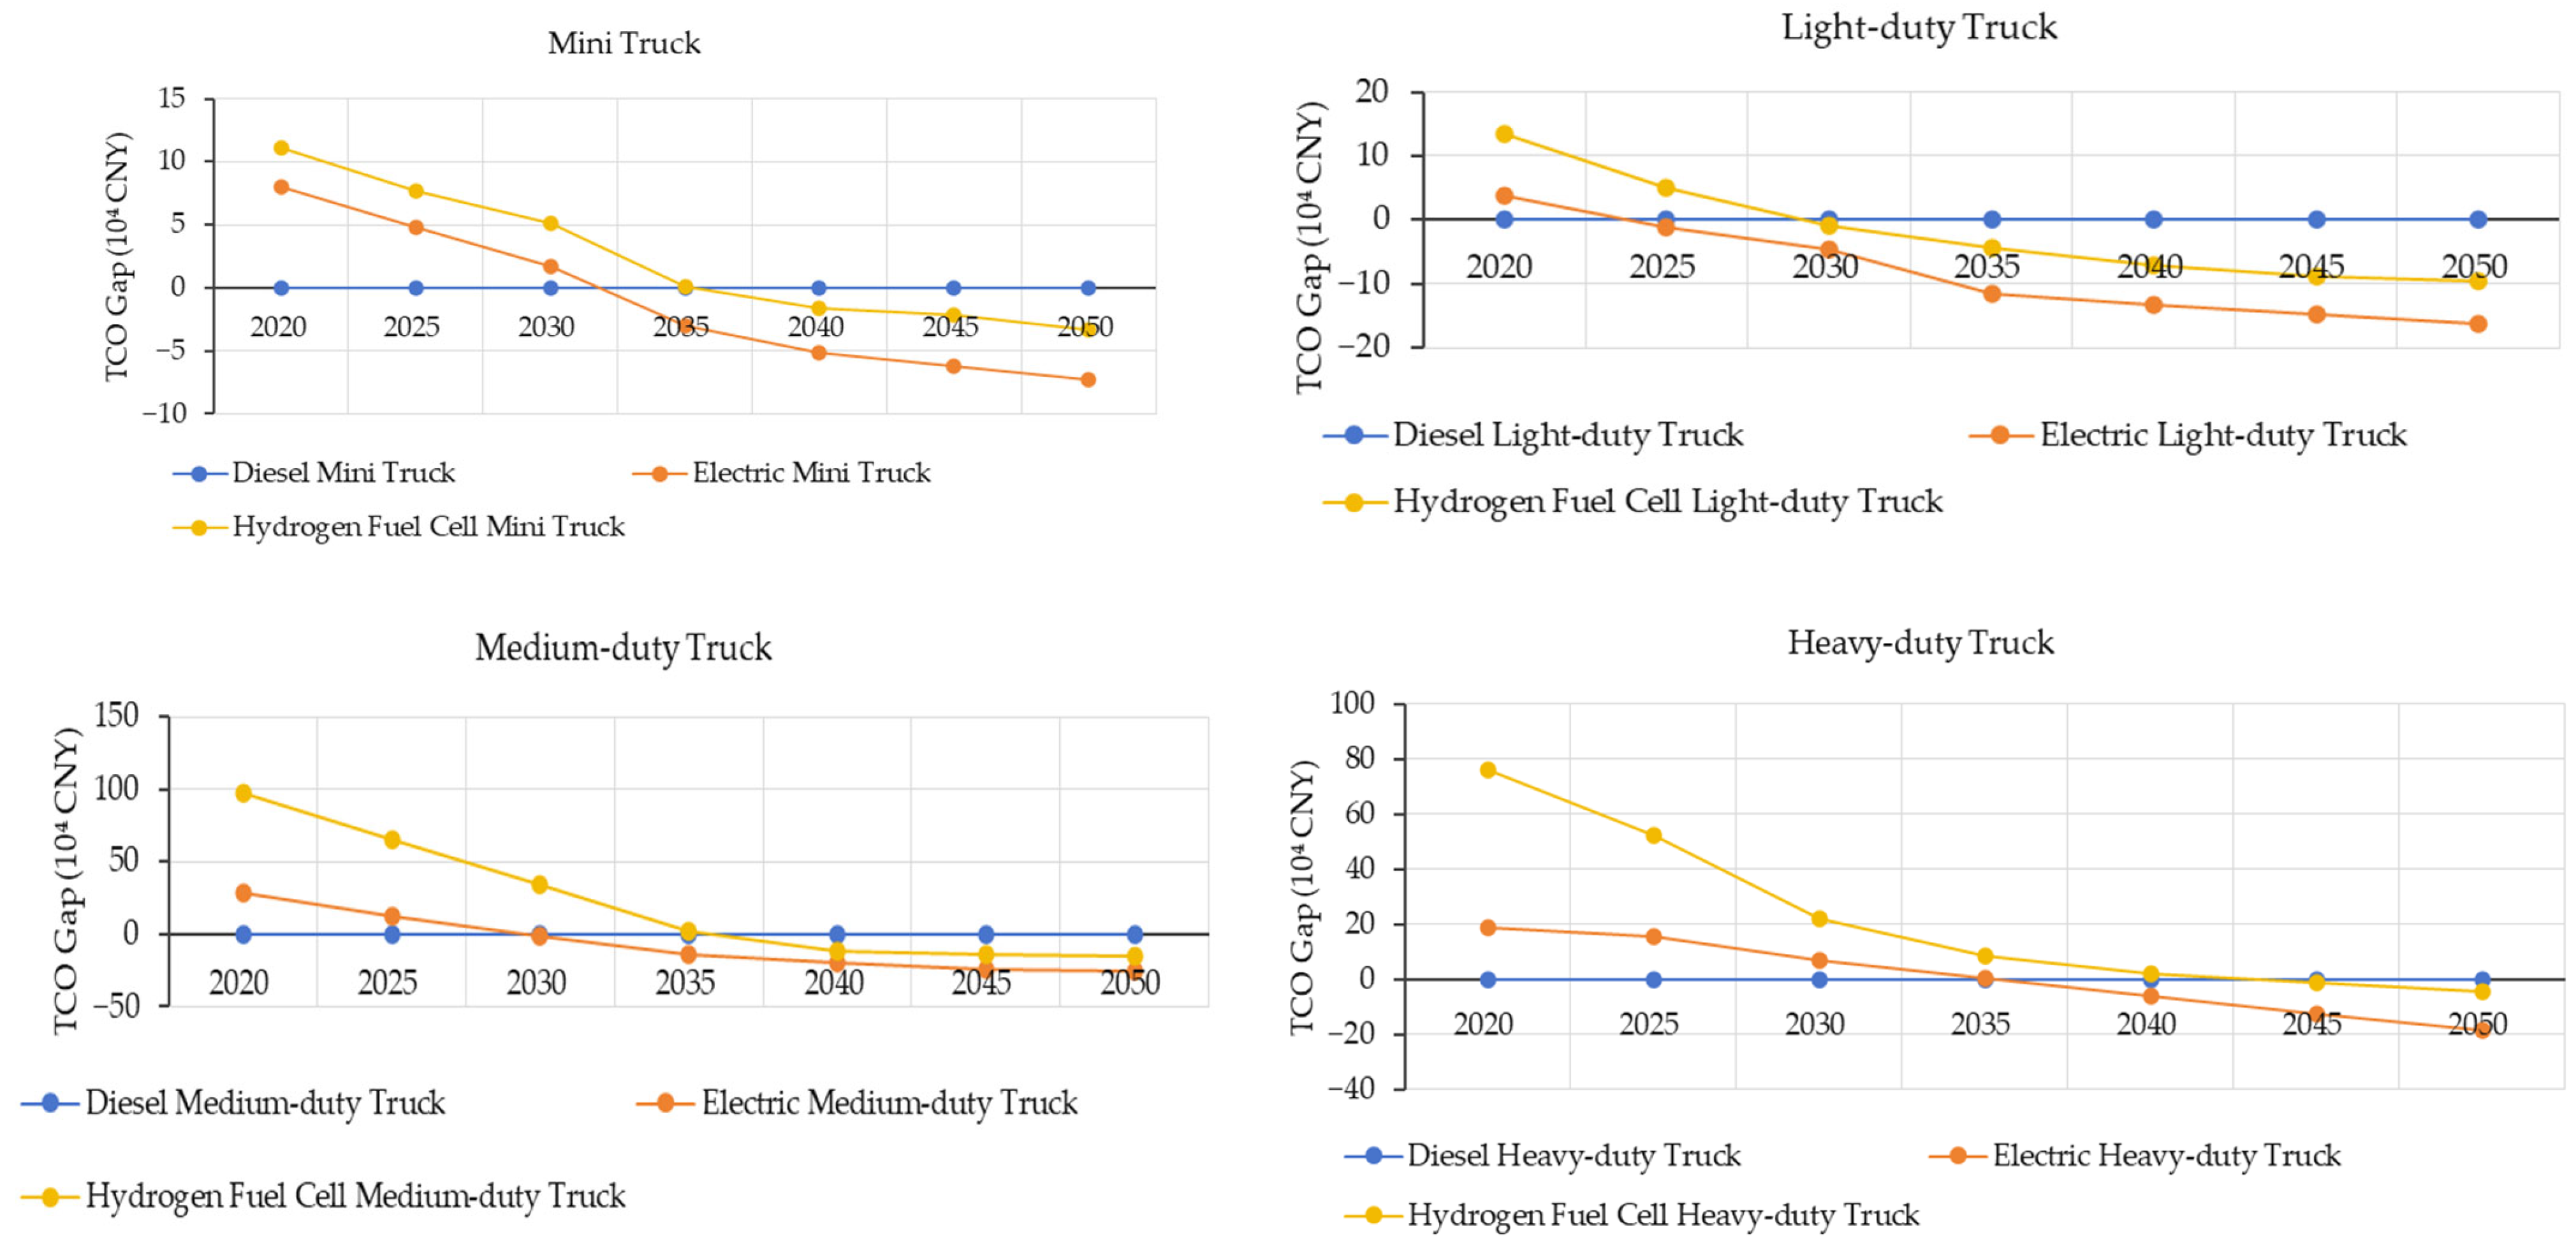
Figure 5 shows the staggered TCO parity years for each model: light-duty electric trucks achieve parity earliest (in 2024), while heavy-duty fuel cell trucks are the latest in 2043, with battery electric models reaching parity earlier than fuel cell models across all categories. This result is driven by three core factors: (1) higher annual mileage accelerates the accumulation of operating cost savings to offset upfront costs, (2) China’s mature power battery industry chain has a faster cost reduction path than fuel cell technology, and (3) light-duty urban distribution scenarios are more suitable for current electric truck technology than long-haul heavy-duty scenarios.
Notably, heavy-duty truck TCO parity varies by logistics scenario: battery electric models achieve parity 3–5 years earlier for fixed-route port/mine drayage, while long-haul trunk logistics (the dominant heavy-duty application) has slower parity progress, consistent with our baseline average result.
The above TCO parity years serve as the necessary economic threshold (rather than a trigger for instantaneous full market substitution) for large-scale new energy truck deployment in the subsequent fleet adoption model and scenario analysis. Once a specific truck type (mini/light/medium/heavy) powered by electricity or hydrogen achieves TCO parity with its diesel counterpart, it gains fundamental economic competitiveness, but its market penetration follows a gradual uptake trajectory with inherent lag effects, constrained by three key real-world factors: (1) Infrastructure lag: The construction of supporting charging/hydrogen refueling stations generally lags 1–3 years behind vehicle TCO parity, restricting large-scale application in cross-regional long-haul scenarios. (2) Market and operational inertia: Fleet operators’ long-standing procurement habits, the immature second-hand market for new energy commercial vehicles, and phased adjustments to policy subsidies lead to a delayed market response to cost parity. (3) Supply side constraints: The limited production capacity of new energy trucks and supply bottlenecks of core components (power batteries, fuel cell stacks) slow the pace of large-scale market rollout.
Specifically, after reaching TCO parity, the annual penetration growth rate of electric/hydrogen trucks is set to increase incrementally (5–10% year-on-year for electric trucks, 3–8% year-on-year for hydrogen fuel cell trucks) until reaching the scenario-set penetration ceiling, rather than achieving full substitution instantaneously. This adoption rule is consistently applied across all scenario settings (
Section 5.2.3).
In addition, the robustness of the TCO parity results is further verified through discount rate sensitivity analysis (ranging from 3% to 10%). When the discount rate is reduced to 3%, the TCO parity time of new energy trucks is advanced by 0–1 year due to the higher present value of long-term operating cost savings; when the discount rate rises to 10%, the parity time is delayed by 1–3 years, but all new energy truck models can still achieve TCO parity with diesel trucks before 2050. This confirms that the core conclusion of the economic competitiveness of new energy trucks is not affected by the change in discount rate within the reasonable range of China’s freight market.
We further verify the robustness of the TCO parity results based on the constructed scenario-based hydrogen price forecasting system. Under the Conservative Scenario (high hydrogen price), the TCO parity time of hydrogen fuel cell trucks is delayed by 2–4 years across all vehicle types, but all models can still achieve parity with diesel trucks before 2050; under the Accelerated Scenario (low hydrogen price), the parity time of fuel cell trucks is advanced by 1–3 years, and heavy-duty fuel cell trucks can achieve TCO parity with diesel trucks as early as 2040. The change in hydrogen price only affects the specific parity time of fuel cell trucks but does not change the core conclusion: all new energy trucks can achieve TCO parity with diesel trucks before 2050, and electrification shows better economic competitiveness than hydrogen fuel cell technology across all vehicle types in the Chinese context.
Notably, the above TCO parity results are highly dependent on China-specific parameters and market conditions, including (1) China’s mature lithium battery industry chain and rapidly declining power battery costs, which directly drive the early parity of electric trucks; (2) the operational characteristics of China’s freight trucks (e.g., 55,000 km annual mileage for heavy-duty trucks and 28,000 km for light-duty trucks), which amplify the operating cost advantage of electric models; and (3) China’s policy environment, including purchase subsidies for new energy trucks and driving restrictions on diesel trucks, which further improve the economic competitiveness of electric models. The economic comparison between electrification and hydrogen technology is strictly limited to the above Chinese context and baseline assumptions and cannot be directly generalized to other countries and regions with different cost structures, operational modes, or policy environments.
4.2. Life Cycle Emission Results
4.2.1. Life Cycle GHG Emissions of Different Truck Types in the Base Year (2020)
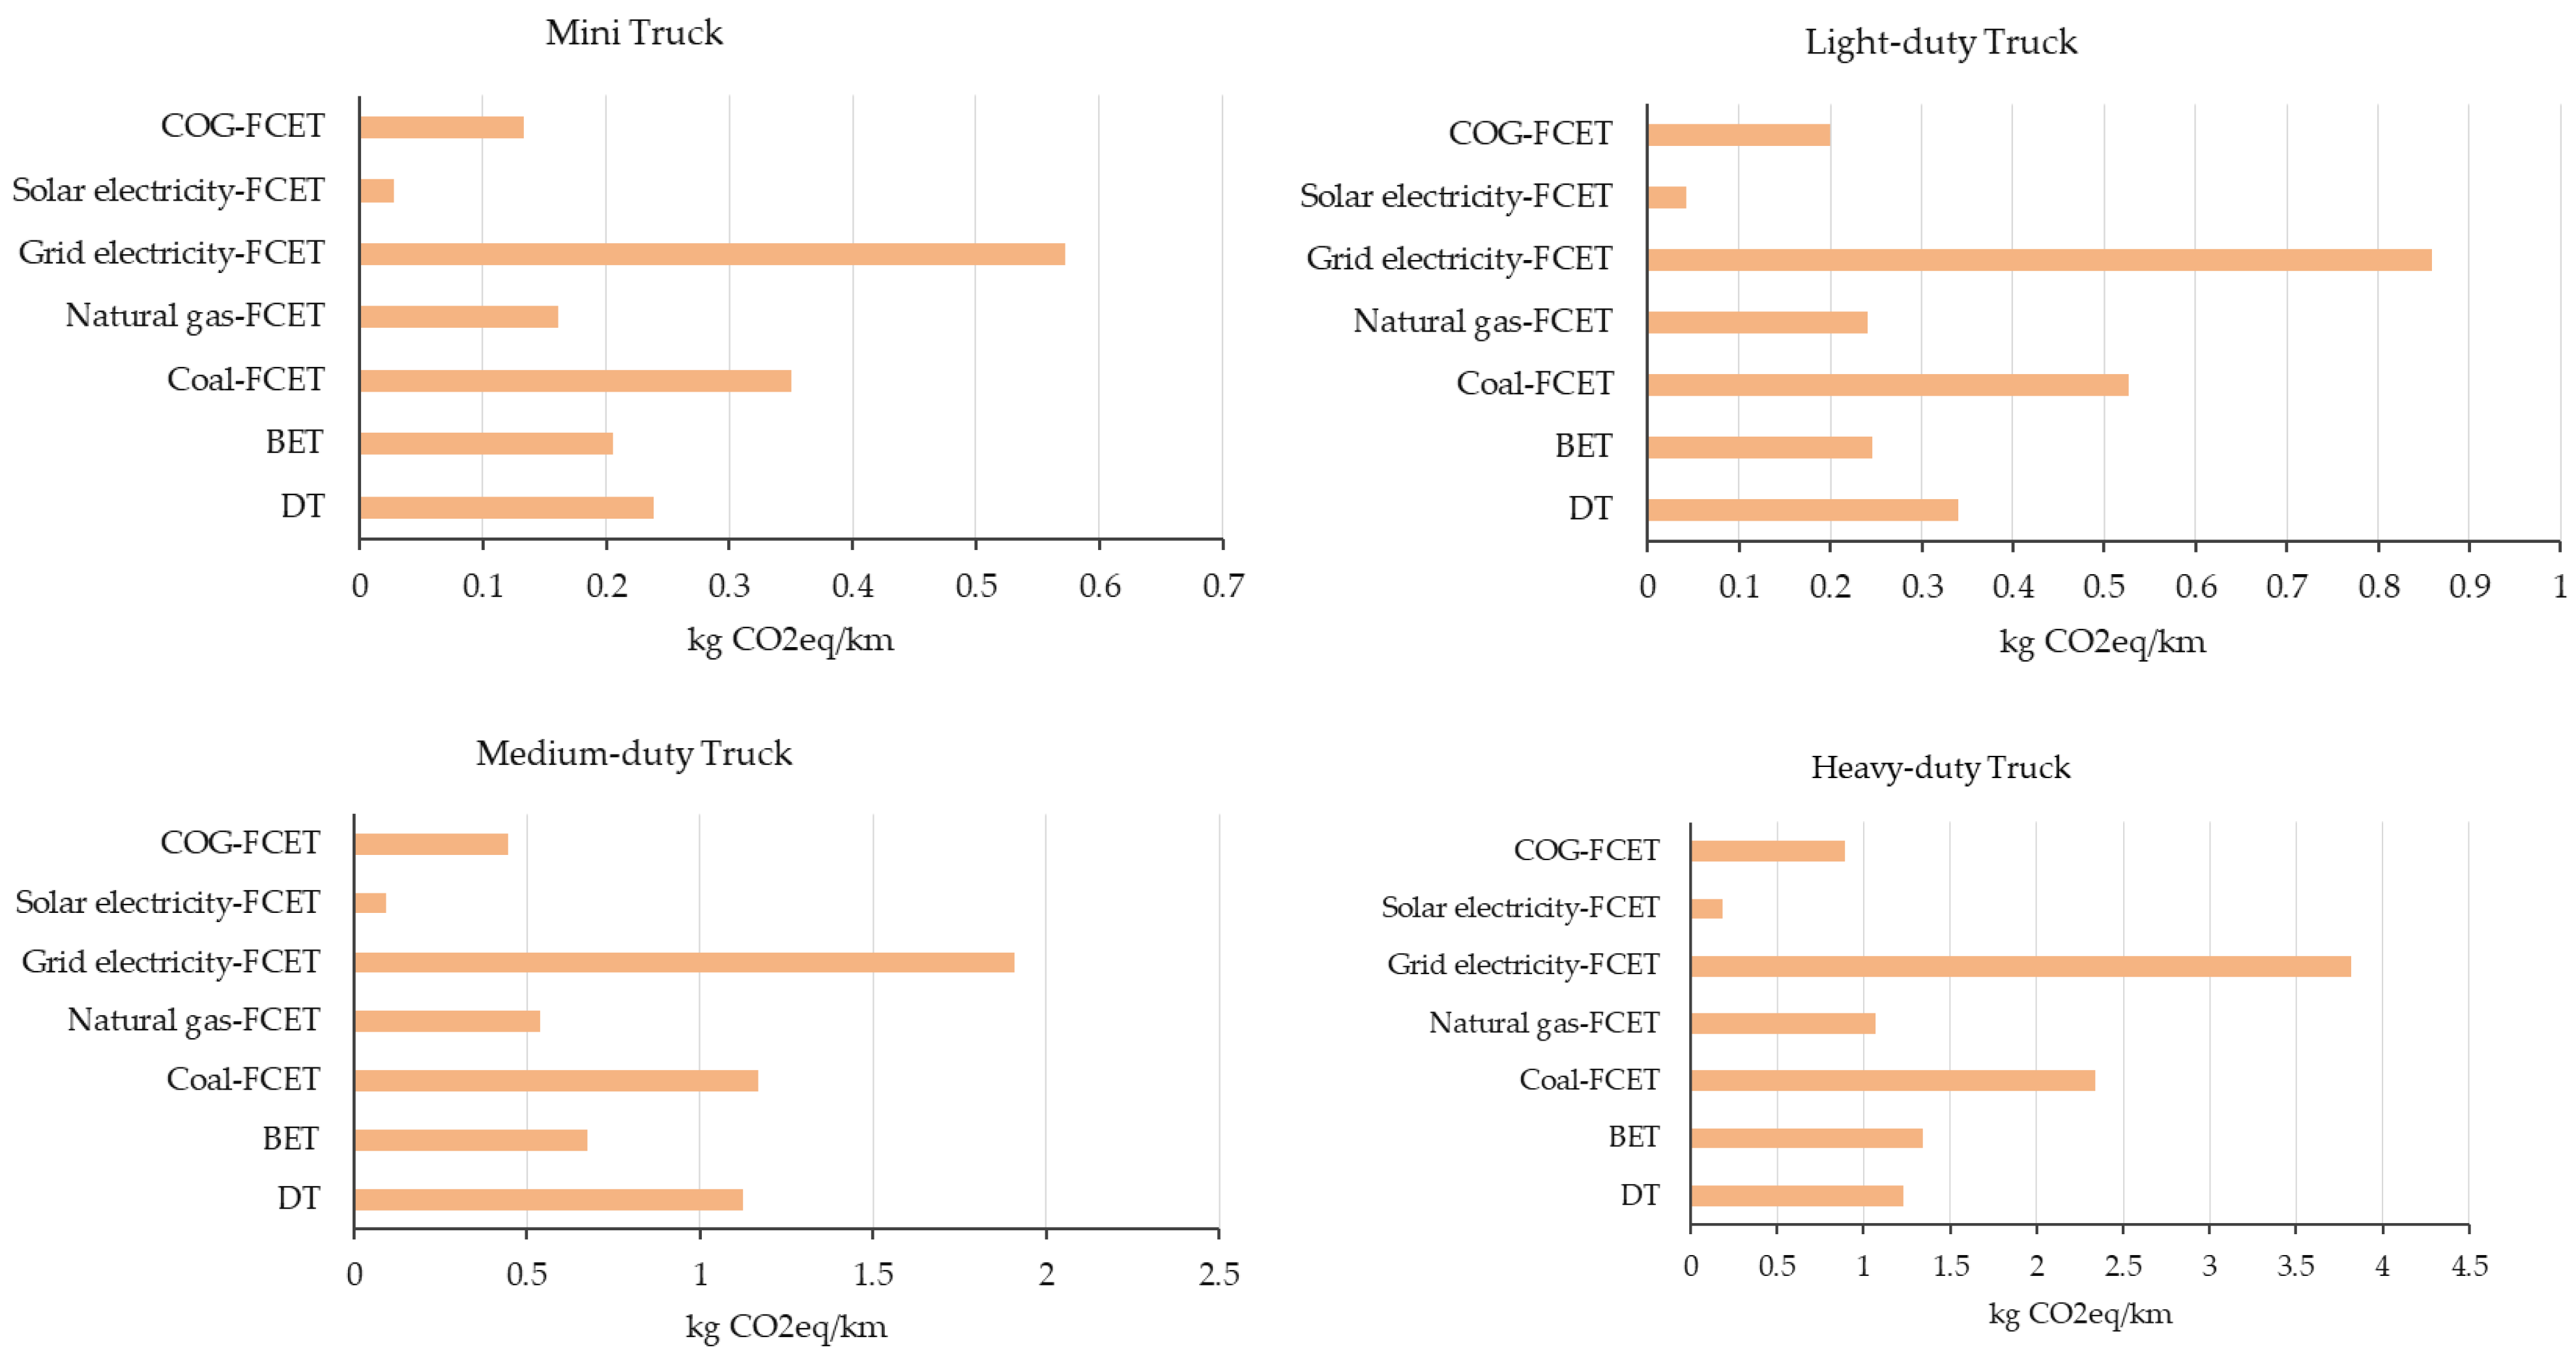
Figure 6 presents GHG emissions for four truck types under different technical pathways in 2020. Electric mini and light- and medium-duty trucks reduce GHG emissions by 14%, 27.7%, and 40.0% compared with diesel trucks, respectively, while electric heavy-duty trucks emit about 9.2% more. This divergent result arises because China’s 2020 power grid was still dominated by coal-fired power, and the much higher per-kilometer electricity consumption of heavy-duty trucks amplifies upstream grid emissions, offsetting their zero-tailpipe-emission advantage. The hydrogen production pathway is the core determinant of fuel cell truck life cycle emissions: solar electrolysis hydrogen achieves over 85% emission reduction, while grid electrolysis and coal-based hydrogen have higher emissions than diesel. This is because over 90% of fuel cell truck life cycle emissions come from the hydrogen production stage, and the carbon intensity of different production pathways varies by an order of magnitude.
4.2.2. Life Cycle Emissions of Different Truck Types from 2020 to 2050
By 2050, China’s power supply will be largely decarbonized to achieve a net-zero emission economy, shifting from coal-dominated to renewable-dominated generation, which will greatly affect the full life cycle emissions of fuel cell and electric trucks.
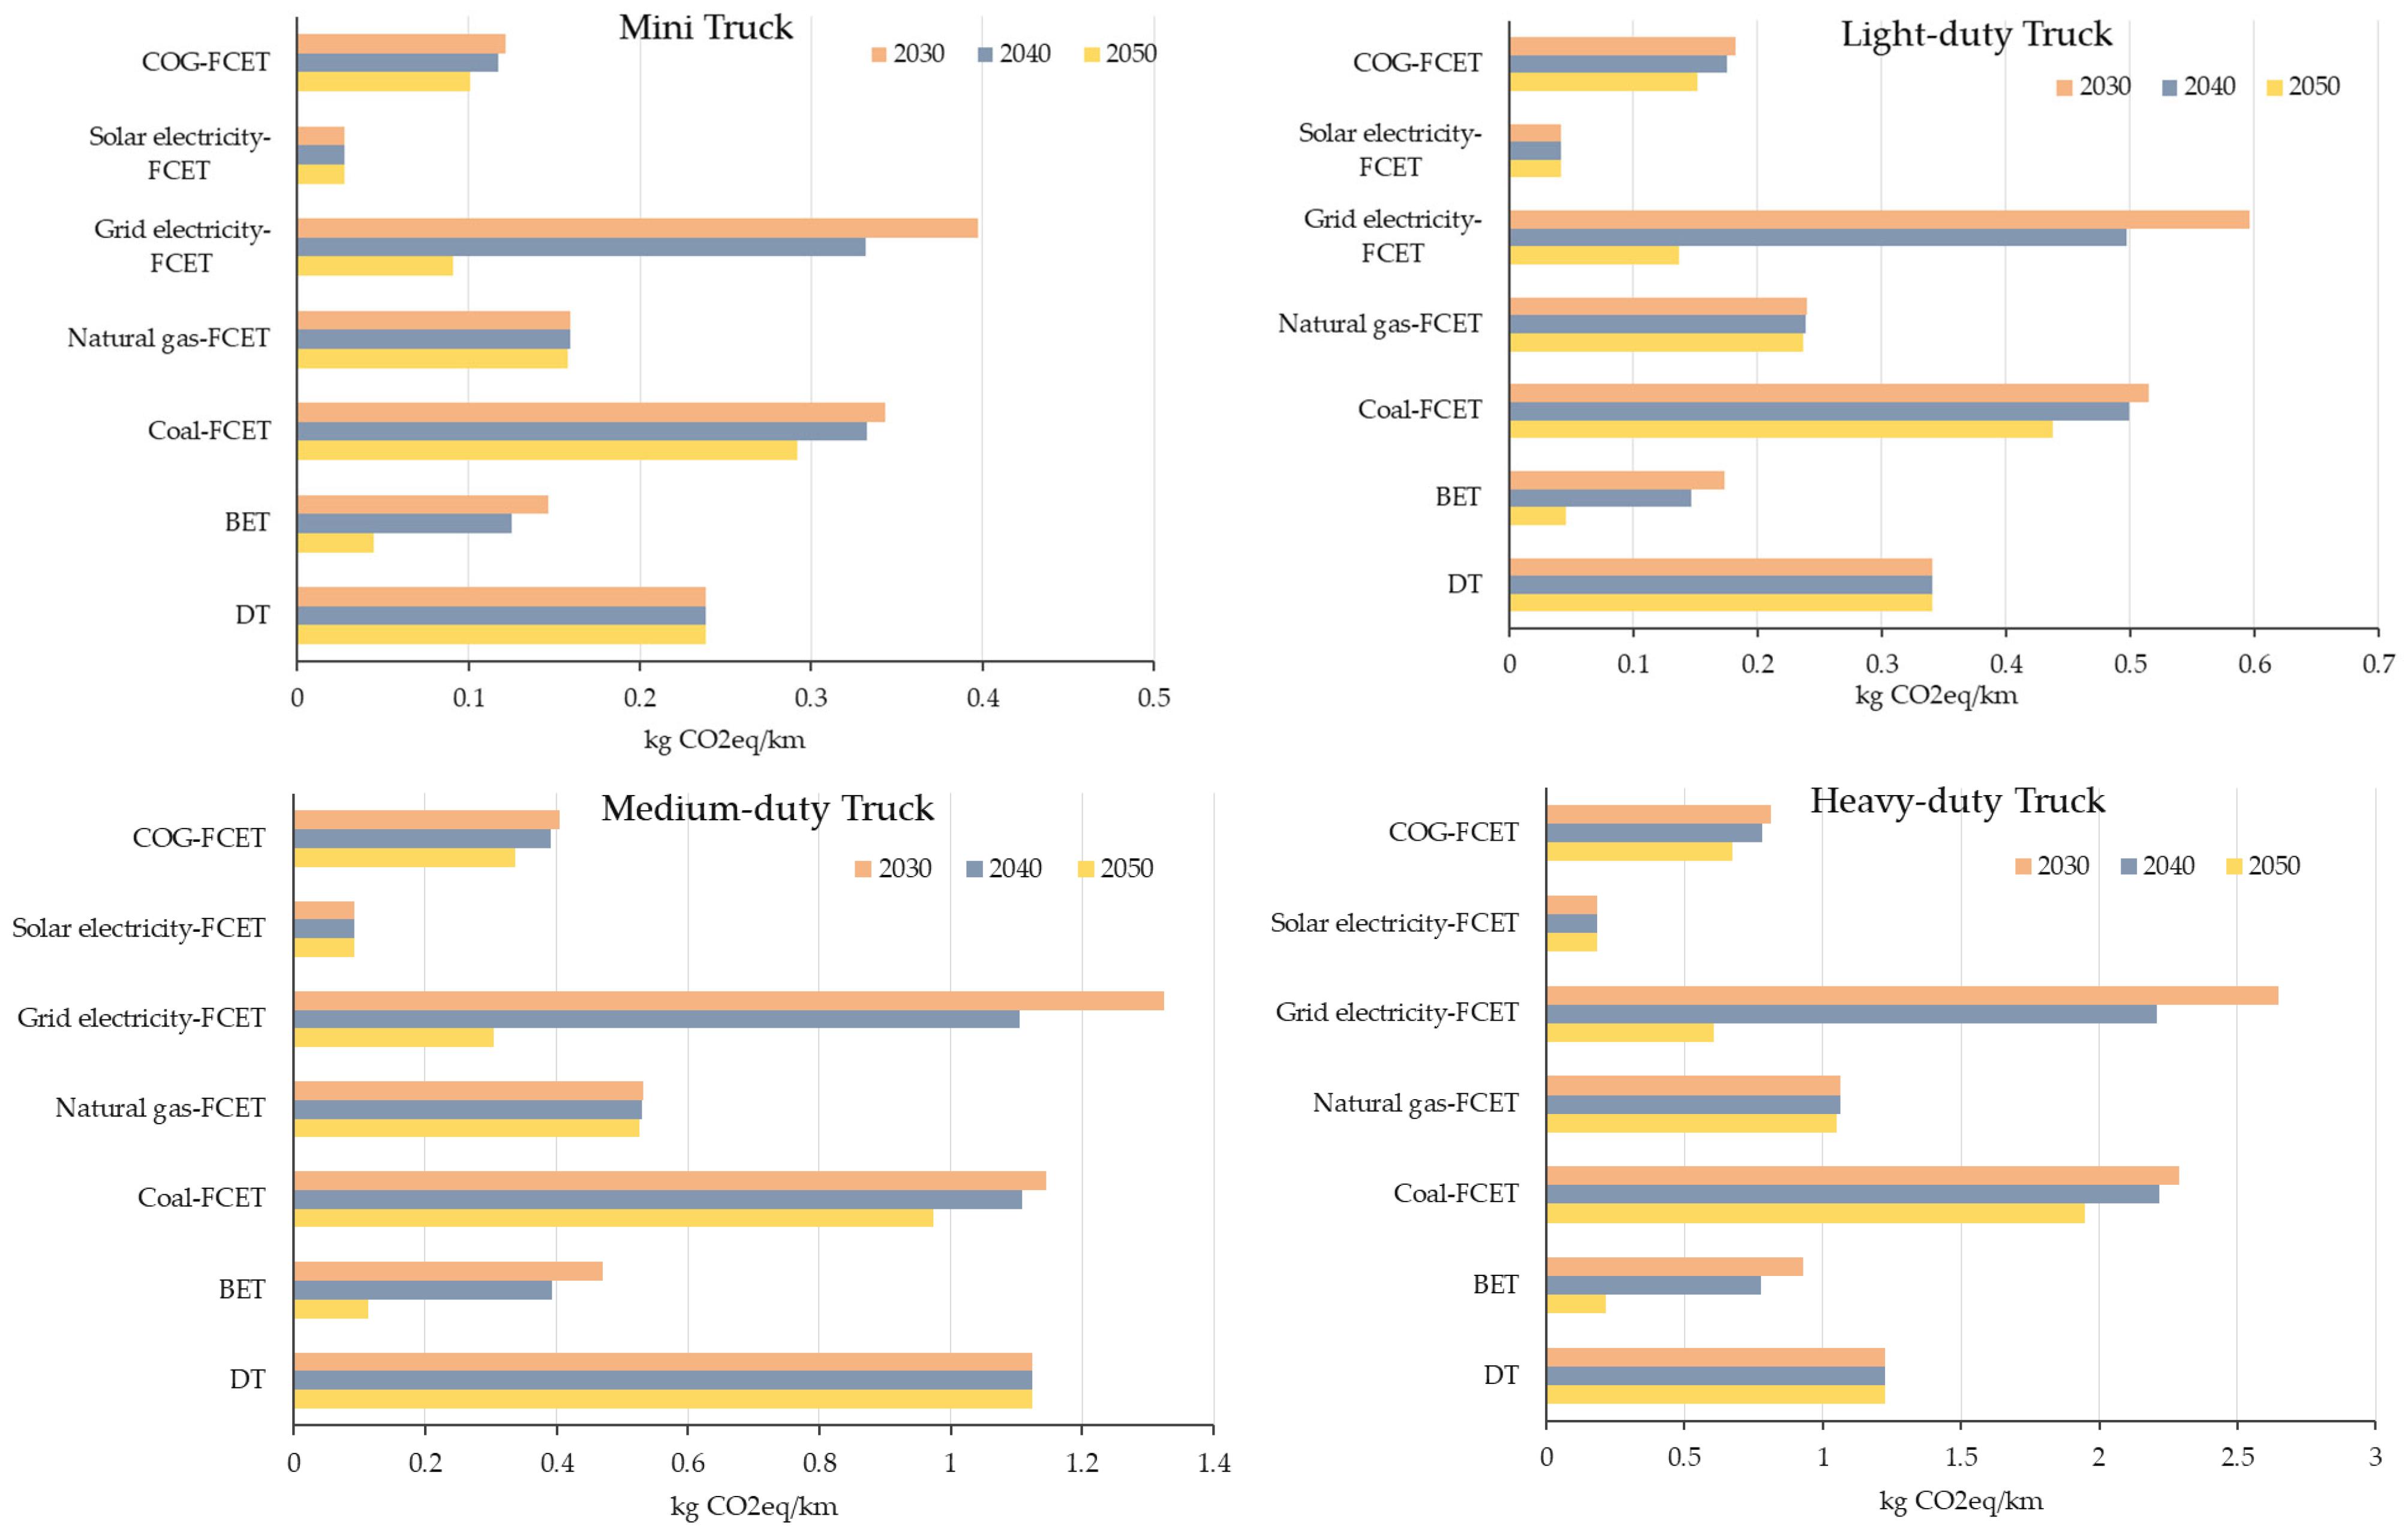
Figure 7 shows fuel cycle GHG emissions for four truck types in 2030, 2040, and 2050.
The results show that with grid decarbonization, the GHG reduction ratio of electric trucks expands from −9.2–40% in 2020 to nearly 90% by 2050, and grid electricity water electrolysis becomes a viable low-carbon hydrogen production pathway. This dramatic improvement occurs because China’s power grid will achieve deep decarbonization by 2050 (coal-fired power share dropping to 5%), which directly eliminates the upstream emission disadvantage of electric trucks and grid electrolysis hydrogen, fully releasing their zero-emission potential. By 2050, almost all new energy models achieve lower life cycle emissions than diesel trucks, except coal-based hydrogen mini/light-duty models, which have inherent high carbon emissions from coal gasification.
The above life cycle emission results are closely tied to China-specific power grid decarbonization planning and hydrogen production structure. The significant improvement in emission reduction effects of electric and fuel cell trucks is based on China’s unique energy transition path: coal-fired power will drop from 52% in 2030 to 5% in 2050, and renewable-powered water electrolysis will dominate hydrogen production by 2050. The emission reduction performance of different technical pathways will vary significantly in regions with different power grid structures and hydrogen production systems, so the above conclusions are only applicable to China’s energy transition context set in this study.
4.2.3. Model Validation
To verify the reliability and accuracy of the truck fleet GHG emission accounting and forecasting model, this study conducts historical back-testing validation by comparing model-simulated outputs with authoritative real-world historical emission data.
Data Source: Real historical data are all from official and industry-recognized authoritative sources: 2015–2020 truck sales/ownership data from China Association of Automobile Manufacturers (CAAM), real historical fleet GHG emission data from the Annual Report on China’s Motor Vehicle Environmental Management (Ministry of Ecology and Environment of China) and ICCT’s China Heavy-Duty Commercial Vehicle Emission Report, and historical operation parameters from the National Bureau of Statistics of China.
Validation Method and Metric: We input 2015–2020 historical parameters into the model to simulate annual total GHG emissions of China’s truck fleet and compare the results with real historical data. The Mean Absolute Percentage Error (MAPE) is used to quantify simulation accuracy, which is the mainstream metric for emission model validation.
Table 10 compares model-simulated results and real historical emissions from 2015 to 2020. The validation results confirm that the model has high simulation accuracy: the average MAPE of the six-year validation period is 3.82%, and the maximum annual error does not exceed 5.6%. This verifies that the model can reliably reflect the actual emission trend of China’s truck fleet, and the model outputs are fully credible for subsequent scenario forecasting and analysis.
5. Scale Emission Reduction Potential Analysis of Road Freight Fleet
5.1. Dynamic Model of Freight Truck Market
5.1.1. Model Sales Forecast by Truck Type Based on LSTM Neural Network
Truck sales data show significant non-linearity, seasonality, and periodicity, which cannot be fully captured with traditional linear forecasting methods. Therefore, in this study, we adopted the Long Short-Term Memory (LSTM) model, a special variant of the Recurrent Neural Network (RNN) that effectively solves the gradient disappearance and explosion problems of traditional RNNs in long-term time series forecasting, to predict the future sales of four truck types (mini, light-duty, medium-duty, heavy-duty) [
46].
- (1)
Data Source and Preprocessing
The original dataset comprises the monthly sales data of each truck type in China from January 2015 to December 2023, obtained from the China Association of Automobile Manufacturers (CAAM), with a total of 108 monthly samples for each truck type. To eliminate the impact of dimensional differences and improve model convergence, the Min-Max normalization method is used to scale the original sales data to the range of [0, 1], with the following normalization formula:
where
is the normalized value, x is the original sales value, and
and
are the maximum and minimum values of the original sales series, respectively. The data are restored to the original dimension after the forecasting is completed.
- (2)
Training and Testing Dataset Split
For time series forecasting, the dataset was split based on chronological order to avoid data leakage, rather than randomly. For the 2015–2023 monthly dataset, the first 80% of the samples (January 2015 to December 2021, 84 monthly samples) were used as the training set to fit the model parameters, and the last 20% of the samples (January 2022 to December 2023, 24 monthly samples) were used as the testing set to verify the out-of-sample forecasting performance of the model. The time step of the time series input was set to 12 months; that is, the sales data of the past 12 months were used to predict the sales value of the next month, which matches the annual cycle characteristics of China’s truck market.
- (3)
LSTM Model Architecture Details
An LSTM model was built based on the Python TensorFlow 2.15 framework, with a four-layer network structure designed for the truck sales time series characteristics, including one input layer, two stacked LSTM hidden layers, and one fully connected output layer. The detailed architecture parameters were as follows:
Input Layer: This layer’s input dimension is (12, 1), corresponding to the 12-month time step and the single feature of truck sales volume.
First LSTM Hidden Layer: This layer contains 64 neurons and has the tanh function as the main activation function and the sigmoid activation function for the input gate, forget, and output gates. A dropout layer with a rate of 0.2 is added after the layer to prevent model overfitting.
Second LSTM Hidden Layer: This layer contains 32 neurons, which is consistent with the tanh/sigmoid activation function settings of the first hidden layer, and a dropout layer with a rate of 0.2 is added to enhance the generalization ability of the model.
Fully Connected Output Layer: This layer contains one neuron with a linear activation function, which outputs the predicted sales value of the target month.
For model training, the Adam optimizer was selected with an initial learning rate of 0.001, the loss function was set to the Mean Squared Error (MSE), which is suitable for regression tasks, the batch size was set to 16, and the maximum training epoch was 200. An early stopping mechanism was introduced: when the validation set loss does not decrease for 10 consecutive epochs, the training is terminated early to avoid overfitting. Separate LSTM models were trained for each of the four truck types to ensure the forecasting accuracy for different market segments.
- (4)
Baseline Models for Performance Comparison
To verify the superiority of the LSTM model in truck sales forecasting, two mainstream baseline models were introduced for horizontal comparison, which are widely used in time series forecasting research:
Linear Regression Model: A classic linear forecasting model that uses the sales data of the past 12 months as independent variables to fit a linear relationship with the sales value of the target month, which is used to test the non-linear forecasting advantage of the LSTM model.
ARIMA Model: The most classic statistical model for stationary time series forecasting. The optimal order of the ARIMA model for each truck type is determined through the Akaike Information Criterion (AIC), and the final ARIMA(p,d,q) orders are ARIMA(2,1,1) for mini trucks, ARIMA(3,1,2) for light-duty trucks, ARIMA(2,1,1) for medium-duty trucks, and ARIMA(3,1,2) for heavy-duty trucks.
- (5)
Model Forecasting Performance Evaluation Metrics
Three widely used error metrics for time series forecasting were selected to quantitatively evaluate the performance of the LSTM and baseline models: Mean Absolute Error (MAE), Root Mean Squared Error (RMSE), and Mean Absolute Percentage Error (MAPE). The calculation formulas are as follows:
where
is the actual sales value,
is the predicted sales value, and n is the number of samples. The smaller the values of the three metrics, the higher the forecasting accuracy of the model.
- (6)
Model Performance Comparison Results
Table 11 shows the average forecasting performance of the LSTM model and two baseline models on the testing set for four truck types. The results show that the LSTM model significantly outperforms the linear regression and ARIMA models in all three evaluation metrics. Specifically, the average MAPE of the LSTM model across all truck types is 4.27%, which is 7.89 percentage points lower than the linear regression model (12.16%) and 5.32 percentage points lower than the ARIMA model (9.59%). This confirms that the LSTM model can better capture the non-linear, seasonal, and periodic characteristics of China’s truck sales data and has higher forecasting accuracy and stronger generalization ability. The sales forecast results of the LSTM model are used as the core input for subsequent truck ownership and fleet emission forecasting.
5.1.2. Scrap Volume Forecast
Authoritative vehicle scrap data are lacking in China, so the scrap volume was estimated. Argonne National Laboratory developed a two-parameter Logistic model to simulate vehicle survival rate as a function of age [
28]. The survival rate SR
n,v of vehicle type v in year n as a function of age k is given by
where SR
n,v is the survival rate of vehicle type v in year n, α
v is the shape coefficient related to mass retirement, and L
50,v is the age at which 50% of vehicles are retired.
According to the parameter estimation of the Logistic model, the age at which the survival rate of each truck type approaches zero (i.e., nearly complete scrappage) is basically consistent with the mandatory service life specified by the government, which conforms to the vehicle service life settings in the previous section. Therefore, it is assumed that the scrappage volume of each truck type equals the new sales volume from 12 or 15 years prior (corresponding to the service life of each vehicle type). Such an estimation is reasonably accurate over a relatively long period [
47].
5.1.3. Ownership Forecast by Truck Type
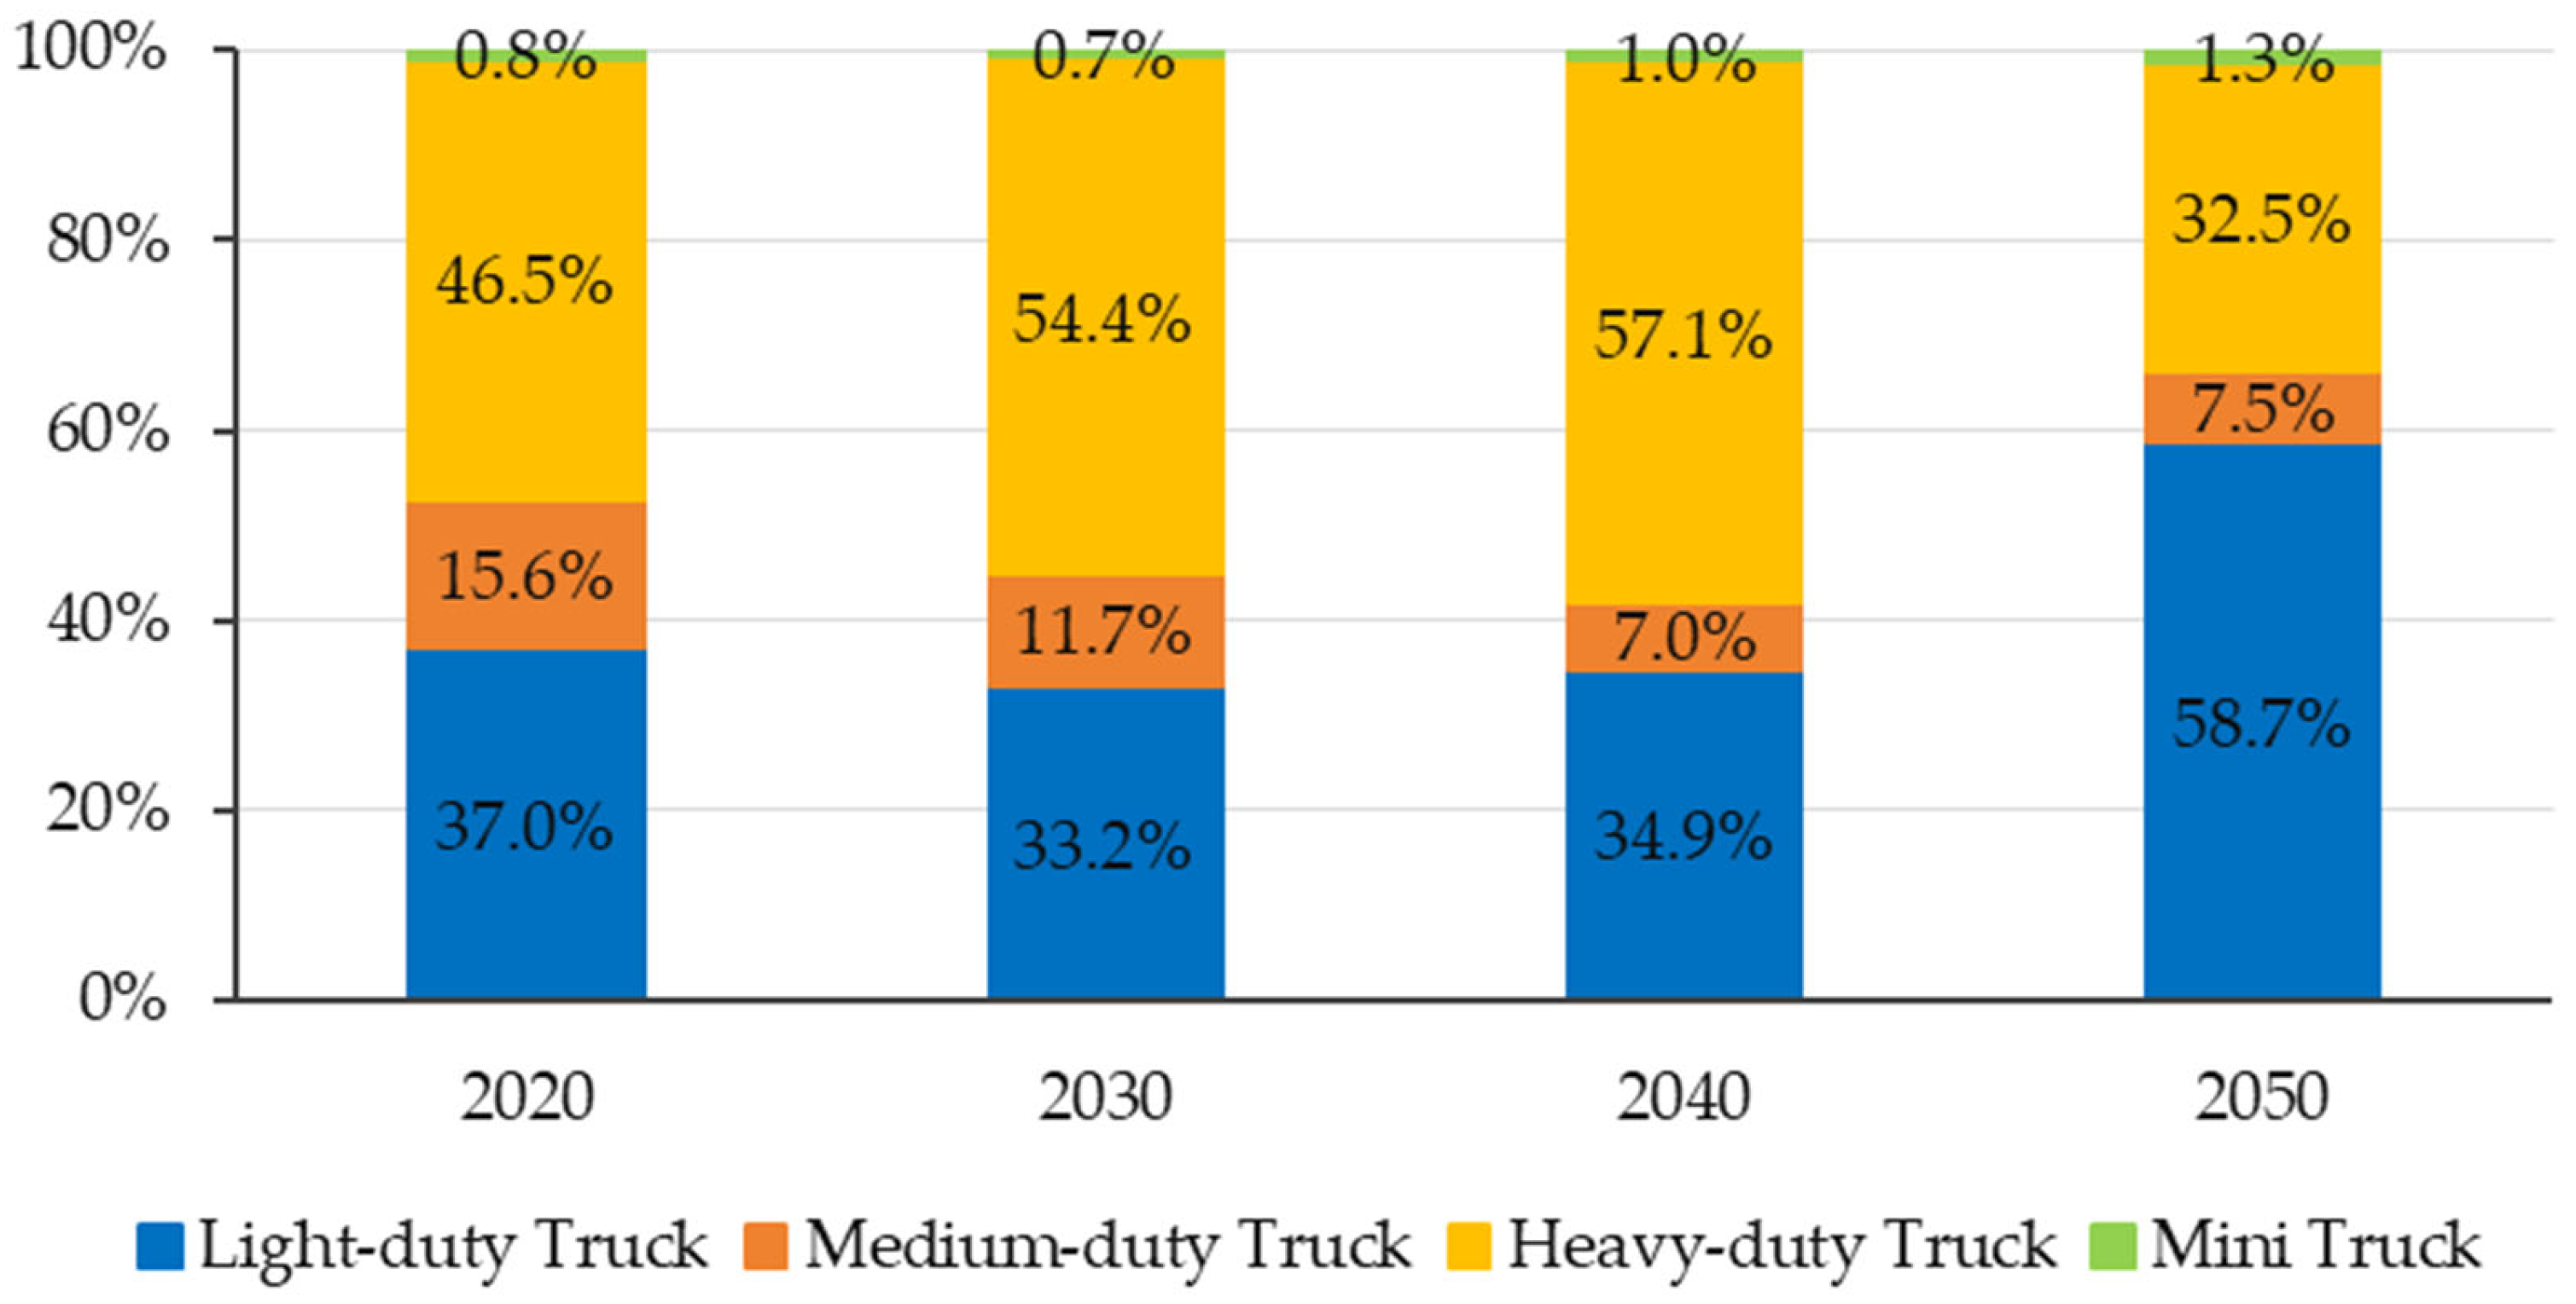
The fleet structure (share of mini/light/medium/heavy-duty trucks) is not static; it was dynamically extrapolated from the 2010 to 2023 historical data of the China Association of Automobile Manufacturers (CAAM) and National Bureau of Statistics, aligned with IEA and ICCT long-term commercial vehicle forecasts. The baseline trend accounts for logistics system evolution: the heavy-duty truck share rises from 32% (2020) to 38% (2050) to reflect intermodal transport and consolidation center development; the light-duty truck share remains stable; mini/medium-duty truck shares decline slightly in line with historical trends. In accordance with mainstream practices in global freight decarbonization research, we keep this baseline structure trend consistent across all scenarios to isolate the independent emission reduction effect of core policy variables (fuel economy improvement, new energy substitution) and avoid interference from structural changes on policy effect evaluation.
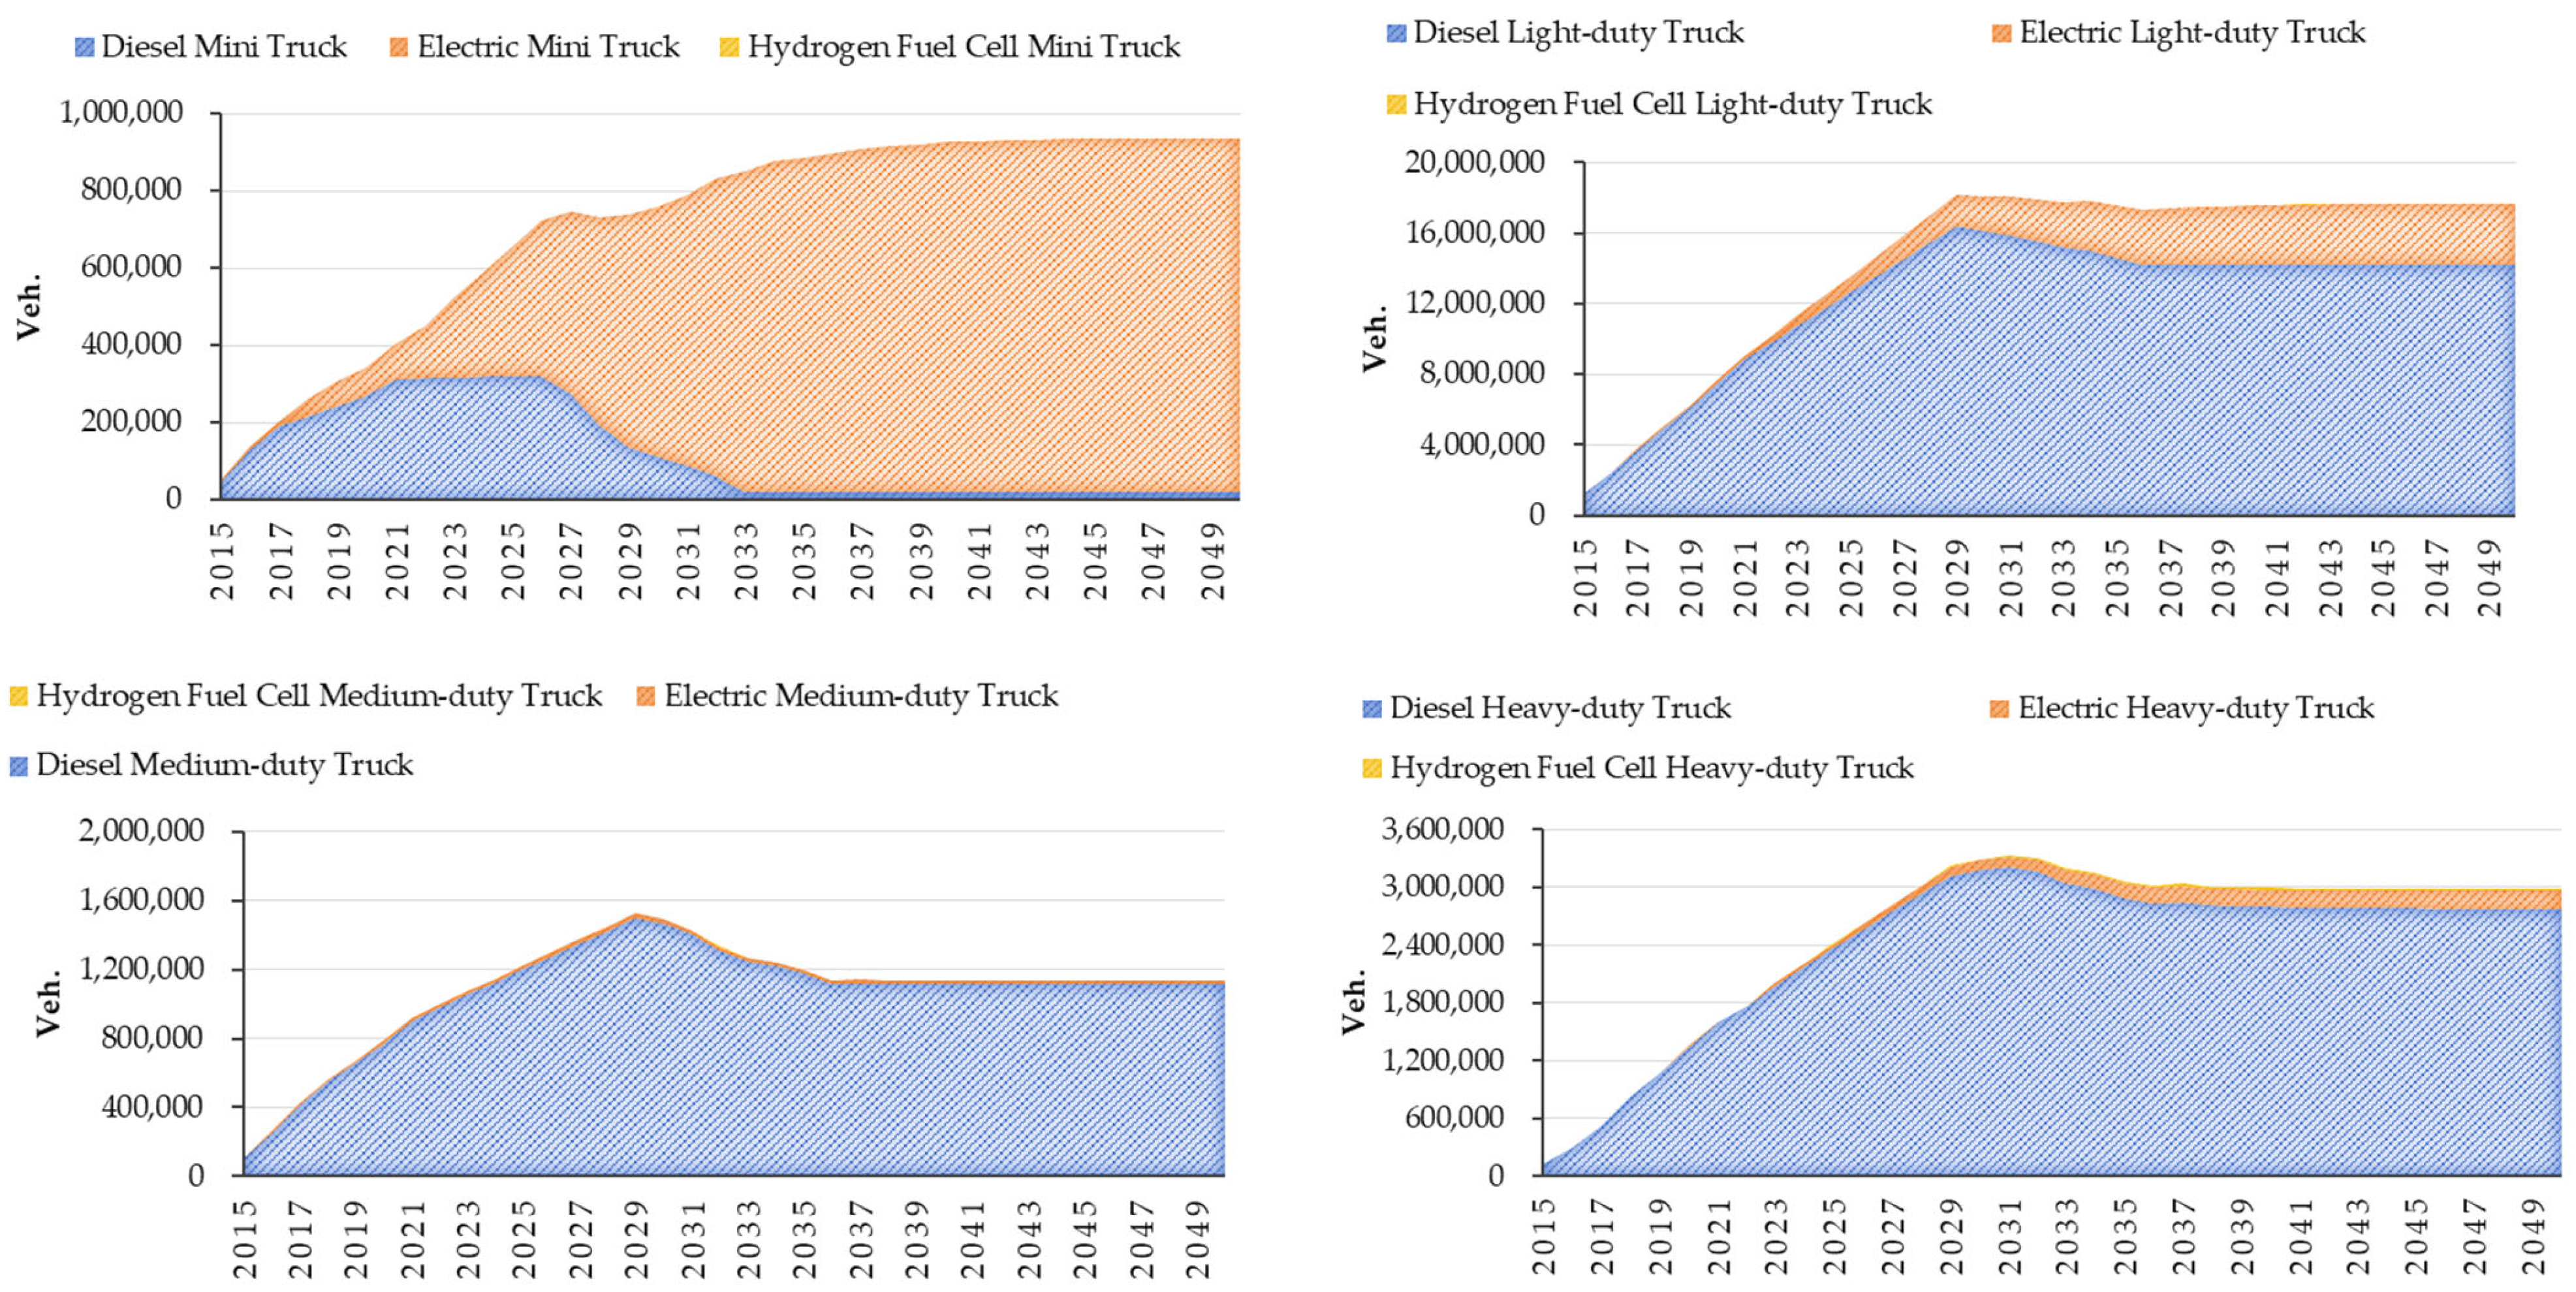
Based on current mandatory retirement regulations and data availability, the 2015 sales of diesel, battery electric, and hydrogen trucks for each model serve as the base ownership. Subsequent annual ownership equals previous ownership plus current sales minus current scrap volume (Equation (10)). The resulting truck ownership forecast is shown in
Figure 8.
where Stock
n−1,v,i is the inventory of vehicle type v using fuel type i in year n − 1, Sales
n,v,i is the sales of vehicle type v using fuel type i in year n, and Scrap
n,v,i is the scrap volume of vehicle type v using fuel type i in year n.
5.2. Cumulative Emission Reduction Benefit Analysis Model
5.2.1. GHG Emission Forecast
A bottom-up approach was used to calculate the GHG emissions of the road freight fleet:
where n is the target year, v is vehicle type, i is fuel type, Stock
n,v,i is the inventory of vehicle type v using fuel type i in year n, VKT
v is the annual mileage of vehicle type v (km/year), FE
n,v,i is the fuel economy of vehicle type v using fuel type i in year n (L/km for diesel, kgH
2/km for fuel cell, kWh/km for electric), and GHG
LC,n,v,i is the pathway-specific life cycle GHG intensity from the LCA of vehicle type v using fuel type i in year n (g/L for diesel, g/kgH
2 for fuel cell, g/kWh for electric).
The life cycle GHG emission intensity (GHG
LC,n,v,i) in Equation (11) is directly derived from the LCA results (
Section 4.2) with pathway-specific differentiation: (1) For diesel trucks (DTs), GHG
LC,n,v,i adopts the well-to-wheel (WTW) GHG emission intensity of diesel calculated through the LCA, which remains stable over the years. (2) For battery electric trucks (BETs), GHG
LC,n,v,i is the WTW GHG emission intensity corresponding to China’s annual power structure transformation (
Table 7), which decreases year by year as the grid decarbonizes. (3) For hydrogen fuel cell trucks (FCETs), GHG
LC,n,v,i is the weighted average WTW GHG emission intensity of five hydrogen production pathways (coal gasification, natural gas reform, grid electrolysis, solar electrolysis, coke oven gas) based on the annual hydrogen production structure (
Table 9), reflecting the emission differences in diverse hydrogen supply routes.
5.2.2. Hydrogen Production Structure Forecast
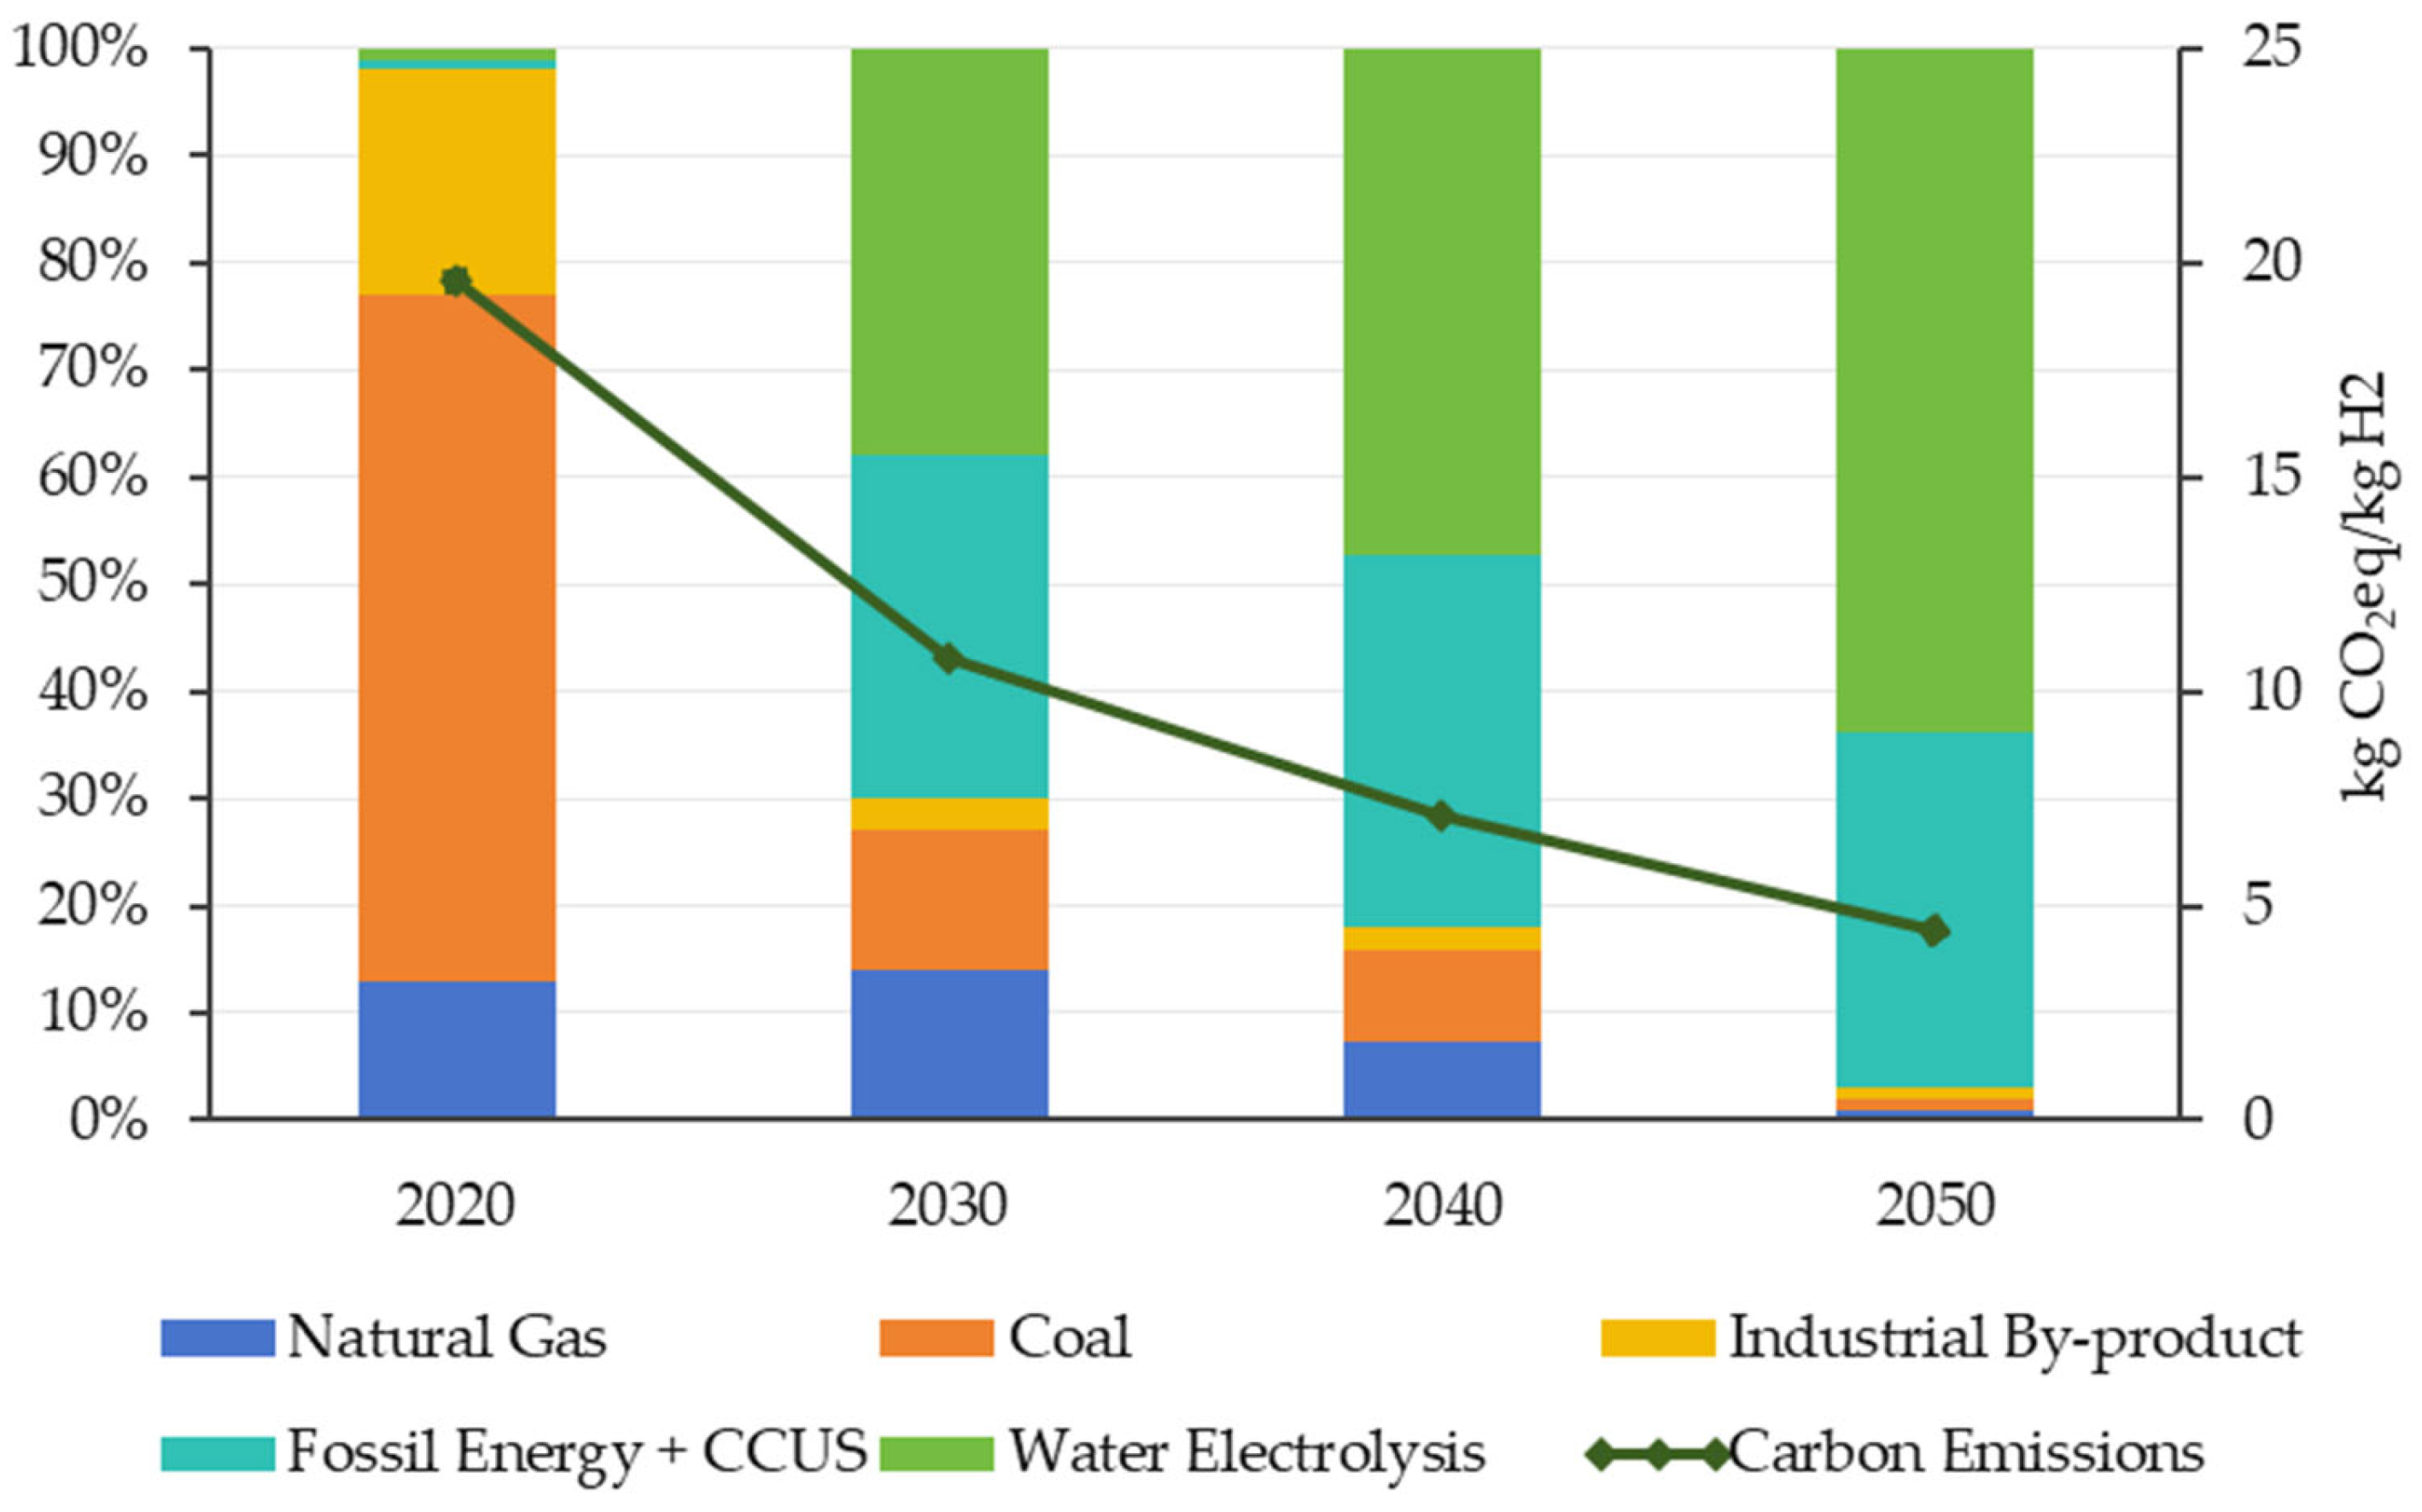
China’s hydrogen industry is still in the early stages. In 2020, fossil-based hydrogen accounted for 79% of global production, including 59% from natural gas and 19% from coal, whereas China’s production is structured as follows: 65% from coal, 14% from natural gas, and 21% from by-products. According to the China Hydrogen Energy and Fuel Cell Industry White Paper 2020 [
36], industrial by-product hydrogen will be the main source in the early stage (2020–2025) due to its low cost and proximity to markets. In the long run (around 2050), China’s energy structure will diversify, with renewable energy as the main hydrogen source (
Table 12).
To analyze the impact of different hydrogen supply structures, this study references the IEA’s Global Hydrogen Review 2021 (2021) future hydrogen supply structure forecast. Based on combinations of future hydrogen production pathways and carbon emission intensities, the GHG emission intensity of the hydrogen production mix changes over time (
Figure 9).
While large-scale water electrolysis hydrogen is technically feasible for the deep decarbonization of fuel cell trucks (with the lowest life cycle carbon intensity among all pathways), the main obstacles to its rapid large-scale shift include its high production costs and incomplete supporting infrastructure in China. Therefore, this study assumes a gradual phased transition (consistent with
Table 12): industrial by-product hydrogen and fossil-based hydrogen with CCUS will continue to play transitional roles before 2040, while water electrolysis gradually dominates after 2040 as costs fall and infrastructure matures.
5.2.3. Scenario Setting
In this study, a multi-scenario system was designed, strictly anchored to the actual policy system and implementation path of China’s road freight decarbonization, with two core design logics: First, the independent emission reduction contributions of two core policy tools (fuel efficiency standard upgrade and new energy vehicle (NEV) promotion) are disentangled through split scenarios. Second, the decarbonization potential is quantified under different policy enforcement intensities, from baseline stagnation to full target implementation, and the risk of policy implementation deviation is assessed. All scenarios are fully aligned with clear correspondence to real policy paths.
To clearly distinguish the quantitative differences in technology adoption trajectories across core scenarios, all scenarios follow the unified TCO parity-driven gradual uptake rule defined in
Section 4.1.2: NEVs start incremental market penetration only after reaching TCO parity with diesel trucks, with the annual penetration growth rate, penetration ceiling, and infrastructure lag effect set differentially across scenarios to reflect different policy support intensities. The fuel economy improvement path is calibrated with reference to the Argonne National Laboratory’s truck fuel economy forecast, consistent with the Global Fuel Economy Initiative (GFEI)’s global target system.
In addition, the scenarios set in this study fully couple the scenario-based hydrogen price forecasting system with the fleet development path. To fully reflect the coordinated development of hydrogen energy technology progress and new energy truck market deployment, the hydrogen price in the Business As Usual (BAU) scenario and fuel-economy-only scenario follows the Conservative Scenario setting, which in the NEV-only scenario follows the Baseline Scenario setting, and that in the ideal scenario follows the Accelerated Scenario setting. The detailed settings of each scenario are as follows:
This scenario corresponds to the no-additional-policy baseline path, which only continues the policies implemented before 2023, with no new fuel efficiency standard upgrades, NEV promotion incentives, or supporting infrastructure construction. This scenario is the universal control group for policy effect evaluation in transport decarbonization research. The quantitative parameter settings are as follows:
Fuel economy: Frozen at the 2020 baseline level for all truck types, with no improvement over the forecast period.
NEV adoption trajectory: Locked at the 2020 market penetration level (battery electric trucks: 1.2%, hydrogen fuel cell trucks: 0.05%) for all years, with no large-scale deployment regardless of TCO parity outcomes.
Supporting policies: No additional infrastructure construction or subsidy incentives.
- 2.
Fuel economy-only scenario
This scenario focuses solely on fuel efficiency improvement without large-scale new energy truck deployment. This scenario is used to independently identify the emission reduction contribution of diesel truck technical efficiency improvement. The quantitative parameter settings are as follows:
Fuel economy: Gradually improved in line with GFEI targets: 15% improvement by 2030, 35% by 2035, and 50% by 2050 (vs. 2015 baseline) for mini/light/medium-duty trucks; heavy-duty trucks achieve a 55% improvement by 2050, with linear interpolation for intermediate years.
NEV adoption trajectory: Completely consistent with the BAU scenario, locked at the 2020 penetration level, with no incremental deployment even after TCO parity.
Supporting policies: No NEV-related infrastructure construction or incentives, only stricter fuel efficiency and emission standards for diesel trucks.
This scenario focuses solely on new energy truck substitution with no fuel economy improvement (fuel economy remains at the 2020 baseline level, consistent with BAU). This scenario is used to independently identify the long-term emission reduction contribution of new energy substitution. New energy truck deployment strictly follows the gradual uptake rule based on TCO parity thresholds (
Section 4.1.2):
Battery electric trucks start incremental penetration from their respective TCO parity years (light-duty: 2024, medium-duty: 2029, mini: 2032, heavy-duty: 2035), with a maximum annual penetration growth rate of 8–10%.
Hydrogen fuel cell trucks start incremental penetration from their respective TCO parity years (light-duty: 2029, medium-duty: 2036, mini: 2035, heavy-duty: 2043), with a maximum annual penetration growth rate of 5–8%.
By 2050, the total penetration rate of new energy trucks reaches 75% (battery electric: 60%; hydrogen fuel cell: 15%), with no accelerated infrastructure or policy support beyond the baseline TCO-driven adoption rule.
This scenario combines the full fuel economy improvement path of the fuel-economy-only scenario and the new energy truck deployment framework of the NEV-only scenario, with additional policy support to address adoption constraints: accelerated charging/hydrogen refueling infrastructure deployment cuts the infrastructure lag effect by two years, and targeted subsidies reduce the market inertia for fleet operators. The specific settings are as follows:
Fuel economy improvement is consistent with the fuel economy-only scenario, with 50–55% improvement by 2050 across all truck types.
New energy truck penetration starts from the same TCO parity years as the NEV-only scenario, but the maximum annual penetration growth rate is increased to 10–12% for electric trucks and 8–10% for hydrogen fuel cell trucks.
By 2050, the total penetration rate of new energy trucks reaches 90% (battery electric: 75%; hydrogen fuel cell: 15%). This setting clearly positions BETs as the core decarbonization pathway, with FCETs as a supplementary solution for specific scenarios, consistent with China’s latest industry forecasts.
- 5.
Delayed Transition (Policy-Constrained) Scenario
This scenario corresponds to the realistic risk of policy implementation lag, insufficient enforcement, and slow infrastructure construction in China’s freight sector. It reflects the situation where policy support is lower than expected, market inertia is not effectively addressed, and the decarbonization process is significantly constrained by policy deficiencies. The quantitative parameter settings are as follows:
Fuel economy: The improvement rate is only 50% of that of the fuel-economy-only scenario: 7.5% improvement by 2030, 17.5% by 2035, and 25% by 2050 (vs. 2015 baseline), corresponding to the lag of emission standard upgrade and insufficient enforcement.
NEV adoption trajectory: After reaching TCO parity, the annual penetration growth rate is only 50% of that of the NEV-only scenario: maximum of 4–5% for battery electric trucks and 2–4% for hydrogen fuel cell trucks; the infrastructure lag effect is extended to 3–5 years; the 2050 total NEV penetration ceiling is only 40% (battery electric trucks: 30%; hydrogen fuel cell trucks: 10%).
Supporting policies: No accelerated infrastructure construction or targeted subsidy incentives, with the gradual phase-out of existing NEV support policies.
5.3. Result Analysis
5.3.1. Overall Emission Reduction Effect
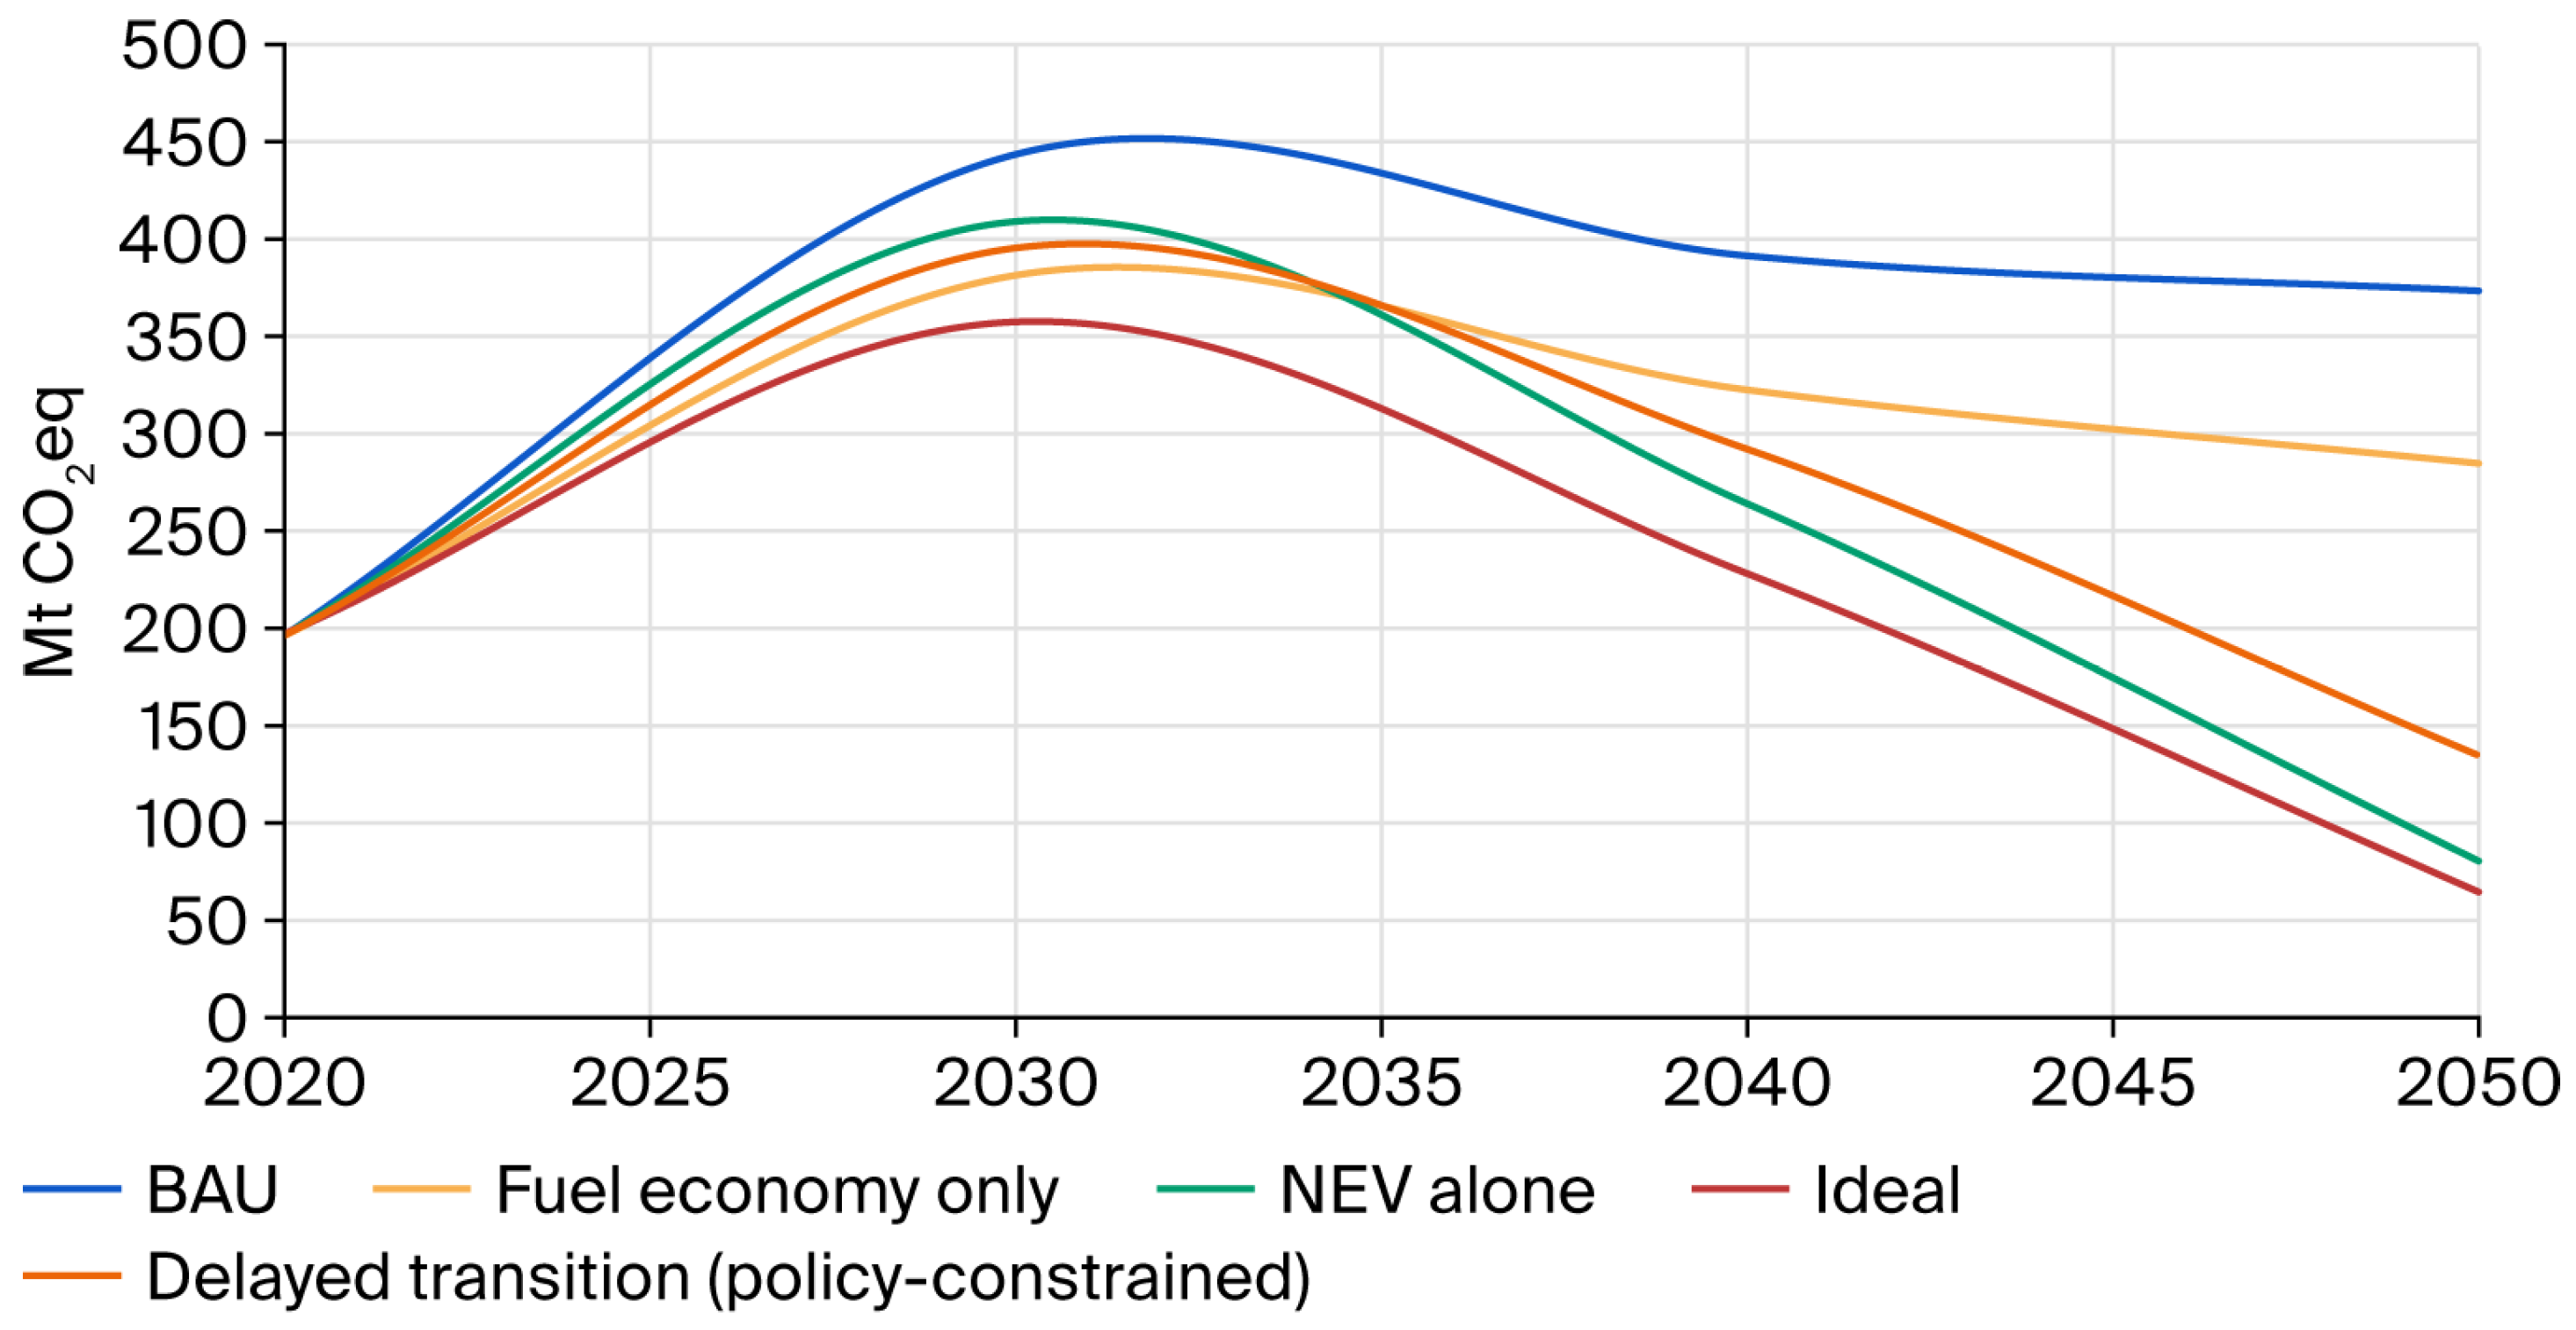
Figure 10 shows the total GHG emissions of the truck fleet under each scenario from 2020 to 2050. Emissions peak around 2030 under all scenarios. Under the ideal scenario, emissions decline rapidly after 2030, dropping by 36.3% and 72.0% in 2040 and 2050 compared with the previous decade, and by 67.5% in 2050 compared with 2020, driven by the combined effect of fuel efficiency improvement and large-scale new energy substitution.
Comparison between the fuel economy- and NEV-only scenarios shows that total fleet carbon emissions grow more slowly under the former scenario from 2020 to 2030 but decline more significantly under the latter from 2030 to 2040 and 2040 to 2050. This indicates that fuel economy improvement delivers better short-term emission reduction, while new energy truck substitution becomes more effective in the long run.
For the delayed transition (policy-constrained) scenario, emissions also peak around 2030 but at a higher level than all active policy intervention scenarios, with a much slower post-peak decline. By 2050, its emissions are 112% higher than in the ideal scenario, with only a 31.2% reduction from the 2020 baseline, highlighting that policy implementation lag and insufficient constraints will cause a substantial loss of long-term decarbonization potential in the road freight sector.
5.3.2. Model-Specific Emission Reduction Analysis
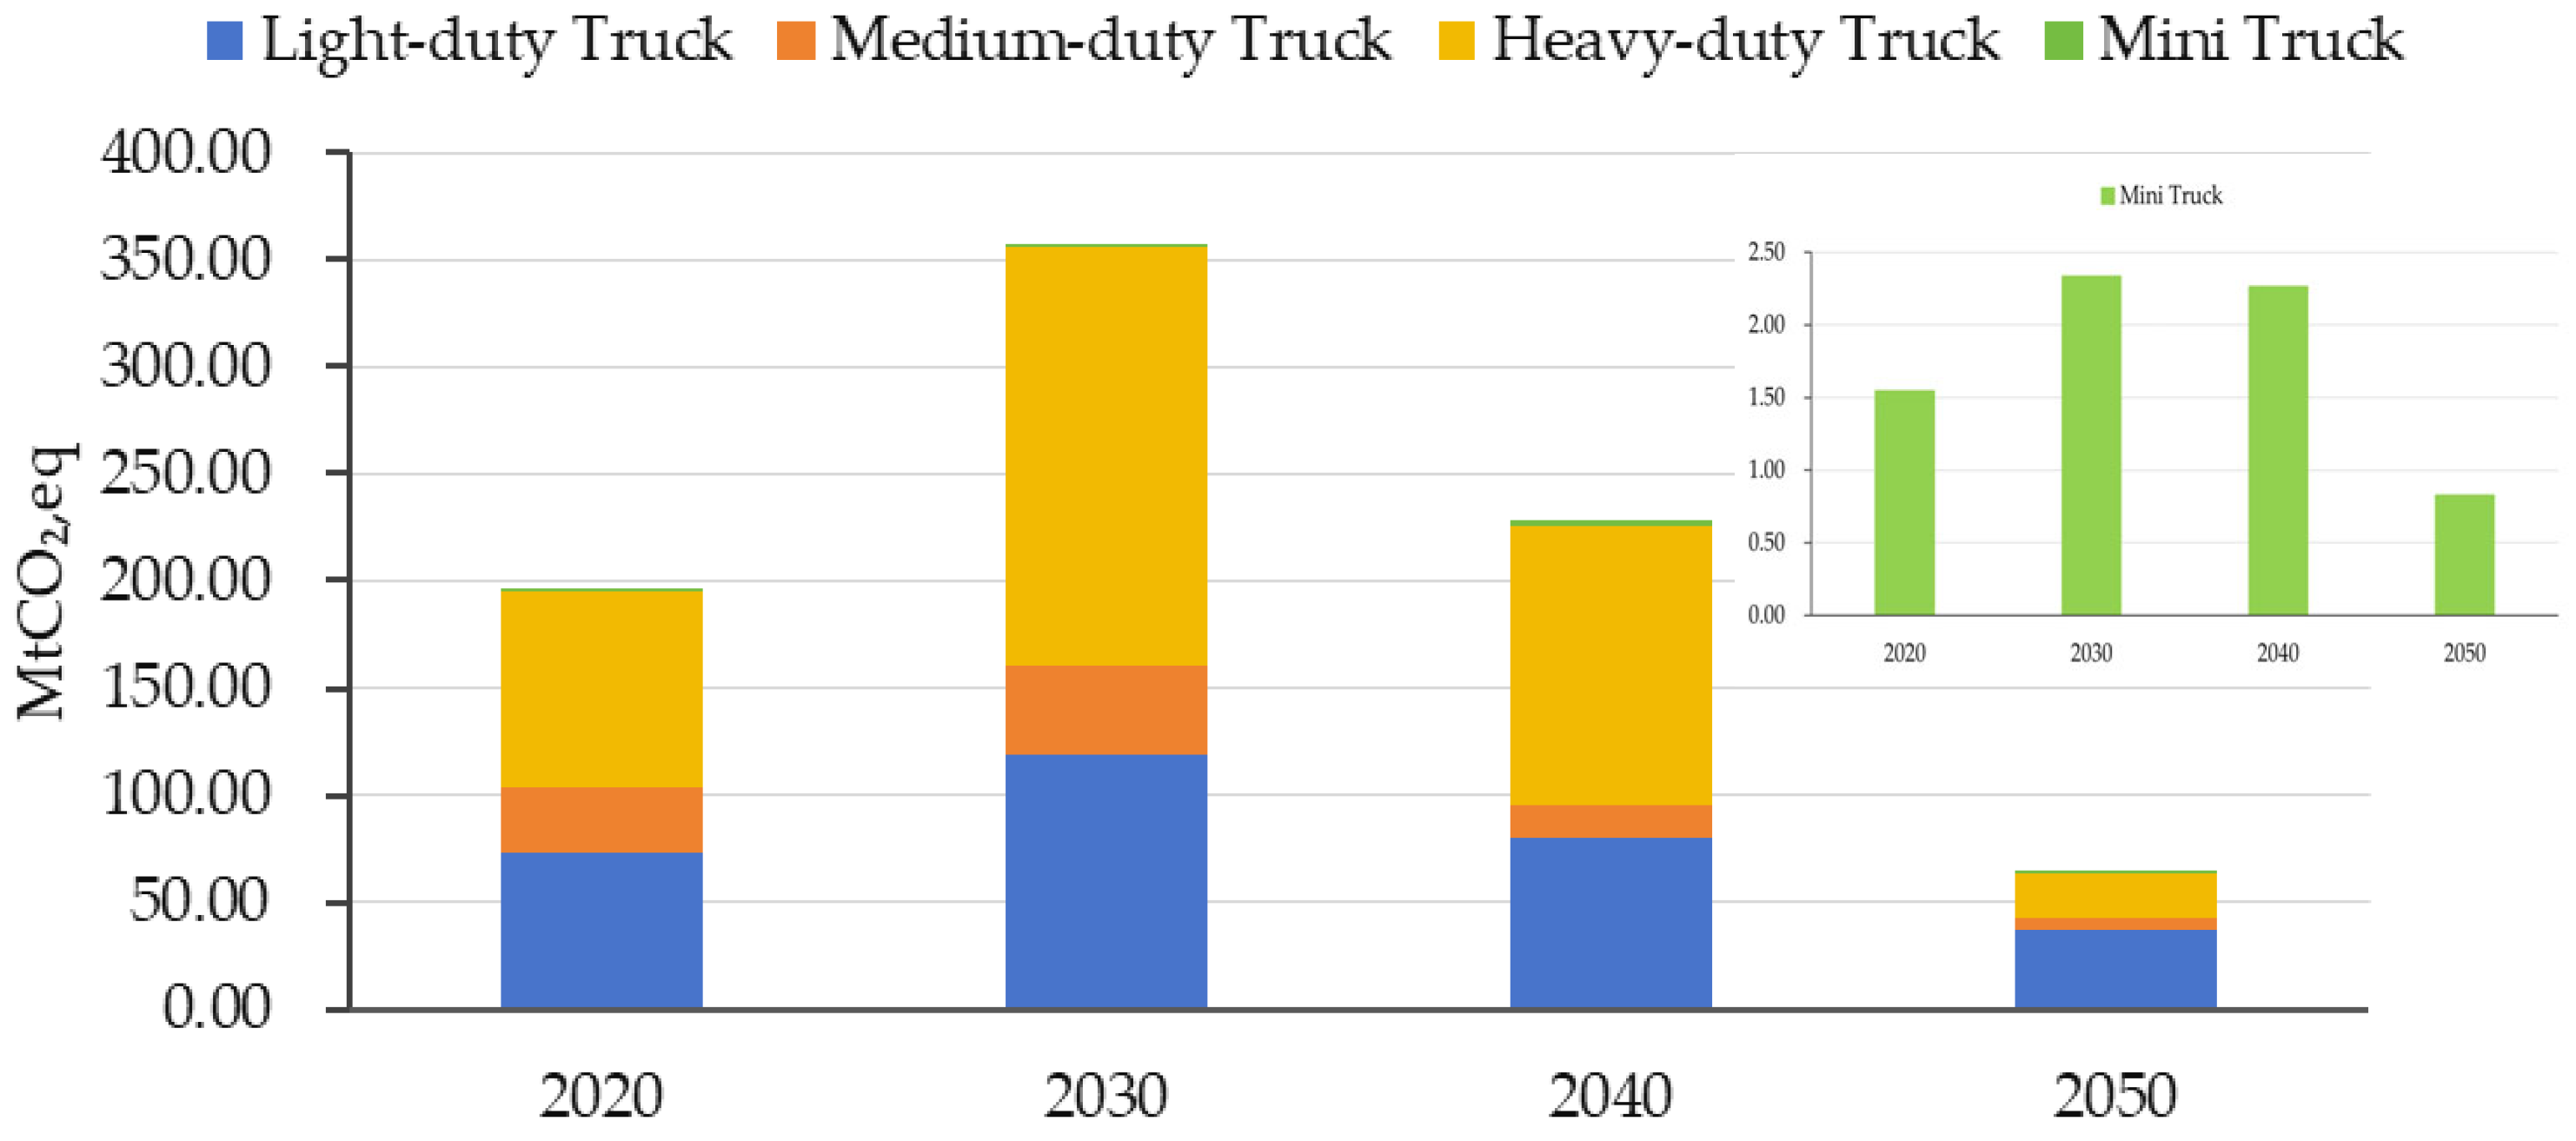
Emission contributions under the ideal scenario are further analyzed, representing the most plausible future. As shown in
Figure 11, heavy-duty trucks are the main emission source before 2040, accounting for 47–58% of total emissions, and contribute the largest absolute emission reduction. This is because heavy-duty trucks have the highest single-vehicle emission intensity, longest annual mileage, and latest TCO parity year, leading to sustained high emission share and the largest marginal decarbonization benefit from electrification. Light-duty trucks have the second-largest contribution due to their achievement of the earliest electrification transition, while mini trucks have limited overall impact due to their small emission base.
This sustained high emission share is further shaped by the core logistics patterns of heavy-duty trucks: long-haul trunk logistics (62% of heavy-duty truck ownership), which is the dominant cross-provincial bulk transport scenario, contribute over 70% of heavy-duty emissions, with strict range requirements slowing new energy penetration; fixed-route port/mine drayage (21% of ownership) has already achieved early TCO parity for electric models, becoming the core short-term emission reduction source.
Calibrated with China’s 2010–2023 freight data, heavy-duty truck freight demand has a GDP income elasticity of 0.87 (steady demand growth alongside economic development) and a low price elasticity of −0.22 (demand is insensitive to transport cost changes). This high demand rigidity confirms that road freight decarbonization must rely on low-carbon technology substitution and efficiency improvement, rather than demand suppression, which validates the core logic of our scenario design.
As shown in
Figure 12, the heavy-duty truck fleet contributes the most to GHG reduction in road freight, dropping from 91.4 MtCO
2,eq in 2020 to 20.8 MtCO
2,eq in 2050. The second-largest contribution comes from light-duty trucks, falling from 72.8 MtCO
2,eq in 2020 to 37.4 MtCO
2,eq in 2050. The most significant reduction occurs in medium-duty trucks, with an 84.4% drop between 2020 and 2050. Mini-duty truck emissions decrease by 46.5%, but their small share limits overall contribution.
5.3.3. Sensitivity and Combined Parameter Uncertainty Analysis
Given the complexity of fleet emission calculation and the uncertainty of long-term forecast parameters, in this study, a one-way sensitivity analysis was first conducted to identify the impact of individual parameter changes on results and then a combined parameter uncertainty analysis to reflect the superposition effect of multiple parameter fluctuations, so as to provide a more balanced interpretation of the results.
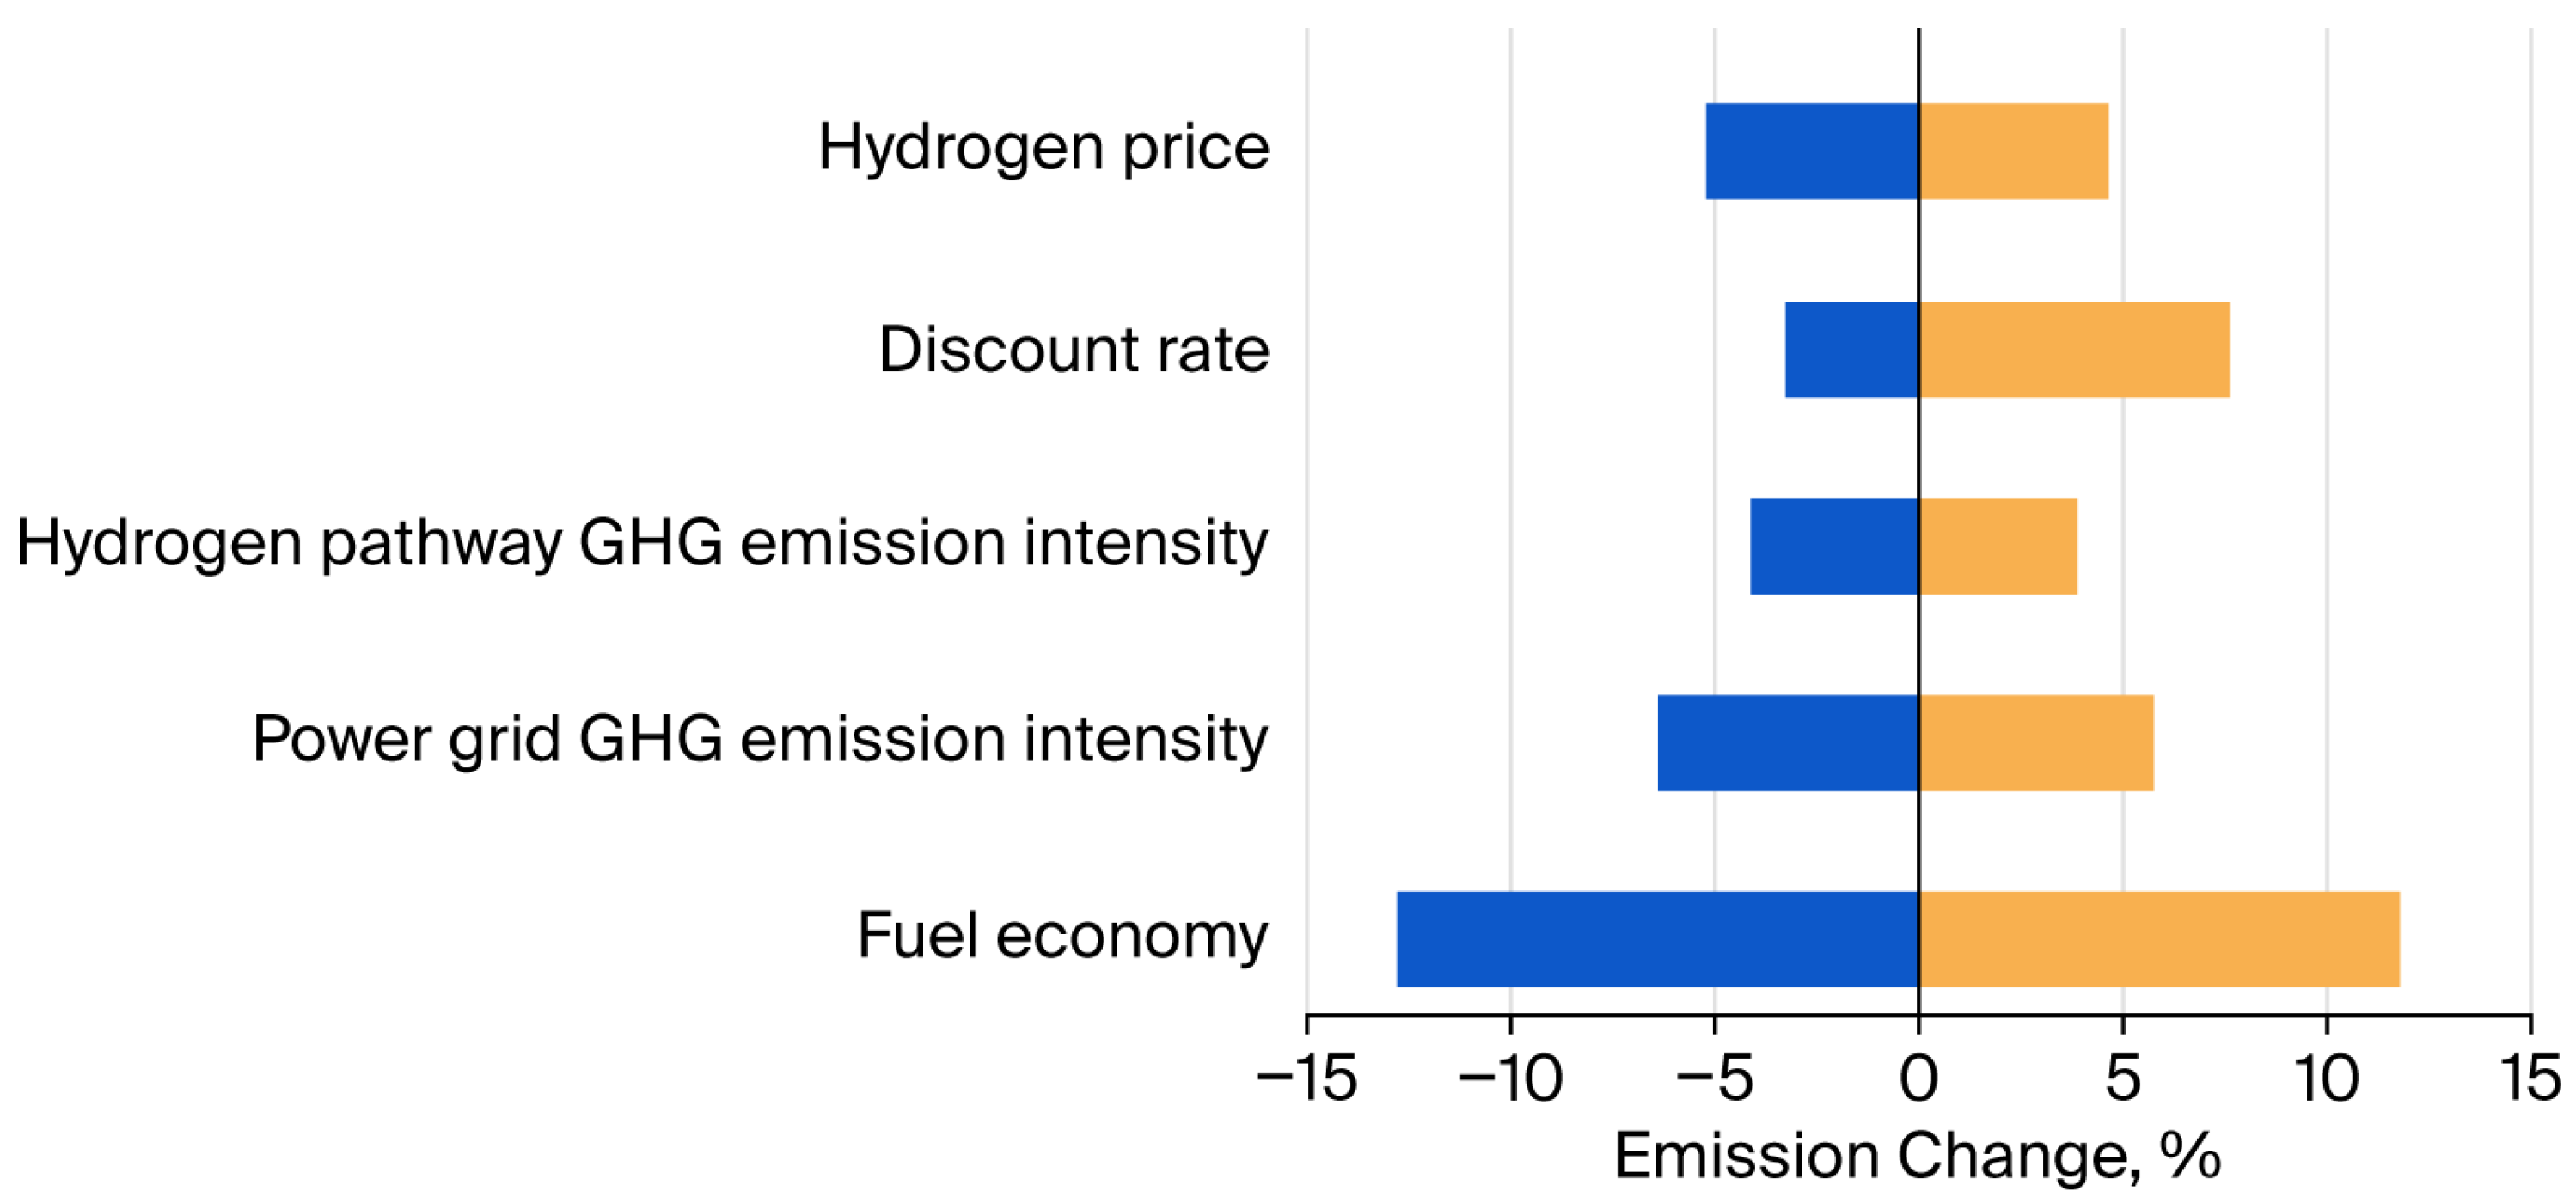
The one-way sensitivity analysis first evaluates the impact of ±10% fluctuation in three core parameters (hydrogen pathway GHG emission intensity, power grid GHG emission intensity, fuel economy) on the cumulative GHG emissions of the truck fleet from 2020 to 2050 under the ideal scenario. Then, we further expanded the sensitivity analysis to test the impact of discount rate changes (ranging from 3% to 10%) on the TCO parity results and cumulative fleet GHG emissions, and the impact of the scenario-based hydrogen price forecasting system on the model results.
As shown in
Figure 13, fuel economy remains the most influential single factor: a 10% increase in fuel economy will lead to a 12.7% reduction in cumulative fleet GHG emissions, while a 10% decrease will lead to an 11.8% increase. This is because the fuel economy directly affects the emissions of the entire in-use fleet and indirectly changes new energy TCO parity time, forming a dual impact on cumulative emissions. The GHG emission intensity of the power grid and hydrogen production pathway has a relatively smaller but non-negligible impact, with a ±10% fluctuation leading to a −6.3%~+5.8% and −4.1%~+3.9% change in cumulative emissions, respectively.
For the hydrogen price, the sensitivity analysis results show the following: Compared with the Baseline Scenario, the Accelerated Scenario (low hydrogen price) advances the TCO parity time of fuel cell trucks, increases their market penetration rate, and reduces the cumulative fleet GHG emissions from 2020 to 2050 by 5.2%. The Conservative Scenario (high hydrogen price) delays the TCO parity time of fuel cell trucks, reduces their market penetration, and increases the cumulative emissions by 4.6%. This confirms that hydrogen price is a key factor affecting the deployment of fuel cell trucks, but even under the Conservative Scenario, the core conclusion of the study remains robust.
A discount rate ranging from 3% to 10% leads to a −3.2%~+7.6% change in cumulative emissions. A lower discount rate increases operators’ focus on long-term operating cost savings, accelerating new energy adoption, while a higher discount rate delays market penetration. Even under extreme parameter fluctuations, the core conclusion remains robust, as the long-term decarbonization trend is driven by deterministic technology-cost reduction and grid decarbonization under China’s dual carbon goals.
We further tested the sensitivity of the results to fleet structure and annual mileage changes: ±10% fluctuation in 2050 heavy-duty truck share leads to a ±8.1% change in 2050 total emissions, and a ±1% annual change in mileage for all models leads to a ±6.3% change in 2050 total emissions. In addition, we quantified the impact of real-world variability in vehicle lifetime and scrappage on long-term projections, addressing the potential bias from deterministic baseline assumptions. We set three extreme scenarios for vehicle service life:
Baseline scenario: mini trucks 12 years, heavy/medium/light trucks 15 years (original setting);
Shortened lifetime scenario: 20% shorter service life for all truck types, corresponding to accelerated technology iteration and stricter emission elimination policies;
Extended lifetime scenario: 20% longer service life for all truck types, corresponding to improved vehicle reliability and extended operation of in-use fleets.
The results show that the extreme fluctuation of vehicle lifetime only leads to a ±5.7% change in 2050 total fleet emissions under the ideal scenario. All extreme scenarios do not alter the core conclusions of the study: the fleet will peak emissions around 2030, with fuel economy improvement driving short-term abatement and new energy substitution dominating long-term deep decarbonization.
- 2.
Combined Parameter Uncertainty Analysis
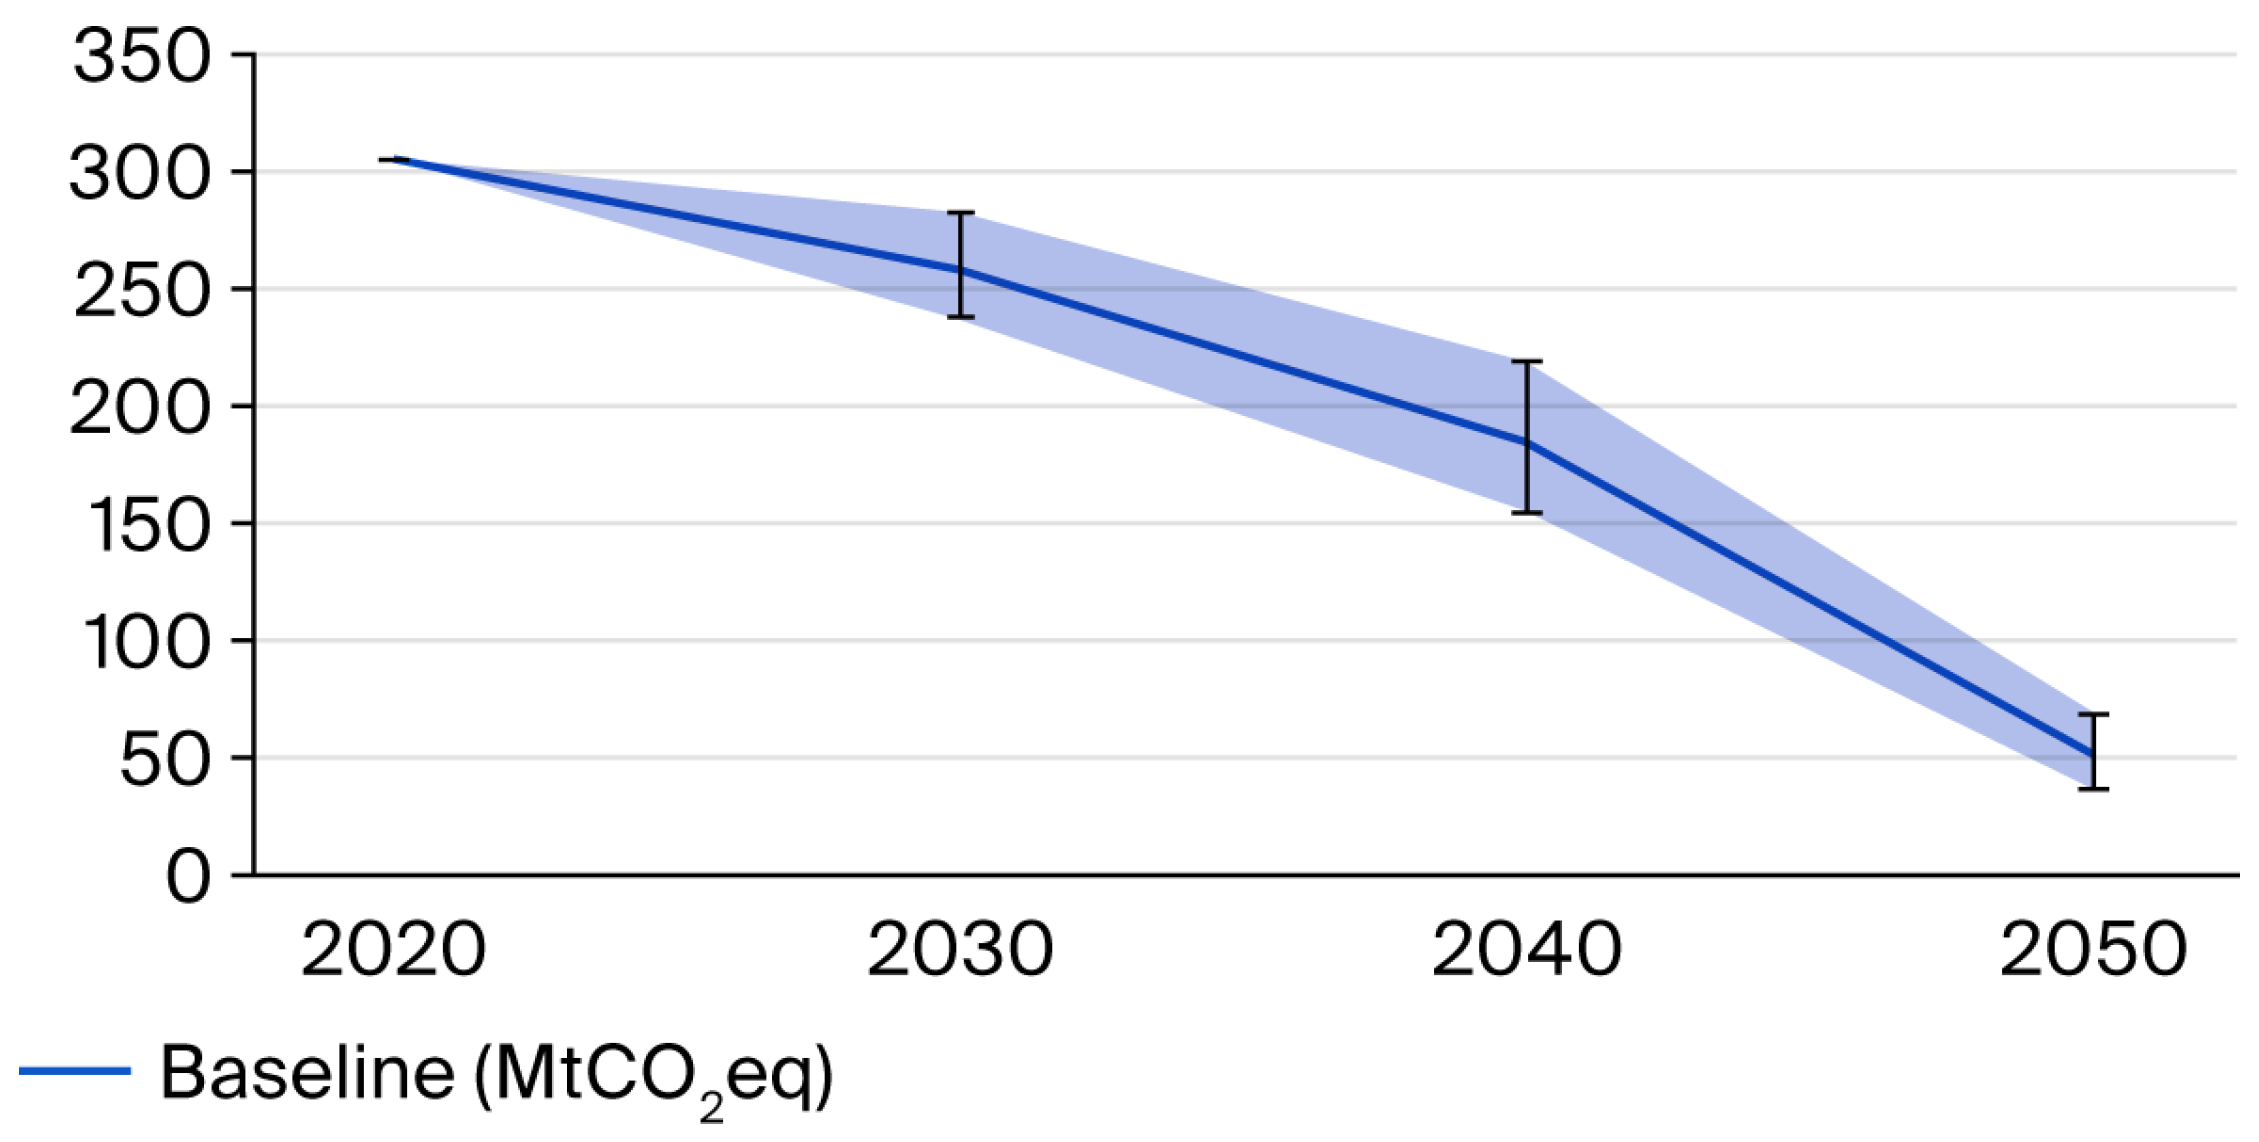
To reflect the superposition effect of multiple uncertain parameters in the actual operation of the system, this study used the Monte Carlo simulation method to conduct combined uncertainty analysis, based on the parameter range and probability distribution defined in
Section 3.3.7. The simulation object is the total GHG emissions of the truck fleet under the ideal scenario in 2030, 2040, and 2050, and the results are presented with 95% confidence intervals to quantify the fluctuation range of the forecast results.
Figure 14 shows the results of the combined uncertainty analysis:
In 2030, the baseline emission value of the fleet under the ideal scenario is 258.6 MtCO2eq, with a 95% confidence interval of 236.8–282.5 MtCO2eq, corresponding to an emission reduction rate of 15.4–23.4% compared with the 2020 baseline;
In 2040, the baseline emission value is 186.2 MtCO2eq, with a 95% confidence interval of 155.7–218.9 MtCO2eq, corresponding to an emission reduction rate of 36.0–47.4% compared with the 2020 baseline;
In 2050, the baseline emission value is 52.3 MtCO2eq, with a 95% confidence interval of 37.1–70.4 MtCO2eq, corresponding to an emission reduction rate of 78.5–87.0% compared with the 2020 baseline.
The results show that even under the superposition of multiple parameter fluctuations, the core conclusion of this study remains robust: the road freight fleet will achieve a peak of carbon emissions around 2030 and will achieve significant emission reductions of more than 75% by 2050 under the ideal scenario. The uncertainty of the forecast results gradually increases with the extension of the forecast period, which is mainly due to the cumulative effect of long-term technological progress and policy implementation uncertainty. Among them, the combined fluctuation in hydrogen price and grid decarbonization rate is the main source of the uncertainty of the 2050 forecast results, contributing 62% of the total variance of the simulation results.
6. Conclusions and Policy Recommendations
Taking China’s road freight trucks as the research object, this study constructed a combined TCO life cycle carbon emission model to evaluate the economic efficiency and emission reduction benefits of four truck types (mini, light, medium, heavy) under diesel, electric, and hydrogen fuel cell pathways. Combined with LSTM and ownership models, the overall emission reduction potential of the road freight fleet from 2020 to 2050 was simulated. The main conclusions (all based on China-specific parameters, baseline assumptions, and the context of China’s road freight sector) are as follows:
- (1)
Under the cost, operational and policy assumptions of this study, all new energy trucks can achieve TCO parity with diesel trucks by 2050. In the Chinese context, battery electrification is the core mainstream decarbonization pathway for China’s road freight sector, with better economic competitiveness than hydrogen technology across all truck types: light-duty electric trucks reach parity earliest (in 2024), followed by medium (2029), mini (2032), and heavy (2035) electric trucks; fuel cell models generally reach parity later, with heavy-duty fuel cell trucks latest in 2043.
- (2)
The life cycle emission reduction performance of new energy trucks is highly dependent on China’s energy structure transition path: solar-powered water electrolysis offers the lowest carbon intensity for fuel cell trucks in China’s long-term renewable energy development planning. Along with the deep decarbonization of China’s grid by 2050, almost all new energy trucks will achieve lower life cycle emissions than diesel trucks under the set energy transition scenario. Notably, while full-scale electrolysis-based hydrogen is technically feasible for maximum decarbonization, a gradual phased transition is the practically likely pathway in China, given cost and infrastructure constraints.
- (3)
Road freight carbon emissions will peak around 2030. Under the ideal scenario, considering new energy deployment and fuel economy improvement, the fleet can achieve emission reductions of 19.5%, 41.9%, and 82.9% by 2030, 2040, and 2050, respectively. Fuel economy improvement dominates short-term (before 2030) emission control, while new energy substitution becomes the core long-term (after 2030) driver.
- (4)
Heavy-duty trucks are the main emission source (47–58%) and the core of emission reduction, followed by light- and medium-duty trucks; mini-duty trucks contribute little.
The combined parameter uncertainty analysis confirms the robustness of the above conclusions. Even under the superposition of fluctuations in key parameters such as hydrogen price, battery cost, grid decarbonization rate, and discount rate, the road freight fleet will still achieve a carbon emission peak around 2030 and reduce emissions by more than 75% by 2050 under the ideal scenario (95% confidence interval: 78.5–87.0%). The long-term forecast results have some uncertainties, mainly from the fluctuation in hydrogen energy technology cost and the pace of power grid decarbonization. Therefore, the formulation of supporting policies should maintain flexibility and dynamically adjust the promotion path of new energy trucks according to the actual progress of technological progress and energy structure transformation.
Based on the above conclusions about the truck fleet emission forecasting model and sensitivity test, the following policy recommendations specific to China’s context are proposed:
First, promote new energy freight vehicles by model and stage in an orderly manner, following economic feasibility timelines. For heavy-duty trucks, formulate a phased promotion roadmap for long-haul heavy-duty trucks with a focus on hydrogen fuel cell technology; for light-duty electric trucks, enhance policy support to accelerate large-scale application. For hydrogen supply, prioritize near-term low-cost transitional hydrogen sources and long-term renewable electrolysis hydrogen industrialization to steadily unlock the emission reduction potential of fuel cell vehicles.
Second, accelerate the low-carbon transition of the upstream energy structure. Increase the share of renewable energy in the power grid, prioritize green electricity supply for new energy truck charging, and support the large-scale development of renewable energy-based green hydrogen production, transportation, and refueling systems.
Third, continuously tighten fuel efficiency standards for diesel trucks. Accelerate the formulation and implementation of the next phase of national fuel consumption limits for heavy-duty commercial vehicles, set stricter fuel efficiency requirements for newly registered diesel trucks, and promote efficiency retrofitting for high-emission in-use diesel trucks.
Fourth, formulate differentiated emission regulation, subsidy support, and phased elimination plans for different truck types: focus on the low-carbon transition of heavy-duty trucks, accelerate the electrification of medium-duty trucks, and set appropriate transition requirements for mini trucks according to local conditions.
Author Contributions
Conceptualization, P.C., Q.C. and Z.K.; methodology, Q.C. and P.C.; software, Q.C.; validation, P.C., Q.C. and Z.K.; formal analysis, Z.K.; investigation, Q.C.; resources, R.Y.; data curation, R.Y.; writing—original draft preparation, Q.C. and P.C.; writing—review and editing, Z.K. and R.Y.; visualization, Z.K. and R.Y.; supervision, P.C.; project administration, P.C.; funding acquisition, P.C. and Z.K. All authors have read and agreed to the published version of the manuscript.
Funding
This research was funded by the Beijing Social Science Fund, grant number 25JCB020, and Achievement of the Scientific Research Project of Tianjin Municipal Education Commission, grant number 2024SK051, Research on the Development Level Measurement and Optimization Path of the “Four-Network Integration” of Rail Transit in the Beijing-Tianjin-Hebei Region.
Data Availability Statement
The original contributions presented in this study are included in the article. Further inquiries can be directed to the corresponding author.
Conflicts of Interest
The authors declare no conflicts of interest.
Abbreviations
The following abbreviations are used in this manuscript:
| GHG | Greenhouse Gas |
| TCO | Total Cost of Ownership |
| MT | Mini Truck |
| LDT | Light-Duty Truck |
| MDT | Medium-Duty Truck |
| HDT | Heavy-Duty Truck |
| NPV | Net Present Value |
| LCA | Life Cycle Assessment |
| LCI | Life Cycle Inventory |
| WTW | Wells-to-Wheels |
| WTP | Well-to-Pump |
| PTW | Pump-to-Wheels |
| GWP | Global Warming Potential |
| FE | Fuel Economy |
| LSTM | Long Short-Term Memory |
| COG-FCET | Coke Oven Gas-based hydrogen Fuel Cell Electric Truck |
| FCET | Fuel Cell Electric Truck |
| BET | Battery Electric Truck |
| DT | Diesel truck |
References
- ICCT. Barriers and Opportunities for Improving Long-Haul Freight Efficiency in China; The International Council on Clean Transportation: Washington, DC, USA, 2019; Available online: https://www.theicct.org.cn/en/publication/barriers-and-opportunities-for-improving-long-haul-freight-efficiency-in-china/ (accessed on 13 May 2026).
- Wen, L.; Song, Q. Simulation study on carbon emission of China’s freight system under the target of carbon peaking. Sci. Total Environ. 2022, 812, 152600. [Google Scholar] [CrossRef] [Scilit] [PubMed]
- Dua, R. Net-zero transport dialogue: Emerging developments and the puzzles they present. Energy Sustain. Dev. 2024, 82, 101516. [Google Scholar] [CrossRef] [Scilit]
- ICCT. Transitioning to Zero-Emission Heavy-Duty Freight Vehicles; The International Council on Clean Transportation: Washington, DC, USA, 2017; Available online: https://www.theicct.org/publications/transitioning-zero-emission-heavy-duty-freight-vehicles (accessed on 13 May 2026).
- Liu, F.; Zhao, F.; Liu, Z.; Hao, H. The impact of fuel cell vehicle deployment on road transport greenhouse gas emissions: The China case. Int. J. Hydrogen Energy 2018, 43, 22604–22621. [Google Scholar] [CrossRef] [Scilit]
- Dua, R.; Almutairi, S. A perspective on emerging policy and economics research priorities for enabling low-carbon trucking. Energy Res. Soc. Sci. 2025, 124, 104025. [Google Scholar] [CrossRef] [Scilit]
- Li, H.; Zhao, Y.; Lin, J. A review of the energy–carbon–water nexus: Concepts, research focuses, mechanisms, and methodologies. WIREs Energy Environ. 2020, 9, e358. [Google Scholar] [CrossRef] [Scilit]
- Sen, B.; Ercan, T.; Tatari, O. Does a battery-electric truck make a difference?―Life cycle emissions, costs, and externality analysis of alternative fuel-powered Class 8 heavy-duty trucks in the United States. J. Clean. Prod. 2017, 141, 110–121. [Google Scholar] [CrossRef] [Scilit]
- Yang, L.; Hao, C.; Chai, Y. Life Cycle Assessment of Commercial Delivery Trucks: Diesel, Plug-In Electric, and Battery-Swap Electric. Sustainability 2018, 10, 4547. [Google Scholar] [CrossRef] [Scilit]
- Kast, J.; Morrison, G.M.; Gangloff, J.J.; Vijayagopal, R. Designing hydrogen fuel cell electric trucks in a diverse medium and heavy duty market. Res. Transp. Econ. 2018, 70, 139–147. [Google Scholar] [CrossRef] [Scilit]
- Wang, M.H.; Wang, W.; Chen, Z.Y.; Liu, J.Z.; Ou, X.M.; Ren, L. Total ownership cost analysis of hydrogen-fuel-cell heavy-trucks in China. J. Autom. Saf. Energy 2023, 14, 762–773. [Google Scholar] [CrossRef]
- He, X.; Wang, F.; Wallington, T.J.; Shen, W.Q.; Melaina, M.W.; Kim, H.; De Kleine, R.; Lin, T.; Zhang, S.; Keoleian, G.A.; et al. Well-to-wheels emissions, costs, and feedstock potentials for light-duty hydrogen fuel cell vehicles in China in 2017 and 2030. Renew. Sustain. Energy Rev. 2021, 137, 110477. [Google Scholar] [CrossRef] [Scilit]
- El Hannach, M.; Ahmadi, P.; Guzman, L.; Pickup, S. Life cycle assessment of hydrogen and diesel dual-fuel class 8 heavy duty trucks. Int. J. Hydrogen Energy 2019, 44, 8575–8584. [Google Scholar] [CrossRef] [Scilit]
- Lao, J.; Song, H.; Wang, C.; Zhou, Y.; Wang, J. Reducing atmospheric pollutant and greenhouse gas emissions of heavy duty trucks by substituting diesel with hydrogen in Beijing-Tianjin-Hebei-Shandong region, China. Int. J. Hydrogen Energy 2021, 46, 18137–18152. [Google Scholar] [CrossRef] [Scilit]
- Huang, S.J.; Ren, Y.L. Indirect Carbon Emission Measurement of Electric Vehicle in China. Appl. Mech. Mater. 2013, 470, 772–776. [Google Scholar] [CrossRef] [Scilit]
- Khanna, N.; Lu, H.; Fridley, D.; Zhou, N. Near and long-term perspectives on strategies to decarbonize China’s heavy-duty trucks through 2050. Sci. Rep. 2021, 11, 20414. [Google Scholar] [CrossRef] [Scilit]
- Wang, J.T.; Yan, Y.; Huang, Q.S.; Song, Y. Analysis of Carbon Emission Reduction Potential of China’s Transportation. Sci. Technol. Manag. Res. 2021, 41, 200–210. [Google Scholar] [CrossRef]
- Fan, J.; Wang, J.; Li, F.; Yu, H. Energy demand and greenhouse gas emissions of urban passenger transport in the Internet era: A case study of Beijing. J. Clean. Prod. 2017, 165, 177–189. [Google Scholar] [CrossRef] [Scilit]
- Kochhan, R.; Fuchs, S.; Reuter, B.; Schickram, S.; Sinning, M.; Lienkamp, M. An overview of costs for vehicle components, fuels, greenhouse gas emissions and total cost of ownership update 2017. Res. Gate 2017, 23, 1–25. [Google Scholar] [CrossRef]
- ICCT. Total Cost of Ownership for Heavy Trucks in China: Battery-Electric, Fuel Cell Electric, and Diesel Trucks; The International Council on Clean Transportation: Washington, DC, USA, 2021; Available online: https://theicct.org/publication/total-cost-of-ownership-for-heavy-trucks-in-china-battery-electric-fuel-cell-and-diesel-trucks/ (accessed on 13 May 2026).
- ISO 14040:2006; Environmental Management—Life Cycle Assessment—Principles and Framework. International Organization for Standardization: Geneva, Switzerland, 2006. Available online: https://www.iso.org/standard/37456.html (accessed on 13 May 2026).
- ISO 14044:2006; Environmental Management—Life Cycle Assessment—Requirements and Guidelines. International Organization for Standardization: Geneva, Switzerland, 2006. Available online: https://www.iso.org/standard/38498.html (accessed on 13 May 2026).
- Cullen, D.; Neyerlin, K.; Ahluwalia, R.; Mukundan, R.; More, K.; Borup, R.; Weber, A.; Myers, D. New roads and challenges for fuel cells in heavy-duty transportation. Nat. Energy 2021, 6, 462–474. [Google Scholar] [CrossRef] [Scilit]
- Kast, J.; Vijayagopal, R.; Gangloff, J.J.; Marcinkoski, J. Clean commercial transportation: Medium and heavy duty fuel cell electric trucks. Int. J. Hydrogen Energy 2017, 42, 4508–4517. [Google Scholar] [CrossRef] [Scilit]
- Burke, A.; Sinha, A.K. Technology, Sustainability, and Marketing of Battery Electric and Hydrogen Fuel Cell Medium-Duty and Heavy-Duty Trucks and Buses in 2020–2040; The National Center for Sustainable Transportation: Davis, CA, USA, 2020; Available online: https://escholarship.org/content/qt7s25d8bc/qt7s25d8bc_noSplash_d19259dbecb93e6d0119c3f06d77e29b.pdf (accessed on 13 May 2026).
- Smith, D.; Ozpineci, B.; Graves, R.L.; Jones, P.T.; Lustbader, J.A.; Kelly, K.J.; Walkowicz, K.A.; Birky, A.; Payne, G.; Sigler, C.; et al. Medium- and Heavy-Duty Vehicle Electrification: An Assessment of Technology and Knowledge Gaps; U.S. Department of Energy: Washington, DC, USA, 2020. Available online: https://www.osti.gov/biblio/1615213/ (accessed on 13 May 2026).
- Lu, Z.; Zhou, Y.; Cai, H.; Wang, M.; He, X.; Przesmitzki, S. China Vehicle Fleet Model: Estimation of Vehicle Stocks, Usage, Emissions, and Energy Use―Model Description, Technical Documentation, and User Guide; Argonne National Laboratory: Lemont, IL, USA, 2018. Available online: https://publications.anl.gov/anlpubs/2018/11/148761.pdf (accessed on 13 May 2026).
- Li, M.; Ye, H.; Liao, X.; Ji, J. How Shenzhen, China pioneered the widespread adoption of electric vehicles in a major city: Implications for global implementation. Wiley Interdiscip. Rev. Energy Environ. 2020, 9, e373. [Google Scholar] [CrossRef] [Scilit]
- Jones, J.; Genovese, A.; Tob-Ogu, A. Hydrogen vehicles in urban logistics: A total cost of ownership analysis and some policy implications. Renew. Sustain. Energy Rev. 2020, 119, 109595. [Google Scholar] [CrossRef] [Scilit]
- Lee, H.; Kim, A.; Lee, A.; Lee, B. Optimized H2 fueling station arrangement model based on total cost of ownership (TCO) of fuel cell electric vehicle (FCEV). Int. J. Hydrogen Energy 2021, 46, 34116–34127. [Google Scholar] [CrossRef] [Scilit]
- Ma, J.; Guo, Z.S.; Yang, R.H.; Lan, L.B.; Chen, Y.S.; Fu, P. Economic Analysis and Prediction of Life Cycle Costs for Different Hydrogen Fuel Cell Vehicles. Chin. J. Autom. Eng. 2023, 13, 506–516. [Google Scholar]
- Dai, Q.; Kelly, J.C.; Dunn, J.; Benavides, P.T. Update of Bill-of-Materials and Cathode Materials Production for Lithium-Ion Batteries in the GREET Model; Argonne National Laboratory: Lemont, IL, USA, 2018. [Google Scholar]
- Simon, B.; Bachtin, K.; Kiliç, A.; Amor, B.; Weil, M. Proposal of a framework for scale-up life cycle inventory: A case of nanofibers for lithium iron phosphate cathode applications: Cradle-to-gate LCA of nanofiber li-ion battery cathodes. Integr. Environ. Assess. Manag. 2016, 2, 465–477. [Google Scholar] [CrossRef] [Scilit]
- ICCT. Life-Cycle Greenhouse Gas Emissions of Biomethane and Hydrogen in the EU; The International Council on Clean Transportation: Washington, DC, USA, 2021; Available online: https://theicct.org/sites/default/files/publications/lca-biomethane-hydrogen-eu-oct21.pdf (accessed on 13 May 2026).
- China Hydrogen Alliance. China Hydrogen Energy Industry Development Report 2020; China Hydrogen Alliance: Beijing, China, 2020; Available online: https://china-gases.com/f/image/20201028/1603891645438344.pdf (accessed on 13 May 2026).
- China Hydrogen Alliance; Chinese Society of Automotive Engineers. China Hydrogen Energy and Fuel Cell Industry White Paper 2020; China Hydrogen Alliance: Beijing, China, 2020. [Google Scholar]
- Spath, P.L.; Mann, M.K. Life Cycle Assessment of Hydrogen Production via Natural Gas Steam Reforming; U.S. National Renewable Energy Lab: Golden, CO, USA, 2000; Available online: https://www.fischer-tropsch.org/DOE/DOE_reports/NREL/TP-570/TP-570-27637/TP-570-27637.pdf (accessed on 13 May 2026).
- Cetinkaya, E.; Dincer, I.; Naterer, G.F. Life cycle assessment of various hydrogen production methods. Int. J. Hydrogen Energy 2012, 37, 2071–2080. [Google Scholar] [CrossRef] [Scilit]
- Mehmeti, A.; Angelis-Dimakis, A.; Arampatzis, G.; McPhail, S.J.; Ulgiati, S. Life cycle assessment and water footprint of hydrogen production methods: From conventional to emerging technologies. Environments 2018, 5, 24. [Google Scholar] [CrossRef] [Scilit]
- Dufour, J.; Serrano, D.P.; Gálvez, J.L.; Moreno, J.; González, A. Hydrogen production from fossil fuels: Life cycle assessment of technologies with low greenhouse gas emissions. Energy Fuels 2011, 25, 2194–2202. [Google Scholar] [CrossRef] [Scilit]
- Li, J.; Cheng, W. Comparative life cycle energy consumption, carbon emissions and economic costs of hydrogen production from coke oven gas and coal gasification. Int. J. Hydrogen Energy 2020, 45, 27979–27993. [Google Scholar] [CrossRef] [Scilit]
- Kalinci, Y.; Hepbasli, A.; Dincer, I. Techno-economic analysis of a stand-alone hybrid renewable energy system with hydrogen production and storage options. Int. J. Hydrogen Energy 2015, 40, 7652–7664. [Google Scholar] [CrossRef] [Scilit]
- Antonini, C.; Treyer, K.; Streb, A.R.; van der Spek, M.; Bauer, C.; Mazzotti, M. Hydrogen production from natural gas and biomethane with carbon capture and storage–A techno-environmental analysis. Sustain. Energy Fuels 2020, 4, 2967–2986. [Google Scholar] [CrossRef] [Scilit]
- BloombergNEF. Lithium Iron Phosphate Battery Cost Forecast for Commercial Vehicles 2024; BloombergNEF: New York, NY, USA, 2024. [Google Scholar]
- China Energy Research Society. China Energy Outlook 2023; China Energy Research Society: Beijing, China, 2023; Available online: https://usercontent.one/wp/www.cet.energy/wp-content/uploads/2023/12/CET_CETO2023_Full-report-20231203.pdf (accessed on 13 May 2026).
- Lu, Z.P.; Yu, X.J.; Lu, C.Y. New Energy Vehicle Sales Forecast Method Integrating VMD and LSTM Models. J. Wuhan Univ. Technol. Inf. Manag. Eng. Ed. 2023, 45, 546–551. [Google Scholar]
- Si, K. Forecast of Ownership and Demand of China’s Freight Trucks During the 11th Five-Year Plan Period. Transp. World Transp. Veh. 2006, 6, 56–58. [Google Scholar] [CrossRef]
Figure 1.
Transport volume of different freight modes in China (2010–2024).
Figure 1.
Transport volume of different freight modes in China (2010–2024).
Figure 2.
Total cost of ownership by truck type in 2020.
Figure 2.
Total cost of ownership by truck type in 2020.
Figure 3.
Purchase cost breakdown of trucks in 2020.
Figure 3.
Purchase cost breakdown of trucks in 2020.
Figure 4.
Purchase cost breakdown of trucks in 2020.
Figure 4.
Purchase cost breakdown of trucks in 2020.
Figure 5.
TCO gap between new energy and diesel trucks (2020–2050).
Figure 5.
TCO gap between new energy and diesel trucks (2020–2050).
Figure 6.
Life cycle GHG emissions of trucks in 2020. Note: COG-FCET = Coke oven gas-based hydrogen fuel cell electric truck. Solar electricity-FCET = Solar-powered water electrolysis hydrogen fuel cell electric truck. Grid electricity-FCET = Grid electricity-powered water electrolysis hydrogen fuel cell electric truck. Natural gas-FCET = Natural gas reforming hydrogen fuel cell electric truck. Coal-FCET = Coal gasification hydrogen fuel cell electric truck. BET = Battery electric truck. DT= Diesel truck.
Figure 6.
Life cycle GHG emissions of trucks in 2020. Note: COG-FCET = Coke oven gas-based hydrogen fuel cell electric truck. Solar electricity-FCET = Solar-powered water electrolysis hydrogen fuel cell electric truck. Grid electricity-FCET = Grid electricity-powered water electrolysis hydrogen fuel cell electric truck. Natural gas-FCET = Natural gas reforming hydrogen fuel cell electric truck. Coal-FCET = Coal gasification hydrogen fuel cell electric truck. BET = Battery electric truck. DT= Diesel truck.
Figure 7.
WTW GHG emissions of trucks (2030, 2040, 2050).
Figure 7.
WTW GHG emissions of trucks (2030, 2040, 2050).
Figure 8.
Prediction of the ownership of trucks with different fuel types from 2020 to 2050.
Figure 8.
Prediction of the ownership of trucks with different fuel types from 2020 to 2050.
Figure 9.
Prediction of greenhouse gas emission intensity for hydrogen production combination.
Figure 9.
Prediction of greenhouse gas emission intensity for hydrogen production combination.
Figure 10.
Total GHG emissions of truck fleet under different scenarios.
Figure 10.
Total GHG emissions of truck fleet under different scenarios.
Figure 11.
Emission share by truck type (2020–2050).
Figure 11.
Emission share by truck type (2020–2050).
Figure 12.
GHG emission reduction by truck type (2020–2050).
Figure 12.
GHG emission reduction by truck type (2020–2050).
Figure 13.
One-way sensitivity analysis results. The horizontal axis represents the change rate of the cumulative GHG emissions of the truck fleet under the ideal scenario (2020–2050) caused by parameter fluctuation. Negative values in blue color indicate a reduction in total emissions, while positive values in yellow color indicate an increase in total emissions.
Figure 13.
One-way sensitivity analysis results. The horizontal axis represents the change rate of the cumulative GHG emissions of the truck fleet under the ideal scenario (2020–2050) caused by parameter fluctuation. Negative values in blue color indicate a reduction in total emissions, while positive values in yellow color indicate an increase in total emissions.
Figure 14.
Combined parameter uncertainty analysis results (the shadow area represents the 95% confidence interval of fleet GHG emissions under the ideal scenario).
Figure 14.
Combined parameter uncertainty analysis results (the shadow area represents the 95% confidence interval of fleet GHG emissions under the ideal scenario).
Table 1.
Comparison of fuel cell trucks with electric and diesel trucks.
Table 1.
Comparison of fuel cell trucks with electric and diesel trucks.
| Item | Hydrogen Fuel Cell Trucks | Electric Trucks | Diesel Trucks |
|---|
| Energy Sustainability | Renewable with diverse hydrogen sources | Renewable | Non-renewable |
| Tailpipe Emissions | Zero emissions | Low/zero emissions | High emissions |
| Refueling/Charging Time | A few minutes for hydrogen refueling; requires hydrogen refueling stations | Several hours for charging; requires charging stations | A few minutes for refueling; requires gas stations |
| Driving Range | Relatively long | Relatively short | Long |
| Powertrain System Efficiency | High | High | Low |
| Noise | Low | Low | High |
Table 3.
Necessary parameters for unit conversion.
Table 3.
Necessary parameters for unit conversion.
| Fuel | Density | Lower Heating Value |
|---|
| Diesel | 837 g/L | 43.8 MJ/kg |
| Hydrogen | 83.8 g/m3 | 140 MJ/kg |
Table 4.
Parameter assumptions for trucks.
Table 4.
Parameter assumptions for trucks.
| Truck Type | Motor Power
(kW) | Fuel Cell Power
(kW) | Driving Range (km) | Annual Mileage
(km) | Service Life
(Year) |
|---|
| Mini Truck | 60 | 70 | 100 | 19,500 | 12 |
| Light-Duty Truck | 85 | 100 | 200 | 28,000 | 15 |
| Medium-Duty Truck | 239 | 200 | 400 | 35,000 | 15 |
| Heavy-Duty Truck | 250 | 200 | 600 | 55,000 | 15 |
Table 5.
Key parameters of the battery.
Table 5.
Key parameters of the battery.
| Core Parameters | Unit | Value |
|---|
| Energy Density | kWh/kg | 0.159 |
| Battery Pack Weight | kg | 203 |
| Battery Pack Capacity | kWh | 23.5 |
| Specific Energy Consumption | kWh/kg | 0.958 |
Table 7.
Power generation structure and grid emission intensity prediction.
Table 7.
Power generation structure and grid emission intensity prediction.
| Energy | 2030 | 2040 | 2050 |
|---|
| Coal | 48% | 26% | 3% |
| Natural Gas | 6% | 7% | 4% |
| Hydropower | 16% | 16% | 17% |
| Nuclear Power | 8% | 12% | 18% |
| Wind Power | 14% | 23% | 30% |
| Solar Power | 8% | 16% | 28% |
Grid Greenhouse Gas Emission Intensity
(kg CO2eq/kWh) | 0.581 | 0.425 | 0.138 |
Table 8.
Fuel consumption coefficients for different truck driving distances.
Table 8.
Fuel consumption coefficients for different truck driving distances.
| Truck Type | Diesel (L/km) | Electricity (kWh/km) | Hydrogen (kg/km) |
|---|
| Mini Truck | 0.07 | 0.2 | 0.012 |
| Light-Duty Truck | 0.1 | 0.25 | 0.018 |
| Medium-Duty Truck | 0.33 | 0.7 | 0.04 |
| Heavy-Duty Truck | 0.36 | 1.4 | 0.08 |
Table 9.
Range and justification of key uncertain parameters.
Table 9.
Range and justification of key uncertain parameters.
| Key Uncertain Parameter | Baseline Value in This Study | Fluctuation Range | Probability Distribution Setting | Justification of Range Setting |
|---|
| Hydrogen price in 2050 | 20 CNY/kg | 15–25 CNY/kg | Triangular distribution (minimum: 15; most likely: 20; maximum: 25) | The range fully corresponds to the scenario-based hydrogen price forecasting system constructed in this study: the lower bound matches the Accelerated Scenario, the baseline value matches the Baseline Scenario, and the upper bound matches the Conservative Scenario. The setting is calibrated based on the IEA Net Zero Emissions by 2050 Scenario and the China Hydrogen Energy Industry Development Report 2024, covering the full uncertainty range of renewable hydrogen cost in China [6,34]. |
| Power battery system cost | Baseline value calculated based on 0.159 kWh/kg energy density and 0.958 kWh/kg specific energy consumption | ±30% of the baseline value | Normal distribution (mean: baseline value; standard deviation: 10% of baseline value) | The range is calibrated based on BloombergNEF’s 2024 forecast of lithium iron phosphate battery cost for commercial vehicles, covering the uncertainty of technological progress, raw material price fluctuations, and large-scale production effects [44]. |
| Grid GHG emission intensity in 2050 | 0.152 kg CO2eq/kWh | 0.100–0.220 kg CO2eq/kWh | Triangular distribution (minimum: 0.100; most likely: 0.152; maximum: 0.220) | The lower bound corresponds to the accelerated decarbonization scenario in China Energy Outlook 2023 (full phase-out of coal-fired power by 2050) [45]; the upper bound corresponds to the conservative scenario with slower renewable energy development, consistent with the parameter setting range in Khanna et al. (2021) [16]. |
| Fuel economy improvement rate by 2035 | 35% (vs. 2015 baseline) | 25–45% | Uniform distribution | The range is consistent with the Global Fuel Economy Initiative (GFEI) global target fluctuation range, covering the uncertainty of policy implementation intensity and engine technology breakthroughs, and aligned with the setting in ICCT’s China heavy-duty truck fuel efficiency research [20]. |
| Discount rate | 5% | 3–10% | Uniform distribution | The range covers the actual financing cost range of different types of freight fleet operators in China: the lower bound corresponds to the low financing cost of large state-owned logistics enterprises, while the upper bound corresponds to the high capital cost of small- and medium-sized private fleets, consistent with the parameter setting range in mainstream TCO studies on commercial vehicles [29,31]. |
Table 10.
Model validation: simulated vs. real historical truck fleet GHG emissions (unit: Mt CO2eq).
Table 10.
Model validation: simulated vs. real historical truck fleet GHG emissions (unit: Mt CO2eq).
| Year | Real Historical Emissions | Model-Simulated Emissions | Absolute Percentage Error |
|---|
| 2015 | 172.3 | 168.5 | 2.20% |
| 2016 | 178.6 | 174.2 | 2.46% |
| 2017 | 185.2 | 180.9 | 2.32% |
| 2018 | 190.4 | 195.8 | 2.84% |
| 2019 | 193.7 | 203.6 | 5.11% |
| 2020 | 196.5 | 207.5 | 5.60% |
| Average MAPE | — | — | 3.82% |
Table 11.
Forecasting performance comparison of LSTM and baseline models (testing set average).
Table 11.
Forecasting performance comparison of LSTM and baseline models (testing set average).
| Model | MAE (Units) | RMSE (Units) | MAPE (%) |
|---|
| Linear Regression | 1892.6 | 2457.3 | 12.16 |
| ARIMA | 1426.8 | 1879.5 | 9.59 |
| LSTM (This Study) | 635.2 | 842.7 | 4.27 |
Table 12.
Prediction of hydrogen production structure.
Table 12.
Prediction of hydrogen production structure.
| Hydrogen Source | 2020 | 2030 | 2040 | 2050 |
|---|
| Natural Gas | 14% | 14% | 5% | <1% |
| Coal | 65% | 13% | 5% | <1% |
| Industrial By-product | 21% | 3% | 2% | <1% |
| Fossil Energy + CCUS (Fossil Energy with Carbon Capture, Utilization and Storage) | <1% | 32% | 33% | 34% |
| Water Electrolysis | <1% | 38% | 45% | 65% |
| Disclaimer/Publisher’s Note: The statements, opinions and data contained in all publications are solely those of the individual author(s) and contributor(s) and not of MDPI and/or the editor(s). MDPI and/or the editor(s) disclaim responsibility for any injury to people or property resulting from any ideas, methods, instructions or products referred to in the content. |