Article

Driving Decarbonization: A Life Cycle Assessment of Road Freight Transport Using Locally Produced Green Hydrogen in The Netherlands

1
KWR Water Research Institute, Groningenhaven 7, 3430 BB Nieuwegein, The Netherlands
2
CE Delft—LCA Department, Oude Delft 180, 2611 HH Delft, The Netherlands
3
Allied Waters, Groningenhaven 7, 3430 BB Nieuwegein, The Netherlands
*
Author to whom correspondence should be addressed.
Energies 2026, 19(10), 2433; https://doi.org/10.3390/en19102433
Submission received: 20 March 2026 / Revised: 11 May 2026 / Accepted: 13 May 2026 / Published: 19 May 2026
(This article belongs to the Special Issue 11th International Conference on Smart Energy Systems (SESAAU2025))

Abstract

Road freight transport is an important driver of global greenhouse gas (GHG) emissions. Decarbonizing this sector demands a comprehensive assessment of emerging powertrain technologies, which are currently lacking in the literature. To fill this knowledge gap, we performed a life cycle assessment (LCA) on 10 impact categories to evaluate road freight transport in the Netherlands of four truck alternatives, assuming similar performance: fuel-cell electric (FCEV), hydrogen internal combustion engine (HICEV), battery electric (BEV), and diesel internal combustion engine (DICEV). We compared locally produced green hydrogen, according to EU regulations, with electricity and diesel as alternative fuel chains, while also considering the environmental impact of road infrastructure. We found that FCEV and HICEV trucks achieve the lowest global warming impact when green hydrogen is used. We identified discrepancies between the transport alternatives, highlighting key factors influencing NOx and particulate matter emissions. Our research also showed that water consumption (WC) for green hydrogen is strongly influenced by upstream processes, with solar-powered electricity emerging as a crucial contributor. Our results highlight the need for more exploration on the environmental impact of green hydrogen and can be used by researchers and practitioners to further understand the complexity of reducing emissions in road freight transport.

1. Introduction

In 2022, the transport sector was responsible for 23% of global greenhouse gas (GHG) emissions [1]. Road freight transport contributes approximately 6% of global GHG emissions [2], highlighting its large environmental impact compared to other modes of transport. The transition of road freight transport from fossil-based fuels to renewable energy requires the implementation of advanced powertrains capable of high-capacity energy storage and rapid recharge or refueling, alongside infrastructure designed to efficiently supply novel energy carriers [3,4]. According to projections by the International Transport Forum [5], global freight transport emissions could increase by up to 60% by 2050 if no additional measures are implemented to decarbonize this sector. This trajectory directly conflicts with the goals of the Paris Agreement [6], which emphasizes the urgent need to reduce GHG emissions across all sectors.
Hydrogen is an energy carrier that can be used for the decarbonization of freight transport and heavy-duty mobile operations [7,8,9]. To accelerate the decarbonization of the freight transport sector, the EU introduced the Renewable Energy Directive III (RED III), establishing binding targets for solely renewable energy deployment across Member States [10,11]. By 2030, at least 5.5% of the energy used in transport must come from advanced biofuels and Renewable Fuels of Non-Biological Origin (RFNBO) [10]. In the Dutch context, this corresponds to an RFNBO sub-target of 7.5 petajoules (PJ) by 2030, representing around 1% of the total energy demand across the transport sector [12,13]. Green hydrogen qualifies as an RFNBO RED III compliant fuel when it is produced using verifiably newly installed renewable electricity that matches in both time and location to the hydrogen production.
For road freight transport, two types of technologies are considered to utilize hydrogen. Hydrogen internal combustion engine vehicle (HICEV) trucks rely on modified internal combustion engines adapted from conventional diesel systems [14]. Fuel-cell electric vehicle (FCEV) trucks utilize hydrogen-based electrochemical conversion technology, offering higher energy conversion efficiency than HICEV and no tailpipe emissions except water. Since pressurized hydrogen achieves a higher energy density in volume and weight compared to batteries and allows rapid refueling, it is well-suited for applications that require long range and minimal downtime [15]. Compared to battery-electric trucks, hydrogen-powered vehicles can achieve longer distances without the weight penalty of large battery systems [16]. Compared with fully electrified pathways that depend on the electricity grid for distribution, hydrogen offers higher long-distance transport capacity, especially when transported as hydrogen gas through pipelines or in liquefied form by ship, train, or truck [17,18]. This study focuses on gaseous hydrogen, as it is the primary form used in vehicle applications.
The lack of robust and cost-efficient green hydrogen production and distribution infrastructure remains a crucial barrier to large-scale adoption, as both are essential for widespread vehicle deployment [19]. However, development is limited by the insufficient size of the current hydrogen market [20]. This mutual dependency between vehicle availability and infrastructure investment creates a challenge: without sufficient infrastructure and a suitable service network for hydrogen vehicles, fleet operators are reluctant to adopt hydrogen trucks, while infrastructure providers are hesitant to invest without assurances of hydrogen demand.

Life Cycle Assessment of Road Freight Transport

Life cycle assessment (LCA) is widely used to evaluate and compare the environmental performance of alternative transport pathways over their full life cycles [17,21]. Previous studies have applied comparative LCAs to passenger and freight vehicles powered by diesel, electricity, and hydrogen [22,23,24,25,26,27,28]. Within this perspective, powertrains such as battery-electric vehicles (BEVs), FCEVs and HICEV are considered as sustainable transition pathways [27], each characterized by distinct infrastructural and system integration requirements. These studies have provided important insights into trade-offs between energy efficiency, GHG emissions, and upstream environmental impacts. However, most LCAs focus on fuel pathways and drivetrain efficiency while abstracting from freight-specific system characteristics.
Recent research on road freight transport highlights the importance of logistical characteristics, such as payload capacity and vehicle mass, in determining operational variability in practice [29]. Differences in vehicle weight between BEVs, FCEVs, and diesel trucks directly affect usable payload and transport efficiency, yet these effects are rarely adopted in LCA system boundaries [30]. From a transition perspective, this constitutes a conceptual limitation, as decarbonization outcomes are defined by system-level interactions.
Operational non-exhaust emissions, particularly from tire and brake wear, are increasingly recognized as environmental burdens, especially from heavier vehicles and high-torque powertrains [31]. Furthermore, LCAs exclude road infrastructure impacts, such as road construction and degradation, although differences in gross vehicle weight (GVW) between different powertrains do affect the load on the infrastructure [31].
With respect to the hydrogen fuel chain, existing LCAs of hydrogen-powered freight transport predominantly focus on centralized production and long-distance distribution via tube trailers or hydrogen trucking [32]. These studies do not fully capture emerging configurations involving locally produced green hydrogen that is RFNBO RED III compliant. The production of green hydrogen combined with on-site storage has been proposed to reduce transport requirements, enhance system flexibility, and improve environmental performance [33]. However, these configurations remain underrepresented in comparative LCA studies of road freight transport. Importantly, regulatory conditions governing green hydrogen production and use have no direct equivalent for BEVs [34]. This asymmetry highlights the importance of a more context-specific analytical approach.
The literature indicates that there is a research gap regarding the further development of LCA approaches for freight transport that explicitly consider the interaction between powertrain technologies, logistical efficiency and infrastructure systems. This study comprises an LCA of road freight transport, approached as a systems-oriented transition analysis. Therefore, it provides insights into energy sources and powertrains, vehicle mass, the effects of payload, infrastructure use and local fuel supply.

2. Materials and Methods

2.1. Methodological Framework

2.1.1. Methodology

For the LCA, we followed the ISO 14040 and ISO 14044 guidelines [35,36]. These standards ensure that the LCA process is systematic, transparent, and reproducible, following four phases: (i) goal and scope definition, (ii) life cycle inventory (LCI) analysis, (iii) life cycle impact assessment (LCIA), and (iv) interpretation.
In the goal and scope definition, the overall objective of the study, the intended application, and the target audience were defined. This phase also included defining the functional unit, setting the system boundaries, outlining assumptions and limitations, and clarifying data quality requirements (see Table S1). The subsequent LCI analysis involved the gathering and quantification of all relevant energy and material inputs and environmental emissions. Foreground data collected within the LNH project reflects actual operating conditions and background data was selected from Ecoinvent. All modeling procedures were performed using SimaPro 9.6.0.01 software.
The LCIA phase converted the quantified material and energy exchanges of the system into potential environmental (midpoint) impacts using the ReCiPe 2016 (Hierarchist) method [37]. This is a scientifically supported approach to assess the environmental impact [24,27]. Ten of the eighteen available midpoint impact categories were included to ensure an evaluation of different transport alternatives with relevant environmental indicators. All selected impact categories are provided in Table S2. The interpretation phase assessed the robustness of the results, evaluated uncertainties and sensitivities, and formulated conclusions consistent with the defined goal and scope.

2.1.2. Case Study Description

This research examined the environmental impact of a local green hydrogen fuel chain for transport in Nieuwegein, the Netherlands, which was built and became operational in 2024 as part of the LIFE NEW HYTS (LNH) project [38]. The local scale allows the LNH consortium to innovate and be flexible, exploring different products and markets as early adopters, for example, hydrogen drivetrain technologies, electricity markets and grid-balancing services. The local scale also makes it possible to respond more effectively to policy developments and to identify where regulations are hindering the transition to sustainable transport and what changes are needed to accelerate this process. Moreover, local hydrogen applications have benefits in terms of exchange of energy and other commodities with local third parties, such as direct usage of locally produced renewable electricity, or valorizing byproducts such as residual heat or oxygen. Lastly, the character of the demonstration project makes it easier to involve local third parties and to replicate in the broader European context.
The system under study produces green hydrogen using a 2.5 MW proton-exchange membrane water electrolyzer (PEMWE) using electricity from wind power and solar power. Because only renewable electricity is used, the green hydrogen may be classified as RED III compliant RFNBO. The hydrogen is fuel-cell-grade, meaning it meets the high-purity requirements necessary for PEM fuel-cell operation [39]. The produced hydrogen is transported at 30 Bar via a 1.3 km pipeline to a nearby hydrogen refueling station (HRS), where it is stored at high pressure up to 900 Bar. Hydrogen can be used by all types of hydrogen-powered vehicles and mobile machinery. This study focuses primarily on applications in heavy-duty freight transport. All foreground data are provided through the LNH project and represent the system as installed. To ensure a fair and consistent comparison between the transport alternatives, the average load factor is set at 20 mt, based on a truck with a maximum GVW of 40 mt [40].

2.1.3. Goal and Scope, System Boundaries and Functional Unit

The goal of this study was to assess the environmental impact of freight transport with locally produced green hydrogen in comparison with battery-electric and diesel-fueled trucks. The assessment also aims to identify opportunities to reduce the overall environmental footprint and address key contributing factors of the green hydrogen fuel chain.
The analysis followed a ‘cradle-to-grave’ approach and covers both emissions and uptake from the environment, from the extraction of raw materials through to end-of-life processing, including disposal and recycling of selected materials. For the geographical scope, the Dutch context was applied wherever inventory data was available. Alternatively, European-level data was used, and where this is also unavailable, global data was considered.
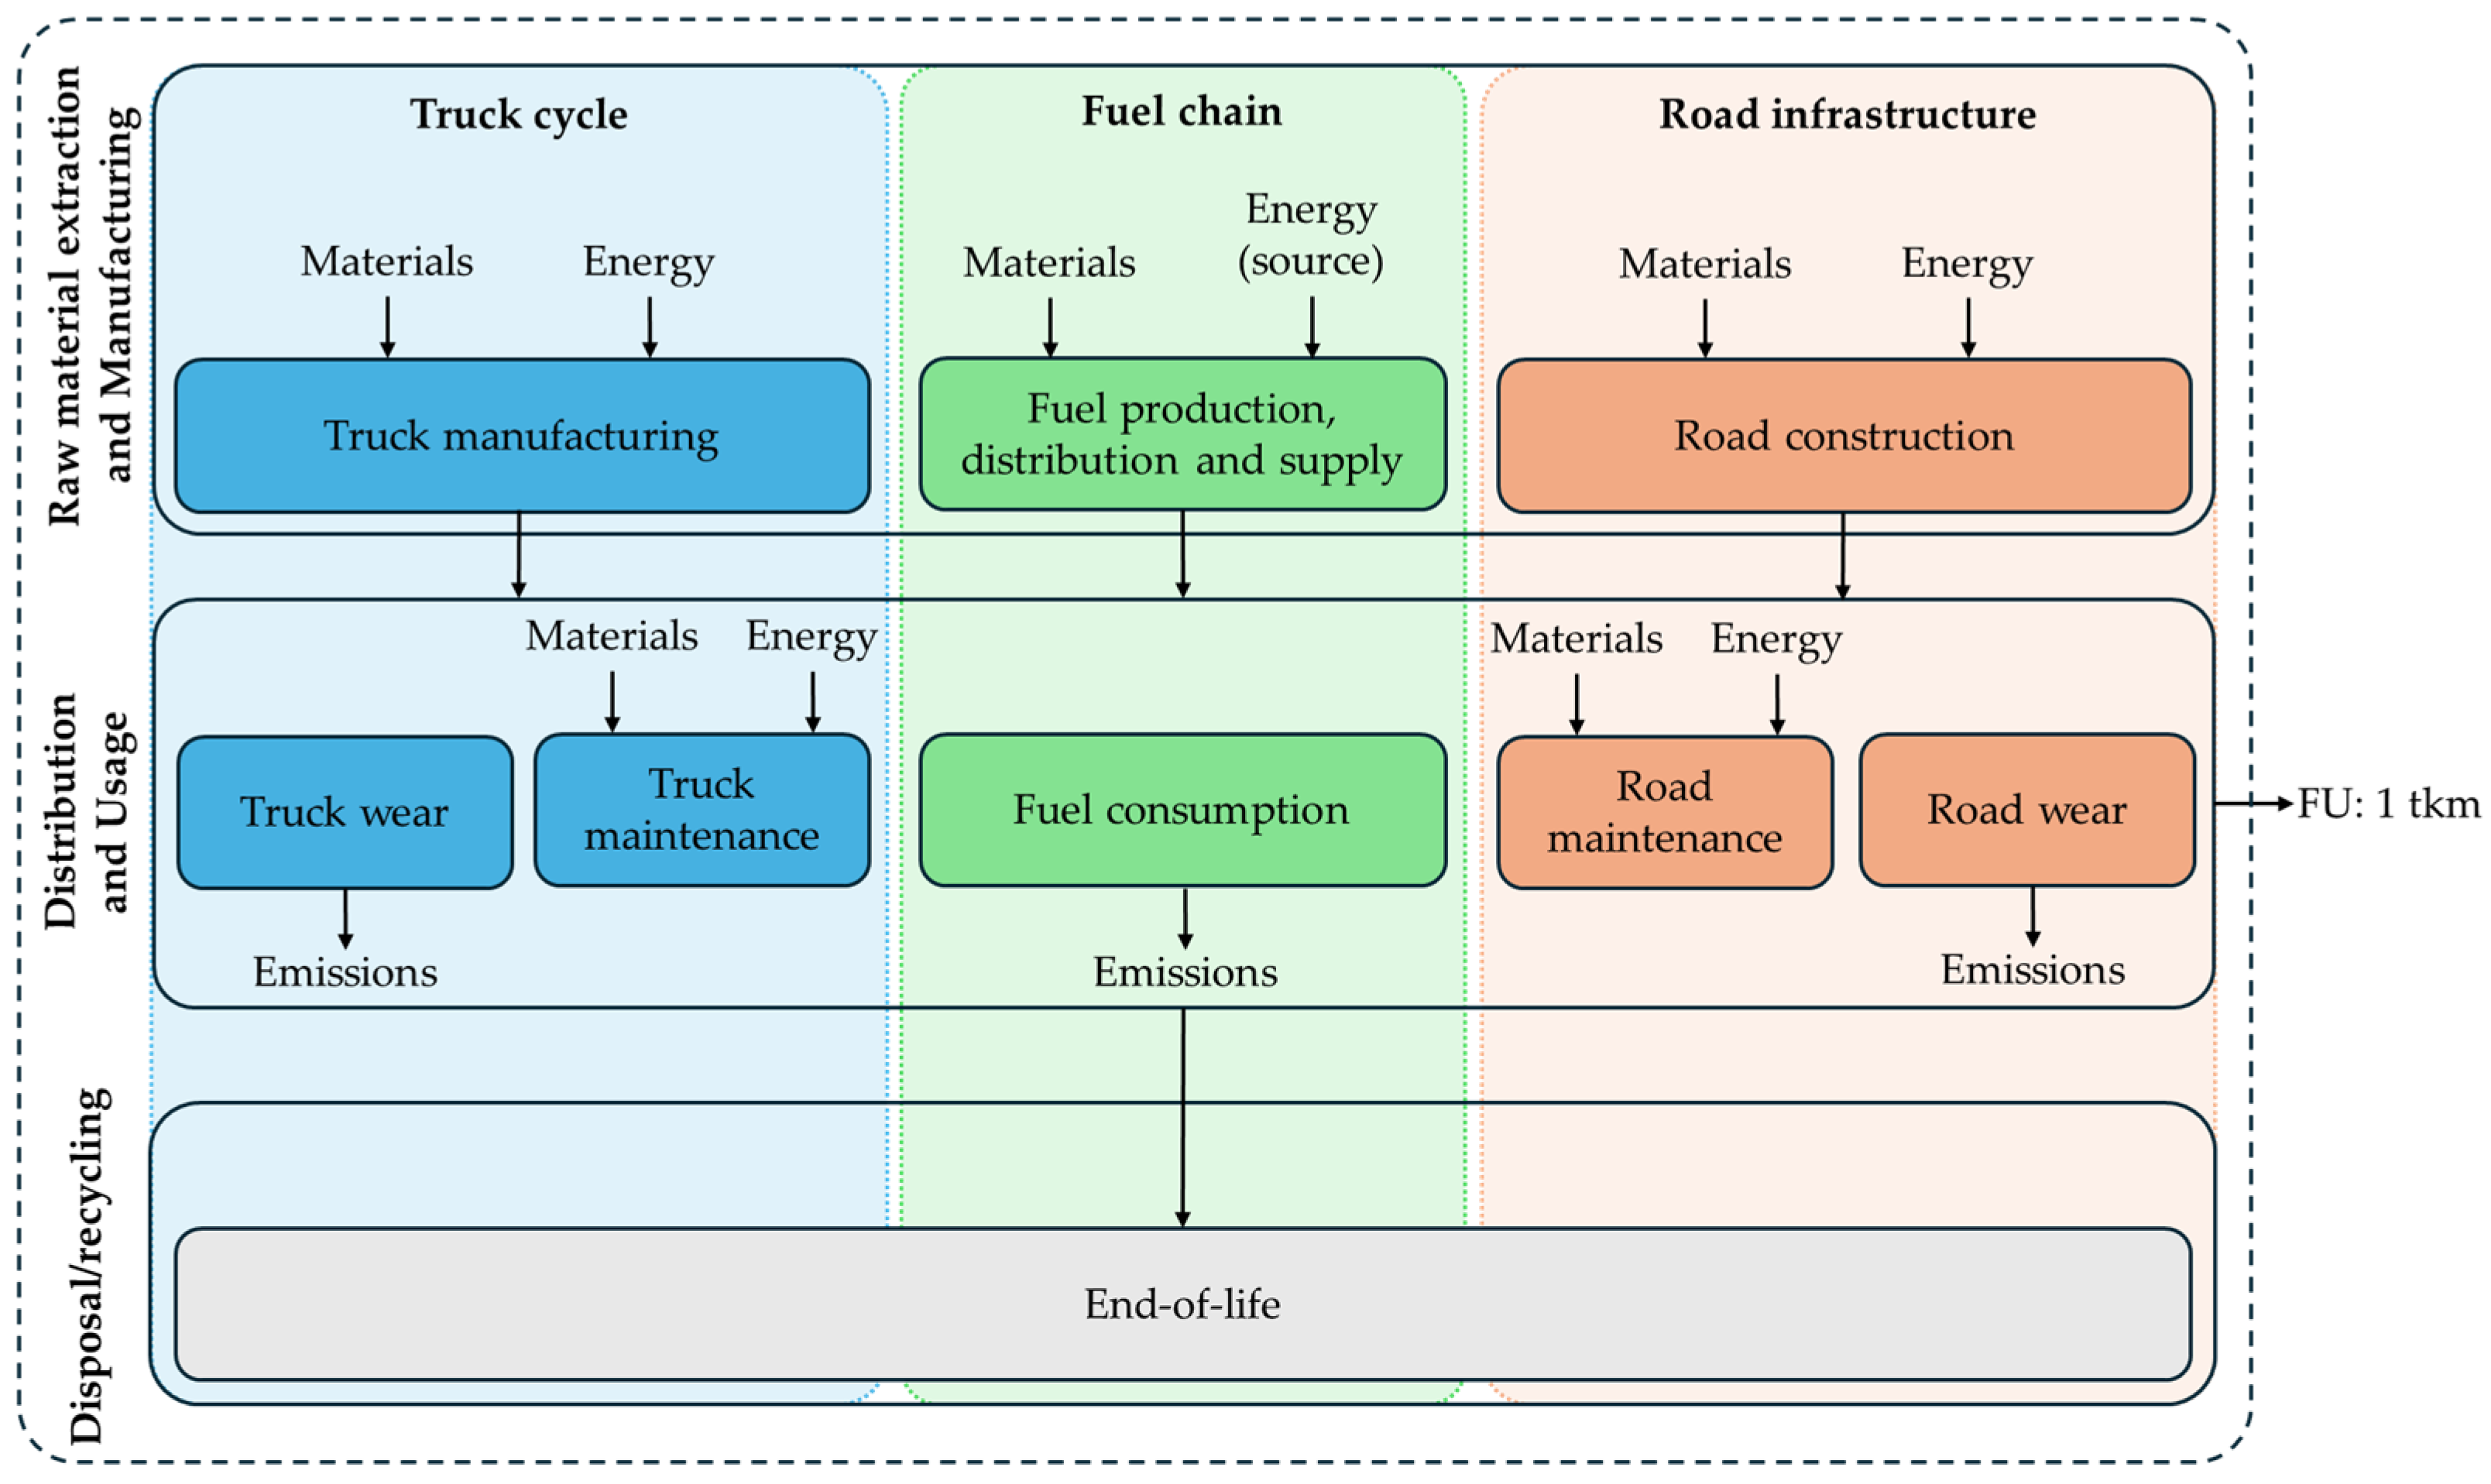
The system boundaries illustrated in Figure 1 show that the system is divided into three domains: truck cycle, fuel chain, and road infrastructure. The truck cycle includes (environmental emissions and extractions of) manufacturing, maintenance, wear, and end-of-life processes for four freight trucks, each with a distinct powertrain configuration. Two hydrogen-based options were considered: the FCEV truck and HICEV truck. The diesel internal combustion engine vehicle (DICEV) truck represents the baseline transport technology, which is currently dominant in freight transport. For this option, the production and use of AdBlue (a solution of 32.5% urea and 67.5% demineralized water) were included to meet EURO 6 emission standards. The final alternative is a BEV truck, reflecting a fully electrified powertrain approach. Refueling and recharging times were excluded from the analysis, as the system boundaries are confined to regional operations rather than long-haul freight transport. The fuel chain covers the (environmental emissions and extractions of) fuel production, distribution (fuel transport), supply (refueling station), and consumption of energy carriers, also known as well-to-wheel (WTW). Emissions associated with end-of-life processes for the fuel chain infrastructure were also included. Three fuel chains were considered for the transport alternatives: green hydrogen, electricity and diesel. The road infrastructure module includes construction, maintenance, and road wear. Emissions related to road infrastructure were quantified based on background life cycle inventory data for road construction, maintenance, and wear, with emission factors adjusted for GVW, following the methodology of Spielmann and Scholz (2005) [41]. As for the truck cycle, emissions of end-of-life processes from equipment and materials were included.
The functional unit (FU) is defined as one ton-kilometer (1 tkm), representing the transport of one ton of freight over one kilometer.

2.2. Life Cycle Inventory (LCI): Truck Cycle

This study examined the truck cycle of four alternatives: FCEV, HICEV, BEV, and DICEV. Because no public data on material composition was available for truck manufacturing, a diesel-fueled heavy-duty truck from the Ecoinvent database [42] served as the baseline for determining material use across all configurations. The specifications for each powertrain type, presented in Table 1, formed the basis for calculating material demand. All underlying calculations and detailed methodological steps are provided in the Supplementary Material Table S3. All truck variants can reach a GVW of up to 40 mt and are available in either a 6 × 2T (three axles, one drive axle) or 6 × 4T (three axles, two drive axles) configuration. Reported truck masses refer to vehicle mass excluding fuel. Additional weight corresponding to fuel was added separately by assuming tanks are filled to 50% of their maximum allowable mass or volume. Fuel consumption of the trucks is based on available data from manufacturers and converted per 1 tkm. Refueling and recharging time was not considered in the results since the FU was set at the transport of one ton of freight over one kilometer.
For the FCEV truck, the Hyundai XCIENT Fuel-Cell model was used [43,44]. For the HICEV truck, a MAN hTGX was selected [45,46]. Although both vehicles are hydrogen-fueled, they differ in hydrogen storage pressure: the FCEV configuration uses 350 Bar storage, consistent with the European model currently available, while the HICEV configuration uses 700 Bar storage. The 700 Bar version of the Hyundai XCIENT Fuel Cell is available in North America, but the 350 Bar European configuration was used in this study to ensure regional representativeness.
The BEV configuration was based on a Volvo FH Electric truck (6 × 4T) [47,48], while the DICEV truck was modeled using a Volvo FH truck [47,49]. The inventory focused on differences in material use for the main powertrain components (e.g., battery pack, electric motor).
For all truck types, the analysis is performed with an assumed lifetime of 800,000 km, which reflects typical operational lifetimes for heavy-duty vehicles [21]. Because truck lifetime and the load factor are uncertain and can influence the environmental impact, differences in lifetime and load factor are examined in the sensitivity analysis.
For maintenance inventories, data from a diesel-fueled heavy-duty truck in the Ecoinvent database [50] served as the baseline. The same adjustment method used in the manufacturing inventory was applied, modifying the base process depending on the powertrain type. A distinction was made between electric trucks (FCEV and BEV) and trucks with combustion engines (HICEV and DICEV).
The literature showed that tire- and brake-related truck wear depends on (GVW) [31]. Because this study assumes that the average freight load factor is the same across all transport alternatives, differences in truck wear arise only from variations in the total truck weight. The total vehicle weight was determined by adding or removing components associated with the FCEV, HICEV, and BEV configurations.

2.3. Life Cycle Inventory (LCI): Fuel Chain

In the fuel chain, we consider environmental emissions and extractions during fuel production and supply, as well as emissions during the use of the fuels. Below, we discuss the fuel chains for green hydrogen, electricity and diesel.

2.3.1. Green Hydrogen Fuel Chain

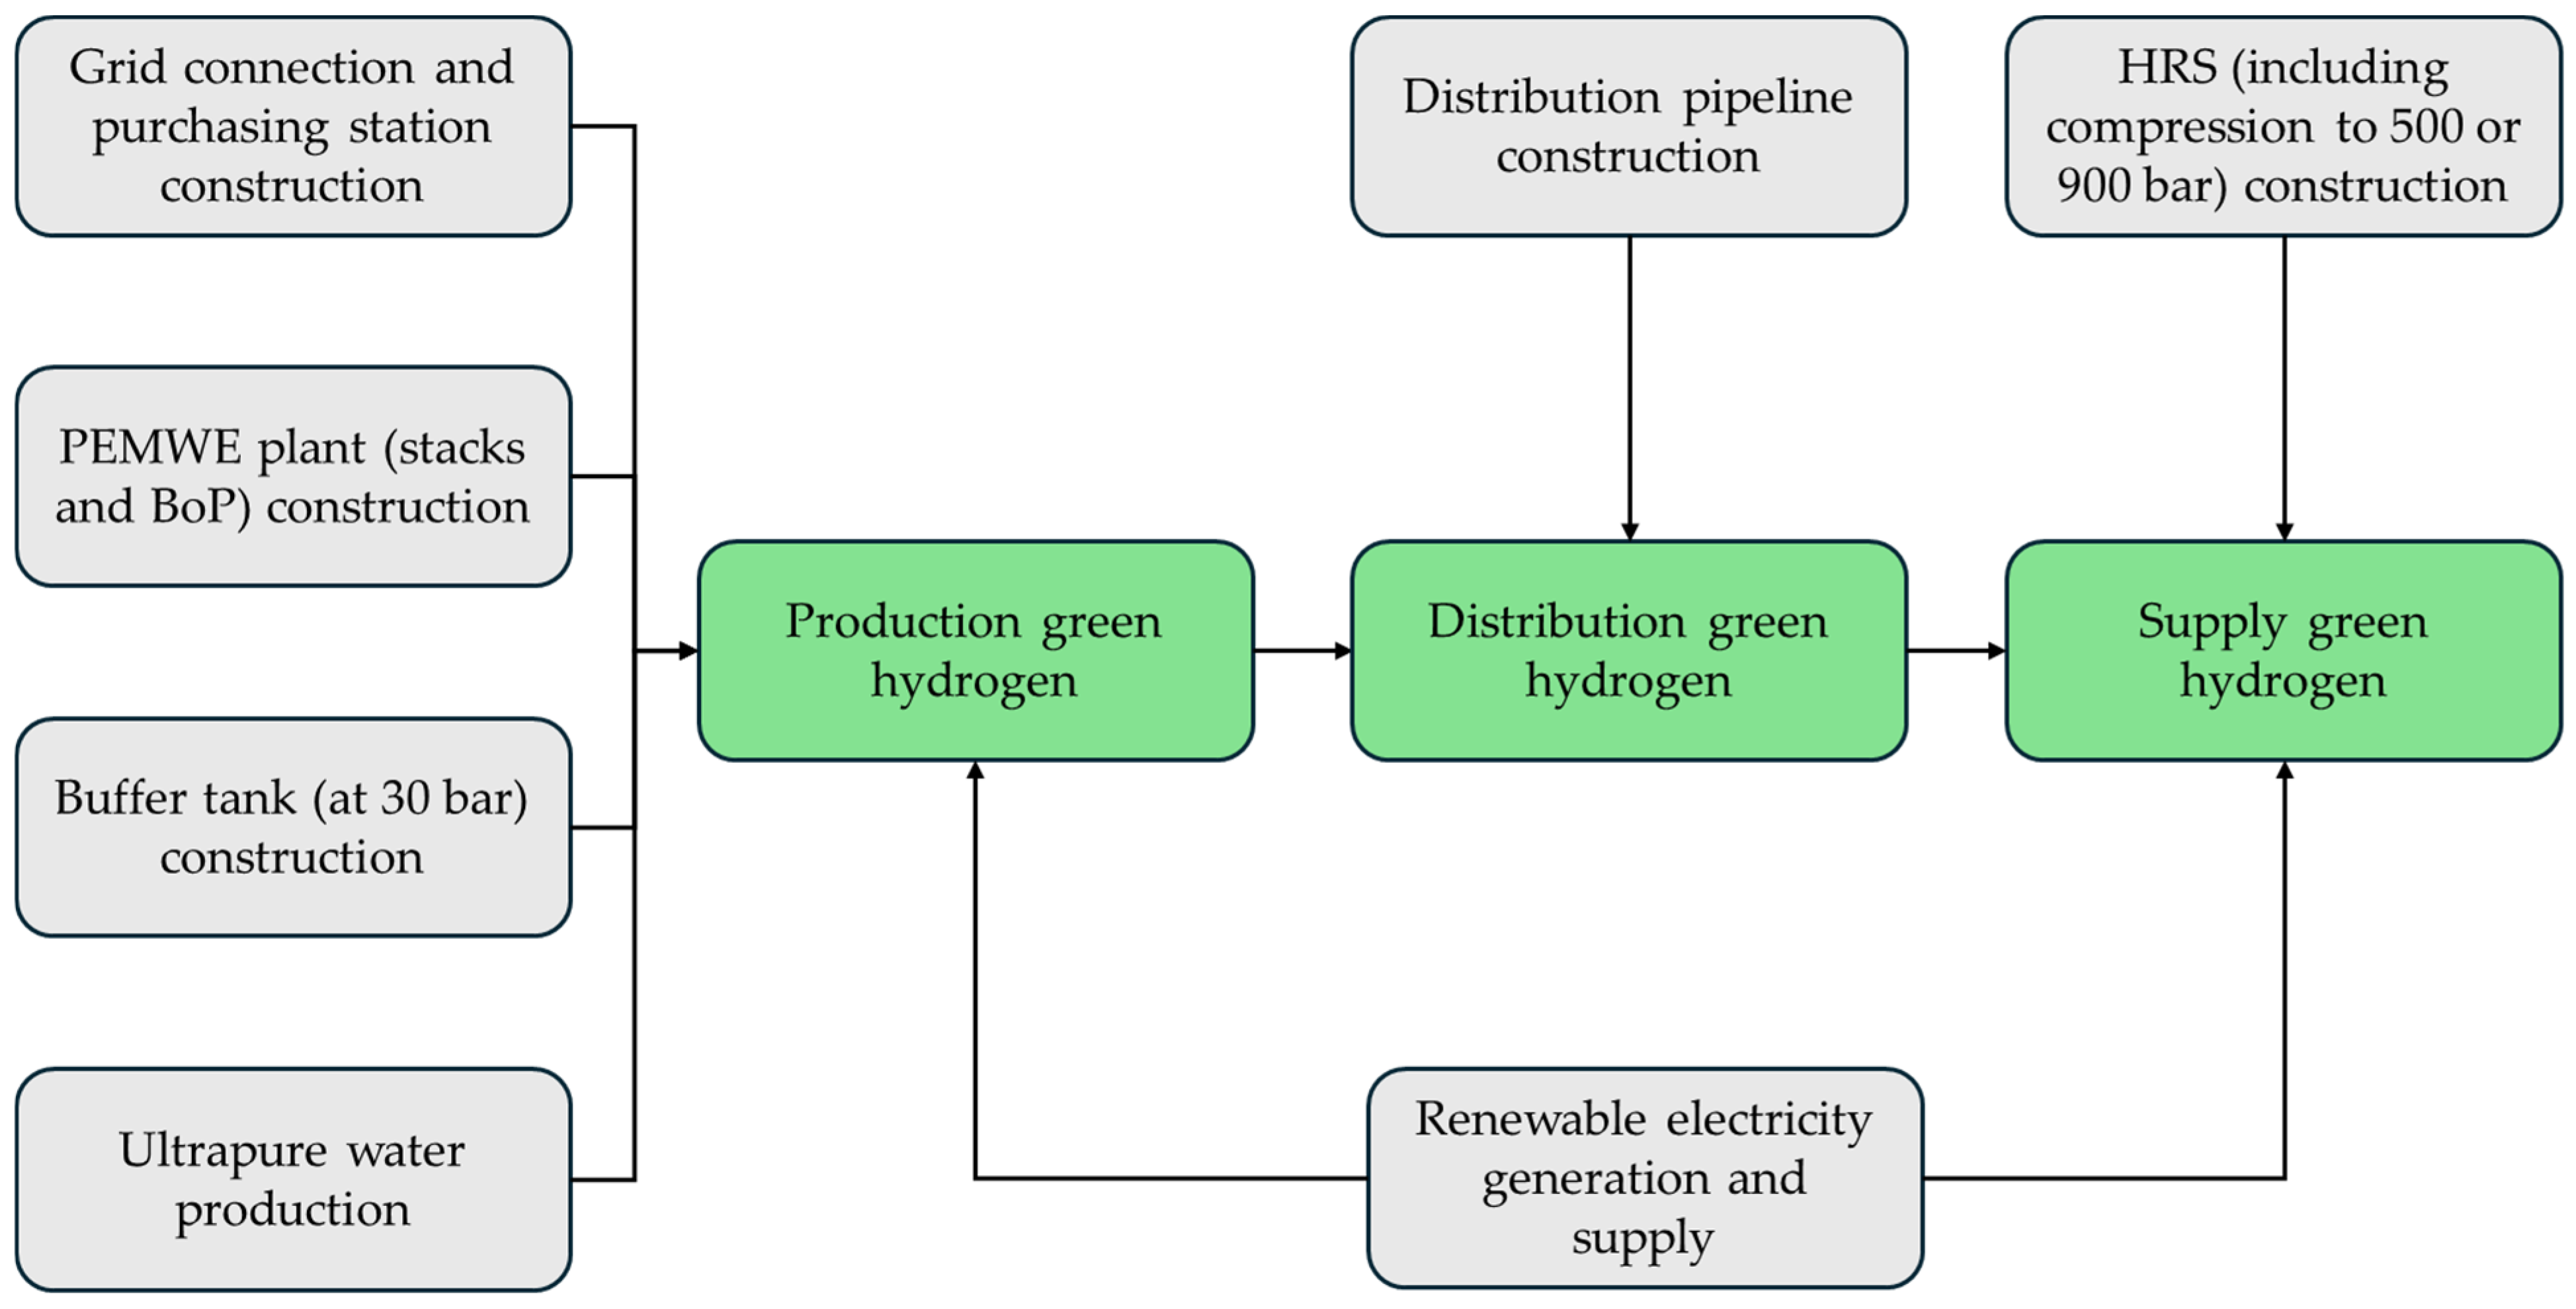
For hydrogen production, a 2.5 MW proton-exchange membrane water electrolyzer (PEMWE) was considered. The expected annual hydrogen production is 250 mt, based on 5320 operating hours at full capacity per year. For this, an electricity mix of solar power (40%), onshore (32%) and offshore (28%) wind power was used based on the most recent data provided by the Central Agency for Statistics [51]. Long-term stack performance is influenced by cell degradation, which was estimated to be 1% per year. The green hydrogen fuel chain is displayed schematically in Figure 2. The operational key values are provided in Table 2.
The PEMWE plant is connected to the national electricity grid through an on-site purchasing station. Power to the electrolyzer stacks is supplied via a dedicated power container, where the voltage is stepped down from 10.5 kV to approximately 215 V and converted from alternating current (AC) to direct current (DC). Electricity supply to auxiliary components is provided by an on-site transformer, which falls outside the scope of the LCA.
The PEMWE plant has its own treatment installation to produce ultrapure water out of drinking water, which is part of the auxiliary equipment. Directly after the PEMWE, there is a buffer tank to store green hydrogen at 30 Bar before it is transported to the HRS via a stainless steel pipeline of 1.3 km. Hydrogen supply includes the construction of a buffer tank and HRS, where hydrogen is further compressed to 550 or 900 Bar, depending on the specifications of the hydrogen vehicle (350 or 700 Bar).
The specific energy demand of the electrolyzer stack comprises the primary electricity consumption. The stack requires 49.3 kWh/kg H2 for hydrogen conversion at an initial pressure of 30 Bar [52]. The 2025 energy demand is comparable to the conversion efficiency observed in the LNH case study. Additional fuel consumption associated with auxiliary equipment, like ultrapure water production, gas cleaning and cooling, was estimated at 5% of the stack-specific energy demand [52,53]. The associated energy demand for compression at 550 and 900 Bar is 3.5 and 4.5 kWh/kg H2, respectively [54]. This includes the cooling demand for compression at those pressures. When combining stack consumption, auxiliary loads, compression, and the cumulative effect of stack degradation over the system lifetime, the total specific electricity consumption is 57.0 kWh/kg H2 at 550 Bar and 58.0 kWh/kg H2 at 900 Bar. No analysis or monitoring is conducted to quantify hydrogen venting resulting from phenomena such as gas crossover or venting during electrolyzer start-up and gas purification. Internal safety systems are in place to detect unexpected hydrogen leaks and to trigger alarms when defined threshold levels are exceeded. Active monitoring is performed to assess key performance indicators, such as efficiency, to identify potential leakages and minimize the loss of hydrogen. For this assessment, a hydrogen leakage rate of 1% was assumed, based on values reported in the literature for systems with comparable system boundaries [55]. Due to uncertainty in hydrogen leakage rates and their potential impact on the environmental impact, a range of leakage rates was evaluated in the sensitivity analysis.
The life cycle inventory (LCI) of the PEMWE stacks is based on the literature that reports material requirements for PEMWE stack technologies in 2025 [56], and the resulting inventory data are presented in Table 3. The full life cycle inventory (LCI) of the green hydrogen fuel chain is provided in the Supplementary Material Table S4.
Table 2. PEMWE system parameters for the situation in 2025.
ParameterUnitSituation 2025References
Stack size electrolyzerMW2.5[52]
Hydrogen production targetmt/year250[52]
Full load operating hoursHours/year5320[52]
Stack efficiency degradation%/year1[52]
Operating pressure (stack/HRS)Bar30/550 or 900
Specific electricity consumption stackkWh/kg H249.3[52]
Energy demand cell degradationkWh/kg H21.8
Auxiliary equipment electricity
consumption (5% of specific electricity consumption stack)
kWh/kg H22.5[52,53]
Compression to 900 Bar energy demand (including cooling)kWh/kg H23.5 (at 550 Bar) or
4.5 (at 900 Bar)
[54]
Total electricity consumption (incl. efficiency degradation)kWh/kg H257.0 (at 550 Bar) or
58.0 (at 900 Bar)
-
Water demand (ultrapure)kg/kg H29.2[53,57]
Stack lifetimeYears8[53,57]
Balance of plant (BoP) lifetimeYears20[53,57]
Table 3. Material demand of the 2.5 MW proton-exchange water electrolysis (PEMWE) stacks for a situation in 2025.
MaterialAmount [kg]Applied Ecoinvent Dataset
Titanium987.5Titanium—GLO
Stainless steel1377.5Steel, chromium steel 18/8—GLO
Copper987.5Copper, cathode—GLO
Nafion15Tetrafluoroethylene—GLO
Activated carbon23.5Activated carbon, granular—GLO
Carbon paper22.5Reference product [53]
Graphite263.7Graphite—GLO
Iridium1.3Iridium (raw material)
Platinum1.6Platinum—GLO
Ruthenium0.2Ruthenium (raw material)
Gold0.7Gold—GLO
Aluminum67.5Aluminum—GLO
Plastic272.5Polymer foaming—GLO
Rubber14.1Synthetic rubber—GLO

2.3.2. Electricity Fuel Chain

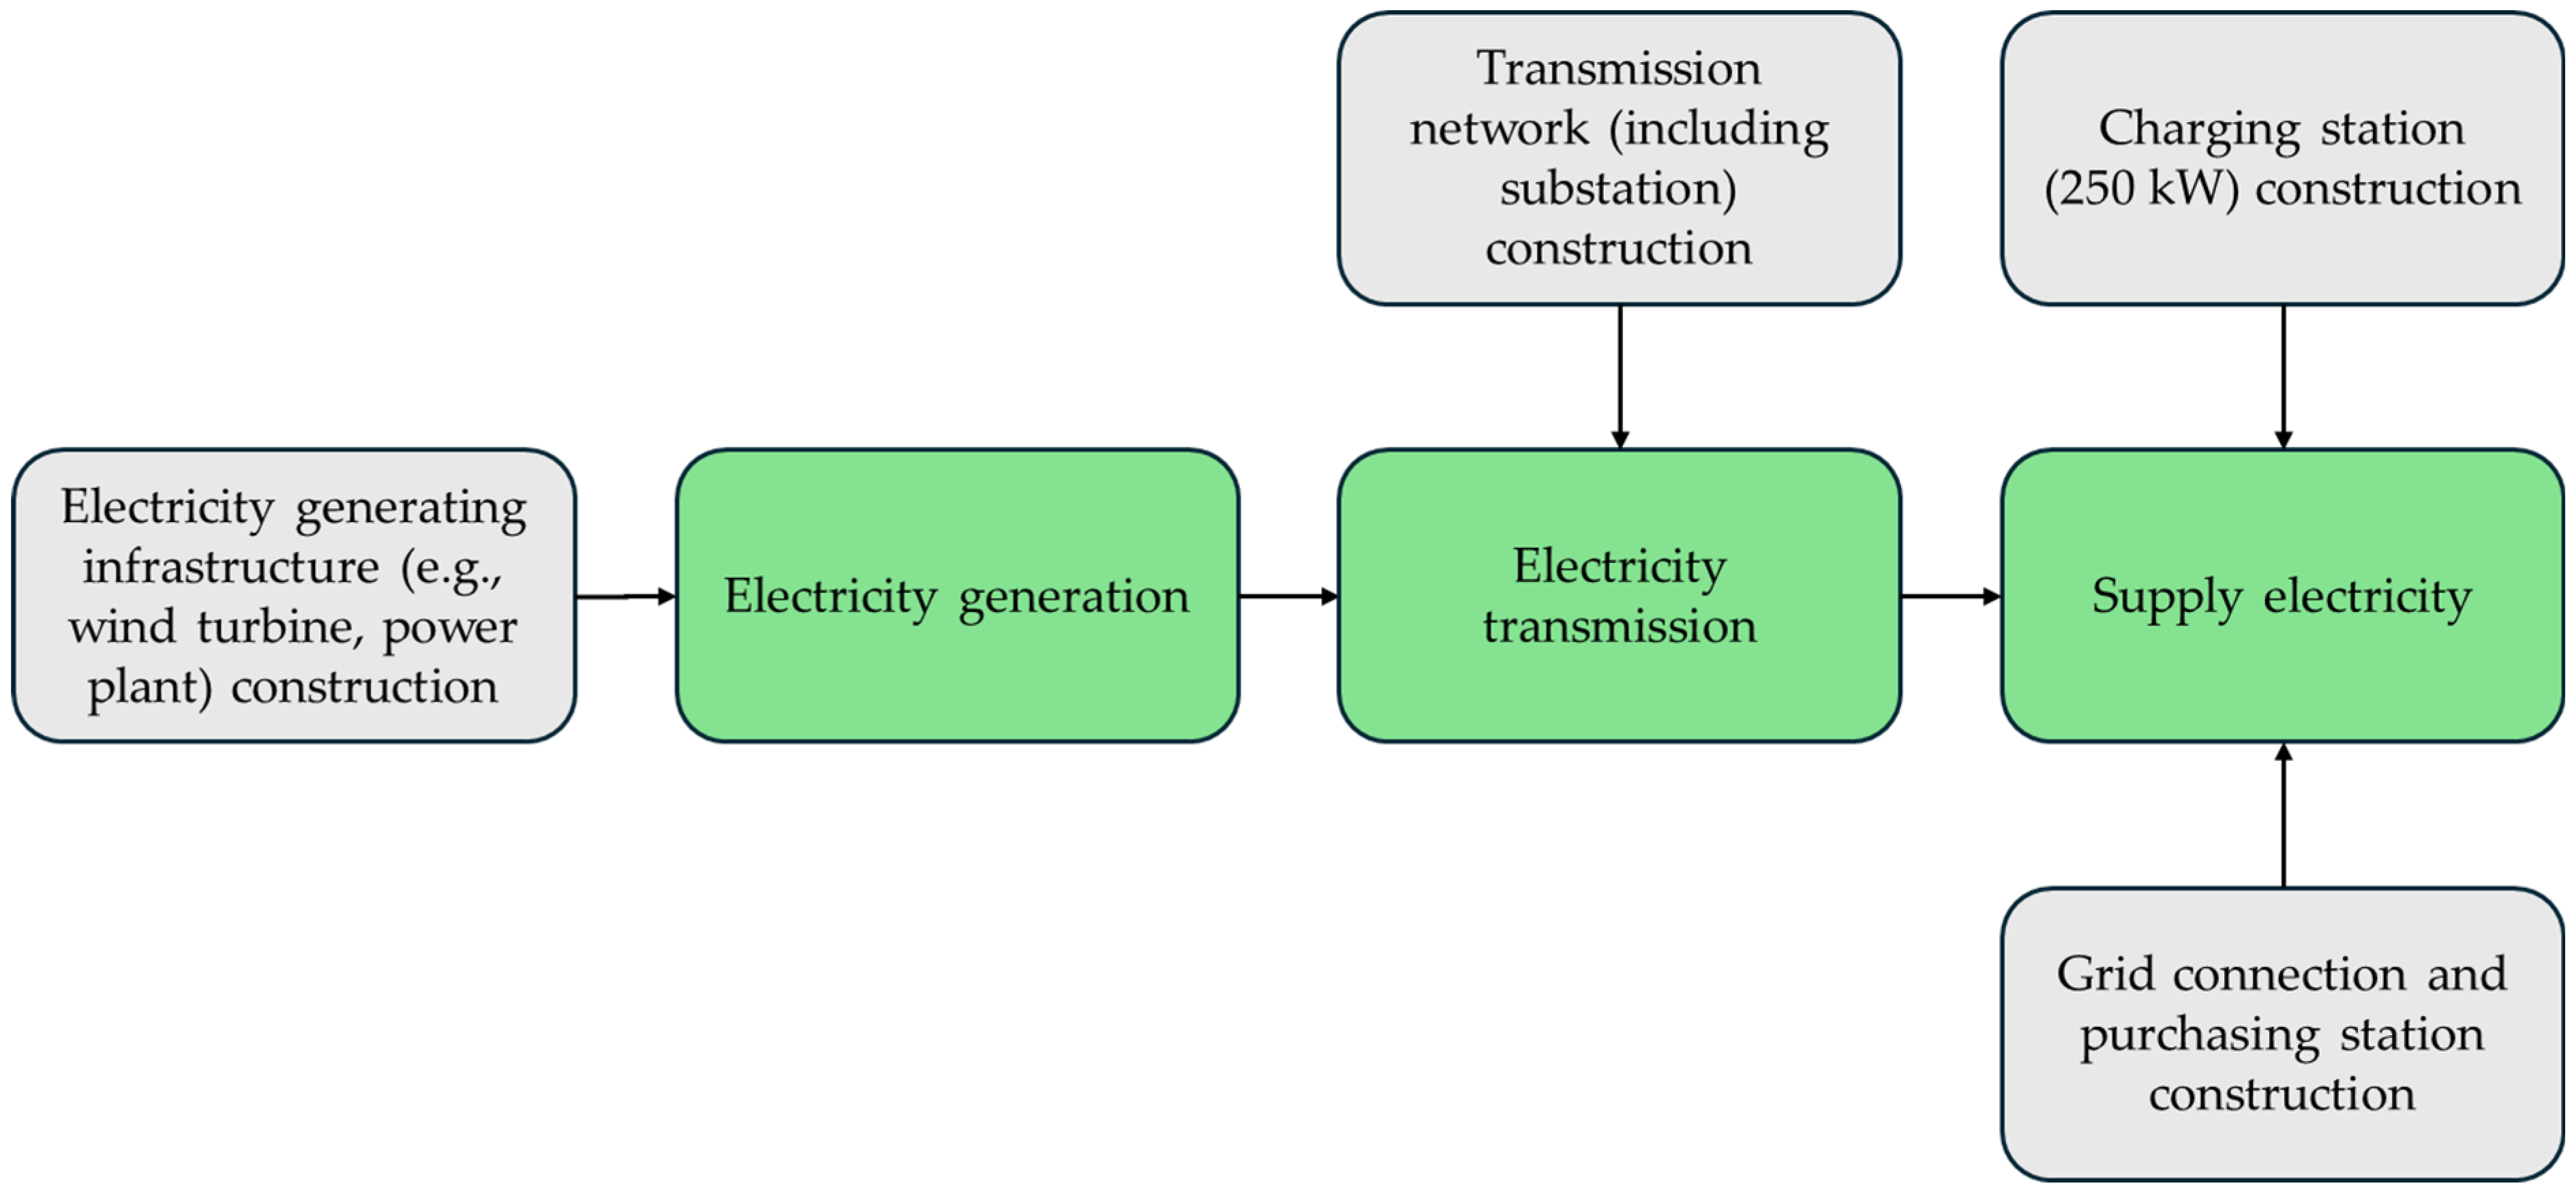
The electricity fuel chain in Figure 3 represents the system components that are needed for electricity generation, transmission and supply. The electricity mix in the Netherlands for 2024 (Table 4) was derived from data provided by the Central Agency for Statistics as the most recent data [51]. For BEV operation, electricity consumption was modeled using the Dutch grid mix instead of assuming 100% renewable electricity, as is required for the green hydrogen fuel chain. This distinction was made because, unlike green hydrogen, which must comply with RFNBO requirements under the RED III directive, there are currently no equivalent regulatory obligations governing the electricity source for BEVs. To enable a consistent comparison with green hydrogen, an additional BEV scenario based on 100% renewable electricity was included in the analysis. This scenario assumes direct use of renewable electricity and does not include additional electricity storage to supply power during periods when insufficient renewable generation is directly available.
The electricity transmission system includes both high- and medium-voltage infrastructure components. For the charging efficiency on fast charging at 250 kW for the BEV truck, a conversion efficiency of 85% was assumed [58]. Material requirements for electricity supply at purchasing stations and charging stations were also included. To account for the longer recharging time of BEVs compared to hydrogen- and diesel-fueled trucks (Table 1), it was included in the LCI that 10 times more charging stations are needed. The complete LCI of the electricity fuel chain is provided in the Supplementary Material Table S5.

2.3.3. Diesel Fuel Chain

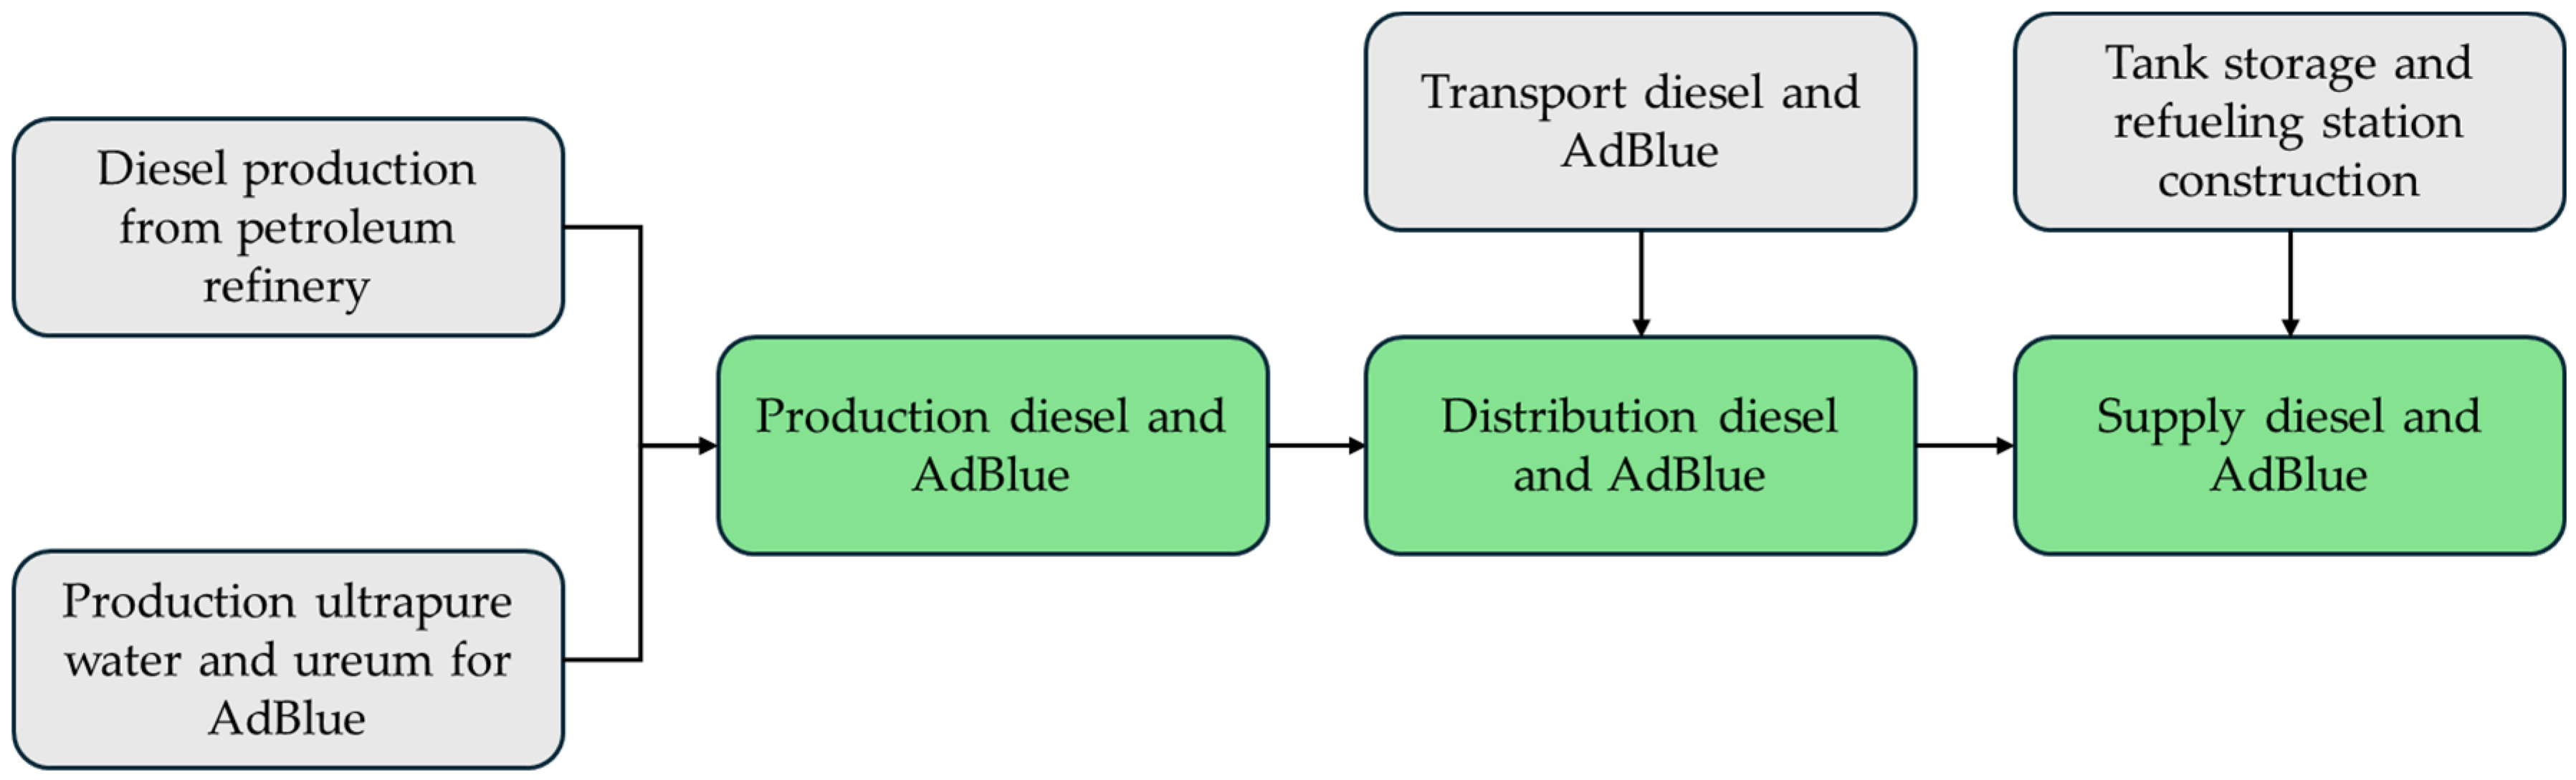
For the 2025 situation, the diesel fuel chain was based on the production, distribution, and supply of low-sulfur diesel as represented in an existing process from the Ecoinvent database [59]. This dataset covers the full fuel chain, including crude oil extraction, transport to the refinery, refinery operations, and the associated energy use and infrastructure requirements. It also includes the distribution of diesel to refueling stations and the infrastructure of the stations themselves (Figure 4).
Because diesel vehicles in the EU require AdBlue, the production, distribution, and supply of AdBlue were also included. In this study, the AdBlue inventory accounts only for the energy demand, material inputs, and necessary infrastructure to produce the urea and water solution. It does not represent the complete life cycle of AdBlue. The full life cycle inventory (LCI) of the diesel fuel chain is provided in the Supplementary Material Table S6.

2.3.4. Fuel Consumption and Emissions

The fuel consumption values (Table 2) for the different transport alternatives were derived from publicly available specifications provided by truck manufacturers. For FCEV trucks, only water vapor emissions were included. For HICEV trucks, NOx emissions were included in addition to water vapor [60]. Other combustion-related emissions were not considered further because CO2, CO and NH3 were observed only at very low or near-detection-limit concentrations, and no emission factors normalized to kWh of burned hydrogen were found that could be applied [61]. BEV trucks were assumed to have no direct emissions in the use phase besides tire and brake wear. Emissions from diesel use correspond to the EURO 6 regulations. All emission factor details are provided in the Supplementary Material Table S7.

2.4. Life Cycle Inventory (LCI): Road Infrastructure

The environmental impacts associated with road construction and maintenance were based on Ecoinvent processes corresponding to heavy-duty freight transport [40]. The contribution of road construction depends on the GVW. For road maintenance, the same impact factor was used for all truck alternatives. The environmental impact of road wear depends on the GVW [40]. Because the BEV configuration has a higher vehicle weight than the other transport options, a higher impact factor was assigned to its road-wear emissions. All impact factors related to road infrastructure are provided in the Supplementary Material Table S7.

3. Results on Life Cycle Impact Assessment (LCIA)

3.1. Environmental Impacts in 2025

The LCIA covers the ten impact categories and reflects contributions from all three life cycle modules included in the system boundary: truck cycle, fuel chain and road infrastructure. Focus is placed on four impact categories that are especially relevant for the LNH project: global warming, ozone formation (human health), particulate matter, and water consumption (WC). The results of the remaining impact categories, terrestrial ecotoxicity (TET), freshwater ecotoxicity (FET), land use (LU), marine eutrophication (ME), mineral resource scarcity (MRS) and fossil resource scarcity (FRS) are provided in Figures S1–S6 and Table S8.
The emphasis on the first three impact categories is motivated by their direct link to tailpipe emissions (CO2, PM, and NOx) that were identified as critical environmental indicators for evaluating the transition from fossil to low- and zero-tailpipe emission transport alternatives within the project. These indicators not only represent major contributors to climate change and human health but also serve as widely recognized benchmarks in regulatory frameworks and industry reporting.
In addition, WC is included as a priority impact category to capture the environmental tradeoffs associated with transitioning from fossil energy carriers to renewable energy-based transport alternatives [60]. This method measures net freshwater consumption, meaning only water removed from a local water source is counted. A distinction was made between upstream water use (e.g., cooling, cleaning) and direct WC, such as the ultrapure water required for hydrogen production.

3.1.1. Global Warming (GW)

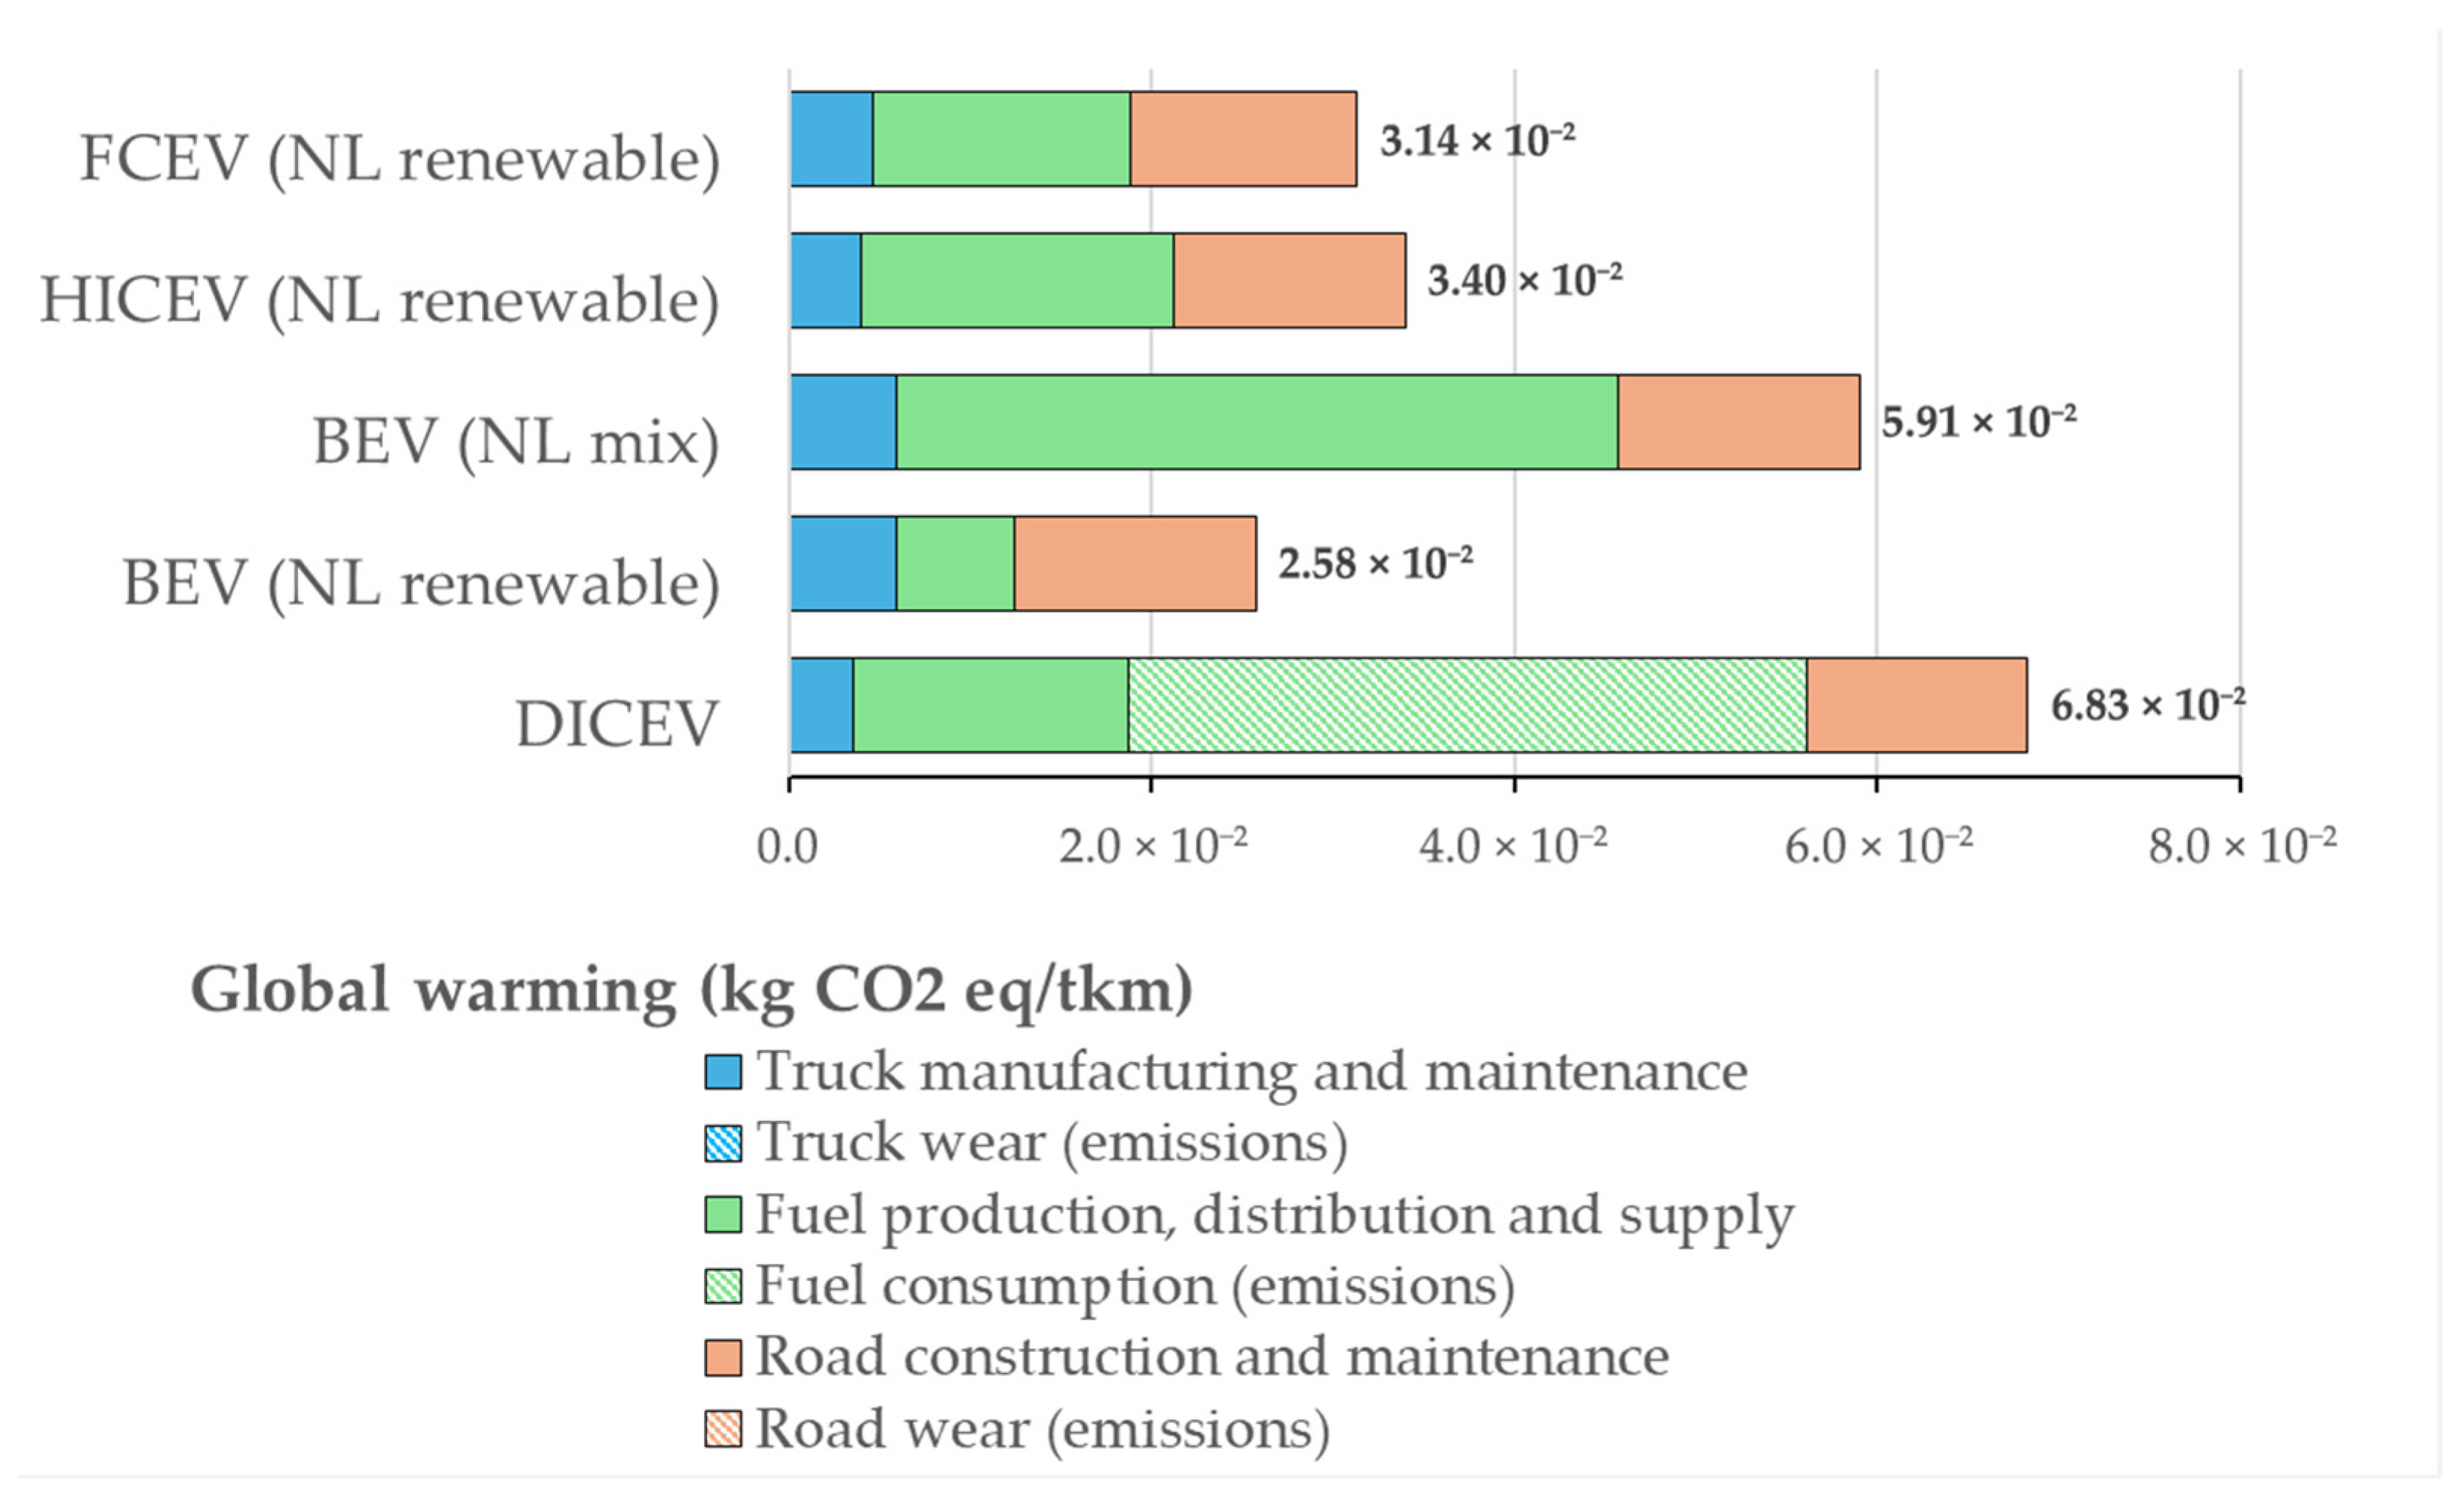
FCEV exhibits the lowest global warming (GW) impact, followed by HICEV, BEV and DICEV (Figure 5). These differences are primarily attributable to the fuel chain, which is dominated by GHG emissions from fuel production and the use of fuel. For DICEVs, more than half of the total GW impact originates from GHG emissions during diesel combustion.
For BEV, GHG emissions in the use phase (fuel consumption) are absent. However, these emissions are shifted upstream, especially in the fuel cycle, where electricity is generated. In the base scenario, the Dutch grid mix is considered, which shows a reduction of 14% compared to DICEV. When BEVs are charged with a similar renewable electricity mix as used for generating hydrogen, a reduction in the GW impact of 62% compared to DICEV can be observed.
The contribution of the truck cycle is similar across all alternatives. The contribution of the truck cycle for BEV is about double the impact of the truck cycle on the DICEV alternative. This higher contribution is the result of the battery (materials) required in a BEV. Whilst this increase in the GW impact is noticeable, it is not sufficient to make DICEVs the preferred choice over BEVs, as emissions from diesel consumption are much higher.
FCEV and HICEV transport alternatives have comparable GW impact distribution. The most influential factor is the fuel cycle (45–50%), with the energy required to produce hydrogen accounting for the largest share. This is lower for FCEV due to higher fuel efficiency. In absolute terms, the green hydrogen fuel chain is comparable to producing diesel in the DICEV alternative. In the base case, hydrogen is produced by using a renewable electricity mix. When this is replaced by the more carbon-intensive Dutch electricity mix, we see that the GW impact of both hydrogen alternatives is higher than that of BEV using the Dutch grid mix (see sensitivity analysis).
GW impacts associated with road construction and maintenance and wear are similar across the different transport options. Most road infrastructure-related GHG emissions stem from fossil fuel use during road construction, as well as emissions embedded in the life cycles of road materials such as bitumen and gravel used for asphalt production.

3.1.2. Ozone Formation, Human Health (OF-HH)

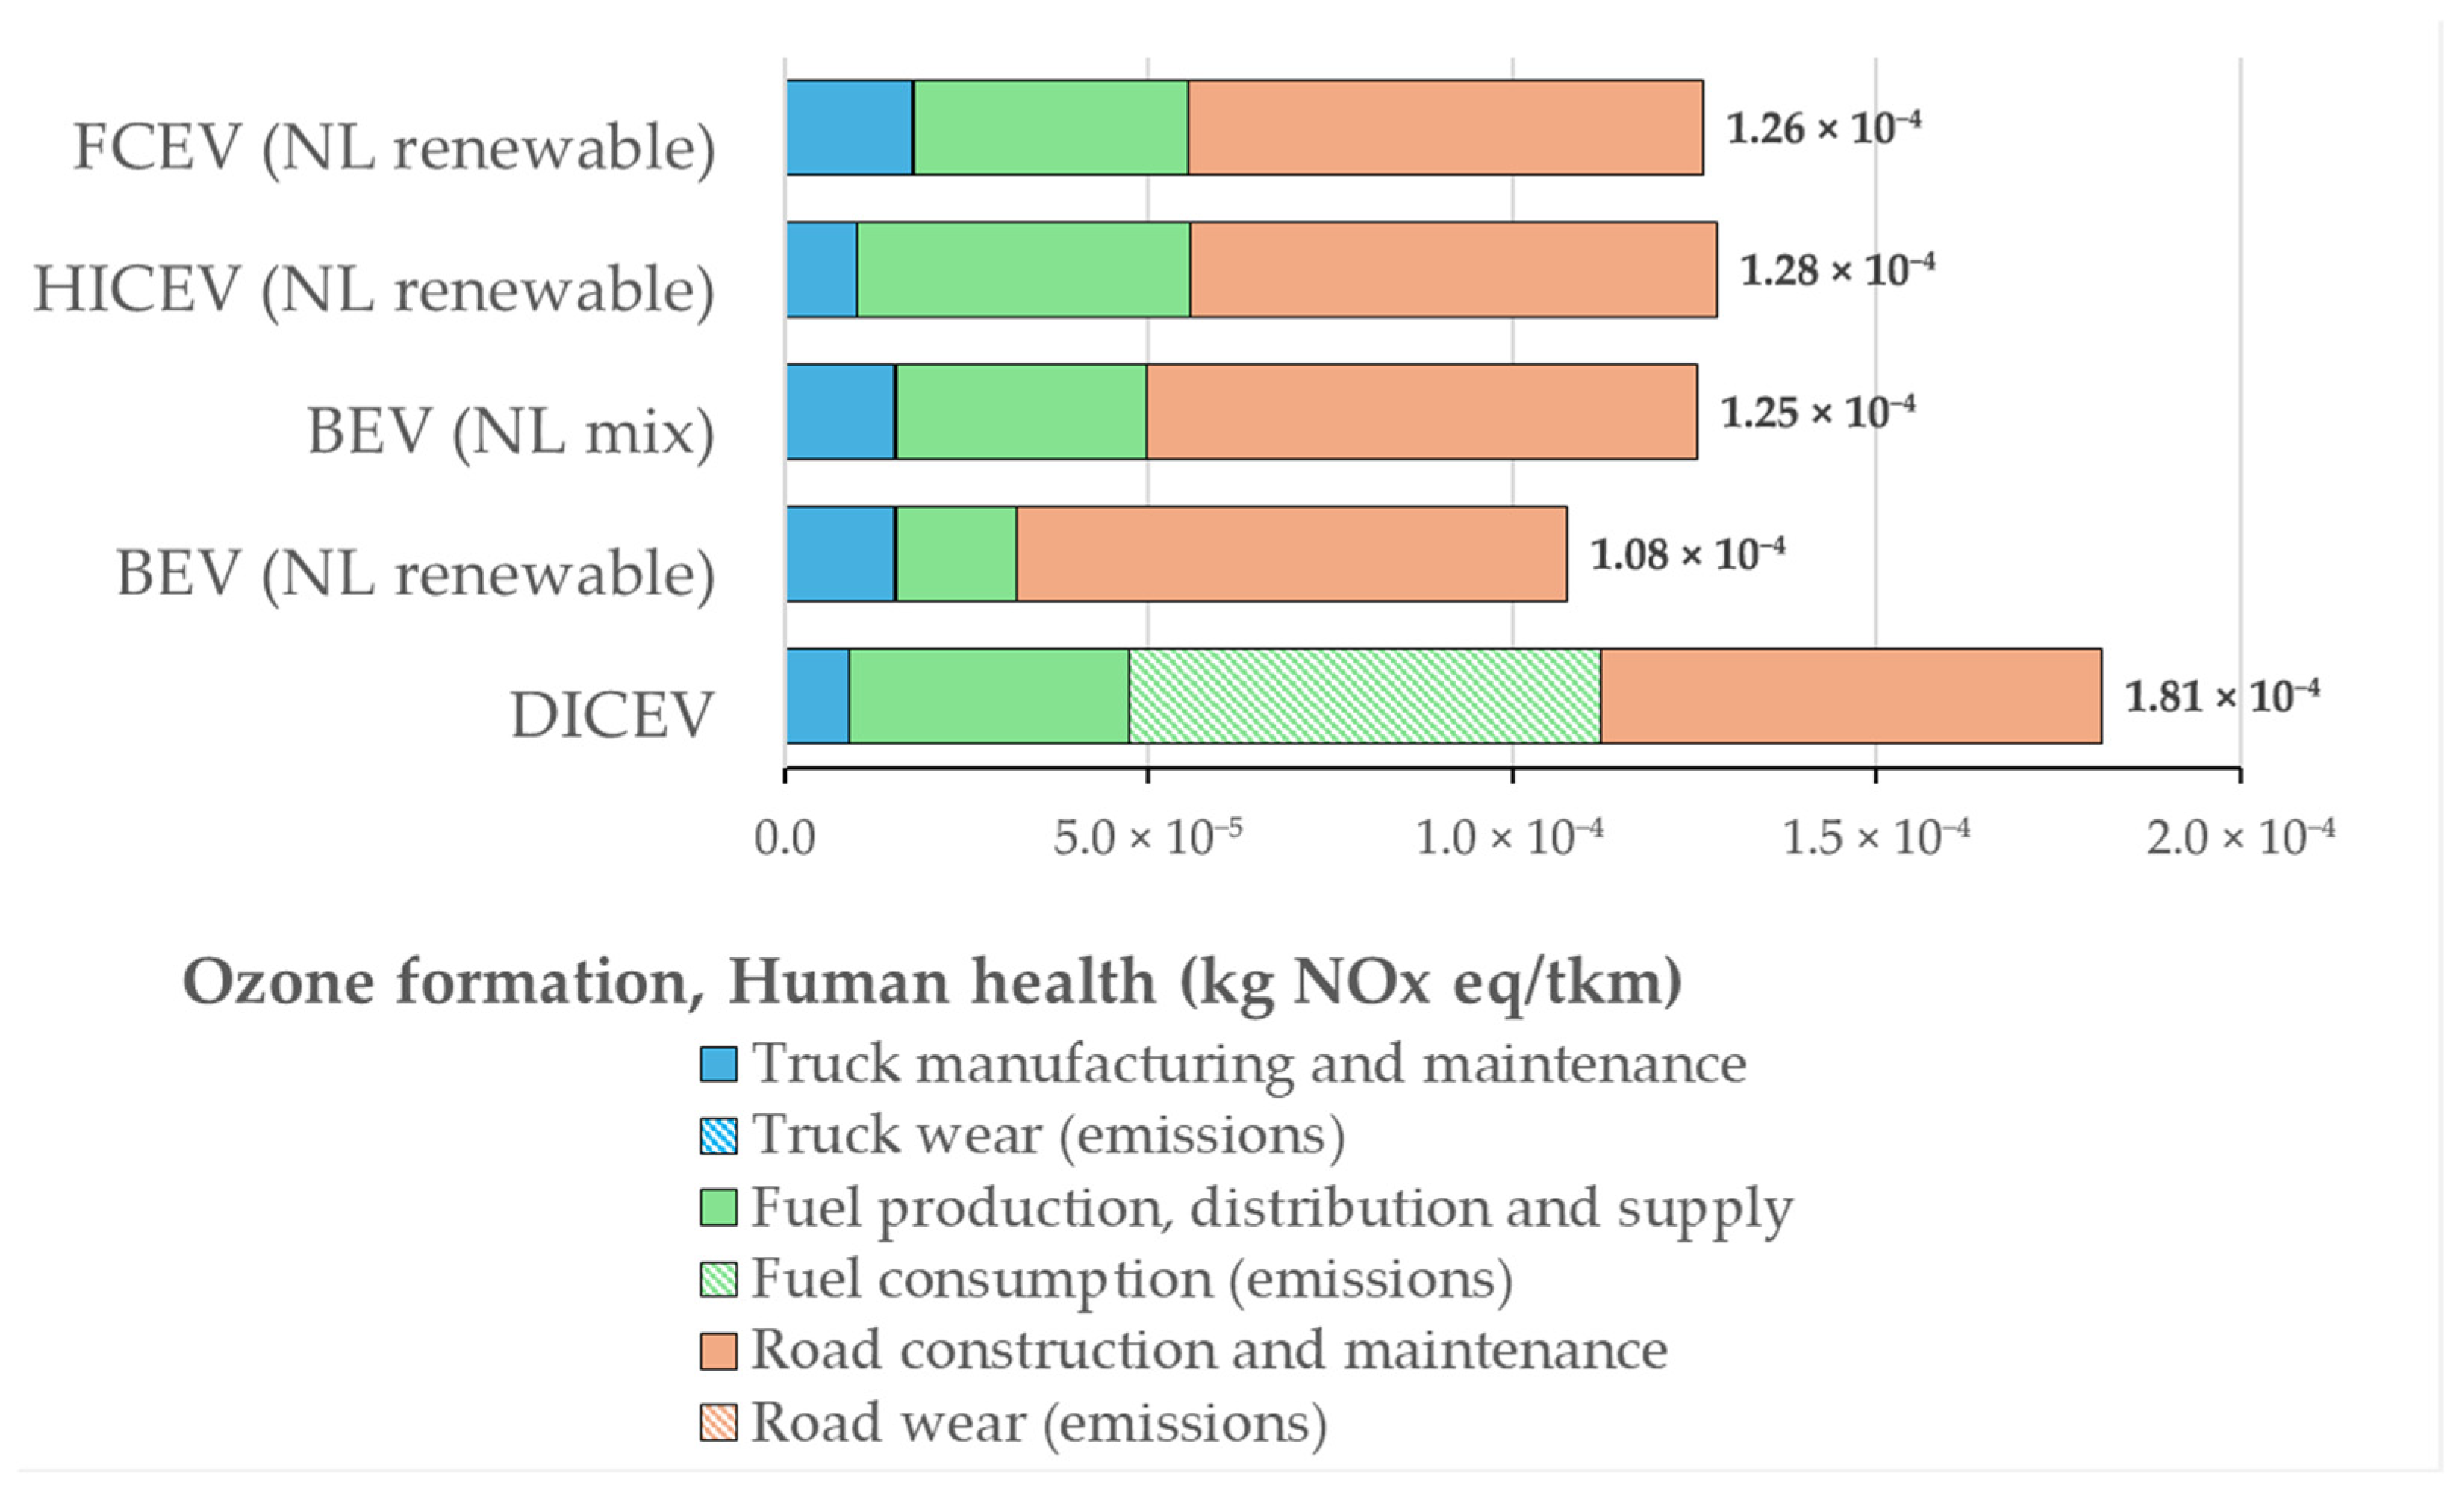
The ozone formation (OF-HH) impact for DICEV is about 30% higher than for BEV, HICEV and FCEV (Figure 6). This is primarily caused by NOx emissions from diesel combustion (fuel consumption) in the DICEV alternative. These specific emissions are absent for BEV and FCEV. In the case of HICEV, the effect of NOx emissions from hydrogen combustion is marginal.
The electricity fuel chain for BEVs is characterized by low NOx-equivalent emissions per kWh of electricity generated. However, the Dutch electricity mix contains a notable share of fossil-based generation, primarily from natural gas during power generation, which affects the OF-HH impact. Shifting towards a fully renewable electricity mix reduces the OF-HH impact of the electricity fuel chain by 52%.
Although hydrogen uses renewable energy, which per kWh has lower NOX eq emissions, the green hydrogen fuel chain inhibits energy losses of 18.6 kWh/kg H2. Hydrogen-fueled trucks also exhibit lower tank-to-wheel efficiencies (0.153–0.184 kWh/tkm) than BEVs (0.090 kWh/tkm), requiring more energy to deliver the same transport service. Additionally, the material requirements of PEM water electrolysis contribute to the upstream ozone-formation impact. In particular, the production of platinum used in PEMWE catalyst layers is associated with NOx-equivalent emissions due to energy-intensive mining and refining processes. These material-related emissions add to the overall OF-HH burden of green hydrogen production. As a result, even when hydrogen is produced from renewable electricity, the cumulative upstream impact of the fuel chain for FCEV (NL renewable) is 9% higher than BEV (NL mix) and 127% higher than BEV (NL renewable).
Road construction remains the dominant factor for OF-HH across all transport alternatives, accounting for at least 38% of the total OF-HH impact. Accounting for its higher GVW, the BEV imposes 10% higher road infrastructure impacts than the DICEV. The main contributors are emissions of NOx and non-methane volatile organic compounds (NMVOC) from fossil fuel combustion during construction activities and from the production and transport of asphalt and other road materials. No direct emissions from road wear affect the OF-HH impact.
The truck cycle contributes the least to the OF-HH category, although clear differences exist between alternatives. Trucks with more material-intensive systems, such as batteries in BEVs and fuel cells in FCEVs, result in higher ozone-forming emissions during manufacturing due to the energy-intensive production of metals and chemical components.

3.1.3. Fine Particulate Matter Formation (PMF)

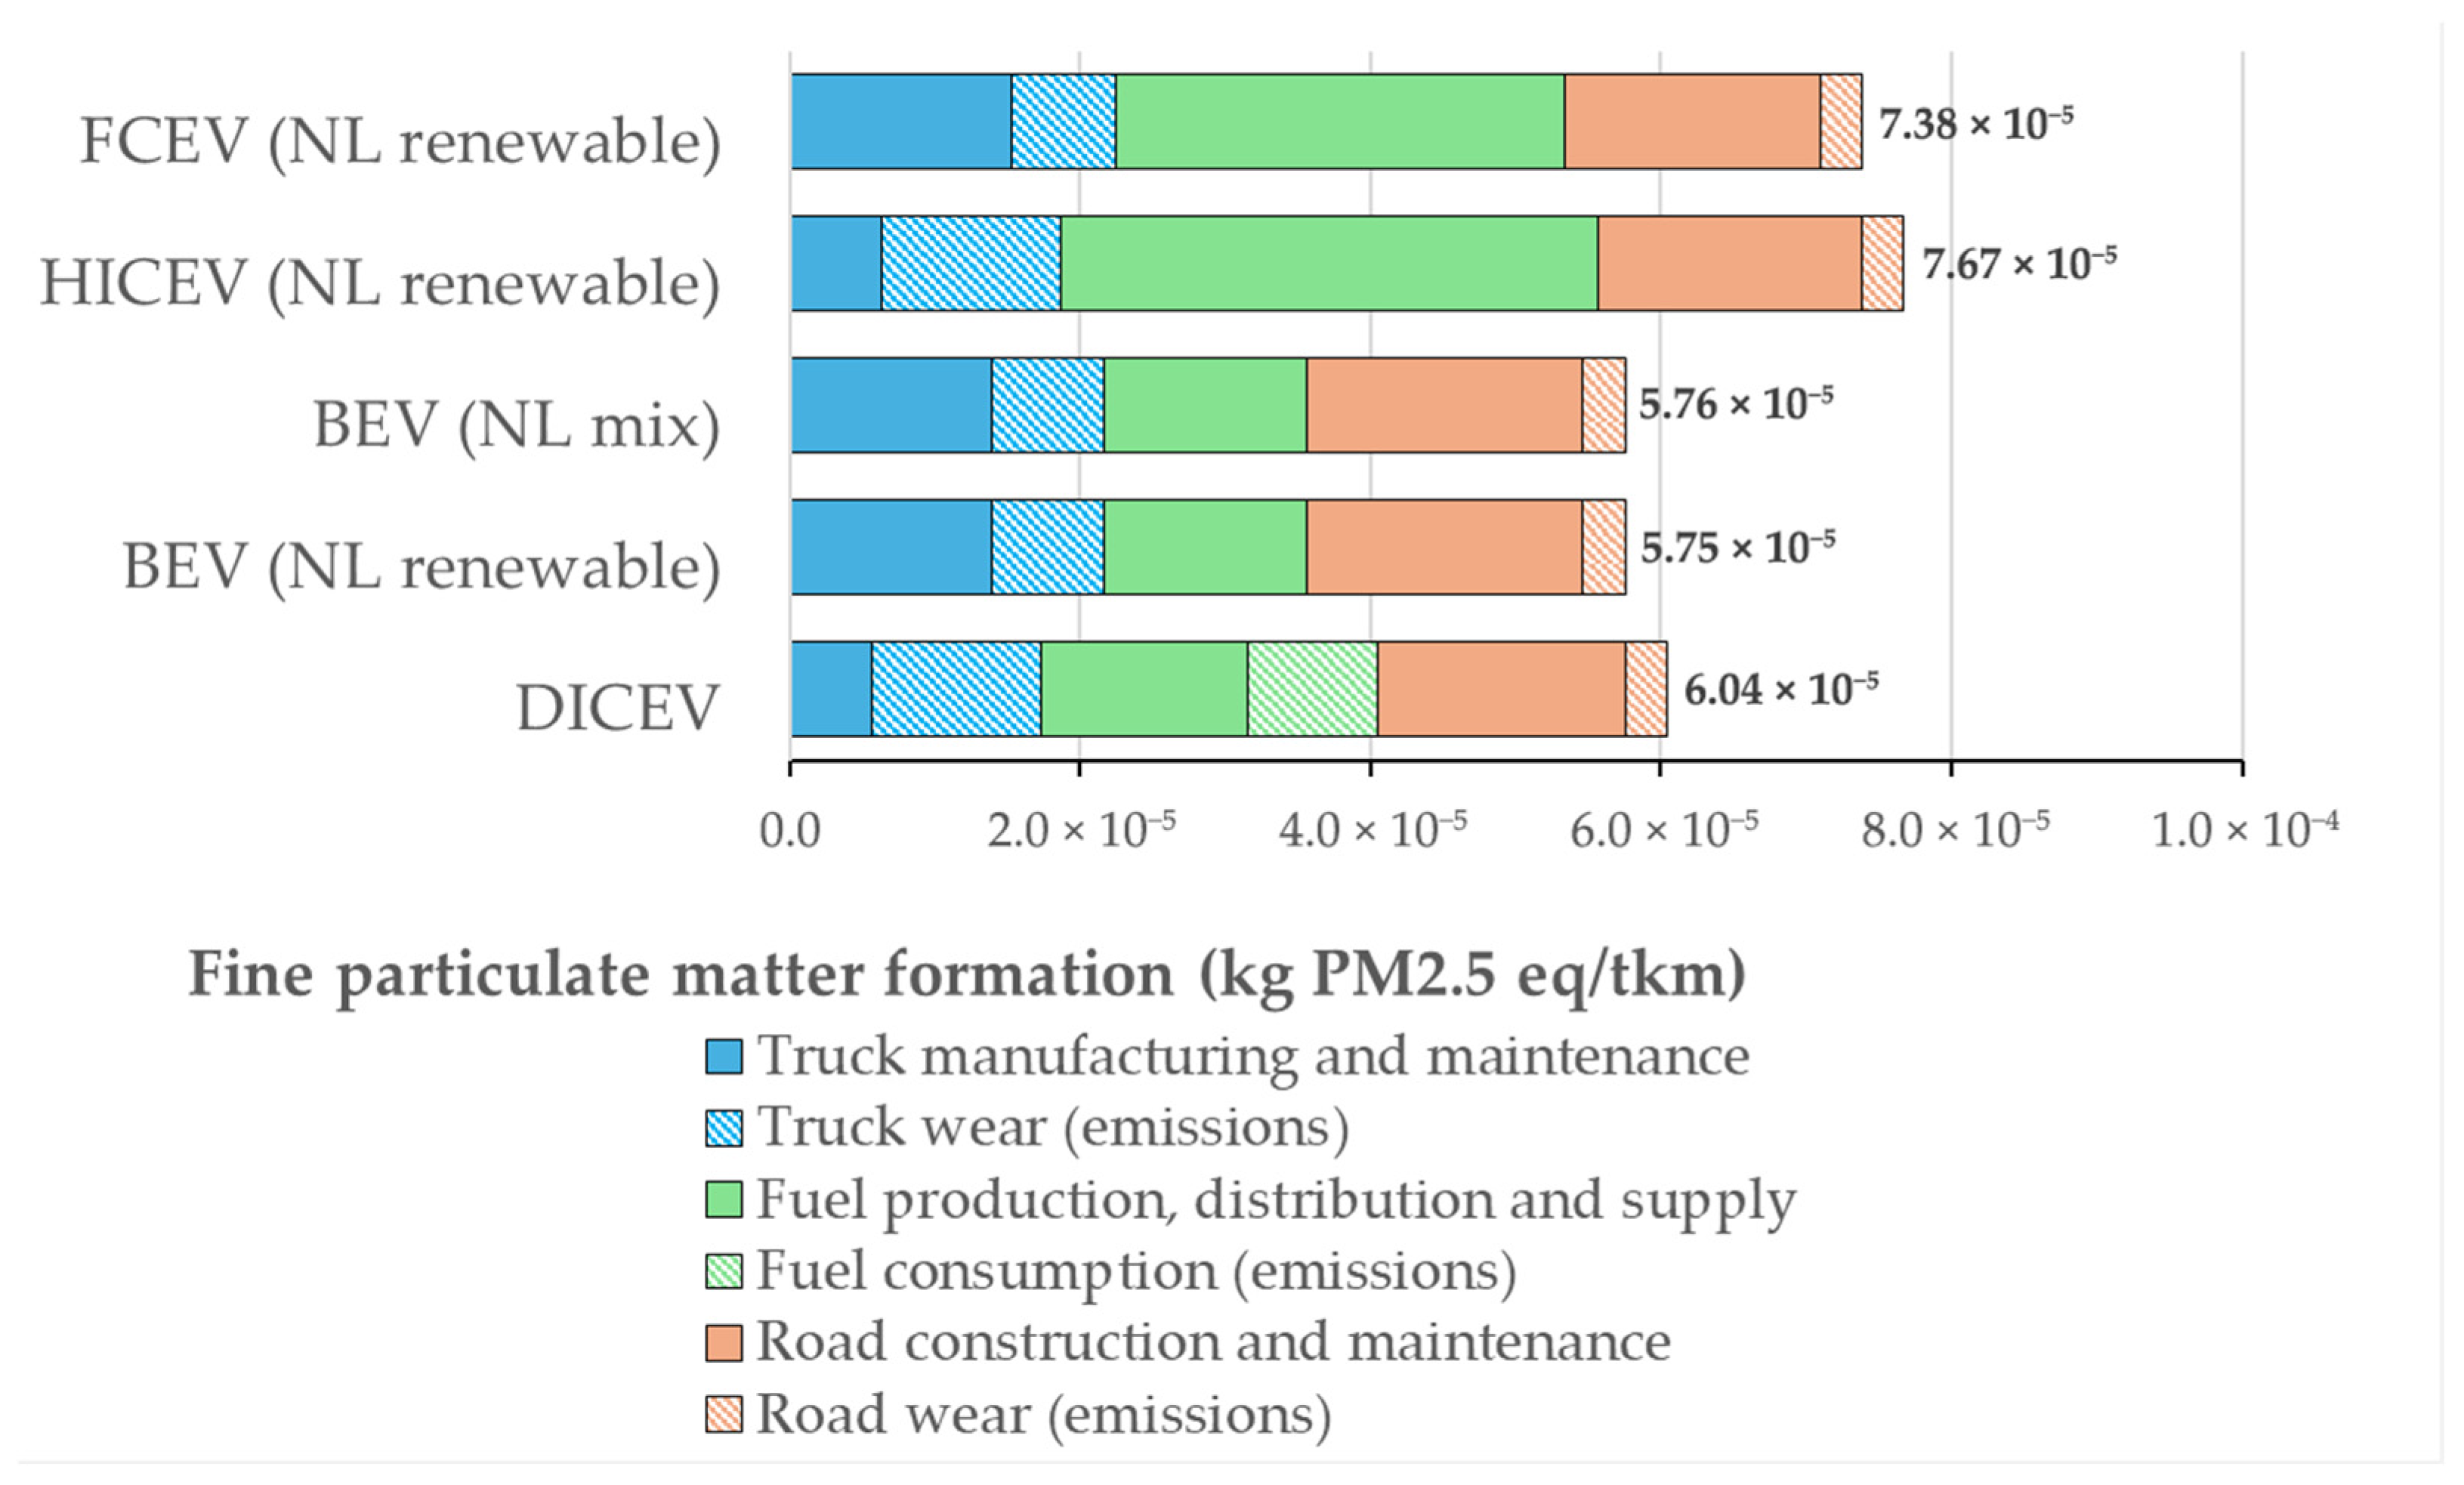
BEV has the lowest fine particulate matter formation (PMF) impact (Figure 7), followed by DICEV, while the highest PMF is observed for FCEV and HICEV. Differences between alternatives arise primarily in the fuel chain. Renewable electricity sources used for BEV charging, particularly wind, exhibit low PMF contributions. Solar power has higher upstream PMF impacts due to the energy-intensive manufacturing of PV panels and ground modules. This results in almost identical PMF impacts for BEV based on only renewable electricity compared with the Dutch electricity mix that includes fossil fuels for electricity generation.
The highest PMF values for hydrogen alternatives are counterintuitive, as hydrogen-based transport is often presented as a zero-emission alternative. While tailpipe PM emissions are eliminated, upstream emissions from hydrogen production, distribution, and supply offset this benefit, accounting for almost half of the total PMF impact. PM emissions in the green hydrogen fuel cycle are approximately three times higher than those of diesel or electricity, primarily due to the higher energy demand and lower system efficiency of hydrogen pathways. This comparison does not account for the fact that FCEV systems require clean oxygen and therefore incorporate air-purification components, which remove particulate matter during operation [17]. Moreover, PEMWE systems introduce additional PMF impacts from material cycles. The production of platinum, used as a catalyst in PEMWE stacks, is particularly energy-intensive and associated with notable PMF emissions from mining, ore processing, and refining.
Across all alternatives, non-exhaust emissions from road, tire, and brake wear dominate PMF impacts, especially for combustion-engine trucks (HICEV and DICEV). Material-intensive options such as BEV and FCEV show higher truck cycle PMF impact from battery and fuel-cell manufacturing. However, regenerative braking in BEVs and FCEVs reduces brake wear, partially offsetting these material-related impacts compared to DICEV and HICEV.
For road infrastructure, PMF emissions stem primarily from fossil fuel use during construction activities and from the life cycles of asphalt and other road materials. Variations between transport alternatives remain small, which are driven by truck weight differences.

3.1.4. Water Consumption (WC)

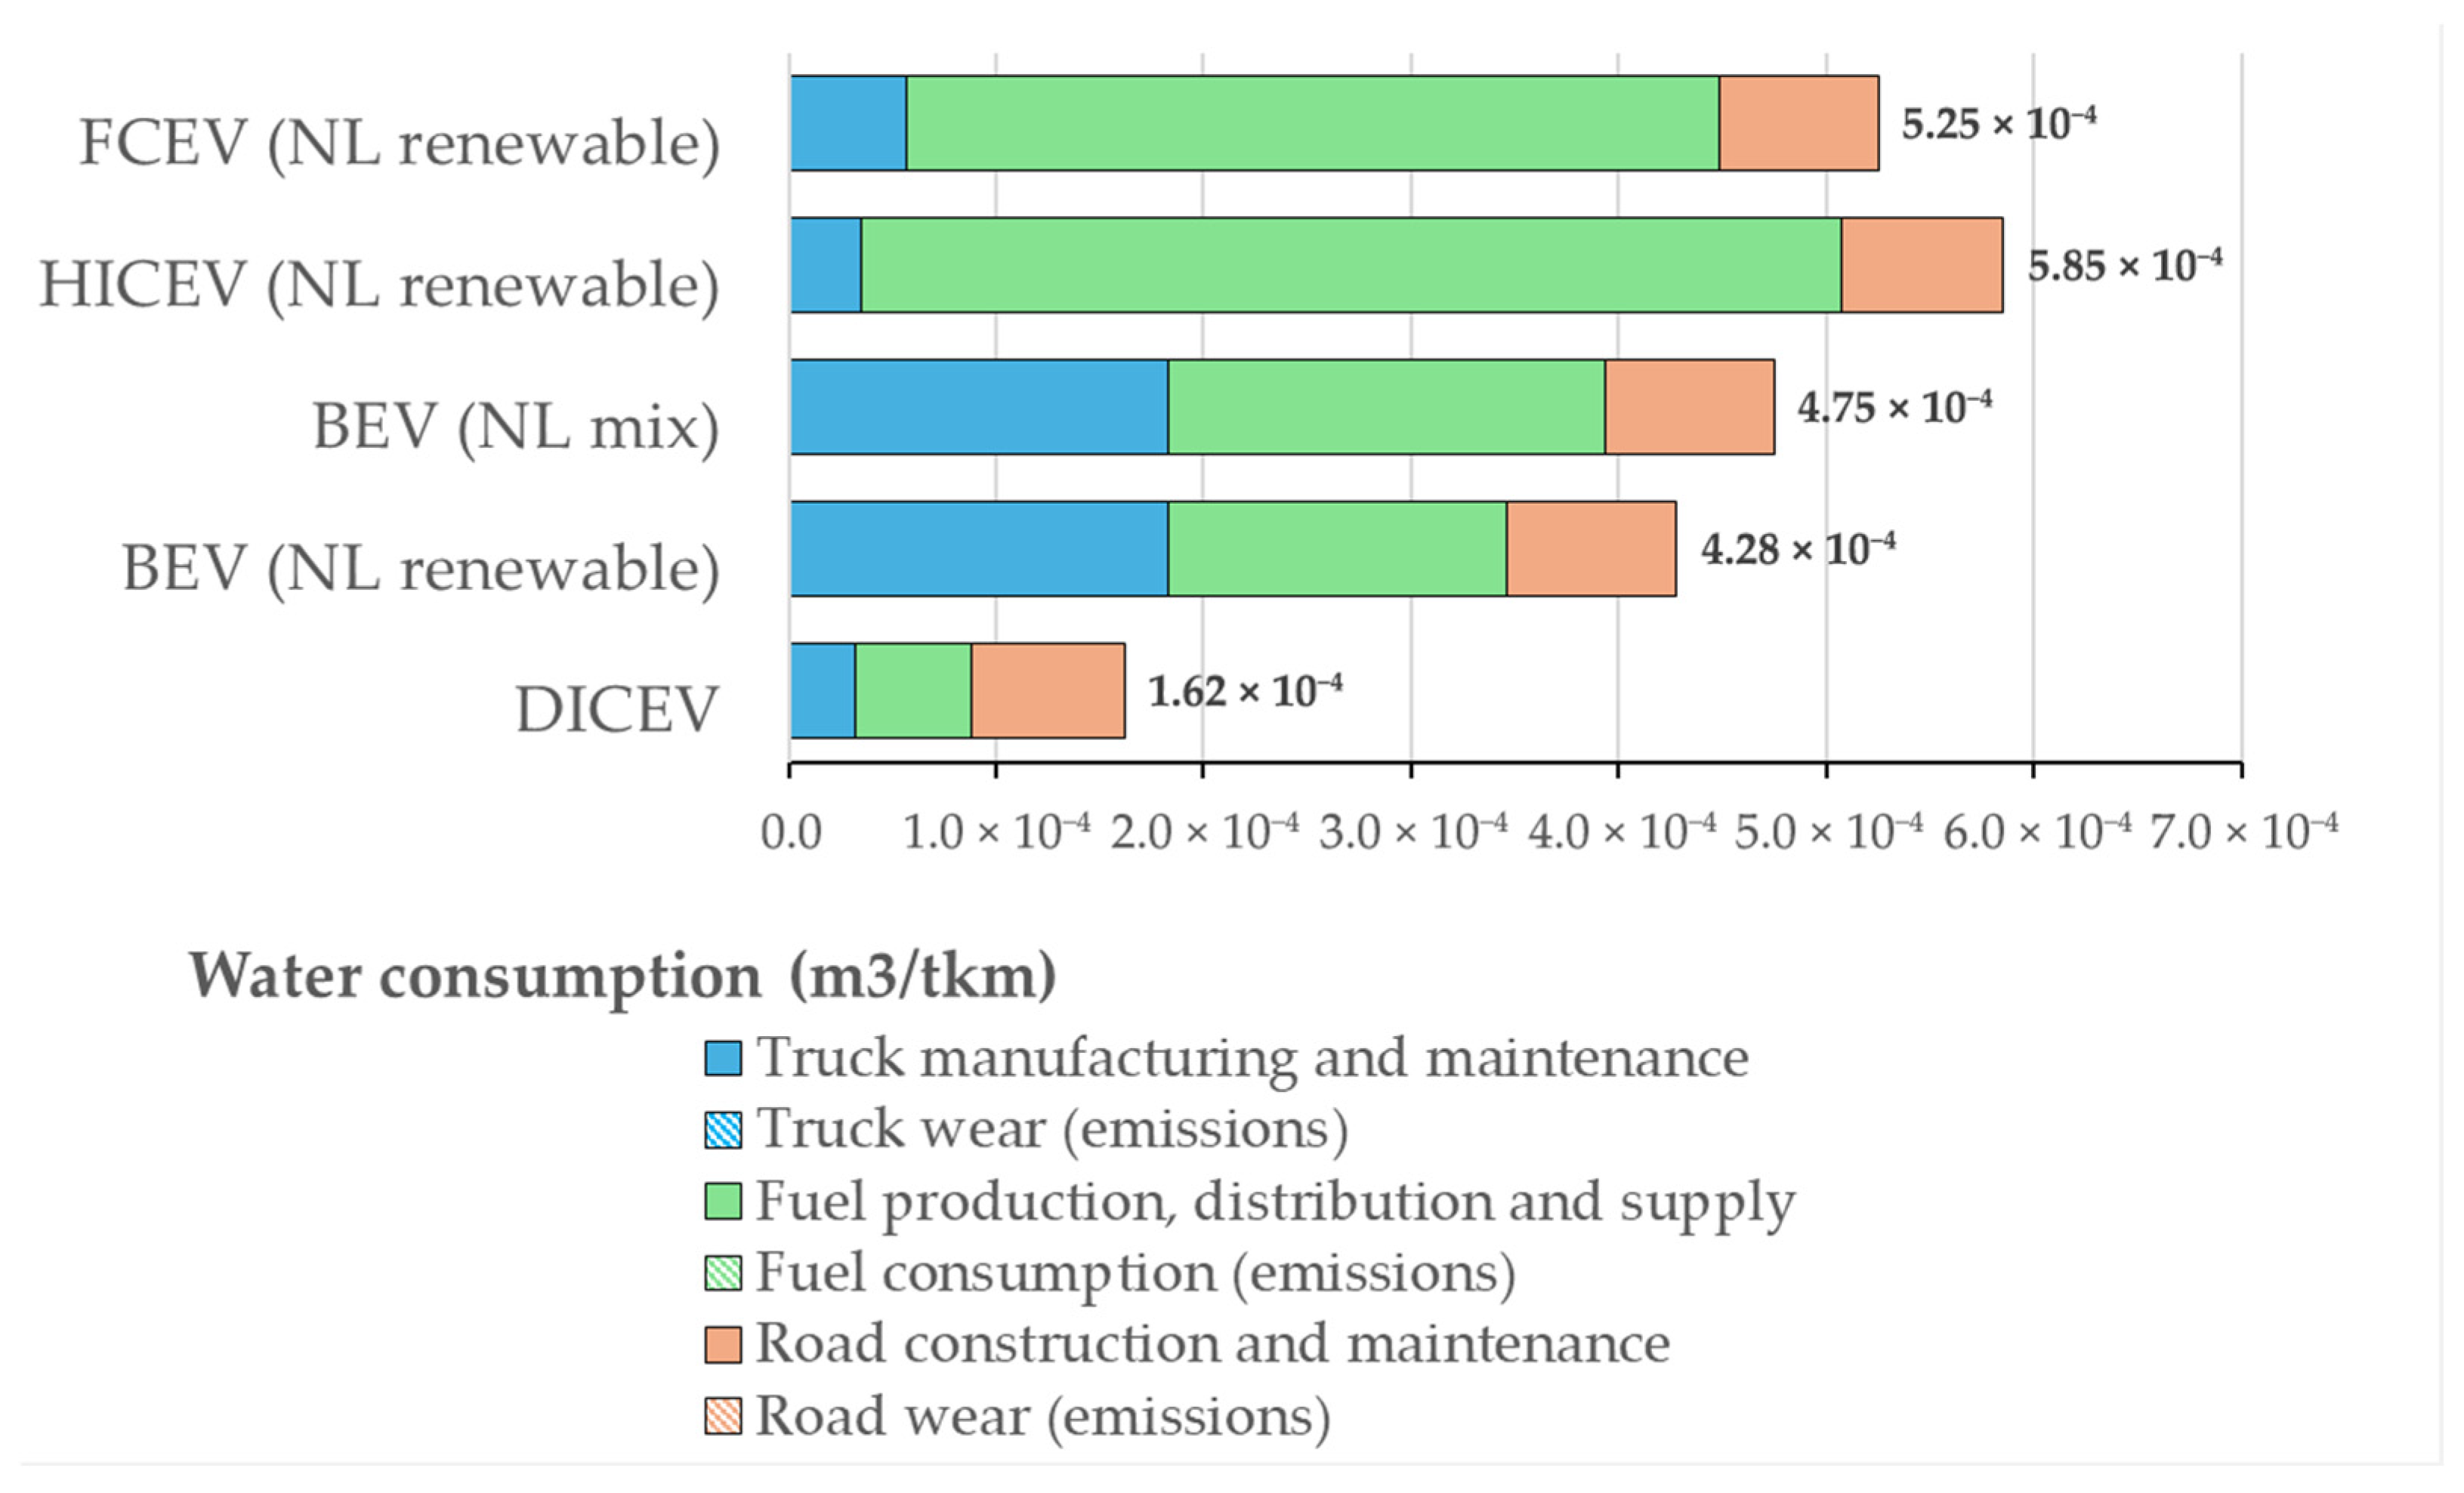
The outcomes in Figure 8 show that a shift from DICEV to BEV, FCEV and HICEV increases water consumption (WC) by a factor of 3 to 4. For BEV, this increase compared to DICEV can be attributed to the water demand required in mining battery materials (as part of truck manufacturing) and in the selected electricity mix. Using the Dutch grid mix shows a higher WC compared to the renewable mix. The LCIA revealed that this is due to water requirements for electricity generation from natural gas-based combined heat and power (CHP) plants. CHP facilities require water for steam generation and cooling, increasing the WC factor for grid electricity.
WC is defined as the net amount of freshwater withdrawn from the environment that is no longer available for other human or ecological uses. This impact category only focuses on deprivation: once water is consumed within a process, its impact is characterized based on the reduced availability of clean water for competing users. Consequently, replenishment mechanisms (e.g., water reuse) are not included in the calculation.
Within the fuel chain, diesel exhibits the lowest WC impact. The extraction, refining, and distribution of diesel require water for cooling and processing, but these demands are modest compared to the water intensity of electricity and green hydrogen pathways.
Upstream burdens from electricity generation dominate the water consumption (WC) impact of the green hydrogen fuel chain at 90%, while ultrapure water demand contributes only 10%. Electricity from renewable sources for the green hydrogen fuel chain shows higher WC impacts. Generating electricity from solar energy is the most water-intensive form of renewable energy because of the production of solar panels. The production of silicon wafers and aluminum frames involves high-temperature processes and chemical treatments that require high volumes of water. These upstream demands dominate the WC impact of solar electricity, making it a major contributor in both BEV charging and green hydrogen production. Wind power, in comparison, has a very low WC during manufacturing, resulting in a much lower WC footprint (see Table 5). The material cycle associated with PEMWE systems contributes marginally to WC impacts.
In the vehicle cycle, WC impacts remain low for all alternatives except BEV and FCEV. For BEVs, the life cycle of battery materials—particularly lithium, cobalt, and nickel—requires water-intensive mining and refining processes, making battery production an important contributor to WC. Similarly, FCEV manufacturing shows elevated WC impacts due to the combined demands of battery systems and fuel-cell stacks, both of which rely on materials with water-intensive supply chains. HICEV and DICEV rely primarily on conventional powertrain components with lower water demands.
Road construction and maintenance contribute similarly across all alternatives, with small variations driven by differences in GVW. WC in this module is dominated by the production of materials such as gravel, concrete, and asphalt, as well as water used in construction processes.
Overall, the WC results show that shifting to renewable energy carriers, particularly those with substantial solar PV inputs, can increase water demand relative to conventional diesel.

3.2. Impact Analysis on Electricity from Solar Power and Wind Power

Across the four main impact categories, the LCIA results in Table 5 from the Ecoinvent database indicate that the environmental impacts of electricity from solar PV [61] in the Netherlands are higher than both offshore [62] and onshore wind power [63]. Similar patterns are reported from other LCA studies in Germany [33], Saudi Arabia [64], China [32], and the United States [65]. Reducing the environmental footprint of green hydrogen production can therefore be achieved by increasing reliance on wind power or by improving upstream solar-PV manufacturing processes.
The global warming impact of solar power stems primarily from the life cycle stages, raw material extraction and manufacturing of PV cells, particularly solar-grade silicon. Most emissions originate from fossil-based energy inputs during extraction and manufacturing. The literature indicates a wide range of impacts (0.001–0.218 kg CO2 eq/kWh), depending on manufacturing pathway assumptions [66]. Similar patterns are visible in OF-HH and PMF due to NOx and PM emissions associated with fossil energy use. Decarbonizing supply chains, optimizing system capacity, extending panel lifetime, and adopting less energy-intensive materials can further reduce CO2, NOx and PM emissions of PV electricity. WC is dominated by silicon cell production, which involves water-intensive processes. By contrast, the operational phase (e.g., panel cleaning) and end-of-life processing contribute marginally, a trend also reflected in comparable literature [67,68].
In contrast, both offshore and onshore wind power exhibit lower impacts across the same LCIA categories. Most environmental burdens are concentrated in wind turbine manufacturing, particularly steel, concrete, and composite materials, while operational impacts remain minimal due to the absence of fuel combustion and low maintenance needs. WC for wind power is also low, as turbine production involves less water-intensive processing than silicon-based PV manufacturing.

3.3. Sensitivity Analysis on Green Hydrogen-Based Transport

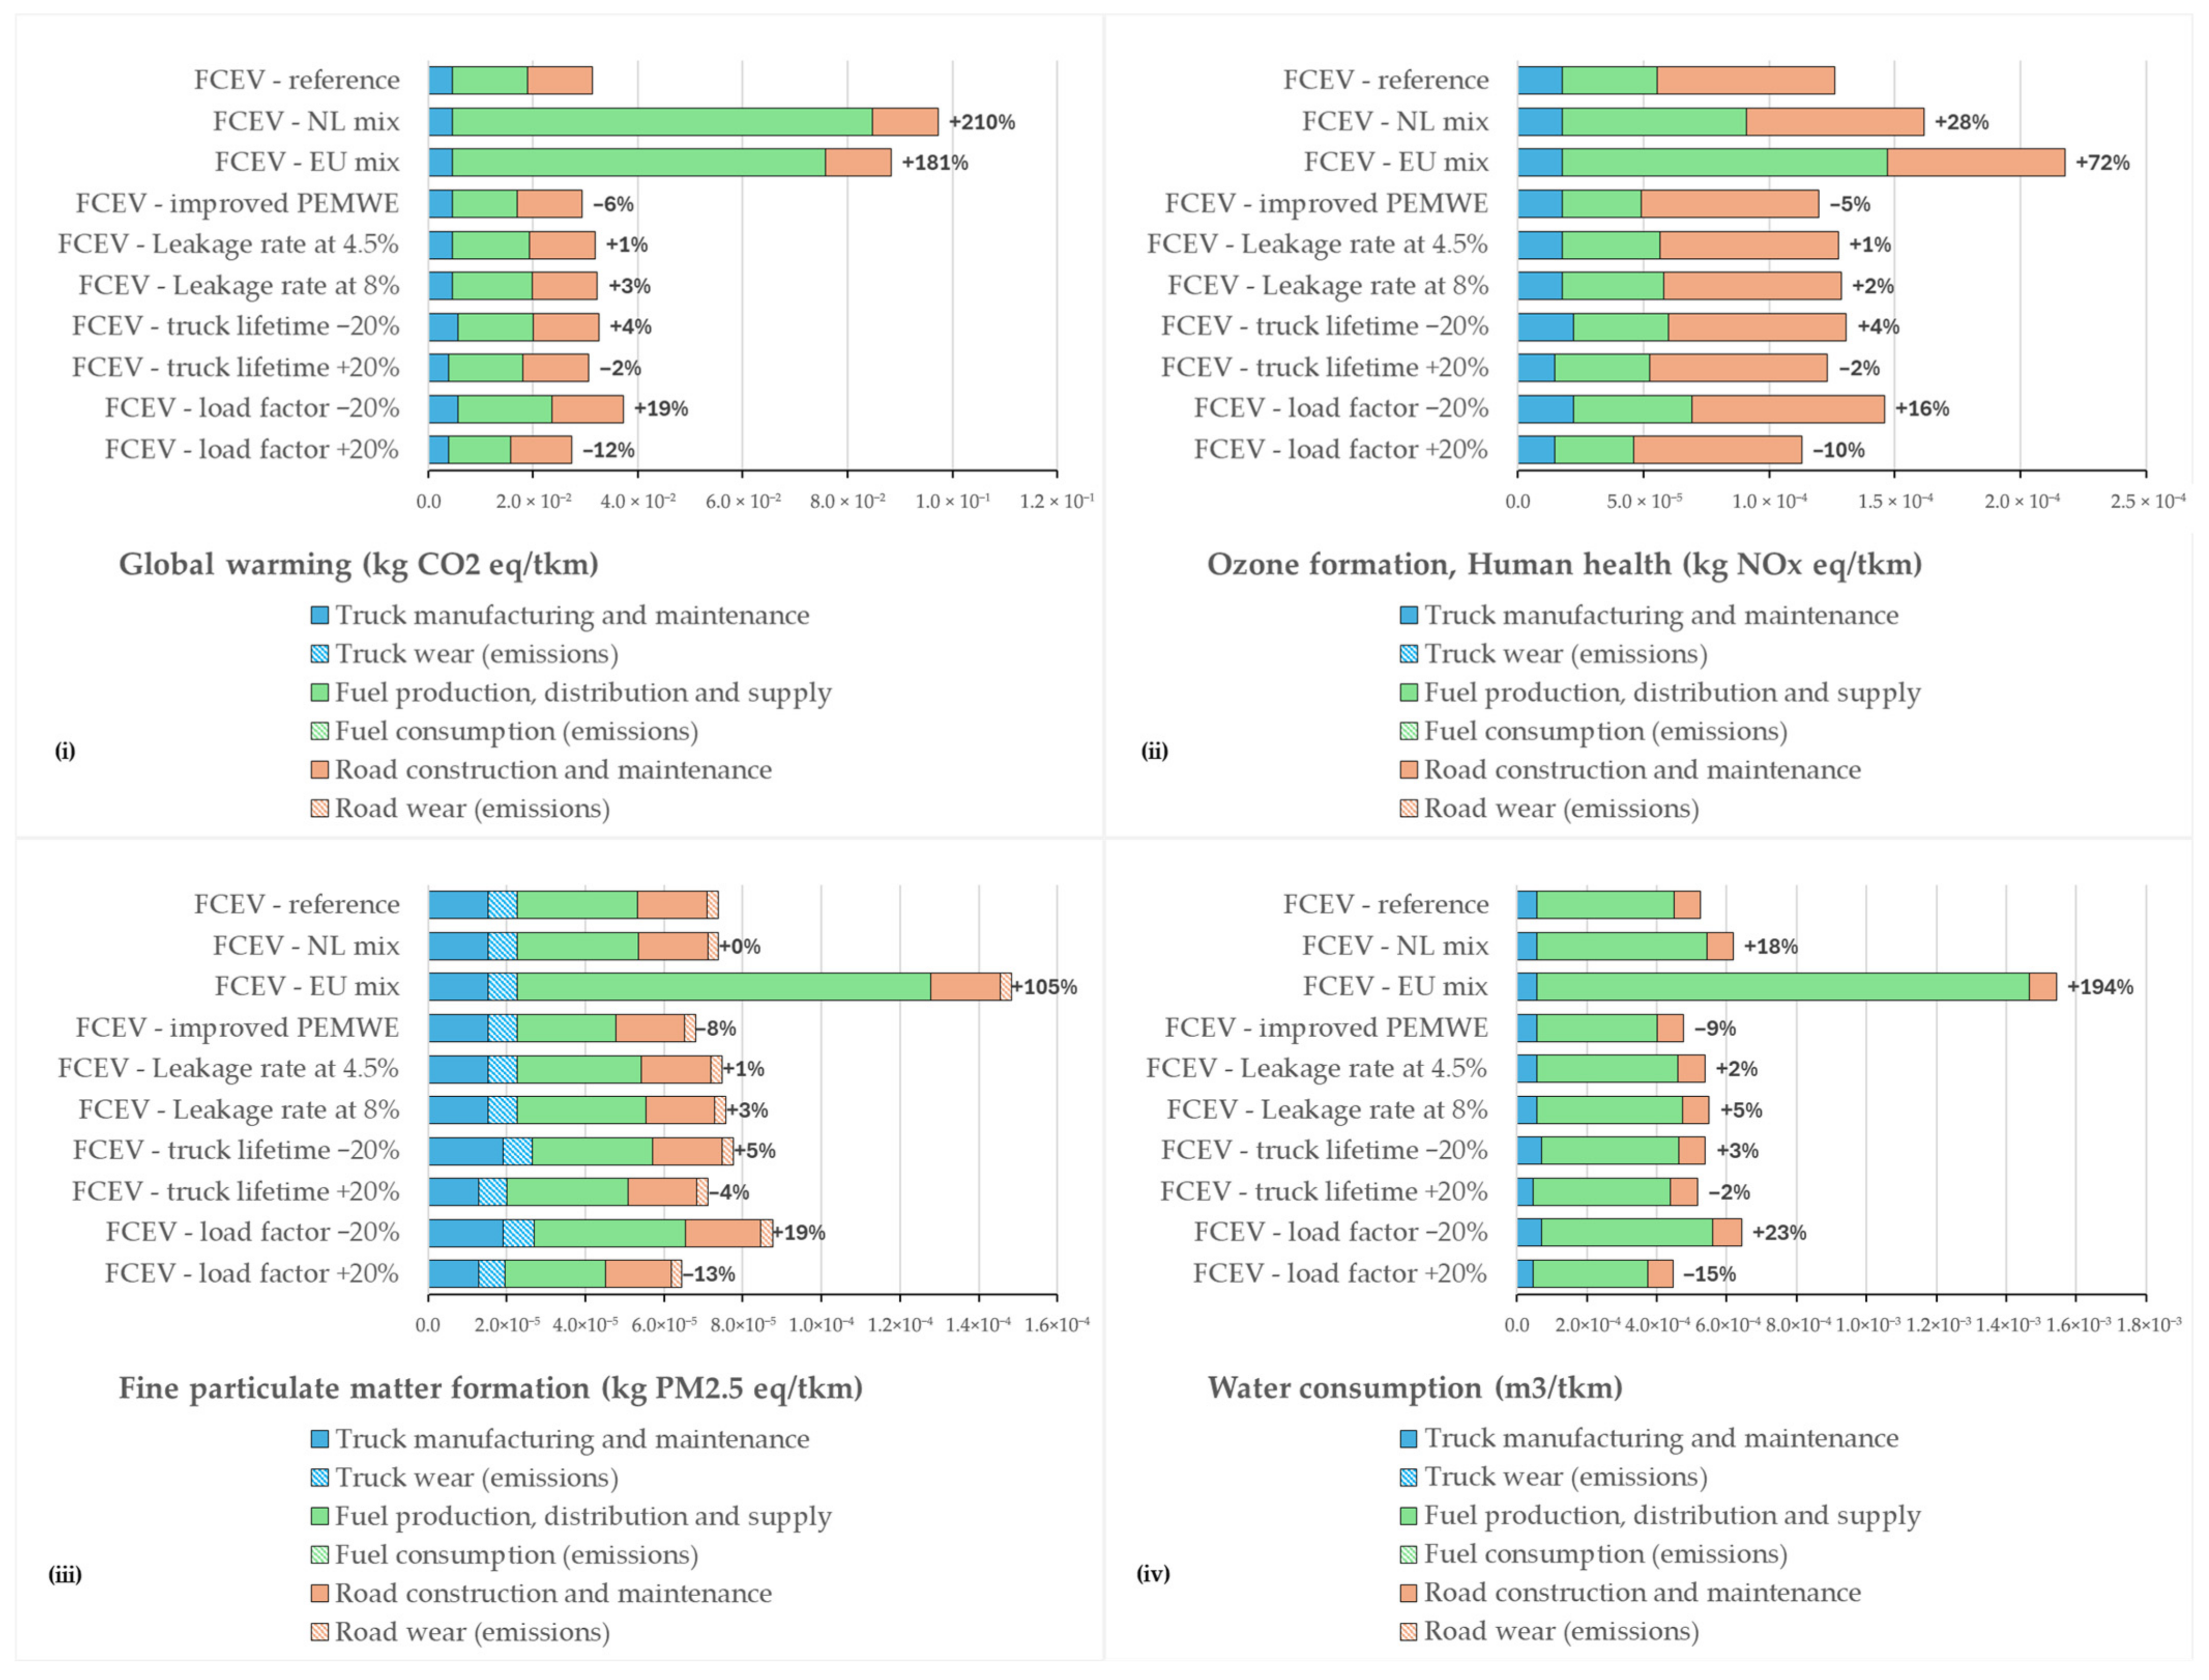
A sensitivity analysis was conducted to evaluate assumptions that can influence environmental impact results (Table S9). The analysis focused on the FCEV option, which shows lower impacts across most categories compared to HICEV. Results for the four main impact categories in Figure 9i–iv show that the choice of grid mix strongly affects fuel chain impacts, a trend that is also observed for the remaining categories in Figure S7. Using a different grid mix that includes fossil energy, and therefore cannot be classified as green hydrogen, leads to a threefold increase in global warming impact for the Dutch electricity mix, with a smaller increase for the EU mix. Other impact categories also increase clearly when electricity from mixed renewable and non-renewable sources is used. The only exception is the PMF impact, for which FCEV, based on the Dutch electricity mix, shows a similar result to the reference case, assuming only renewable energy.
As electrolysis technologies mature, improvements in PEM water electrolyzer stacks are expected, including higher energy efficiency and reduced use of rare and critical materials [56]. By 2050, electricity demand for hydrogen production is projected to decrease from 49.3 kWh per kg H2 to 42.6 kWh per kg H2 [69], while energy demand for hydrogen compression at 550 Bar is expected to decline from 3.5 to 2.5 kWh per kg H2 as compressor technologies advance [54]. Improving PEM water electrolyzer technology reduces the environmental impact of FCEVs by 10%. These reductions occur exclusively in the fuel chain, where higher energy efficiency accounts for most of the improvement.
The base case assumes a hydrogen leakage rate of 1%, representing a conservative minimum. The literature reports average leakage rates of approximately 4.5%, with upper estimates reaching 8% [55]. The sensitivity analysis indicates that increasing leakage rates has a limited effect on the four impact categories. At the maximum leakage rate of 8%, the impacts increase by 3 to 5%. Consequently, hydrogen leakage is a parameter that should not be neglected. However, the sensitivity analysis conducted does not change the overall outcomes of the current analysis.
The literature reports a typical truck lifetime between 640,000 and 960,000 km [33]. This study assumes a lifetime of 800,000 km, with an increase or decrease of 20%. Sensitivity results show that lifetime assumptions affect only the truck cycle, with all impact categories changing marginally by about 2 to 5% of the total environmental impact.
A fixed payload of 20 mt was assumed, thereby excluding real-world operational variability. Varying the load factor while keeping fuel efficiency constant shows noticeable effects in the fuel chain. Higher payloads reduce impacts in both the fuel chain and truck cycle because environmental burdens are allocated over a larger freight volume. Although increased load raises GVW and leads to higher emissions rates of truck and road wear, this does not offset the reductions achieved in the fuel chain and truck cycle.

4. Discussion

4.1. Environmental Impacts from Truck Cycle and Road Infrastructure on Road Freight Transport

The results show that the environmental impact of the truck cycle is low compared to the fuel chain and road infrastructure modules. Most of the impacts related to the truck cycle reflect wear emissions from brakes and tires and upstream material production. For impact categories such as PMF, both FCEVs and BEVs employ regenerative braking that exhibits low wear-related emissions [31]. This implies that truck concepts without regenerative braking can be improved by adopting this technology. Differences in GVW among the alternatives lead to minor variations in brake and tire-wear impacts and corresponding emissions. In addition, reducing the material intensity of batteries and fuel cells could lower production-phase emissions for BEVs and FCEVs. Furthermore, fuel-cell electric vehicles (FCEVs) offer co-benefits for local air quality. Fuel-cell systems require clean air intake, which leads to filtration of particulate matter and other pollutants before the air enters the stack. This process removes ambient PM and contributes to regional air quality, but this co-benefit was not included in this study.
Road infrastructure and related climate impacts are often left out of LCA studies and are considered equal for all alternatives. In this study, the impacts of road infrastructure were explicitly included. Including these impacts showed that the contribution to the total environmental impact on road freight transport is not negligible. Energy use by construction machinery is particularly influential. Replacing diesel-powered equipment with the zero-emission alternatives can reduce these impacts in the future. Research also shows that more efficient material use and improved recycling can further lower the environmental burden of both road construction and end-of-life processes [70,71].

4.2. Implications of Water Consumption (WC)

A transition to fossil-free road freight transport options such as BEVs, FCEVs and HICEVs shows a maximum potential reduction in global warming impacts of up to 50%. At the same time, this transition may lead to a three- to four-fold increase in water consumption. This indicates a potential problem shift, whereby mitigating one environmental impact can transfer pressure to water availability and its associated risks for ecosystems and biodiversity. The present analysis provides a certain extent of insight into the magnitude, location, and life cycle stages responsible for the observed increase in WC. Whether such an increase constitutes a critical environmental concern is highly context-dependent. Nevertheless, the results underline the importance of further investigating water-related impacts associated with alternative transport options, especially hydrogen-based systems. Such an in-depth assessment would benefit from integrating Water Footprint Assessment (WFA) approaches with LCA methods to better capture both quantitative water use and potential regional water-scarcity impacts [72].
The ReCiPe WC indicator provides valuable insight into freshwater use across the freight transport pathways, but its interpretation requires caution due to methodological limitations. ReCiPe measures net freshwater consumption, not withdrawal, meaning only water removed from local availability is counted and considered as being consumed. This is particularly relevant for assessing hydrogen systems: although electrolysis consumes ultrapure water, fuel-cell operation releases the ultrapure water again, which the methodology does not account for. Because the methodology does not account for this recovery, WC impacts for hydrogen pathways tend to be overstated in cases where water can be captured and reused.
These methodological limitations are closely linked to the broader role of water management in hydrogen production. Producing ultrapure water for electrolysis contributes to resource use, but nutrient recovery from the brine stream could mitigate these impacts [18]. Using seawater as the feedstock for desalination would not only provide ultrapure water for hydrogen production in arid regions but could simultaneously deliver drinking and irrigation water for domestic, industrial, and agricultural use. The resulting increase in brine volumes would make brine mining economically more attractive, enabling pathways that prevent brine disposal into the oceans [18].

4.3. Green Hydrogen Environmental Impact Drivers and Potential Improvements

4.3.1. Local Green Hydrogen Production Versus Other Production Methods

Electrolysis is used as the hydrogen production method in this study, and its environmental performance depends strongly on the carbon intensity of the electricity supply in combination with the efficiency of the electrolyzer. Further reductions in environmental impact could be achieved by optimizing electrolyzer siting, as the chosen configuration can affect the distances required for both hydrogen transport to end-users and electricity distribution from the source to the electrolyzer. Electricity transmission and distribution losses in EU power grids typically range between 3% and 8%, with current values for the Netherlands of approximately 4–5% of electricity output [73]. Further improvements could be achieved by transitioning to a direct DC power supply for the electrolyzer stacks, either through direct DC coupling of renewable generation or by implementing DC distribution grids.
Alternative production routes offer distinct environmental profiles: methane pyrolysis converts methane into hydrogen and solid carbon, avoiding CO2 formation during the production [65]. The environmental impact can be further reduced when biogas is used instead of natural gas as a methane source. Photoelectrochemical (PEC) solar hydrogen production represents another emerging option that directly converts water with sunlight into hydrogen without intermediate electricity generation [74]. Although this method can achieve higher conversion efficiencies, the process depends on catalysts and membranes made from scarce materials. Hydrogen mining, the extraction of naturally available geologic hydrogen, has recently gained attention as a potential source of low-carbon hydrogen. However, its overall environmental profile remains uncertain, as the presence of other subsurface gases (e.g., methane) and the impacts of extraction techniques could introduce additional emissions [74].

4.3.2. Potential Improvements and Drawbacks to Local Green Hydrogen Fuel Chain

Future technological improvements of the green hydrogen fuel chain in the sensitivity analysis, such as reduced material use for PEMWE and higher conversion efficiency, showed how the environmental impact can be reduced. Besides these system improvements, the use of residual heat from electrolyzers could increase system-level energy efficiency, especially when integrated into district heating or industrial heating, where it can replace natural gas as a heat source [52]. However, because PEMWE stack efficiency is expected to improve further, the associated heat losses will decrease, reducing the potential for heat recovery. Nevertheless, roughly ten percent of the electrical input is still expected to be released as heat, which may allow heat recovery to remain feasible for large-scale, centralized hydrogen production.

4.3.3. Impact of Hydrogen Leakage at Green Hydrogen Fuel Chain

The literature identifies it as an important parameter that can influence the overall environmental impact of green hydrogen production [75]. Although hydrogen is not a direct GHG, it acts as an indirect GHG by altering atmospheric chemistry and enhancing the global warming influence of methane, ozone, and stratospheric water vapor. Recent studies estimate a 100-year global warming potential of roughly 13 kg CO2 eq per kilogram of leaked hydrogen [75], which remains lower than the global warming potential of methane (approximately 27–30 kg CO2 eq per kilogram of CH4). Importantly, large-scale deployment of green hydrogen can substantially reduce methane consumption in the energy system by replacing fossil-based natural gas, thereby avoiding upstream methane leakage from fracking, gas extraction, and long-distance pipeline transport. In hydrogen production via electrolysis, hydrogen venting can be reduced using zero-loss hydrogen dryers. However, this dryer type results in additional electricity consumption [76].

4.4. Impact of Charging Duration on Transport Performance

The different truck configurations (Table 1) show that BEV trucks need more time to recharge than hydrogen or diesel trucks. The charging times range from 0.25 to 0.95 min per kilometer for BEVs compared with 0.02 to 0.006 min per kilometer for FCEVs, HICEVs and DICEVs. Because this study assumed a fixed driving distance without intermediate refueling or charging, these time-related differences were not reflected in the results.
In the context of long-haul operations, refueling and recharging times become an important factor to minimize downtime. Truck drivers in the EU are allowed to drive a maximum of 9 h per day with a daily rest period of at least 11 h [77], meaning that extended downtime for recharging during transport operation could reduce effective driving time and thereby impact overall transport efficiency. In such situations, it is expected that the environmental footprint of BEV trucks will increase due to reduced utilization rates and higher fleet requirements to compensate for.
At the same time, technological developments are expected to mitigate this limitation. Recent advancements show that BEV trucks with ranges up to 600 km are already available [78]. Moreover, the use of Megawatt Charging Systems (MCS) technology makes it possible to charge in under 30 min [79]. However, the large-scale deployment of such systems remains uncertain, as it requires substantial reinforcement of the electricity grid to support high-capacity charging infrastructure [80].
A comparable challenge exists for hydrogen refueling infrastructure. Although refueling times for hydrogen are comparable to those for diesel and are therefore advantageous from an operational point of view, the availability of hydrogen refueling stations (HRS) is currently limited. The EU strives for at least one HRS every 200 km on main roads by the end of 2030 [81]. Further development and expansion of HRS networks are required to ensure that hydrogen-powered trucks can refuel along their routes without incurring additional travel distances, which would otherwise negatively affect operational efficiency.
Further research could examine how refueling and charging duration influence the environmental impact of long-distance freight transport, especially for BEV trucks. First efforts could focus on expanding the functional unit from 1 tkm to a functional unit that reflects annual or even lifelong operation.

5. Conclusions

This study performed a life cycle assessment (LCA) of four road freight transport alternatives in the Netherlands: fuel-cell electric (FCEV), hydrogen internal combustion engine (HICEV), battery electric (BEV), and diesel internal combustion engine (DICEV). A comprehensive LCA was conducted that included the truck cycle, fuel chain, and road infrastructure. Incorporating road infrastructure and wear-related emissions provides a more comprehensive overview of all the life cycle burdens. The results show that FCEV, HICEV, and BEV all exhibit lower global warming- and ozone-related human health impacts than DICEV due to their reduced CO2 and NOx emissions during operation, where electricity replaces diesel combustion. FCEV and HICEV achieve lower climate change impacts than BEV (NL mix), driven by EU regulations that green hydrogen must meet stricter greenhouse gas (GHG) performance thresholds than electricity. When BEVs are supplied with the same renewable electricity mix, they achieve the lowest global warming impact.
While emissions of NOx and particulate matter are substantially lower during the operational phase for FCEV, HICEV, and BEV, these pollutants shift upstream to the material extraction and processing stages associated with solar panels and, to a lesser extent, wind turbines used in renewable electricity generation. These emissions are particularly relevant in densely populated areas and are part of the broader rationale for zero-emission zones. Because PV manufacturing generates higher NOx and particulate emissions than wind turbine production, a higher solar share in the renewable mix increases ozone-related (human health) and particulate matter impacts. Furthermore, solar power requires more land use than wind power.
Water consumption (WC) is higher for FCEV, HICEV, and BEV compared with DICEV due to the water-intensive mining and processing of materials used in solar panels, wind turbines, and batteries. Specifically for FCEV and HICEV, the use of water as feedstock for hydrogen production also contributes notably to WC. Although hydrogen production requires ultrapure water, the same quantity is regenerated during fuel-cell operation or hydrogen combustion. However, the current WC assessment method does not account for the return of water vapor to natural systems. Because electrochemical conversion of hydrogen produces demineralized water that could be recovered, further methodological refinement is needed to reflect potential net-zero water use in hydrogen pathways more accurately.
Both electrolysis and fuel-cell technologies are still in early stages of development, with substantial room for efficiency improvements and material reductions. Efficiency enhancements have a strong effect on environmental performance because they reduce the amount of solar- or wind-generated electricity required for hydrogen production, thereby reducing the upstream impact of renewable energy facilities.
The comparison of FCEV, HICEV, BEV, and DICEV highlights the need to consider differences in operationality, as BEVs require longer charging times and rely on heavier energy storage systems than the other powertrains. Although operationality does not form part of the functional unit (FU) in LCA, it remains relevant for real-world decision-making in transport, especially in the transport sector, where rapid refueling is essential. Further research is required to clarify how LCA results can be meaningfully interpreted, accounting for operational differences without confounding them with the selected functional unit.
Overall, the findings show that several factors influence the environmental impact of road freight transport that are related to the truck cycle, fuel chain and road infrastructure. Important areas for further improvement include reducing the impact of electricity generation, advancements in green hydrogen production and battery technologies, more efficient use of materials and water consumption, and adopting more sustainable road infrastructure practices. The results also reveal that the electricity mix has a major effect on environmental performance. This highlights the need for clear and well-supported assumptions when comparing different road freight transport pathways.

Supplementary Materials

The following supporting information can be downloaded at: https://www.mdpi.com/article/10.3390/en19102433/s1, Table S1: data quality life cycle inventory (LCI), Table S2: overview of the selected ReCiPe midpoint impact categories for the study, Table S3: life cycle inventory (LCI) truck cycle—manufacturing 1 truck, Table S4: life cycle inventory (LCI) green hydrogen fuel chain in 2025 per 1 kg H2, Table S5: life cycle inventory (LCI) electricity fuel chain per 1 kWh, Table S6: life cycle inventory (LCI) diesel fuel chain per 1 L, Table S7: emission factors use phase, Table S8: life cycle impact assessment (LCIA) results of the ten impact categories across the truck cycle, fuel chain and road infrastructure, Table S9: life cycle impact assessment (LCIA) sensitivity analysis results of the ten impact categories for FCEV. Figure S1: Terrestrial ecotoxicity (TET) impact across the truck cycle (blue), fuel chain (green), and road infrastructure (orange) for the truck alternatives FCEV, HICEV, BEV and DICEV for the situation in 2025, Figure S2: Freshwater ecotoxicity (TET) impact across the truck cycle (blue), fuel chain (green), and road in-frastructure (orange) for the truck alternatives FCEV, HICEV, BEV and DICEV for the situation in 2025, Figure S3: Land use (LU) impact across the truck cycle (blue), fuel chain (green), and road infra-structure (orange) for the truck alternatives FCEV, HICEV, BEV and DICEV for the situation in 2025, Figure S4: Marine eutrophication (ME) impact across the truck cycle (blue), fuel chain (green), and road infrastructure (orange) for the truck alternatives FCEV, HICEV, BEV and DICEV for the sit-uation in 2025, Figure S5: Mineral resource scarcity (MRS) impact across the truck cycle (blue), fuel chain (green), and road infrastructure (orange) for the truck alternatives FCEV, HICEV, BEV and DICEV for the situation in 2025, Figure S6: Fossil resource scarcity (FRS) impact across the truck cycle (blue), fuel chain (green), and road infrastructure (orange) for the truck alternatives FCEV, HICEV, BEV and DICEV for the sit-uation in 2025, Figure S7: sensitivity analysis displaying results of the FCEV transport alternative of the remaining impact categories.

Author Contributions

Conceptualization, R.v.d.B. and T.v.d.B.; investigation, R.v.d.B., T.v.d.B. and C.v.d.G.; writing—original draft preparation, R.v.d.B.; writing—review and editing, all authors; visualization, R.v.d.B.; supervision, T.v.d.B., D.B. and C.v.d.G. All authors have read and agreed to the published version of the manuscript.

Funding

This research was co-financed with funding from the LIFE Program of the European Climate, Infrastructure and Environment Executive Agency (CINEA). The authors would like to thank the LIFE Program (LIFE20 CCM/NL/001664) for their financial contribution to the research projects that lay at the foundation of this publication.

Data Availability Statement

The original contributions presented in this study are included in the article/Supplementary Materials. Further inquiries can be directed to the corresponding author.

Acknowledgments

Special appreciation is extended to Ad van Wijk from KWR Water Research Institute for his valuable insights and guidance during the preparation of this paper.

Conflicts of Interest

Author Coen van der Giesen was employed by the company CE Delft. Author Ron Bol was employed by the company Allied Waters. The remaining authors declare that the research was conducted in the absence of any commercial or financial relationships that could be construed as potential conflicts of interest.

Abbreviations

The following abbreviations are used in this manuscript:
BEVBattery-Electric Vehicle
BoPBalance of Plant
CHPCombined Heat and Power
DICEVDiesel Internal Combustion Engine Vehicle
FCEVFuel-Cell Electric Vehicle
FETFreshwater Ecotoxicity
FRSFossil Resource Scarcity
FUFunctional Unit
GHGGreenhouse Gas
GVWGross Vehicle Weight
HICEVHydrogen Internal Combustion Engine Vehicle
HRSHydrogen Refueling Station
LCALife Cycle Assessment
LCILife Cycle Inventory
LCIALife Cycle Impact Assessment
LNHLIFE NEW HYTS
LULand Use
MEMarine Eutrophication
MCSMegawatt Charging System
MRSMineral Resource Scarcity
mtMetric ton
NOxNitrogen Oxides
NMVOCNon-Methane Volatile Organic Compounds
OF-HHOzone Formation, Human Health
PEMWEProton-Exchange Membrane Water Electrolyzer
PJPetajoule
PM2.5Particulate Matter ≤ 2.5 µm
PMFFine Particulate Matter Formation
PVPhotovoltaic
RED IIIRenewable Energy Directive III
RFNBORenewable Fuels of Non-Biological Origin
WCWater Consumption
WFAWater Footprint Assessment
WTWWell-to-Wheel
TETTerrestrial Ecotoxicity
tkmTon-Kilometer

References

  1. International Energy Agency. CO2 Emissions in 2022; International Energy Agency: Paris, France, 2023. [Google Scholar]
  2. Freight Transportation|MIT Climate Portal. Available online: https://climate.mit.edu/explainers/freight-transportation (accessed on 5 November 2025).
  3. Sorrell, S.; Lehtonen, M.; Stapleton, L.; Pujol, J.; Champion, T. Decoupling of Road Freight Energy Use from Economic Growth in the United Kingdom. Energy Policy 2012, 41, 84–97. [Google Scholar] [CrossRef] [Scilit]
  4. Hydrogen Roadmap Europe—Publications Office of the EU. Available online: https://op.europa.eu/en/publication-detail/-/publication/0817d60d-332f-11e9-8d04-01aa75ed71a1/language-en (accessed on 28 October 2025).
  5. Transport Demand Set to Triple, but Sector Faces Potential Disruptions|ITF. Available online: https://www.itf-oecd.org/transport-demand-set-triple-sector-faces-potential-disruptions (accessed on 1 May 2026).
  6. United Nations. UNFCCC Adoption of the Paris Agreement—Paris Agreement Text English; United Nations: New York, NY, USA, 2015. [Google Scholar]
  7. Shi, Y.; Qiu, Z.; Snyder, S.W.; Wang, Y. A Perspective on Broad Deployment of Hydrogen-Fueled Vehicles for Ground Freight Transportation with a Comparison to Electric Vehicles. Energy Strategy Rev. 2024, 56, 101565. [Google Scholar] [CrossRef] [Scilit]
  8. Parolin, F.; Colbertaldo, P.; Campanari, S. Development of a Multi-Modality Hydrogen Delivery Infrastructure: An Optimization Model for Design and Operation. Energy Convers. Manag. 2022, 266, 115650. [Google Scholar] [CrossRef] [Scilit]
  9. Zheng, Y.; Hou, D.; Liu, Y.; Zhou, Y.; Xiao, J. Complex System Analysis of the Implications of Hydrogen Fuel Cell Trucks in China’s Road Freight Transportation. Int. J. Hydrogen Energy 2024, 60, 1449–1461. [Google Scholar] [CrossRef] [Scilit]
  10. Directive—EU—2023/2413—EN—Renewable Energy Directive—EUR-Lex. Available online: https://eur-lex.europa.eu/legal-content/EN/TXT/?uri=CELEX%3A32023L2413 (accessed on 3 February 2026).
  11. Implementing Regulation—2022/996—EN—EUR-Lex. Available online: https://eur-lex.europa.eu/legal-content/EN/ALL/?uri=CELEX%3A32022R0996 (accessed on 3 February 2026).
  12. Weeda, M. Inzet van Groene Waterstof in de Vervoerssector Kostenvergelijking van de Raffinageroute Met Opties Voor Direct Gebruik; TNO: The Hague, The Netherlands, 2024. [Google Scholar]
  13. Toezegging Bij Wijziging van de Wet Milieubeheer in Verband Met de Implementatie van Richtlijn (EU) 2023/2413 (RED III) Wat de Bevordering van Energie Uit Hernieuwbare Bronnen Betreft|Tweede Kamer Der Staten-Generaal. Available online: https://www.tweedekamer.nl/kamerstukken/toezeggingen/detail?id=TZ202510-018&did=TZ202510-018 (accessed on 22 December 2025).
  14. Peiretti Paradisi, B.; Pulvirenti, L.; Prussi, M.; Rolando, L.; Vinogradov, A. Life Cycle Assessment of Different Powertrain Alternatives for a Clean Urban Bus Across Diverse Weather Conditions. Energies 2025, 18, 4522. [Google Scholar] [CrossRef] [Scilit]
  15. Wallington, T.J.; Woody, M.; Lewis, G.M.; Keoleian, G.A.; Adler, E.J.; Martins, J.R.R.A.; Collette, M.D. Hydrogen as a Sustainable Transportation Fuel. Renew. Sustain. Energy Rev. 2025, 217, 115725. [Google Scholar] [CrossRef] [Scilit]
  16. Zhang, W.; Tan, N.; Ma, T. Mechanisms for the Low-Carbon Transition of Public Transport Energy Systems: Decoupling Emissions and Energy Consumption in Inner Mongolia and the Path to Three-Chain Synergy. Energies 2025, 18, 4817. [Google Scholar] [CrossRef] [Scilit]
  17. Burchart, D.; Przytuła, I. Review of Environmental Life Cycle Assessment for Fuel Cell Electric Vehicles in Road Transport. Energies 2025, 18, 1229. [Google Scholar] [CrossRef] [Scilit]
  18. Groene Energie Voor Iedereen. Hoe Waterstof En Elektriciteit Onze Toekomst Dragen. Available online: https://library.kwrwater.nl/publication/71899413/groene-energie-voor-iedereen-hoe-waterstof-en-elektriciteit-onze-toekomst-dragen/ (accessed on 27 February 2026).
  19. Astiaso Garcia, D. Analysis of Non-Economic Barriers for the Deployment of Hydrogen Technologies and Infrastructures in European Countries. Int. J. Hydrogen Energy 2017, 42, 6435–6447. [Google Scholar] [CrossRef] [Scilit]
  20. Steinbach, S.A.; Bunk, N. The Future European Hydrogen Market: Market Design and Policy Recommendations to Support Market Development and Commodity Trading. Int. J. Hydrogen Energy 2024, 70, 29–38. [Google Scholar] [CrossRef] [Scilit]
  21. Gentilucci, G.; Accardo, A.; Spessa, E. Life Cycle Analysis of a PEM Fuel Cell System for Long-Haul Heavy-Duty Trucks; SAE Technical Papers; SAE International: Warrendale, PA, USA, 2024. [Google Scholar] [CrossRef] [Scilit]
  22. Ren, L.; Zhou, S.; Peng, T.; Ou, X. Greenhouse Gas Life Cycle Analysis of China’s Fuel Cell Medium- and Heavy-Duty Trucks under Segmented Usage Scenarios and Vehicle Types. Energy 2022, 249, 123628. [Google Scholar] [CrossRef] [Scilit]
  23. Booto, G.K.; Aamodt Espegren, K.; Hancke, R. Comparative Life Cycle Assessment of Heavy-Duty Drivetrains: A Norwegian Study Case. Transp. Res. D Transp. Environ. 2021, 95, 102836. [Google Scholar] [CrossRef] [Scilit]
  24. Drawer, C.; Rödl, A.; Kaltschmitt, M. Life Cycle Assessment of Construction and Driving Operation of a Hydrogen-Powered Truck Built from a Used Diesel Truck. Transp. Res. Interdiscip. Perspect. 2024, 24, 101020. [Google Scholar] [CrossRef] [Scilit]
  25. Velandia Vargas, J.E.; Brynolf, S.; Grahn, M.; Rodriguez, F.; Blekhman, D. Vehicle-Oriented and Sweden-Framed Life Cycle Assessment: Hydrogen for Long-Haul Trucks. iScience 2025, 28, 113607. [Google Scholar] [CrossRef] [Scilit]
  26. Chotanapund, V.; Gheewala, S.H.; Strezov, V.; Huda, N.; Mungkalasiri, J.; Prapaspongsa, T. Spatially Differentiated Life Cycle Assessment of Thailand’s Transport: The Implications from Country-Specific Factors and Alternative Technologies. Sustain. Prod. Consum. 2025, 57, 319–340. [Google Scholar] [CrossRef] [Scilit]
  27. Cabrera-Jiménez, R.; Mateo, J.M.; Jiménez, L.; Pozo, C. Prospective Life-Cycle Assessment of Sustainable Alternatives for Road Freight Transport. Renew. Sustain. Energy Rev. 2025, 211, 115243. [Google Scholar] [CrossRef] [Scilit]
  28. Németh, P.; Mecséri, B.; Hanula, B. A Life Cycle Assessment Framework for Evaluating the Climate Impact of Hydrogen-Based Passenger Vehicle Technologies Toward Sustainable Mobility. Hydrogen 2025, 6, 68. [Google Scholar] [CrossRef] [Scilit]
  29. Mattinzioli, T.; Butt, A.A.; Harvey, J. Literature Review on Pavements and Electric Vehicle Interaction: A Research Roadmap. Transp. Res. D Transp. Environ. 2023, 122, 103886. [Google Scholar] [CrossRef] [Scilit]
  30. Syré, A.M.; Göhlich, D. Decarbonization of Long-Haul Heavy-Duty Truck Transport: Technologies, Life Cycle Emissions, and Costs. World Electr. Veh. J. 2025, 16, 76. [Google Scholar] [CrossRef] [Scilit]
  31. Woo, S.H.; Kim, W.; Kim, M.; Jang, H.; Lee, S. Impact of Vehicle Electrification on Brake Wear Particle (BWP) Emissions under Real-World Driving Conditions. Wear 2026, 584–585, 206392. [Google Scholar] [CrossRef] [Scilit]
  32. Ren, W.; Cao, Y.; Yang, Q.; Zhang, Z.; Wang, Q.; Nie, X.; Huang, J. Life Cycle Assessment of Green Hydrogen Supply Chains for Vehicle Use in China. Renew. Energy 2026, 256, 124093. [Google Scholar] [CrossRef] [Scilit]
  33. Hermesmann, M.; Tsiklios, C.; Müller, T.E. The Environmental Impact of Renewable Hydrogen Supply Chains: Local vs. Remote Production and Long-Distance Hydrogen Transport. Appl. Energy 2023, 351, 121920. [Google Scholar] [CrossRef] [Scilit]
  34. Martinez, G.E.; Degens, R.; Espadas-Aldana, G.; Costa, D.; Cardellini, G. Prospective Life Cycle Assessment of Hydrogen: A Systematic Review of Methodological Choices. Energies 2024, 17, 4297. [Google Scholar] [CrossRef] [Scilit]
  35. ISO 14040:2006; Environmental Management—Life Cycle Assessment—Principles and Framework. ISO: Geneva, Switzerland, 2006. Available online: https://www.iso.org/standard/37456.html (accessed on 22 December 2025).
  36. ISO 14044:2006; Environmental Management—Life Cycle Assessment—Requirements and Guidelines. ISO: Geneva, Switzerland, 2006. Available online: https://www.iso.org/standard/38498.html (accessed on 22 December 2025).
  37. Huijbregts, M.A.J.; Steinmann, Z.J.N.; Elshout, P.M.F.; Stam, G.; Verones, F.; Vieira, M.; Zijp, M.; Hollander, A.; van Zelm, R. ReCiPe2016: A Harmonised Life Cycle Impact Assessment Method at Midpoint and Endpoint Level. Int. J. Life Cycle Assess. 2016, 22, 138–147. [Google Scholar] [CrossRef] [Scilit]
  38. Life New Hyts|Renewable Green Hydrogen for Transport. Available online: https://lifenewhyts.eu/ (accessed on 27 February 2026).
  39. ISO 14687:2025; Hydrogen Fuel Quality—Product Specification. ISO: Geneva, Switzerland, 2005. Available online: https://www.iso.org/standard/82660.html (accessed on 4 February 2026).
  40. Transport, Freight, Lorry, >32 Metric Ton, Diesel, EURO 6—Europe—Transport, Freight, Lorry, >32 Metric Ton, Diesel, EURO 6|EcoQuery. Available online: https://ecoquery.ecoinvent.org/3.11/cutoff/dataset/11457/documentation (accessed on 20 March 2025).
  41. Spielmann, M.; Scholz, R.W. Life Cycle Inventories of Transport Services: Background Data for Freight Transport. Int. J. Life Cycle Assess. 2005, 10, 85–94. [Google Scholar] [CrossRef] [Scilit]
  42. Market for Lorry, 40 Metric Ton—Europe—Lorry, 40 Metric Ton|EcoQuery. Available online: https://ecoquery.ecoinvent.org/3.11/cutoff/dataset/23522/documentation (accessed on 20 March 2025).
  43. World’s First Fuel Cell Heavy-Duty Truck, Hyundai XCIENT Fuel Cell, Heads to Europe for Commercial Use—Hyundai HM. Available online: https://hyundaihm.com/worlds-first-fuel-cell-heavy-duty-truck-hyundai-xcient-fuel-cell-heads-to-europe-for-commercial-use/ (accessed on 18 February 2026).
  44. XCIENT Fuel Cell Truck|Hydrogen Truck|Hyundai Motor Company. Available online: https://ecv.hyundai.com/global/en/products/xcient-fuel-cell-truck-fcev (accessed on 18 February 2026).
  45. MAN Waterstof Vrachtwagen|MAN Nederland|MAN Nederland. Available online: https://man-nederland.nl/man-truck/truck-modellen/man-waterstoftruck (accessed on 18 February 2026).
  46. Hylane Man HTgX Vehicle Information. Available online: https://www.hylane.net/assets/documents/fahrzeug-datenblaetter/MAN_hTGX_EN.pdf (accessed on 18 February 2026).
  47. Specificaties Volvo FH. Available online: https://www.volvotrucks.nl/nl-nl/trucks/models/volvo-fh/specifications.html#accordion-eaebb0bd66-item-bd4fbb3745 (accessed on 18 February 2026).
  48. Volvo FH Aero Electric. Available online: https://www.volvotrucks.nl/nl-nl/trucks/electric/volvo-fh-aero-electric.html (accessed on 18 February 2026).
  49. Volvo FH with I-Save Smashes Fuel Test Record. Available online: https://www.volvotrucks.com/en-en/news-stories/stories/2020/feb/volvo-fh-with-i-save-breaks-fuel-record.html (accessed on 18 February 2026).
  50. Market for Maintenance, Lorry 40 Metric Ton—Global—Maintenance, Lorry 40 Metric Ton|EcoQuery. Available online: https://ecoquery.ecoinvent.org/3.11/cutoff/dataset/1324/documentation (accessed on 20 March 2025).
  51. Elektriciteitsbalans; Aanbod En Verbruik|CBS. Available online: https://www.cbs.nl/nl-nl/cijfers/detail/84575NED (accessed on 5 March 2026).
  52. van der Roest, E.; Bol, R.; Fens, T.; van Wijk, A. Utilisation of Waste Heat from PEM Electrolysers—Unlocking Local Optimisation. Int. J. Hydrogen Energy 2023, 48, 27872–27891. [Google Scholar] [CrossRef] [Scilit]
  53. Gerhardt-Mörsdorf, J.; Peterssen, F.; Burfeind, P.; Benecke, M.; Bensmann, B.; Hanke-Rauschenbach, R.; Minke, C. Life Cycle Assessment of a 5 MW Polymer Exchange Membrane Water Electrolysis Plant. Adv. Energy Sustain. Res. 2024, 5, 2300135. [Google Scholar] [CrossRef] [Scilit]
  54. Genovese, M.; Piraino, F.; Kovač, A.; Marciuš, D.; Pagnotta, L.; Fragiacomo, P. Integration of Hydrogen Compressors and Turbines into Current and Future Hydrogen Infrastructure. J. Power Sources 2025, 629, 235965. [Google Scholar] [CrossRef] [Scilit]
  55. Restrepo, L.; Fulton, L.M. Assessing Hydrogen Supply Chains: An Integrated Review of Leakage and Energy Efficiency Studies. Int. J. Hydrogen Energy 2025, 156, 150265. [Google Scholar] [CrossRef] [Scilit]
  56. Van Der Star, M. Material Requirements for Water Electrolysers in the Netherlands 2020–2050; Centre for Sustainability, 7 December 2022. Available online: https://www.centre-for-sustainability.nl/news/material-requirements-for-water-electrolysers-with-m-van-der-star-ekinetix (accessed on 27 January 2026).
  57. Bareiß, K.; de la Rua, C.; Möckl, M.; Hamacher, T. Life Cycle Assessment of Hydrogen from Proton Exchange Membrane Water Electrolysis in Future Energy Systems. Appl. Energy 2019, 237, 862–872. [Google Scholar] [CrossRef] [Scilit]
  58. Sarda, J.; Patel, N.; Patel, H.; Vaghela, R.; Brahma, B.; Bhoi, A.K.; Barsocchi, P. A Review of the Electric Vehicle Charging Technology, Impact on Grid Integration, Policy Consequences, Challenges and Future Trends. Energy Rep. 2024, 12, 5671–5692. [Google Scholar] [CrossRef] [Scilit]
  59. Market for Diesel, Low-Sulfur—Europe Without Switzerland—Diesel, Low-Sulfur|EcoQuery. Available online: https://ecoquery.ecoinvent.org/3.10/apos/dataset/9460/documentation (accessed on 21 March 2025).
  60. Deng, R.; Procházka, O.; Kilchert, S. Life Cycle Assessment of Future Electricity and Hydrogen Systems: Implications for Low-Carbon Transport. Clean. Environ. Syst. 2025, 19, 100349. [Google Scholar] [CrossRef] [Scilit]
  61. Electricity Production, Photovoltaic, 570kWp Open Ground Installation, Multi-Si—Netherlands—Electricity, Low Voltage|EcoQuery. Available online: https://ecoquery.ecoinvent.org/3.11/cutoff/dataset/4861/documentation (accessed on 19 May 2025).
  62. Electricity Production, Wind, 1-3MW Turbine, Offshore—Netherlands—Electricity, High Voltage|EcoQuery. Available online: https://ecoquery.ecoinvent.org/3.11/cutoff/dataset/4231/documentation (accessed on 19 May 2025).
  63. Electricity Production, Wind, 1-3MW Turbine, Onshore—Netherlands—Electricity, High Voltage|EcoQuery. Available online: https://ecoquery.ecoinvent.org/3.11/cutoff/dataset/8128/documentation (accessed on 13 March 2026).
  64. Vazquez-Sanchez, H.; Okeke, I.J.; Singh, E.; Baaqel, H.; Saville, B.A.; MacLean, H.L.; Sarathy, S.M. A Life Cycle Assessment of E-Hydrogen Production Using Proton-Exchange Membrane Water Electrolysis Coupled with Desalination in Saudi Arabia. Int. J. Hydrogen Energy 2025, 139, 792–805. [Google Scholar] [CrossRef] [Scilit]
  65. Henriksen, M.S.; Matthews, H.S.; White, J.; Walsh, L.; Grol, E.; Jamieson, M.; Skone, T.J. Tradeoffs in Life Cycle Water Use and Greenhouse Gas Emissions of Hydrogen Production Pathways. Int. J. Hydrogen Energy 2024, 49, 1221–1234. [Google Scholar] [CrossRef] [Scilit]
  66. Nugent, D.; Sovacool, B.K. Assessing the Lifecycle Greenhouse Gas Emissions from Solar PV and Wind Energy: A Critical Meta-Survey. Energy Policy 2014, 65, 229–244. [Google Scholar] [CrossRef] [Scilit]
  67. Golroudbary, S.R.; Lundström, M.; Wilson, B.P. Analogical Environmental Cost Assessment of Silicon Flows Used in Solar Panels by the US and China. Sci. Rep. 2024, 14, 9538. [Google Scholar] [CrossRef] [Scilit] [PubMed]
  68. Na, W.-C.; Kim, Y.; Kim, K.N.; Lee, K.-Y. Analysis on the Water Footprint of Crystalline Silicon PV System. Clean Technol. 2014, 20, 449–456. [Google Scholar] [CrossRef] [Scilit]
  69. Koj, J.C.; Zapp, P.; Wieland, C.; Görner, K.; Kuckshinrichs, W. Green Hydrogen Production by PEM Water Electrolysis up to the Year 2050: Prospective Life Cycle Assessment Using Learning Curves. J. Ind. Ecol. 2025, 29, 145–158. [Google Scholar] [CrossRef] [Scilit]
  70. Corona, B.; Hoefnagels, R.; Vural Gürsel, I.; Moretti, C.; van Veen, M.; Junginger, M. Metrics for Minimising Environmental Impacts While Maximising Circularity in Biobased Products: The Case of Lignin-Based Asphalt. J. Clean. Prod. 2022, 379, 134829. [Google Scholar] [CrossRef] [Scilit]
  71. Fvb, J.L. SR Werking Lignine in Asfalt. 2025. Available online: https://open.overheid.nl/documenten/9e9752fd-08e0-479a-b2fd-2ddb5e9723cf/file (accessed on 19 March 2026).
  72. Berger, M.; Gerbens-Leenes, W.; Karandish, F.; Aldaya, M.M.; Boulay, A.M.; Hogeboom, R.J.; Link, A.; Manzardo, A.; Mialyk, O.; Motoshita, M.; et al. Complementary Strengths of Water Footprint and Life Cycle Assessments in Analyzing Global Freshwater Appropriation and Its Local Impacts—Recommendations from an Interdisciplinary Discussion Series. Ecol. Indic. 2025, 174, 113458. [Google Scholar] [CrossRef] [Scilit]
  73. The Council of the European Union. CEER Report on Power Losses; The Council of the European Union: Brussels, Belgium, 2017.
  74. Tasleem, S.; Alsharaeh, E.H. Role of Green, Yellow, Blue, White and Gold Hydrogen in Fuelling the Path to Net Zero and Sustainable Future—A Review. Energy Convers. Manag. 2025, 326, 119500. [Google Scholar] [CrossRef] [Scilit]
  75. Muñoz, I. Literature Review on Climate Effects and Leakage Rates in a Hydrogen Economy; 2.-0 LCA Consultants: Aalborg, Denmark, 2023. [Google Scholar]
  76. Agency, E. Review of Emerging Techniques for Hydrogen Production from Electrolysis of Water; Environment Agency: Bristol, UK, 2024.
  77. Driving Time and Rest Periods—Mobility and Transport. Available online: https://transport.ec.europa.eu/transport-modes/road/social-provisions/driving-time-and-rest-periods_en (accessed on 7 May 2026).
  78. EActros|Mercedes-Benz Trucks International. Available online: https://www.mercedes-benz-trucks.com/int/en/trucks/eactros.html (accessed on 7 May 2026).
  79. Narasipuram, R.P.; Hosseinpour, A. Megawatt Charging System for Electric Vehicles: Design Requirements and Deployment Challenges. Energy Convers. Manag. X 2026, 30, 101761. [Google Scholar] [CrossRef] [Scilit]
  80. Tripathy, S.; Fahnbulleh, E.B.; Ghatak, S.R.; Lopes, F.; Acharjee, P. Uncertainty-Aware Planning of EV Charging Infrastructure and Renewable Integration in Distribution Networks: A Review. Energies 2026, 19, 1131. [Google Scholar] [CrossRef] [Scilit]
  81. Infographic—Fit for 55: Towards More Sustainable Transport|European Alternative Fuels Observatory. Available online: https://alternative-fuels-observatory.ec.europa.eu/general-information/news/infographic-fit-55-towards-more-sustainable-transport (accessed on 16 October 2025).
Figure 1. System boundaries for the four transport alternatives—FCEV, HICEV, BEV, and DICEV trucks—based on a functional unit (FU) of 1 tkm. The system includes the truck cycle (blue), fuel chain (green), and road infrastructure (orange).
Energies 19 02433 g001
Figure 2. System components of the green hydrogen fuel chain.
Energies 19 02433 g002
Figure 3. System components of the electricity fuel chain.
Energies 19 02433 g003
Figure 4. System components diesel fuel chain for the LCI.
Energies 19 02433 g004
Figure 5. Global warming (GW) impact across the truck cycle (blue), fuel chain (green), and road infrastructure (orange) for the truck alternatives FCEV, HICEV, BEV and DICEV in 2025. Emissions during the use phase are represented by diagonal lines in the corresponding colors.
Energies 19 02433 g005
Figure 6. Ozone formation, human health (OF-HH) impact across the truck cycle (blue), fuel chain (green), and road infrastructure (orange) for the truck alternatives FCEV, HICEV, BEV and DICEV in 2025. Emissions during the use phase are represented by diagonal lines in the corresponding colors.
Energies 19 02433 g006
Figure 7. Fine particulate matter formation (PMF) impact across the truck cycle (blue), fuel chain (green), and road infrastructure (orange) for the truck alternatives FCEV, HICEV, BEV and DICEV for the situation in 2025. Emissions during the use phase are represented by diagonal lines in the corresponding colors.
Energies 19 02433 g007
Figure 8. Water consumption (WC) impact across the truck cycle (blue), fuel chain (green), and road infrastructure (orange) for the truck alternatives FCEV, HICEV, BEV and DICEV for the situation in 2025. Emissions during the use phase are represented by diagonal lines in the corresponding colors.
Energies 19 02433 g008
Figure 9. Sensitivity analysis displaying results of the FCEV transport alternative for the impact categories global warming (i), ozone formation, human health (ii), fine particulate matter formation (iii), and water consumption (iv). Emissions during the use phase are represented by diagonal lines in the corresponding colors.
Energies 19 02433 g009
Table 1. Configurations of the different truck alternatives and key values that correspond to the powertrain.
Truck SpecificationsUnitTruck Type
FCEVHICEVBEVDICEV
Truck model [reference] Hyundai XCIENT Fuel Cell (6 × 2T)MAN hTGX
(6 × 4T)
Volvo FH Electric (6 × 4T)Volvo FH (6 × 4T)
Reference[-][43,44][45,46][47,48][47,49]
Truck masskg980010,60012,0008700
Rangekm4006003002700
Max motor powerkW350 (fuel-cell stack 220 kW)381330397
Hydrogen capacitykg31 (at 350 Bar)56 (at 700 Bar)--
Electric (battery) capacitykWh72-540-
Diesel capacityL---800
Total fuel capacitykWh130022005408700
Fuel consumptionkWh/tkm0.1530.1840.0900.162
Refueling and recharging timeh0.15–0.250.15–0.259.5 h at 43 kW (normal), 2.5 h at 250 kW (fast)0.15–0.25
Table 4. Electricity mix in the Netherlands (NL) in 2024.
SituationNL Electricity Mix 2024
Solar power19%
Wind power—offshore15%
Wind power—onshore13%
Electricity from combined heat and power (CHP)13%
Natural gas25%
Biomass2%
Coal8%
Waste incineration2%
Nuclear3%
Table 5. Environmental impact factors for renewable energy sources per 1 kWh in the Netherlands.
Applied Ecoinvent DatasetGlobal Warming
[kg CO2 eq/kWh]
Ozone Formation (Human Heath)
[kg NOx eq/kWh]
Fine Particulate
Matter Formation
[kg PM2.5 eq/kWh]
Water
Consumption
[m3/kWh]
Solar power0.1040.0002700.0002050.00342
Offshore wind0.01650.00004530.00003080.000157
Onshore wind0.01720.00004390.00003510.000218
Disclaimer/Publisher’s Note: The statements, opinions and data contained in all publications are solely those of the individual author(s) and contributor(s) and not of MDPI and/or the editor(s). MDPI and/or the editor(s) disclaim responsibility for any injury to people or property resulting from any ideas, methods, instructions or products referred to in the content.