1. Introduction
With the rapid development of new power systems, distribution networks are facing profound changes caused by the large-scale integration of renewable energy, deep source–load–storage interaction, and evolving market mechanisms [
1,
2,
3,
4]. Traditional planning evaluation of distribution networks usually adopts a unified indicator framework with fixed dimensions. Such a rigid indicator selection mode is insufficient for capturing differences in regional characteristics, development stages, and operating scenarios, which may weaken key indicators, introduce redundant information, and reduce the accuracy of planning evaluation. Therefore, developing flexible methods for constructing indicator systems that can adapt to the characteristics of new power systems has become an important research topic in planning evaluation.
At present, extensive studies have been conducted, both in China and internationally, on planning evaluation for emerging distribution networks, with the main focus on expanding the dimensions of indicator systems. References [
5,
6] concentrated on the core characteristics of new power systems and integrated traditional indicators with emerging evaluation concepts to construct multidimensional evaluation systems covering aspects such as low-carbon development, flexibility and intelligence, and economic efficiency. To address system complexity, Ref. [
7] introduced a hierarchical framework and established a key-technology evaluation system centered on grid satisfaction, spatiotemporal resources, and effective improvement. For system performance under extreme scenarios, Ref. [
8] further supplemented scenario-specific indicators for extreme weather from the perspectives of adequacy and risk consequences. Ref. [
9] considered the differences between planning and operation stages and proposed a classification method for reliability evaluation indicator systems. Although these studies constructed indicator systems for the evaluation of new power systems, they mainly focused on expanding the indicator library or refining evaluation criteria. A flexible indicator construction method based on scenario classification is still lacking, especially for reflecting differentiated development across regions and planning stages.
Scenario segmentation is a prerequisite for differentiated assessment. Existing research has primarily focused on generating micro-level operational scenarios: References [
10,
11,
12,
13,
14] utilize time-series correlations or deep learning techniques to extract detailed characteristics of source-load fluctuations; while References [
15,
16] focus on the evolution during the planning phase, they are limited to the optimization of the plans themselves. Overall, existing research on scenario segmentation is mostly applied to micro-level simulation calculations, and there is a lack of effective integration with the construction of macro-level indicators. Currently, there is a lack of a practical mechanism capable of directly mapping regional physical characteristics (such as resource endowments and the development status of flexibility resources) to serve as the basis for indicator selection. Consequently, scenario analysis struggles to effectively guide the streamlining and differentiated construction of indicator systems.
Meanwhile, increasing attention has been paid to the ability of data-driven techniques to extract useful information from massive power system datasets [
17]. In feature selection, Refs. [
18,
19,
20] used the maximum relevance and minimum redundancy (mRMR) method to eliminate multicollinearity among input features and reduce information redundancy, while Refs. [
21,
22] applied random forest models to screen indicators from high-dimensional power system features. To further enhance feature selection performance, Ref. [
23] introduced subjective–objective weighting and consistency indicators to capture the coupling effects among indicators. Ref. [
24] developed a composite feature selection unit for efficient feature selection, thereby reducing data dimensionality and alleviating feature redundancy. Ref. [
25] proposed a four-dimensional feature selection framework and showed that jointly considering target contribution and information independence is critical for constructing high-quality indicator sets. Although these data-driven methods have achieved good performance in areas such as fault diagnosis and transient stability assessment, their application to the construction of planning evaluation indicator systems remains limited. A comprehensive quantitative screening mechanism that can simultaneously account for indicator contribution to planning objectives and information redundancy among indicators is still lacking.
To address the above challenges, this paper proposes a data-driven method for constructing planning evaluation indicators for emerging distribution networks. The main contributions of this study are summarized as follows:
A scenario-oriented indicator construction framework is established for county-level distribution networks. Based on an existing comprehensive indicator system, key regional factors are analyzed to classify typical planning scenarios, and initial indicator sets are formed for different scenarios with expert knowledge.
A data-driven indicator screening method is developed by combining the mRMR method and the RF algorithm. Candidate indicators are evaluated from the perspectives of relevance and importance, and a game-theoretic combination strategy with coefficient-of-variation correction is further introduced to obtain the final key indicator set.
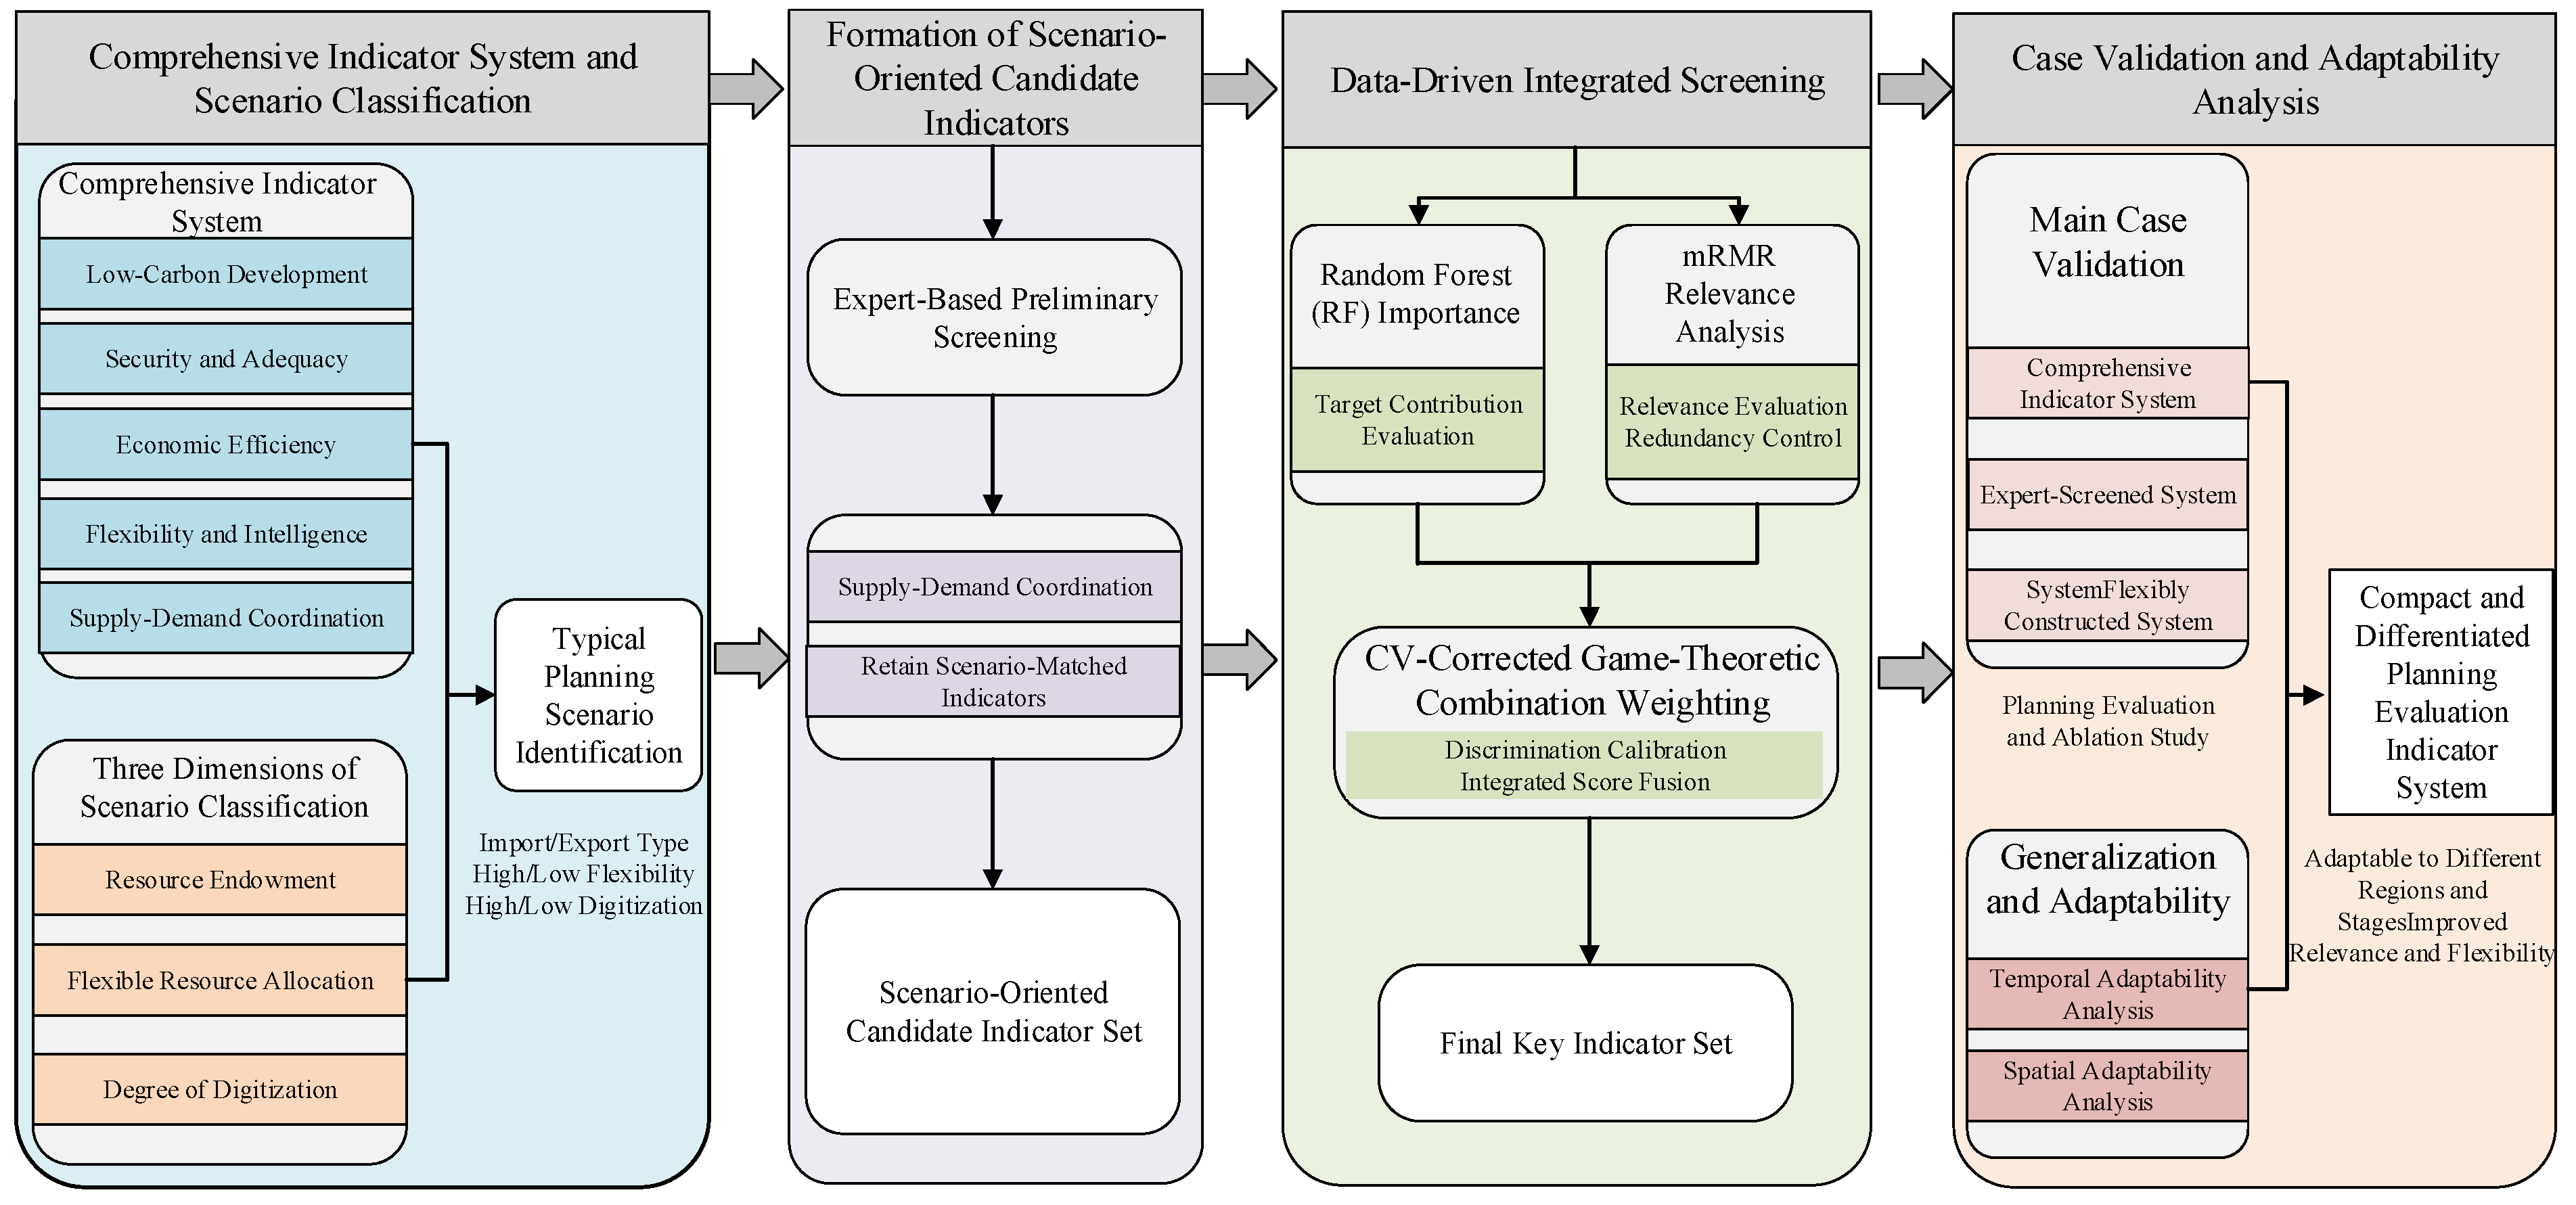
A case study of a county-level distribution network is conducted to validate the proposed method. The results demonstrate that the proposed method can construct a compact yet differentiated evaluation system, thereby improving the relevance and flexibility of planning evaluation. The overall technical framework is shown in
Figure 1.
2. Comprehensive Indicator System for Planning Evaluation of Emerging Distribution Networks
Existing indicator systems for distribution network planning evaluation mainly focus on six aspects: grid structure, load supply, equipment technology, safety and reliability, economic efficiency, and intelligence level. However, they do not adequately reflect key characteristics of emerging power systems, such as low-carbon development, flexible resources, and digital empowerment. Based on an in-depth analysis of the limitations of traditional indicators and the requirements of emerging power systems, a more comprehensive and adaptable indicator system was established, as reported in our previous study [
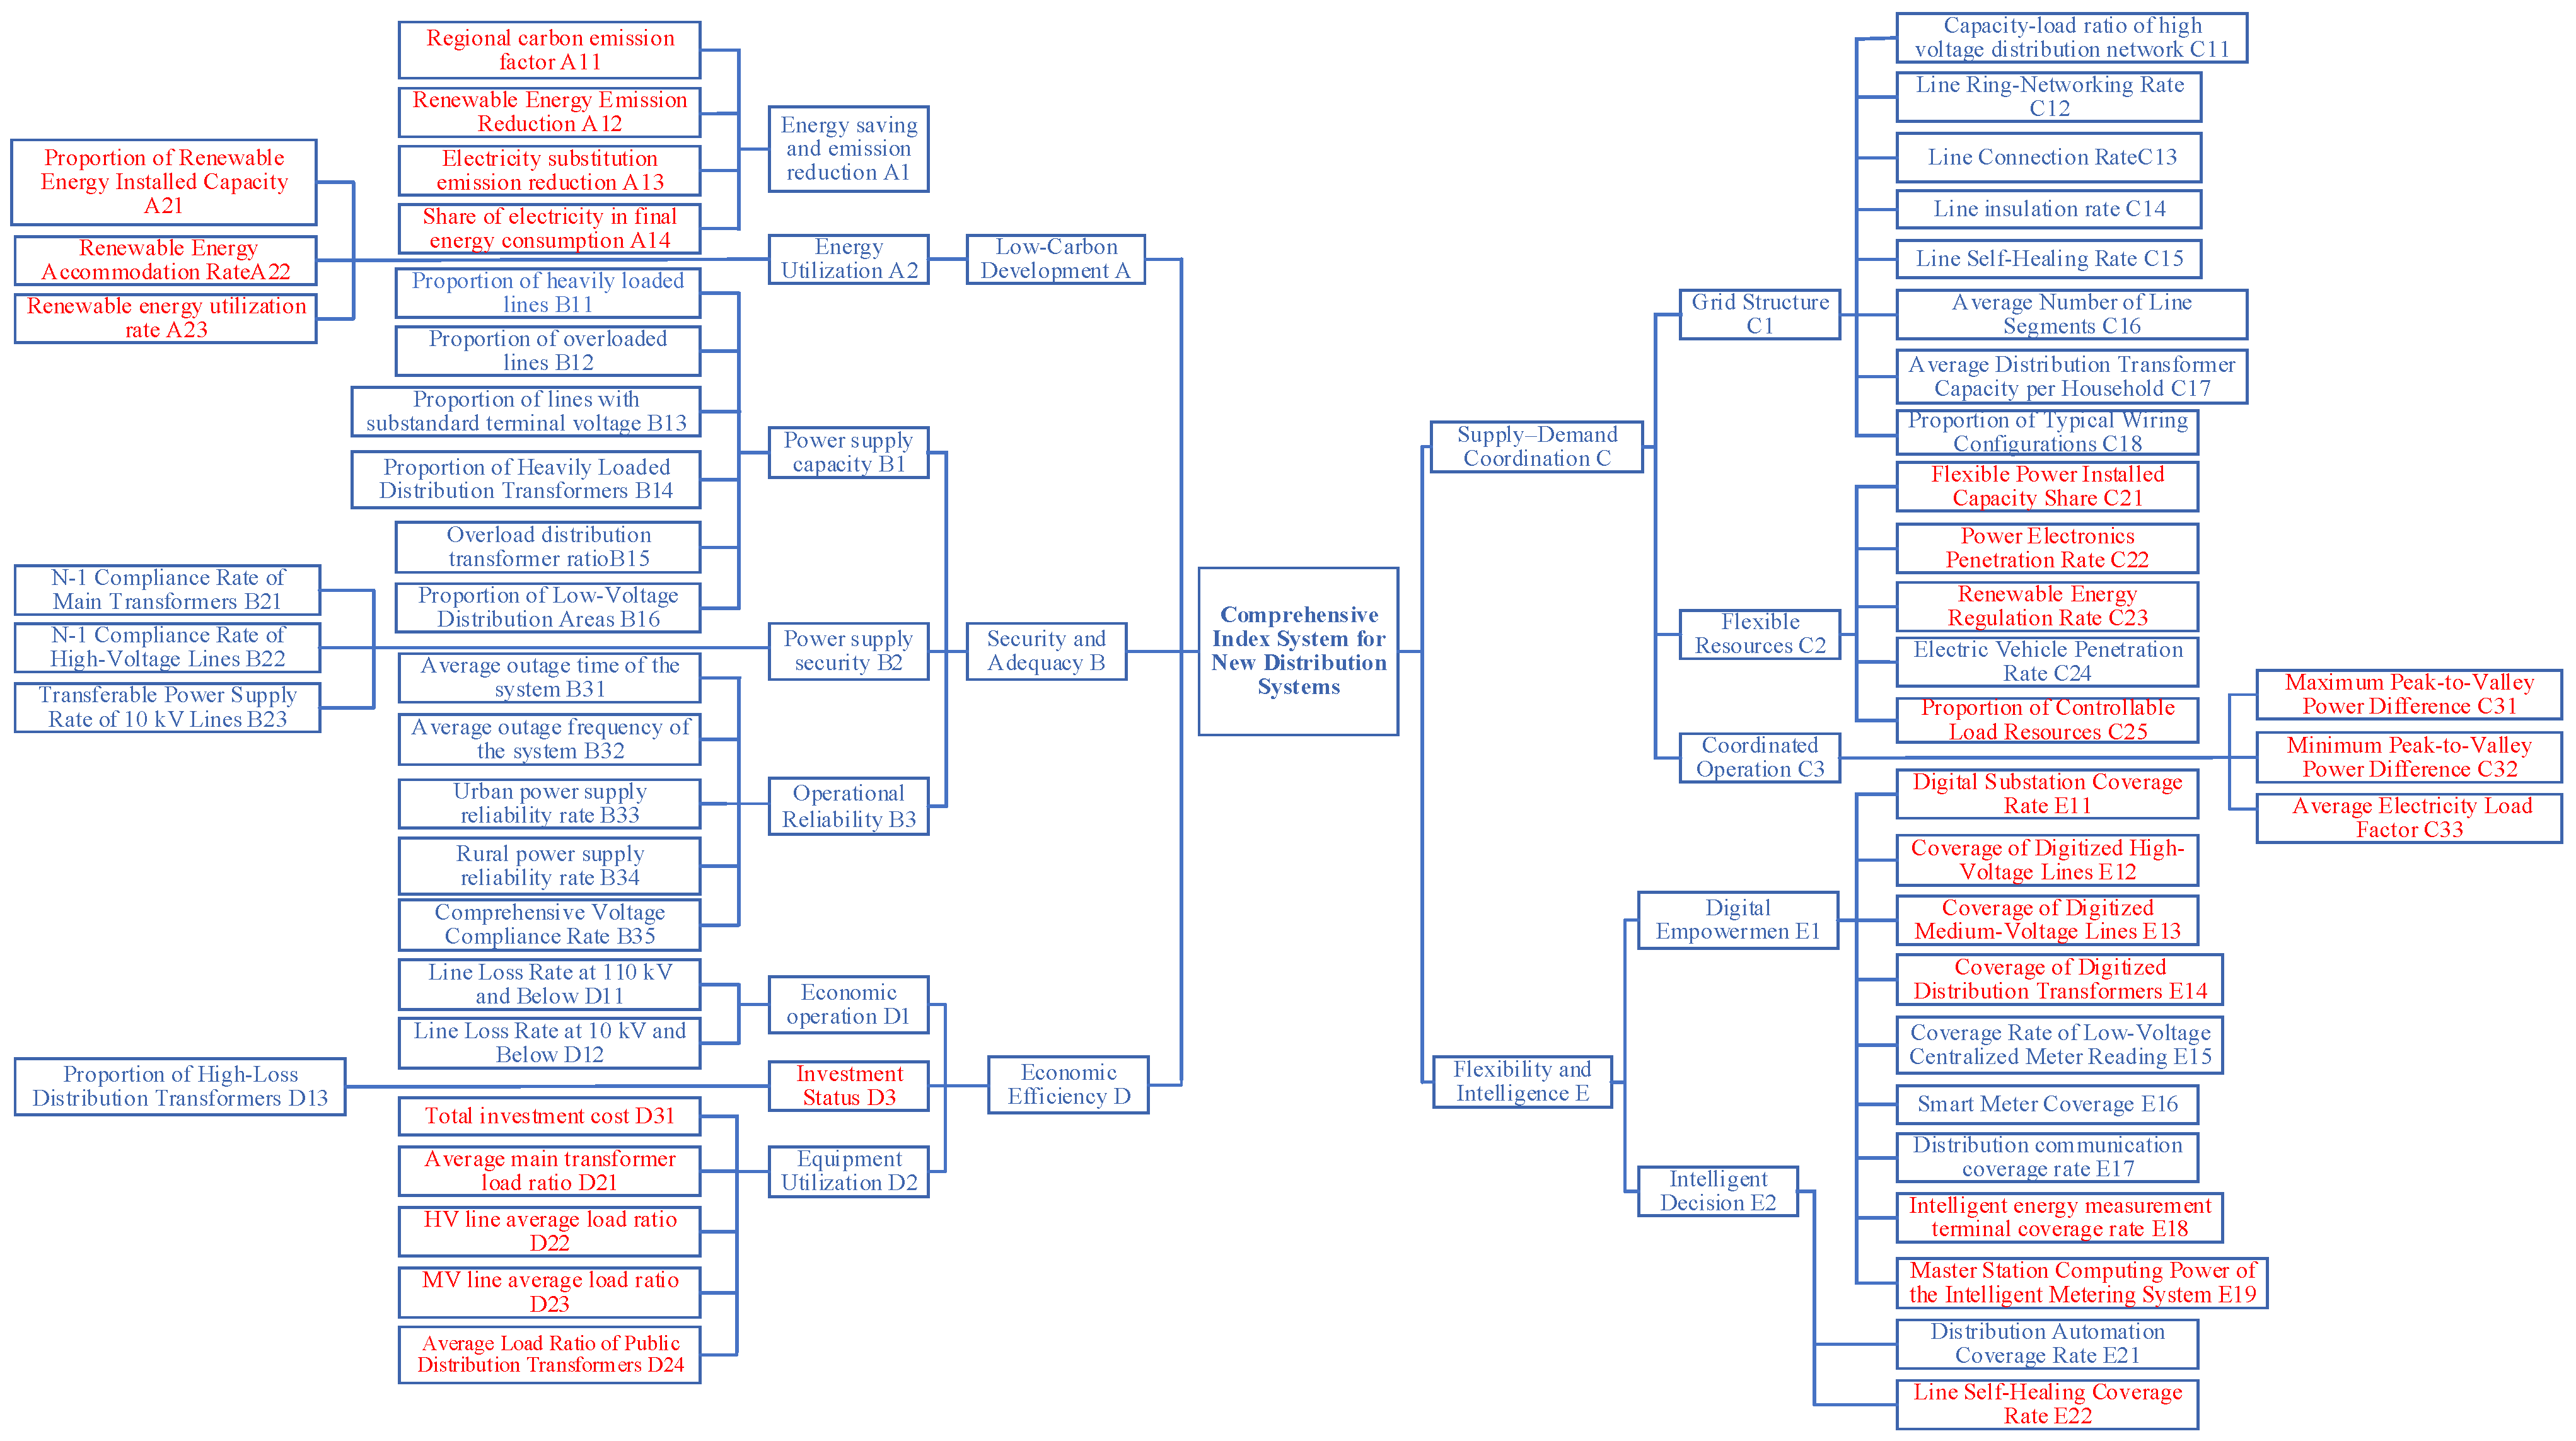
26]. The system is organized into five dimensions: Low-Carbon Development, Security and Adequacy, Economic Efficiency, Flexibility and Intelligence, and Supply–Demand Coordination, including 5 first-level indicators, 13 second-level indicators, and 56 third-level indicators, as shown in
Figure 2.
3. Method for Planning Scenario Classification
The current Technical Guidelines for Distribution Network Planning and Design [
27] mainly classify power supply areas according to administrative level or load density. However, such a single-dimensional classification method cannot effectively reflect the structural differences among regions in terms of renewable energy penetration, source–load interaction capability, and intelligence level. To enhance engineering applicability, this paper reclassifies planning scenarios from three macro dimensions: resource endowment, flexible resource allocation, and digital-intelligent development. Specifically, resource endowment reflects the local resource basis of a region, flexible resource allocation characterizes the region’s active regulation and support capability, and the level of digital-intelligent development represents the digital support capability of the distribution network in perception, communication, and coordinated decision-making. Together, these three dimensions determine the planning concerns and evaluation priorities of different regions in emerging distribution network planning, and can therefore serve as the core basis for scenario classification.
3.1. Resource Endowment
The resource-endowment dimension mainly characterizes the scale of exploitable local energy resources in a region and its energy exchange with external systems. Drawing on the load-density-based supply-area classification principle in the Technical Guidelines for Distribution Network Planning and Design and the two-dimensional “load density–power density” classification method reported in the literature [
28], this study classifies regional resource endowment according to the relative relationship between energy density and load density, in combination with the characteristics of county-level distribution-network planning evaluation. Accordingly, regions are classified into two types: energy-import type and energy-export type.
Considering that this study focuses on macro-level scenario identification at the planning stage, the energy side is represented by total installed capacity per unit area to characterize regional supply potential, while the load side is represented by maximum supplied load per unit area to characterize the regional demand boundary. The corresponding formulas and classification criteria are given in Equations (1) and (2) and
Table 1.
Energy Import Type: Local energy resources are relatively scarce or remain underdeveloped, and the regional load demand is mainly satisfied by external energy supply.
Energy Export Type: The region is rich in exploitable clean energy resources, and the local energy production capacity significantly exceeds its own demand, thereby exhibiting strong potential for outward energy transmission.
where
denotes the energy density,
denotes the load density,
is the total installed capacity, and
is the power supply area.
3.2. Flexible Resource Allocation
Flexible resource allocation is a key dimension for measuring the active support and regulation capability of county-level distribution networks. Considering that this study focuses on the macro-level classification of typical planning scenarios at the county scale, and in order to ensure the simplicity and operability of the classification rules, the share of flexible power installed capacity (
) is adopted as the core indicator for judgment. The corresponding formula and classification criteria are shown in Equation (3) and
Table 2.
where
represents the installed capacity of flexible energy sources, and
represents the installed capacity of clean energy sources. In this study, the 10% threshold is adopted as an engineering criterion to distinguish relatively low and high flexible-support capability at the county-planning level, with emphasis on simplicity and operability in macro scenario classification. It should also be noted that the characterization of flexibility is not limited to the power-source side. In the comprehensive indicator system and the subsequent screening process, grid-side and load-side flexibility-related indicators are also incorporated, such as the penetration rate of power-electronic equipment, the renewable-energy regulation rate, and the proportion of controllable load resources, so as to reflect the flexible regulation capability of the distribution system under source–grid–load coordination.
3.3. Degree of Digitization
The degree of digitization reflects the core level of digital coverage in sensing, communication, and key equipment within the distribution network. Considering that the digitization level of county-level distribution networks is primarily manifested in substations, lines, and distribution equipment, a comprehensive Digital Smart Index (
) is constructed for evaluation. The four categories of indicators are aggregated using a weighted method. The weighting accounts for the balance between the main grid support function and distribution-side sensing and control requirements, and is determined based on prior research and expert opinions. The calculation formula and judgment criteria are presented in
Table 3 as follows:
where
represents the coverage rate of digitized substations,
the coverage rate of digitized high-voltage lines,
the coverage rate of digitized medium-voltage lines, and
the coverage rate of distribution transformers.
The 75% threshold adopted in this study was estimated with reference to relevant staged digital-grid development targets and converted according to the weighting structure of Equation (4). Therefore, it is intended as an engineering criterion for county-level macro scenario identification, rather than as a universally optimal cut-off value.
3.4. Typical Planning Scenarios
Based on the binary classification results of the three dimensions described above, namely resource endowment, flexible resource allocation, and degree of digitization, eight representative typical planning scenarios are ultimately identified. This scenario combination framework can preserve the main differences among county-level distribution networks in terms of resource basis, regulation capability, and digital support capability, while also ensuring clear engineering interpretability and practical operability of the classification results. The detailed classification is shown in
Table 4.
3.5. Preliminary Construction of the Evaluation Indicator System Based on Expert Knowledge
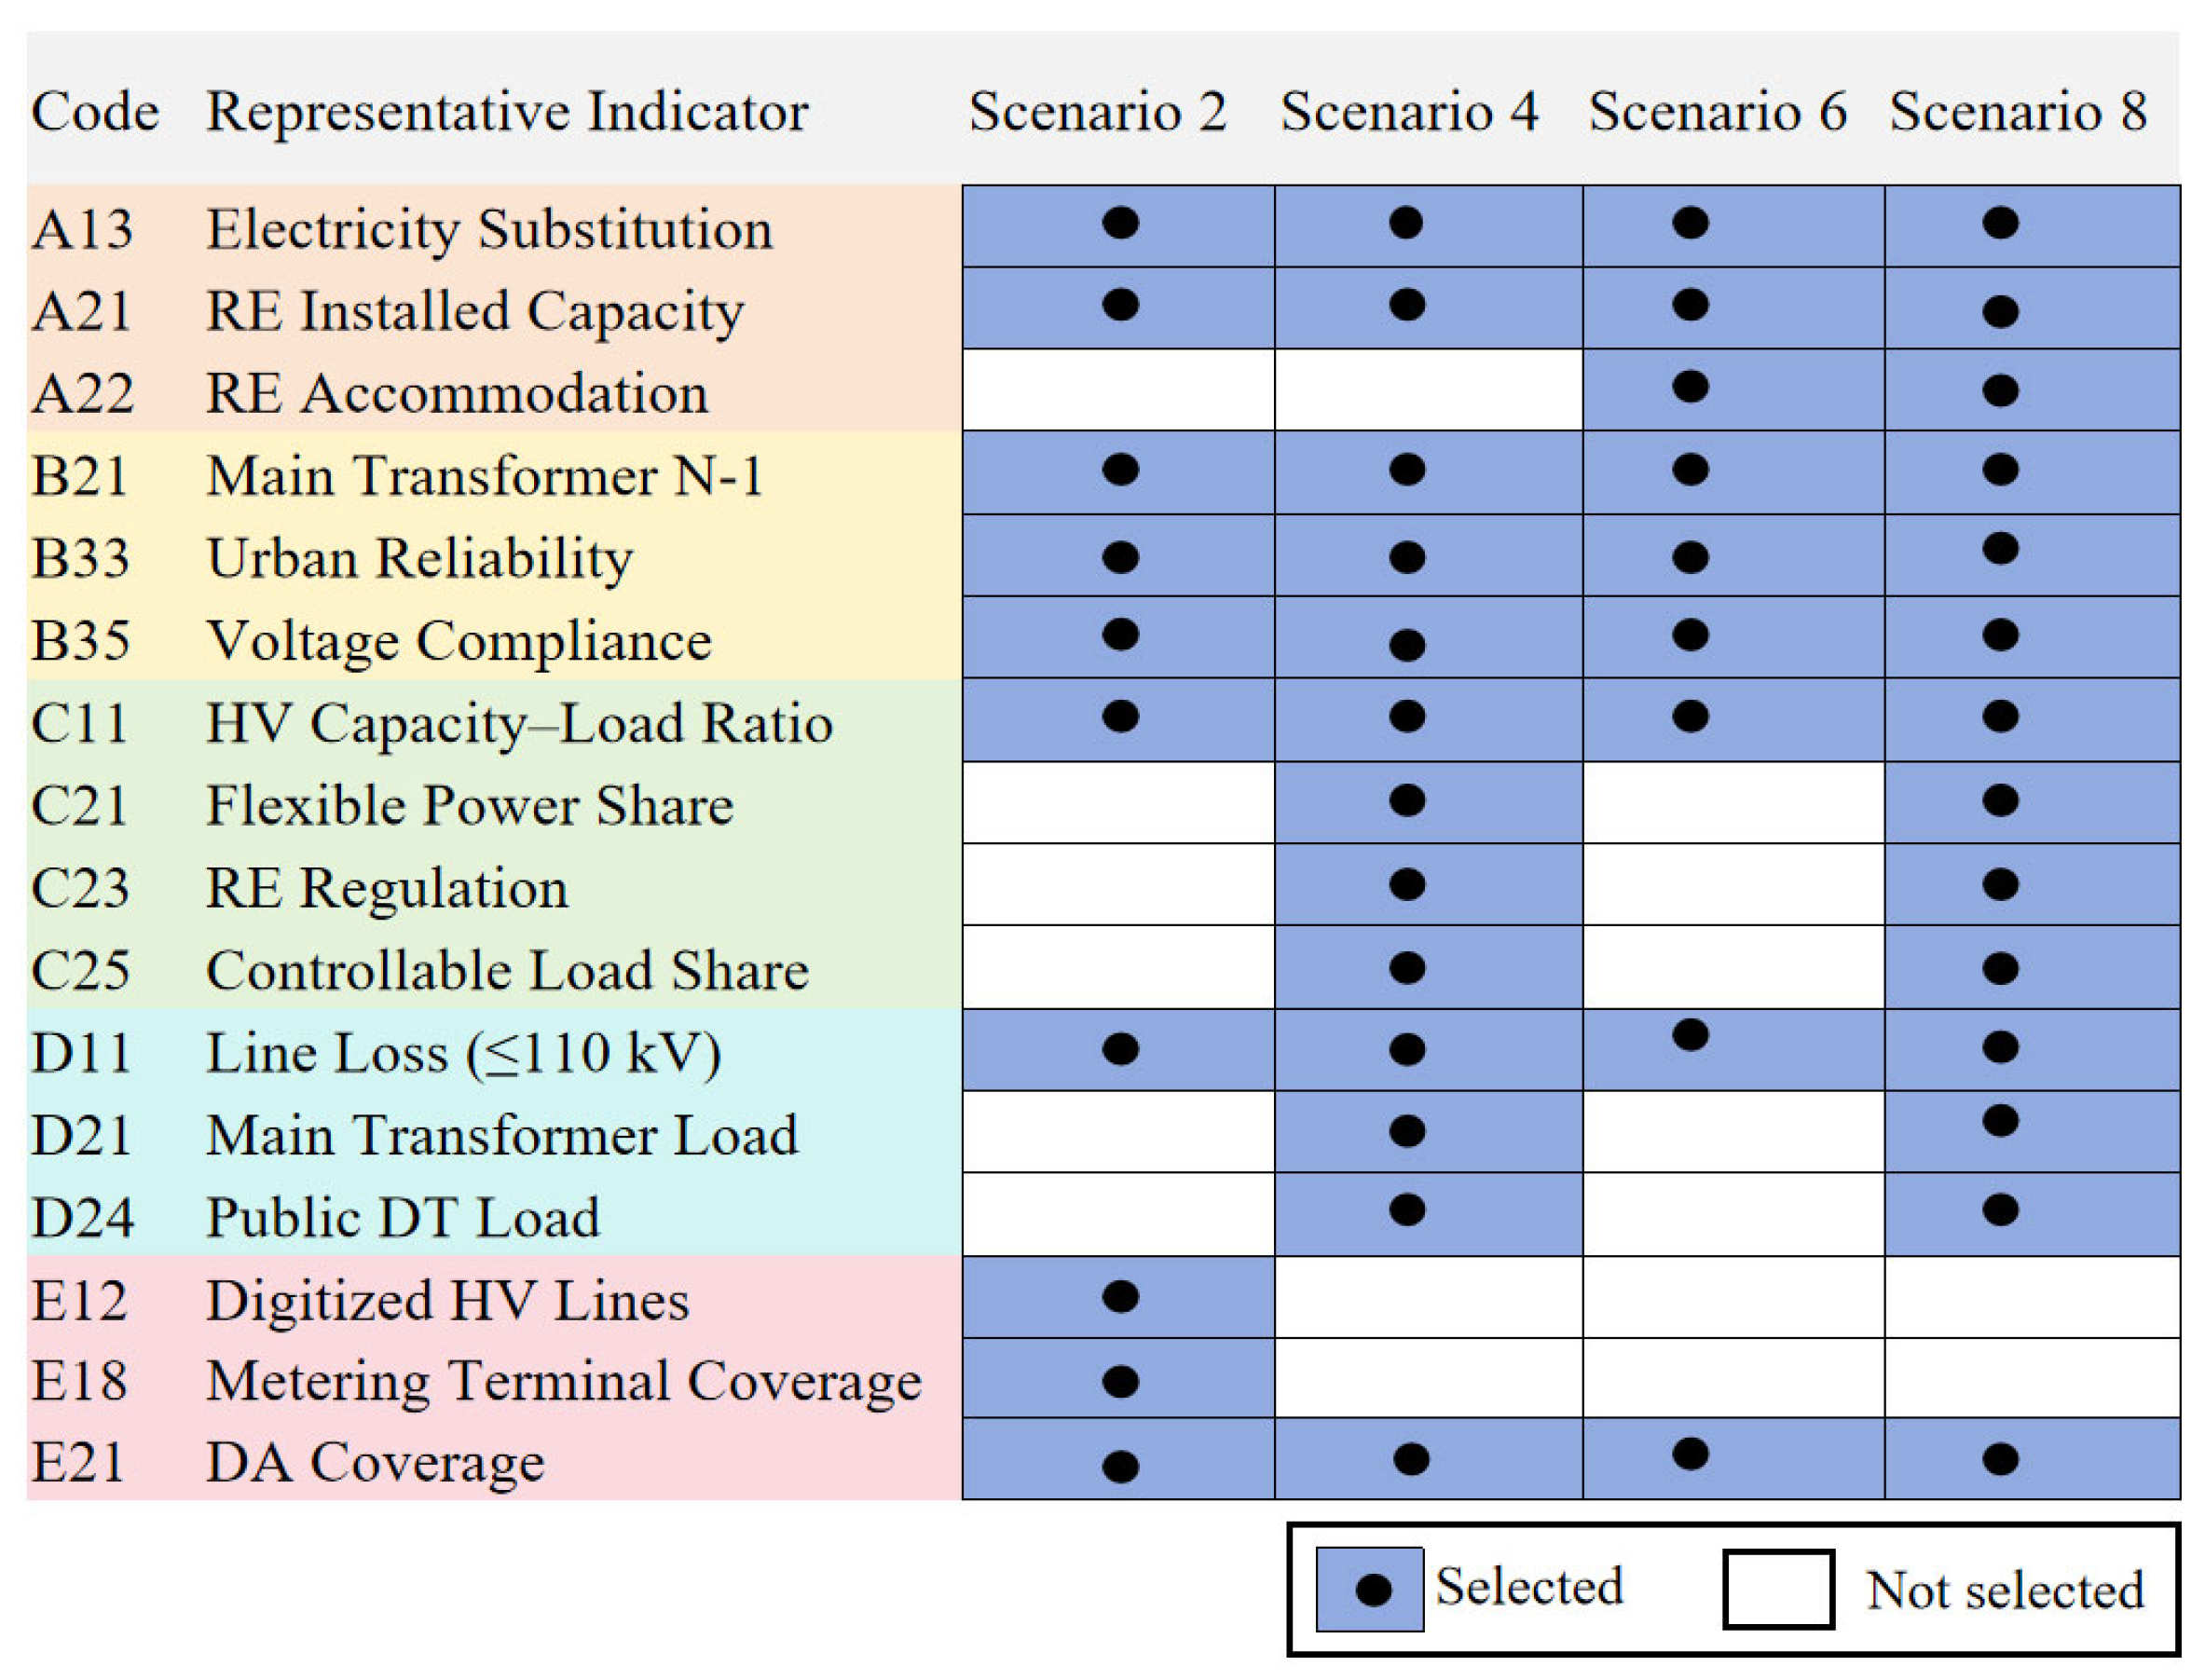
The construction of a distribution network planning evaluation indicator system should not only follow the operational characteristics of the power grid but also reflect differences in regional macro development environments. In particular, policy orientation and economic development trends directly affect the applicability and priority of specific indicators under different planning scenarios. Therefore, a preliminary indicator construction method based on expert knowledge is introduced. Relying on the industry insight and forward-looking judgment of domain experts, this method performs macro-level qualitative screening for each planning scenario, removes indicators that are clearly inconsistent with regional development positioning or policy constraints, and ensures the directional appropriateness of the candidate indicator set. It should be emphasized that expert knowledge in this study is used only for preliminary construction and directional correction, rather than for directly determining the final indicators. Expert knowledge is not used to assign final weights. Instead, the candidate indicators are further screened and refined through the subsequent data-driven procedures, so as to reduce subjective influence and improve the rationality of indicator selection.
Figure 3 shows a selection of representative indicators identified by experts under various typical planning scenarios.
4. Data-Driven Flexible Indicator Construction Method
Although expert knowledge can preliminarily select indicators consistent with subjective experience and macro-level guidance, to further enhance the objectivity and accuracy of indicator selection, a data-driven approach is applied to analyze the expert-constructed evaluation indicator system, forming a planning evaluation indicator system for distribution networks that adapts to diverse scenario requirements.
4.1. Random Forest Importance Analysis
Distribution network planning evaluation involves multi-source heterogeneous data, where the impact of each candidate indicator on the final planning scheme exhibits nonlinear and interactive characteristics. To overcome the limitations of traditional linear analysis methods, the Random Forest algorithm [
29] is employed to identify key driving factors. RF, an ensemble learning-based model, fits data through multiple decision trees and demonstrates strong noise robustness and generalization capability.
During the model construction stage, the simplified indicator set preliminarily screened by experts is used as the input feature set:
where
denotes the data of the j-th indicator. The target variable is defined as a scheme label, denoted by
, which is constructed from scheme-related indicator data based on the county-level 14th Five-Year Distribution Network Plan and related supplementary planning materials. Rather than representing a single economic metric or a direct expert score, this label is used to describe the overall characteristics of different planning schemes. In this study, it is introduced only as an auxiliary supervision signal for indicator screening.
To improve the stability and reproducibility of model training, the RF model is implemented with 100 decision trees, a fixed random seed, and parallel computation, while the remaining parameters are kept at their default settings. Before training, the input features are normalized. Missing values are imputed by column means and, if necessary, further filled with zeros [
30]. The RF importance score of indicator
, denoted by
, is defined as the weighted average impurity reduction contributed by this indicator over all tree-splitting processes, and is calculated as follows:
where
is the total number of decision trees,
denotes the set of all nodes in the k-th decision tree, and
represents the impurity reduction achieved by splitting node
using indicator
. A larger value of
indicates that the indicator is more important to the planning evaluation result.
4.2. mRMR Relevance Analysis
The maximum relevance and minimum redundancy (mRMR) method [
31] is a filter-based feature selection algorithm. Its core idea is to maximize the relevance between the selected indicators and the target variable while minimizing the redundancy among the selected indicators.
Mutual information
is the basic measure of relevance between variables. Under the mutual information quotient (MIQ) criterion, mRMR ranks candidate indicators by jointly considering their relevance to the target variable and the redundancy among indicators. In the present implementation, continuous indicators are first processed by Min–Max normalization and then ranked under the MIQ criterion in the mRMR procedure. The mutual information between indicator
and target variable
is defined as
According to the mutual information quotient (MIQ) criterion, the objective function of mRMR,
is defined as
where
denotes the mutual information between indicator
and the target variable
,
is the average mutual information between the indicators in the set and the target variable;
denotes the mutual information between indicators
and
;
represents the mutual information among indicators within the set. Moreover,
and
denote the probability distributions of indicator
and target variable
, respectively, and
denotes their joint probability distribution.
Since the mRMR algorithm outputs ranking results rather than directly usable quantitative scores, this study adopts a linear order-preserving mapping based on ranking position to convert the ranking result into a quantitative relevance score for subsequent fusion analysis. The mRMR relevance score of indicator
, denoted by
, is defined as
where
is the total number of valid ranked indicators, and
denotes the position of indicator
in the mRMR ranking list. This transformation is not intended to represent an exact mutual-information magnitude; rather, it is used to preserve the ranking information produced by mRMR and provide a consistent quantitative input for the subsequent combination step.
4.3. CV-Corrected Game-Theoretic Fusion Strategy
RF and mRMR evaluate candidate indicators from the perspectives of importance and relevance, respectively, and their results are complementary. To comprehensively utilize the two types of evaluation information and avoid the final ranking being dominated by a single method, this study proposes a game-theoretic combination method corrected by the coefficient of variation (CV) to fuse the two sets of scores.
The purpose of this strategy is to determine the initial combination coefficients for the RF and mRMR score vectors through a game-theoretic procedure. First, the previously obtained RF importance score vector and mRMR relevance score vector are normalized and denoted by and , respectively.
Using the idea of game theory, a balance point between different evaluation methods is sought so that the deviation between the final combined weight and the original weights is minimized, thereby obtaining a more reasonable comprehensive weight [
32]. The combined comprehensive importance vector is expressed as
where
and
are the initial coefficients of the linear combination. The optimization objective is to minimize the deviation between the combined comprehensive importance vector
and the original score vectors
and
. The objective function and constraints are given by
According to the first-order optimality condition for minimizing the objective function, the problem can be transformed into the following matrix equation:
By solving the above equation, the initial combination coefficients and can be obtained.
- 2.
Calculation of the Calibration Factors Based on the Coefficient of Variation
Different methods produce score vectors with different levels of dispersion, and their ability to distinguish candidate indicators also varies. In general, a larger dispersion of the score vector indicates a stronger ability of the method to distinguish differences among indicators. To reflect this internal discrimination capability, the coefficient of variation is introduced for calibration [
33]. The coefficient of variation of the score vector
corresponding to method
is defined as
where
is the standard deviation of all elements in the score vector, and
is the mean value of all elements in the score vector. The adjustment factor of method
is then defined as
The final normalized combination coefficient is given by
- 3.
Calculation of the Final Comprehensive Importance Score
The original normalized score vectors are then weighted and averaged using the final combination coefficients, and the final comprehensive importance score of each indicator is obtained as
where
and
denote the normalized RF importance score and mRMR relevance score of indicator
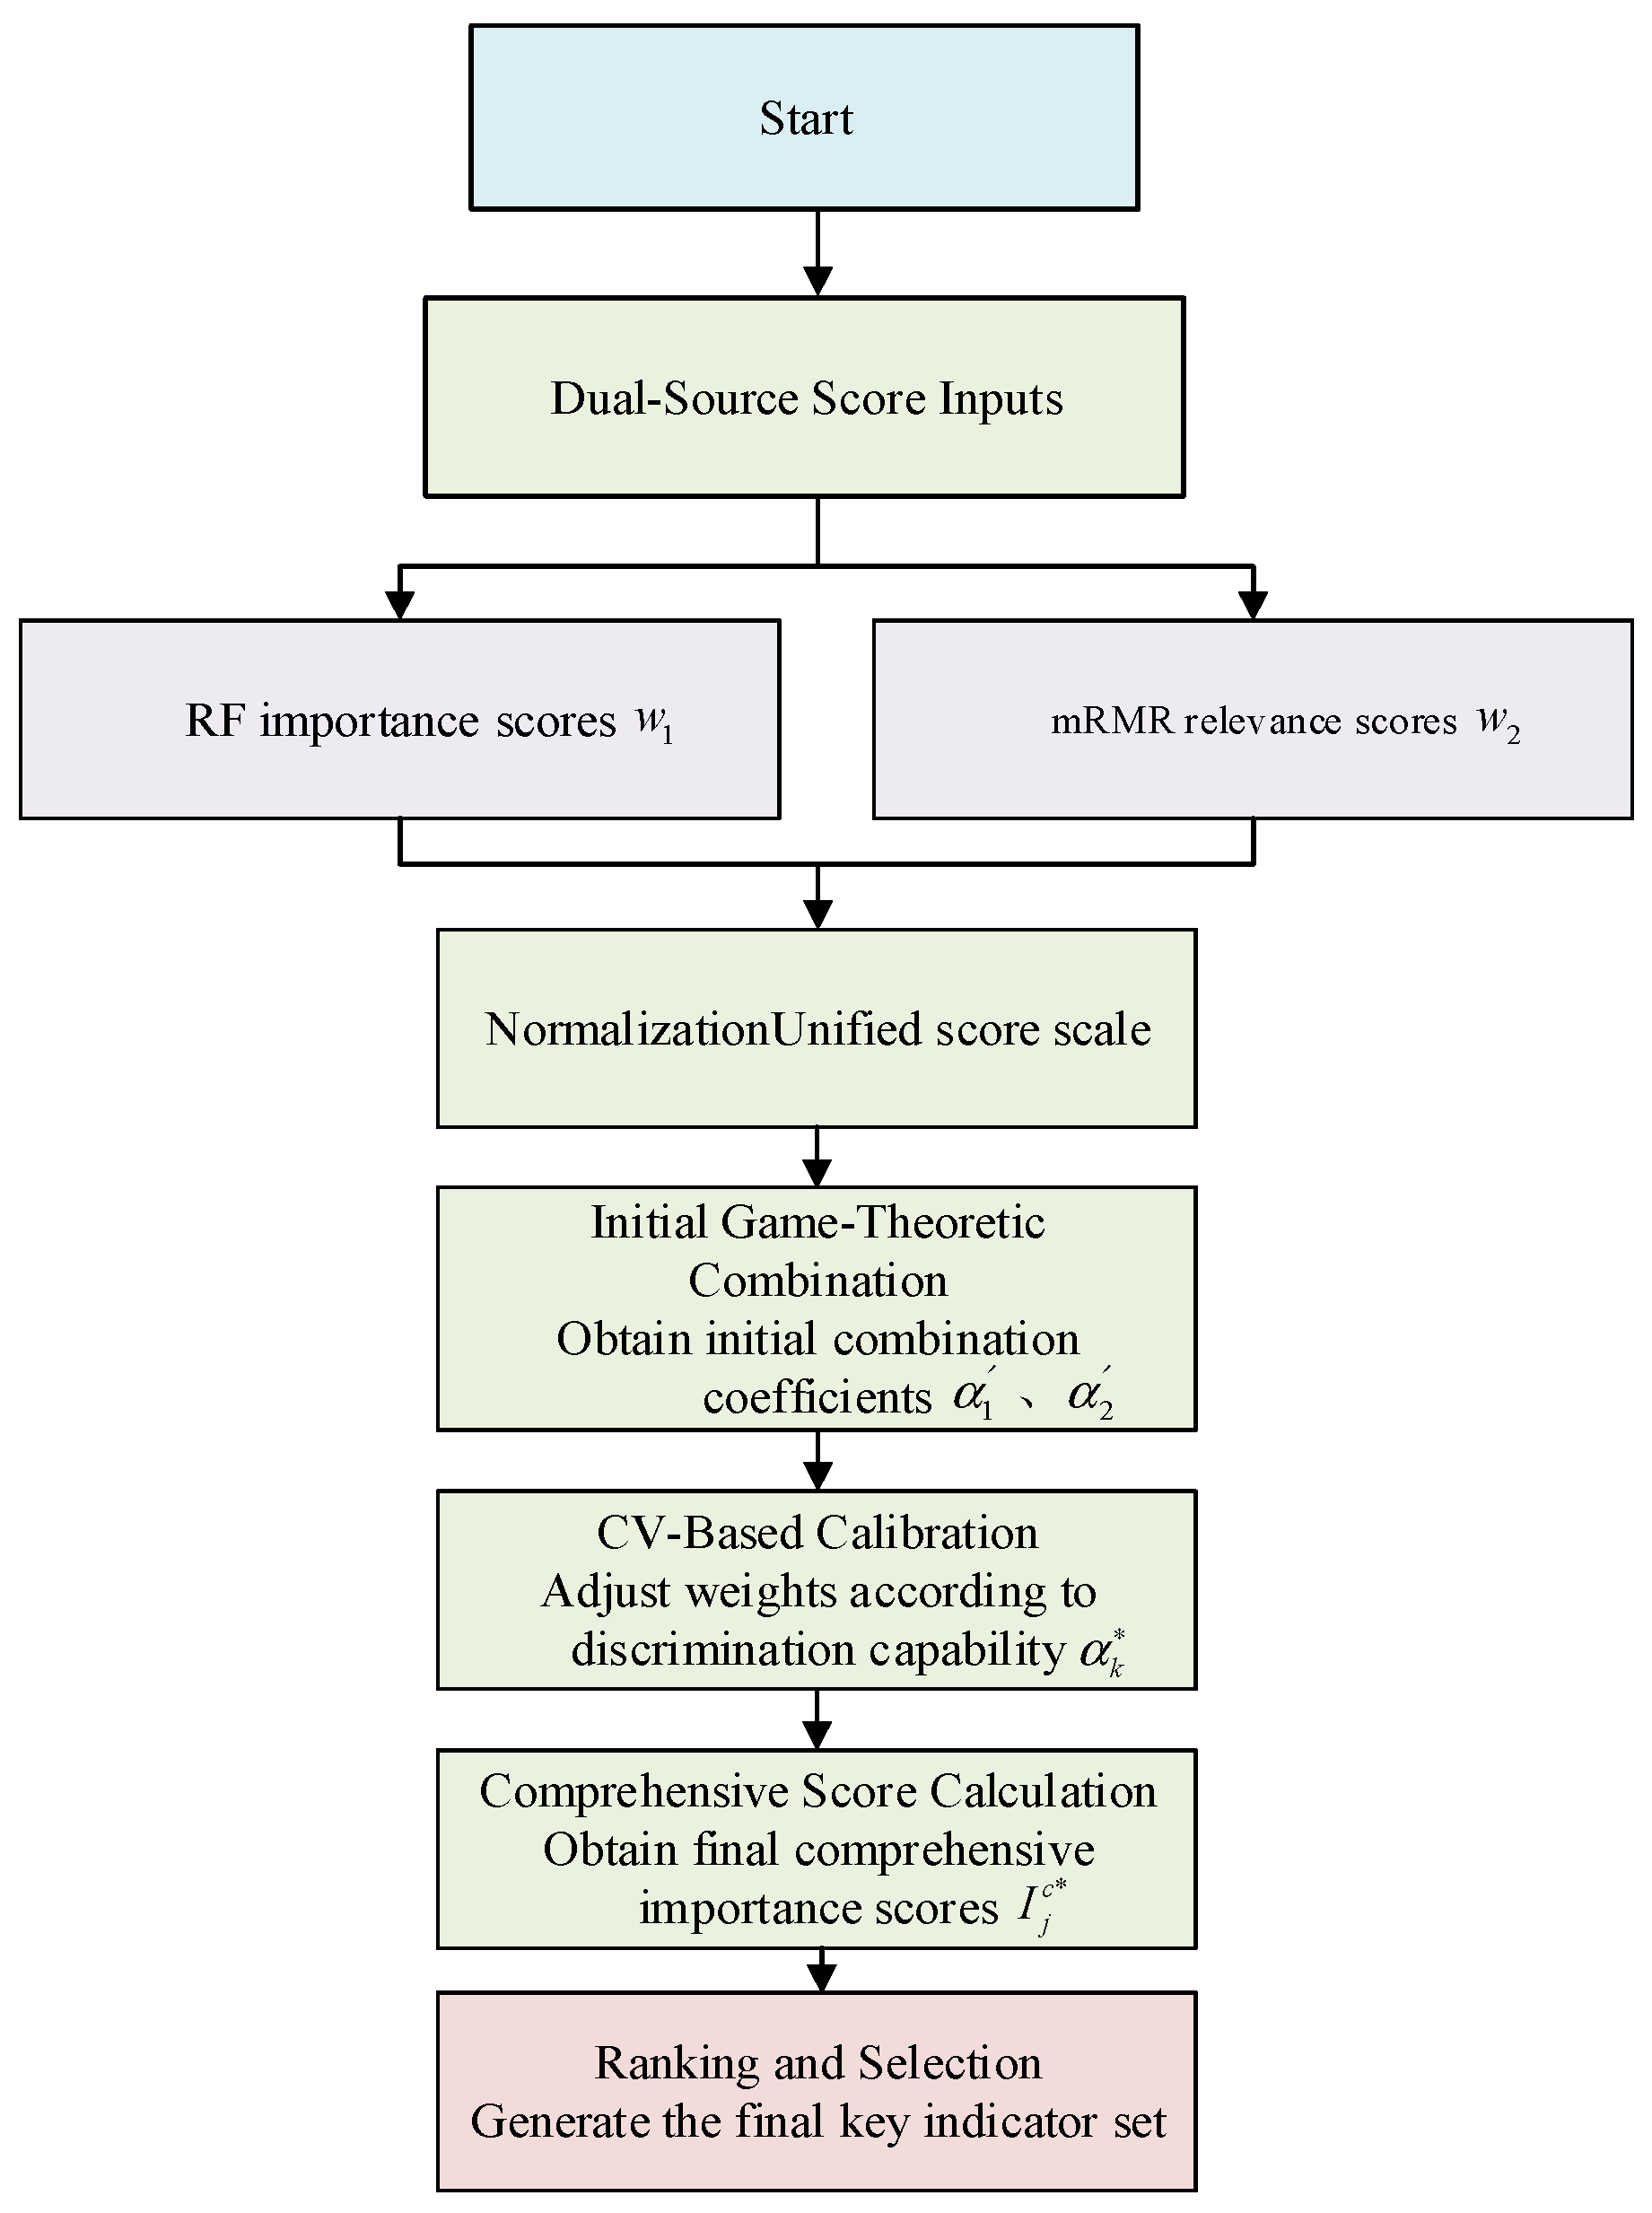
, respectively. The overall data-driven workflow is illustrated in
Figure 4. It should be noted that this strategy is mainly used for the practical fusion of RF and mRMR scores in the present study, rather than as a theoretically proven optimal weighting scheme.
5. Case Study
To verify the applicability and effectiveness of the proposed data-driven method for constructing planning evaluation indicators for emerging distribution networks, County A was selected as the case study. The relevant data were supplemented based on the county’s “14th Five-Year” distribution network planning data and were appropriately desensitized. The basic characteristics of County A are summarized in
Table 5.
5.1. Basic Characteristics of County A and Scenario Identification
The basic characteristics of County A in the present year and the planning year are listed in
Table 5. As shown in the table, the energy density of County A is much lower than its load density, indicating a typical energy-import type feature. In the present year, the proportion of flexible power installed capacity is 3.23%, and the DSI is 85.71%. In the planning year, the proportion of flexible power installed capacity increases to 10.42%, and the DSI reaches 89.57%, indicating a relatively high level of intelligent application and an overall trend toward high digitization. Based on the above analysis, the typical planning scenarios of County A are identified as shown in
Table 6.
County A is representative because it exhibits a typical energy-import characteristic at the county level and spans two planning stages, which makes it suitable for examining how the indicator system changes with evolving flexibility-resource allocation and digitization level under the same resource-endowment type.
5.2. Indicator Construction for Scenario 2
Based on expert knowledge, a total of 36 indicators were initially selected for Scenario 2, and the corresponding indicator data are listed in
Table 7.
5.2.1. Screening Results of RF and mRMR
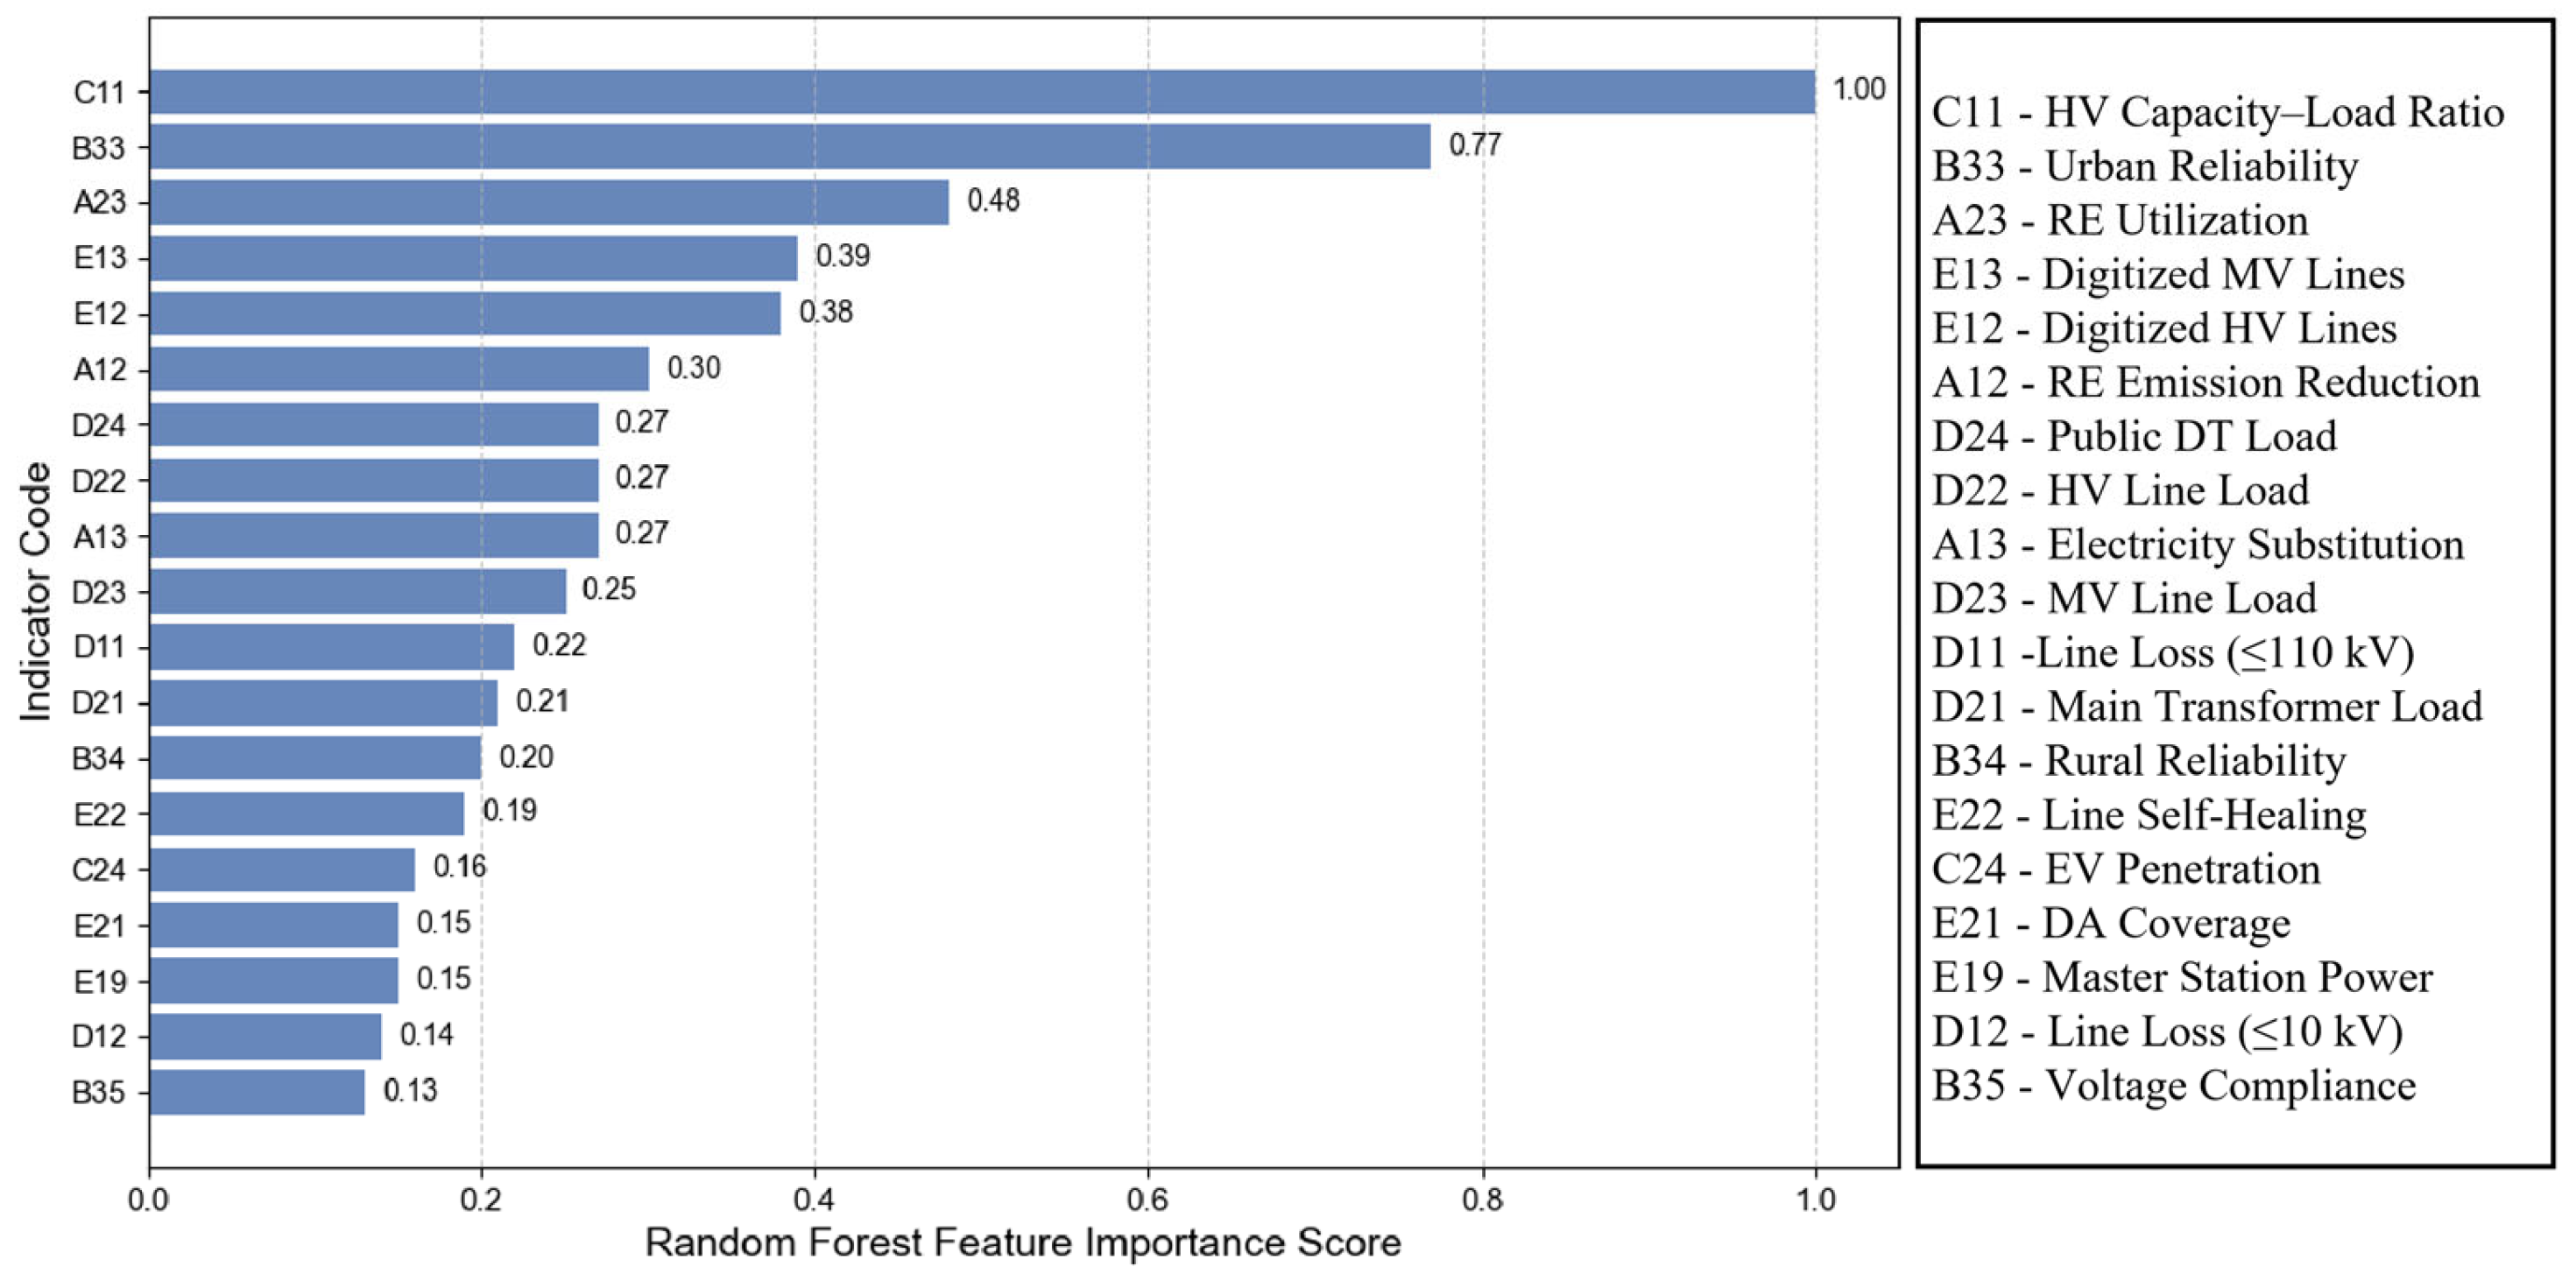
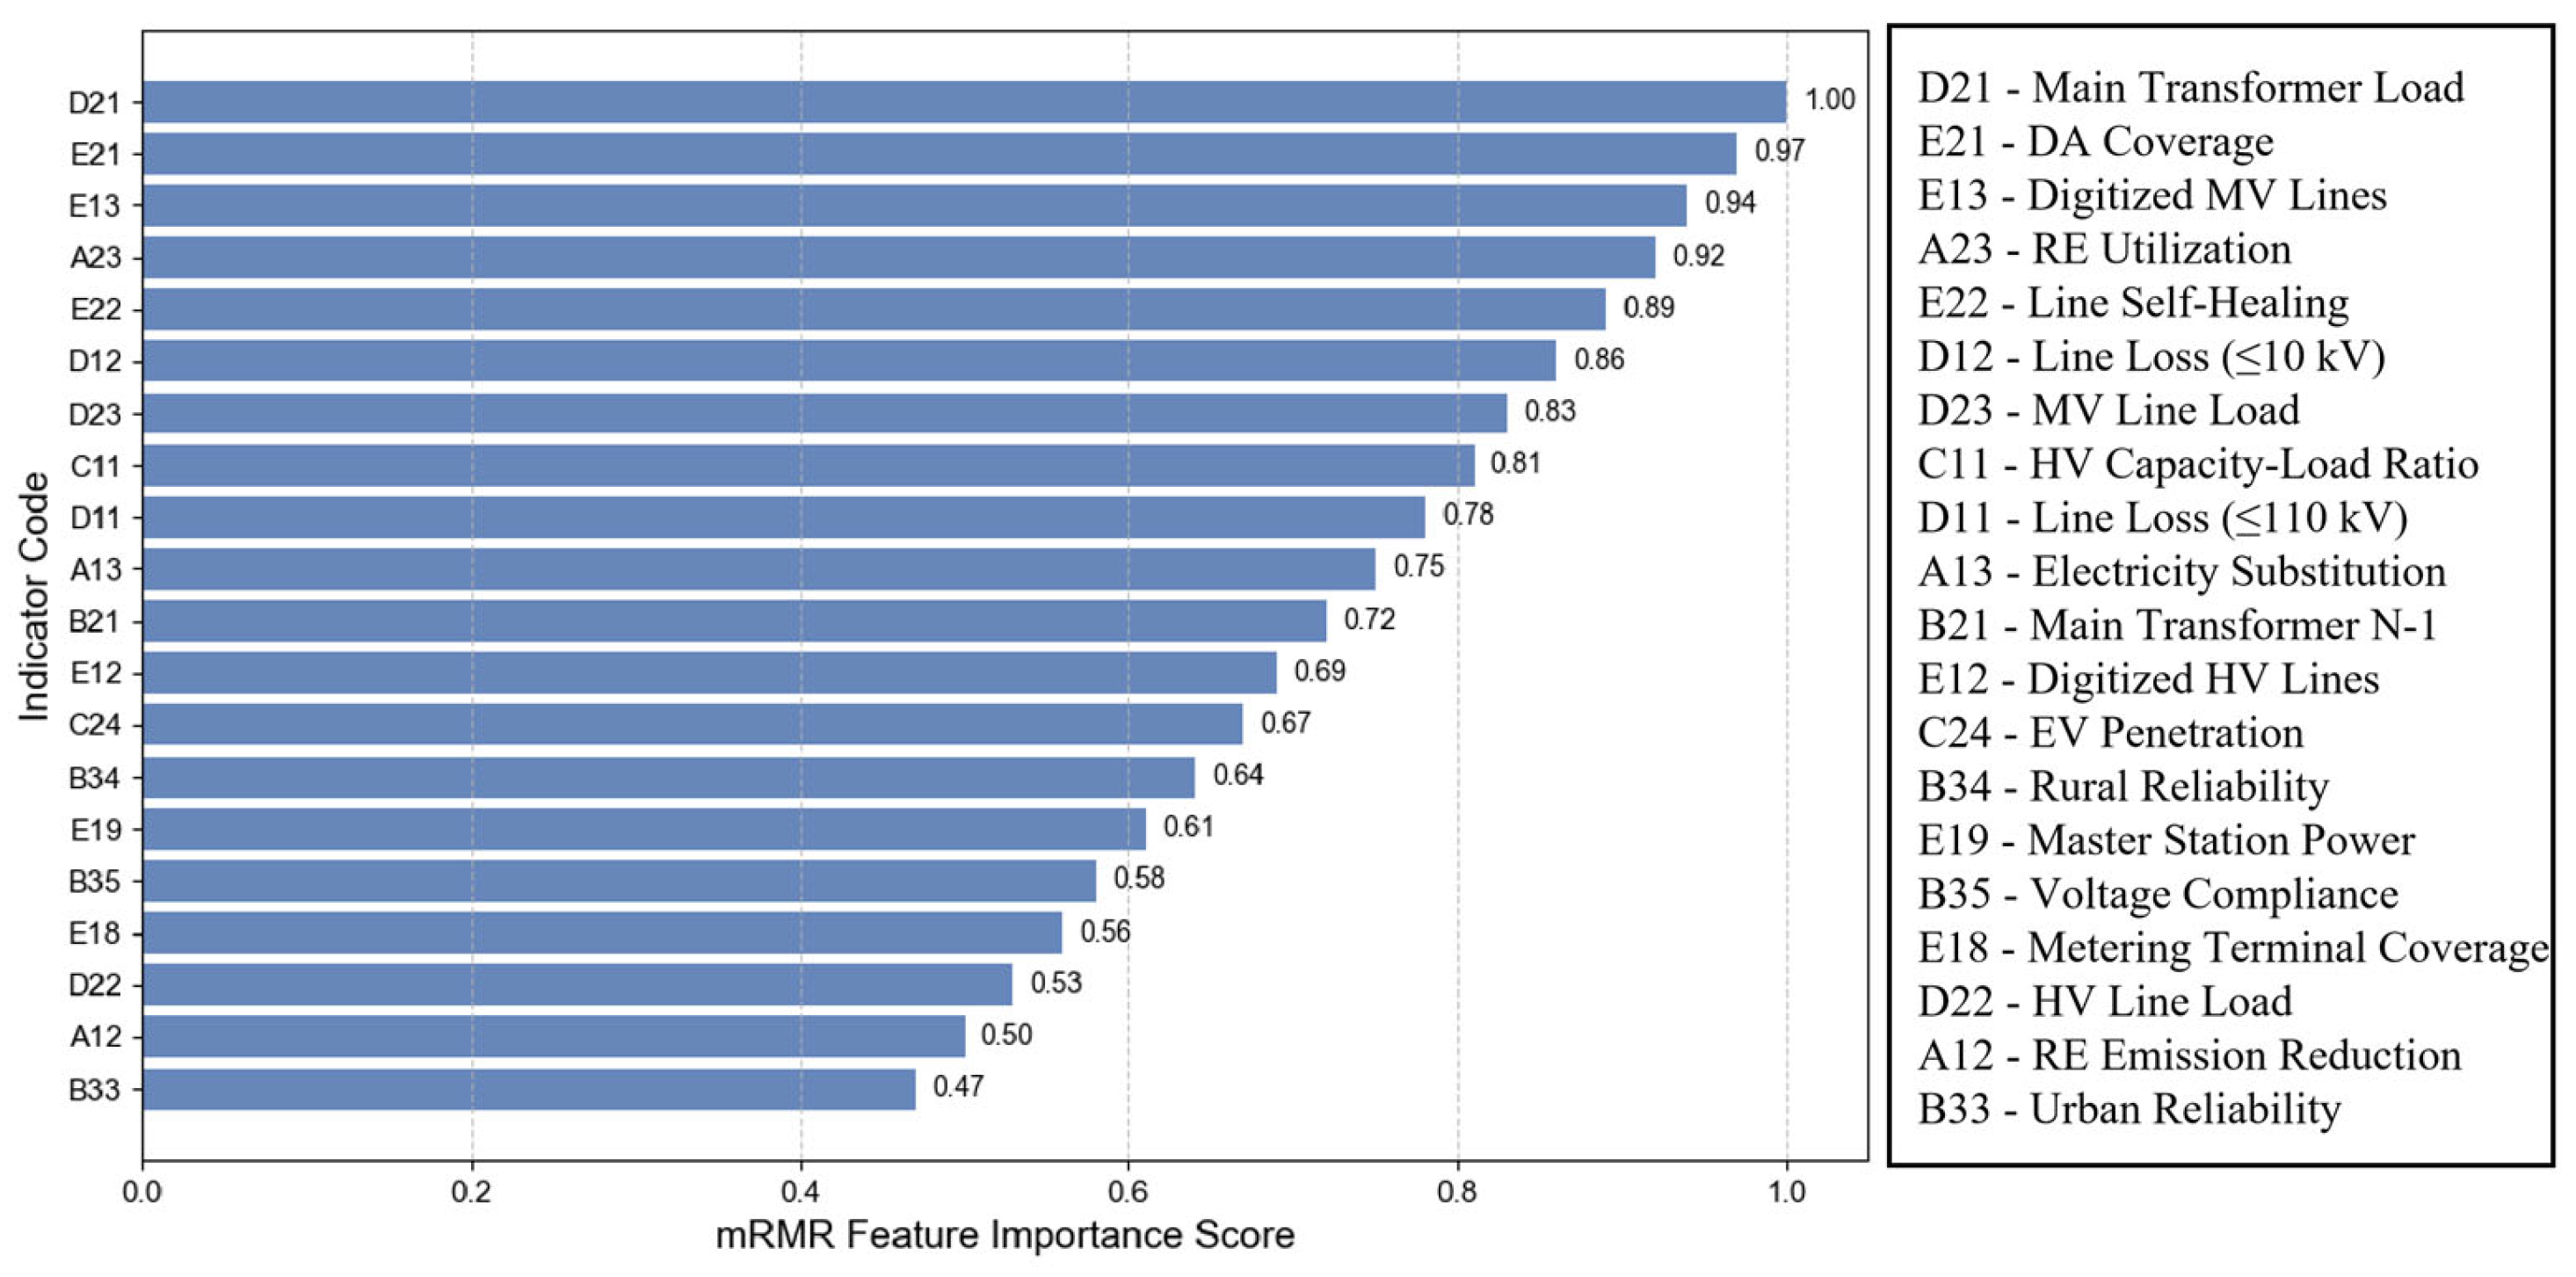
The candidate indicators were evaluated in terms of importance and relevance using the RF algorithm and the mRMR method, respectively. The screening results are shown in
Figure 5 and
Figure 6.
Overall, the screening results of the two methods show a certain degree of consistency. The top-ranked indicators are mainly concentrated in aspects such as grid carrying capacity, renewable energy utilization, and digital support capability, indicating that these indicators have strong representativeness for planning evaluation under Scenario 2.
5.2.2. Comprehensive Screening Based on the CV-Corrected Game-Theoretic Method
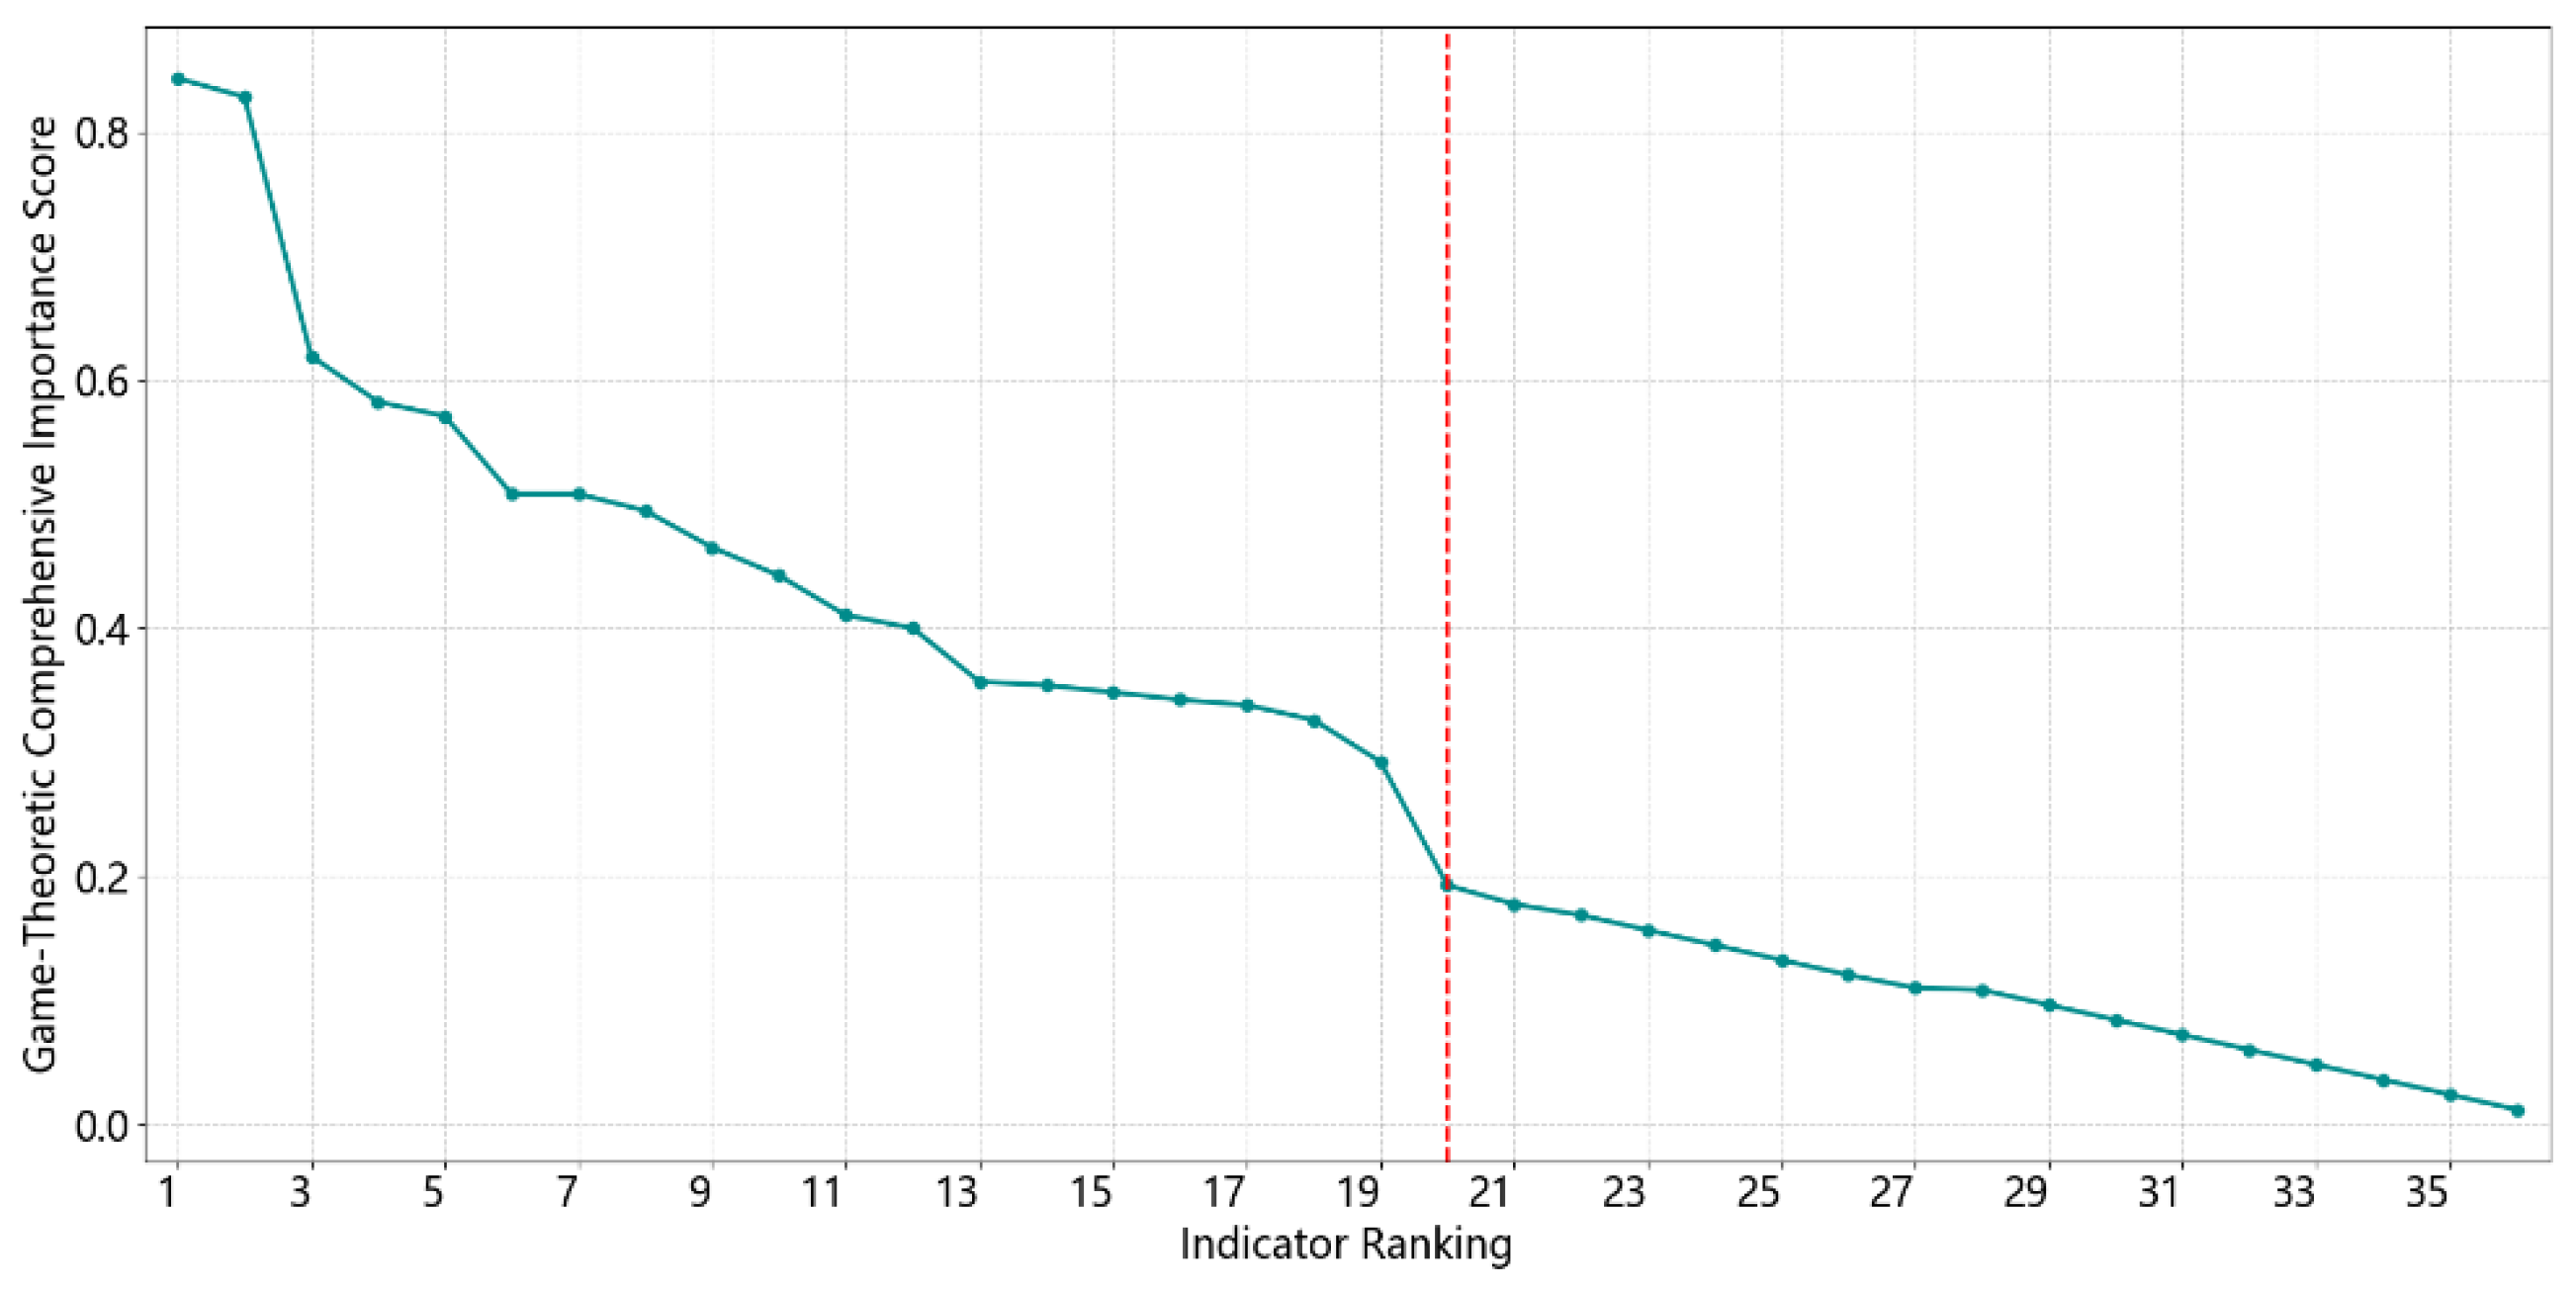
Based on the CV-corrected game-theoretic combination weighting model, the weight assigned to the random forest method is 0.5902, while that assigned to mRMR is 0.4098. To determine the final number of indicators in a more scientific manner, the comprehensive importance scores of all candidate indicators were calculated, as shown in
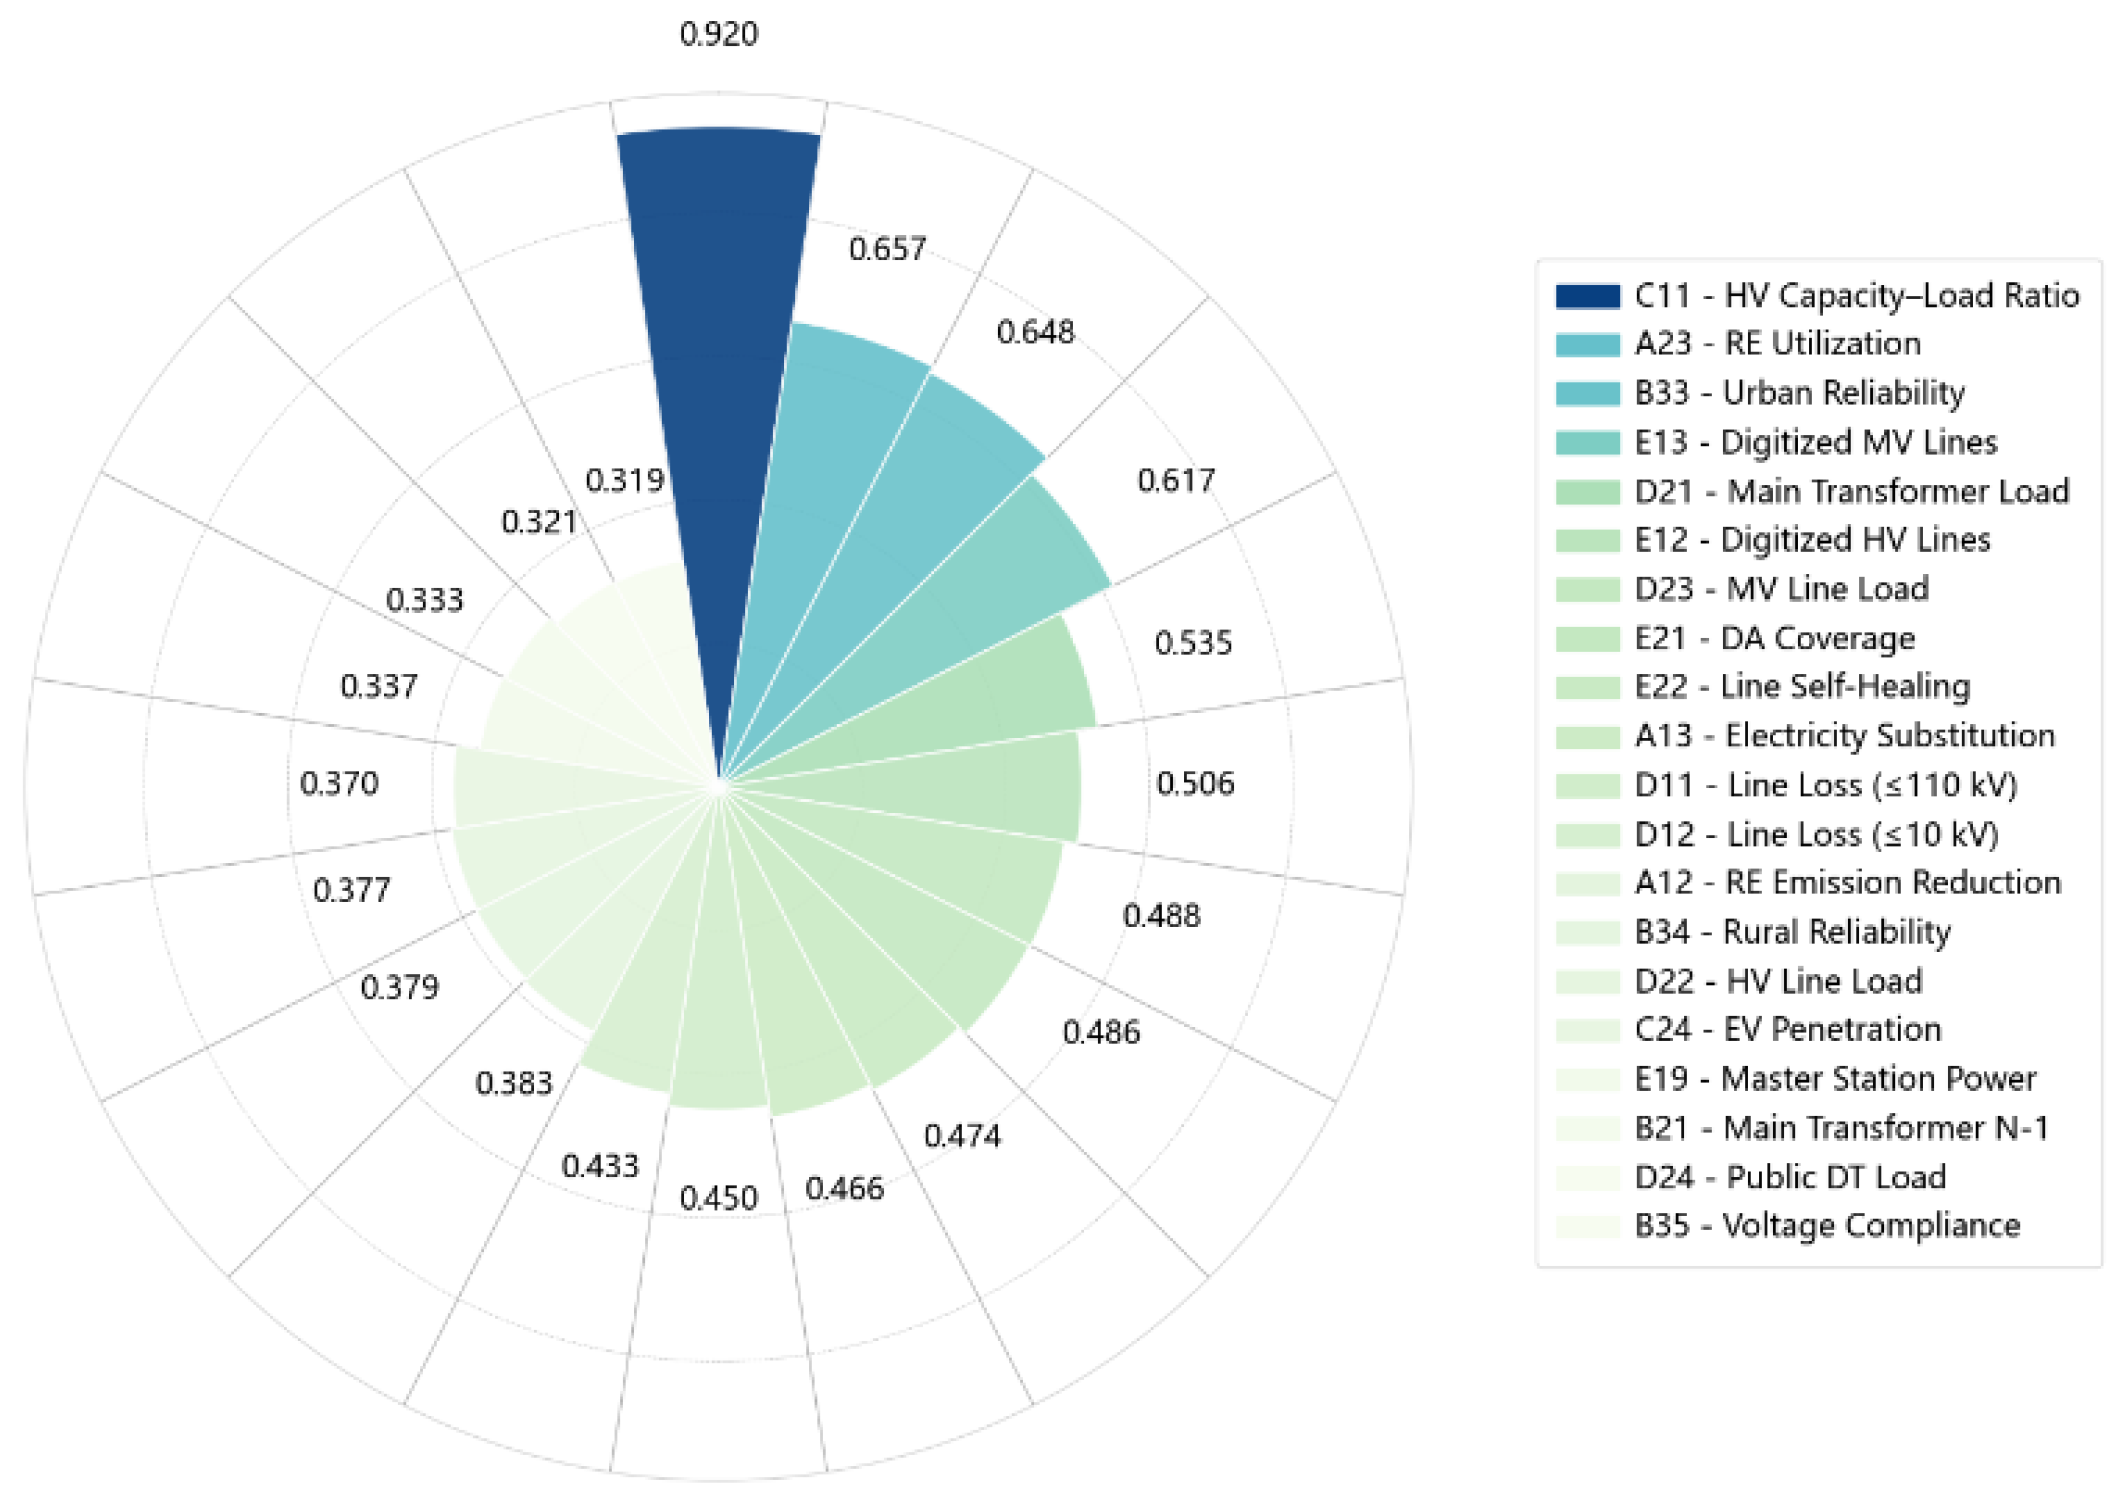
Figure 7. Under the premise of ensuring a sufficient number of indicators, the ranking curve exhibits an evident elbow at the 20th position. The indicators ranked before this point (Indicators 1–20) have relatively high scores and strong discriminative ability for the evaluation objective, and therefore constitute the core part of the indicator system. Accordingly, the top 20 indicators were finally selected, and the results are shown in
Figure 8.
5.3. Planning Evaluation and Ablation Study
5.3.1. Comparison of Screening Results Before and After CV Correction
To further examine the effect of CV correction on indicator composition, the screening results before and after CV correction were compared, as shown in
Table 8.
The comparison shows that the two screening results remain largely consistent, with 16 out of 20 indicators being commonly retained, indicating that CV correction does not alter the overall core structure of the indicator set in Scenario 2. The differences between the two results are mainly reflected in a small number of boundary indicators. Compared with the uncorrected result, the CV-corrected result tends to retain more indicators associated with resource structure, load characteristics, and end-use electrification, whereas the uncorrected result includes relatively more indicators related to digital support and grid-side security. These results suggest that the role of CV correction mainly lies in adjusting the selection of marginal indicators, rather than fundamentally changing the core indicator structure.
5.3.2. Planning Evaluation Under Different Indicator Systems and Ablation Analysis
To examine the applicability of the flexibly constructed indicator system in practical planning evaluation and to compare the discrimination performance of different indicator systems, the entropy-weight method [
34] was adopted for comprehensive evaluation. It should be noted that the scheme label
defined in the RF-based screening stage is not used here as an evaluation target. Instead, the purpose of this section is to compare how different indicator systems distinguish the same set of planning schemes. Since the label y is constructed from scheme-related indicator data, a potential dependence between the training stage and the evaluation stage cannot be fully excluded, which is also a limitation of this study. An ablation analysis was conducted for the four planning schemes under three indicator systems:
Comprehensive Indicator System, i.e., the comprehensive indicator system with 56 indicators;
Expert-Screened System, which contains only the 36 indicators obtained through expert-based preliminary screening;
Flexibly Constructed System, i.e., the 20-indicator system proposed in this paper.
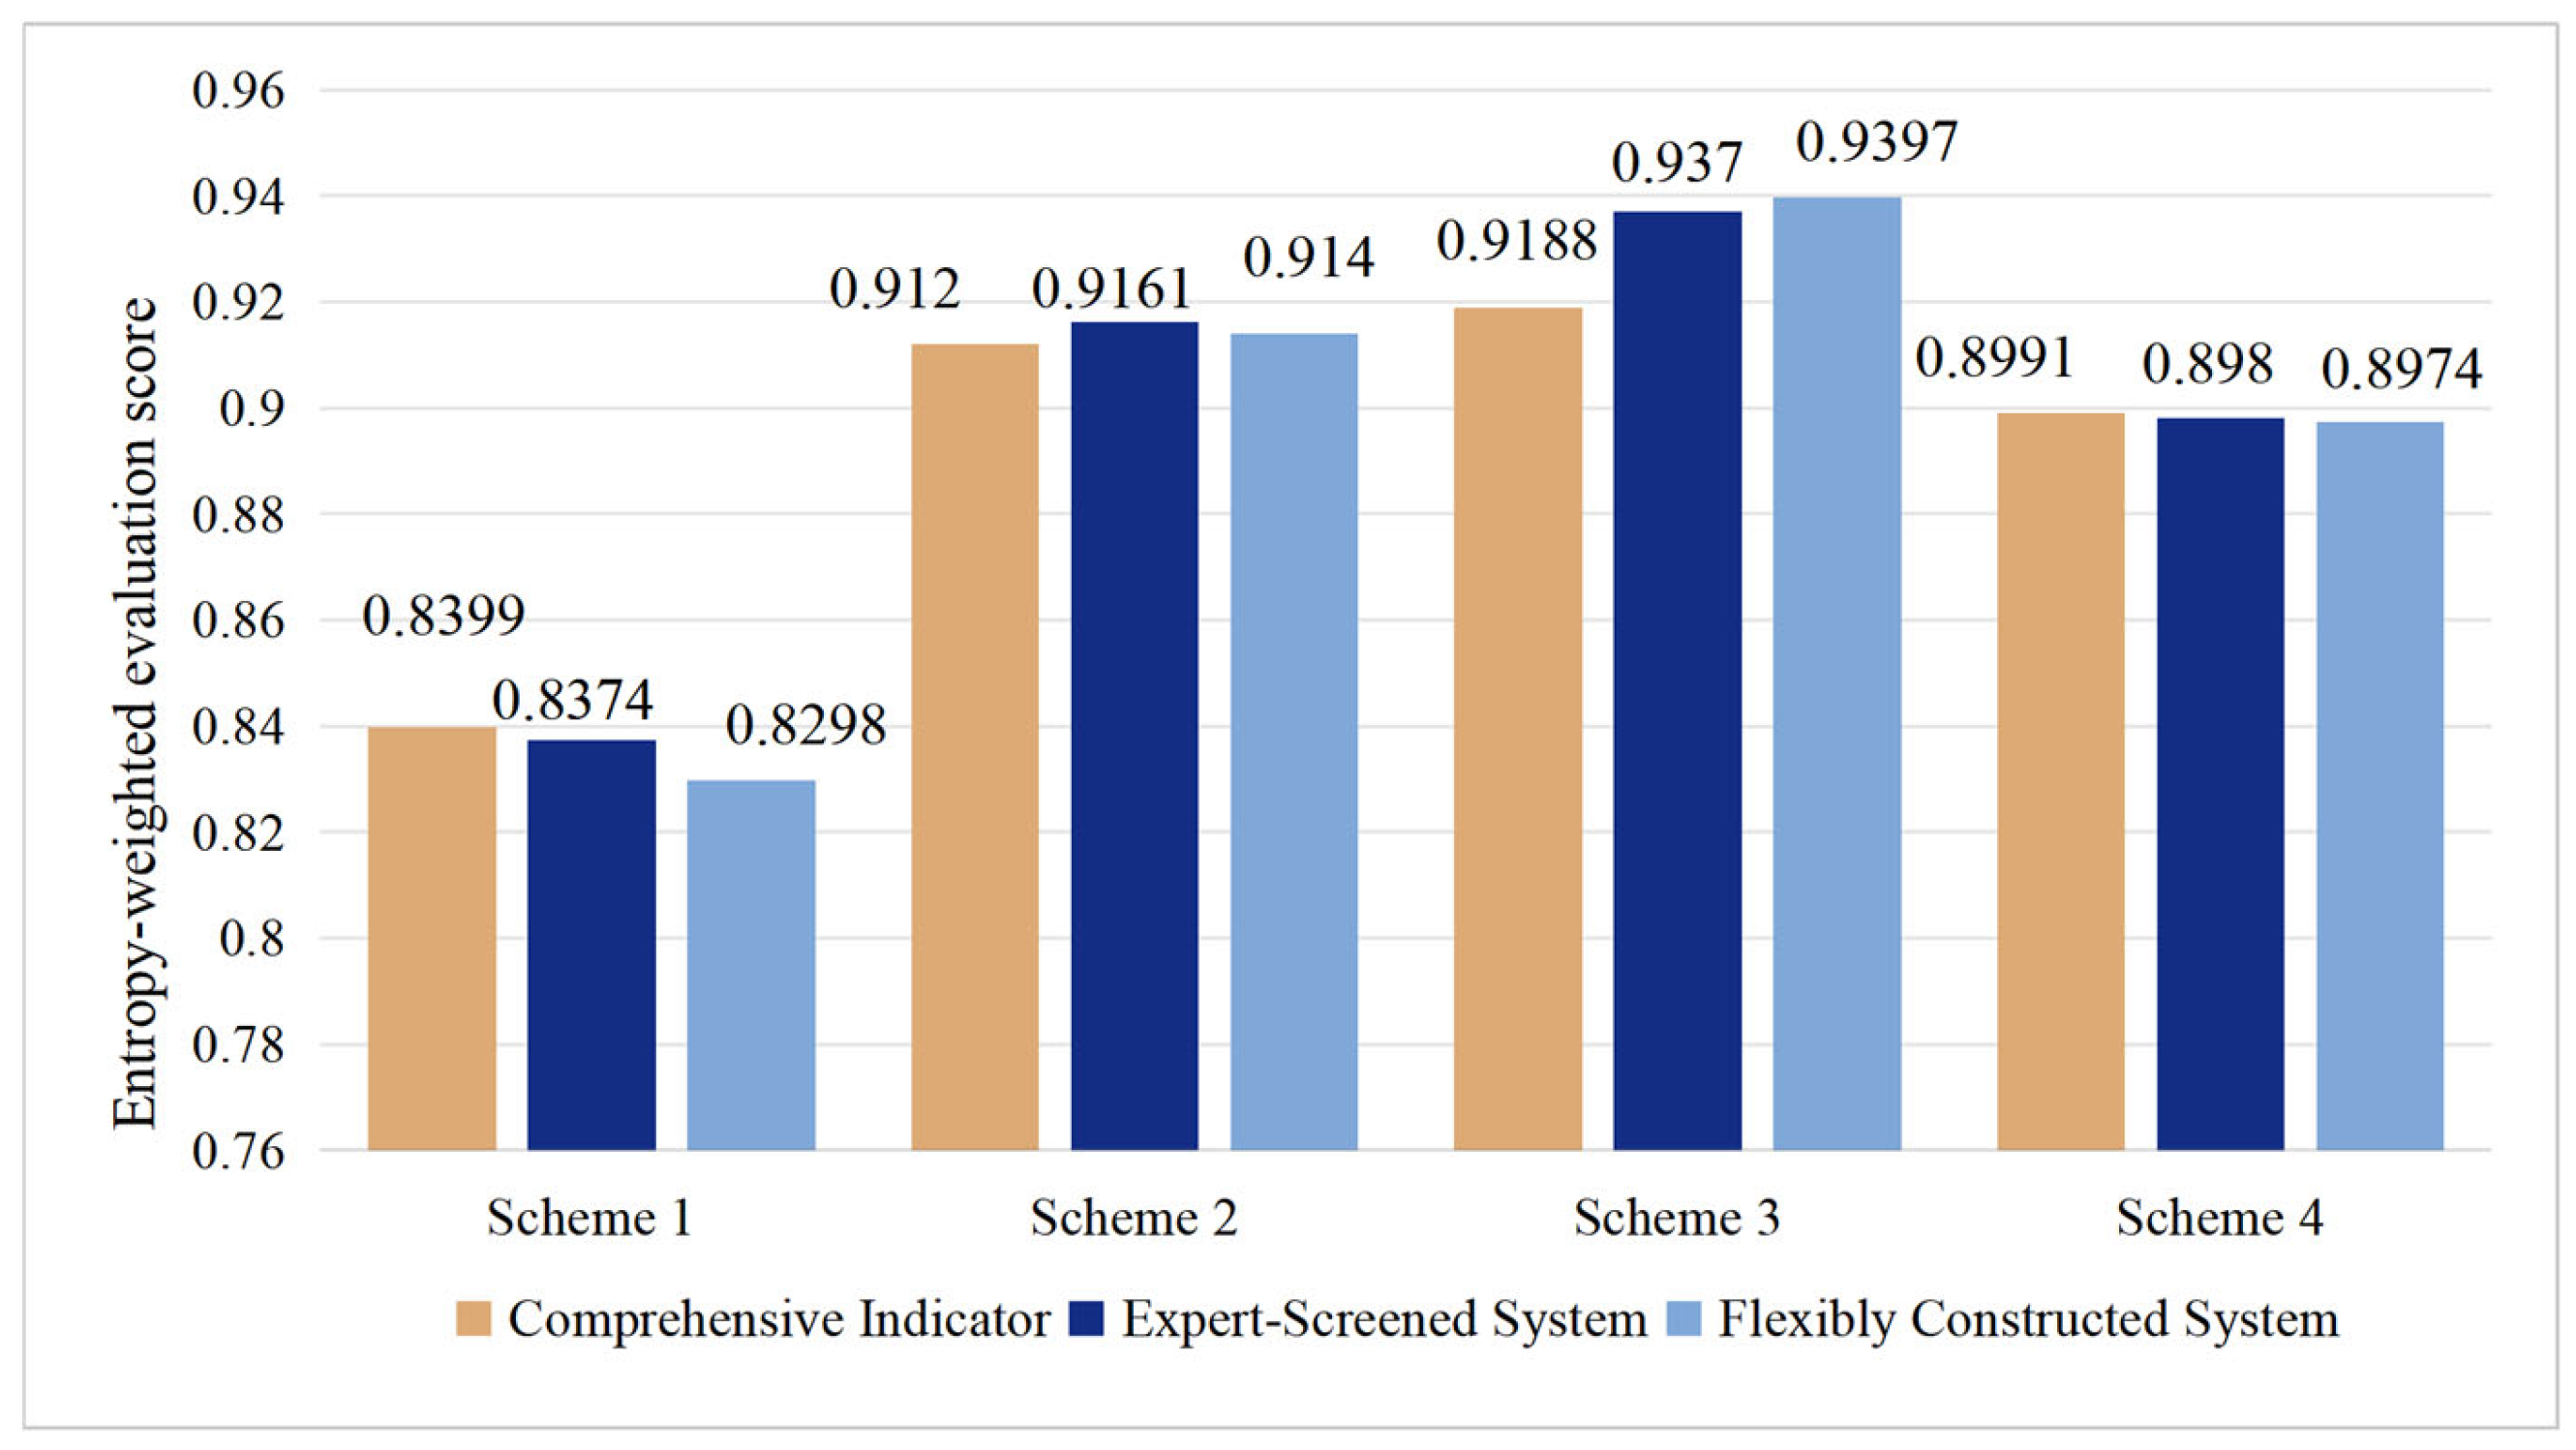
As shown in
Figure 9, as the indicator system evolves from the comprehensive system to the expert-screened system and further to the flexibly constructed system, the number of indicators decreases continuously, while the discrimination among planning schemes is progressively enhanced. Compared with the comprehensive indicator system, the expert-screened system reduces the number of indicators by 35.7% while already improving the differentiation among schemes. After further introducing the data-driven screening process, the flexibly constructed system retains only 20 core indicators and further enhances the ability to distinguish superior and inferior schemes. Specifically, the evaluation score of the optimal Scheme 3 increases from 0.9188 to 0.9370 and then further to 0.9397, while the score of the least favorable Scheme 1 decreases from 0.8374 to 0.8298. The ablation results indicate that expert knowledge can effectively achieve the initial contraction of the candidate indicator set, while data-driven screening further improves the compactness and discrimination capability of the indicator system. The resulting flexible indicator construction system reduces indicator redundancy while enhancing the identification of differences among planning schemes.
5.4. Generalization and Adaptability Analysis
5.4.1. Indicator Construction and Evaluation Under Different Temporal Dimensions
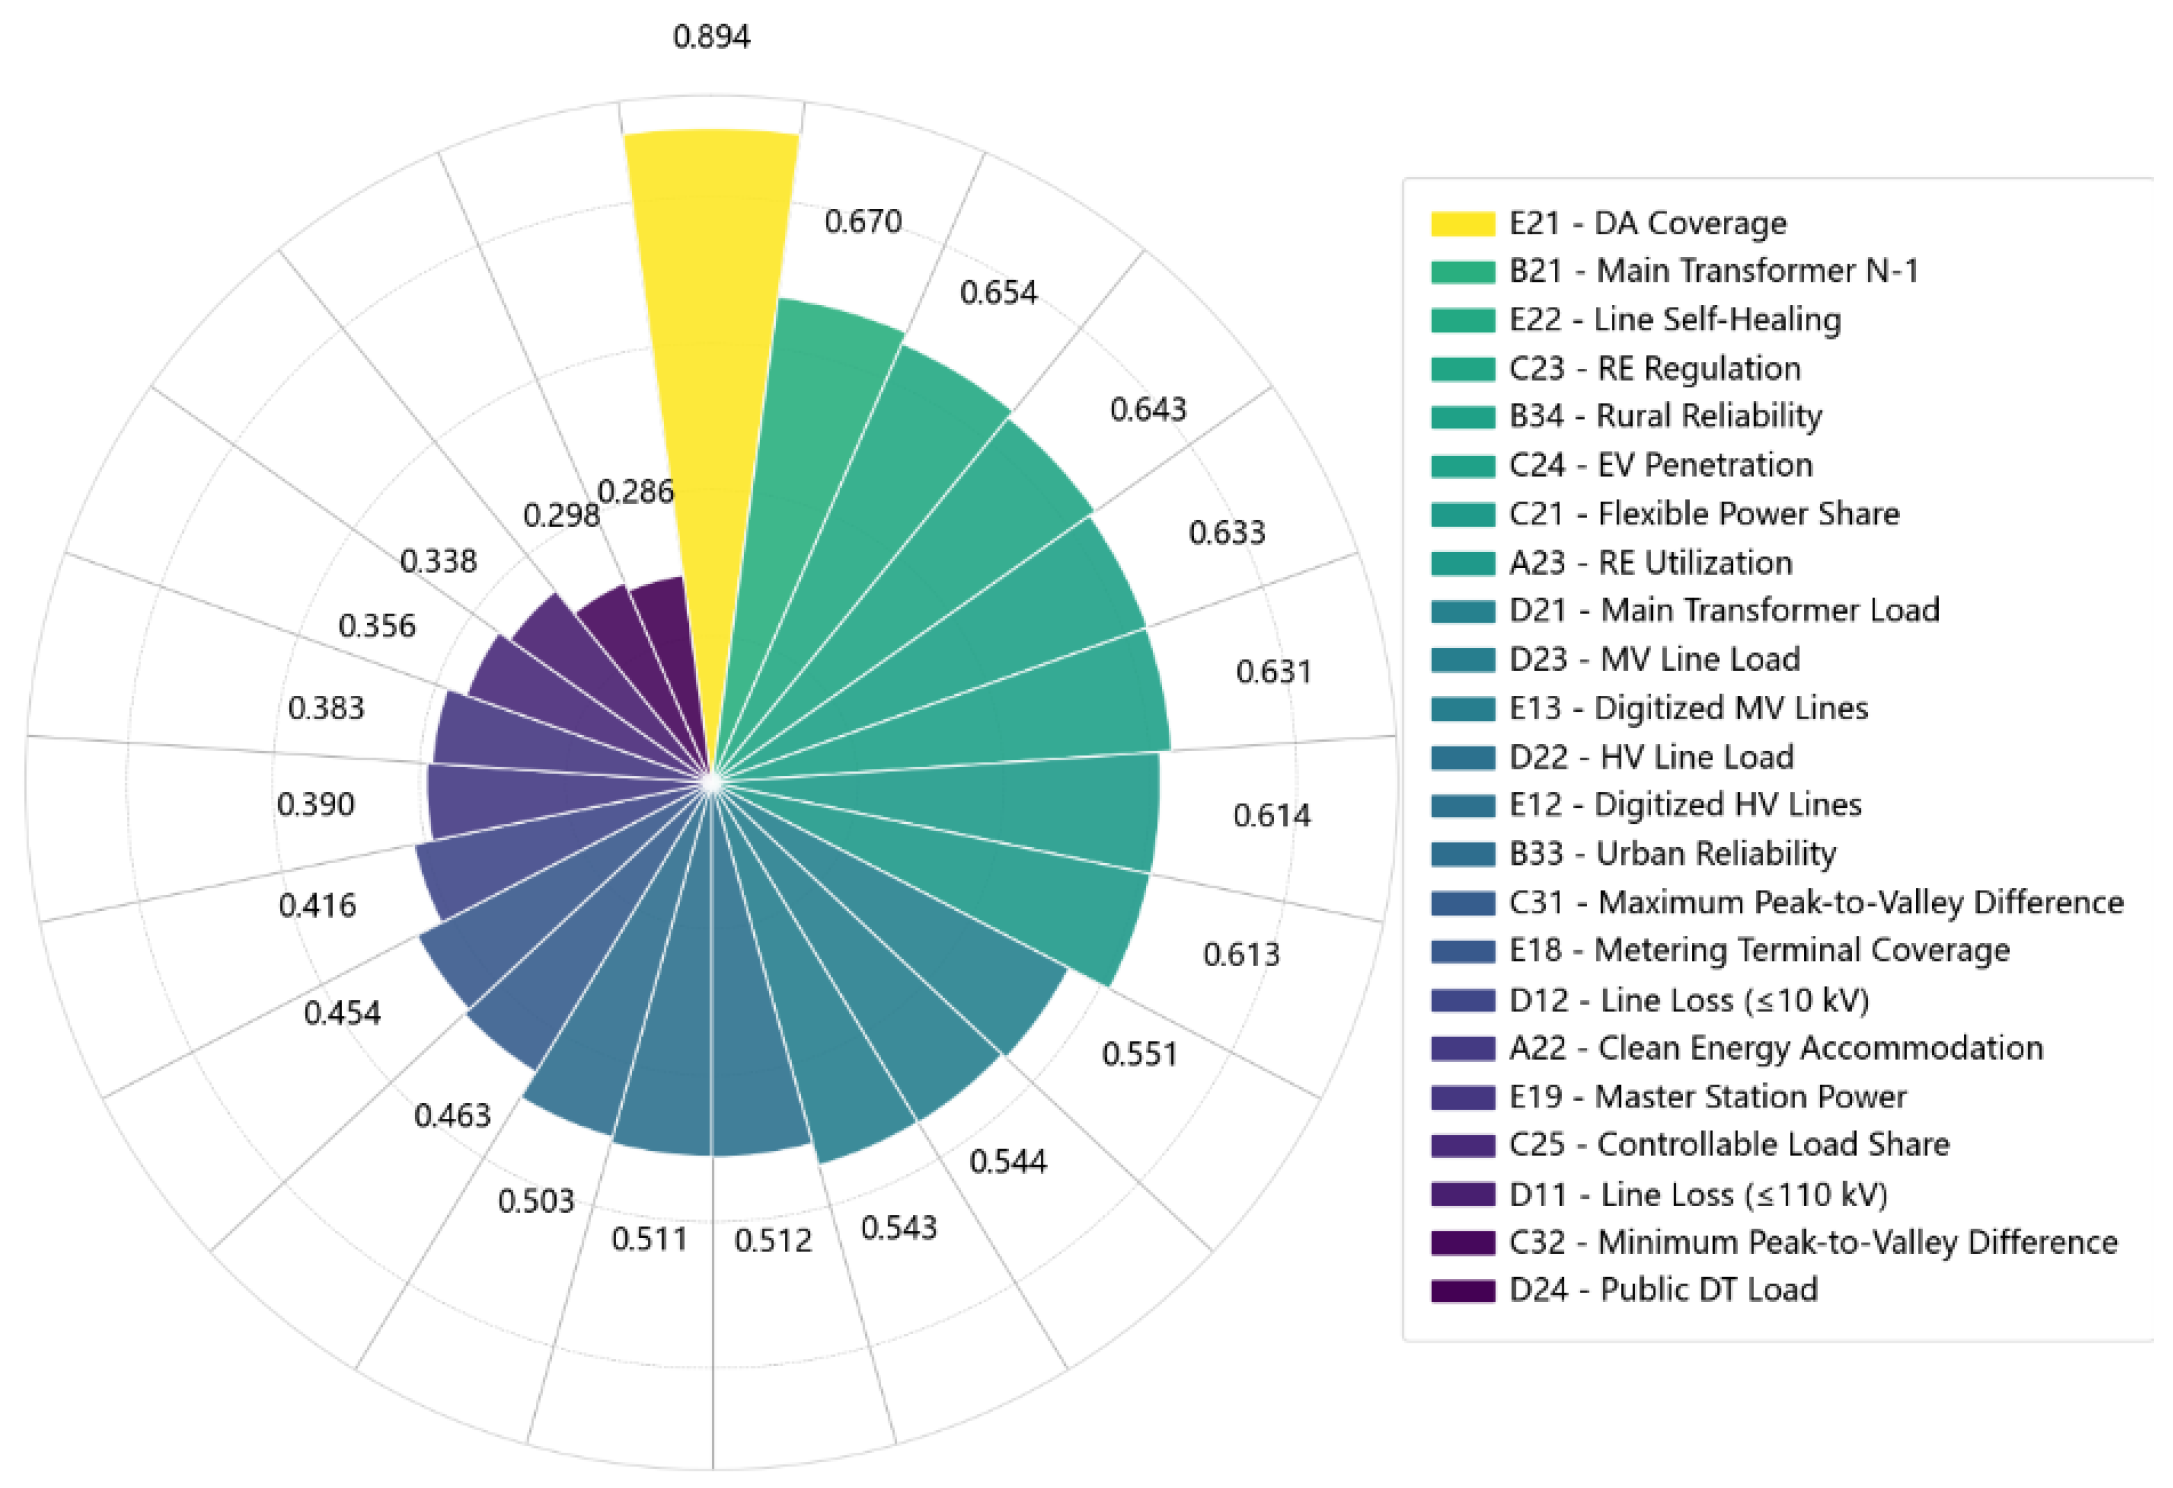
To verify the adaptability of the proposed method in the temporal dimension, i.e., across different planning stages, the planning evaluation of County A was extended to the planning-year scenario (Scenario 4: energy-import type–high flexibility–high digitization). For this new scenario, the proposed flexible indicator construction method finally selected 23 core evaluation indicators, as shown in
Figure 10.
In Scenario 4, the distribution automation coverage rate ranks first, indicating that the planning year places higher demands on the advanced digital and intelligent support capabilities of the distribution network. In addition, indicators such as renewable energy regulation rate, flexible power installed capacity share, proportion of controllable load resources, and renewable energy accommodation rate newly enter the core indicator set, directly reflecting the increasing importance of flexibility and deep renewable energy integration. The evaluation focus therefore shifts from ensuring energy import capability to building a more flexible and renewable-oriented distribution system.
The comparison of scheme scores between Scenario 2 and Scenario 4 is shown in
Table 9. As can be seen, under the present-year Scenario 2, Scheme 3 achieves the highest score of 0.9397. However, when the evaluation system shifts to the planning-year Scenario 4, Scheme 2 becomes the best scheme with a score of 0.9311. This result indicates that the core indicators and weight priorities are not identical across different planning stages, and the optimal planning scheme may change dynamically with scenario evolution.
5.4.2. Indicator Construction and Evaluation Under Different Spatial Dimensions
To verify the adaptability of the proposed method in the spatial dimension, i.e., across different county-level objects, another county, County B, was selected for comparative analysis. Its basic characteristics are listed in
Table 10.
As shown in
Table 10, the energy density of County B is much higher than its load density, indicating a pronounced outward power transmission feature. The proportion of flexible power installed capacity is 5.14%, which also corresponds to the criterion for low flexible resource allocation. In terms of digitization, the DSI of this region reaches 79.53%, indicating an overall high-digitization level. Therefore, County B can be classified as Scenario 6 (energy-export type–low flexibility–high digitization). Considering that County A (Scenario 2) and County B (Scenario 6) are at the same level in terms of flexible resource allocation and digitization, while their main difference lies in resource endowment type, the two scenarios are suitable for comparing the impact of regional resource-basis variation on indicator system construction.
The comparison of overall planning evaluation scores between County A (Scenario 2) and County B (Scenario 6) is presented in
Table 11.
From
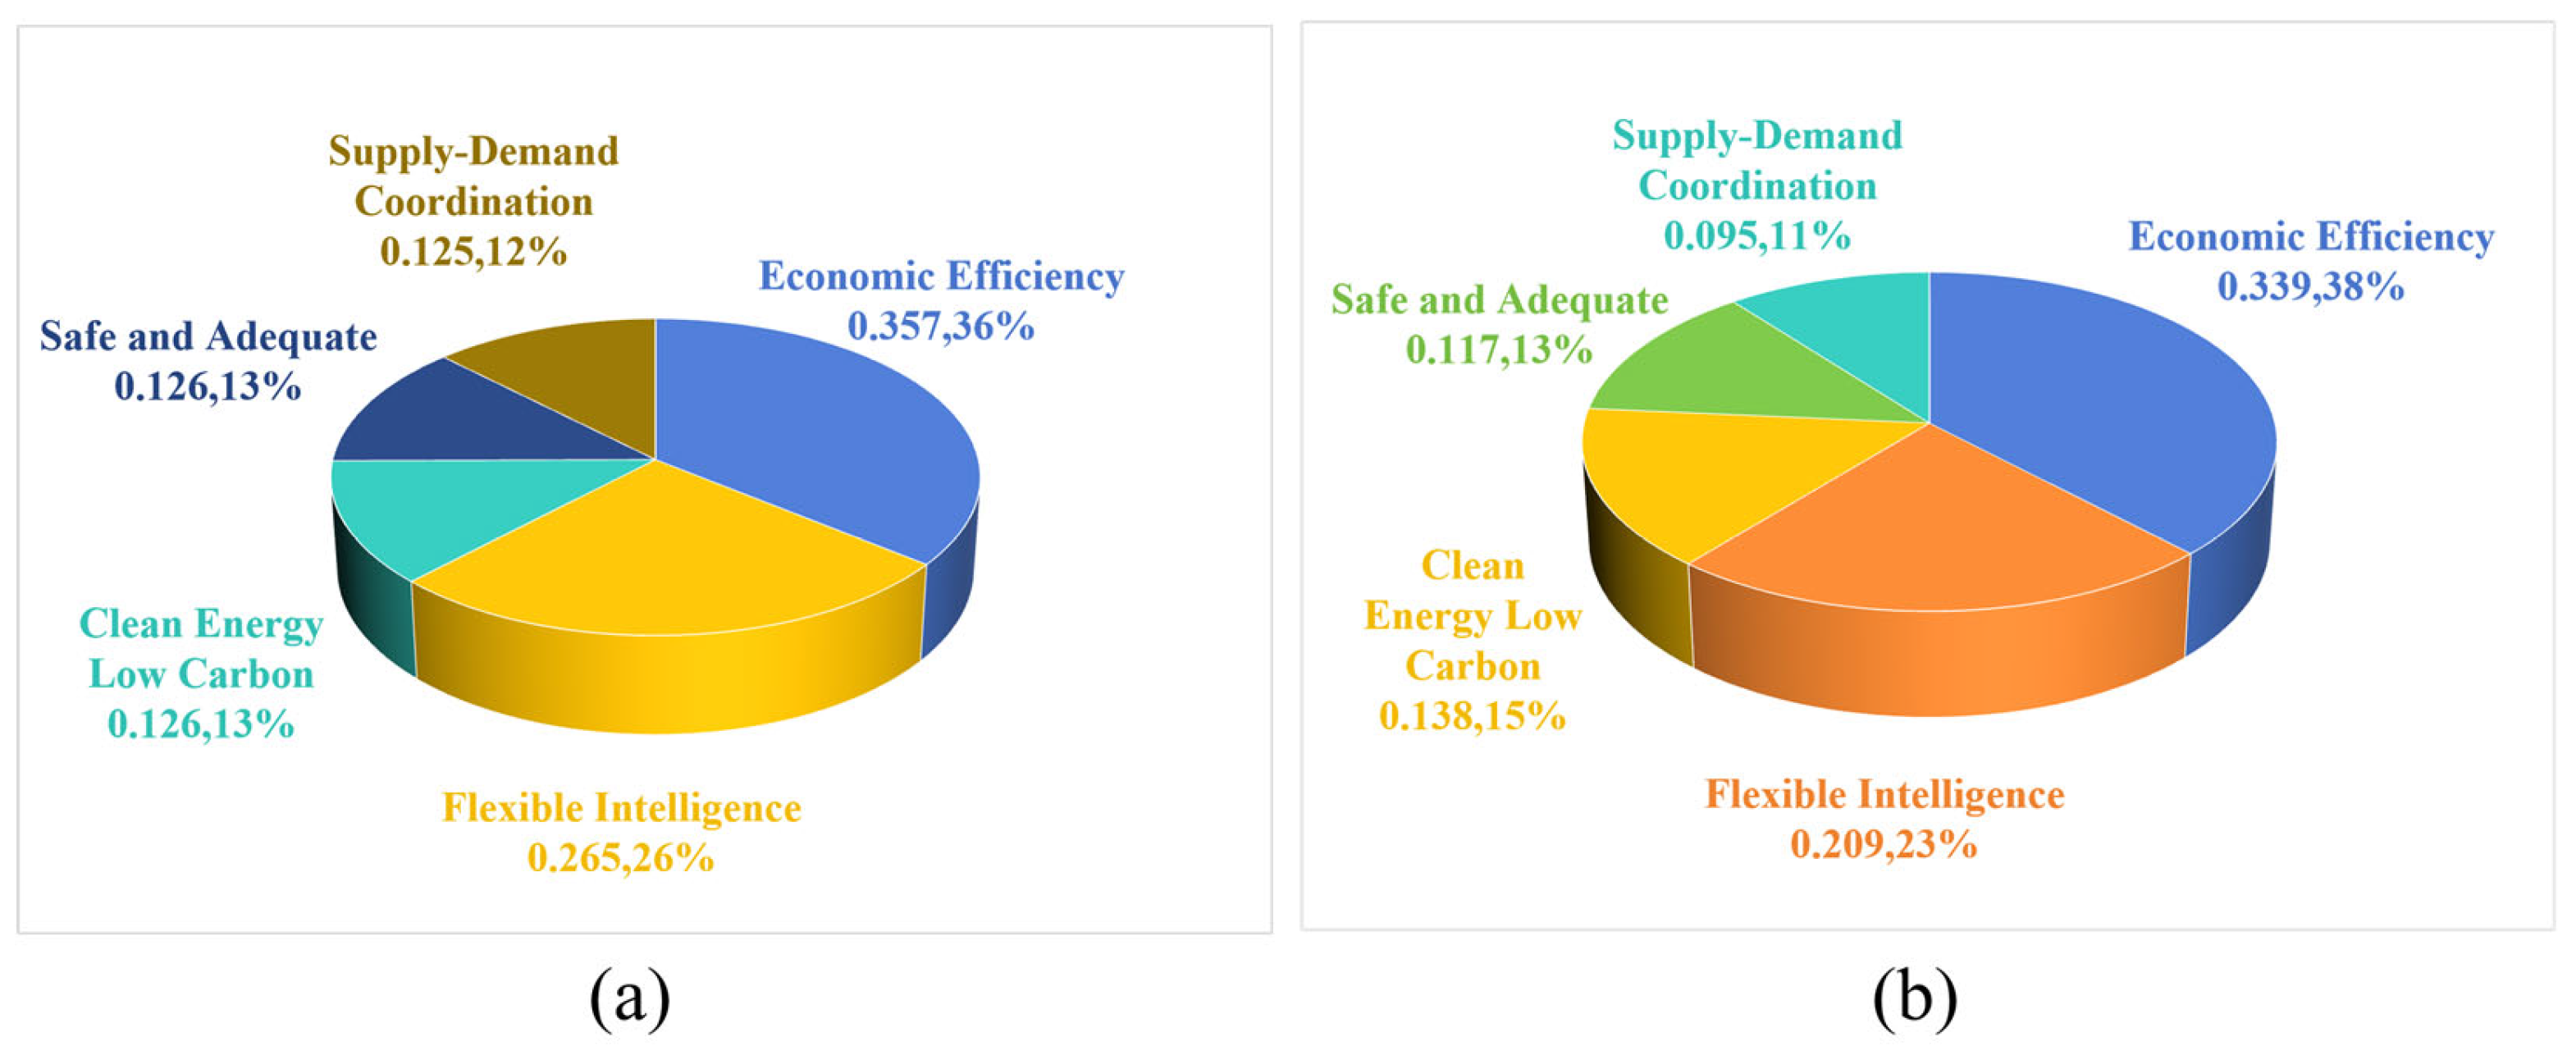
Figure 11, it can be seen that under different planning scenarios, the core characteristics determine the weight emphasis of the indicator system. From the energy-import Scenario 2 to the energy-export Scenario 6, the proportions of first-level dimensions change clearly. Although Economic Efficiency remains the dominant dimension in both scenarios (36% in Scenario 2 and 38% in Scenario 6), the weight of Low-Carbon Development increases from 13% to 15% in Scenario 6, which is consistent with the physical requirement that energy-export-oriented grids prioritize renewable energy accommodation and clean outward transmission. In contrast, since the renewable energy accommodation pressure in County B is relatively smaller, the weight of Flexibility and Intelligence decreases from 26% to 23%.
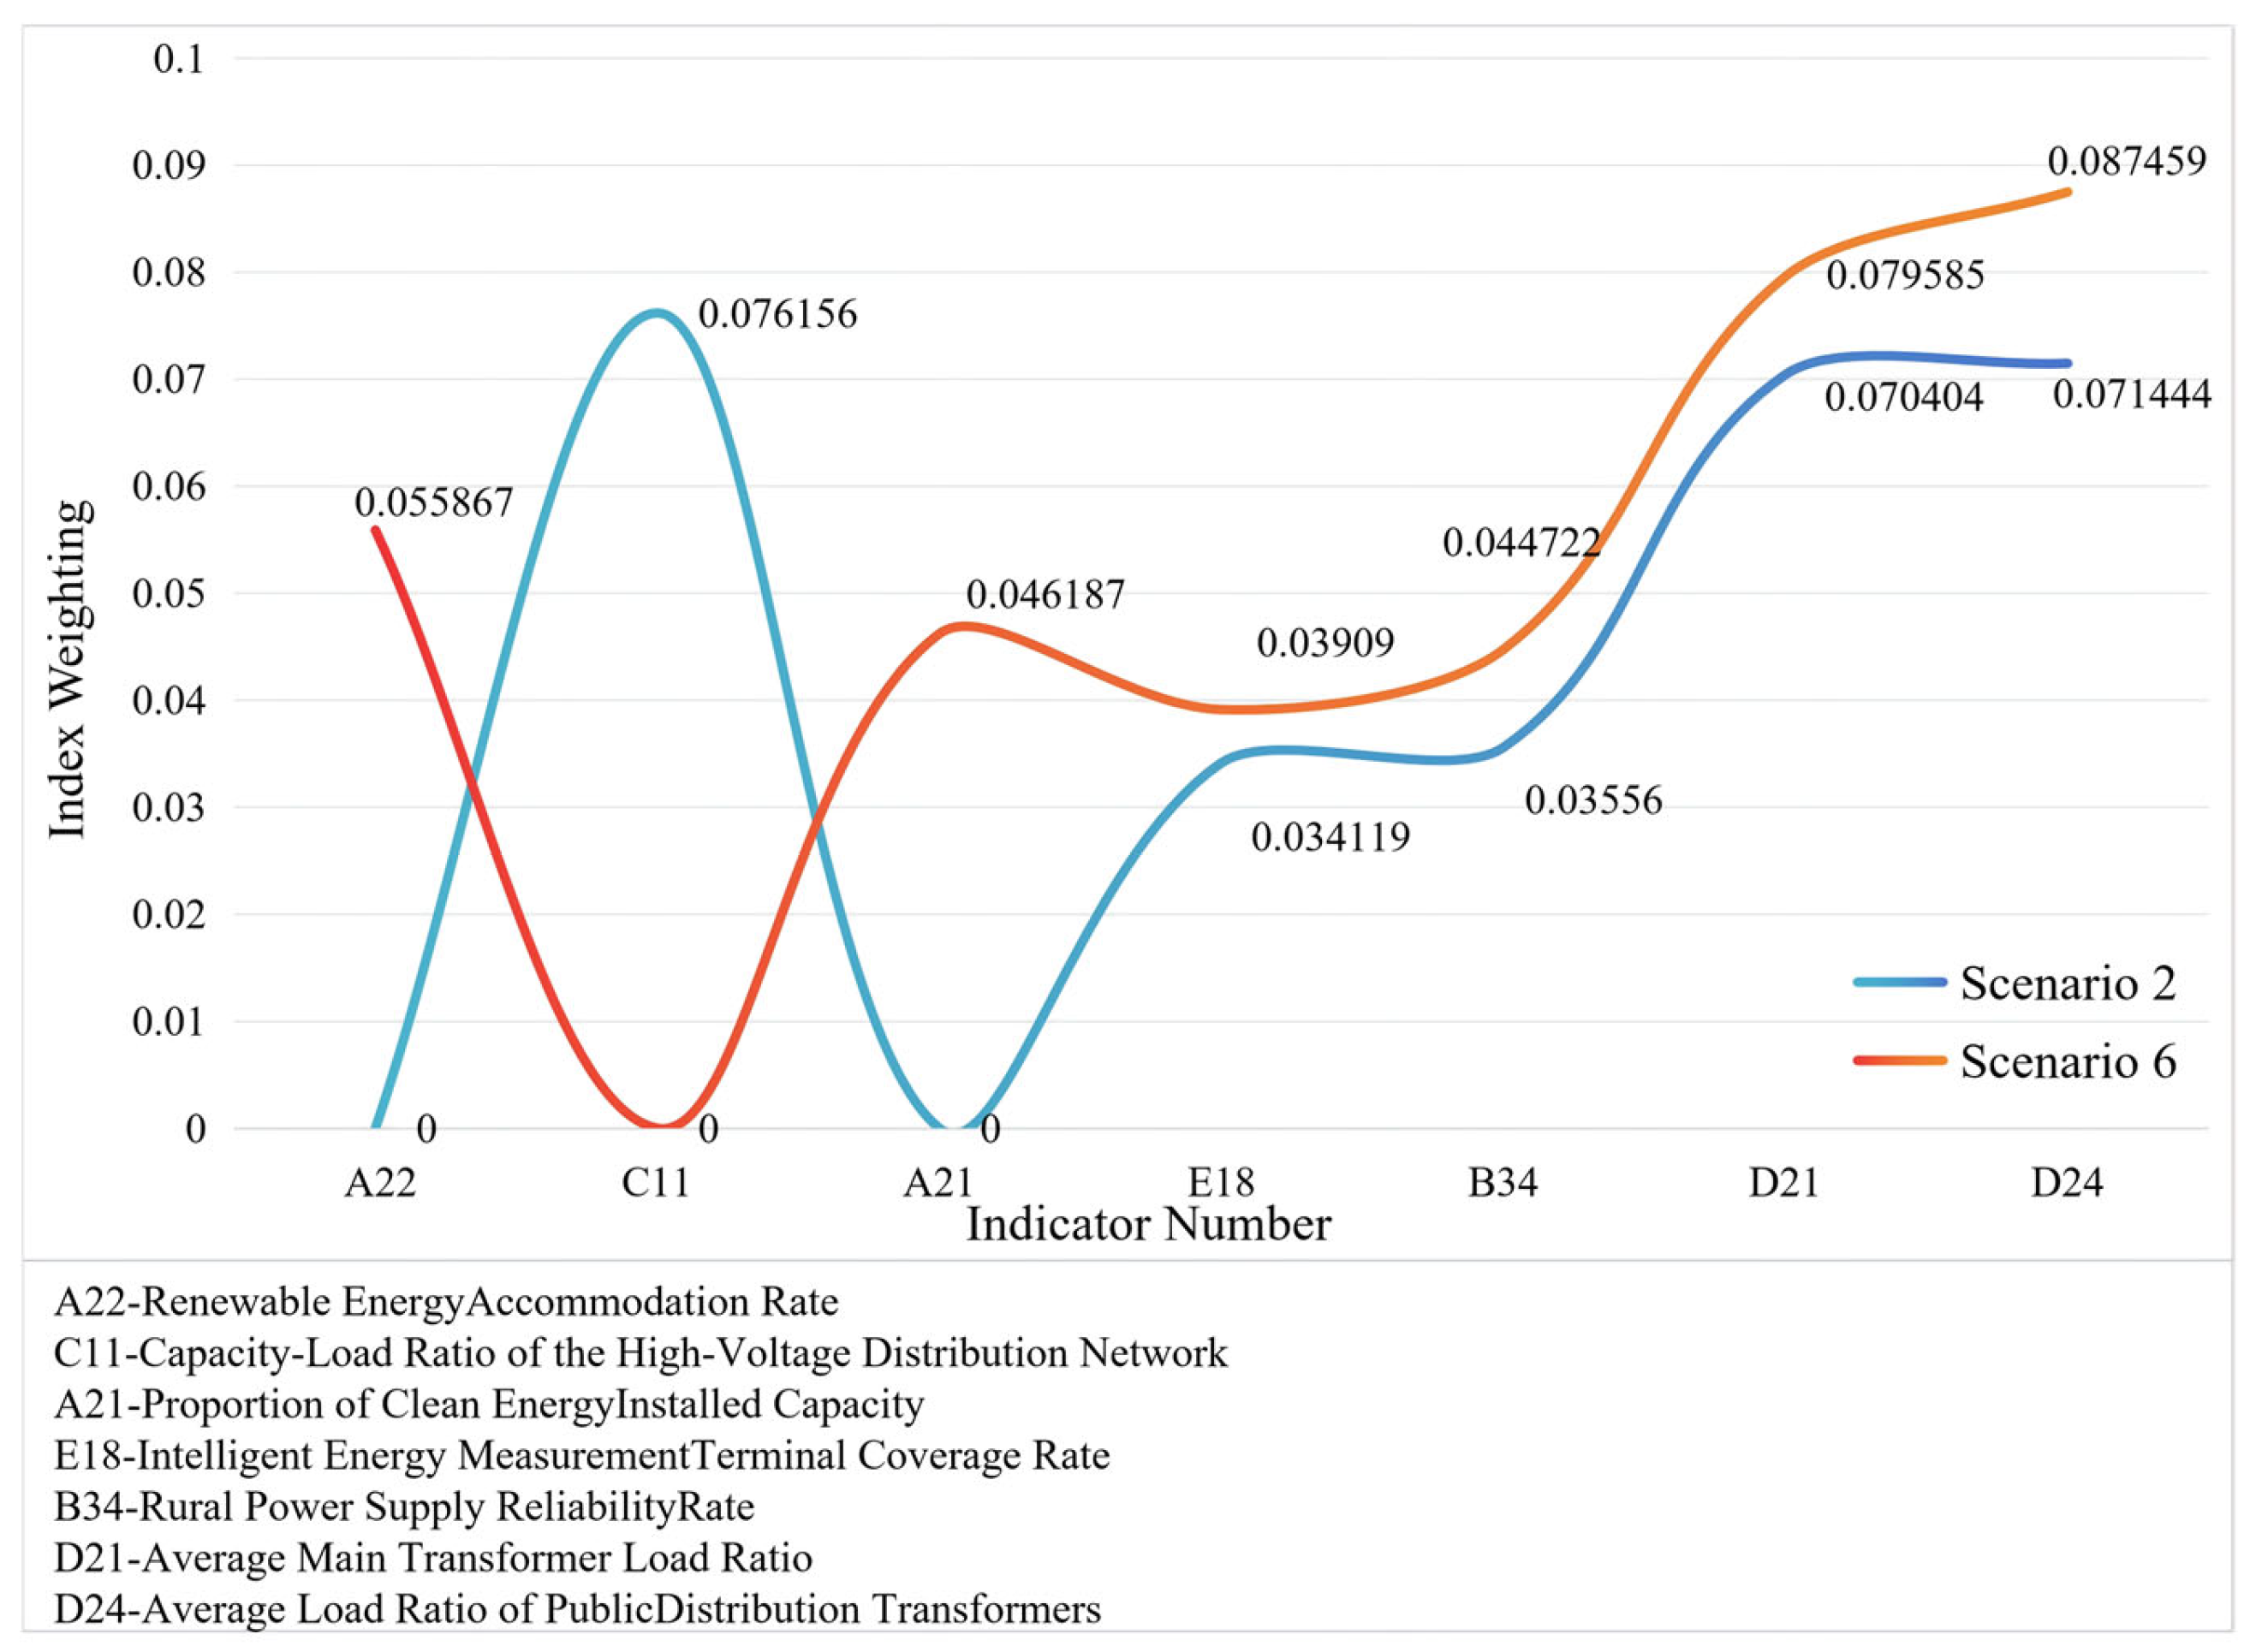
At the micro-indicator level, the changes in indicator weights further reveal the differences in evaluation priorities across scenarios, as shown in
Figure 12.
In Scenario 6, the weights of Renewable Energy Accommodation Rate (0.0559) and Proportion of Renewable Energy Installed Capacity (0.0462) increase significantly, which is highly consistent with the strategic objective of “exporting green electricity” in an energy-export-oriented grid. In contrast, the highly weighted Capacity–Load Ratio of the High-Voltage Distribution Network (0.0762) in Scenario 2 is automatically excluded in Scenario 6. In addition, Scenario 6 places greater emphasis on asset utilization efficiency, as reflected by the higher weights of Average Load Ratio of Public Distribution Transformers (0.0875) and Average Main Transformer Load Ratio (0.0796), compared with 0.0734 and 0.0704 in Scenario 2, respectively. Meanwhile, the weight of Intelligent Energy Measurement Terminal Coverage Rate increases from 0.0341 in Scenario 2 to 0.0391 in Scenario 6, further indicating the stronger demand for refined and intelligent management in energy-export-oriented scenarios.
Overall, the dynamic variation of third-level indicator weights reveals the differences in evaluation priorities under different development orientations, which provides further support for the scenario adaptability of the proposed method in the studied cases.
5.5. Practical Implementation Discussion
The proposed method is mainly intended for county-level distribution-network planning evaluation. The required data include planning documents and scheme-indicator data, regional resource-endowment data, flexibility-resource allocation data, and digitization-related development data. Most of these data can be obtained from distribution-network planning materials, operational statistics, and utility information systems, which gives the method a certain degree of practical accessibility.
From the perspective of implementation, the RF model, mRMR analysis, and the subsequent fusion-based screening are mainly used for offline analysis, and the overall computational scale is manageable. Therefore, the method is suitable for planning preparation, scheme comparison, and periodic rolling revision, rather than for real-time high-frequency online applications. Considering that regional resource structure, flexibility-resource allocation, and digitization level may evolve over different planning stages, the indicator system is more suitable for staged updates in accordance with planning cycles, major project commissioning, and changes in regional development conditions, so as to maintain the relevance and applicability of the evaluation results.
6. Conclusions and Future Work
Traditional distribution-network planning evaluation often relies on a unified indicator system, which makes it difficult to reflect the differentiated development of emerging distribution networks across regions. To address this issue, this paper proposes a data-driven method for constructing planning evaluation indicators for emerging distribution networks. Comparative case studies show that the proposed method can adjust the indicator system according to scenario characteristics and performs well in the studied cases, thus providing a useful reference for distribution-network planning evaluation.
A scenario-driven preliminary indicator-screening mechanism is established. By analyzing county-level differences in resource endowment, flexibility, and digitization, and combining expert knowledge for macro-level judgment, the comprehensive indicator system is preliminarily screened to form candidate indicator sets with distinct scenario characteristics.
A data-driven quantitative indicator-screening method is developed. The mRMR method is used to analyze indicator relevance, the RF model is employed to evaluate indicator importance, and a CV-corrected game-theoretic fusion strategy is adopted for comprehensive screening. In the present case, this improves the objectivity and operability of indicator screening.
Since the scheme label is constructed from scheme-related indicator data, a potential dependence between the training stage and the evaluation stage cannot be fully excluded, which is also a limitation of this study.
This study is still limited by the number of representative cases and the scope of available data. Future work may proceed in three directions.
Hierarchical modeling and comparative analysis can be further carried out within counties, such as among urban areas, rural areas, and different supply-grid units, so as to improve the ability of the method to identify intra-regional differences.
For cases in which the indicator-screening curve does not show a clear elbow point, auxiliary judgment methods based on Pareto cumulative contribution can be explored to determine the size of the compact indicator set.
Broader multi-region and multi-year samples can be incorporated, and systematic benchmark comparisons with other feature-selection methods, such as PCA, LASSO, and SHAP, together with statistical validation methods including cross-validation and variance analysis, can be introduced to further examine the stability and applicability of the proposed method.