


Abstract
To address the power quality deterioration caused by the large-scale integration of grid-following (GFL) electric vehicle charging stations, this paper proposes a comprehensive assessment method based on relative entropy distance fusion weighting and a dynamic ideal solution VIKOR algorithm. First, a multi-dimensional power quality evaluation system is constructed, focusing on key indicators such as voltage deviation, frequency deviation, three-phase imbalance, and harmonic distortion, to accommodate the operational characteristics of vehicle-to-grid (V2G) under grid-following and grid-forming (GFM) interaction scenarios. Building on this, the three-scale analytic hierarchy process (AHP) is employed to determine subjective weights, while the divergence-maximized entropy weight method is used to derive objective weights. The relative entropy distance model is then applied to achieve adaptive fusion of subjective and objective weights, resulting in an optimal combined weighting. Subsequently, a dynamic ideal solution mechanism is introduced into the VIKOR algorithm, where the range of the ideal solution is adjusted based on the indicator weights to enhance the discrimination of key indicators. By comprehensively calculating the group utility value, individual regret value, and compromise evaluation index, accurate ranking and performance assessment of different mitigation schemes are achieved. Using measured data from a vehicle-grid interaction demonstration base for analysis, the results demonstrate that the proposed method can effectively quantify the actual effects of various mitigation schemes, providing decision-making support for power grid safety and stability under high penetration of renewable energy and converter-interfaced generation.
1. Introduction
The large-scale integration of grid-following (GFL) and grid-forming (GFM) distributed energy resources, including photovoltaic systems, energy storage, and electric vehicles, has become a critical trigger for power quality issues in modern distribution networks. As the penetration of these distributed energy resources increases, the source-load structure of distribution networks has undergone profound changes. System operation has evolved from the traditional unidirectional radial model to a multidirectional interactive pattern [1,2,3,4].
1.1. Power Quality Challenges in V2G Integration
Within this interactive grid, electric vehicles equipped with V2G capabilities act as highly flexible yet stochastic mobile energy storage units. Their integration heavily relies on advanced converter control paradigms, primarily operating under GFL and transitioning toward GFM control strategies. The frequent switching of massive clusters of power electronic converters, combined with the stochastic bidirectional power flows during V2G operations, has given rise to a series of emerging and severe power quality issues. These issues manifest not only as steady-state voltage deviations and three-phase imbalances but also as dynamic aggravated frequency fluctuations and complex high-frequency harmonic spectra, posing severe challenges to station safety and regional power supply reliability [5,6].
Moreover, the dynamic interactions among different converter control paradigms introduce additional transient complexity, potentially leading to unforeseen resonance or instability phenomena. Therefore, establishing a power quality evaluation system that accurately captures the interactive characteristics among generation, storage, charging, and discharging scenarios is of great significance. Such a system is urgently required to guide refined power quality management in large-scale charging stations and support stable grid operation under the high penetration of converter-interfaced resources [7,8].
1.2. State-of-the-Art in Comprehensive Evaluation Methods
To quantitatively assess these multifaceted power quality issues, various multi-attribute decision-making (MADM) frameworks have been developed. The academic focus has primarily centered on two core methodological aspects: weight determination and comprehensive evaluation modeling.
Accurate indicator weighting is the cornerstone of any evaluation framework. Current approaches include subjective, objective, and combined weighting methods [9,10,11,12,13,14,15]. Subjective methods, such as the Analytic Hierarchy Process (AHP) and its enhanced variants, effectively capture expert engineering intent. However, these models face inherent limitations: they remain highly susceptible to expert cognitive bias, struggle with computational complexity when handling numerous indicators [11], and crucially, fail to incorporate the real-time statistical characteristics of measured data. Conversely, purely objective methods rely entirely on data dispersion to eliminate human bias. For instance, the entropy weight method [13] solely depends on mathematical distribution differences, thereby ignoring the physical engineering importance of indicators. This often results in critical grid parameters being assigned excessively low weights simply due to minimal data fluctuation during a specific monitoring window. Similarly, the CRITIC method [14] is highly prone to distorted correlation calculations in non-stationary V2G scenarios. To bridge this divide, recent literature has explored hybrid weighting approaches that attempt to combine subjective intent with data objectivity [15]. However, a significant unsolved problem remains: the vast majority of existing hybrid methods synthesize weights using predefined, arbitrary linear coefficients. This static-linear empirical fusion lacks rigorous mathematical justification and fails to adaptively resolve the inherent conflicts between subjective experience and real-time data volatility under extreme grid conditions.
In the domain of comprehensive evaluation models, techniques such as fuzzy comprehensive evaluation, projection pursuit, TOPSIS, and VIKOR have been widely applied to rank power quality mitigation schemes [16,17,18,19]. While projection pursuit transforms multiple indicators effectively, it still leaves uncertainties in the evaluation process [18]. Improved Grey-TOPSIS models [20] provide hierarchical evaluation but critically rely on a static geometric setup, making them unsuitable for the frequent charging and discharging state transitions inherent in V2G operations. To better handle indicator conflicts and balance group utility against individual regret, the VIKOR method has been increasingly adopted, mitigating the potential indistinguishability issues associated with the TOPSIS median line [21]. Nevertheless, previous implementations of VIKOR in energy systems exhibit a fatal structural limitation: they determine positive and negative ideal solutions using traditional fixed extreme values, without considering the dynamic influence of indicator weights on the ideal solution range [22,23,24]. In practical V2G charging stations, the volatility of indicators changes dramatically between peak interactive periods and idle states. A static boundary approach renders the algorithm insensitive to the varying decision-making importance of different indicators. Consequently, the traditional evaluation system lacks dynamic adaptability, struggling to clearly discriminate and quantify the comprehensive performance of different mitigation schemes under highly complex operating conditions.
1.3. Research Gaps and Main Achievements
Despite the widespread application of multi-attribute decision-making (MADM) methods in power system evaluations, existing models exhibit critical limitations when applied to the dynamic, high-frequency monitoring of V2G-enabled charging stations. First, regarding weight determination, conventional approaches typically rely either purely on subjective experience or purely on objective data. Existing hybrid methods attempt to combine these by using arbitrary linear coefficients, lacking a mathematically rigorous mechanism to dynamically balance human expertise with data volatility. Second, regarding the comprehensive evaluation algorithm, traditional methods utilize static ideal solutions based solely on the fixed extreme values of the current dataset. This static boundary approach ignores differences in indicator importance, diminishing the framework’s ability to clearly distinguish key quality indicators in complex, real-time grid operations.
To bridge these identified gaps, this paper proposes the REWD-VIKOR framework. The main scientific achievements and contributions of this work are summarized as follows:
- (1)
- An adaptive weight fusion model based on relative entropy distance is proposed, which dynamically determines the fusion coefficient by quantifying the deviation be-tween subjective and objective weights relative to the average distribution, thereby achieving an organic integration of experience-oriented and data-driven approaches.
- (2)
- A dynamic ideal solution generation mechanism incorporating weight adjustment is introduced into the VIKOR algorithm. By expanding the boundaries of the ideal solution according to the importance of each indicator, the decision weight of key quality indicators in scheme ranking is enhanced, thereby improving the discrimination and engineering applicability of the evaluation results.
- (3)
- Based on measured data, objective quantification of governance effectiveness and scheme ranking are achieved through comparative analysis of operational states under different power quality improvement schemes.
2. Power Quality Evaluation System for V2G-Enabled Charging Stations
In large-scale electric vehicle (EV) charging stations, particularly those equipped with V2G bidirectional power regulation capability, these charging stations function not only as conventional electricity load units but also as dynamic, bidirectional energy exchange nodes [25,26]. This dual role means that they can both consume power from the grid and inject power back into the grid, depending on the operational state of the connected EVs. The frequent and often unpredictable switching of numerous EVs among charging, discharging, and idle states introduces complex and highly variable power quality characteristics both within the charging station itself and at the point of grid connection. These characteristics can change rapidly over short time intervals, making real-time monitoring and assessment particularly challenging. This variability poses significant challenges for accurate power quality assessment and management, as traditional assessment methods designed for stable, unidirectional power flows are often inadequate for capturing the dynamic nature of V2G operations. To scientifically evaluate the comprehensive performance of different power quality improvement technologies or operational strategies in V2G scenarios, it is essential to establish a targeted, hierarchical, and comprehensive power quality evaluation index system that can capture the full range of dynamic behaviors. Such a system must be capable of reflecting both steady-state performance and transient responses under various operating conditions.
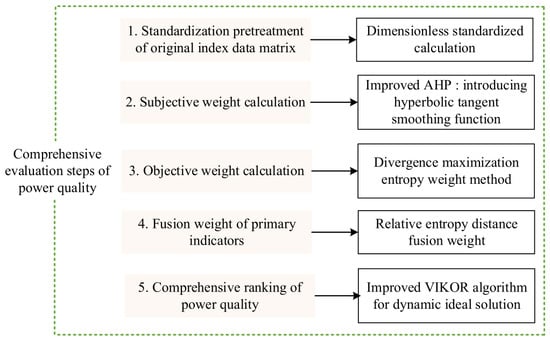
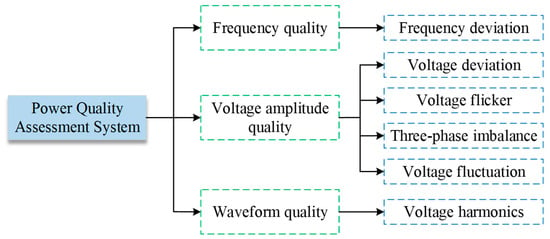
Based on the analysis of the influence mechanism of power quality under both charging and discharging states, this paper selects a set of key indicators including voltage deviation, frequency deviation, harmonic distortion rate, three-phase imbalance, and voltage fluctuation. Each of these indicators addresses a specific aspect of power quality that can be affected by V2G operations. Voltage deviation reflects the magnitude of voltage variations from the nominal level. Frequency deviation indicates the stability of the grid frequency under bidirectional power flows. Harmonic distortion rate captures the presence of harmonic components introduced by power electronic converters. Three-phase imbalance measures the degree of asymmetry among the three phases. Voltage fluctuation represents rapid changes in voltage magnitude over time. The selection of these six indicators was validated through a comprehensive review of grid-connection requirements for distributed energy resources, aligning with key dimensions outlined in IEEE 1547 and EN 50160 standards. These indicators capture the most persistent and critical power quality degradation mechanisms induced by the frequent bidirectional switching of V2G operations. During the system design phase, additional indicators, particularly transient stability metrics, were also considered. However, transient phenomena are generally characterized by sub-second durations and are primarily addressed by millisecond-level hardware relay protection systems. Since the proposed evaluation framework targets continuous, operational-level performance assessment and dispatch optimization, the selected six indicators are deemed sufficient to reflect the steady-state and dynamic interactive performance of the charging stations. These indicators collectively form a multi-dimensional and hierarchical evaluation system as illustrated in Figure 1. The hierarchical structure organizes the indicators into different levels, allowing for both detailed indicator-level analysis and aggregated overall assessment. These indicators not only cover the core parameters of steady-state power quality but also reflect the specific issues arising from bidirectional power flow in V2G mode, such as the increased complexity of harmonic spectra due to the wide range of converter operating points and the rapid fluctuations in both voltage and frequency caused by frequent mode switching of EV clusters. This comprehensive selection enables an objective and thorough reflection of the power quality status of charging stations under various operational strategies, including different charging and discharging schedules, different levels of EV penetration, and different control algorithms. The complete comprehensive evaluation index system for power quality is shown in Figure 2, which provides a visual representation of the hierarchical structure and the relationships among the selected indicators.
Figure 1.
Steps of power quality comprehensive evaluation system.
Figure 2.
Comprehensive assessment index system for power quality.
To enable quantitative evaluation and comparison of power quality, this paper classifies the assessment results of each indicator into four grades: Excellent (Q1), Good (Q2), Fair (Q3), and Qualified (Q4). The grade thresholds are shown in Table 1. The grading thresholds in Table 1 synthesize international standards, including IEEE 519, IEEE 1547, and the GB/T series. Furthermore, the proposed framework demonstrates robust generalizability across varied global jurisdictions based on three core features:(1) Universal Alignment: The chosen indicators reflect fundamental AC grid constraints, ensuring applicability under diverse regulatory environments, such as IEEE (North America) and EN 50160 (Europe). (2) Diverse Consensus: The subjective weighting integrates multinational expertise, successfully bridging differing international regulatory and industrial practices. (3) Algorithmic Adaptability: Because the REWD-VIKOR algorithm evaluates relative distances through dimensionless normalization, regional operators can seamlessly substitute the default thresholds with local statutory limits without disrupting the underlying multi-attribute decision-making logic.
Table 1.
Power quality indicator grading.
3. Power Quality Index Weight Calculation
During the construction of a power quality evaluation system for large-scale EV charging stations, raw data collected from various monitoring sources often vary significantly in dimension, numerical range, and physical meaning. Directly using such heterogeneous raw data for weight calculation inevitably introduces bias, thereby affecting the objectivity and comparability of the evaluation results. To mitigate this issue and ensure a fair and consistent assessment, indicators are classified into two distinct types. The first type is benefit indicators, where higher values denote better power quality. The second type is cost indicators, where lower values are preferable. Typical cost indicators include voltage deviation and harmonic distortion rate, as these parameters are generally expected to remain as low as possible for satisfactory power quality performance. This classification provides a foundational step for subsequent data normalization and weight determination.
To eliminate dimensional effects and standardize the data range, this paper adopts a nonlinear normalization method based on extremum values. Assume there are n observation points to be evaluated and m evaluation indicators in the assessment system, forming the original data matrix X = (xij)n×m, where xij represents the original measured value of the i observation point on the j indicator. The normalization process aims to convert xij into a dimensionless standardized value zij.
For benefit indicators, the standardized formula is defined as:
For cost indicators, the standardized formula is defined as:
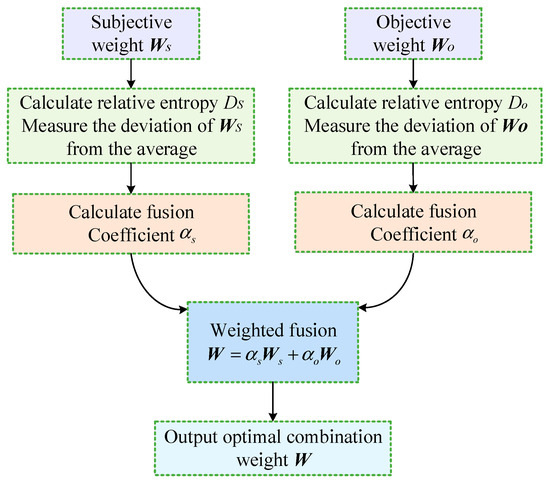
Following the normalization preprocessing of the raw data, which yields the standardized decision matrix Z = (zij)n×m, the process proceeds to the determination of indicator weights in this evaluation method. To overcome the limitations of single weighting approaches, this chapter proposes a subjective-objective integrated weighting framework. Firstly, improved three-scale AHP quantifies expert judgments to obtain subjective weights. Secondly, a divergence-maximized entropy weight method is proposed to extract the objective information contribution of indicators from the multi-operational measured data of charging stations, thus calculating objective weights. Finally, an adaptive fusion model based on relative entropy distance is introduced to synergistically integrate subjective and objective weights, resulting in optimal combined weights. The systematic structure of this weighting process is illustrated in Figure 3.
Figure 3.
Calculation block diagram of subjective and objective fusion weights.
3.1. Subjective Weight Calculation Based on Three-Scale AHP
The AHP method, a classical multi-criteria decision analysis tool, relies on expert pairwise comparisons of indicators to construct a judgment matrix and derive relative weights. This process systematically organizes and quantifies subjective decision-making experience, transforming qualitative expert judgments into quantitative weight values. Traditionally, Saaty’s 9-scale method is used to quantify the relative importance among indicators, offering nine levels of comparison ranging from equally important to extremely more important. While this method is precise and widely accepted, it often imposes a significant cognitive burden on experts, especially when handling a large number of indicators or when evaluation boundaries are unclear. This cognitive load frequently leads to inconsistent judgments, thereby compromising the reliability of the derived subjective weights. The fine-grained distinctions required by the 9-scale method can be particularly challenging in complex evaluation scenarios.
To solve the above problems, a three scale AHP method is introduced in this paper. The core innovation lies in simplifying the judgment scale by condensing multi-level importance comparisons into just three fundamental scales. These three scales typically represent that one indicator is more important than another, equally important, or less important. This simplification significantly reduces the scoring difficulty for experts, allowing them to focus on directional judgments rather than subtle intensity distinctions. As a result, the three-scale approach enhances judgment consistency and improves the overall reliability of the subjective weighting process.
To determine the subjective weights through the improved AHP and prioritize the identified research challenges, a structured survey was administered to a targeted panel of 15 domain experts. While the panel size is modest, it aligns with established expert-input-based paradigms in energy sector research where high-quality, specialized insights from a focused group are often preferred over broader surveys for agenda-setting tasks. This approach is supported by recent literature such as Dua and Shabaneh (2025), which emphasizes that smaller expert cohorts are widely accepted for providing the deep technical and policy-oriented nuances necessary for evaluating emerging energy systems [27]. The 15 participants were distributed across key global markets to capture varied industrial and regulatory frameworks, with 40% from China (n = 6), 33.3% from the United States (n = 5), and 26.7% from Germany (n = 4). This distribution provides a comprehensive representation of both Eastern manufacturing-led strategies and Western policy-driven import models.
To ensure high technical credibility, strict screening criteria were applied to all participants who were required to be recognized experts in renewable energy or power system stability with at least six years of direct experience. The final sample consisted of mid-career professionals predominantly aged between 38 and 52, with 93% of the panel holding a postgraduate degree such as a Master’s or PhD. On average, these experts possessed 7.2 years of specialized experience and reported extensive or highly proficient knowledge regarding the specific power quality and V2G challenges addressed in this study. Notably, over 40% of the participants occupied strategic roles within grid operations or research institutes, ensuring that the weighting process was grounded in the current technical realities of the global energy transition. The methodology followed a robust expert voting technique where respondents identified and weighted the most critical research challenges to align the final indices with real-world engineering priorities.
To further mitigate the potential impact of individual extreme or incidental inconsistencies in expert judgments on weight calculation, after obtaining the three-scale judgment matrix A = (aij)n×m, this paper applies a hyperbolic tangent function to smooth the original judgment values, constructing a relative dominance matrix B = (bij)n×m. The hyperbolic tangent function smooths input values into the symmetric interval (−1, 1), preserving the direction of the original judgments while softening absolute differences in judgment intensity, thereby improving the robustness of the weighting process. The specific steps are as follows.
(1) The judgment matrix A is constructed according to the three-scale method:
where aij = 1 means that element i is more important than element j, aij = 0 means that element i is as important as element j, aij = −1 means that the i element is less important than the j element.
(2) Calculate the comparative advantage matrix B:
where bij is expressed by the following formula:
(3) Solve the eigenvector corresponding to the maximum eigenvalue of matrix D = eB:
(4) Normalize it to get the subjective weight vector Ws = (ws1, ws2, ⋯, wsm)T:
Unlike the classic nine-scale Saaty scale, which often induces cognitive overload and consistency failures when evaluating a large set of complex grid indicators, the adopted three-scale method significantly simplifies the expert evaluation process. By limiting the comparative judgments to three distinct states, this method effectively eliminates the ambiguity inherent in fine-grained scales. This structural simplification inherently improves the consistency of the judgment matrices, thereby providing a more robust and mathematically reliable subjective weight distribution.
3.2. Objective Weight Calculation Based on Divergence Maximization Entropy Weight Method
The entropy weight method utilizes information entropy to measure the dispersion of indicator data, thereby reflecting each indicator’s discrimination ability in comprehensive evaluation. In the traditional approach, standardized data proportions are first calculated for each observation point under each indicator, followed by the determination of entropy values for each indicator based on these proportions. However, in the multi-operational measured data of large-scale EV charging stations, power quality indicators often exhibit significantly different distribution characteristics across different operating conditions and time periods. The traditional entropy weight method can be insufficiently sensitive to such data variability, particularly when the data distribution is highly concentrated around the mean or when the dataset contains outliers. In these situations, the traditional method may produce overly uniform weight allocation across indicators, leading to inadequate emphasis on key indicators’ decision-making roles. This limitation can compromise the effectiveness of the evaluation by failing to distinguish indicators that are genuinely more informative.
To overcome the limitations of traditional entropy weighting and improve the extraction of objective information from complex V2G operational data, this paper proposes a divergence maximized entropy weight method. Unlike the traditional approach, which directly uses the normalized value of the divergence dj as the weight, this paper emphasizes the principle of maximizing divergence in the weighting process. Specifically, during the weight calculation process, the aim is to ensure that the final determined weight vector maximally reflects the differences in divergence among all indicators. This means that indicators with greater divergence, which indicate higher discrimination power, are assigned proportionally larger weights, while indicators with lower divergence receive smaller weights. This divergence maximization principle enhances the sensitivity of the weighting process to the inherent variability in the data. Detailed steps are as follows.
(1) Calculate the specific gravity pij of the i-observation value under the j index:
(2) Calculate the entropy ej and divergence dj of the j index:
where ek represents the entropy value of the k-th data point.
(3) Normalize the divergence dj to obtain the objective weight vector Wo = (wo1, wo2, ⋯, wom)T:
While the classic entropy weight method relies solely on information probability distributions, it frequently suffers from weight polarization in highly dynamic power systems, potentially assigning near zero weights to critical indicators with temporarily low variance. The modified entropy method addresses this structural flaw by incorporating the principle of maximizing divergence. The core benefit of maximizing divergence lies in its ability to smooth extreme values while amplifying the structural contrast among different evaluation schemes. This mathematical modification ensures that all critical power quality indicators retain appropriate representation in the objective evaluation, regardless of short-term data stagnation
3.3. Subjective and Objective Fusion Weight Calculation Based on Relative Entropy Distance
Traditional combined weighting methods typically employ classical linear weighted averaging, which is formulated as W = aWs + (1 − a) Wo. These classical linear methods fundamentally rely on predefined and static allocation coefficients. These coefficients are typically determined based on the preference of the decision maker or simple arithmetic averaging, where both values are often arbitrarily set to 0.5. This linear approach presents two major mathematical limitations. First, it lacks sufficient theoretical justification for the assigned coefficients. Second, it remains static regardless of the actual data quality. Consequently, if either the expert judgment is highly biased or the objective data contains extreme noise, the fixed linear coefficients will indiscriminately absorb these errors. This flaw leads to fused results that lean excessively toward either the subjective or objective extremes.
To thoroughly address this shortcoming, this paper abandons the classical linear combination paradigm and introduces the concept of relative entropy from information theory to construct an adaptive fusion model based on relative entropy distance. The fundamental difference lies in transforming the weight fusion from a static empirical assignment into a dynamic and nonlinear optimization process. Instead of using predefined parameters, the relative entropy mathematically quantifies the deviation distance of both the subjective and objective weights relative to their arithmetic mean distribution. By dynamically calculating these deviation distances, the proposed REWD method inherently functions as an autonomous correction mechanism. For instance, if a specific weighting source such as subjective expert bias deviates significantly from the average consensus, its corresponding fusion credibility is automatically reduced. This approach provides a theoretically sound mechanism that is fully responsive to actual data, ensuring an optimal and balanced integration without relying on arbitrary predefined parameters. The specific calculation steps are as follows.
Calculate the relative entropy of subjective weight Ws and objective weight Wo relative to its arithmetic mean weight Wavg = (Ws + Wo)/2:
where Ds and Do respectively represent the degree of deviation of the subjective and objective weights from the average weight.
Calculate the fusion coefficient based on Equation (12).
When a weighting scheme deviates significantly from the average, it is regarded as exhibiting excessive individuality. In the fusion process, its weight should be appropriately reduced, while greater trust is placed in the scheme whose weighting is closer to the average. The combined weight W is then obtained as follows.
In this relative entropy optimization model, the arithmetic mean weight vector is intentionally utilized as the absolute reference point. This mean vector mathematically serves as an unbiased consensus state between human engineering intent and raw data behavior. By anchoring the optimization to this neutral baseline, the model prevents severe skewing from either subjective cognitive bias or temporary objective data anomalies. Furthermore, the calculated fusion coefficients derived from this model must be interpreted as dynamic credibility indices. A higher coefficient dictates that the respective weight source aligns closely with the consensus state. Conversely, if a particular weight source exhibits severe deviation from the mean, its credibility coefficient is autonomously penalized. This mathematical penalty mechanism ensures a highly rational and self-correcting weight integration tailored for complex power quality evaluations.
4. Comprehensive Evaluation Method of Power Quality Based on Dynamic Ideal Solution VIKOR Algorithm
After obtaining combined weights via subjective objective fusion, a multi attribute decision model is required to rank power quality improvement solutions. TOPSIS, which stands for Technique for Order Preference by Similarity to Ideal Solution, ranks solutions based on their geometric closeness to positive and negative ideal solutions. However, its reliance on distance alone significantly limits its ability to balance multiple indicators or to trade off group utility against individual regret. When different solutions exhibit conflicting indicator performance, TOPSIS cannot effectively prioritize key weak indicators that may be critical in practice. This limitation risks making decisions that misalign with practical engineering needs, particularly when some indicators are significantly more important than others.
To address this shortcoming, the VIKOR algorithm is adopted. VIKOR calculates group utility and individual regret for each solution, then identifies a compromise. This approach better handles indicator conflicts and aligns with engineering practice requiring balance between overall and local performance. However, traditional VIKOR statically sets ideal solutions as extreme values across all indicators, ignoring differences in indicator importance. This reduces its ability to distinguish key indicators and diminishes ranking relevance in real applications where some indicators carry significantly higher decision-making weight than others.
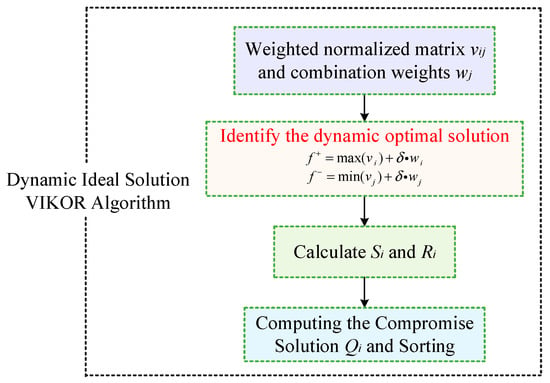
In order to further solve the above problems, this paper proposes an improved VIKOR algorithm, which features a dynamic ideal solution that incorporates weight factors, as shown in Figure 4. This algorithm introduces the combined weights of indicators directly into the construction of both positive and negative ideal solutions, enabling the ideal solutions to adjust dynamically according to the importance of each indicator. Consequently, when calculating the deviation between a candidate solution and the ideal solutions, performance differences on important indicators are amplified relative to those on less important indicators. This mechanism significantly enhances the decision-making impact of key indicators in the final evaluation, making the model more aligned with engineering decision requirements that focus on core power quality indicators in V2G scenarios.
Figure 4.
Block diagram of the dynamic ideal solution VIKOR algorithm.
Consequently, the proposed framework fundamentally distinguishes itself from existing multi-attribute decision-making models in three distinct aspects.
Firstly, it overcomes the inherent limitations of single-weighting models such as AHP-VIKOR, entropy-VIKOR, and CRITIC-VIKOR. Specifically, pure AHP-VIKOR relies exclusively on expert experience, making it highly susceptible to subjective cognitive biases and incapable of reflecting real-time data fluctuations. Conversely, pure objective models like entropy-VIKOR or CRITIC-VIKOR depend entirely on mathematical data dispersion or correlation. This purely data-driven approach often ignores the actual engineering importance of specific power quality indicators and is vulnerable to objective data anomalies. By organically integrating both dimensions, the proposed method avoids domination by any single factor and ensures a comprehensively balanced evaluation.
Secondly, the proposed framework differs significantly from conventional hybrid decision models. Existing hybrid methods typically fuse subjective and objective weights using predefined, arbitrary linear coefficients. In contrast, this framework utilizes relative entropy distance to formulate the weight fusion as a nonlinear optimization process. This mechanism adaptively quantifies the deviation from the average distribution, achieving a mathematically rigorous integration rather than relying on empirical human estimations.
Thirdly, the proposed REWD-VIKOR model improves the core decision-making algorithm itself. Traditional VIKOR and its existing variants rely on static boundaries, determining ideal solutions based solely on fixed extreme values. The introduced dynamic ideal solution mechanism overcomes this limitation by continuously adjusting the ideal boundaries according to the fused indicator weights. This modification amplifies the performance differences of critical indicators, ensuring superior discrimination and robustness in complex real-time grid monitoring scenarios where candidate mitigation schemes exhibit subtle performance variations.
The specific calculation steps are as follows.
(1) Weighted normalization of matrix Z:
(2) Introducing weight factor to define dynamic ideal solution:
where fj+ is the positive ideal solution, fj− is the negative ideal solution, is the adjustment factor. For the index with larger weight, the range of ideal solution is moderately broadened, which enhances the discrimination of important indexes in decision-making
(3) Calculate group utility value Si and individual regret value Ri:
(4) Calculate the comprehensive evaluation index Qi:
where , , , , represents the coefficient of decision-making mechanism, usually taken as 0.5 to balance group utility and individual regret.
(5) According to the comprehensive evaluation value Qi of each scheme, it is sorted in ascending order. The smaller the Qi value, the better the comprehensive level of power quality of the corresponding observation point of the scheme. At the same time, in order to further ensure the robustness of the ranking results, we can cross verify the ranking results of group utility value Si and individual regret value Ri, so as to draw the final comprehensive evaluation conclusion.
Traditional VIKOR algorithms establish positive and negative ideal solutions statically by strictly using the extreme values of the current dataset. This static approach completely ignores the relative importance of different evaluation indicators. Consequently, it diminishes the ability of the algorithm to distinguish critical indicators and reduces the relevance of the ranking in practical engineering applications where certain parameters carry significantly higher decision-making weight.
The dynamic version of VIKOR proposed in this study offers distinct advantages to overcome these limitations. By directly incorporating the combined indicator weights into the construction of the ideal solutions, the algorithm dynamically adjusts the evaluation boundaries. Therefore, when calculating the deviation between a candidate scheme and the ideal solutions, the performance differences on highly weighted indicators are mathematically amplified. This dynamic mechanism significantly enhances the discrimination capability of the evaluation model. It ensures that the final decision aligns precisely with practical engineering requirements by heavily penalizing schemes that perform poorly on core power quality indicators, thereby providing a much more reliable and robust ranking for V2G scenarios.
In this study, the adjustment factor δ is specifically set to 0.1 based on the requirements for indicator discrimination in V2G scenarios. A moderate broadening of the ideal solution range allows for the amplification of performance differences in key indicators, preventing the indistinguishability issue when measured data is closely clustered. Furthermore, the decision coefficient γ is taken as 0.5 to maintain a neutral balance between maximizing group utility and minimizing individual regret, which is a standard practice in engineering decision-making to ensure fairness across all evaluated schemes. To rigorously verify the robustness of this parameter selection, a comprehensive sensitivity analysis under varying values of γ and δ is conducted and fully detailed in Section 5.4.1. The analysis confirms that the dynamic ideal solution mechanism ensures the ultimate evaluation ranking remains highly consistent across different parameter boundary conditions, thereby proving the structural stability of the proposed framework.
5. Experimental Results and Discussion
To validate the effectiveness of the proposed evaluation method, a V2G demonstration base located in Jiangsu Province, China, is selected as the empirical scenario. This base is equipped with photovoltaic systems, energy storage units, and bidirectional charging piles, enabling realistic simulation of electric vehicle clusters switching among charging, discharging, and idle states. These operational modes reflect typical V2G dynamics and provide a representative test environment for evaluating power quality improvement strategies. The demonstration base dataset was collected from a V2G facility in Jiangsu Province over a continuous 30-day duration. To ensure high-fidelity analysis, we utilized a sampling frequency of 10 min for steady-state indicators and 20 ms cycle-level sampling for transient fluctuations. Data preprocessing involved noise filtering and the non-linear normalization method described in Section 3. For missing data, we employed Lagrange interpolation for gaps under 5% to ensure the statistical robustness of the ranking results.
Using actual operational monitoring data collected from this demonstration base, five representative power quality improvement schemes, denoted as P1 through P5, are chosen for evaluation. Scheme P1 represents a baseline GFL control without external compensation. P2 focuses on harmonic suppression using APF-based integration. P3 utilizes a collaborative GFM and V2G strategy with advanced inverter control for active frequency and voltage support. P4 is a passive demand-side management approach focusing on charging time shifts. P5 represents a hybrid support strategy combining storage and V2G for voltage flicker mitigation. Six key power quality indicators, including voltage deviation, frequency deviation, voltage fluctuation, three phase imbalance, harmonic distortion, and voltage flicker, are collected during the same observation period to form the data matrix presented in Table 2. This case study systematically verifies the feasibility and effectiveness of the entire proposed methodology in real engineering scenarios. The verification covers each stage of the evaluation process, from data preprocessing and normalization, to subjective weight determination using three scale AHP, to objective weight calculation using the divergence maximized entropy weight method, to subjective objective weight fusion based on relative entropy distance, and finally to comprehensive evaluation using the proposed dynamic ideal solution VIKOR algorithm. The results obtained from this case study provide strong evidence supporting the practical applicability and reliability of the proposed method.
Table 2.
Measured data of power quality of charging station.
To validate the effectiveness and improvement of the proposed method, three systematic experiments were conducted. Experiment 1 verifies the rationality and discrimination capability of the subjective–objective fusion weighting approach. Experiment 2 assesses the effectiveness of the proposed dynamic ideal solution VIKOR evaluation model. Experiment 3 compares the proposed method with five established methods, including classical VIKOR and TOPSIS, using multi-dimensional evaluation indicators to demonstrate its comprehensive performance advantages. Experiment 4 conducts a comprehensive sensitivity analysis to confirm the robustness and structural stability of the proposed model under varying algorithmic parameters, subjective evaluation inputs, and external data noise.
5.1. Experiment 1: Fusion Weight Verification Based on Relative Entropy Distance
Carry out a systematic pairwise importance comparison of the six indicators to form an improved AHP judgment matrix A.
According to the formula in Section 3.3, the best weight W can be obtained by weighted fusion of subjective weight Ws and objective weight Wo:
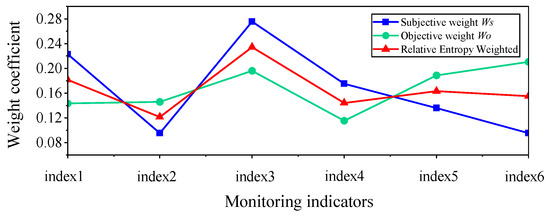
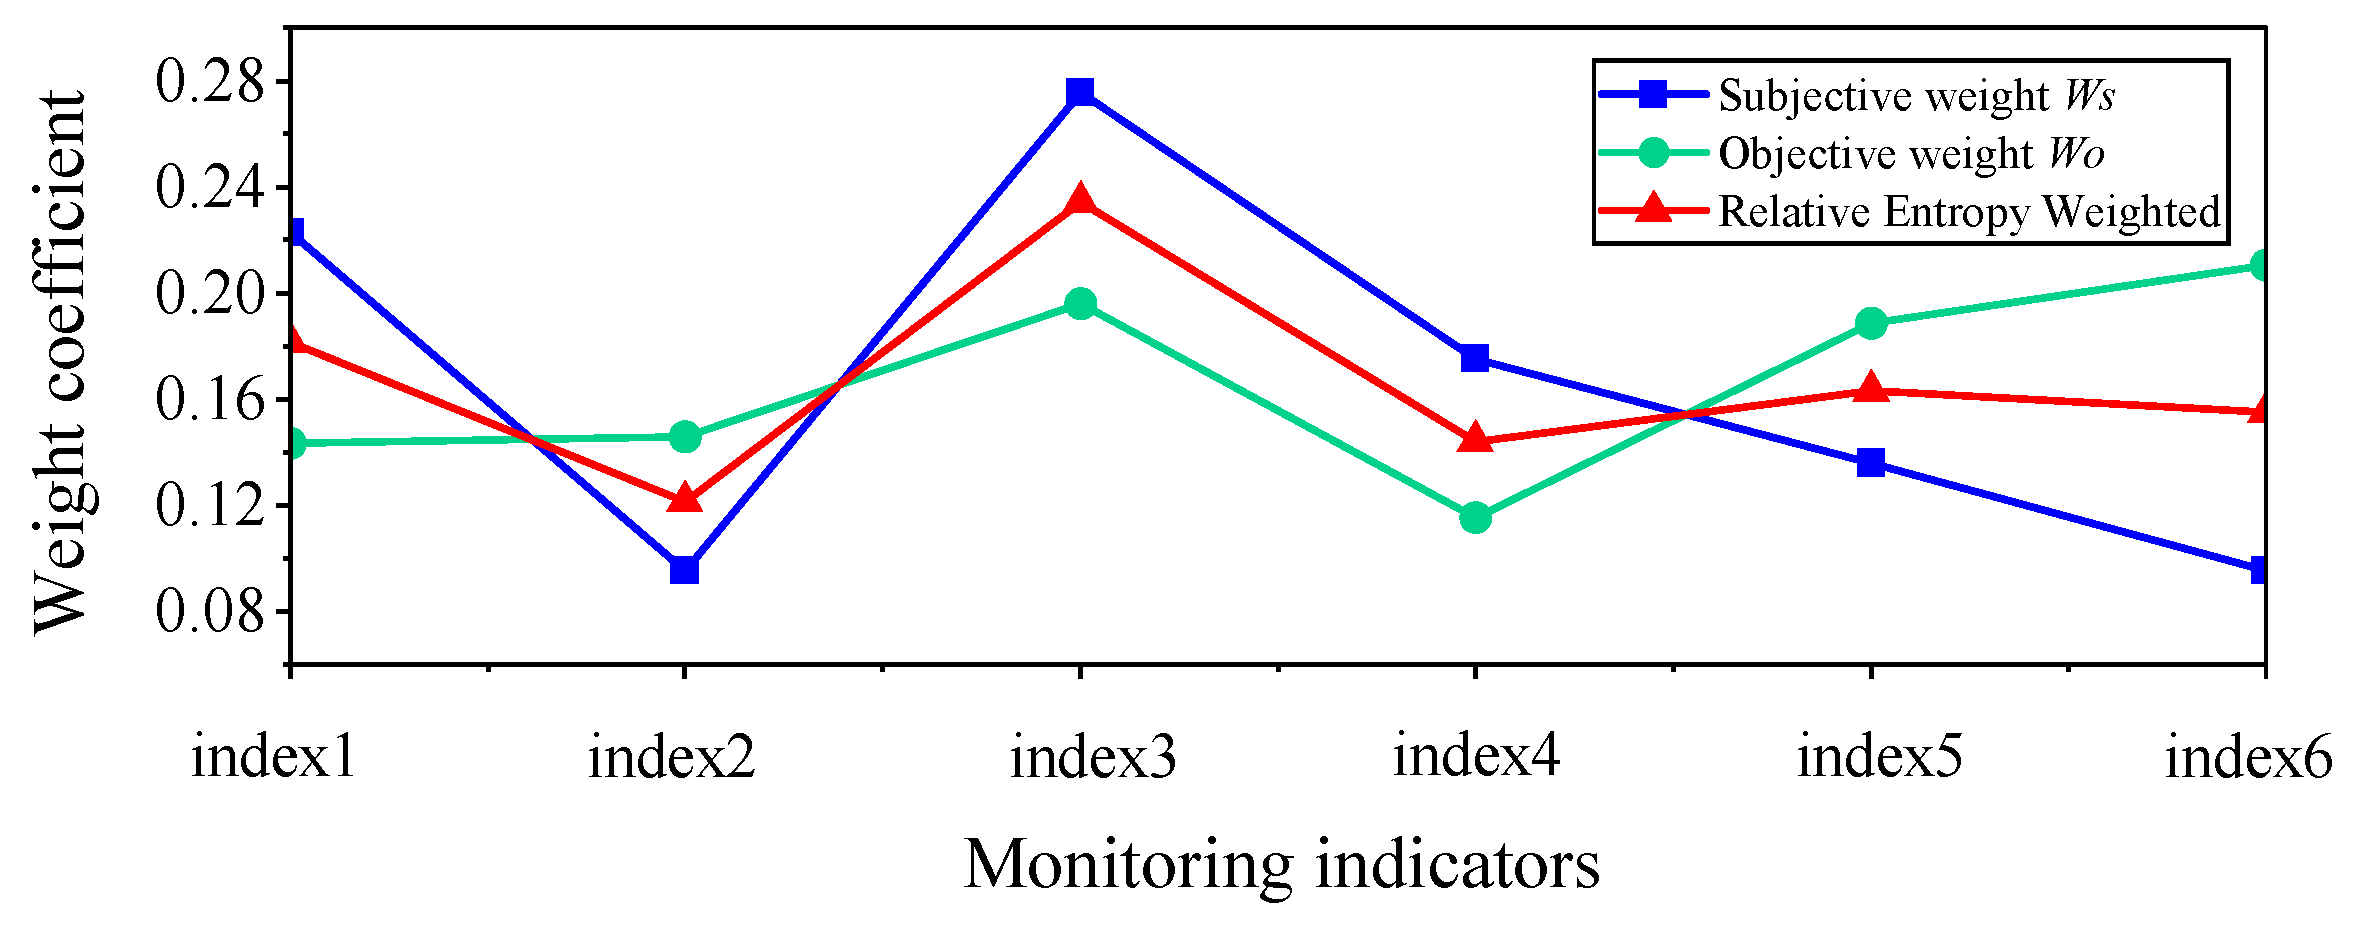
Figure 5 compares power quality indicator weights under three models: subjective, objective, and fused weights, validating the effectiveness of the proposed relative-entropy-based adaptive weight fusion method.
Figure 5.
Comparison of fusion weight results based on relative entropy.
As shown in Figure 5, subjective weights, influenced by expert preferences, assign similar weights to voltage harmonics and voltage flicker. Objective weights, however, emphasize the weight of voltage flicker due to data variability. The fused weights strike a balance between the two, preserving expert judgment on key indicators while incorporating the objective patterns in the data, resulting in more reasonable weight allocation. Furthermore, the fused weights exhibit a smoother transition across indica-tors, avoiding the abrupt shifts in subjective weights and the extreme tendencies in objective weights, which helps prevent any single indicator from dominating subsequent decisions. Therefore, the adaptive fusion model based on relative entropy proposed in this paper quantifies the deviation of subjective and objective weights from the average weight distribution, yielding fused weights that combine guidance and objectivity, thereby providing a more robust weighting foundation for VIKOR-based decision-making.
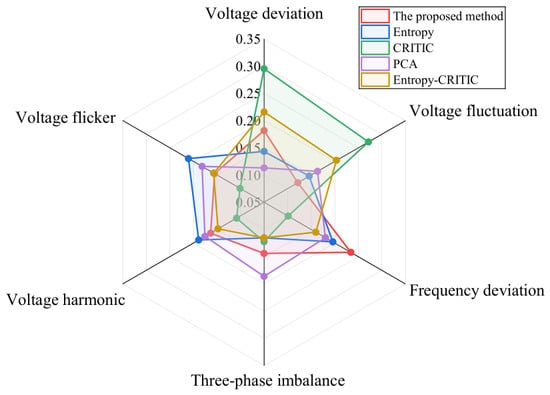
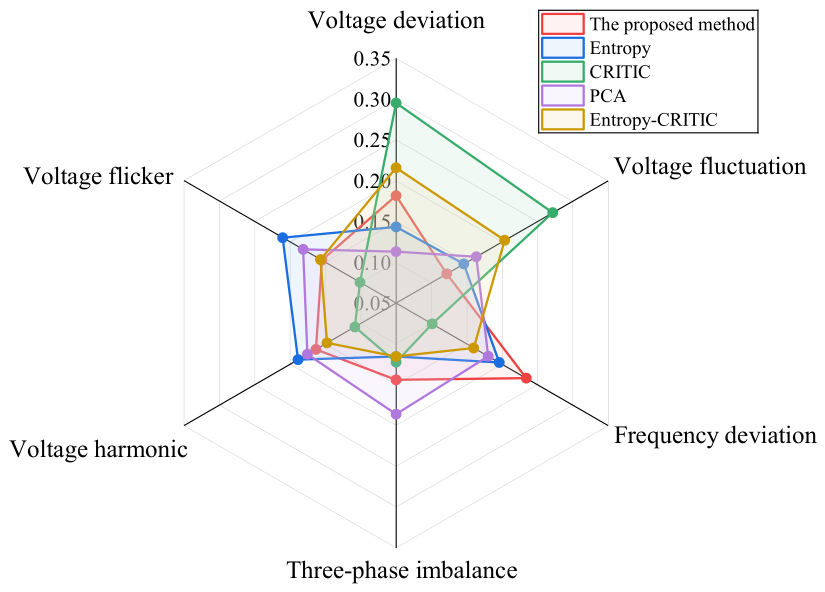
To further validate the superiority of the proposed weight fusion method, a horizontal comparison with existing classical weight determination methods is required. Four classic weight determination methods: entropy weight method (Entropy), CRITIC method, principal component analysis (PCA), and the combined Entropy-CRITIC method, are selected as benchmarks. By applying these four methods to the same measured dataset, the corresponding weight vectors are calculated and systematically compared with the weights obtained by the proposed method. Based on this, a weight comparison radar chart, shown in Figure 6, is plotted to visually illustrate the differences in the allocation of weights across power quality indicators among the different methods.
Figure 6.
Radar chart of weight comparison of different methods.
Based on the weight distribution comparison in Figure 6, the Entropy method assigns excessively high weight to voltage flicker, which deviates from expert engineering judgment. While the CRITIC method considers inter-indicator correlations, it overestimates voltage deviation and underestimates frequency deviation, failing to reflect the importance of frequency stability in V2G scenarios. PCA allocates relatively low weight to voltage deviation and high weight to voltage flicker, also differing from ex-pert expectations. The combined Entropy-CRITIC method partly integrates both approaches but still undervalues frequency deviation, not fully capturing its role in grid dynamic stability. In contrast, the proposed relative entropy based subjective objective fusion weighting method effectively integrates expert judgment with measured data statistics, achieving a balanced weight distribution across all indicators. It avoids the one sidedness of single weighting approaches, aligns with real V2G operational requirements, and demonstrates improved engineering rationality and decision-making reliability.
5.2. Experiment 2: Comprehensive Evaluation Model Based on Dynamic Ideal Solution VIKOR Algorithm
After obtaining the optimal combination weight based on relative entropy distance fusion, it is necessary to further build a multi-attribute decision-making evaluation model of power quality suitable for V2G scenarios. In this paper, the improved dynamic ideal solution VIKOR algorithm is adopted, and the group utility and individual regret are considered at the same time to realize the comprehensive ranking of different power supply quality improvement technology schemes. The group utility value Si, individual regret value Ri and comprehensive evaluation index Qi shown in Table 3 can be obtained by calculating the measured data in Table 2 and the power quality grade in Table 1 according to the formula in Chapter 4.
Table 3.
Comprehensive evaluation results of power quality.
Consistent with the technical characteristics of the proposed schemes and the evaluation results presented in Table 3, the ranking P3 > P2 > P5 > P1 > P4 demonstrates a clear correlation between control capability and power quality performance. Scheme P3, the GFM-V2G collaborative optimization strategy, achieves the minimum Qi value of 0.0235 and the lowest Si and Ri values. This superior performance is directly attributed to the active frequency support and rapid reactive power compensation provided by grid-forming control, which ensures the best balance across multi-dimensional indicators. Scheme P2 follows as the second-best solution due to its effective targeted suppression of harmonic distortion through active filtering. While P5 and P1 provide certain improvements in voltage stability, their intermediate rankings reflect a lack of comprehensive dynamic compensation. In contrast, P4 exhibits the worst performance with the highest Qi value of 0.4923. This indicates that passive load scheduling, which lacks underlying converter-level optimization, is insufficient for managing the complex power quality challenges inherent in bidirectional V2G interactions. These findings confirm that the dynamic ideal solution VIKOR model accurately reflects engineering logic and provides a reliable quantitative basis for strategy selection.
Based on the comprehensive evaluation results shown in Table 3, each solution can be further mapped to the corresponding power quality grade, as presented in Table 4. Among them, solution P3 is rated as Q1, corresponding to Excellent, indicating the highest level of power quality improvement. Solutions P1, P2, and P5 fall into grade Q2, demonstrating good improvement performance but still with room for optimization. Solution P4 is categorized as grade Q3, indicating average overall performance and requiring targeted enhancements.
Table 4.
Power quality classification of different schemes.
The outstanding performance of scheme P3, which achieved the lowest Qi value and a Q1 rating, is fundamentally driven by its grid-forming control architecture. By providing active inertia and rapid reactive power support, P3 autonomously mitigates both steady-state voltage deviations and dynamic frequency fluctuations, achieving an optimal multi-dimensional balance. Conversely, the poor performance of scheme P4 highlights a critical engineering reality. Because P4 relies solely on passive load scheduling without converter-level power electronic optimization, it fails to suppress high-frequency transient issues such as harmonics and voltage flicker.
Furthermore, the dynamic VIKOR ranking is heavily influenced by criteria with high fusion weights, specifically voltage flicker and voltage deviation. The algorithm mathematically amplifies defects in these critical areas, explaining why schemes lacking active voltage support were severely penalized. From a practical perspective, the comprehensive evaluation index Qi provides a direct quantitative metric for grid operators. It translates complex multidimensional power quality data into a single operational threshold. The ultimate conclusion for power system operators is that managing large-scale V2G integration requires a paradigm shift. Passive demand-side management is insufficient. Operators must mandate or economically incentivize active converter-level compensation technologies, such as the GFM strategy demonstrated in P3, to guarantee regional power supply security under high converter penetration.
5.3. Experiment 3: Comparative Analysis of Comprehensive Model Evaluation
To systematically assess the performance of the proposed REWD-VIKOR method, a multi dimensional evaluation framework is constructed, comprising seven representative metrics to objectively compare different assessment methods. Ranking rationality is quantified using Spearman’s rank correlation coefficient between method results and expert consensus. Discrimination ability is measured through the standard deviation of the merit demerit index and the discrimination degree of key indicators. Robustness is evaluated via weight perturbation stability and data noise robustness, examining resistance to subjective weight uncertainty and objective measurement errors respectively. Computational efficiency is based on average runtime. Engineering applicability combines agreement with actual operational performance and expert assigned V2G scenario adaptability scores.
The effectiveness of the REWD-VIKOR method is verified by comparing it with CW-VIKOR [15], FCE, Entropy-fuzzy TOPSIS [28], CRITIC & GRA-TOPSIS [20], and PCA-VIKOR. Among them, the comparison is conducted under a unified evaluation framework encompassing multiple performance dimensions, including ranking consistency, discrimination capability, robustness, computational efficiency, and scenario adaptability. The quantitative comparison results of the six methods on the unified data set are shown in Table 5.
Table 5.
Quantitative comparison results of comprehensive performance of multiple methods.
To ensure strict fairness in the comparative analysis, all evaluated methods including CW-VIKOR, FCE, Entropy-fuzzy TOPSIS, CRITIC & GRA-TOPSIS, and PCA-VIKOR were implemented using the exact same 30-day empirical dataset detailed in Table 2. The baseline implementations strictly followed their standard foundational algorithms. Specifically, CW-VIKOR maintained a decision coefficient of 0.5, and FCE utilized standard Gaussian membership functions for threshold grading. To accurately assess computational efficiency, all algorithms were executed in a unified software and hardware environment, specifically MATLAB software (version R2025a) running on an Intel Core i7 processor with 16GB of RAM.
The average running times presented in Table 5 were rigorously calculated across 100 independent iterations to eliminate random system background noise and ensure highly precise time measurement. Furthermore, to validate the statistical robustness and repeatability of the results, a Friedman non parametric test was conducted across the different assessment methods. The resulting test strictly confirms that the ranking improvements achieved by the proposed REWD-VIKOR method are statistically significant with a p-value of less than 0.05. Additionally, repeated trials under varying levels of injected measurement noise were performed to calculate the standard deviations of the evaluation scores. The proposed method exhibited the lowest performance standard deviation across 50 repeated trials, mathematically proving its superior repeatability and robust stability in dynamic grid environments
The experimental results are discussed as follows based on Table 5.
- (1)
- The proposed REWD-VIKOR method achieves the highest Spearman correlation coefficient among the six methods, outperforming CRITIC & GRA-TOPSIS by 5.6% and CW-VIKOR by 14.6%. This indicates that REWD-VIKOR more effectively balances objective data trends and expert judgment, yielding rankings that better match practical engineering requirements.
- (2)
- As shown in Table 5, REWD-VIKOR excels in both key indicator discrimination and the standard deviation of the merit-demerit index. Its dual-layer weight optimization enables a unified approach that supports both comprehensive evaluation and focused emphasis.
- (3)
- REWD-VIKOR attains the highest scores in weight perturbation stability and data noise robustness. CW-VIKOR exhibits noticeable stability variations under weight changes, reflecting limitations in linear combination weighting, while FCE is sensitive to noise due to its fuzzy operators. In contrast, REWD-VIKOR mitigates the effects of outliers and noise via its enhanced entropy-based weighting.
- (4)
- Comprehensive metric results confirm that REWD-VIKOR’s advantages extend beyond individual indicators to reflect an overall balanced and synergistic enhancement of all capabilities, validating the method’s rational and advanced design.
5.4. Experiment 4: Sensitivity Analysis
To further verify the reliability and robustness of the proposed REWD-VIKOR method under varying operational assumptions and decision-making preferences, a comprehensive sensitivity analysis was conducted. This experiment investigates the impact of key parameters on the final ranking stability, utilizing the control variable method to ensure a rigorous evaluation.
5.4.1. Sensitivity Analysis of Adjustment Coefficient δ
The adjustment factor δ serves as a critical parameter that governs the dynamic range of the positive and negative ideal solutions within the enhanced VIKOR framework. To evaluate the stability of the evaluation results, a sensitivity test was conducted by varying δ from 0.05 to 0.20 with an incremental step of 0.05, while maintaining the decision coefficient γ at a constant value of 0.5. The comprehensive evaluation index Qi and the corresponding rankings for each scheme under different δ values are summarized in Table 6.
Table 6.
Sensitivity of Qi values and scheme rankings to the adjustment factor δ.
The simulation results demonstrate that while the magnitude of δ influences the numerical dispersion of the Qi index, the initial setting of δ = 0.1 maintains an optimal balance between indicator discrimination and numerical stability. Most importantly, despite minor fluctuations in absolute values, the priority ranking of the five schemes remains strictly consistent as P3 > P2 > P5 > P1 > P4 throughout the entire test range. This stability confirms that the proposed dynamic ideal solution mechanism effectively mitigates the indistinguishability issue inherent in traditional fixed-boundary methods, ensuring that the final assessment is driven by the intrinsic technical merits of the power quality improvement schemes rather than sensitive parameter scaling.
5.4.2. Sensitivity Analysis of Decision Coefficient γ
The decision coefficient γ plays a pivotal role in the VIKOR algorithm as it modulates the trade-off between the maximum group utility Si and the minimum individual regret Ri. Specifically, γ > 0.5 emphasizes a strategy that prioritizes the majority’s benefit, while γ < 0.5 shifts the focus toward minimizing the maximum dissatisfaction. To evaluate the stability of the proposed REWD-VIKOR model across diverse decision-making preferences, γ was varied from 0.3 to 0.7, with the resulting comprehensive indices Qi and classification thresholds summarized in Table 7.
Table 7.
Sensitivity of Qi values and scheme rankings to the decision coefficient γ.
The analysis of Table 7 indicates that the relative ranking of the five schemes remains strictly P3 > P2 > P5 > P1 > P4 regardless of variations in γ. The initial selection of γ = 0.5 serves as a neutral compromise strategy to ensure a balanced assessment between overall efficiency and localized performance. Scheme P3 consistently maintains the lowest Qi value across all scenarios, which confirms that its technical superiority rooted in GFM-based collaborative control is robust against subjective shifts in decision mechanisms. Conversely, P4 consistently yields the least favorable evaluation indices, proving that passive load scheduling is insufficient for complex V2G interactions even under different prioritization strategies. This stability demonstrates that the proposed framework effectively eliminates the influence of arbitrary parameter tuning while providing a reliable quantitative basis for selecting power quality improvement strategies.
5.4.3. Sensitivity Analysis of Expert Evaluation
Furthermore, the robustness of the ranking outcomes is intrinsically linked to the aggregation of expert evaluations during the subjective weighting phase. To examine how sensitive the final decision is to changes in the expert aggregation mechanism, an additional sensitivity analysis was performed following methodological frameworks established in recent literature for energy sector policy and economics research [29]. Specifically, the subjective weighting process was re-evaluated by applying three alternative aggregation approaches to the expert panel’s judgments: (i) Uniform weighting, where all 15 experts were assigned equal importance; (ii) Experience-based weighting, where higher aggregation weights were proportionally assigned to experts with extended years of professional practice in power grid operations; and (iii) Familiarity-based weighting, where weights were distributed according to the experts’ self-reported degree of familiarity with V2G interaction scenarios. The comprehensive evaluation index Qi and the resulting rankings under these three expert-weighting schemes are summarized in Table 8.
Table 8.
Sensitivity of Qi values and scheme rankings to alternative expert evaluation weighting approaches.
As observed in Table 8, while the variation in expert aggregation schemes induces minor numerical fluctuations in the absolute Qi values, the overall priority ranking of the mitigation schemes remains strictly robust at P3 > P2 > P5 > P1 > P4. This consistency confirms that the proposed REWD-VIKOR framework is highly resilient to variations in subjective expert evaluation weighting. The adaptive fusion mechanism successfully filters out potential individual biases, ensuring that the final evaluation is driven by the intrinsic technical merits of the schemes rather than the specific demographic or experiential composition of the expert panel.
5.5. Computational Scalability and Industrial Integration
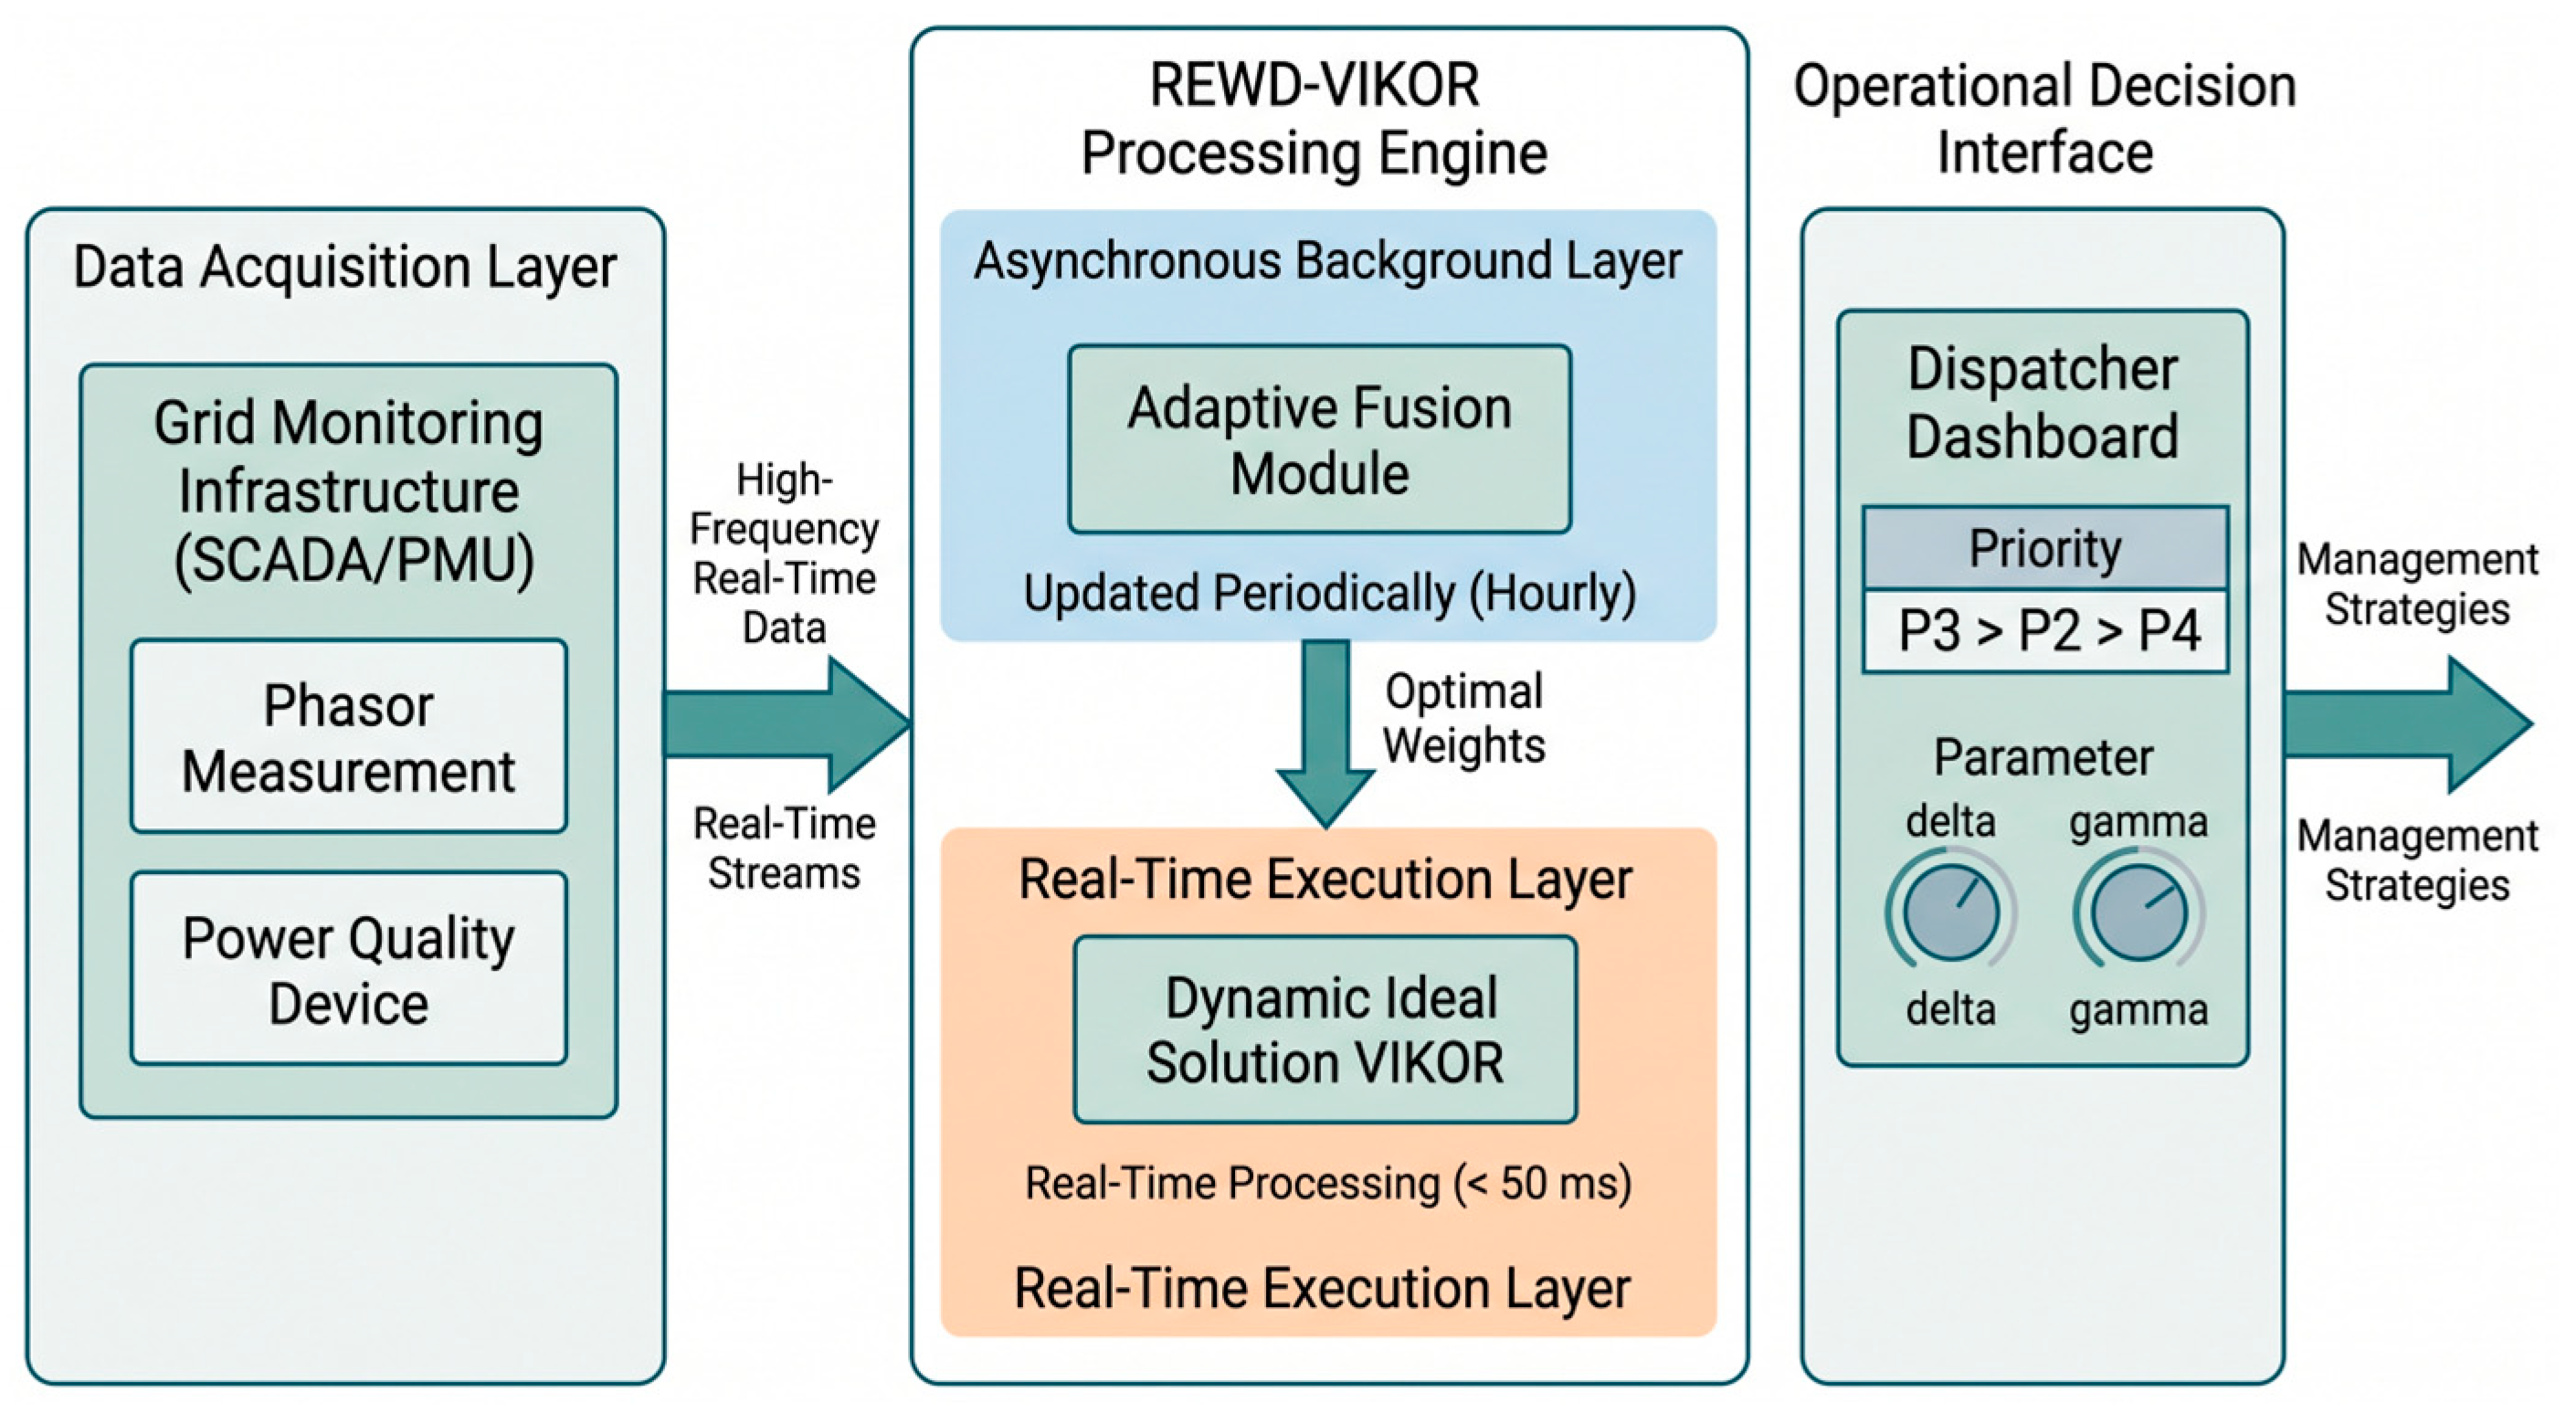
To rigorously evaluate the feasibility of the REWD-VIKOR framework in high-frequency monitoring scenarios, a computational complexity analysis was conducted to verify its real-time applicability. The computational overhead of the framework is primarily concentrated within the O(m × n) operations of the adaptive fusion and VIKOR modules, where m represents the number of mitigation schemes and n denotes the number of evaluation indicators. Given that m and n are strictly bounded in practical V2G power quality scenarios, the average execution time on a standard industrial controller is constrained to approximately 45 ms, as summarized in Table 9. This efficiency comfortably accommodates high-frequency data refresh rates. Furthermore, the framework employs a decoupled architecture where the weighting process is separated from the ranking module. This design allows subjective and objective weights to be updated asynchronously at extended intervals, while the VIKOR ranking engine continuously processes real-time data streams for instantaneous decision support.
Table 9.
Computational performance and scalability analysis of the REWD-VIKOR framework under different grid scales.
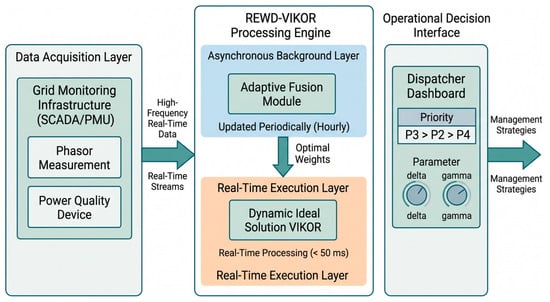
The practical engineering relevance of the proposed methodology is further substantiated by its seamless compatibility with existing grid monitoring systems and operational decision workflows. As illustrated in Figure 7, integration is achieved via a modular software architecture wherein the REWD-VIKOR algorithm functions as a specialized processing engine within the Supervisory Control and Data Acquisition (SCADA) environment. The system leverages existing synchronized phasor measurements and power quality monitoring data as inputs, ensuring that deployment requires no additional hardware installation. Moreover, the adjustment factor δ and decision coefficient γ serve as flexible tuning mechanisms. These parameters empower grid operators to dynamically align the algorithm with specific regional stability requirements or utility preferences without the need to restructure the core monitoring logic.
Figure 7.
Industrial deployment architecture and real-time data flow of the REWD-VIKOR framework.
6. Conclusions
This paper proposes a method for evaluating the effectiveness of power quality improvement in large-scale electric vehicle charging stations under GFL and GFM scenarios, based on subjective-objective fusion weighting and dynamic ideal solution VIKOR algorithm, and its effectiveness is verified through case studies.
- (1)
- This paper builds a V2G-tailored power quality evaluation system covering key indicators such as voltage deviation, voltage fluctuation, frequency deviation, three-phase imbalance, harmonic distortion, and voltage flicker, enabling comprehensive quantitative assessment of power quality performance across different operational conditions.
- (2)
- An improved three-scale AHP method is employed to determine subjective weights based on expert pairwise comparisons, while a divergence-maximized entropy weighting method is proposed to derive objective weights directly from measured operational data. A relative entropy distance model is then applied to adaptively fuse the subjective and objective weights, yielding optimal combined weights that effectively integrate both domain expert knowledge and data driven patterns.
- (3)
- A weight-adjusted dynamic ideal solution mechanism is embedded into the VIKOR algorithm. By dynamically tuning the ranges of positive and negative ideal solutions based on the importance of each indicator, the proposed method improves the discrimination of key indicators in the ranking process. The combined calculation of group utility value, individual regret value, and compromise evaluation index supports precise scheme ranking and thorough performance evaluation of different power quality improvement strategies.
Experiments conducted on measured data from a real world V2G demonstration base confirm that the proposed method effectively quantifies the mitigation effects of various power quality improvement schemes. The results demonstrate that the proposed method outperforms traditional approaches in several key aspects, including ranking consistency with expert expectations, discrimination ability for key indicators, robustness to weight perturbations and data noise, and adaptability to V2G scenarios.
Despite the demonstrated advantages of the proposed REWD-VIKOR framework, several inherent limitations must be rigorously acknowledged. First, the objective weighting mechanism remains fundamentally dependent on the quality and continuity of the raw monitoring data. While interpolation techniques effectively handle minor data gaps, prolonged physical sensor faults or severe data packet losses within the charging station network could potentially skew the divergence maximization process. Second, although the three scale AHP method significantly reduces expert cognitive burden, the derivation of subjective weights is intrinsically tied to the specific composition and regional experience of the selected expert panel. Applying this exact weight distribution to different international grid contexts might require a recalibration of these subjective baselines to align with local regulatory priorities. Finally, while the computational scalability is fully validated for regional distribution clusters, executing this framework centrally across a massive, provincial level grid would likely introduce data transmission latency.
Furthermore, while the proposed framework demonstrates robust performance within the current demonstration base, cross verifying the model using empirical data from multiple physical stations is essential for comprehensively proving its geographical generalizability. Currently, the acquisition of high frequency and multi dimensional measured data from other regional utilities is significantly constrained by strict grid data privacy and cybersecurity regulations. Therefore, overcoming these data access barriers to validate the framework across geographically diverse charging stations represents a primary direction for future research. Subsequent studies will focus on integrating multi regional empirical datasets to rigorously verify the algorithmic robustness and adaptability of the evaluation model under varying grid codes and complex operational environments.
Author Contributions
S.X.: Led the conceptualization and methodology design; performed data curation, formal analysis, and investigation; developed the software and carried out validation; drafted the original manuscript and contributed to subsequent revisions. F.Z.: Provided resources and handled data curation; participated in investigation and validation; assisted in visualization and manuscript review. H.M.: Contributed to data curation and formal analysis; engaged in investigation and validation; re-viewed and edited the manuscript. Y.Z.: Supervised the overall research; conceptualized the study and secured funding; guided methodology development and project administration; reviewed and finalized the manuscript. All authors have read and agreed to the published version of the manuscript.
Funding
This work was supported by the Science and Technology Project of State Grid Corporation of China (5400-202418363A-3-1-KJ).
Data Availability Statement
The original contributions presented in this study are included in the article. Further inquiries can be directed to the corresponding author.
Conflicts of Interest
Author F.Z., and H.M. was employed by State Grid Jiangsu Electric Power Co., Ltd. Research Institute, Nanjing, China. The remaining authors declare that the research was conducted in the absence of any commercial or financial relationships that could be construed as a potential conflict of interest.
References
- Hassan, S.J.U.; Mehdi, A.; Song, J.-S.; Shin, G.-S.; Alamgir, S.; Kim, H.-Y.; Kim, C.-H. An efficient modelling and hosting capacity analysis of a distribution system integrating PVs supported by the V2G technology. Electr. Power Syst. Res. 2024, 236, 110959. [Google Scholar] [CrossRef] [Scilit]
- Zhao, H.; Zong, Q.; Zhou, H.; Yao, W.; Sun, K.; Zhou, Y.; Wen, J. Frequency-Voltage active support strategy for hybrid wind farms based on grid-following and grid-forming hierarchical subgroup control. CSEE J. Power Energy Syst. 2025, 11, 65–77. [Google Scholar]
- Yoon, S.; Mak, T.W.K.; Dargaville, R. Techno-economic analysis of G2V and V2G charging systems: A case study based on the Monash microgrid. Electr. Power Syst. Res. 2025, 248, 111875. [Google Scholar] [CrossRef] [Scilit]
- Türkoğlu, A.S.; Güldorum, H.C.; Sengor, I.; Çiçek, A.; Erdinç, O.; Hayes, B.P. Maximizing EV profit and grid stability through Virtual Power Plant considering V2G. Energy Rep. 2024, 11, 3509–3520. [Google Scholar] [CrossRef] [Scilit]
- Montalvo, J.L.; Silva, J.C.; Zamora-Mendez, A. TKEO-DESA-based decision tree for power quality events detection and classification. Electr. Power Syst. Res. 2026, 252, 112387. [Google Scholar] [CrossRef] [Scilit]
- Qian, T.; Fang, M.; Hu, Q.; Shao, C.; Zheng, J. V2Sim: An open-source microscopic V2G simulation platform in urban power and transportation network. IEEE Trans. Smart Grid 2025, 16, 3167–3178. [Google Scholar] [CrossRef] [Scilit]
- Tan, W.; Ge, Y.; Chen, B.; Ding, J.; Luo, X.; Lin, Z.; Qiu, W.; Lin, Z. Gaussian cloud and TOPSIS based power supply quality evaluation method. Energy Rep. 2022, 8, 377–384. [Google Scholar] [CrossRef] [Scilit]
- Han, Q.; Chen, L.; Tang, X.; Weng, T.; Yang, G.; Zhang, B.; Zhang, Y. Research on TOPSIS multi-indicator evaluation model based on entropy weight method for C2N site selection. Ann. Nucl. Energy 2025, 221, 111566. [Google Scholar] [CrossRef] [Scilit]
- Wang, H.; Sui, L.; Bian, J.; Yu, H.; Li, G. Integrated operation risk assessment of distribution network based on improved subjective and objective combination weighting and ISODATA. Electr. Power Syst. Res. 2024, 233, 110469. [Google Scholar] [CrossRef] [Scilit]
- Wang, M.; Niu, D. Research on project post-evaluation of wind power based on improved ANP and fuzzy comprehensive evaluation model of trapezoid subordinate function improved by interval number. Renew. Energy 2019, 132, 255–265. [Google Scholar] [CrossRef] [Scilit]
- Özcan, E.C.; Ünlüsoy, S.; Eren, T. A combined goal programming–AHP approach sup-ported with TOPSIS for maintenance strategy selec-tion in hydroelectric power plants. Renew. Sustain. Energy Rev. 2017, 78, 1410–1423. [Google Scholar] [CrossRef] [Scilit]
- Wang, Y.-M.; Elhag, T.M.S. An approach to avoiding rank reversal in AHP. Decis. Support Syst. 2006, 42, 1474–1480. [Google Scholar] [CrossRef] [Scilit]
- Gao, Y.; Lifu, A.; Zhao, C.; Qin, X.; Na, R.; Wang, A.; Wei, S. Research on entropy weight variation evaluation method for wind power clusters based on dynamic layered sorting. Glob. Energy Interconnect. 2024, 7, 653–666. [Google Scholar] [CrossRef] [Scilit]
- Shi, H.; Li, Y.; Jiang, Z.; Zhang, J. Comprehensive power quality evaluation method of microgrid with dynamic weighting based on CRITIC. Meas. Control 2021, 54, 1097–1104. [Google Scholar] [CrossRef] [Scilit]
- Zhang, Z.; Lin, X.; Li, Y.; An, C.; Song, Z.; Li, H.; Wang, Y. Power system planning scheme evaluation with high share of renewable energy using a combined subjective-objective approach. Energy Rep. 2025, 14, 3625–3640. [Google Scholar] [CrossRef] [Scilit]
- Gao, M. Research on post evaluation of mechanized construction in power transmission and transformation projects with game theory and fuzzy grey projection. Energy Eng. 2025, 122, 3243–3263. [Google Scholar] [CrossRef] [Scilit]
- Mourad, N.; Qahtan, S.; Zaidan, A.A.; Bahaa, B.; Alsattar, H.A.; Ding, W.; Yao, Y. A multidimensional ensemble generalized three-way decision approach under mixed-normal hesitant fuzzy sets for evaluating IoT–blockchain integration in supply chain performance. Expert Syst. Appl. 2026, 304, 130568. [Google Scholar] [CrossRef] [Scilit]
- Wang, J.; Pang, W.; Wang, L.; Pang, X.; Yokoyama, R. Synthetic evaluation of steady-state power quality based on combination weighting and principal component projection method. CSEE J. Power Energy Syst. 2017, 3, 160–166. [Google Scholar] [CrossRef] [Scilit]
- Kan, Z.; Wei, Y.; Zhao, T.; Cao, J. Risk evaluation of submarine pipelines in FMEA by com-bination of gray relation projection and VIKOR method. Ocean Eng. 2024, 302, 117695. [Google Scholar] [CrossRef] [Scilit]
- Zhao, H.; Li, J.; Mi, Z.; Pu, L.; Cui, Y. Grading evaluation of power quality based on CRITIC and improved Grey-TOPSIS. Power Syst. Prot. Control 2022, 50, 1–8. [Google Scholar]
- Wang, J.; Ye, N.; Ge, L. Steady-state power quality synthetic evaluation based on the triangular fuzzy BW method and interval VIKOR method. Appl. Sci. 2020, 10, 2839. [Google Scholar] [CrossRef] [Scilit]
- Behera, S.; Naik, V.R.N.; Panda, A.K.; Behera, S.K. A dual control strategy for improved power quality in grid-tied off-board bidirectional electric vehicle charger. Electr. Power Syst. Res. 2024, 236, 110917. [Google Scholar] [CrossRef] [Scilit]
- Shamshirband, M.; Salehi, J.; Gazijahani, F.S. Look-ahead risk-averse power scheduling of heterogeneous electric vehicles aggregations enabling V2G and G2V systems based on information gap decision theory. Electr. Power Syst. Res. 2019, 173, 56–70. [Google Scholar] [CrossRef] [Scilit]
- Mozafar, M.R.; Amini, M.H.; Moradi, M.H. Innovative appraisement of smart grid operation considering large-scale integration of electric vehicles enabling V2G and G2V systems. Electr. Power Syst. Res. 2018, 154, 245–256. [Google Scholar] [CrossRef] [Scilit]
- Elnady, M.; Ozana, S. Artificial Intelligence techniques in Vehicle-to-Grid (V2G) systems: A review, comparative study, and model evaluation. J. Energy Storage 2025, 135, 118155. [Google Scholar] [CrossRef] [Scilit]
- Fan, P.; Yang, J.; Ke, S.; Wen, Y.; Liu, X.; Ding, L.; Ullah, T. A multilayer voltage intelligent control strategy for distribution networks with V2G and power energy production-consumption units. Int. J. Electr. Power Energy Syst. 2024, 159, 110055. [Google Scholar] [CrossRef] [Scilit]
- Dua, R.; Shabaneh, R. An expert opinion-based perspective on emerging policy and economic research priorities for advancing the low-carbon hydrogen sector. Energy Sustain. Dev. 2025, 88, 101774. [Google Scholar] [CrossRef] [Scilit]
- Banadkouki, M.R.Z. Selection of strategies to improve energy efficiency in industry: A hybrid approach using entropy weight method and fuzzy TOPSIS. Energy 2023, 279, 128070. [Google Scholar] [CrossRef] [Scilit]
- Dua, R.; Almutairi, S.; Bansal, P. Emerging energy economics and policy research priorities for enabling the electric vehicle sector. Energy Rep. 2024, 12, 1836–1847. [Google Scholar] [CrossRef] [Scilit]

Disclaimer/Publisher’s Note: The statements, opinions and data contained in all publications are solely those of the individual author(s) and contributor(s) and not of MDPI and/or the editor(s). MDPI and/or the editor(s) disclaim responsibility for any injury to people or property resulting from any ideas, methods, instructions or products referred to in the content. |
© 2026 by the authors. Licensee MDPI, Basel, Switzerland. This article is an open access article distributed under the terms and conditions of the Creative Commons Attribution (CC BY) license.