Article

Parametric Investigation of Thermal Runaway Mechanism in Lithium Battery Under Nail Penetration

1
Guangxi Key Laboratory of New Energy Vehicle Power Battery and Green Powertrain Domain, School of Mechanical Engineering, Guangxi University, Nanning 530004, China
2
School of Mechanical Engineering, Southeast University, Nanjing 211189, China
*
Author to whom correspondence should be addressed.
Energies 2026, 19(10), 2274; https://doi.org/10.3390/en19102274
Submission received: 8 April 2026 / Revised: 29 April 2026 / Accepted: 6 May 2026 / Published: 8 May 2026

Abstract

The rapid progress and growing deployment of electric vehicles have elevated the safety of lithium-ion batteries to a top priority for both the public and the automotive industry. Among the various triggers of battery thermal runaway (TR), mechanical abuse stands out as a primary factor; yet, the internal physical and electrochemical processes occurring inside a cell during TR are still not fully understood. To bridge this knowledge gap and obtain a clearer picture of the cell’s internal behavior under TR conditions, a three-dimensional coupled electro-thermal model of a single battery cell is developed. Nail penetration simulations are performed under various operating conditions: nail radii of 3 mm and 5 mm, penetration speeds of 1.5 mm/s and 2.5 mm/s, initial state of charge (SOC) from 60% to 100%, surface heat transfer coefficients of 5–20 W/(m2·K), and different penetration locations (center, near electrodes, corners). The results show that a larger nail radius (5 mm) leads to a peak temperature of 538 K, and higher initial SOC (100%) results in a voltage drop of 0.8 V. The highest local temperature (480 K) occurs near the positive electrode. These findings offer a robust simulation-based approach for evaluating battery safety under nail penetration. This work offers a robust simulation-based approach for evaluating the safety performance of lithium-ion batteries under nail penetration scenarios.

1. Introduction

As the world enters a new phase of development, promoting energy conservation and emission reduction has become a critical issue confronting nations globally [1]. In the process of transitioning energy structures toward green and low-carbon models, reducing emissions in the transportation sector is particularly crucial. Electric vehicles, characterized by their clean and environmentally friendly nature (low emissions), quiet operation, and high energy utilization efficiency, are gradually replacing conventional fuel-powered vehicles. They have emerged as a vital pathway to achieving low-carbon transportation and indicate the direction of transformation for the automotive industry [2]. The rapid expansion of the new energy vehicle market has further stimulated an urgent demand for energy storage technologies that are safe and reliable, highly efficient, energy-saving, and environmentally benign. Among various energy storage solutions, lithium-ion batteries (LIBs) have become the mainstream choice for electric vehicle power systems due to their comprehensive advantages, including high energy density, low self-discharge rates, and long service life [3]. However, it should be noted that LIBs still exhibit deficiencies in thermal stability. When subjected to extreme operating conditions, they are prone to internal short circuits (ISC), which can trigger self-heating or even thermal runaway (TR) phenomena [4]. Consequently, how to effectively prevent and control safety risks associated with TR has become a focal concern for both the academic community and the industrial sector.
TR represents a critical challenge that urgently needs to be addressed in the field of lithium-ion battery safety. This process is characterized by high complexity, fundamentally stemming from the coupling effects of multi-scale phenomena and the interplay of various physical mechanisms. From the perspective of triggering mechanisms, abusive conditions leading to lithium-ion battery failures can be broadly categorized into three main types: thermal abuse, electrical abuse, and mechanical abuse [5]. Specifically, thermal abuse primarily manifests as batteries being exposed to overheated environments or direct flame impingement [6]; electrical abuse typically arises from overcharging, over-discharging, or short-circuit events [7]; while mechanical abuse refers to external forces acting on batteries during operation, such as impacts, penetration, or bending [8].
Thermal abuse and overcharging represent two primary triggers for TR in LIBs. Thermal abuse induces ISC between electrodes through separator melting at elevated temperatures [9], while overcharging promotes the formation and growth of Li (or Cu) dendrites that penetrate the separator, also causing ISC. Research indicates that the onset temperature of TR decreases with increasing state of charge (SOC) [10], and declining state of health compromises thermal stability due to internal material degradation [11]. Yuan et al. [12] demonstrated through overcharge experiments that charging to 180% SOC triggers violent cathode-electrolyte reactions and anode lithium plating/melting, resulting in rapid temperature escalation and TR. Fernandes et al. [13] subjected cells to 2C-rate overcharging up to 135% SOC and analyzed the gases emitted during the TR process, revealing that the overcharging process exhibits stage-wise characteristics, with gas release behavior at each stage closely correlated to changes in battery temperature and voltage.
Nail penetration testing serves as a standard approach for simulating mechanical damage in batteries, primarily employed to evaluate safety performance under extreme operating conditions and functioning as a crucial metric for assessing safety levels. Nail penetration testing serves as a standard approach for simulating mechanical damage in batteries, primarily employed to evaluate safety performance under extreme operating conditions and functioning as a crucial metric for assessing safety levels. Lamb et al. [14] utilized CT imaging technology to examine internal damage in batteries following nail penetration tests; however, the obtained data exhibited limitations and failed to authentically replicate the localized short circuits and TR propagation processes triggered by minor defects in practical applications. Maleki et al. [15] conducted a systematic comparative analysis of three mechanical abuse testing methods—nail penetration, indentation, and compression—becoming the first to thoroughly uncover and quantify how the “heat sink effect” compromises the accuracy of internal short circuit experiments. Finegan et al. [16] innovatively employed high-speed synchrotron X-ray imaging technology combined with synchronized internal and external temperature monitoring, successfully achieving dynamic observation of internal structural damage, material migration, and temperature rise processes in 18,650-type batteries during nail penetration. The study revealed that vertically oriented penetration generates higher internal temperature increases, while horizontally oriented penetration accelerates the spread of TR. Additionally, the migration of active materials alters heat transfer pathways, thereby influencing surface temperature field distribution. Nevertheless, nail penetration experiments on LIBs continue to face multiple challenges: the experimental process is difficult to precisely control, safety risks exist, repeatability is poor, and accurate acquisition of internal electrothermal parameters during TR remains highly challenging. Lamb et al. [14] utilized CT imaging technology to examine internal damage in batteries following nail penetration tests; however, the obtained data exhibited limitations and failed to authentically replicate the localized short circuits and TR propagation processes triggered by minor defects in practical applications. Maleki et al. [15] conducted a systematic comparative analysis of three mechanical abuse testing methods—nail penetration, indentation, and compression—becoming the first to thoroughly uncover and quantify how the “heat sink effect” compromises the accuracy of internal short circuit experiments. Finegan et al. [16] innovatively employed high-speed synchrotron X-ray imaging technology combined with synchronized internal and external temperature monitoring, successfully achieving dynamic observation of internal structural damage, material migration, and temperature rise processes in 18,650-type batteries during nail penetration. The study revealed that vertically oriented penetration generates higher internal temperature increases, while horizontally oriented penetration accelerates the spread of TR. Additionally, the migration of active materials alters heat transfer pathways, thereby influencing surface temperature field distribution. Nevertheless, nail penetration experiments on LIBs continue to face multiple challenges: the experimental process is difficult to precisely control, safety risks exist, repeatability is poor, and accurate acquisition of internal electrothermal parameters during TR remains highly challenging.
Establishing appropriate numerical simulation models represents a crucial technical approach for investigating the intrinsic mechanisms of TR. The pseudo-two-dimensional (P2D) theoretical framework proposed by Newman et al. [17] has become a classical paradigm in the field of electrochemical modeling; this model can precisely characterize the transport behavior of lithium ions within the cathode/anode materials and electrolyte system, while effectively describing the electrochemical reaction processes occurring at the interfaces of active material particles. Coupling electrochemical models with thermodynamic models enables a systematic elucidation of the synergistic interaction mechanisms between electrochemical heat generation and heat transfer during the TR process. Based on multidisciplinary theoretical foundations encompassing electrochemistry, heat transfer theory, and energy conservation principles, Ping et al. [18] developed a three-dimensional electro-thermal coupled numerical model capable of comprehensively reproducing the dynamic evolution characteristics of LIBs throughout the entire process from normal charge–discharge cycles to TR. In a complementary study, Zhao et al. [19] employed a three-dimensional electrochemical-thermal coupled simulation approach to numerically investigate the ISC phenomena occurring in high-capacity LIBs during nail penetration tests, providing an in-depth analysis of the intrinsic correlations between electrochemical processes and thermodynamic responses. Given that LIBs inherently constitute complex electrochemical systems characterized by multi-field coupling, adopting multi-physics coupled modeling approaches represents an essential pathway for accurately describing their cross-scale, multi-physical field interaction behaviors.
Despite extensive investigations into nail penetration-induced TR behavior through experimental and numerical simulation approaches, from the perspective of numerical modeling, several key gaps still remain: (1) Most existing models simplify the nail penetration as an instantaneous internal short circuit, neglecting the dynamic contact process between the nail and the battery layers. (2) The coupled electro-thermal effects during the transient penetration phase are rarely quantified, especially the real-time evolution of short-circuit current and Joule heating. (3) The influence of penetration location and thermal boundary conditions on the spatial temperature distribution within the cell has not been systematically studied.
To address these challenges, this study focuses on the characteristic temperatures, voltage responses, and temperature field distribution patterns of batteries during nail penetration-induced TR, systematically investigating the influence mechanisms of various internal and external factors on the TR evolution process. By establishing a three-dimensional multi-physics coupled model that integrates electrochemical and thermal behaviors, the research conducts an in-depth analysis of the electro-thermal characteristics of individual battery cells under TR conditions. The study comprehensively examines the impact mechanisms of key parameters, including penetration radius, initial SOC, penetration velocity, external heat transfer conditions, and penetration location. It provides detailed discussions on the evolution patterns of temperature-voltage characteristics and thermal field distribution under different operating conditions, thereby revealing the fundamental mechanisms of TR and heat dissipation principles.
The innovation of this article lies in:
(1)
A numerical model integrating electrochemical and thermal dynamics is developed based on the battery cell to replicate the thermal runaway phenomenon induced by nail penetration. This model enables a thorough investigation of the electro-thermal response evolution and the spatial temperature distribution patterns occurring within the battery throughout the entire process.
(2)
By comprehensively examining the effects of factors such as penetration radius, velocity, surface cooling conditions, initial SOC, and penetration location on battery temperature, voltage evolution, and temperature distribution, the study provides in-depth insights into the intrinsic mechanisms of TR and heat transfer principles.

2. Modeling

2.1. Geometry Construction

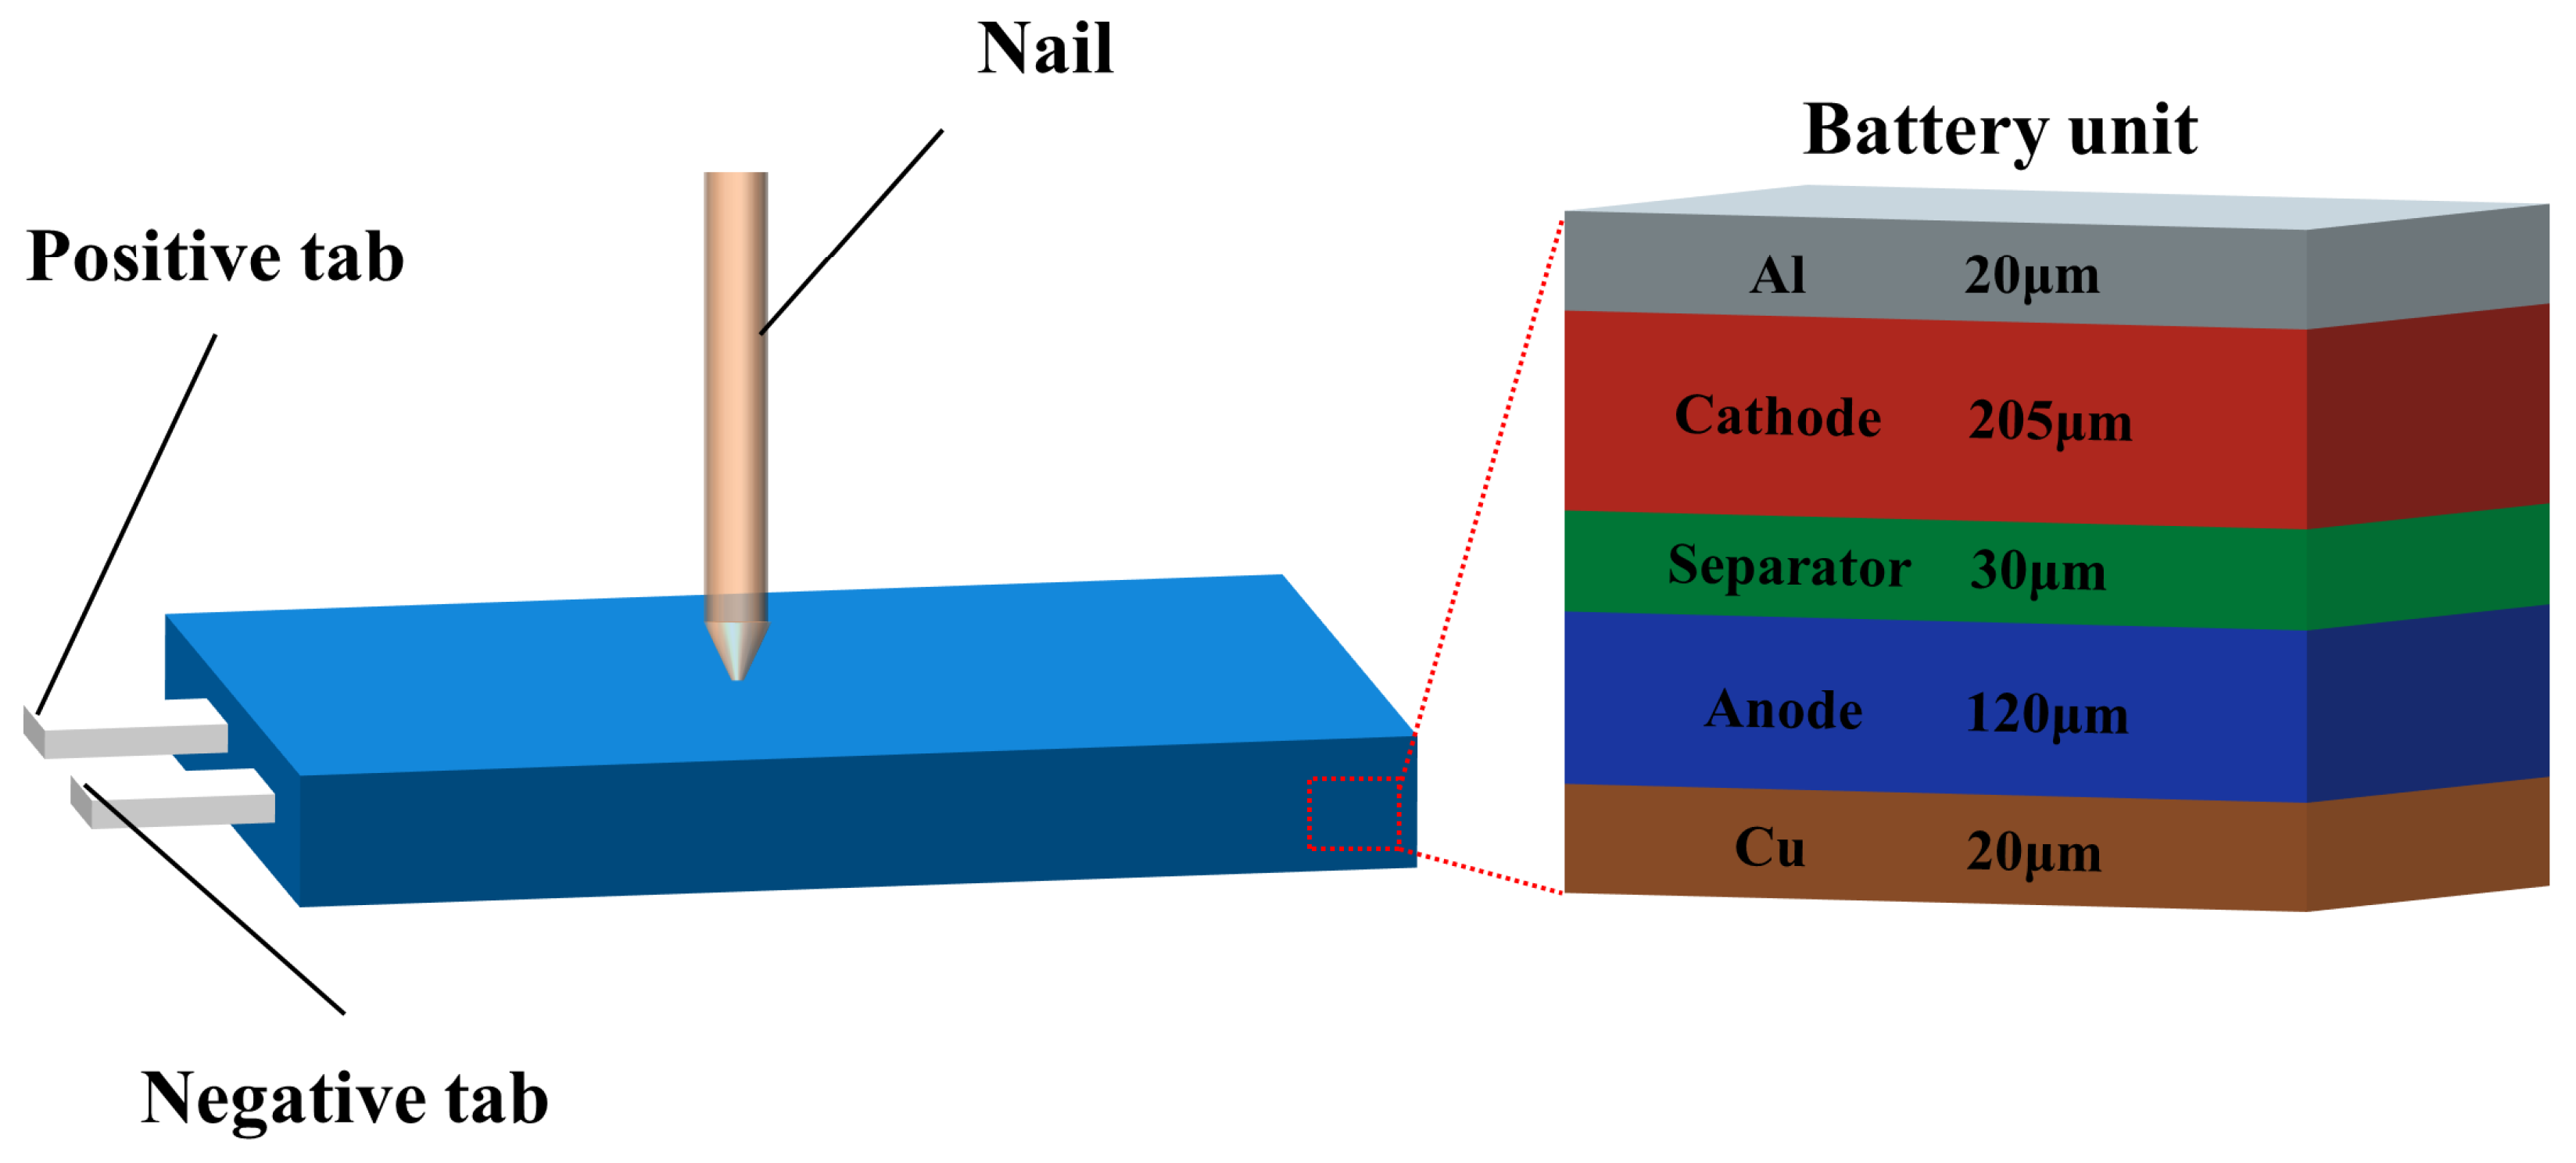
LIBs commonly feature a multi-layered composite structural design, comprising alternately stacked layers of electrodes, separators, and electrolyte. This structural configuration not only directly affects the battery’s energy density and cycle life, but also fundamentally governs its thermal safety characteristics and the propagation pathways of TR phenomena. Figure 1 presents a schematic illustration of the lithium-ion battery structure. In this investigation, a simplified layered unit is extracted from the actual battery architecture to serve as the research subject. The layered unit consists of an aluminum current collector (20 μm), anode sheet (120 μm), cathode sheet (205 μm), copper current collector (20 μm), and separator (30 μm). The anode active material is a layered nickel-cobalt-manganese ternary material (NCM), the cathode active material is mesophase carbon microbeads (MCMB), and the electrolyte system employs lithium hexafluorophosphate (LiPF6). To examine the electro-thermal coupling response characteristics within the battery under TR conditions, this study utilizes a structural steel nail with a 3 mm diameter, performing radial penetration experiments from the battery’s central position at a velocity of 2 mm/s. The relevant geometric dimensional parameters are provided in Table 1.

2.2. Theoretical Model

This study establishes an integrated framework composed of three interrelated models. Specifically, an electrochemical model is first developed to characterize the migration behavior of lithium ions and charge transfer mechanisms within LIBs [20]; subsequently, a thermal model is introduced to delineate the heat transfer patterns among various component materials inside the battery [21]; building upon this foundation, a TR model is further incorporated, which is capable of effectively simulating the cascading exothermic reaction processes that occur in batteries under extreme operating conditions [22]. It is worth noting that the TR model provides dynamically evolving boundary conditions for the electrochemical reaction processes.

2.2.1. Electrochemical Model

The electrochemical model developed by Newman and his team [23] has gained widespread application due to its strong universality. This model can clearly elucidate the ion conduction mechanisms, charge migration processes, and reaction kinetic characteristics during battery operation. During the charge–discharge cycles of batteries, lithium ions undergo deintercalation and intercalation behaviors between the active materials of the positive and negative electrodes, a process that directly induces corresponding changes in electrode potential. The mathematical expression describing the charge conservation relationship is presented in Equation (1), whose theoretical foundation originates from Ohm’s law [20]:
σ s e f f 2 ϕ s x 2 = a F j L i
Here, σseff denotes the effective conductivity of the liquid phase, while ϕl indicates the electric potential within the liquid phase. The symbols R and T stand for the universal gas constant and absolute temperature, respectively, with t0+ representing the transference number of lithium ions.
The principle of charge conservation is equally valid within the electrolyte [20], and Equation (2) is as follows:
x σ l e f f ϕ l x + 2 R T 1 t + 0 F x σ l e f f x ln c e = a s F j L i
σleff is the liquid phase effective conductivity, ϕl represents the potential in the liquid phase. R and T respectively represent the ideal gas constant and temperature, the t+0 is the lithium-ion transference number.
Throughout the diffusion of lithium ions, the overall mass is conserved. The movement of lithium ions follows Fick’s second law of diffusion: Equation (3) describes this behavior in the solid phase, whereas the liquid phase dynamics are expressed by the following Equation (4) [20]:
c s t = 1 r 2 r D s r 2 c s r
ε e c e t = x D e e f f c e x + 1 + t + 0 a j L i
In the model, cs and cl denote the concentration of lithium ions in the solid phase and the electrolyte, respectively. The diffusivity of lithium ions within the solid active material is DS, and Dleff represents the effective diffusion coefficient in the electrolyte. Furthermore, the electrolyte volume fraction, εl is defined as a key model parameter.
The kinetic behavior of electrode reactions can be described by the Butler-Volmer equation [24]:
J = k c l α a c s , max c s , s u r f α a c s , s u r f α c × exp α a η F R T exp α c η F R T
where the maximum concentration and the surface concentration of lithium ions in the solid particles are denoted by cs,max and cs,surf respectively. αa denotes the charge transfer coefficient of the cathode, and αc represents that of the anode. The symbol k stands for the reaction rate constant, while η signifies the overpotential.
The electrochemical model’s microscale boundary conditions are characterized by the following: in the context of lithium diffusion through the solid phase, no material flux occurs at the particle’s central point, whereas the flux magnitude at the outer surface correlates directly with the electrochemical reaction kinetics; regarding lithium-ion transport within the electrolyte phase, flux continuity is maintained across the electrode-separator junctions, and null flux conditions prevail at the battery’s terminal boundaries.
For the microscopic boundary conditions of the electrochemical model: during Li diffusion in the solid phase, the flux at the center of a particle is zero, while the surface flux is determined by the electrochemical reaction rate; during lithium-ion diffusion in the liquid phase, the flux is continuous at the interfaces between the electrodes and the separator, and the flux is zero at both terminals of the battery.

2.2.2. Thermal Model

During battery operation, various forms of heat are generated. Governed by the law of energy conservation, Equation (6) represents the heat generated in the thermal model [21]:
ρ C P T t = λ 2 T x 2 + Q r e v + Q r x n + Q a b u s e Q c o n v
where Qrev corresponds to the reversible heat effect during the battery’s electrochemical reactions; Qrxn characterizes the irreversible heat generation caused by electrode polarization; Qabuse represents the heat released from side reactions under abusive operating conditions; while Qconv describes the convective heat transfer phenomenon between the battery and its surrounding environment.
Under standard operating conditions, the heat generation from electrochemical reactions in LIBs is governed by the Bernardi model, which is expressed as follows [21]:
Q r e v = F a J T E o c T
Q r x n = F a J E E o c
where E represents the cell voltage, Eoc denotes the open-circuit voltage, and ∂Eoc/∂T is the temperature coefficient of the open-circuit voltage, its rate of change with respect to temperature.
The convective heat transfer between the LIB and the surroundings follows Newton’s law of cooling [21] as shown in Equation (9):
Q c o n v = h T T a m b
The thermal model employed in this study is based on the following simplifying assumptions: all battery layer materials are considered thermally isotropic; radiative heat dissipation at high temperatures and interlayer contact thermal resistance are neglected; and gas generation and venting during thermal runaway are not considered. These simplifications aim to establish a clear baseline model to focus on investigating the influence mechanism of external equivalent convective heat transfer capacity on the thermal runaway process. All air-exposed surfaces are modeled with a natural convection boundary condition using a constant heat transfer coefficient h. The ambient temperature is set to a constant 298 K. No additional convective boundary condition is applied to the steel nail surface. Its temperature is indirectly influenced through conduction at the contact area with the battery and natural convection with the surrounding environment via the battery’s outer surface.

2.2.3. Thermal Runaway Model

When TR occurs in IBs, four critical exothermic side reactions are successively initiated within an extremely short timeframe: initially, the decomposition reaction of the solid electrolyte interface (SEI) film; subsequently, the exothermic reaction between the cathode material and the electrolyte; followed by the exothermic reaction between the anode material and the electrolyte; and finally, the process where the electrolyte undergoes self-decomposition while releasing heat. The heat generation rates produced by these four reactions are sequentially represented by Qsei, Qne, Qpe and Qe, with their respective precise mathematical expressions detailed in Equation (10) [23].
Q a b u s e = Q s e i + Q n e + Q p e + Q e
The substantial heat released from each individual side reaction serves as the fundamental trigger for the battery’s intense combustion or even explosive failure. Consequently, the exothermic processes occurring during TR are integrated into a thermodynamic parameter framework, where the mathematical formulation is constructed based on the Arrhenius equation [23], with its specific representation presented in Equation (11):
d c d t = A i exp E i R T f c
The model incorporates the following simplified chemical reaction equations: Equations (12) and (13) characterize the decomposition process of the solid electrolyte interphase (SEI); Equations (14)–(16) depict the chemical interactions between the cathode material and the electrolyte; Equations (17) and (18) reflect the interactions between the anode material and the electrolyte; Equations (19) and (20) characterize the decomposition behavior of the electrolyte itself [23].
d c s e i d t = A s e i exp E a , s e i R T c s e i m s e i
Q s e i T , c s e i = H s e i W s e i A s e i exp E a , s e i R T c s e i m s e i
d c n e d t = A n e exp z s e i z s e i , 0 exp E a , n e R T c n e m n e
d z s e i d t = A n e exp z s e i z s e i , 0 exp E a , n e R T c n e m n e
Q n e T , c n e , z s e i = H n e W n e A n e exp z s e i z s e i , 0 exp E a , n e R T c n e m n e
d α d t = A p e α m p e 1 1 α m p e 2 exp E a , p e R T
Q p e T , c p e = H p e W p e A p e α m p e 1 1 α m p e 2 exp E a , p e R T
d c e d t = A e exp E a , e R T c e m e
Q e T , c e = H e W e A e exp E a , e R T c e m e

2.3. Simulation Steps

The electrochemical and thermal response characteristics within the battery are modeled and analyzed using numerical computation methods. The study employs the “Lithium-Ion Battery” module and “Solid Heat Transfer” module in COMSOL Multiphysics software (version 6.3) to accomplish multi-physics field coupling analysis and numerical simulation of thermal runaway phenomena. In the constructed geometric configuration, the dimensions of the penetrating steel nail are set to three times the thickness of the battery. To accurately capture the electrical contact effects generated during the steel nail penetration process with the battery, a step function dependent on the penetration rate is introduced into the model to enable real-time regulation of the steel nail’s effective electrical conductivity characteristics. At the beginning of the simulation, the steel nail remains separated from the battery body while the battery operates normally; at this moment, the steel nail’s electrical conductivity is initialized to 0 to represent its insulating properties. As the simulation progresses over time, when the steel nail gradually approaches along the battery thickness direction, its electrical conductivity is incrementally enhanced through the step function until stable contact is established with the battery. Within the regions where contact has been established, the steel nail’s electrical conductivity is assigned the authentic physical parameters of the material, thereby reproducing the internal short circuit phenomenon triggered by steel nail penetration. Based on the variation characteristics of the electrical conductivity distribution, the corresponding regions can be determined as having been penetrated by the steel nail. When the steel nail’s electrical conductivity has been completely transformed across the entire battery thickness direction, it signifies the thorough completion of the penetration action. Numerical computation adopts a transient solving strategy with a time discretization step of 0.5 s, and the calculation process continues until termination at 120 s, aiming to thoroughly investigate the heat release characteristics during the battery thermal runaway phase. Throughout the modeling process, the steel nail region is simultaneously configured with both electrical and thermal transport parameters to characterize its dual physical functions in current conduction and heat transfer.

3. Model Validation

3.1. Mesh Independence Check

Mesh discretization is a critical step in numerical simulation; an overly coarse mesh can lead to distorted results or even solution failure, while an excessively fine mesh increases computational cost. Grid independence testing (where a change of less than 5% in results after mesh refinement is considered to achieve independence) can determine an appropriate mesh size to balance accuracy and efficiency. In this study, unstructured mesh discretization is applied to the battery-nail composite geometry, as it is better suited for complex geometries and physical field variations, ensuring computational accuracy and stability in the electro-thermal-chemical coupled regions. Mesh sensitivity analysis is conducted using four meshes of different densities (with element counts of 100,136, 114,073, 137,659, and 235,931, respectively).
Table 2 presents the grid independence verification results for this model. The relative errors between successive mesh refinements are 9.56%, 8.64%, and 2.31%, respectively. When the number of mesh elements increases from 137,659 to 235,931, the relative deviation of the results falls below the 5% threshold, indicating that a grid-independent solution has been achieved [25]. For computational efficiency, the mesh configuration with 137,659 elements is ultimately selected for subsequent simulations.

3.2. Model Validation

Due to the inherent difficulty in directly measuring the complete internal evolution process during nail penetration tests, the validation of this model primarily concentrates on evaluating its predictive capability for key macroscopic parameters such as surface temperature, voltage variations, and heating rate. The fundamental objective of this model is to elucidate the evolution patterns of multiphysics coupling and the mechanisms of various parameter effects, with the validity of its predictions mainly reflected in the agreement with experimental trends and the rationality of the underlying physical mechanisms. All temperature measurement data employed for model verification in this study are sourced from previously published experimental research literature.
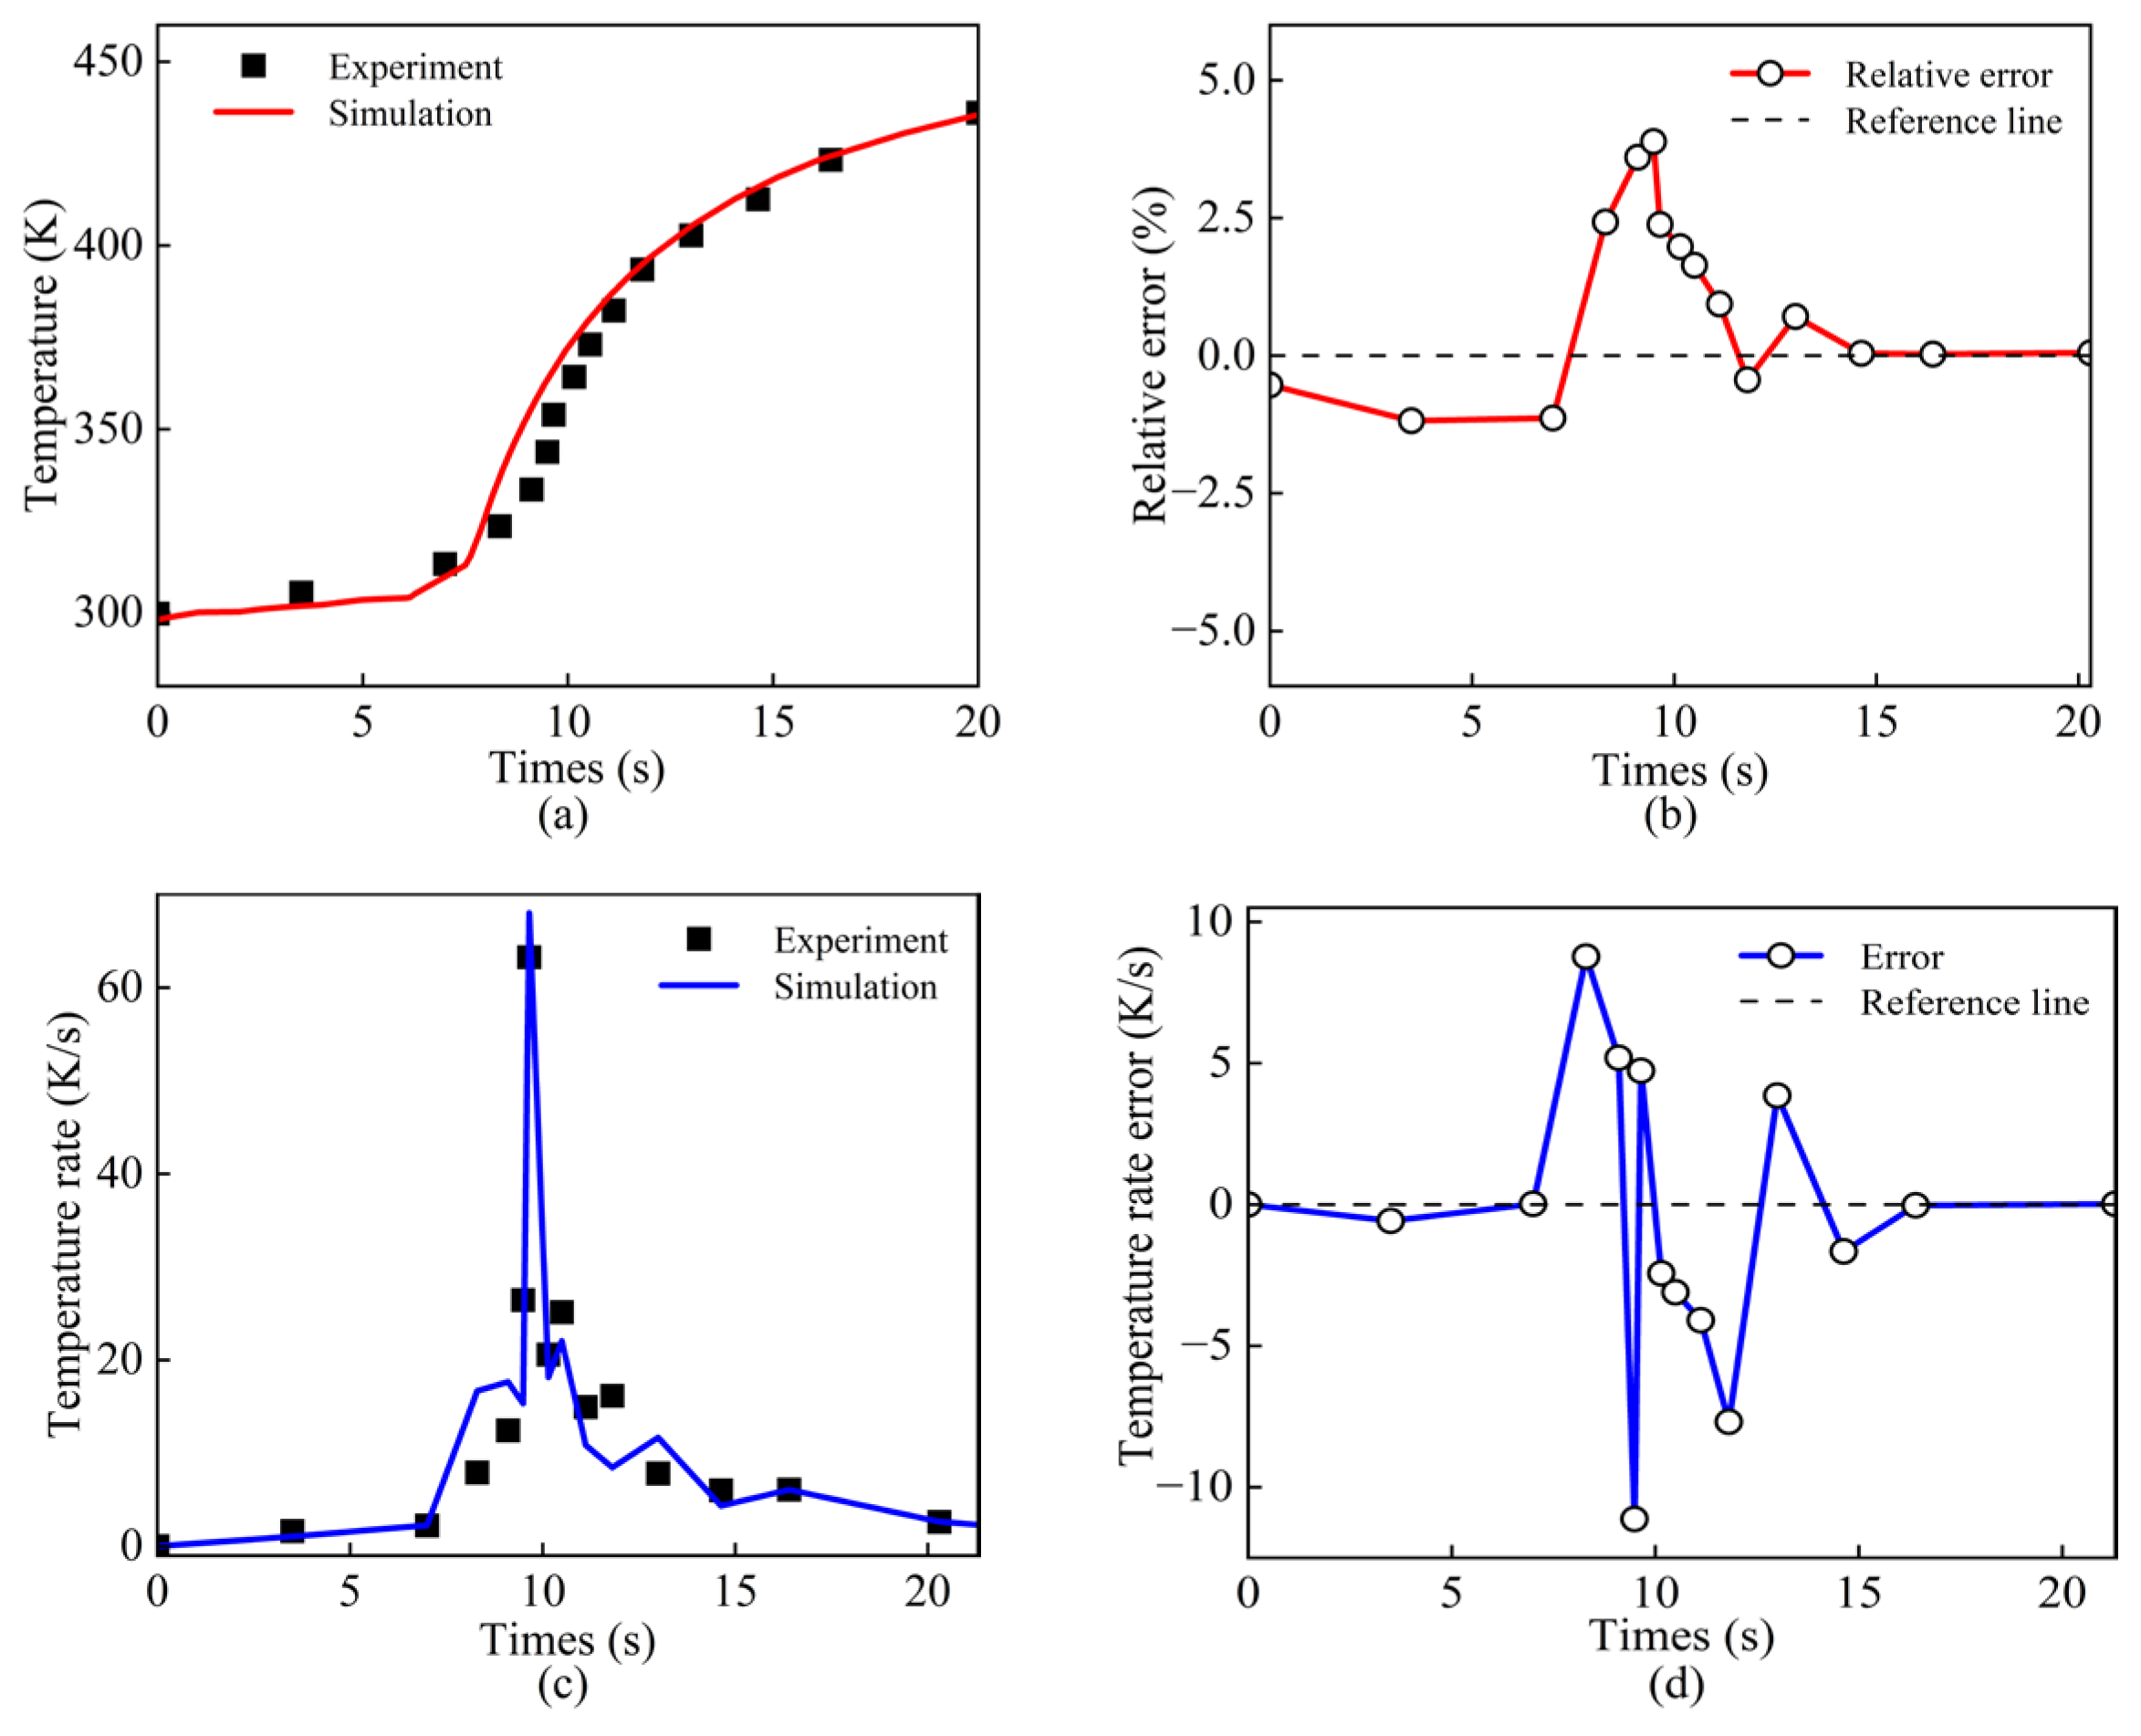
Based on the experiments conducted by Yi et al. [26], the research team performed a nail penetration test by inserting a steel nail with a diameter of 3 mm into the battery at a speed of 10 mm/s under conditions of ambient temperature of 25 °C and battery SOC of 80%. Temperature monitoring is carried out using a glass fiber-wrapped K-type thermocouple for data acquisition. Figure 2a and Figure 2b show the comparison of temperature changes and the relative error between experiment and simulation, respectively. The simulated and experimental temperatures agree well with each other, with a maximum relative error of 3.88%, and all error values are below 5%. A comparison of the experimental and simulated temperature rise rates is presented in Figure 2c, showing largely identical trends. As shown in Figure 2d, the maximum temperature rise rate during the battery TR process is 11.12 K/s. This indicates that the TR model constructed is highly reliable.

4. Results and Discussion

4.1. Influence of Different Radius

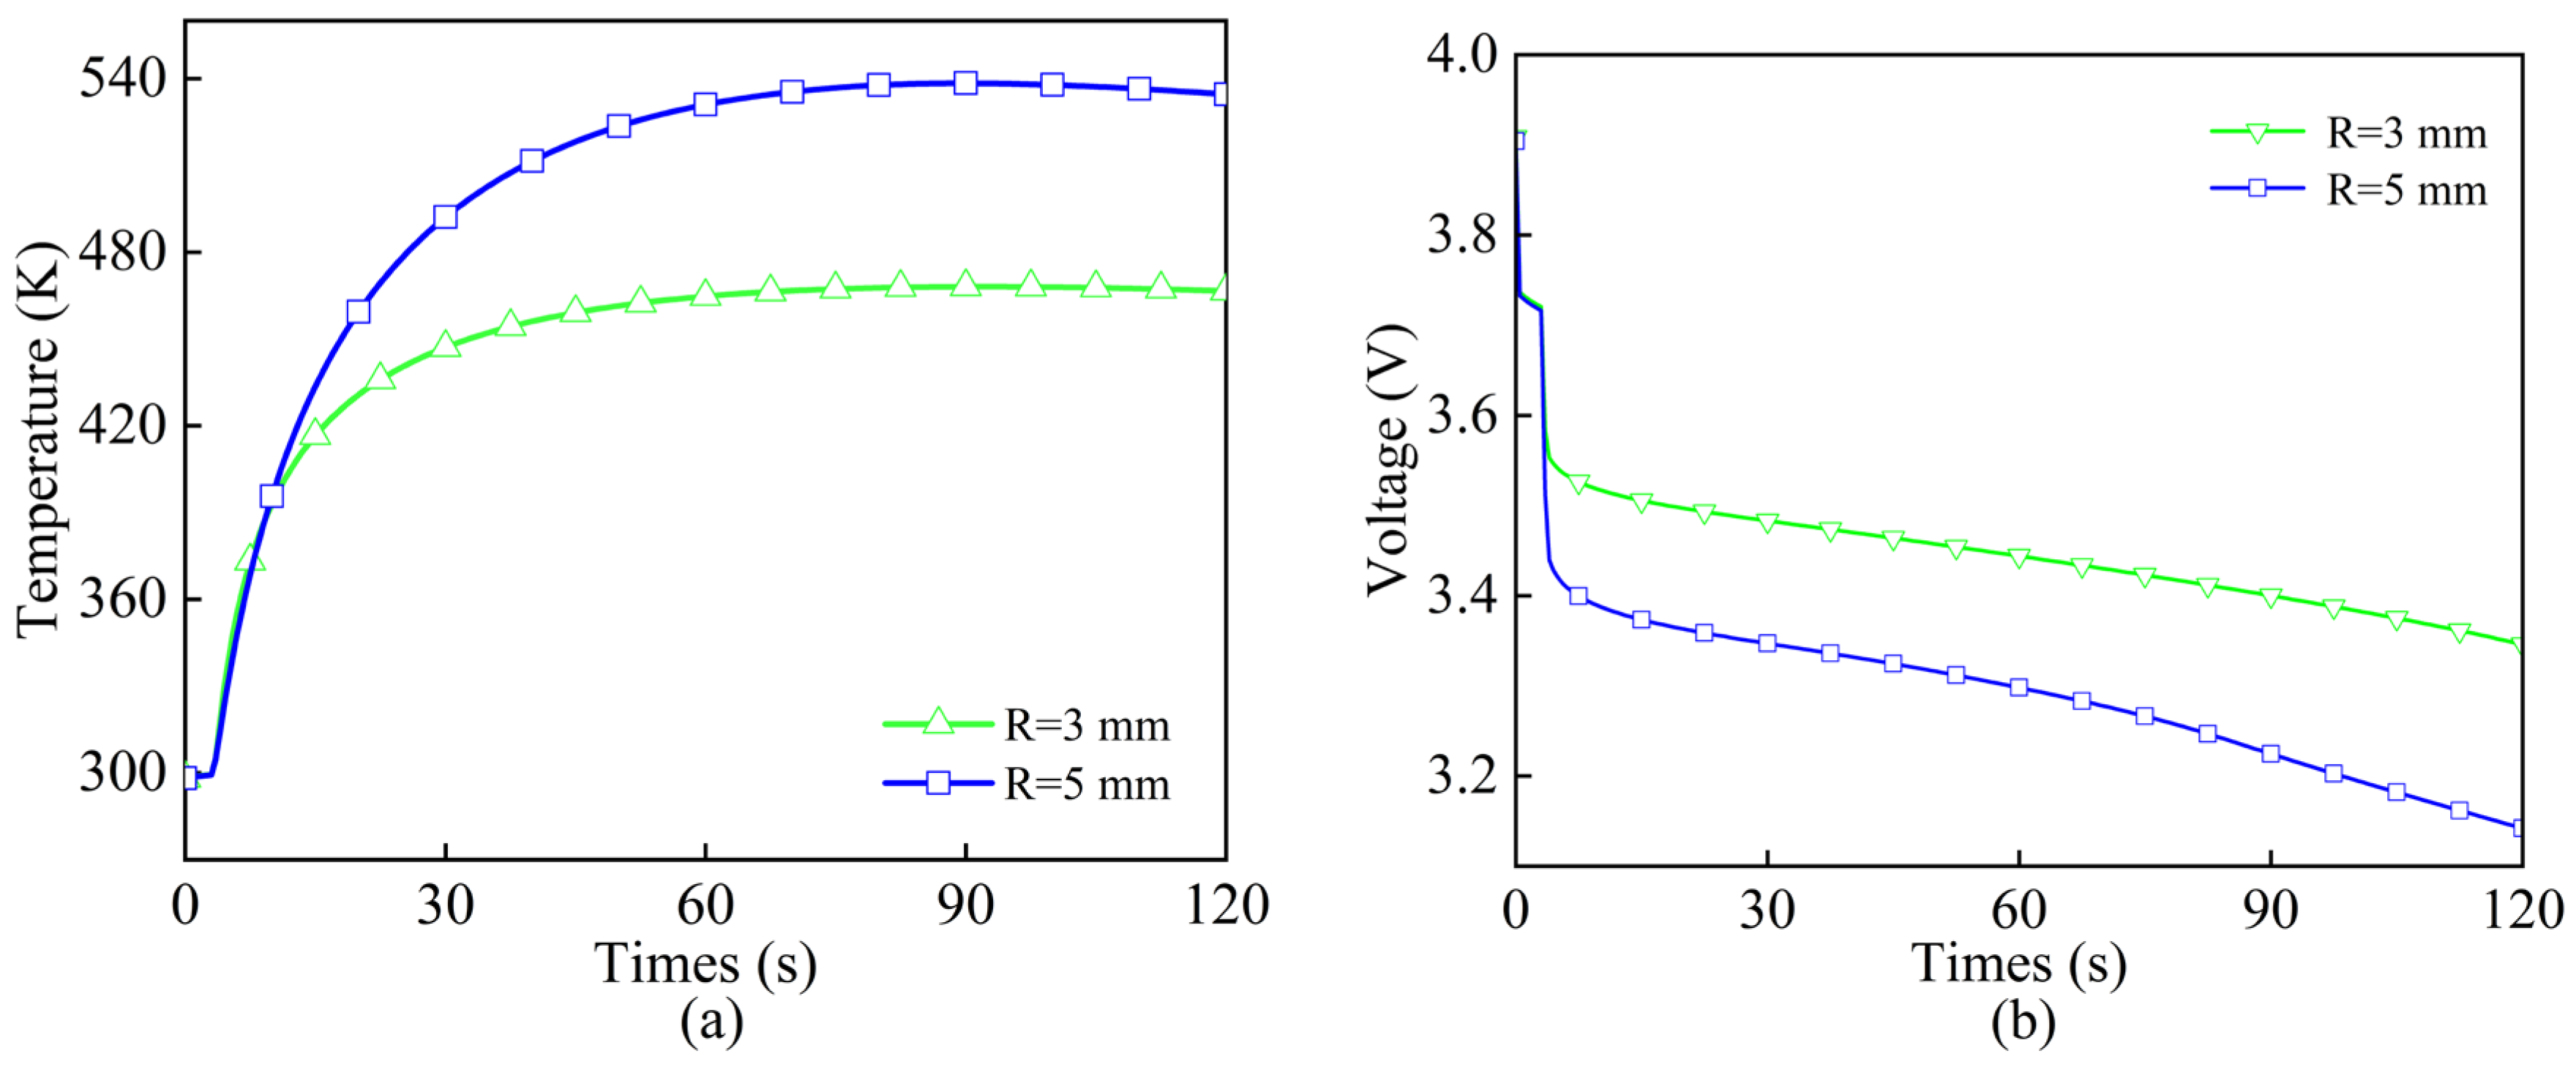
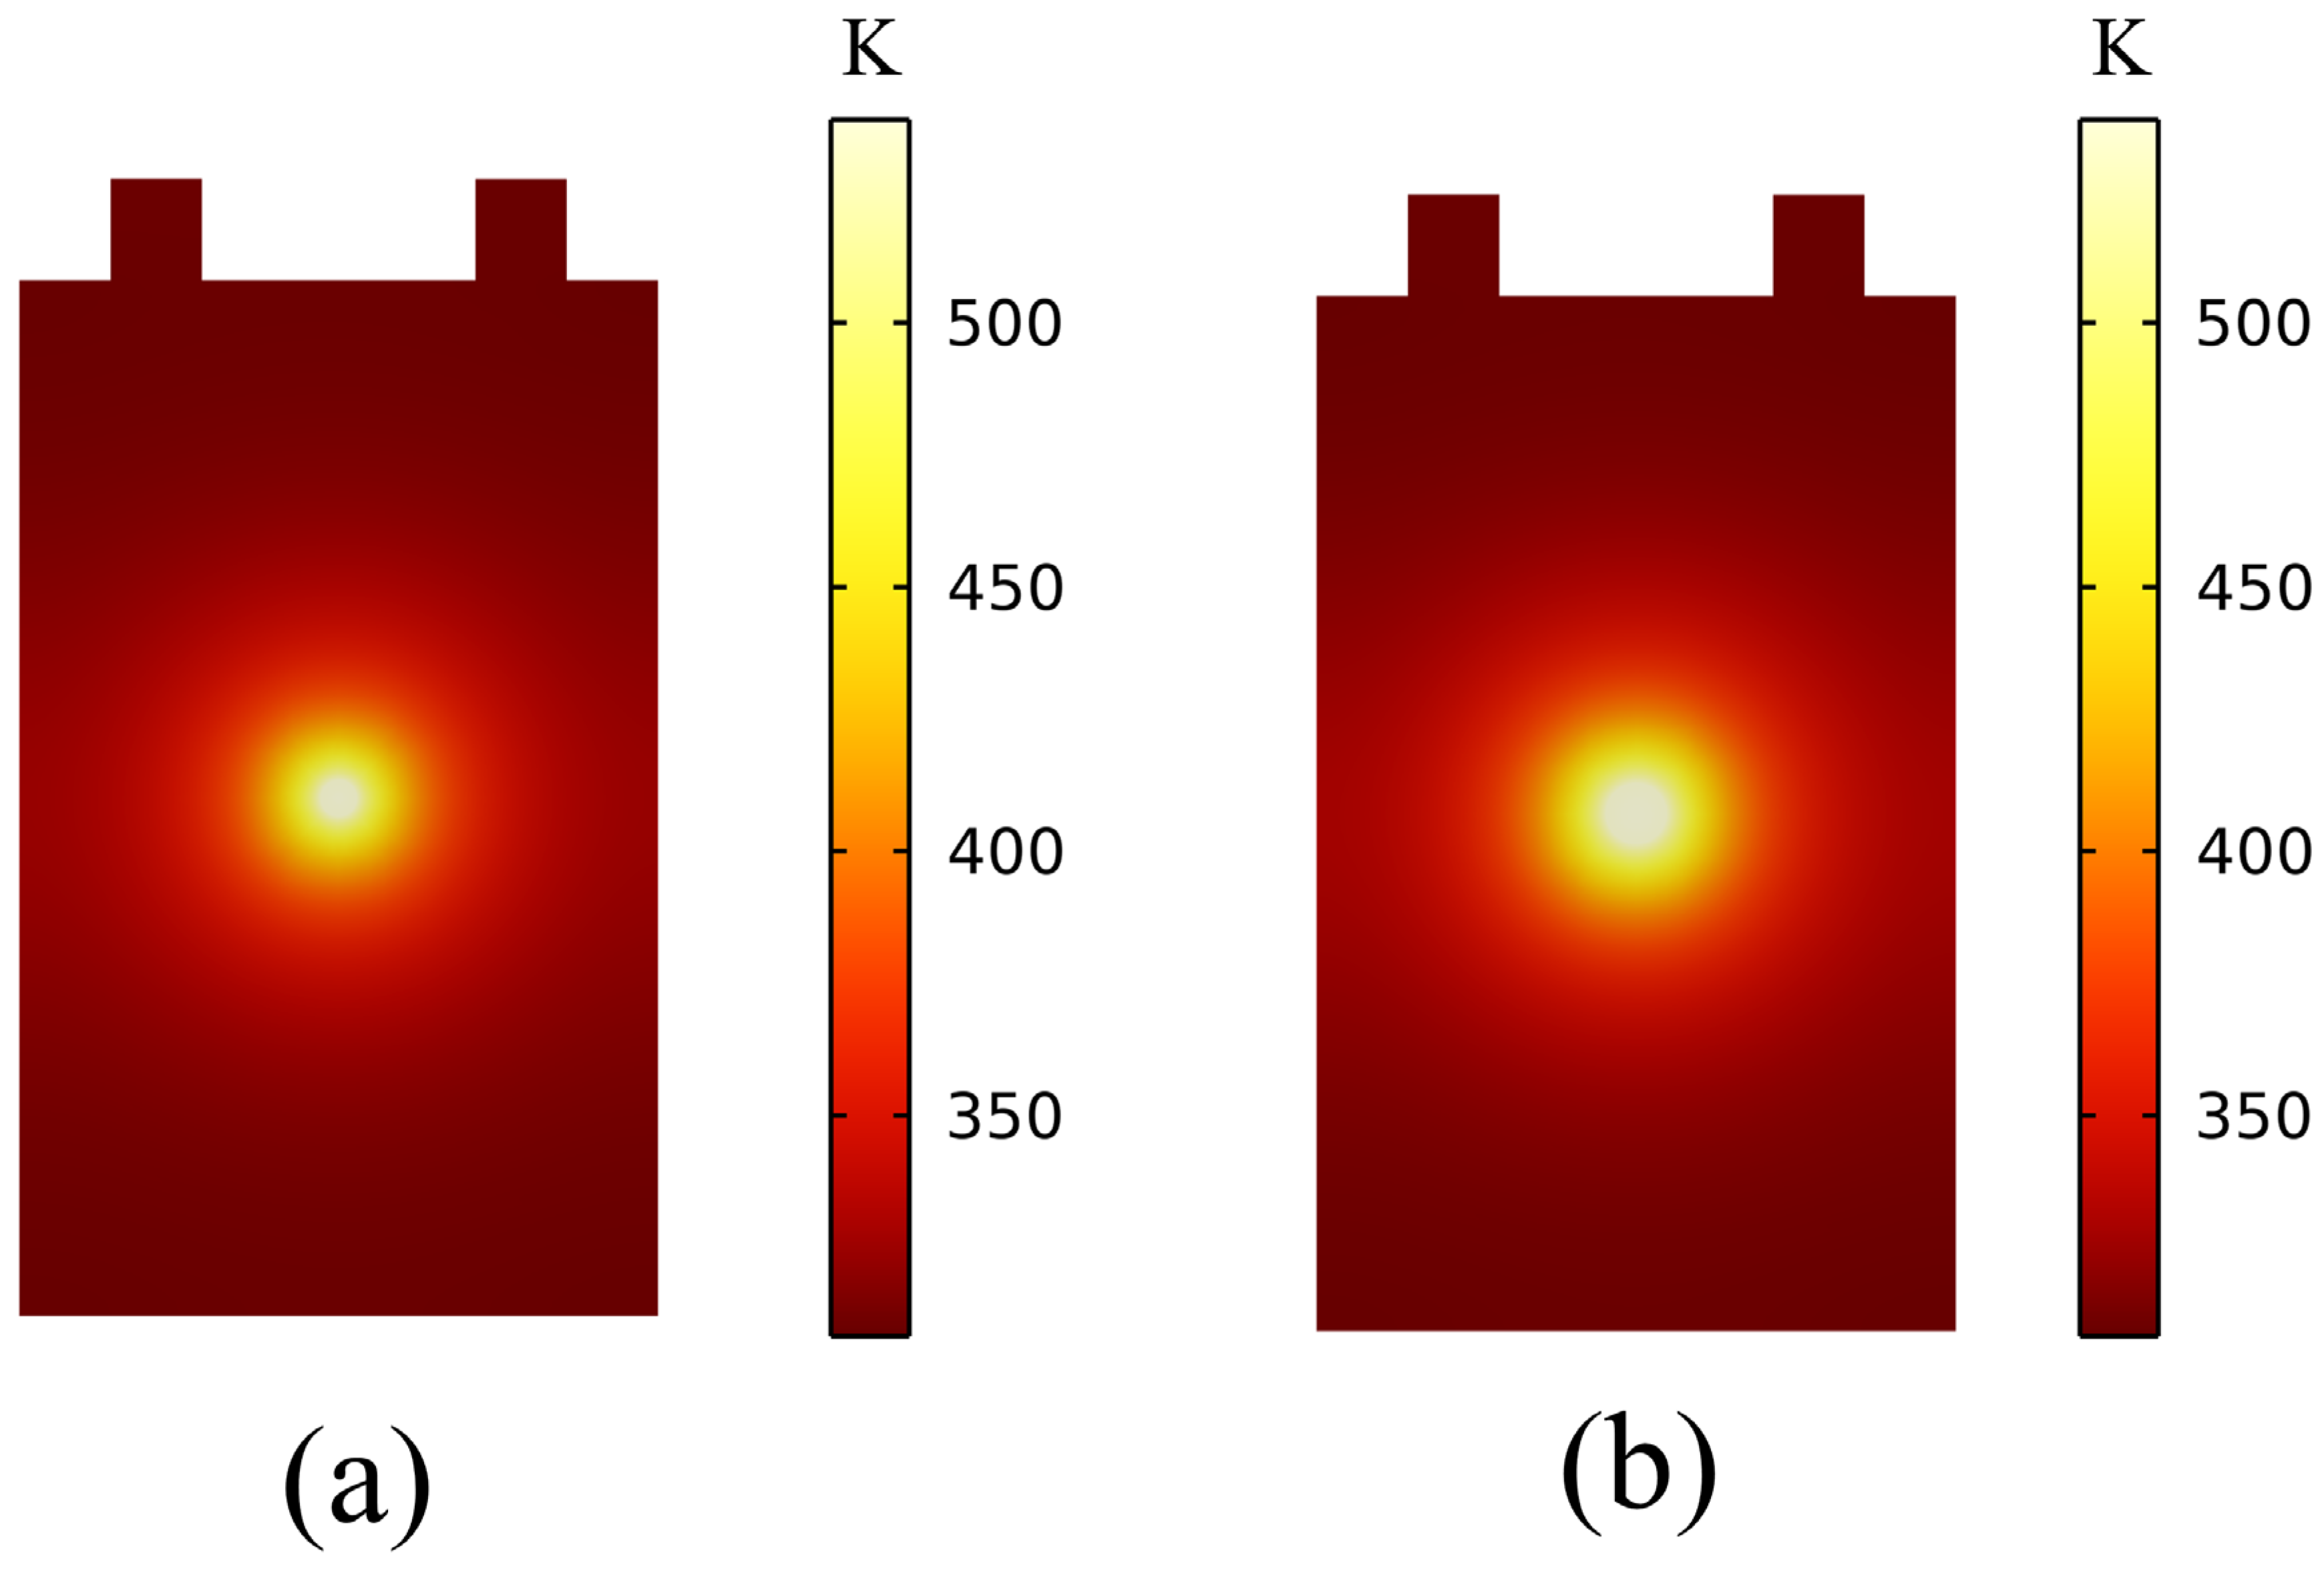
The severity of TR in LIBs is closely correlated with the geometric dimensions of the internal short-circuit region. Under constant penetration speed conditions, this study systematically investigates the influence mechanisms of steel nails with different diameters (selecting 3 mm and 5 mm as representative sizes) on the evolution of battery TR, with in-depth analysis of the electro-thermal coupling effects and TR propagation patterns driven by variations in short-circuit area. As evidenced by the comparison of temperature-rise curves for battery cells under two penetration conditions in Figure 3a, an increase in penetration tool size directly leads to a significant elevation in the peak temperature of TR. In both cases, the temperature evolution comprises three stages: an initial slow rise (<2 s) due to localized Joule heating at the puncture site, followed by a rapid surge (2–6 s) as internal short circuit triggers cascading exothermic reactions, and finally a peak plateau before gradual cooling. A larger nail radius (5 mm) accelerates the transition from the first to the second stage and raises the peak temperature from 503 K to 538 K. Figure 4 illustrates the temperature distribution inside the battery, enabling an intuitive observation of the temperature propagation characteristics during the thermal runaway process. For the two nail penetration radii (R = 3 mm and R = 5 mm), the hot spot location is completely consistent with the nail penetration location. This is because the steel nail directly pierces the separator, causing physical contact between the positive and negative electrode materials at the penetration point, forming a severe internal short circuit. The localized Joule heat makes the temperature rise most significant at the penetration point. As thermal runaway develops, heat propagates to the surrounding area, but the temperature peak always remains at the penetration point, which directly determines the initial thermal center of the battery. Moreover, a larger penetration diameter expands the internal short-circuit contact area, inducing stronger short-circuit currents and instantly releasing more Joule heat, thereby accelerating the temperature rise process [27].
The voltage variation curves in Figure 3b clearly demonstrate that the decay rate of battery voltage after penetration exhibits a distinct positive correlation with steel nail diameter. Smaller penetration diameters induce only gradual voltage attenuation, reflecting relatively mild internal short-circuit conditions; in contrast, larger penetration diameters cause abrupt voltage drops, which represent typical characteristics of severe large-area ISC. Such large-scale short circuits not only trigger exothermic chain reactions within the battery but also significantly accelerate the reaction process, thereby resulting in the dual phenomena of sharply elevated temperatures and rapidly collapsing voltage observed in the experiments.

4.2. Effects of Different Needling Speeds

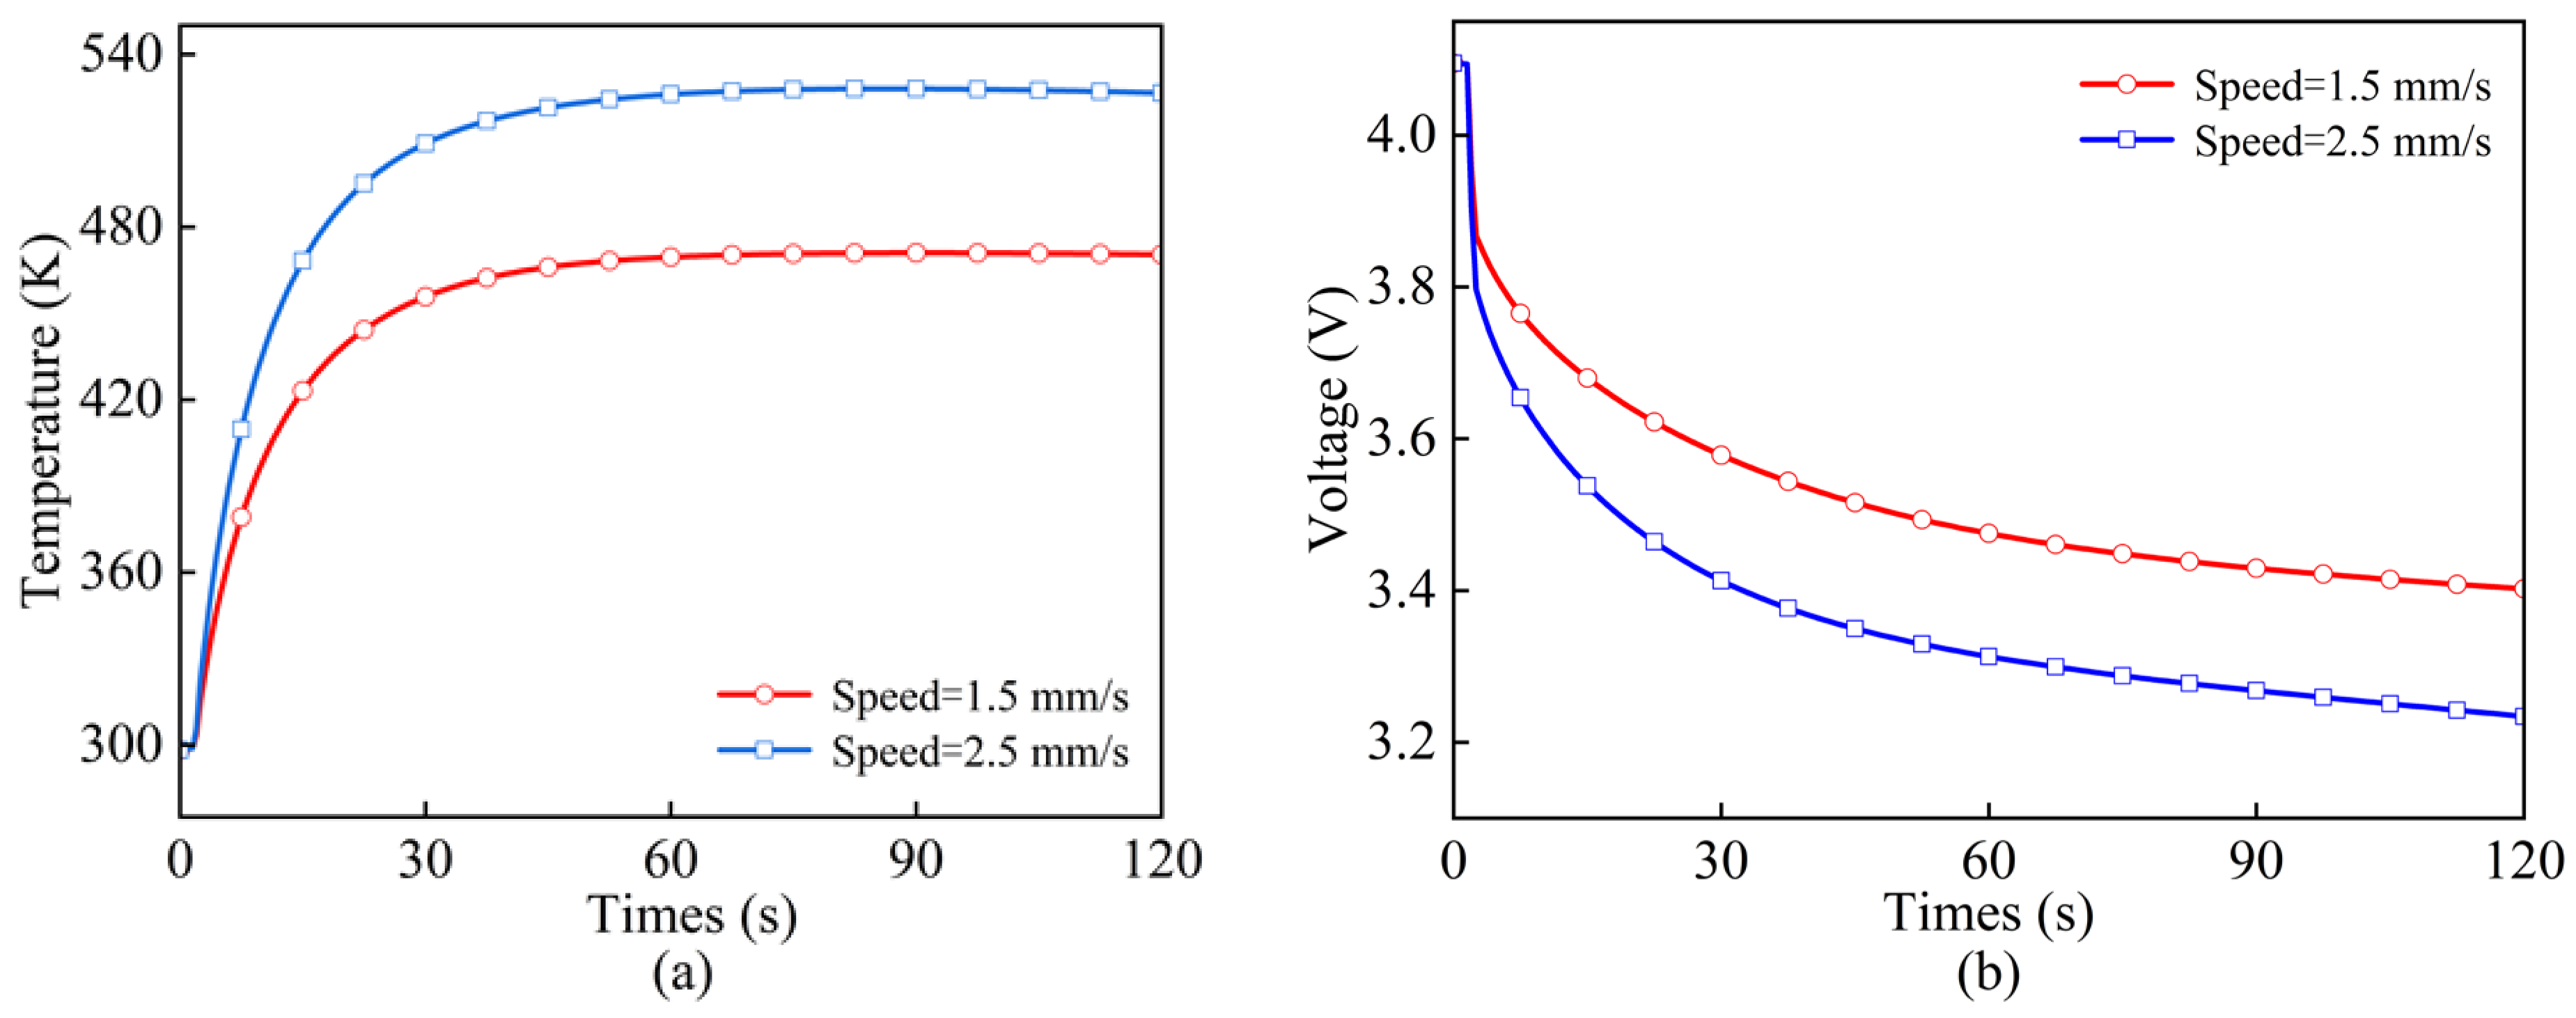
Figure 5 illustrates the regulatory effect of penetration rate on the temperature variation patterns during battery TR, with this study selecting two representative rates of 1.5 mm/s and 2.5 mm/s for comparative investigation. Experimental data reveal that both the rapidity of temperature increases and the ultimate temperature maximum exhibit an enhancing trend with the elevation of penetration rate (Figure 5a). Specifically, under the lower penetration condition of 1.5 mm/s, the maximum temperature attainable by the battery remains notably lower, sustaining at approximately 470 K; whereas when the penetration rate escalates to 2.5 mm/s, the internal battery temperature markedly ascends to around 530 K. At a low penetration speed (1.5 mm/s), the temperature rises slowly during the first 3 s, and the rapid increase occurs after 4 s, allowing partial heat dissipation to the surroundings. In contrast, at a high speed (2.5 mm/s), the temperature enters the rapid increase stage within 2.5 s, and the peak temperature is reached approximately 2 s earlier than in the low-speed case. This demonstrates that higher penetration speed shortens the incubation period and intensifies the thermal runaway. Fundamentally, the penetration rate essentially governs the immediacy of physical contact achieved between the cathode and anode materials following penetration. When employing high-speed penetration at 2.5 mm/s, extensive direct contact forms between the positive and negative electrodes within an extremely brief timeframe, thereby rapidly establishing a short-circuit loop characterized by a broad contact area and low resistance values. Conversely, low-speed penetration at 1.5 mm/s manifests as a relatively gradual, progressive process, resulting in comparatively limited short-circuit contact regions accompanied by higher contact resistance.
Figure 5b clearly reveals the intrinsic relationship between penetration rate and battery voltage response. The study finds that the higher the penetration rate, the faster the voltage decay occurs. Under the penetration condition of 2.5 mm/s, the battery voltage rapidly decreases to approximately 3.2 V within 90 s. When the penetration rate is further increased, a low-impedance short-circuit channel immediately forms inside the battery, thereby providing an efficient release path for the stored electrical energy. There exists a clear negative correlation between the formation speed of the short-circuit channel and its resistance value. Specifically, the faster the channel forms, the smaller its resistance becomes, which enables energy to be released at a higher rate, ultimately resulting in a rapid voltage drop. Comparing Figure 5a,b, the voltage drop rate is positively correlated with the temperature rise rate: at 2.5 mm/s, a sharp voltage plunge coincides with a drastic temperature surge; at 1.5 mm/s, a gradual voltage drop leads to a delayed and lower temperature peak.
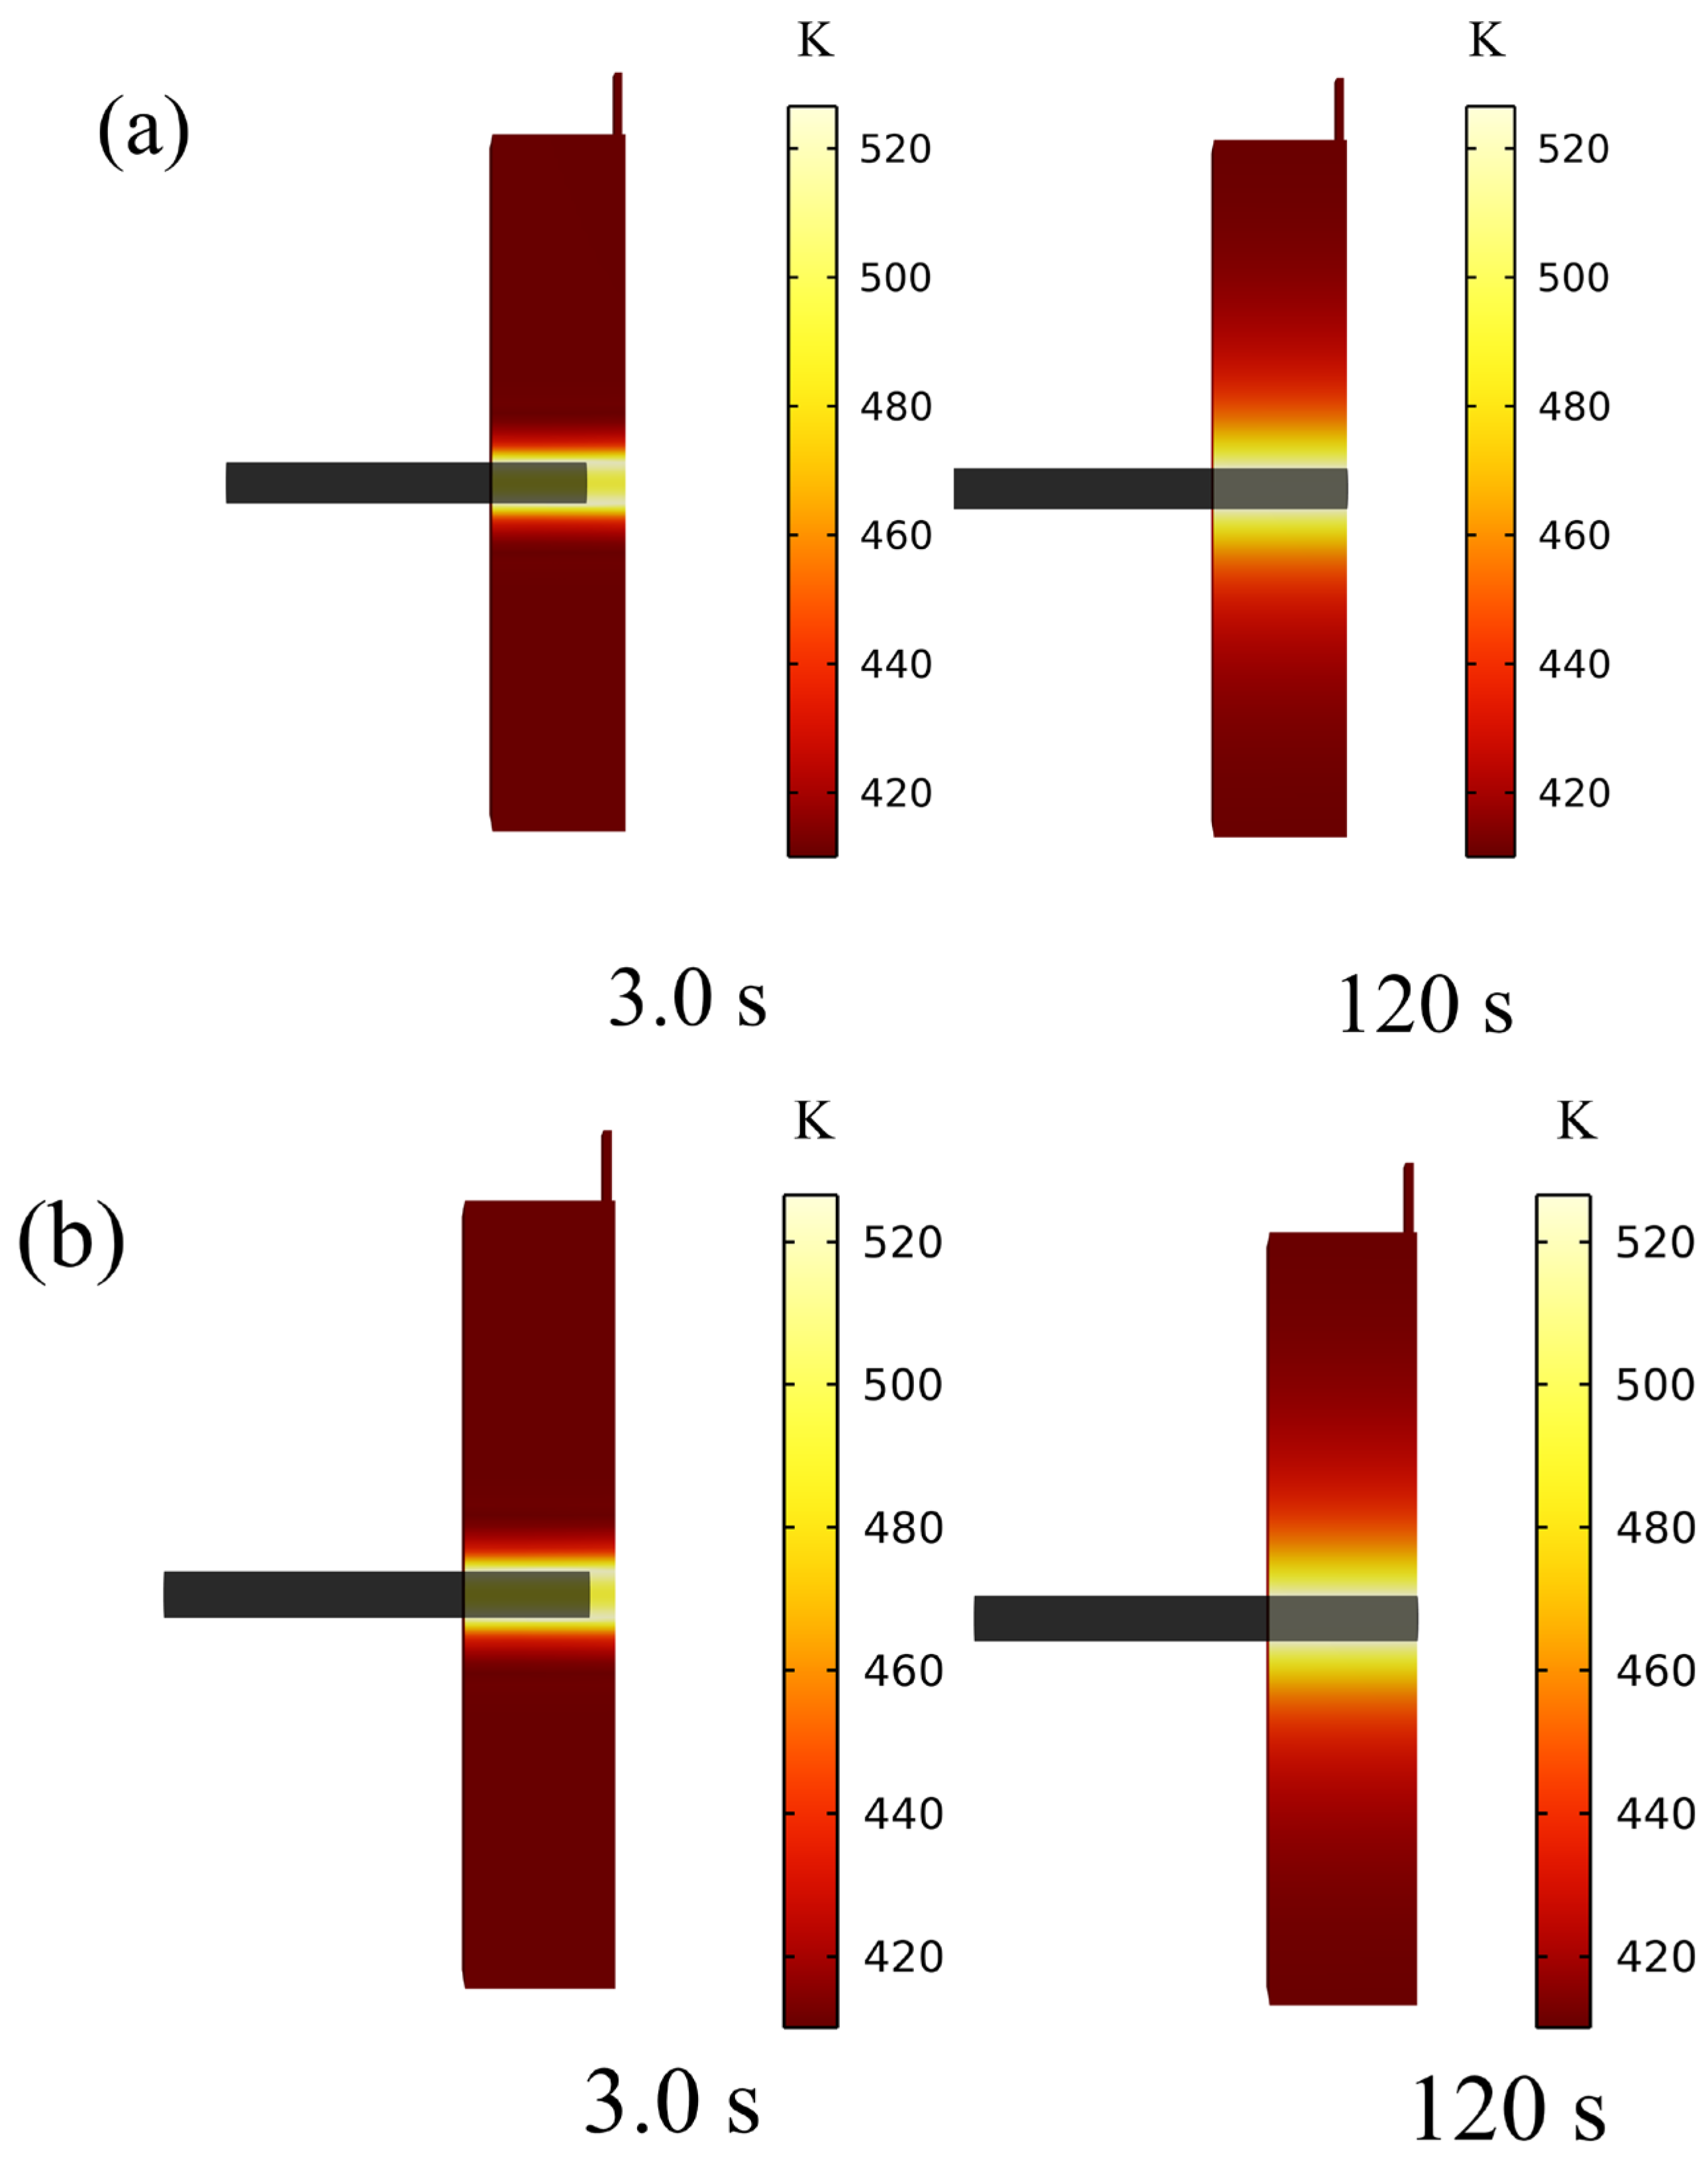
Figure 6 presents a comparative analysis of the temperature distribution within the battery at identical time points under varying penetration rates. When a lower penetration rate (1.5 mm/s) is employed, the temperature rise during the initial phase (0–3 s) remains relatively gradual, with the high-temperature zone primarily localized around the penetration site. As the process progresses, although heat continues to accumulate, the extent of thermal conduction remains distinctly constrained. In stark contrast, under higher penetration rates, a high-temperature core region forms rapidly within the battery, with the hotspot area expanding dramatically and establishing a well-defined thermal conduction pathway within merely 2.5 s. Ultimately, the TR phenomenon propagates throughout the entire battery structure. From a mechanistic perspective, this rate-dependent characteristic fundamentally reflects the competitive interplay between the kinetic process of short-circuit formation and the timescale of thermochemical reactions: high-speed penetration instantaneously injects substantial energy within the system’s thermal relaxation time window, thereby disrupting the thermal equilibrium state; whereas low-speed penetration provides adequate opportunity for heat dissipation, effectively preventing the occurrence of the TR chain reaction.

4.3. Needling at Different Positions

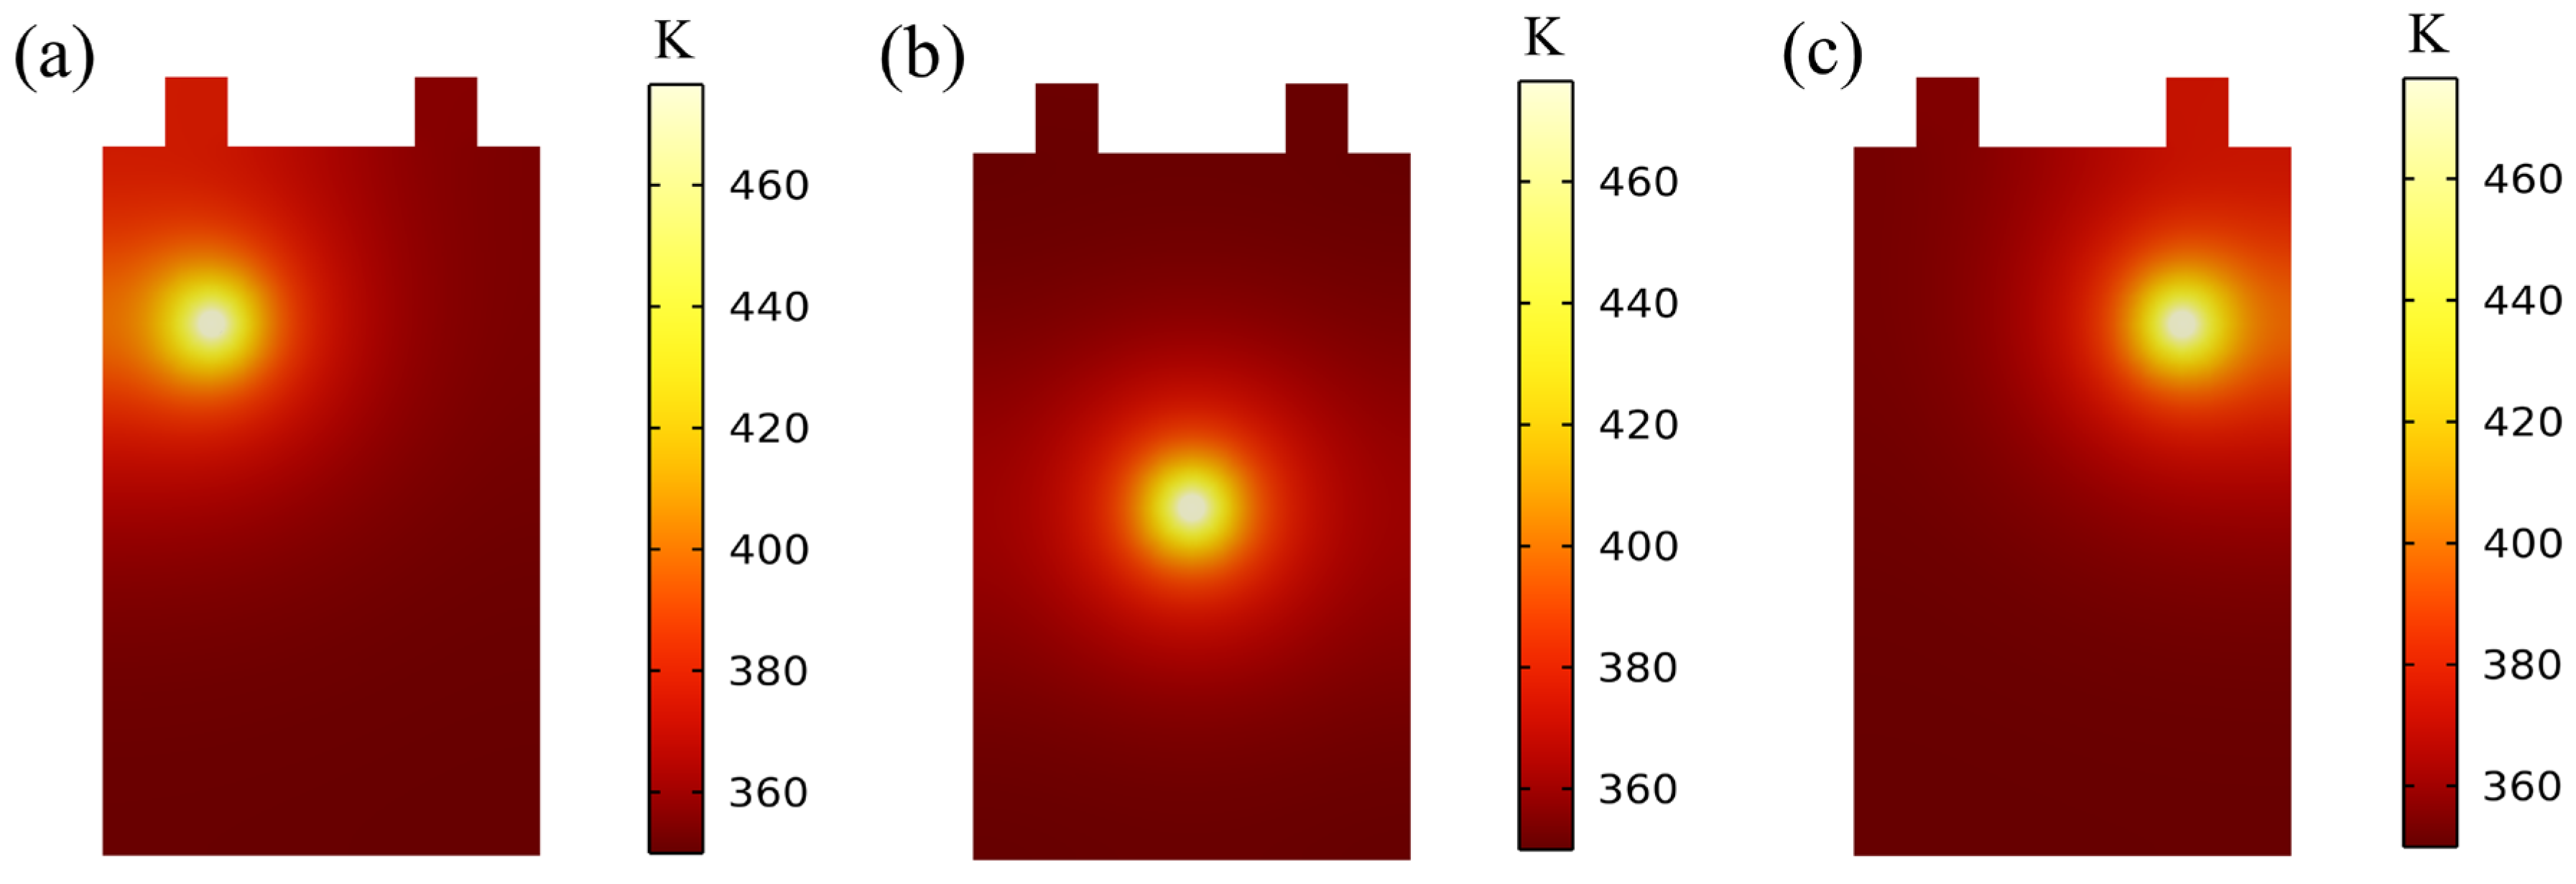
This study employed numerical simulation methods to comprehensively investigate the mechanism by which variations in penetration location affect the TR characteristics of LIBs. Figure 7 consolidates the relevant experimental data. Comparative analysis indicates that penetrations near electrode edges induce more severe TR phenomena compared to the central region of the battery, specifically characterized by higher peak temperatures and broader thermal propagation ranges.
Figure 7a illustrates the temperature field distribution characteristics under penetration conditions at the upper section of the left edge. The maximum temperature recorded under this condition is approximately 477 K. As shown in the temperature distribution map, the high-temperature region primarily concentrates around the penetration point and extends diffusively along the left edge toward the negative electrode tab.
Figure 7b depicts the thermodynamic behavior at the central penetration location. This region lacks both the high chemical reactivity of electrode materials and the rapid heat dissipation advantages of edge structures, causing heat to preferentially accumulate within the battery’s core area, with difficulty in effective outward transfer. Particularly at the central point, the heat conduction path to the external environment is the longest. This thermal resistance effect facilitates continuous heat accumulation, thereby increasing the risk of triggering comprehensive TR. In the region adjacent to the positive electrode tab on the right side of the battery, the current density generated by ISC increases significantly. This elevated current density enables Joule heat to rapidly generate and accumulate within an extremely short timeframe, causing the temperature in this area to rise to 480 K, which markedly exceeds the temperature levels observed in the left and central regions.
Figure 7c portrays the thermal response at the upper-right corner penetration position. This location resides within the electrochemically highly active positive electrode material region. Although the corner structure possesses the physical advantage of bidirectional heat dissipation, its heat dissipation capacity proves insufficient when confronted with intense heat generation processes. This imbalance between heat dissipation and heat generation results in severe localized overheating, and the abnormally elevated temperatures inflict significant thermal damage on the internal battery materials.

4.4. The Different Effects of Initial SOC

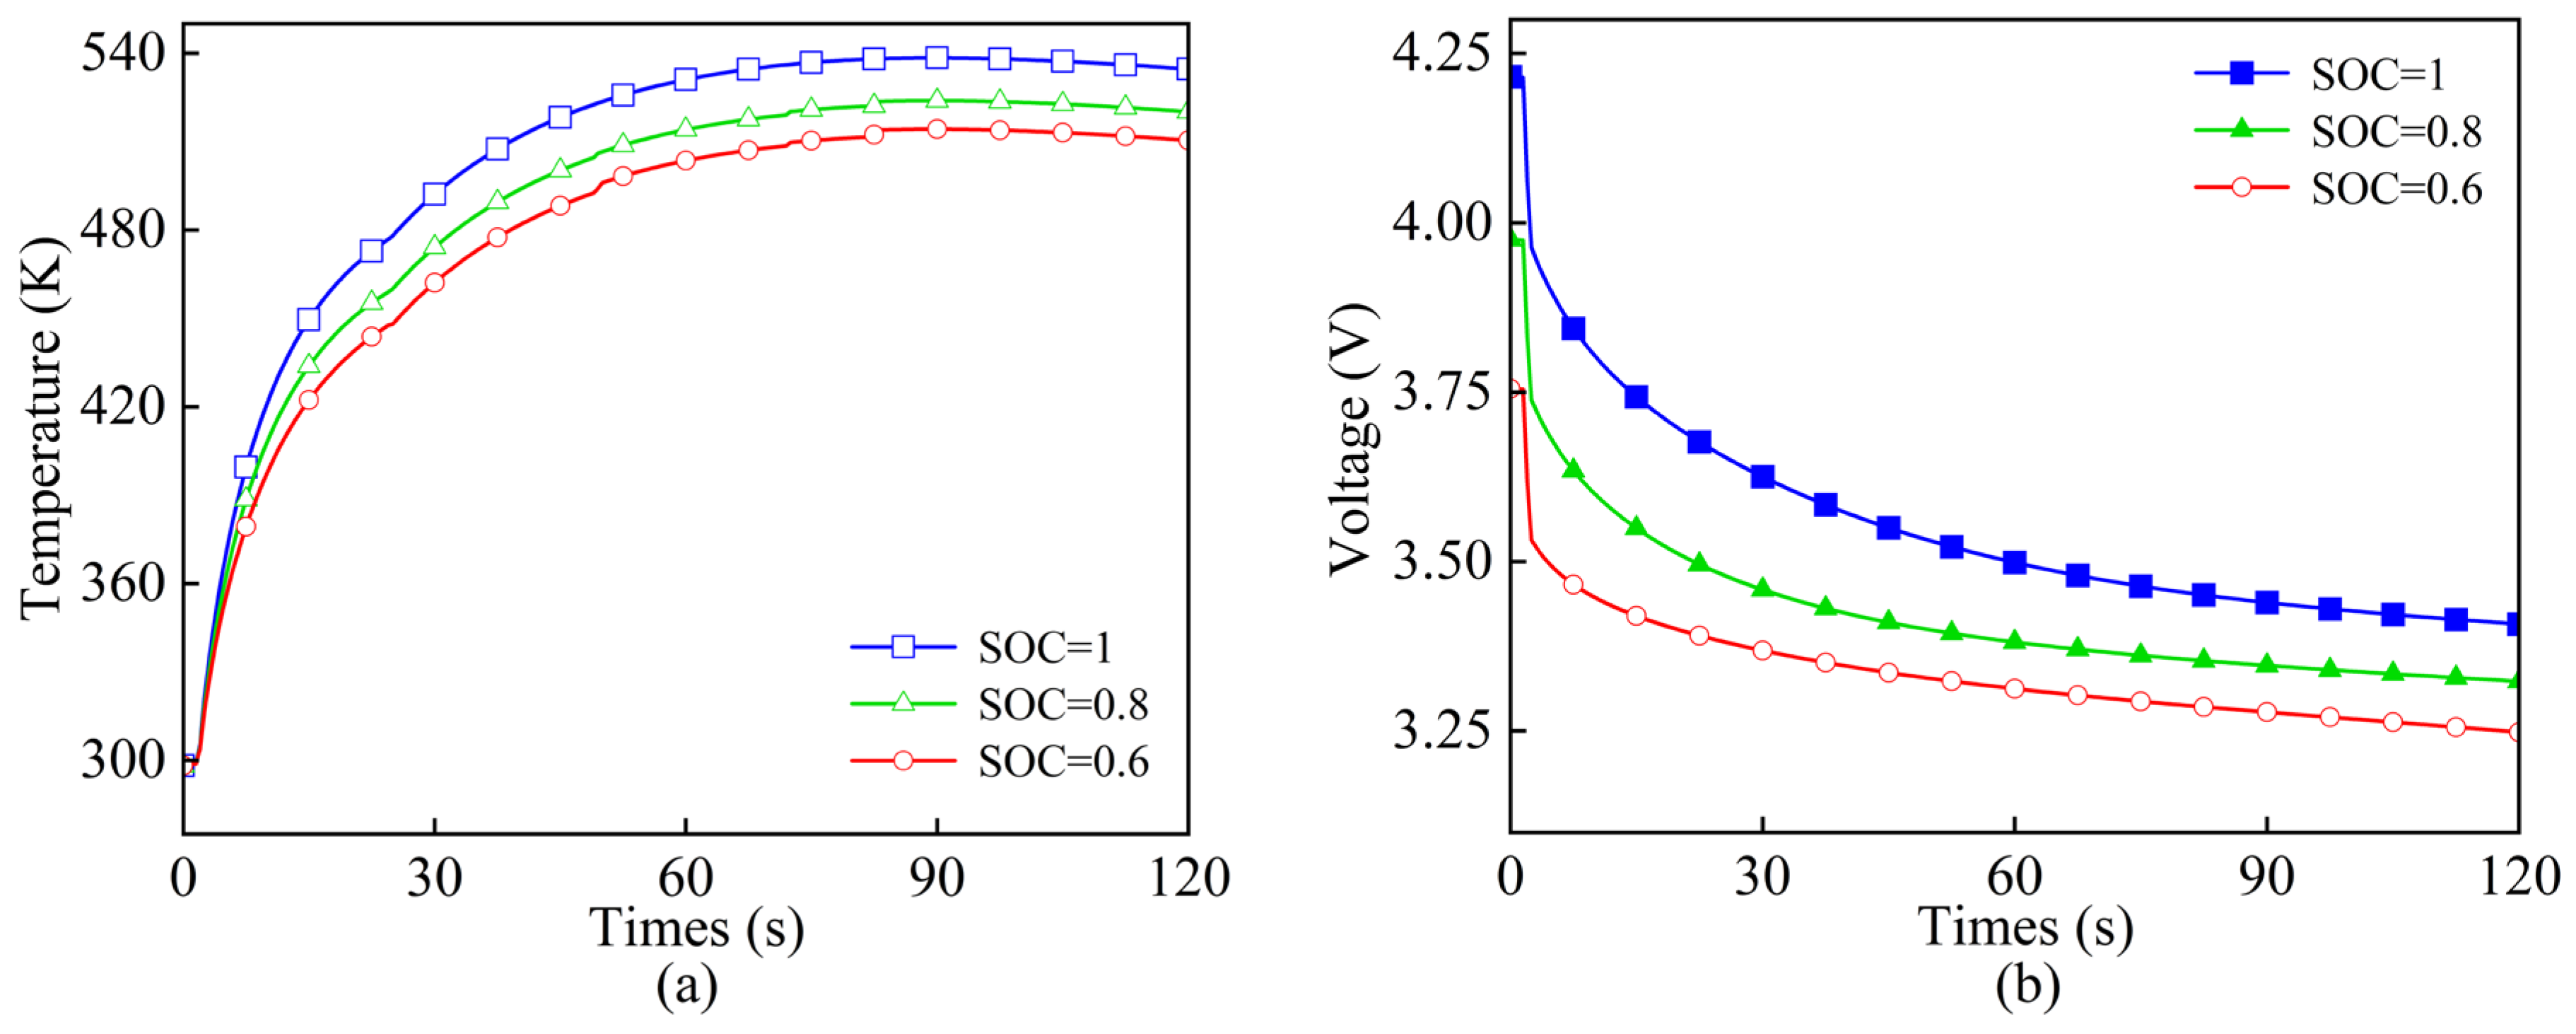
The initial SOC is varied from 0.6 to 1.0 because below 0.6, the stored energy is insufficient to trigger a full thermal runaway under nail penetration, making such conditions less relevant for safety assessment; the upper limit of 1.0 represents the fully charged state with the highest risk. Figure 8 presents the electro-thermal response characteristics of a LIB during nail penetration–induced TR under varying initial SOC. The results reveal a strong dependence of both peak temperature and voltage drop magnitude on the initial SOC. Specifically, as the initial SOC decreases, the peak temperature attained during TR progressively declines, accompanied by a reduced rate and extent of voltage decay. For SOC = 1.0, the temperature enters the rapid increase stage immediately after penetration and reaches a peak of 540 K within 5 s. For SOC = 0.8, the onset of rapid temperature rise is delayed by about 1 s, and the peak temperature is 525 K. For SOC = 0.6, the temperature increases slowly throughout the process, with a peak of only 510 K, and no distinct thermal runaway is observed. This indicates that higher SOC not only raises the peak temperature but also accelerates the thermal runaway propagation. This trend arises because a lower SOC corresponds to less stored chemical energy, which slows the initial heat generation rate during exothermic reactions. Additionally, fewer active materials are available to participate in these reactions, leading to a smaller total heat release. Together, these effects result in a lower peak temperature and a shorter duration of exothermic activity, which accounts for the observed differences in the temperature profiles shown in Figure 8a.
Concurrently, the voltage drop during TR exhibits a stepwise reduction as the initial SOC decreases. As illustrated in Figure 8b, at 100% SOC, the cell voltage falls from 4.2 V to 3.4 V, a drop of 0.8 V, while at 60% SOC, it decreases from 3.8 V to 3.3 V, yielding a smaller drop of only 0.5 V. Given that the internal resistance of the battery remains relatively unchanged across different SOC levels and can be treated as approximately constant, the variation in open-circuit voltage becomes the dominant factor governing the short-circuit current magnitude. A lower SOC entails a lower open-circuit voltage, which, under nearly identical internal resistance, produces a weaker short-circuit current. Consequently, the voltage decline is more gradual, and the associated thermal response is less severe.

5. Conclusions

This study primarily investigates the temperature and voltage response characteristics, as well as the spatial temperature distribution, of a single lithium-ion cell during nail penetration–induced TR under various influencing factors. To this end, an electrochemical–thermal coupled model tailored for nail penetration scenarios is developed to systematically analyze the effects of key parameters—including nail radius, penetration speed, initial SOC, surface heat transfer coefficient, and penetration location—on the cell’s TR behavior. The paper also elucidates the fundamental mechanisms of TR and associated heat dissipation pathways, and discusses the associated TR risks in LIBs (LIBs). The main findings are summarized as follows:
(1)
Increasing the nail radius and penetration speed enlarges the internal short-circuit area within the battery and intensifies the short-circuit current, thereby exacerbating TR and elevating its peak temperature. When the nail radius reaches 5 mm, the maximum temperature of the single cell can rise to 538 K.
(2)
Regions adjacent to the electrodes experience higher TR temperatures, whereas areas nearer to the tabs show more evident heat dissipation. Specifically, the peak TR temperature reaches 477 K near the negative electrode, 480 K near the positive electrode, and 468 K at the center of the cell.
(3)
A higher SOC in a LIB implies more stored energy, which results in faster electrochemical reactions, a more significant voltage decline, and intensified heat generation. At 100% SOC, the battery exhibits a maximum voltage drop of 0.8 V and attains a peak temperature of 500 K.

Author Contributions

Data curation, software, writing—original draft preparation and writing—review, X.X.; investigation, formal analysis, and editing, Z.W.; conceptualization, methodology, T.O. All authors have read and agreed to the published version of the manuscript.

Funding

This work was supported by the Guangxi Science Fund for Distinguished Young Scholars [grant numbers 2023GXNSFFA026013]; the Scientific Research and Technology Development Program of Guangxi (Key project) [grant numbers ZG2503980045]; the National Natural Science Foundation of China [grant numbers 2021NSFC52175081, 2024NSFC52475097].

Data Availability Statement

The original contributions presented in this study are included in the article. Further inquiries can be directed to the corresponding author.

Conflicts of Interest

The authors declare no conflicts of interest.

Abbreviations

The following abbreviations are used in this manuscript:
LIBsLithium-ion batteries
TRThermal runaway
ISCInternal short circuits
SOCState of charge

References

  1. Zhao, X.; Ma, X.; Chen, B.; Shang, Y.; Song, M. Challenges toward carbon neutrality in China: Strategies and countermeasures. Resour. Conserv. Recycl. 2022, 176, 105959. [Google Scholar] [CrossRef] [Scilit]
  2. Wu, W.; Wang, S.; Wu, W.; Chen, K.; Hong, S.; Lai, Y. A critical review of battery thermal performance and liquid based battery thermal management. Energy Convers. Manag. 2019, 182, 262–281. [Google Scholar] [CrossRef] [Scilit]
  3. Kim, T.; Song, W.; Son, D.Y.; Ono, L.K.; Qi, Y. Lithium-ion batteries: Outlook on present, future, and hybridized technologies. J. Mater. Chem. A 2019, 7, 2942–2964. [Google Scholar] [CrossRef] [Scilit]
  4. Feng, X.; Ren, D.; He, X.; Ouyang, M. Mitigating thermal runaway of lithium-ion batteries. Joule 2020, 4, 743–770. [Google Scholar] [CrossRef] [Scilit]
  5. Wang, Q.; Mao, B.; Stoliarov, S.I.; Sun, J. A review of lithium-ion battery failure mechanisms and fire prevention strategies. Prog. Energy Combust. Sci. 2019, 73, 95–131. [Google Scholar] [CrossRef] [Scilit]
  6. Larsson, F.; Andersson, P.; Blomqvist, P.; Lorén, A.; Mellander, B.-E. Characteristics of lithium-ion batteries during fire tests. J. Power Sources 2014, 271, 414–420. [Google Scholar] [CrossRef] [Scilit]
  7. Ohsaki, T.; Kishi, T.; Kuboki, T.; Takami, N.; Shimura, N.; Sato, Y.; Sekino, M.; Satoh, A. Overcharge reaction of lithium-ion batteries. J. Power Sources 2005, 146, 97–100. [Google Scholar] [CrossRef] [Scilit]
  8. Spotnitz, R.; Franklin, J. Abuse behavior of high-power, lithium-ion cells. J. Power Sources 2003, 113, 81–100. [Google Scholar] [CrossRef] [Scilit]
  9. Shelkea, A.V.; Buston, J.E.H.; Gill, J.; Howard, D.; Williams, R.C.E.; Read, E.; Abaza, A.; Cooper, B.; Richards, P.; Wen, J.X. Combined numerical and experimental studies of 21700 lithium-ion battery thermal runaway induced by different thermal abuse. Int. J. Heat Mass Transf. 2022, 194, 123099. [Google Scholar] [CrossRef] [Scilit]
  10. Ping, P.; Wang, Q.S.; Huang, P.F.; Li, K.; Sun, J.; Kong, D.; Chen, C. Study of the fire behavior of high-energy lithium-ion batteries with full-scale burning test. J. Power Sources 2015, 285, 80–89. [Google Scholar] [CrossRef] [Scilit]
  11. Friesen, A.; Horsthemke, F.; Mönnighoff, X.; Brunklaus, G.; Krafft, R.; Börner, M.; Risthaus, T.; Winter, M.; Schappacher, F.M. Impact of cycling at low temperatures on the safety behavior of 18650-type lithium-ion cells: Combined study of mechanical and thermal abuse testing accompanied by post-mortem analysis. J. Power Sources 2016, 334, 1–11. [Google Scholar] [CrossRef] [Scilit]
  12. Yuan, Q.F.; Zhao, F.; Wang, W.; Zhao, Y.M.; Liang, Z.; Yan, D. Overcharge failure investigation of lithium-ion batteries. Electrochim. Acta 2015, 178, 682–688. [Google Scholar] [CrossRef] [Scilit]
  13. Fernandes, Y.; Bry, A.; De Persis, S. Identification and quantification of gases emitted during abuse tests by overcharge of a commercial Li-ion battery. J. Power Sources 2018, 389, 106–119. [Google Scholar] [CrossRef] [Scilit]
  14. Lamb, J.; Orendorff, C.J. Evaluation of mechanical abuse techniques in lithium-ion batteries. J. Power Sources 2014, 247, 189–196. [Google Scholar] [CrossRef] [Scilit]
  15. Maleki, H.; Howard, J.N. Internal short circuit in Li-ion cells. J. Power Sources 2009, 191, 568–574. [Google Scholar] [CrossRef] [Scilit]
  16. Finegan, D.P.; Tjaden, B.; Heenan, T.M.M.; Jervis, R.; Di Michiel, M.; Rack, A.; Hinds, G.; Brett, D.J.L.; Shearing, P.R. Tracking internal temperature and structural dynamics during nail penetration of lithium-ion cells. J. Electrochem. Soc. 2017, 164, A3285. [Google Scholar] [CrossRef] [Scilit]
  17. Doyle, M.; Newman, J.; Gozdz, A.S.; Schmutz, C.N.; Tarascon, J.-M. Comparison of modeling predictions with experimental data from plastic lithium-ion cells. J. Electrochem. Soc. 1996, 143, 1890. [Google Scholar] [CrossRef] [Scilit]
  18. Ping, P.; Wang, Q.; Chung, Y.; Wen, J. Modelling electro-thermal response of lithium-ion batteries from normal to abuse conditions. Appl. Energy 2017, 205, 1327–1344. [Google Scholar] [CrossRef] [Scilit]
  19. Zhao, W.; Luo, G.; Wang, C.Y. Modeling nail penetration process in large-format Li-ion cells. J. Electrochem. Soc. 2014, 162, A207. [Google Scholar] [CrossRef] [Scilit]
  20. Feng, X.; He, X.; Lu, L.; Ouyang, M. Analysis on the fault features for internal short circuit detection using an electrochemical-thermal coupled model. J. Electrochem. Soc. 2018, 165, A155. [Google Scholar] [CrossRef] [Scilit]
  21. Dong, T.; Peng, P.; Jiang, F. Numerical modeling and analysis of the thermal behavior of NCM lithium-ion batteries subjected to very high C-rate discharge/charge operations. Int. J. Heat Mass Transf. 2018, 117, 261–272. [Google Scholar] [CrossRef] [Scilit]
  22. Li, H.; Zhou, D.; Zhang, M.; Liu, B.; Zhang, C. Multi-field interpretation of internal short circuit and thermal runaway behavior for lithium-ion batteries under mechanical abuse. Energy 2023, 263, 126027. [Google Scholar] [CrossRef] [Scilit]
  23. Fuller, T.F.; Doyle, M.; Newman, J. Simulation and optimization of the dual lithium ion insertion cell. J. Electrochem. Soc. 1994, 141, 1. [Google Scholar] [CrossRef] [Scilit]
  24. Ouyang, T.; Liu, B.; Wang, C.; Ye, J.; Liu, S. Novel hybrid thermal management system for preventing Li-ion battery thermal runaway using nanofluids cooling. Int. J. Heat Mass Transf. 2023, 201, 123652. [Google Scholar] [CrossRef] [Scilit]
  25. Fang, W.; Ramadass, P.; Zhang, Z.J. Study of internal short in a Li-ion cell-II. numerical investigation using a 3D electrochemical-thermal model. J. Power Sources 2014, 248, 1090–1098. [Google Scholar] [CrossRef] [Scilit]
  26. Zhao, R.; Liu, J.; Gu, J. A comprehensive study on Li-ion battery nail penetrations and the possible solutions. Energy 2017, 123, 392–401. [Google Scholar] [CrossRef] [Scilit]
  27. Wang, J.; Zhou, Y.; Wang, Z.; He, C.; Zhao, Y.; Huang, X.; Richard, Y.K.K. Fire-resistant and mechanically-robust phosphorus-doped MoS2/epoxy composite as barrier of the thermal runaway propagation of lithium-ion batteries. Chem. Eng. J. 2024, 497, 154866. [Google Scholar] [CrossRef] [Scilit]
Figure 1. Schematic illustrations of the nail penetration.
Energies 19 02274 g001
Figure 2. (a) Comparison of experimental data and simulation data of temperature changes; (b) Relative error between experimental data and simulated data; (c) Comparison and difference in temperature rise rates between experimental data and simulation data; (d) The difference in temperature rise rate between the experimental data and the simulation data.
Energies 19 02274 g002
Figure 3. (a) Temperature variation under different radius; (b) Voltage variation under different radius.
Energies 19 02274 g003
Figure 4. Temperature distribution under different needle insertion radius: (a) R = 3 mm; (b) R = 5 mm.
Energies 19 02274 g004
Figure 5. (a) Temperature variation under different needling speeds; (b) Voltage variation under different needling speeds.
Energies 19 02274 g005
Figure 6. Temperature distribution under different penetration speeds at identical time points: (a) Speed = 1.5 mm/s; (b) Speed = 2.5 mm/s.
Energies 19 02274 g006
Figure 7. Temperature distribution under different heat transfer coefficients: (a) Top left corner; (b) The center area; (c) Top right corner.
Energies 19 02274 g007
Figure 8. (a) Temperature variation under different initial SOC; (b) Voltage variation under different initial SOC.
Energies 19 02274 g008
Table 1. The key structural geometric parameters of LIB [19].
Component UnitParameterValueUnit
AlL × W × H105 × 0.02 × 170mm
AnodeL × W × H105 × 0.12 × 170mm
CathodeL × W × H105 × 0.205 × 170mm
CuL × W × H105 × 0.02 × 170mm
SeparatorL × W × H105 × 0.03 × 170mm
Table 2. The influence of the amount of mesh on the simulation results.
Mesh Number100,136114,073137,659235,931
The battery temperature at 30 s443.23 K445.49 K447.09 K447.52 K
The battery temperature at 60 s466.38 K466.62 K466.54 K466.53 K
The battery temperature rise from 30 s to 60 s23.15 K21.13 K19.45 K19.01 K
Relative error9.56%8.64%2.31%
Disclaimer/Publisher’s Note: The statements, opinions and data contained in all publications are solely those of the individual author(s) and contributor(s) and not of MDPI and/or the editor(s). MDPI and/or the editor(s) disclaim responsibility for any injury to people or property resulting from any ideas, methods, instructions or products referred to in the content.