Article

Energy Recovery from Waste Buttermilk in Microbial Fuel Cells Equipped with a Gas Diffusion Anode and Non-Precious Metal Cathodes


by
Paweł P. Włodarczyk
1,*,
Barbara Włodarczyk
1,
Mateusz Malinowski
2 and
Stanisław Famielec
2
1
Institute of Environmental Engineering and Biotechnology, University of Opole, 45-032 Opole, Poland
2
Department of Bioprocess Engineering, Power Engineering and Automation, Faculty of Production and Power Engineering, University of Agriculture in Kraków, 30-149 Kraków, Poland
*
Author to whom correspondence should be addressed.
Energies 2026, 19(10), 2272; https://doi.org/10.3390/en19102272
Submission received: 18 March 2026 / Revised: 20 April 2026 / Accepted: 6 May 2026 / Published: 8 May 2026
(This article belongs to the Section A4: Bio-Energy)

Abstract

The valorization of dairy industry by-products and simultaneous energy recovery remain important challenges in sustainable waste management. In this study, waste buttermilk was evaluated as a substrate for bioelectricity generation in a microbial fuel cell (MFC) equipped with a gas diffusion anode (GDE) and non-precious metal cathodes. Three electrode configurations were investigated: GDE/GDE, GDE/Cu–B, and GDE/Ni–Co. Stable operation was achieved for all MFC systems, confirming that waste buttermilk can support electroactive biofilm development. The GDE/Ni–Co configuration exhibited the highest performance, reaching a maximum power density of 25 mW·m−2, compared to 22 mW·m−2 and 17 mW·m−2 for GDE/Cu–B and GDE/GDE, respectively. Coulombic efficiency ranged from 10.83% to 18.82%, depending on the electrode system. A cyclic performance decrease was observed, likely caused by membrane fouling and electrode surface blockage. The results indicate that waste buttermilk can be utilized for simultaneous waste treatment and energy recovery in MFC systems, although further optimization is required to improve long-term stability.

1. Introduction

In the 21st century, increasing global shortages of water and energy have emerged as key challenges facing modern economies. One of the key factors contributing to this phenomenon is the growing consumption of food, particularly dairy products [1]. The dairy industry represents one of the most important sectors of the food industry in Poland and across the European Union, with Poland producing around 14–15 billion liters of milk annually (8–9% of EU output). Its economic significance arises not only from its substantial contribution to food production, but also from its role as a critical link in the supply chain of high-value nutritional products, with exports exceeding €3 billion annually [2,3].
The dairy sector is an environmentally intensive branch of the food industry due to the high water and energy consumption and the generation of large amounts of waste and wastewater [4,5,6,7]. Consequently, increasing attention is being paid to implementing sustainable development and circular economy principles aimed at reducing environmental impact while improving economic efficiency [8,9,10,11,12,13].
Milk processing generates a wide variety of waste streams, which can be broadly classified as organic residues, including whey, protein- and fat-rich by-products, and expired dairy products. Whey alone accounts for approximately 80–90% of the volume of milk used in cheese production; therefore, its proper management is of critical environmental and economic importance. In addition, inorganic wastes are also produced, such as used packaging materials, plastic films, equipment components, spent filtration membranes, and sludge from wastewater treatment plants [14,15,16,17].
A major advancement in dairy waste management is the valorization of by-products, particularly whey. Instead of disposal, whey is widely used as a raw material for the production of whey protein concentrates (30–40%), food-grade lactose (20–30%), fermented beverages (10–20%), and bioethanol (5–10%) [18,19]. This approach enables the conversion of waste streams into value-added products while reducing the environmental footprint of the dairy industry. In addition, increasing attention is being paid to biotechnological processing of dairy waste, such as whey fermentation for lactic acid production, a key precursor for biodegradable plastics (PLA). These strategies align with circular economy principles and support the development of food biorefineries [20,21,22].
The ongoing transformation of the dairy sector is thus oriented toward the creation of integrated systems in which waste generated at one stage of production becomes a resource for subsequent processes. This includes the reuse of treated process water in closed-loop systems, heat recovery from pasteurization and cleaning-in-place (CIP) operations, and the production of biogas from sewage sludge and organic waste. The biogas can subsequently be used for the generation of thermal and electrical energy to meet the internal energy demands of dairy plants, typically contributing significantly to on-site energy supply (often in the range of 20–40%) of total energy demand, with combined heat and power (CHP) systems achieving electrical efficiencies of 30–40% and overall efficiencies of 70–90% [23].
Buttermilk is a by-product of butter production, obtained either from the churning of cream (sweet buttermilk) or from the fermentation of milk cream. It consists primarily of residual milk fat and milk proteins, including whey proteins and caseins. The nutritional composition and functional properties of buttermilk vary depending on its origin. Consequently, buttermilk derived from whey-based processes differs in composition and functionality from that obtained from sweet or cultured cream [24,25].
Moreover, the incorporation of buttermilk into bakery formulations has been shown to enhance their nutritional value, improve rheological properties (such as water absorption, dough development time and temperature), sensory quality, and physical characteristics including product volume and weight. For this reason, the addition of approximately 30% buttermilk is recommended to improve both the nutritional and sensory properties of baked goods [26,27].
In addition, buttermilk and cow’s milk serve as sources of exopolysaccharides (EPS) and other secondary metabolites produced by lactic acid bacteria, such as Lactococcus lactis. EPS derived from buttermilk is widely used as a thickening agent in the food industry [28]. Buttermilk also contains proteolytic microorganisms, including lactic acid bacteria, capable of generating bioactive peptides with diverse functional properties. Thermal treatment of buttermilk has been reported to release peptides exhibiting antimicrobial activity [29]. As a result, dairy industry by-products can be valorized into high-demand products suitable for applications in bakery goods, dairy products, beverages, bioactive compounds, biopolymers for microencapsulation materials, exopolysaccharides, short-chain fatty acids, and many other value-added products [28,29]. In contrast, the conversion of dairy waste into electrical energy is primarily driven by anaerobic consortia, including methanogenic archaea (e.g., Methanosaeta and Methanosarcina) in biogas systems or electroactive bacteria such as Geobacter and Shewanella in microbial fuel cells, as reported in previous studies [30,31].
Another important waste stream in the dairy industry is technological wastewater, which represents a significant environmental challenge. It contains high concentrations of organic compounds such as lactose, proteins, and fats, as well as nitrogen, phosphorus, and mineral salts. Due to this high organic load, dairy wastewater is characterized by elevated chemical oxygen demand (COD). The uncontrolled discharge of such effluents can lead to contamination of surface and groundwater, soil degradation, and disruption of natural biological processes, resulting in eutrophication and deterioration of ecosystems [32,33,34].
Despite recent progress, the dairy industry still faces several challenges, including high investment costs of advanced environmental technologies and regulatory limitations affecting the utilization of by-products. In addition, market volatility related to energy prices and raw materials complicates the implementation of waste-to-energy solutions. At the same time, the sector is undergoing a transformation toward more sustainable and integrated systems, where waste streams are minimized, and by-products are valorized. This transition is driven by the development of biotechnological processes, circular economy strategies, and resource efficiency improvements [35,36]. Effective waste management is therefore becoming not only a regulatory requirement but also an opportunity to enhance innovation and competitiveness in the dairy sector.
The efficient management of wastewater and organic by-products, combined with their valorization for energy generation, represents a rational and sustainable strategy for the dairy sector. One promising approach is the application of microbial fuel cell (MFC) technology, which enables simultaneous wastewater treatment and bioelectricity generation. MFCs are bioelectrochemical systems that convert the chemical energy stored in organic substrates, including industrial by-products, directly into electricity [37,38,39]. A typical MFC consists of anodic and cathodic chambers separated by a proton exchange membrane (PEM). In the anodic chamber, electroactive microorganisms oxidize organic matter while forming a biofilm on the electrode surface, releasing electrons and protons. The electrons flow through an external circuit to the cathode, generating electrical current, while protons migrate through the membrane to complete the circuit [37,40,41]. The formation of a stable and electroactive biofilm is essential for efficient energy recovery from waste-derived substrates [41,42,43]. Only some genera and species of bacteria within the biofilm are electrochemically active through direct conduction mechanisms, such as Shewanella or Geobacter [44,45,46].
Despite numerous studies on MFCs powered by dairy wastewater, the use of buttermilk as a substrate in systems equipped with gas diffusion anodes and non-precious metal cathodes has received limited attention. The impact of this electrode architecture on energy recovery performance remains insufficiently explored.
This study evaluates the potential of waste buttermilk as a substrate for energy recovery in a microbial fuel cell system incorporating a gas diffusion anode (GDE) and non-precious metal cathodes. The system performance was assessed to evaluate the feasibility of simultaneous waste valorization and bioelectricity generation. Building on our earlier investigation of GDE-based MFC systems [47] employing a glass reactor and a sintered-glass separator, the present study extends this concept by examining a complex dairy by-product substrate and implementing a noble-metal-free cathode approach with a GDE/GDE reference configuration.

2. Materials and Methods

2.1. Material for Research

Waste buttermilk (WB) obtained from the dairy industry was used as the substrate source in the anodic chamber of the microbial fuel cell. The by-product served as a nutrient medium for the microorganisms colonizing the anode surface. Selected physicochemical parameters (chemical oxygen demand—COD; electrical conductivity—EC) of the WB are summarized in Table 1.
For electrode activation and restart procedures, the substrate was diluted to achieve a COD of 1000 mg·dm−3 to promote stable biofilm development on the anode surface. After the establishment of a stable and electroactive biofilm, the MFC was subsequently fed with buttermilk diluted to a COD level of 5000 mg·dm−3.
Since efficient biofilm formation on the anode surface is essential for stable MFC operation, a carbon-based electrode material characterized by high biocompatibility was selected. A commercially available gas diffusion electrode (GDE), composed of compacted carbon particles supported on a metallic mesh, was employed as the anode. The electrode contains over 90% carbon [47]. The presence of the metallic current collector enhances overall electrical conductivity while preserving a carbon surface favorable for microbial attachment. The GDE used in this study was supplied by Gaskatel GmbH (Kassel, Germany) and is primarily intended for conventional fuel cell applications. An additional practical advantage of this material is the ability to cut the electrode to the desired dimensions, facilitating its adaptation to laboratory-scale reactor configurations.
To ensure a noble-metal-free system, cathodes without precious metal components were selected for investigation. Three cathode types were investigated: a metallic mesh coated with a Cu–B catalyst, a metallic mesh coated with a Ni–Co catalyst, and a GDE. The Cu–B and Ni–Co electrodes were prepared by electrochemical deposition onto copper mesh substrates, as described previously. The Cu–B catalytic layer was obtained by electrodeposition from an electrolyte containing copper sulfate (CuSO4) and sodium borohydride (NaBH4) as the principal components. In the case of the Ni-Co system, the alloy was deposited from a solution based on nickel sulfate (NiSO4) and cobalt sulfate (CoSO4) [48,49]. The deposition processes were conducted at temperatures 90 °C under a current density 2 A·dm−2. The composition of the electrolyte solutions was optimized experimentally to achieve stable alloy formation and uniform surface coverage.

2.2. Experimental Setup

For the measurements of energy recovery from waste buttermilk, a modular, screw-assembled MFC constructed from acrylic (PMMA) was used. This configuration enabled convenient assembly and replacement of the PEM and facilitated visual inspection of proper electrode positioning. The transparent reactor design also allowed monitoring of chamber filling (anodic and cathodic compartments) and observation of cathode aeration, enabling precise control of the air flow rate. Rubber gaskets were positioned between the reactor segments to ensure proper sealing. The acrylic elements were assembled using bolts, which compressed the segments together and slightly deformed the gaskets, resulting in a leak-tight MFC structure.
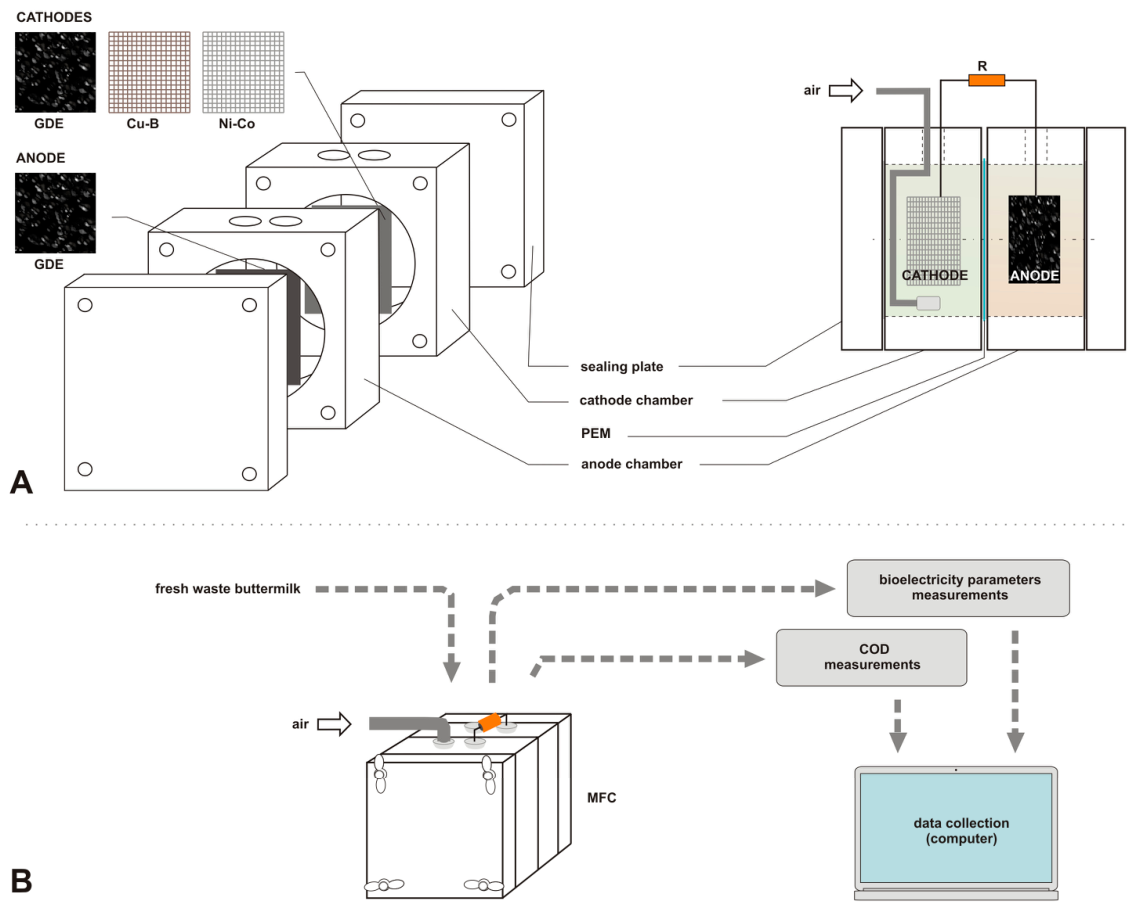
Figure 1 presents the construction of the MFC used in this study and the measurement configuration of the MFC system.
The following electrode systems were implemented: GDE/Cu–B, GDE/Ni–Co, and GDE/GDE. The GDE/GDE configuration was considered as the baseline system, enabling comparison between an all-carbon electrode setup and metal-based catalyst systems free of noble metals. The anode and cathode dimensions (width × length × thickness) were 20 mm × 20 mm × 1 mm. The anodic and cathodic chamber volumes were 30 mL each. The cathode chamber was filled with 50 mM phosphate buffer (PBS, pH 7.2) and continuously aerated to ensure sufficient oxygen availability for the cathodic reaction. Aeration was maintained throughout MFC operation using a stone air diffuser at a flow rate of 2 L·h−1 [50]. Continuous aeration provided stable cathode performance, improved mixing, and minimized concentration gradients within the catholyte.
A Nafion 117 membrane was applied as the proton exchange membrane. An external resistor of 1.5 kΩ was applied to close the electrical circuit of the MFC [51,52,53,54]. The anodic inoculum was obtained from a previously operating MFC, whose microbial community originally originated from activated sludge collected at a municipal wastewater treatment plant. All experiments were conducted at a constant temperature of 21 °C.

2.3. Experiment

During MFC operation, the cell voltage (both during the start-up phase and regular operation), power density, and COD removal were analyzed. Changes in COD were primarily used as an indicator of biofilm activity and overall system performance. During the start-up phase, only the cell voltage was monitored, whereas under stable MFC operation both voltage and power density were analyzed.
Before conducting operational measurements, a start-up procedure was performed in order to obtain a fully active anode. The development of a stable electroactive biofilm on the anode typically requires several start-up cycles, during which microorganisms capable of extracellular electron transfer (EET) become enriched within the biofilm [38,55,56,57,58,59]. During the start-up cycles, the anolyte consisted of waste buttermilk diluted to a COD concentration of 1000 mg·dm−3. Such dilution was considered necessary to promote stable biofilm formation, as excessively high COD concentrations may inhibit the activity of electroactive microorganisms, particularly in the early stages of biofilm development. High organic loading may lead to the accumulation of volatile fatty acids, local decreases in pH within the anodic chamber, and shifts toward fermentative metabolism instead of exoelectrogenic pathways. Under extreme conditions, these effects may prevent successful MFC start-up or significantly delay the establishment of stable electroactive communities. Therefore, to reduce the initial organic load, stabilize pH, and facilitate gradual microbial adaptation on the anode surface, the substrate was initially diluted to a COD level of 1000 mg·dm−3. After successful start-up, higher substrate concentrations were applied during subsequent operational cycles used for MFC performance evaluation. In these cycles, waste buttermilk diluted to a COD concentration of 5000 mg·dm−3 was used.
Due to the reactor design, the MFC operated in batch cycles until a decline in cell voltage was observed. A decrease in voltage indicated reduced substrate availability, at which point the spent buttermilk was replaced with fresh diluted waste buttermilk, initiating a new operational cycle. During substrate replacement, approximately 10% of the previous batch was intentionally retained in the anodic chamber. This approach helped maintain an active microbial environment and stable electrochemical conditions. The remaining fraction of the previous medium preserved planktonic microorganisms, metabolites, and adequate electrolyte conductivity, facilitating faster initiation of the subsequent cycle. At the same time, maintaining only a small fraction of the previous medium limited the accumulation of metabolic products and potential inhibitors present in the wastewater [60,61].
Experiments were conducted over ten consecutive operational cycles. Electrical parameters were monitored continuously throughout MFC operation. COD concentrations of the diluted waste buttermilk were measured before each substrate replacement and after completion of each cycle. No intermediate sampling was performed during individual cycles; therefore, the measured COD values represent net changes in wastewater composition over each cycle. This sampling strategy was adopted due to the reactor design, in which the anodic chamber remained closed throughout each operational cycle. Each cycle was considered complete when the cell voltage decreased to 60% of its maximum value.
The experiments were conducted in repeated operational cycles, and the presented results are representative of consistent trends observed during MFC operation.

2.4. Electrical Measurements and Calculations

The electrical performance of the MFC was evaluated according to standard methodologies described for MFC [37,38]. The electrical performance of the MFC was evaluated by continuously monitoring the cell voltage across an external resistor of 1.5 kΩ using a data acquisition system. The current (I) was calculated according to Ohm’s law [37,62]:
I = E M F C R e x t
where
I—the current [A],
EMFC—the cell voltage [V],
Rext—the external resistance [Ω].
The power output (P) generated by the MFC was calculated using the following equation [62]:
P = I · E M F C
where
P—the power [W].
To allow comparison between experiments, power density was normalized to the projected surface area of the anode (A) and calculated as [38,62]:
P d = I · E M F C A
where
Pd—the power density [W·m−2],
A—the projected surface area of the anode [m2].
Coulombic efficiency (CE) was calculated to evaluate the fraction of electrons recovered as electrical current relative to the theoretical amount of electrons available from substrate oxidation [37,38]. CE was determined for individual operational cycles of the MFC.
In the present study, each cycle was defined as the period from substrate addition to the point at which the cell voltage decreased to 60% of its maximum value. At this point the spent medium was partially replaced with fresh diluted waste buttermilk, initiating a new operational cycle.
Because approximately 10% of the previous batch was retained in the anodic chamber during medium replacement, the chemical oxygen demand (COD) at the beginning of each cycle was determined for the mixed anodic medium to ensure consistency between charge recovery and substrate removal calculations. COD was measured at the beginning and at the end of each cycle.
The CE was calculated using the following equation [37,62,63]:
C E = M · I   d t F · b · V a n · C O D
where
CE—the coulombic efficiency [%],
M—the molecular weight of oxygen [32 g·mol−1],
F—Faraday’s constant [96,485 C·mol−1],
b—the number of electrons exchanged per mole of oxygen [4],
Van—the volume of the anodic chamber [L],
ΔCOD—the change in COD concentration [g·L−1].
The internal resistance of the MFC was estimated from the slope of the linear region of the polarization curve. All electrical parameters were determined for each operational cycle, and the reported values represent average values obtained during stable MFC operation.

2.5. Equipment

Electrodeposition of the Cu–B and Ni–Co catalytic layers was performed using a laboratory DC power supply (PowerLab 305D-II, China). Electrical characteristics of the microbial fuel cell were monitored with a PGSTAT302N potentiostat (Metrohm-Autolab BV, Utrecht, The Netherlands) supported by a Fluke 8840A multimeter (Fluke Corporation, Everett, WA, USA).
The concentration of chemical oxygen demand (COD) was analyzed photometrically using a multiparameter photometer (HI 83224) and a visible-range spectrophotometer (HI-801 Iris). Analyses were carried out using commercial reagent-based test kits supplied by the manufacturer (HANNA Instruments, Woonsocket, RI, USA), following the procedures recommended in the corresponding analytical protocols.
Temperature measurements were performed with a UNI-T UT33C multimeter (UNI-Technology, Hong Kong SAR, China). Thermal conditions during the preparation of diluted waste buttermilk were maintained using a Medingen E5s-B12 thermostat (GK Sondermaschinenbau GmbH, Labortechnik Medingen, Arnsdorf, Germany). Prior to filling the anodic chamber, the waste buttermilk was homogenized using a CAT R17 mechanical stirrer (CAT M. Zipperer GmbH, Staufen, Germany).

3. Results and Discussion

3.1. By-Product (Waste Buttermilk) Preparation

Due to the high COD of the WB, the substrate was initially diluted prior to use. Excessively high COD levels may exceed the metabolic capacity of electroactive microorganisms, leading to the accumulation of intermediate metabolites and a rapid decrease in pH in the anodic chamber. Such conditions inhibit electroactive bacteria and may promote fermentative pathways, resulting in the dominance of non-electrogenic microorganisms and reduced electrical performance of the MFC. In addition, high concentrations of dissolved compounds (e.g., sugars, salts, and proteins) can induce osmotic stress, potentially causing cellular dehydration, decreased metabolic activity, reduced electron production, and in extreme cases, partial loss of the inoculum. Elevated organic loading may also increase ionic strength and the concentration of reaction products, contributing to higher internal resistance and voltage instability. Under such conditions, a rapid increase in voltage may be observed at the beginning of operation, followed by a sharp decline due to preferential fermentative substrate consumption rather than anodic oxidation [38,62,64,65]. Therefore, considering the high COD of the raw waste buttermilk, dilution was applied prior to MFC operation [66,67,68,69]. For electrode activation and start-up, the substrate was diluted to a COD of 1000 mg·dm−3, thereby promoting the formation of a stable biofilm on the anode surface. Upon establishment of a stable electroactive biofilm, the MFC was subsequently operated with buttermilk adjusted to a COD of 5000 mg·dm−3.

3.2. MFC Start-Up

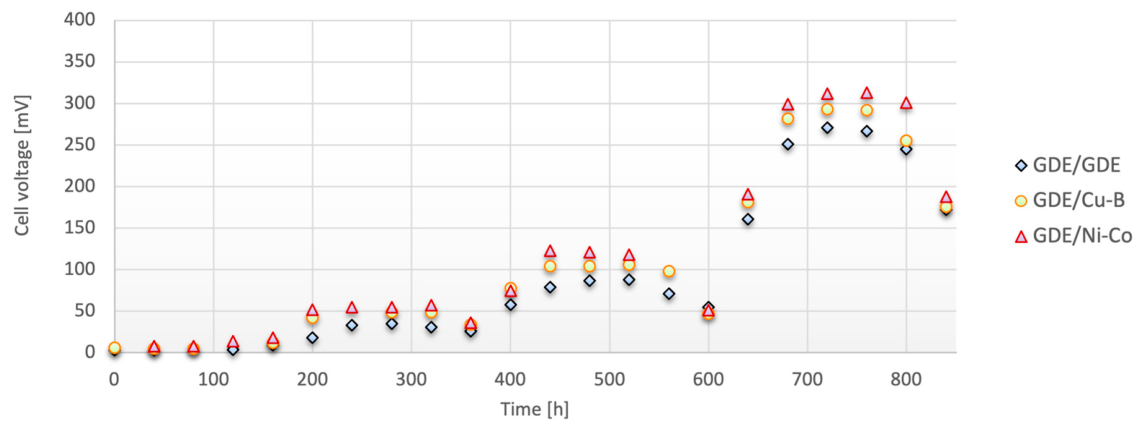
As a first step, the start-up process of the MFC was analyzed. The start-up procedure was carried out for three electrode configurations in the MFC: GDE/GDE, GDE/Cu–B, and GDE/Ni–Co. Cell voltage was monitored during MFC operation with periodic feeding of diluted waste buttermilk (adjusted to a COD level of 1000 mg·dm−3) to the anodic chamber. The start-up procedure was repeated several times until stable voltage values were obtained. This period corresponds to the formation of a stable anodic biofilm enabling reliable MFC operation. Before each start-up cycle, the diluted waste buttermilk was replaced in the anodic chamber, while approximately 10% of the previously used substrate was retained. Figure 2 presents the cell voltage profiles recorded during successive start-up cycles for the MFC operating with three electrode configurations (GDE/GDE, GDE/Cu–B, and GDE/Ni–Co).
According to the obtained results (Figure 2), all analyzed electrode configurations (GDE/GDE, GDE/Cu–B, and GDE/Ni–Co) successfully initiated MFC operation, as indicated by measurable cell voltage. During the first start-up cycle, the cell voltage remained negligible for approximately 150 h for all electrode systems. After this period, the voltage gradually increased, reaching values in the range of 31–57 mV depending on the electrode configuration applied. During the second start-up cycle, the MFC voltage further increased to 87–123 mV. In the third start-up cycle, the cell voltage reached values between 251 and 313 mV. Subsequent start-up cycles did not lead to further increases in the generated voltage, indicating that stable operating conditions had been achieved. It is noteworthy that the highest voltage values were recorded for the GDE/Ni–Co electrode configuration in all cases. After completion of the start-up phase and stabilization of the cell voltage, the GDE/Ni–Co system produced voltages approximately 24% higher than those obtained for the GDE/GDE configuration and about 8% higher than for the GDE/Cu–B system. An increase in generated voltage was observed during successive start-up cycles for all investigated electrode configurations (GDE/GDE, GDE/Cu–B, and GDE/Ni–Co). This behavior suggests the progressive development of a stable electroactive biofilm on the anode surface, demonstrating that waste buttermilk can effectively support microbial community growth regardless of the electrode configuration applied.
The formation of an electroactive biofilm was inferred from the repeatable electrochemical behavior observed during successive cycles. In future extended studies, direct morphological characterization of the anode surface (e.g., by SEM imaging) is planned to confirm biofilm development.

3.3. Electrical Performance

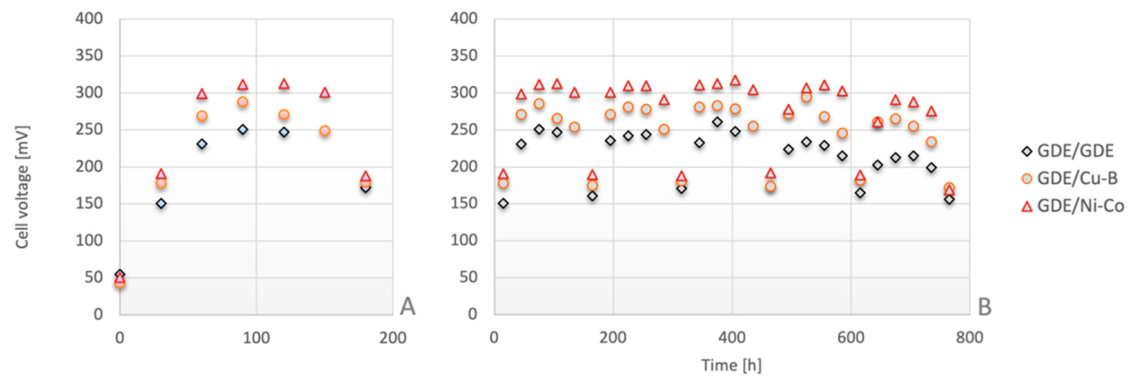
The electrical performance of the MFC was evaluated by analyzing the cell voltage for three electrode configurations (GDE/GDE, GDE/Cu–B, and GDE/Ni–Co) during a single operational cycle and across five consecutive feeding cycles with diluted waste buttermilk. Figure 3A presents the characteristic cell voltage profile of the MFC during a single feeding cycle, while Figure 3B shows the voltage recorded over five consecutive feeding cycles.
During operation, the waste buttermilk was replaced whenever the cell voltage decreased to approximately 60% of its maximum value. As shown in Figure 3A, following substrate addition to the anodic chamber, the cell voltage increased and reached a maximum value of approximately 313 mV. The observed voltage increase reflects the metabolic activity of electroactive microorganisms, and the oxidation of organic compounds present in the waste buttermilk. The obtained voltage profiles are presented in Figure 3.
The presented results (Figure 3) are representative of repeated operational cycles and show consistent trends in cell voltage profiles. Under the applied cyclic feeding strategy, periodic fluctuations in cell voltage were observed (Figure 3B). These fluctuations were directly associated with the sequential addition of fresh substrate and the gradual depletion of available organic matter during each operational cycle. Under laboratory conditions, such variations are acceptable and do not significantly affect system evaluation. However, for practical applications, continuous or recirculating feeding strategies would be required to ensure stable system operation and minimize voltage variability.
It should be noted that over the four operational cycles, the average cell voltage remained in the range of approximately 300–310 mV. In the fifth cycle, however, the maximum voltage decreased to approximately 291 mV. The gradual decrease in voltage observed over consecutive cycles is typical for batch-operated MFC systems and is generally associated with substrate depletion and shifts in microbial metabolic pathways when complex substrates are used [61,62,64,70,71].
However, the additional decline in voltage observed in later cycles suggests that factors other than substrate depletion may also influence system performance. In particular, components of the waste buttermilk, such as lipids and proteins, are likely to contribute to fouling of the proton exchange membrane (PEM) and partial blockage of the electrode surface.
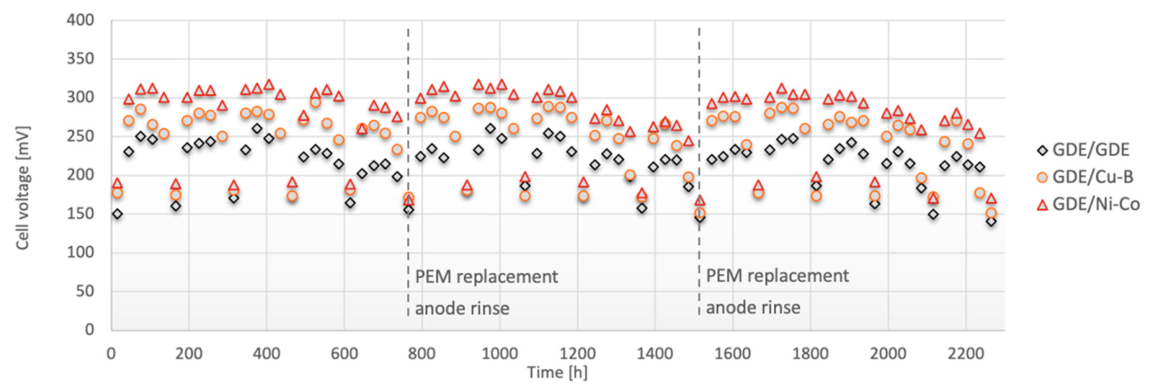
To verify this effect, the PEM was replaced, and the anode surface was gently rinsed after the fifth feeding cycle, taking care not to disturb the established biofilm. The voltage profiles obtained under these conditions are presented in Figure 4. After PEM replacement and electrode rinsing, the maximum cell voltage increased again to approximately 318 mV. However, during the subsequent fifth feeding cycle, the maximum voltage again decreased to around 270 mV. A similar trend was observed after the next regeneration step, where the voltage temporarily increased to above 310 mV, followed by a decline in subsequent cycles.
Such recurring behavior suggests that the observed voltage decrease was likely associated with gradual fouling of the PEM and partial blockage of the electrode surface by organic compounds present in the waste buttermilk. The accumulation of lipids, proteins, and suspended matter may lead to the formation of a diffusion barrier that limits proton transport through the membrane and increases internal resistance. This effect is also reflected in the polarization behavior (Figure 5), where increased internal resistance contributes to reduced power output at higher current densities. Figure 4 presents the cell voltage profiles obtained during cyclic feeding with periodic PEM replacement and gentle electrode rinsing (after each fifth cycle).
In addition, adsorption of organic compounds on the electrode surface may partially block electroactive sites and hinder extracellular electron transfer (EET). Similar effects have been reported in MFC systems treating complex organic wastewaters, where membrane fouling and electrode contamination contribute to progressive performance deterioration [38,62,72,73]. Therefore, periodic PEM replacement and electrode rinsing can temporarily improve system performance by removing accumulated deposits and restoring mass transfer conditions. Although such an approach is acceptable under laboratory conditions, practical applications would require continuous operation and effective strategies to mitigate fouling, such as optimized hydrodynamics, pre-treatment of the substrate, or automated membrane cleaning procedures.
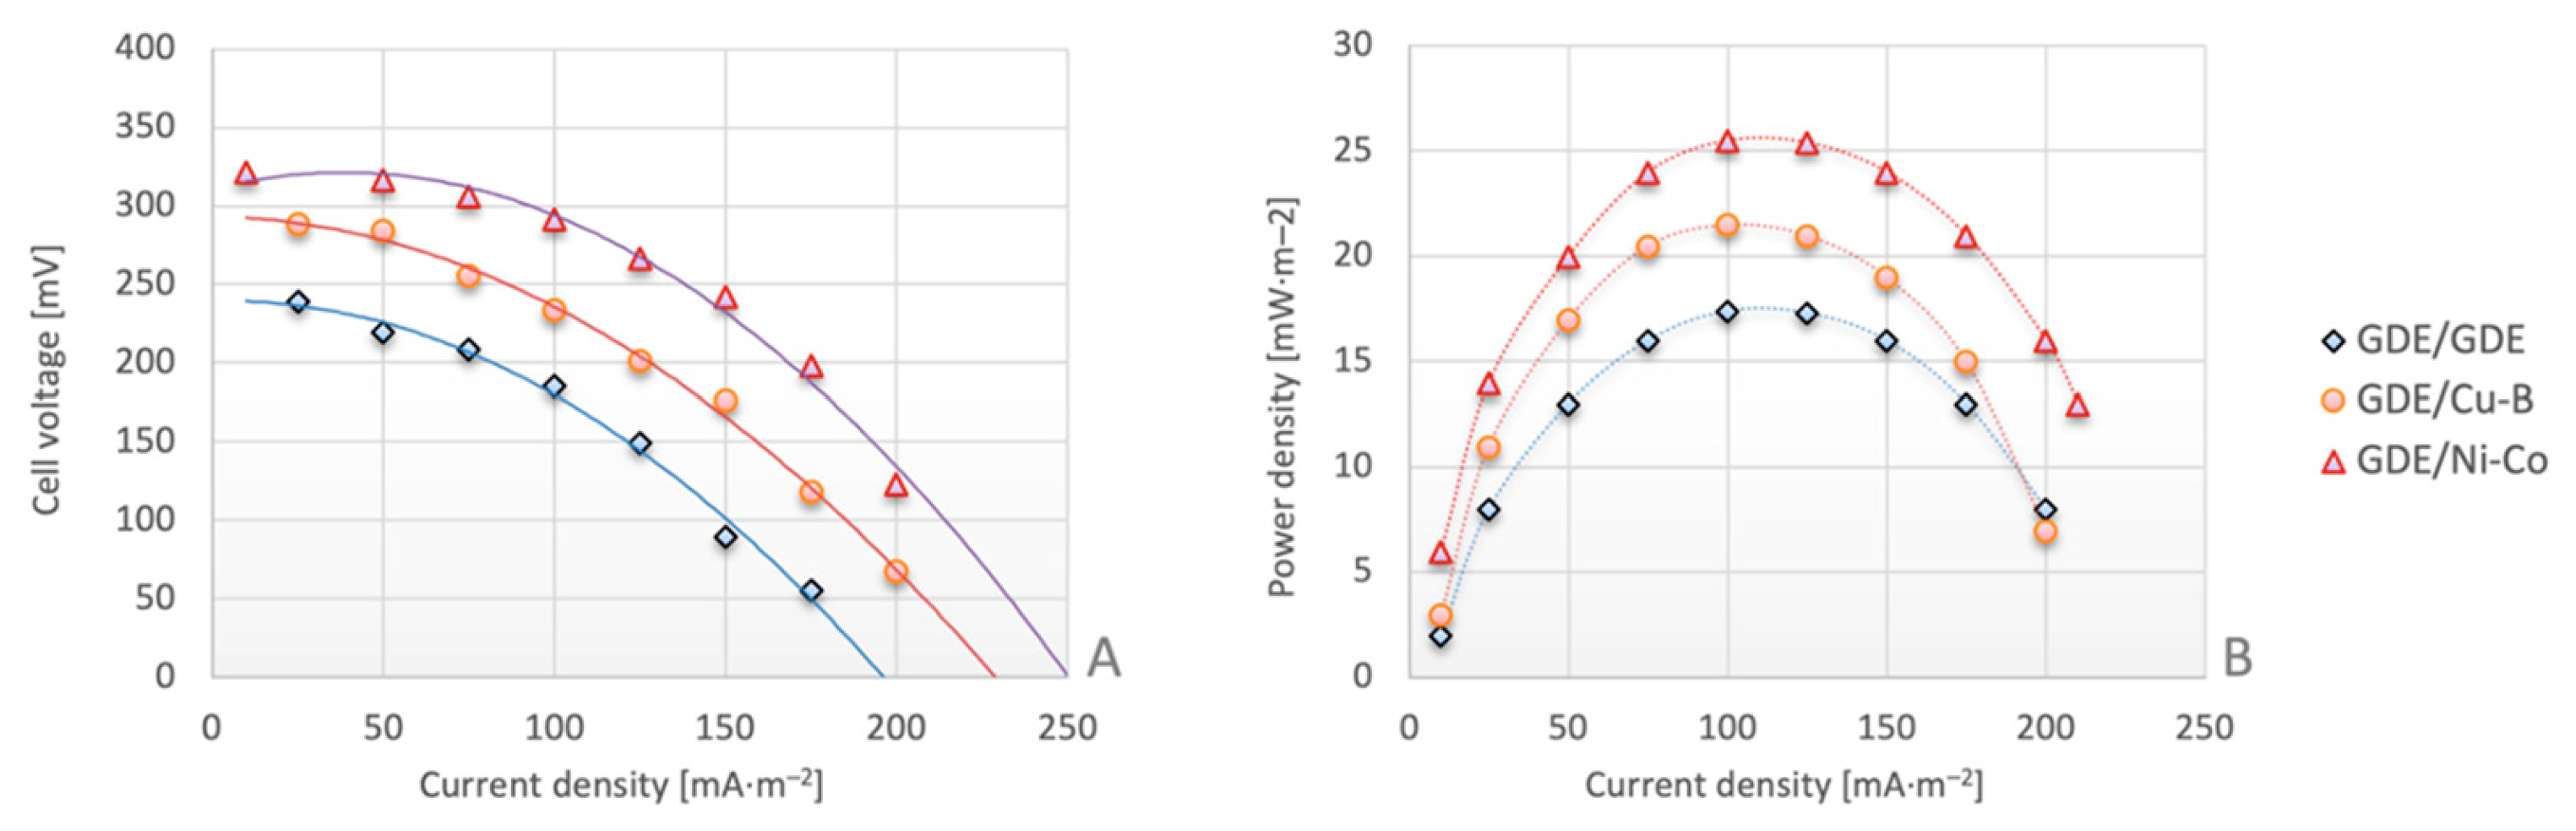
The electrical performance of the MFC was further evaluated by determining the current density and power density (Figure 5).
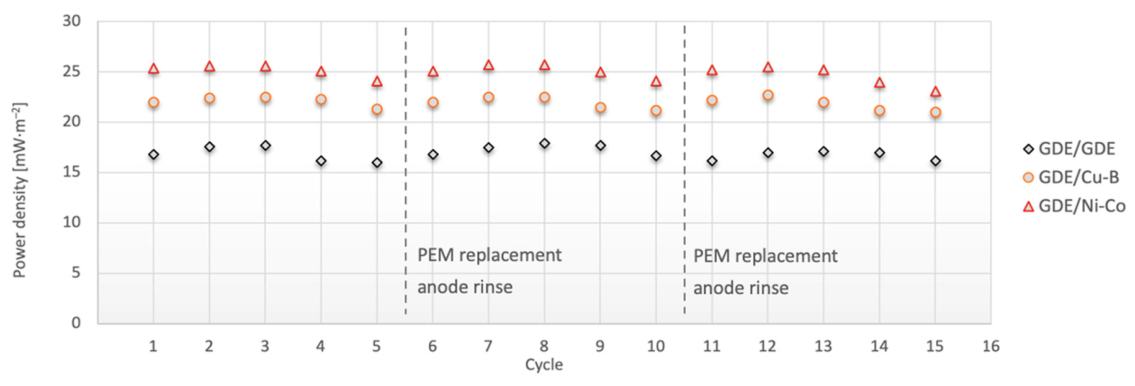
The highest power density (25 mW·m−2) was obtained for the GDE/Ni–Co electrode configuration, while the lowest value (17 mW·m−2) was recorded for the GDE/GDE system. An intermediate value of 22 mW·m−2 was achieved for the GDE/Cu–B configuration. These values are averaged from all measurements (from all MFC operation cycles). Notably, the GDE/Ni–Co system consistently maintained the highest power density over the entire range of current densities, whereas the GDE/GDE configuration exhibited the lowest values throughout the measurements.
Figure 6 presents the power density profiles obtained during cyclic feeding with periodic PEM replacement and gentle electrode rinsing (after each fifth cycle).
Similarly to the cell voltage profiles of the MFC (Figure 4) during feeding cycles with diluted waste buttermilk, the power density profiles of the MFC were analyzed. As with the cell voltage profiles, stable MFC operation can be observed, with a small decrease in power density in the fourth cycle and a significant decrease in the fifth cycle (Figure 6). After replacing the membrane and rinsing the electrode, the power density increased again.
The improved performance of the GDE/Ni–Co system can be attributed to the enhanced catalytic activity of Ni–Co alloys toward the oxygen reduction reaction (ORR), which improves electron transfer kinetics and reduces activation losses. The presence of nickel and cobalt enhances catalytic activity and improves the kinetics of the oxygen reduction reaction, thereby reducing activation losses and increasing power output. Furthermore, bimetallic Ni–Co catalysts are often characterized by improved electrical conductivity and structural stability compared to single-metal systems, which may additionally contribute to enhanced MFC performance. The Ni–Co catalyst exhibits superior catalytic activity toward the ORR despite the higher electrical conductivity of copper (Cu-B catalyst). This enhanced activity arises from the intrinsically high electrocatalytic activity of transition metals such as nickel and cobalt and their ability to provide abundant active sites and accelerate electron transfer kinetics [74,75,76]. Similar improvements in cathodic performance using non-precious metal catalysts, particularly Ni- and Co-based materials, have been reported in previous studies [38,73,77]. These materials are widely investigated as cost-effective alternatives to noble metal catalysts such as platinum, which, although highly active, significantly increase the overall cost of MFC systems.
It should be noted that these results were obtained under laboratory-scale batch conditions, and further studies are required to evaluate performance under continuous operation.

3.4. Changes in COD Concentrations and Coulombic Efficiency

Subsequently, changes in the chemical oxygen demand (COD) of diluted waste buttermilk (WB) during MFC operation were analyzed. Due to the closed design of the anodic chamber, COD concentrations were measured prior to substrate addition and after the completion of each operational cycle.
The CE values were calculated according to the equation presented in Section 2.4. Coulombic efficiency (CE) was determined for each cycle to evaluate the fraction of electrons recovered as electrical current relative to the theoretical amount available from substrate oxidation. In the present study, each operational cycle was defined as the period from substrate addition to the point at which the cell voltage decreased to 60% of its maximum value.
The CE values were calculated based on the total charge recovered during each cycle and the corresponding COD removal. The total charge (Q) was determined by integrating the current over time (Q = ∫I dt), where the current was calculated from the measured cell voltage using Ohm’s law. The COD removal (ΔCOD) was calculated as the difference between the initial and final COD concentrations within the same cycle.
Because approximately 10% of the previous batch was retained in the anodic chamber during medium replacement, the initial COD concentration for each cycle was determined for the mixed anodic medium. This approach ensured consistency between the calculated charge recovery and the corresponding substrate removal.
It should be noted that the operational cycle was defined based on voltage decline rather than complete substrate depletion. Therefore, the calculated CE values represent apparent coulombic efficiency under the applied operating conditions.
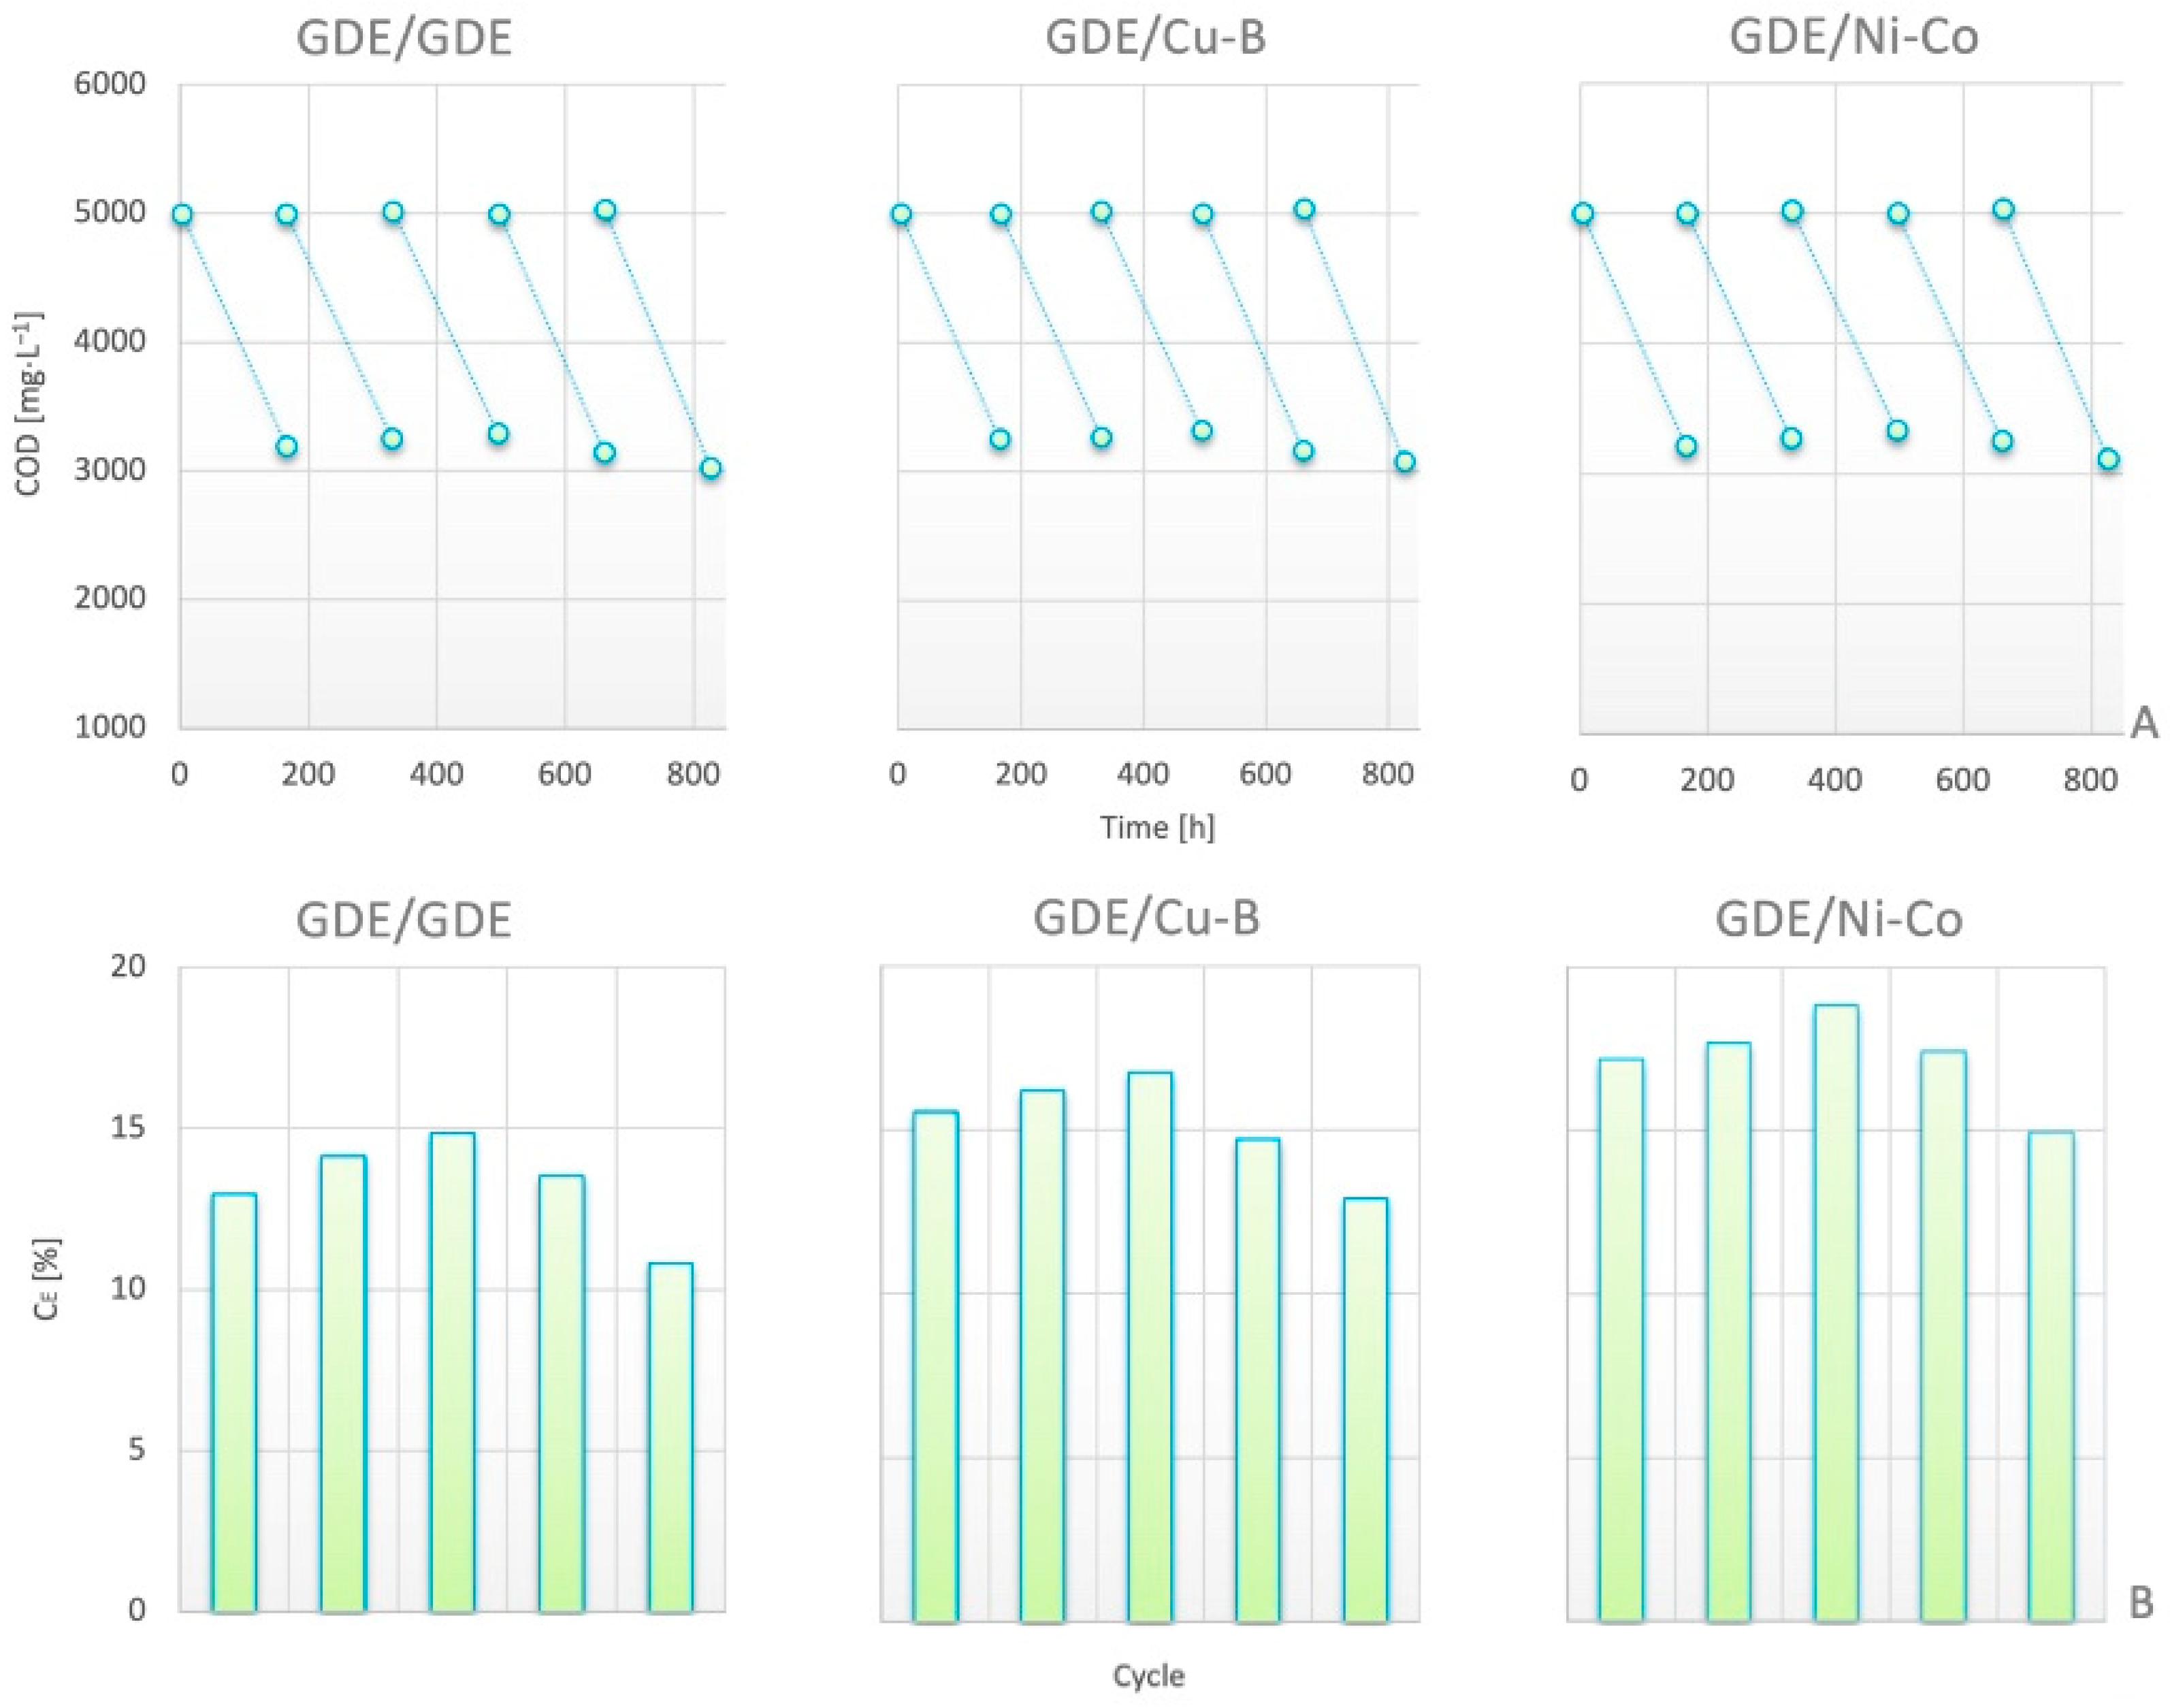
The obtained results indicate that COD removal occurred in all tested electrode configurations, confirming that waste buttermilk can serve as a substrate for microbial metabolism in MFC systems. COD removal was observed in all tested electrode configurations, with removal efficiencies corresponding to the measured ΔCOD values in each cycle (Figure 7). The extent of COD removal varied between cycles and electrode configurations, reflecting differences in system performance and electron recovery efficiency. Figure 7A presents the COD reduction during five consecutive operational cycles, while the corresponding coulombic efficiency values are shown in Figure 7B.
As shown in Figure 7B, the CE values consistently follow the same trend as the electrical performance, with the highest values observed for the GDE/Ni–Co system. The calculated CE values showed a clear dependence on electrode configuration. For the GDE/GDE system, CE ranged from 10.83% to 14.85%, with an average value of 13.26%. The GDE/Cu–B configuration yielded slightly higher values, ranging from 12.90% to 16.77%, with an average value of 15.22%. The highest CE values were obtained for the GDE/Ni–Co system, for which CE ranged from 14.95% to 18.82%, with an average value of 17.21%. This indicates that not all the substrate removed (COD) was converted into electrical current, confirming the presence of competing biochemical pathways. It should also be noted that the duration of each operational cycle influences the total charge recovery and, consequently, the calculated CE values.
These results indicate that the application of non-precious metal cathodes improved electron recovery as electrical current, with the Ni–Co catalyst showing the most favorable performance among the tested systems. The higher CE values observed for the GDE/Ni–Co configuration may be associated with enhanced cathodic reaction kinetics, which can reduce energy losses and improve overall system efficiency.
It should be emphasized that only a fraction of the electrons theoretically available from COD removal was recovered as electrical current. This behavior is consistent with microbial fuel cells treating complex substrates, where part of the organic matter is utilized for biomass growth, fermentation processes, or alternative metabolic pathways that do not contribute directly to current generation. Similar COD removal may result from comparable overall substrate degradation, while differences in electron recovery (CE) reflect variations in electrochemical performance. Furthermore, the variability of CE values between cycles reflects the influence of operational conditions, substrate composition, and microbial activity on electron recovery efficiency. The relatively low CE values are typical for complex substrates such as dairy wastewater, where part of the organic matter is consumed in competing metabolic pathways that do not contribute to current generation [38,62,73,78,79].

3.5. Summary of Results

The results obtained in this study demonstrate that waste buttermilk can serve as a substrate for bioelectricity generation in microbial fuel cells. All tested electrode configurations (GDE/GDE, GDE/Cu–B, and GDE/Ni–Co) enabled successful start-up and stable operation of the MFC, confirming the suitability of this dairy by-product for supporting the development of electroactive biofilms. The electrical performance of the system was strongly influenced by the electrode configuration. The highest cell voltages and power densities were consistently achieved for the GDE/Ni–Co system, followed by GDE/Cu–B and GDE/GDE. The maximum power density reached 25 mW·m−2 for the GDE/Ni–Co configuration, indicating improved cathodic performance due to enhanced oxygen reduction reaction (ORR) kinetics provided by the Ni–Co catalyst. The analysis of operational cycles revealed that the MFC operated in a stable yet dynamic manner under batch conditions, with periodic voltage increases following substrate addition and gradual decreases associated with substrate depletion. The observed voltage decline over consecutive cycles may be attributed to membrane fouling and partial blockage of electrode surfaces by organic components present in waste buttermilk, such as lipids and proteins. Periodic PEM replacement and electrode rinsing were shown to restore system performance, although such interventions would require further optimization for practical applications. Coulombic efficiency values ranged from 10.83% to 18.82%, depending on the electrode configuration, with average values of 13.26%, 15.22%, and 17.21% for GDE/GDE, GDE/Cu–B, and GDE/Ni–Co systems, respectively. This indicates that only a fraction of electrons associated with COD removal was recovered as electrical current, which is consistent with the behavior of MFCs treating complex substrates.
The obtained performance parameters, including power density and coulombic efficiency, are consistent with values reported for MFC systems treating complex organic substrates, where substrate heterogeneity and competing metabolic pathways limit electron recovery [38,62,73]. Similar trends have also been observed for dairy wastewater and whey-based substrates, which are characterized by high organic load and the presence of proteins and lipids that may affect system performance and stability. In such systems, moderate power densities and coulombic efficiencies are typically reported, remaining within the same order of magnitude as the values obtained in this study [78,79]. These trends are consistent with the electrical performance results, confirming the superior behavior of the GDE/Ni–Co configuration. Furthermore, the improved performance observed for the Ni–Co cathode is in agreement with previous studies demonstrating that non-precious metal catalysts can enhance ORR kinetics and improve overall MFC performance [73,77].
Overall, the application of non-precious metal cathodes significantly improved MFC performance, with the Ni–Co catalyst providing the most favorable conditions for electron recovery and power generation. The findings highlight the potential of integrating waste buttermilk valorization with energy recovery in microbial fuel cell systems, while also identifying key operational challenges related to membrane fouling and long-term system stability. It should be noted that the results were obtained under laboratory-scale batch conditions, and further studies are required to evaluate system performance under continuous operation and at larger scales.
To place the results of the present study in context, they were compared with data reported for other waste streams from the dairy industry. Unfortunately, references to waste buttermilk are difficult to find in the available literature. Therefore, the literature data for closely related substrates, such as whey and dairy wastewater, were included for comparison (Table 2).
Although the power density obtained in this study is lower than that reported in some literature for dairy wastewater and whey-based systems, direct comparison is limited due to the scarcity of studies on waste buttermilk in MFC applications. This highlights the novelty of the present work and indicates the need for further research to fully assess the performance of this substrate.

4. Conclusions

This study demonstrated that waste buttermilk can be used as a substrate for bioelectricity generation in microbial fuel cells. The obtained results indicate that dairy by-products can support the development of electroactive biofilms and enable MFC operation, with cell voltages reaching up to approximately 313 mV under the applied conditions.
The performance of the system was influenced by the electrode configuration, with the Ni–Co catalyst showing the most favorable behavior among the tested systems. The maximum power density reached 25 mW·m−2 for the GDE/Ni–Co configuration, compared to 22 mW·m−2 and 17 mW·m−2 for the GDE/Cu–B and GDE/GDE systems, respectively. This suggests that non-precious metal cathodes may represent a viable alternative to more expensive noble metal catalysts in MFC applications. The calculated coulombic efficiency values ranged from 10.83% to 18.82%, with average values of 13.26%, 15.22%, and 17.21% for GDE/GDE, GDE/Cu–B, and GDE/Ni–Co systems, respectively, indicating that only a fraction of the removed organic matter was converted into electrical current, which is typical for complex substrates.
In addition, the results highlight the importance of operational factors such as membrane fouling and electrode surface blockage, which were found to affect system stability during repeated cycles. Although periodic PEM replacement and electrode rinsing improved performance, these approaches may not be directly applicable in practical systems. Therefore, further research is required to develop strategies for mitigating fouling and enabling stable long-term operation, particularly under continuous-flow conditions.
Overall, the findings suggest that microbial fuel cells represent a promising approach for the simultaneous treatment of waste buttermilk and energy recovery. This highlights the potential of valorizing dairy by-products within bioelectrochemical systems for combined waste treatment and energy recovery. However, additional optimization is necessary before practical implementation can be considered. It should be noted that the results were obtained under laboratory-scale batch conditions, and further studies are required to evaluate system performance under continuous operation and larger-scale conditions.

Author Contributions

Conceptualization, P.P.W.; methodology, P.P.W. and B.W.; formal analysis, P.P.W. and B.W.; investigation, P.P.W. and B.W.; resources, M.M. and S.F.; data curation, P.P.W., B.W., M.M. and S.F.; writing—original draft preparation, P.P.W. and B.W.; writing—review and editing, P.P.W., B.W., M.M. and S.F.; visualization, P.P.W.; supervision, P.P.W.; funding acquisition, M.M. and S.F. All authors have read and agreed to the published version of the manuscript.

Funding

The paper has been prepared as part of the project: Network of Universities of Life Sciences—Development of Innovative Dairy Farming (SUP-RIM) financed from the funds of the Ministry of Higher Education and Science of the Republic of Poland, based on the agreement No. MEiN/2023/DPI/2872.

Data Availability Statement

The data presented in this study are available within the article.

Acknowledgments

This work was carried out at MCBR UO (International Research and Development Center of the University of Opole), which was established as part of a project co-financed by the European Union under the European Regional Development Fund, RPO WO 2014–2020, Action 1.2 Infrastructure for R&D. Agreement No. RPOP.01.02.00-16-0001/17-00 dated 31 January 2018.

Conflicts of Interest

The authors declare no conflicts of interest.

Abbreviations

The following abbreviations are used in this manuscript:
Aprojected surface area of the anode [m2]
bnumber of electrons exchanged per mole of oxygen [4]
CODchemical oxygen demand [g·L−1]
CECoulombic efficiency [%]
EETextracellular electron transfer
EMFCcell voltage [V]
FFaraday’s constant [96,485 C·mol−1]
GDEgas diffusion electrode
Icurrent [A]
Mmolecular weight of oxygen [32 g·mol−1]
MFCmicrobial fuel cell
ORRoxygen reduction reaction
Ppower [W]
PEMproton exchange membrane
Pdpower density [W·m−2]
Rextexternal resistance [Ω]
Vanvolume of the anodic chamber [L]
WBwaste buttermilk

References

  1. Kumar, R.V.; Goswami, L.; Pakshirajan, K.; Pugazhenthi, G. Dairy wastewater treatment using a novel low-cost tubular ceramic membrane and membrane fouling mechanism using pore blocking models. J. Water Process Eng. 2016, 13, 168–175. [Google Scholar] [CrossRef]
  2. Statistics Poland. Statistical Yearbook of Agriculture 2023. Available online: https://stat.gov.pl (accessed on 6 April 2026).
  3. Eurostat. Raw Milk Production. Available online: https://ec.europa.eu/eurostat/databrowser/view/apro_mk_pobta/default/table (accessed on 6 April 2026).
  4. Barukčić, I.; Lisak Jakopović, K.; Božanić, R. Whey and buttermilk—Neglected sources of valuable beverages. Nat. Beverages 2019, 13, 209–242. [Google Scholar] [CrossRef]
  5. Camargo-Herrera, Á.D.; Bernal-Castro, C.; Gutiérrez-Cortes, C.; Castro, C.N.; Díaz-Moreno, C. Bio-yogurt with the inclusion of phytochemicals from carrots (Daucus carota): A strategy in the design of functional dairy beverage with probiotics. J. Food Sci. Technol. 2023, 60, 2297–2308. [Google Scholar] [CrossRef]
  6. Gurtu, A.; Salunke, P.; Debnath, T.K. Bird’s eye view of the global dairy industry: Overview of milk-producing countries, dairy processes, and cost comparison. Int. J. Agric. Resour. Gov. Ecol. 2023, 19, 22–40. [Google Scholar] [CrossRef]
  7. Yadav, J.S.S.; Yan, S.; Pilli, S.; Kumar, L.; Tyagi, R.D.; Surampalli, L.Y. Cheese whey: A potential resource to transform into bioprotein, functional/nutritional proteins and bioactive peptides. Biotechnol. Adv. 2015, 33, 756–774. [Google Scholar] [CrossRef] [PubMed]
  8. Baldini, C.; Bava, L.; Zucali, M.; Guarino, M. Milk production life cycle assessment: A comparison between estimated and measured emission inventory for manure handling. Sci. Total Environ. 2018, 625, 209–219. [Google Scholar] [CrossRef] [PubMed]
  9. Gralak, A.; Grochowska, R.; Szczepaniak, I. Determinants of Implementation of the Circular Economy in the Food Processing Sector on the Example of the Dairy Industry. Probl. Agric. Econ. 2022, 372, 64–84. [Google Scholar] [CrossRef]
  10. Grochowska, R.; Szczepaniak, I. Sustainability business models in milk processing. Considerations based on the polish experience. J. Agribus. Rural Dev. 2019, 52, 111–122. [Google Scholar] [CrossRef]
  11. Ritota, M.; Costanzo, M.G.; Mattera, M.; Manzi, P. New trends for the evaluation of heat treatments of milk. J. Anal. Methods Chem. 2017, 2017, 1864832. [Google Scholar] [CrossRef]
  12. Thomassen, M.A.; Dalgaard, R.; Heijungs, R.; De Boer, I. Attributional and consequential LCA of milk production. Int. J. Life Cycle Assess. 2008, 13, 339–349. [Google Scholar] [CrossRef]
  13. Yan, M.-J.; Humphreys, J.; Holden, N.M. An evaluation of life cycle assessment of European milk production. J. Environ. Manag. 2011, 92, 372–379. [Google Scholar] [CrossRef]
  14. Batista, M.A.; Campos, N.C.A.; Silvestre, M.P.C. Whey and Protein Derivatives: Applications in Food Products Development, Technological Properties and Functional Effects on Child Health. Cogent Food Agric. 2018, 4, 1509687. [Google Scholar] [CrossRef]
  15. Clare, D.A.; Swaisgood, H.E. Bioactive Milk Peptides: A Prospectus. J. Dairy Sci. 2000, 83, 1187–1195. [Google Scholar] [CrossRef]
  16. Costa, C.; Azoia, N.G.; Coelho, L.; Freixo, R.; Batista, P.; Pintado, M. Proteins Derived from the Dairy Losses and By-Products as Raw Materials for Non-Food Applications. Foods 2021, 10, 135. [Google Scholar] [CrossRef] [PubMed]
  17. Papademas, P.; Kotsaki, P. Technological utilization of whey towards sustainable exploitation. Adv. Dairy Res. 2019, 7, 231. Available online: https://www.researchgate.net/profile/Paschalia-Kotsaki/publication/345669958_Technological_Utilization_of_Whey_towards_Sustainable_Exploitation/links/5faa61f6a6fdcc0624251f26/Technological-Utilization-of-Whey-towards-Sustainable-Exploitation.pdf?_tp=eyJjb250ZXh0Ijp7ImZpcnN0UGFnZSI6InB1YmxpY2F0aW9uIiwicGFnZSI6InB1YmxpY2F0aW9uIn19 (accessed on 6 January 2020).
  18. Kelly, A.L.; Huppertz, T.; Sheehan, J.J. Pre-treatment of cheese milk: Principles and developments. Dairy Sci. Technol. 2008, 88, 549–572. [Google Scholar] [CrossRef]
  19. Mirzakulova, A.; Sarsembaeva, T.; Suleimenova, Z.; Kowalski, Ł.; Gajdzik, B.; Wolniak, R.; Bembenek, M. Whey: Composition, Processing, Application, and Prospects in Functional and Nutritional Beverages—A Review. Foods 2025, 14, 3245. [Google Scholar] [CrossRef]
  20. Ha, E.; Zemel, M.B. Functional properties of whey, whey components, and essential amino acids: Mechanisms underlying health benefits for active people. J. Nutr. Biochem. 2003, 14, 251–258. [Google Scholar] [CrossRef]
  21. Macwan, S.R.; Dabhi, B.K.; Parmar, S.C.; Aparnathi, K.D. Whey and its utilization. Int. J. Curr. Microbiol. Appl. Sci. 2016, 5, 134–155. [Google Scholar] [CrossRef]
  22. Panghal, A.; Patidar, R.; Jaglan, S.; Chhikara, N.; Khatkar, S.K.; Gat, Y.; Sindhu, N. Whey valorization: Current options and future scenario–a critical review. Nutr. Food Sci. 2018, 48, 520–535. [Google Scholar] [CrossRef]
  23. Ganta, A.; Bashir, Y.; Das, S. Dairy Wastewater as a Potential Feedstock for Valuable Production with Concurrent Wastewater Treatment through Microbial Electrochemical Technologies. Energies 2022, 15, 9084. [Google Scholar] [CrossRef]
  24. Lambert, S.; Leconte, N.; Blot, M.; Rousseau, F.; Robert, B.; Camier, B.; Gassi, J.-Y.; Cauty, C.; Lopez, C.; Gésan-Guiziou, G. The Lipid Content and Microstructure of Industrial Whole Buttermilk and Butter Serum Affect the Efficiency of Skimming. Food Res. Int. 2016, 83, 121–130. [Google Scholar] [CrossRef]
  25. Vanderghem, C.; Bodson, P.; Danthine, S.; Paquot, M.; Deroanne, C.; Blecker, C. Milk Fat Globule Membrane and Buttermilks: From Composition to Valorization. Biotechnol. Agron. Soc. Environ. 2010, 14, 485–500. Available online: https://www.researchgate.net/profile/Christophe-Blecker/publication/46142230_Milk_fat_globule_membrane_and_buttermilks_From_composition_to_valorization/links/0deec51a4dd3cc5257000000/Milk-fat-globule-membrane-and-buttermilks-From-composition-to-valorization.pdf?_tp=eyJjb250ZXh0Ijp7ImZpcnN0UGFnZSI6InB1YmxpY2F0aW9uIiwicGFnZSI6InB1YmxpY2F0aW9uIn19 (accessed on 11 September 2009).
  26. Al-Jahani, A.H. Effect of Buttermilk on the Physicochemical, Rheological, and Sensory Qualities of Pan and Pita Bread. Int. J. Food Sci. 2017, 2017, 2054252. [Google Scholar] [CrossRef] [PubMed]
  27. Hassan, A.A.; El-Shazly, H.A.; Sakr, A.M.; Ragab, W.A. Influence of Substituting Water with Fermented Skim Milk, Acid Cheese Whey or Buttermilk on Dough Properties and Baking Quality of Pan Bread. World J. Dairy Food Sci. 2013, 8, 100–117. Available online: http://www.idosi.org/wjdfs/wjdfs8(1)13/13.pdf (accessed on 18 March 2026).
  28. Ilavenil, S.; Park, H.S.; Vijayakumar, M.; Valan Arasu, M.; Kim, D.H.; Ravikumar, S.; Choi, K.C. Probiotic Potential of Lactobacillus Strains with Antifungal Activity Isolated from Animal Manure. Sci. World J. 2015, 802570. [Google Scholar] [CrossRef]
  29. Mills, S.; Ross, R.P.; Hill, C.; Fitzgerald, G.F.; Stanton, C. Milk Intelligence: Mining Milk for Bioactive Substances Associated with Human Health. Int. Dairy J. 2011, 21, 377–401. [Google Scholar] [CrossRef]
  30. Harirchi, S.; Wainaina, S.; Sar, T.; Nojoumi, S.A.; Parchami, M.; Parchami, M.; Varjani, S.; Kumar Khanal, S.K.; Wong, J.; Awasthi, M.K.; et al. Microbiological insights into anaerobic digestion for biogas, hydrogen or volatile fatty acids (VFAs): A review. Bioengineered 2022, 13, 6521–6557. [Google Scholar] [CrossRef] [PubMed]
  31. Karmakar, S.; Agrahari, R.; Singh, L.K.; Rani, R. Emerging trends and advances in exoelectrogenic microbes as drivers of microbial fuel cells. Discov. Electrochem. 2026, 3, 19. [Google Scholar] [CrossRef]
  32. Demirel, B.; Yenigun, O.; Onay, T.T. Anaerobic treatment of dairy wastewaters: A review. Process Biochem. 2005, 40, 2583–2595. [Google Scholar] [CrossRef]
  33. Chatzipaschali, A.A.; Stamatis, A.G. Biotechnological Utilization with a Focus on Anaerobic Treatment of Cheese Whey: Current Status and Prospects. Energies 2012, 5, 3492–3525. [Google Scholar] [CrossRef]
  34. Zandona, E.; Blažić, M.; Jambrak, A.R. Whey utilisation: Sustainable uses and environmental approach. Food Technol. Biotechnol. 2021, 59, 147–161. [Google Scholar] [CrossRef]
  35. Feil, A.A.; do Amaral, C.C.; Walter, E.; Bagatini, C.A.; Schreiber, D.; Maehler, A.E. Set of sustainability indicators for the dairy industry. Environ. Sci. Pollut. Res. 2023, 30, 52982–52996. [Google Scholar] [CrossRef]
  36. Wójcicki, K.; Młody, M.; Sajdak, M. Opportunities and barriers in the digital transformation of dairy industry and its impact on sustainable production management. Environ. Policy Manag. 2025, 94, 1081. [Google Scholar] [CrossRef]
  37. Logan, B.E. Microbial Fuel Cells; Wiley: Hoboken, NJ, USA, 2008. [Google Scholar]
  38. Logan, B.E.; Hamelers, B.; Rozendal, R.; Schroder, U.; Keller, J.; Freguia, S.; Aelterman, P.; Verstraete, W.; Rabaey, K. Microbial fuel cells:  Methodology and technology. Environ. Sci. Technol. 2006, 40, 5181–5192. [Google Scholar] [CrossRef]
  39. Das, D. Microbial Fuel Cell: A Bioelectrochemical System That Converts Waste to Watts; Springer: Cham, Switzerland, 2017. [Google Scholar]
  40. Franks, A.E.; Nevin, K.P. Microbial fuel cells, a current review. Energies 2010, 3, 899–919. [Google Scholar] [CrossRef]
  41. Yang, S.; Du, F.; Liu, H. Characterization of mixed-culture biofilms established in microbial fuel cells. Biomass Bioenergy 2012, 46, 531–537. [Google Scholar] [CrossRef]
  42. Saratale, G.D.; Saratale, R.G.; Shahid, M.K.; Zhen, G.; Kumar, G.; Shin, H.-S.; Choi, Y.-G.; Kim, S.-H. A comprehensive overview on electro-active biofilms, role of exo-electrogens and their microbial niches in microbial fuel cells (MFCs). Chemosphere 2017, 178, 534–547. [Google Scholar] [CrossRef] [PubMed]
  43. Greenman, J.; Gajda, I.; You, J.; Mendis, B.A.; Obata, O.; Pasternak, G.; Ieropoulos, I. Microbial Fuel Cells and Their Electrified Biofilms. Biofilm 2021, 3, 100057. [Google Scholar] [CrossRef]
  44. Kim, B.-H.; Kim, H.-J.; Hyun, M.-S.; Park, D.-H. Direct electrode reaction of Fe(III)—Reducing bacterium, Shewanella putrefaciens. J. Microbiol. Biotechnol. 1999, 9, 127–131. Available online: https://api.semanticscholar.org/CorpusID:82328758 (accessed on 1 April 1999).
  45. Gorby, Y.A.; Yanina, S.; McLean, J.S.; Rosso, K.M.; Moyles, D.; Dohnalkova, A.; Beveridge, T.J.; Chang, I.S.; Kim, B.H.; Kim, K.S.; et al. Electrically conductive bacterial nanowires produced by Shewanella oneidensis strain MR-1 and other microorganisms. Proc. Natl. Acad. Sci. USA 2006, 103, 11358–11363. [Google Scholar] [CrossRef]
  46. Lovley, D.R. The microbe electric: Conversion of organic matter to electricity. Curr. Opin. Biotechnol. 2008, 19, 564–571. [Google Scholar] [CrossRef] [PubMed]
  47. Włodarczyk, P.P.; Włodarczyk, B. Study of the Use of Gas Diffusion Anode with Various Cathodes (Cu-Ag, Ni-Co, and Cu-B Alloys) in a Microbial Fuel Cell. Energies 2024, 17, 1636. [Google Scholar] [CrossRef]
  48. Włodarczyk, P.P.; Włodarczyk, B. Wastewater treatment and electricity production in a microbial fuel cell with Cu–B alloy as the cathode catalyst. Catalysts 2019, 9, 572. [Google Scholar] [CrossRef]
  49. Włodarczyk, P.P.; Włodarczyk, B. Preparation and analysis of Ni–Co catalyst use for electricity production and COD reduction in microbial fuel cells. Catalysts 2019, 9, 1042. [Google Scholar] [CrossRef]
  50. Włodarczyk, P.P.; Włodarczyk, B. Painted Electrode with Activated Coconut Carbon for Microbial Fuel Cell. Energies 2025, 18, 1350. [Google Scholar] [CrossRef]
  51. Buitrón, G.; López-Prieto, I.; Zúñiga, I.T.; Vargas, A. Reduction of start-up time in a microbial fuel cell through the variation of external resistance. Energy Procedia 2017, 142, 694–699. [Google Scholar] [CrossRef]
  52. Koók, L.; Nemestóthy, N.; Bélafi-Bakó, K.; Bakonyi, P. The influential role of external electrical load in microbial fuel cells and related improvement strategies: A review. Bioelectrochemistry 2021, 140, 107749. [Google Scholar] [CrossRef]
  53. Oh, S.E.; Logan, B.E. Hydrogen and electricity production from a food processing wastewater using fermentation and microbial fuel cell technologies. Water Res. 2005, 39, 4673–4682. [Google Scholar] [CrossRef]
  54. Liu, Y.; Chen, C.; Xue, X.; Tang, K.; Chen, X.; Lai, M.; Li, X.; Wu, Z. Power Generation and Microbial Communities in Microbial Fuel Cell Powered by Tobacco Wastewater. Water 2025, 17, 1101. [Google Scholar] [CrossRef]
  55. Negassa, L.W.; Mohiuddin, M.; Tiruye, G.A. Treatment of brewery industrial wastewater and generation of sustainable bioelectricity by microbial fuel cell inoculated with locally isolated microorganisms. J. Water Process Eng. 2021, 41, 102018. [Google Scholar] [CrossRef]
  56. Rabaey, K.; Verstraete, W. Microbial fuel cells: Novel biotechnology for energy generation. Trends Biotechnol. 2005, 23, 291–298. [Google Scholar] [CrossRef]
  57. Godain, A.; Haddour, N.; Fongarland, P.; Vogel, T.M. Bacterial Competition for the Anode Colonization under Different External Resistances in Microbial Fuel Cells. Catalysts 2022, 12, 176. [Google Scholar] [CrossRef]
  58. Pinck, S.; Ostormujof, L.M.; Teychené, S.; Erable, B. Microfluidic Microbial Bioelectrochemical Systems: An Integrated Investigation Platform for a More Fundamental Understanding of Electroactive Bacterial Biofilms. Microorganisms 2020, 8, 1841. [Google Scholar] [CrossRef]
  59. Hou, L.; Cortez, R.; Hagerman, M.; Hu, Z.; Majumder, E.L. Co-occurrence of direct and indirect extracellular electron transfer mechanisms during electroactive respiration in a dissimilatory sulfate reducing bacterium. Microbiol. Spectr. 2025, 13, e01226-24. [Google Scholar] [CrossRef]
  60. Velasquez-Orta, S.B.; Yu, E.; Katuri, K.P.; Head, I.M.; Curtis, T.P.; Scott, K. Evaluation of hydrolysis and fermentation rates in microbial fuel cells. Appl. Microbiol. Biotechnol. 2011, 90, 789–798. [Google Scholar] [CrossRef]
  61. Sonawane, J.M.; Mahadevan, R.; Pandey, A.; Greener, J. Recent progress in microbial fuel cells using substrates from diverse sources. Heliyon 2022, 8, e12353. [Google Scholar] [CrossRef] [PubMed]
  62. Liu, H.; Logan, B.E. Electricity generation using an air-cathode single chamber microbial fuel cell in the presence and absence of a proton exchange membrane. Environ. Sci. Technol. 2004, 38, 4040–4046. [Google Scholar] [CrossRef]
  63. Kim, K.-Y.; Chae, K.-J.; Choi, M.-J.; Ajayi, F.F.; Jang, A.; Kim, C.-W.; Kim, I.S. Enhanced Coulombic efficiency in glucose-fed microbial fuel cells by reducing metabolite electron losses using dual-anode electrodes. Bioresour. Technol. 2011, 102, 4144–4149. [Google Scholar] [CrossRef]
  64. Logan, B.E.; Regan, J.M. Microbial Fuel Cells—Challenges and Applications. Environ. Sci. Technol. 2006, 40, 5172–5180. [Google Scholar] [CrossRef] [PubMed]
  65. Logan, B.E. Exoelectrogenic bacteria that power microbial fuel cells. Nat. Rev. Microbiol. 2009, 7, 375–381. [Google Scholar] [CrossRef]
  66. López Velarde Santos, M.; Rodríguez Valadéz, F.J.; Mora Solís, V.; González Nava, C.; Cornejo Martell, A.J.; Hensel, O. Performance of a microbial fuel cell operated with vinasses using different cod concentrations. Rev. Int. Contam. Ambient. 2017, 33, 521–528. [Google Scholar] [CrossRef]
  67. Włodarczyk, B.; Włodarczyk, P.P. Enhancing Microbial Fuel Cell Operation with Molasses Decoction from Yeast Production. Desalination Water Treat. 2025, 322, 101192. [Google Scholar] [CrossRef]
  68. Ullah, Z.; Zeshan, Z. Effect of substrate type and concentration on the performance of a double chamber microbial fuel cell. Water Sci. Technol. 2020, 81, 1336–1344. [Google Scholar] [CrossRef]
  69. Malekmohammadi, S.; Mirbagheri, S.A. A review of the operating parameters on the microbial fuel cell for wastewater treatment and electricity generation. Water Sci. Technol. 2025, 84, 1309–1323. [Google Scholar] [CrossRef] [PubMed]
  70. Choudhury, P.; Ray, R.N.; Bandyopadhyay, T.K.; Basak, B.; Muthuraj, M.; Bhunia, B. Process engineering for stable power recovery from dairy wastewater using microbial fuel cell. Int. J. Hydrogen Energy 2021, 46, 3171–3182. [Google Scholar] [CrossRef]
  71. Włodarczyk, B.; Włodarczyk, P.P. Bioelectricity Generation from Brewery Wastewater in a Dual-Chamber Microbial Fuel Cell: A Repeated Fed-Batch Case Study. Energies 2026, 19, 1196. [Google Scholar] [CrossRef]
  72. Xu, J.; Sheng, G.-P.; Luo, H.-W.; Li, W.-W.; Wang, L.-F.; Yu, H.-Q. Fouling of proton exchange membrane (PEM) deteriorates the performance of microbial fuel cell. Water Res. 2012, 46, 1817–1824. [Google Scholar] [CrossRef]
  73. Santoro, C.; Arbizzani, C.; Erable, B.; Ieropoulos, I. Microbial fuel cells: From fundamentals to applications. A review. J. Power Sources 2017, 356, 225–244. [Google Scholar] [CrossRef]
  74. Zhang, X.; Xu, Y.; Liu, Y.; Wei, Y.; Lan, F.; Wang, J.; Liu, X.; Wang, R.; Yang, Y.; Chen, J. Improving oxygen reduction reaction by cobalt iron-layered double hydroxide layer on nickel-metal organic framework as cathode catalyst in microbial fuel cell. Bioresour. Technol. 2024, 392, 130011. [Google Scholar] [CrossRef]
  75. Khan, A.; Rostami, K.; Sedighi, M.; Khan, S.; Ghasemi, M. A Comparative Electrochemical Study of Pt and Ni–Oxide Cathodes: Performance and Economic Viability for Scale-Up Microbial Fuel Cells. Catalysts 2025, 15, 1153. [Google Scholar] [CrossRef]
  76. Mohammed, L.J.; Omer, K.M. Nickel-based single-atom for oxygen evolution/reduction reaction electrocatalysis: Design, mechanisms, and applications. Appl. Mater. Today 2025, 47, 102986. [Google Scholar] [CrossRef]
  77. Wei, J.; Liang, P.; Huang, X. Recent progress in electrodes for microbial fuel cells. Bioresour. Technol. 2011, 102, 9335–9344. [Google Scholar] [CrossRef]
  78. Charnnok, B.; Suksaroj, T.; Boonswang, P.; Chaiprapat, S. Oxidation of hydrogen sulfide in biogas using dissolved oxygen in the extreme acidic biofiltration operation. Bioresour. Technol. 2013, 131, 492–499. [Google Scholar] [CrossRef]
  79. Segundo, R.-F.; Luis, C.-C.; Otiniano, N.M.; De La Cruz-Noriega, M.; Gallozzo-Cardenas, M. Utilization of Cheese Whey for Energy Generation in Microbial Fuel Cells: Performance Evaluation and Metagenomic Analysis. Fermentation 2025, 11, 176. [Google Scholar] [CrossRef]
  80. Tremouli, A.; Antonopoulou, G.; Bebelis, S.; Lyberatos, G. Operation and characterization of a microbial fuel cell fed with pretreated cheese whey at different organic loads. Bioresour. Technol. 2013, 131, 380–389. [Google Scholar] [CrossRef]
  81. Choudhury, P.; Ray, R.N.; Bandyopadhyay, T.K.; Tiwari, O.N.; Bhunia, B. Kinetics and performance evaluation of microbial fuel cell supplied with dairy wastewater with simultaneous power generation. Int. J. Hydrogen Energy 2021, 46, 16815–16822. [Google Scholar] [CrossRef]
  82. Choudhury, P.; Ray, R.N.; Tiwari, O.N.; Bandyopadhyay, T.K.; Muthuraj, M.; Bhunia, B. Strategies for improvement of microbial fuel cell performance via stable power generation from real dairy wastewater. Fuel 2021, 288, 119653. [Google Scholar] [CrossRef]
  83. Almatouq, A.; Ahmed, M.E.; Khajah, M.; Abdullah, H.; Al-Yaseen, R.; Al-Jumaa, M.; Al-Ajeel, F.; Shishter, A. Performance of tubular microbial fuel cells using different industrial wastewater. J. Water Process Eng. 2023, 55, 104166. [Google Scholar] [CrossRef]
  84. Mardanpour, M.M.; Esfahany, M.N.; Behzad, T.; Sedaqatvand, R. Single chamber microbial fuel cell with spiral anode for dairy wastewater treatment. Biosens. Bioelectron. 2012, 38, 264–269. [Google Scholar] [CrossRef] [PubMed]
  85. Elakkiya, E.; Matheswaran, M. Comparison of anodic metabolisms in bioelectricity production during treatment of dairy wastewater in Microbial Fuel Cell. Bioresour. Technol. 2013, 136, 407–412. [Google Scholar] [CrossRef] [PubMed]
  86. Hasany, M.; Yaghmaei, S.; Mardanpour, M.M.; Naraghi, Z.G. Simultaneously energy production and dairy wastewater treatment using bioelectrochemical cells: In different environmental and hydrodynamic modes. Chin. J. Chem. Eng. 2017, 25, 1847–1855. [Google Scholar] [CrossRef]
Figure 1. (A) Construction of the MFC used in this study; (B) measurement configuration of the MFC system.
Energies 19 02272 g001
Figure 2. Cell voltage recorded during the start-up phase of the MFC fed with diluted waste buttermilk for three electrode configurations: GDE/GDE, GDE/Cu–B, and GDE/Ni–Co.
Energies 19 02272 g002
Figure 3. Cell voltage of the MFC with electrode configurations GDE/GDE, GDE/Cu–B, and GDE/Ni–Co during a single feeding cycle (A) and five consecutive feeding cycles (B) with diluted waste buttermilk. During the feeding cycles (B), the substrate (waste buttermilk) was replaced when the cell voltage decreased to approximately 60% of its maximum value.
Energies 19 02272 g003
Figure 4. Cell voltage profiles of the MFC during feeding cycles with diluted waste buttermilk. The PEM was replaced, and the anode was gently rinsed after every fifth feeding cycle. Results are shown for three electrode configurations: GDE/GDE, GDE/Cu–B, and GDE/Ni–Co.
Energies 19 02272 g004
Figure 5. Polarization curves (A) and power density curves (B) of the MFC fed with waste buttermilk for the electrode configurations: GDE/GDE, GDE/Cu–B, and GDE/Ni–Co.
Energies 19 02272 g005
Figure 6. Power density profiles of the MFC during feeding cycles with diluted waste buttermilk. The PEM was replaced, and the anode was gently rinsed after every fifth feeding cycle. Data are shown for average power density in each cycle, and for three electrode configurations: GDE/GDE, GDE/Cu–B, and GDE/Ni–Co.
Energies 19 02272 g006
Figure 7. (A) COD reduction during five consecutive operational cycles of the MFC fed with diluted waste buttermilk. (B) Coulombic efficiency values calculated for the corresponding cycles. Results obtained for electrode configurations GDE/GDE, GDE/Cu–B, and GDE/Ni–Co.
Energies 19 02272 g007
Table 1. Initial characteristics of waste buttermilk used in this study *.
ParameterValue
COD [mg⋅L−1]95,000 ± 12,000
EC [mS⋅cm−1]1.05 ± 0.01
pH6.00 ± 0.05
Bulk density [kg/m3]1032.3 ± 2.9
Dry mass [%]8.8 ± 0.3
Moisture content [%]91.2 ± 0.3
Ash content [% d.m.]7.8 ± 1.1
Fats [%]1.60 ± 0.20
Proteins [%]3.05 ± 0.25
Lactose [%]4.65 ± 0.30
*—based on the data from owned measurements and from the dairy plant.
Table 2. Performance of MFC using waste products from diary industry as substrate.
SubstrateElectrode ConfigurationReactor TypeVoltage
[mV]
Power Density
[mW·m−2]
[mW·m−3] *
CE
(%)
Reference
waste buttermilkGDE/Ni–Codual-chamber3132517.2This study
waste buttermilkGDE/Cu–Bdual-chamber2802215.2This study
waste buttermilkGDE/GDEdual-chamber2501713.3This study
cheese wheycarbon paper/
carbon cloth
dual-chambern/a465.9–11.3[80]
real dairy wastewatern/asingle-chamber6583546.6[81]
real dairy wastewatern/asingle-chamber6526231.6[82]
dairy wastewatercarbon fuel cell electrodespilot-scale tubularn/a86 *n/a[83]
dairy wastewatergraphite coated SS/
carbon cloth
single-chambern/a20 *26.9[84]
dairy industry wastewaterplain graphite platesdual-chambern/a19217.2[85]
dairy wastewatergraphite-sprayed SS meshdual-chambern/a5 *30[86]
* unit given in relation to volume; n/a—no data available.
Disclaimer/Publisher’s Note: The statements, opinions and data contained in all publications are solely those of the individual author(s) and contributor(s) and not of MDPI and/or the editor(s). MDPI and/or the editor(s) disclaim responsibility for any injury to people or property resulting from any ideas, methods, instructions or products referred to in the content.