1. Introduction
Mitigating the impacts of climate change requires a substantial reduction in anthropogenic CO
2 emissions [
1]. This endeavor is inextricably connected to the large-scale expansion of renewable-power generation. In this vein, it is necessary to, first, defossilize energy systems and, second, support the electrification of economies. One key implication of this transformation is increased land requirements for power generation [
2]. Unlike regionally dense and concentrated fossil fuel power technologies, renewable-power generators are more geographically dispersed, less dense, and regionally dependent [
3,
4]. Furthermore, some of them also require leaving substantial areas around them empty due to technical requirements or to ensure their efficient operation. These tensions between clean-energy development and land use call for integrated energy–land planning [
5]. This approach can identify robust technological pathways for preventing potential unwanted consequences that may arise from increased land demand, such as supply disruptions, social unacceptability, land-use competition, and biodiversity losses [
6].
Energy system and integrated assessment models have been the main tools used in the literature for devising medium- to long-term energy system plans [
7]. Although the underlying rationale of these models is usually based solely on cost minimization or welfare maximization, there is a body of research that has also accounted for land requirements in energy planning. This has been mainly realized either as a post-processing calculation of land requirements or endogenously within the models. In the first case, models determine the cost-optimal mitigation pathways against a set of assumptions, policy objectives, and technical constraints, in turn computing the land requirements of these pathways. In the second case, land intensities for power technologies are endogenized in models such that investment decisions also factor in land demands alongside technology costs. This is usually achieved by setting certain restrictions for land use, thereby identifying cost-optimal mitigation pathways with respect to land constraints, among others.
Another way to internalize land requirements is to apply multi-objective optimization with land use comprising one of the objectives (e.g., system cost–land use multi-objective optimization). This approach can identify “optimal” pathways with respect to many objectives (including land use). However, it is usually avoided due to the high computational and methodological complexities it brings with it, including challenges in interpreting and communicating results to policy-makers. Consequently, when considering land requirements, a constraint is typically placed on the optimization problem.
In line with the post-processing approach, Ref. [
8] evaluated the land requirements of a rapid full decarbonization pathway for the Greek power sector by 2035, using an implementation of the Open-Source Energy Modelling System for Greece (OSeMOSYS-Greece). Using the same model, Ref. [
9] calculated the land requirements of electricity export strategies for the Greek power sector and then applied a multi-criteria evaluation of these strategies, with land requirements being an evaluation dimension. Ref. [
10] followed the same approach to evaluate different electrification strategies for Greece’s road transport sector.
In all cases, the results revealed that strategies with higher electrification rates require significantly more land area for power generation, albeit with a decreasing trend over time as non-conventional, less land-intensive renewable technologies enter the system. However, this does not necessarily lead to lower overall preferability for these land-intensive strategies compared to competing pathways. This is because trade-offs are observed between conflicting objectives, which lead to non-monotonic outcomes: higher electrification rates are preferable up to a certain point, beyond which overall performance deteriorates—and in a distinct manner for different criteria-weight mixes.
On the other hand, Ref. [
11] endogenized land requirements for power generation in an implementation of OSeMOSYS for the power sector in Alberta, Canada. In doing so, they examined the impact of different constraints on the annual growth in land use for power generation on system costs, the cost-optimal technological mix, and CO
2 emissions. Their results revealed strong trade-offs between land use and clean-energy expansion: decarbonizing the power sector would require up to ten times more land area in the long term, while alternative, less land-intensive technological pathways would be significantly more expensive. While providing significant evidence on the trade-offs in the land use–clean power generation spectrum, this study lacked a broader country-level perspective, as it focused on a specific province in Canada.
In the same direction, Ref. [
12] applied the modeling-to-generate-alternatives (MGA) technique to the Balmorel energy system model with a view to exploring near-optimal pathways with lower land requirements than the cost-optimal solution. In this approach, they allowed a 1–15% increase in system costs compared to the lowest-cost solution, and they performed the analysis for several European countries. Their results revealed that alternative pathways that were on the order of 10% more costly than the cost-optimal solution could reduce land requirements by up to 58%, primarily by relying on offshore wind power generation to a greater degree. Although this study endogenized land requirements within an energy system model and provided valuable insights into land-use–clean-energy trade-offs, it explored only a limited portion of the solution space by focusing exclusively on near-optimal solutions within a predefined range, while its regional scope excluded northern parts of Europe. Such an analytical framework would be particularly relevant for Mediterranean countries with strong potential for land-intensive, variable renewable-power generation (i.e., solar and wind).
Based on the above-presented analysis of the relevant body of research, it can be concluded that there remains a significant literature gap concerning the assessment of the trade-offs between clean-energy development and land-use requirements. From a methodological point of view, the land-use–clean-energy nexus has only rarely been analyzed endogenously within planning optimization models. Specifically, existing studies either focused exclusively on the techno-economic dynamics of the transition or estimated land-use requirements as a post-processing step, thereby preventing land from being a driver of the resulting power sector strategies. Moreover, the few studies that addressed the endogeneity of land use in energy planning either explored only a limited portion of the solution space, focused on sub-national levels, or overlooked the Mediterranean region. Consequently, the regional scope of analysis comprises the second dimension of the research gap. The Mediterranean region is particularly relevant for this analysis as it presents significant potential for large-scale deployment of variable renewable energy and is also home to biodiversity hotspots.
In view of addressing these literature gaps, this study contributes to the existing body of research by explicitly internalizing land requirements within an engineering optimization model, thereby quantifying the trade-offs between land use and clean power generation for a Mediterranean country, namely Greece. This approach treats land as a key driver of the crafted decarbonization pathways rather than calculating land requirements ex post for predefined mitigation pathways. The analysis further considers multiple land availabilities and demand scenarios, enabling a granular exploration of the solution space and the identification of underlying patterns across technology portfolios.
Applying this framework to the Greek power sector also helps to address the regional research gap, as Greece is a typical Mediterranean country with vast solar and wind power generation potential. As such, over the past decade, numerous studies have examined the Greek energy transition using analytical modeling frameworks (e.g., energy system models) to provide evidence on the impacts, risks, and opportunities associated with the transformation of the Greek power sector [
13]. The analysis is conducted using OSeMOSYS-Greece to identify cost-optimal pathways for Greece’s power sector under different assumptions for land availability and final electricity demand.
By applying these methods, in this analysis, we aim to answer the following questions. First, which technology portfolios can achieve efficient decarbonization of Greece’s power sector under restricted land availability scenarios? This study further quantifies the trade-offs between land availability and system costs to address the following question: how much more expensive does system decarbonization become under restricted land availability and high-final-electricity-demand scenarios? Additionally, the analysis assesses the distribution of occupied land across power technologies under different land availability scenarios, addressing the following question: does the distribution of land occupied for power generation become more equal under land restrictions?
The fundamental focus of this analysis is on examining technology dynamics between renewable energy technologies (rather than between renewable and fossil fuel technologies or transnational electricity trade) in different land availability scenarios. Regarding fossil fuel restrictions, these are applied in light of legally binding decarbonization targets in Greece, which align with the European legislation. Furthermore, restrictions on the level of electricity trade with other countries are introduced due to technical limitations, energy security considerations, and uncertainty about imported electricity prices. Consequently, hard or soft constraints are imposed on the model (see below for details) concerning the pace and timing of decarbonization and electricity trade, which are in line with the official targets of the Greek government for the phase-out of coal-fired power plants, the expansion of renewable power generation, and transnational electricity trade. As a result, the different examined land availability constraints do not result in a rebound effect in fossil fuel power generation but rather affect the composition of the cost-efficient renewable technology portfolio that achieves power sector decarbonization while respecting land restrictions. This scenario setting is adopted as it is more relevant to policy-making in Greece and, more broadly, in other countries facing similar challenges—i.e., the critical policy question is not whether to decarbonize the power sector but how to do so more effectively under various constraints. However, to increase the robustness of the analysis, we also test the two extreme land availability scenarios, i.e., the lowest and the highest land availability scenarios, with increased flexibility in the model for fossil fuel use and electricity trade.
The rest of the paper is structured as follows.
Section 2 presents the methodology adopted in this paper, distinguishing between the modeling framework and scenario design.
Section 3 discusses the key results of the analysis and subsequent policy recommendations. Finally,
Section 4 concludes the paper and discusses key avenues for future research in the field.
2. Methodology
2.1. Overview
In this study, we adopt an engineering, linear cost-optimization model for the Greek power sector, namely, OSeMOSYS-Greece, to quantify the trade-offs between land availability and the development of clean-power generation. The model internalizes land requirements for power generation in terms of the land area needed (1) per unit of installed capacity for placing power generators and maintaining the required distance around them and (2) per unit of produced electricity for producing input fuel (e.g., biomass cultivation and natural-gas extraction). The analysis begins from a land-unconstrained scenario, followed by simulations that impose different caps on the annual growth of land use for power generation. These caps represent stylized constraints about land use rather than potential actual land constraints to be observed on the ground. We examine these caps as they allow us to study the trade-offs between clean-energy development and land availability at a high level of granularity. In addition, two demand scenarios are considered to assess the sensitivity of the results to the level of electrification of the Greek economy. In each scenario, the model selects the cost-optimal technology mix subject to land constraints and final-demand assumptions (which vary across scenarios) as well as technical constraints and policy targets (which remain constant across scenarios). This approach produces discrete technology portfolios for Greece with varying land intensities under the same mitigation stringency.
Subsequently, the analysis examines the variability in technology deployment and the associated system costs across the examined land and final-electricity-demand scenarios. The variability in fossil fuel power generation and transnational electricity trade are limited across different scenarios due to the binding constraints set in the model about the phasing out of coal-fired power plants, the expansion of clean-power generation, and electricity trade between Greece and other countries (see below for details). These settings are applied in order to make the analysis more policy-relevant for policy makers in Greece and beyond. That said, if substantial variability in fossil fuel power generation and transnational electricity trade were allowed under land-constrained scenarios, the results would be less relevant from a policy-making point of view, as they would not represent realistic decarbonization pathways that could be observed in practice. However, for sensitivity analysis, this study also examines the lowest and highest land availability scenarios with increased flexibility in the model regarding fossil fuel use and electricity trade.
2.2. Modeling Framework
We employ a linear programming, cost-optimization model that represents the power sector of Greece in high technological detail, namely, OSeMOSYS-Greece. This model has been analytically described in Ref. [
14] for the representation of the power sector and in Refs. [
8,
9] for the calculation of land requirements for power generation. The model was built using the Open-Source Energy-Modeling System (OSeMOSYS) framework [
15]. This framework enables the development of engineering, bottom-up, technology-rich models for medium- to long-term energy planning based on techno-economic historical data, projections, and policy targets. Consequently, its underlying rationale is similar to that of other established energy system modeling frameworks, such as The Integrated MARKAL–EFOM System (MARKAL/TIMES) [
16]. Its main distinguishing features, however, lie in its flexibility, modularity, and open-source nature. These characteristics result in a relatively low learning curve for building new models and extending the modeling scope to other interconnected sectors beyond the energy system, such as the land system. These factors constitute the rationale behind selecting this framework for the present analysis.
The model computes the annual combination of power technologies that (1) minimizes the total discounted system cost over the examined period (as calculated in Equation (
1)), (2) meet the exogenously defined final electricity demand, and (3) respect the established technical restrictions (e.g., reserve margin, mitigation targets, and minimum and maximum technology usage). In this process, a rational social planner with perfect foresight is assumed, who fully foresees how socio-economic conditions evolve over the modeling horizon and the impact of their decisions in subsequent years within the decision window. Furthermore, the model assumes that the implied social planner has a fixed, consistent inter-temporal preference, reflected in the constant discount rate of 5% applied to discount system costs. Furthermore, the model does not consider actor-specific preferences and capital constraints. Given the assumption of perfect foresight, parametric uncertainty can be addressed only by running different discrete scenarios, each assuming a different set of input data, in turn examining the sensitivity of results to variability in key input parameters.
The model was calibrated to data describing the characteristics, interactions, and potential development of the Greek power sector. Consequently, the model describes, with a high level of granularity, the existing technologies in the Greek power system as well as those that could be exploited in the future in light of system decarbonization. Key technology characteristics reflected in the model include capacity investment and operational cost requirements, capacity and availability factors, efficiency, input and output fuel, and lifetime. In this effort, we extracted data from datasets and reports, prioritizing those that are specific to the Greek power sector (e.g., [
17,
18]). Renewable capacity factors were obtained from Ref. [
19], while the demand profile was derived from Ref. [
20]. Monetary values were normalized to 2019 to ensure consistency and remove inflation effects. Values for intermediate years that were not available in the selected sources were estimated using linear interpolation. In cases of data unavailability, we referred to sources with a European or global scope—specifically Ref. [
19] for renewable technologies and Ref. [
21] for fossil fuel technologies.
where
is the total discounted system cost in the base model year
(2015),
represents the capacity investment costs for technology
T in model year
y (which range from
to the final model year
Y (2070)),
is the fixed operational cost for technology
T in year
y,
is the variable operational cost for technology
T in year
y, and
r is the discount rate.
Although the focus of the analysis is up to 2050, the time horizon of the model was set to span the 2019–2070 period in order to avoid knife-edge effects on the final model years of the modeling horizon. The model has an annual resolution, while each year is further split into 24 time slices, within which investment decisions are made and model results are produced. The time slices are defined by assigning a time bracket for each month and two time brackets for a date, i.e., “day” and “night”, the duration of which is adjusted based on seasonal characteristics (e.g., shorter daylight hours in the winter).
Furthermore, the electricity interconnections of the Greek power sector with other countries are represented by two indicative technologies, one accounting for electricity imports and the other for electricity exports. These technologies either supply electricity to or withdraw electricity from the grid, respectively. For the scope of this study, the level of electricity trade between the Greek power sector and other countries is set exogenously and remains fixed based on official projections [
17], with an additional 10% margin after 2030 to address potential model infeasibility arising from land constraints. This limited exogenous variability reflects, first and foremost, the constraints on the total electricity trade capacity between the Greek power system and neighboring systems. Furthermore, such scenarios, where a large part of total electricity consumption is covered from electricity imports, carry high energy security and geopolitical risks, as the availability of electricity is based on other countries. Moreover, scenarios in which a large share of total electricity consumption is covered by imports raise significant energy security and geopolitical concerns, as electricity availability depends on other countries. In addition, the cost-optimal level of electricity trade depends on the price of imported electricity—i.e., imports are economically justified when their price is lower than the marginal cost of domestic generation. However, this price is highly uncertain, as it depends on developments in other countries that are not explicitly endogenized within the adopted modeling framework. Allowing the model to fully endogenize electricity trade under land constraints could lead to imports compensating for domestic production deficits, mainly from variable land-intensive renewable technologies (solar and onshore wind). This would occur if electricity import prices were lower than the marginal cost of domestic power generation from the land-constrained technology portfolio.
Key model results include the cost-optimal usage and capacity of power technologies, capital investment requirements, fixed and variable operational costs, CO
2 emissions, and land-use requirements for power generation. Land-use requirements for power generation are measured using the “footprint and spacing” approach. This approach to land measurement is particularly suitable for the examined scenarios, which involve a transition for the Greek power system toward high shares of renewable power generation. This is because it considers the area required to place energy infrastructure (“footprint”) and the area that must remain unoccupied (mainly around renewable power generators) to ensure efficient operation and meet technical requirements (“spacing”). Specifically, the land requirements for power generation are calculated as shown in Equation (
2).
where
declares the total land area occupied for power generation in year
y,
denotes the land-area impact factor of technology
T per unit of installed capacity,
is the total installed capacity of technology
T in year
y,
represents the land-area impact factor of the input fuel
F per unit of electricity produced by technology
T, and
denotes the electricity generated by technology
T in year
y.
Land constraints in the model are specified as annual caps (
) on the total land area that can be occupied for power generation in a given year (
), as shown in Equation (
3)).
Based on this approach, land-use requirements for power generation are integrated into the energy-planning process, thereby acting as a key driver for the power generation portfolio selected by the model. Land requirements act as a type of penalty for power technologies: technologies with higher land requirements are penalized, while those with lower land intensities are favored in new investment capacity decisions.
The land intensities across system power technologies and fuels in the model are calibrated based on the data presented in
Table 1. The values are presented as the median, 25th and 75th percentile values across different real-world projects for each power generator, thereby offering a sense of the variability around these parameters. This uncertainty arises due to the technological heterogeneity and regional specificity in areas where renewable generators are placed. For renewable technologies, capacity-related land impact coefficients are calculated based on the coefficients reported in Ref. [
22] per unit of produced electricity; these coefficients are converted into a per-unit-of-installed-capacity basis by multiplying them by the maximum electricity production per unit of installed capacity (
) for each renewable generator. The calculation of
is given in Equation (
4).
where
denotes the capacity factor of renewable technology,
(i.e., the share of the year in which the technology can operate based on the suitability of weather conditions);
represents the availability factor of renewable technology
(i.e., the share of the year in which the power infrastructure can operate, depending on technical reasons); and 8760 is the rough number of hours that a calendar year contains. The
and
values considered across power technologies in the model are presented in
Table 2.
As shown, solar PV and onshore wind are the most land-intensive power technologies, but they also exhibit a relatively high level of robustness when accounting for uncertainty. At the same time, they are among the most critical technologies for the energy transition, as they are deployed at large scale to substitute for fossil fuels. Onshore wind also requires additional spacing between turbines to ensure efficiency, further increasing its overall land footprint—especially compared to other technologies. For wind onshore, there is notable variability at the lower end of the distribution, (i.e., the 25th percentile), while the upper end (i.e., the 75th percentile) converges to the median value. For solar PV, there is relatively low heterogeneity at both ends of the distribution. This is not the case for geothermal, CSP, and hydropower plants, where there is high heterogeneity across projects, as reflected in the substantial divergence in both the lower and upper parts of the distribution. However, this heterogeneity is unlikely to significantly affect overall results, as these technologies have limited deployment potential and primarily serve as complementary flexibility options with respect to solar and wind.
For fossil-fuel- and biomass-based power plants, there is significant variability in percentage terms relative to the median value, which, however, is negligible in absolute terms. The same applies to land requirements associated with fuel inputs, which, in the case of Greece, are largely imported and therefore not central to this analysis. Land use for biomass cultivation is more relevant, but it is still small compared to that for variable renewable technologies—particularly given the possibility of imports. In our scenarios, we therefore rely on median values for land coefficients, either because the variability does not seem critical for the results, or, in the case of solar and wind, because the median value is close to the worst-case scenarios. Regarding the best-case scenarios in terms of land requirements for these technologies, these are mainly captured in the unconstrained land-use case, where the share of these technologies in the power mix is determined solely by economic considerations.
Energy-related land impacts are fully endogenized in the model, alongside constraints on maximum domestic fuel capacity, so that the model selects the cost-optimal level of production and imports for each type of fuel while factoring in land restrictions. As shown in
Table 1, it is assumed that there are zero terrestrial land requirements for rooftop solar PV and wind offshore power generation, which favors these technologies in land-restricted scenarios—particularly offshore wind, which has high potential for large-scale power generation in Greece. In practice, land coefficients serve as an externality cost for power technologies. Therefore, power technologies with zero land-use requirements become more competitive for inclusion in the power mix. It should be noted, however, that offshore wind may be subject to marine spatial constraints, which require dedicated planning. This, however, goes beyond the scope of this analysis, which focuses exclusively on terrestrial land requirements.
2.3. Scenario Establishment
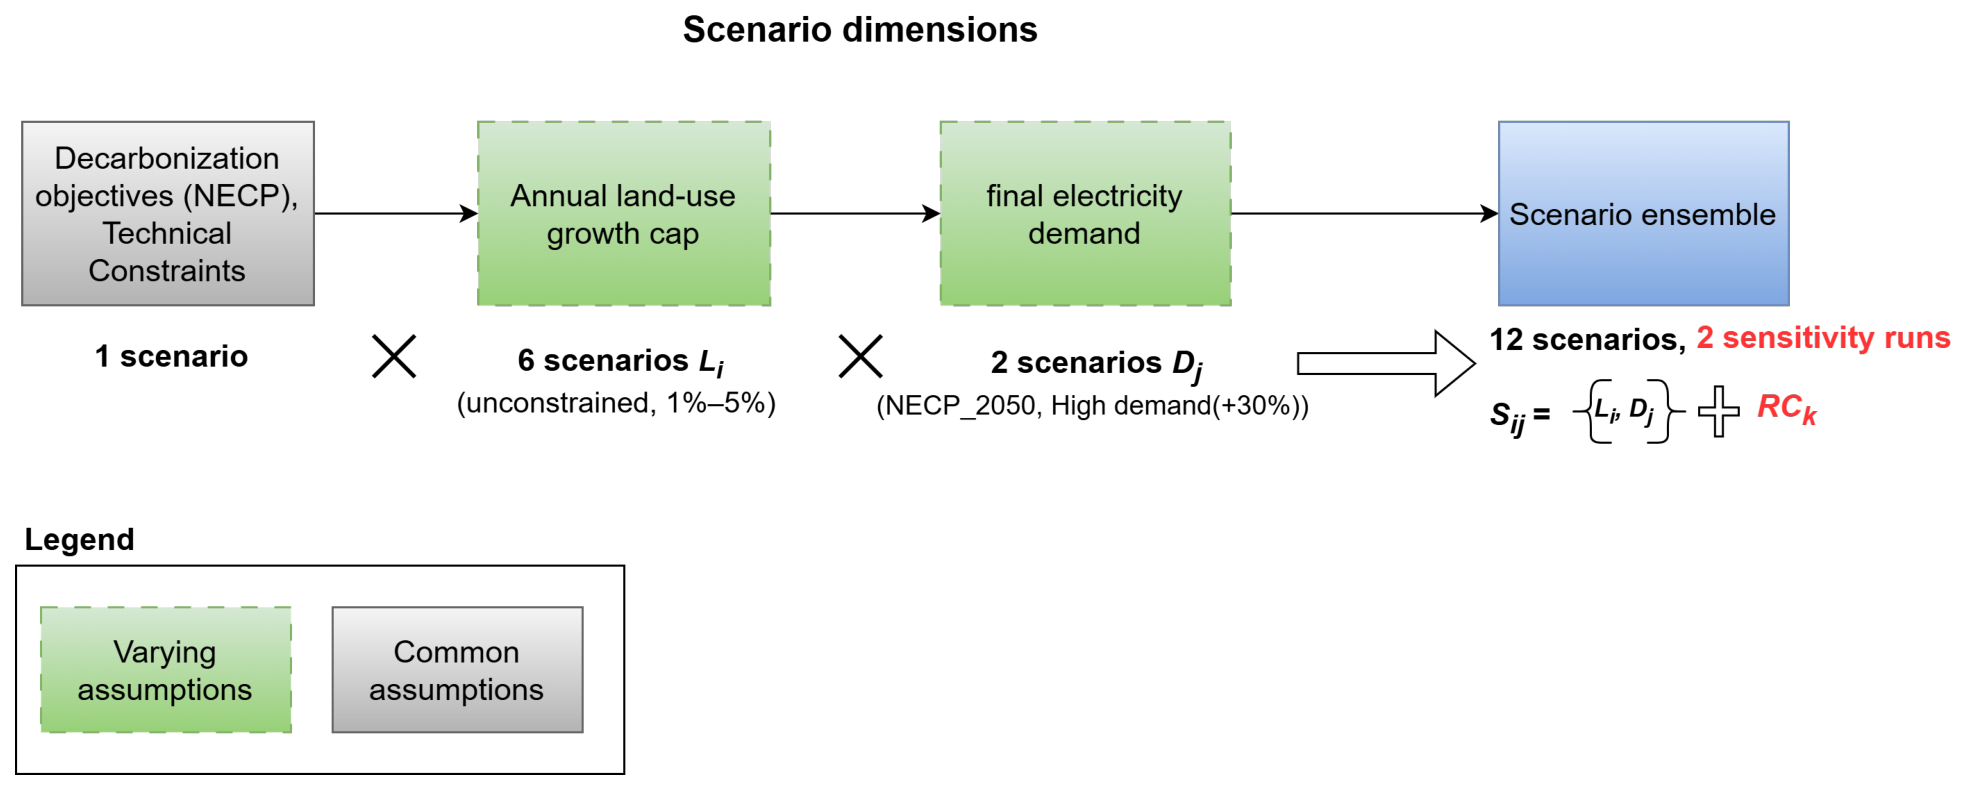
The two key dimensions for which the scenario setting is formulated are final electricity demand and land availability (
Figure 1). For electricity demand, two scenarios are examined: the first scenario considers the final electricity demand specified in the National Energy and Climate Plan (NECP) of Greece until 2030, which is extrapolated until 2050, assuming the same environmental ambition (the
“NECP_2050” scenario,
Figure 1). Energy demand is extrapolated from 2050 to 2070 based on the average growth in the 2030–2050 period. The second scenario considers an increased electricity demand (on the order of 30%) from 2030 onward compared to ESEK 2050 (
“Increased_demand”). This scenario is used to perform a sensitivity analysis with respect to the degree of electrification of the Greek economy and subsequently the level of electricity production required.
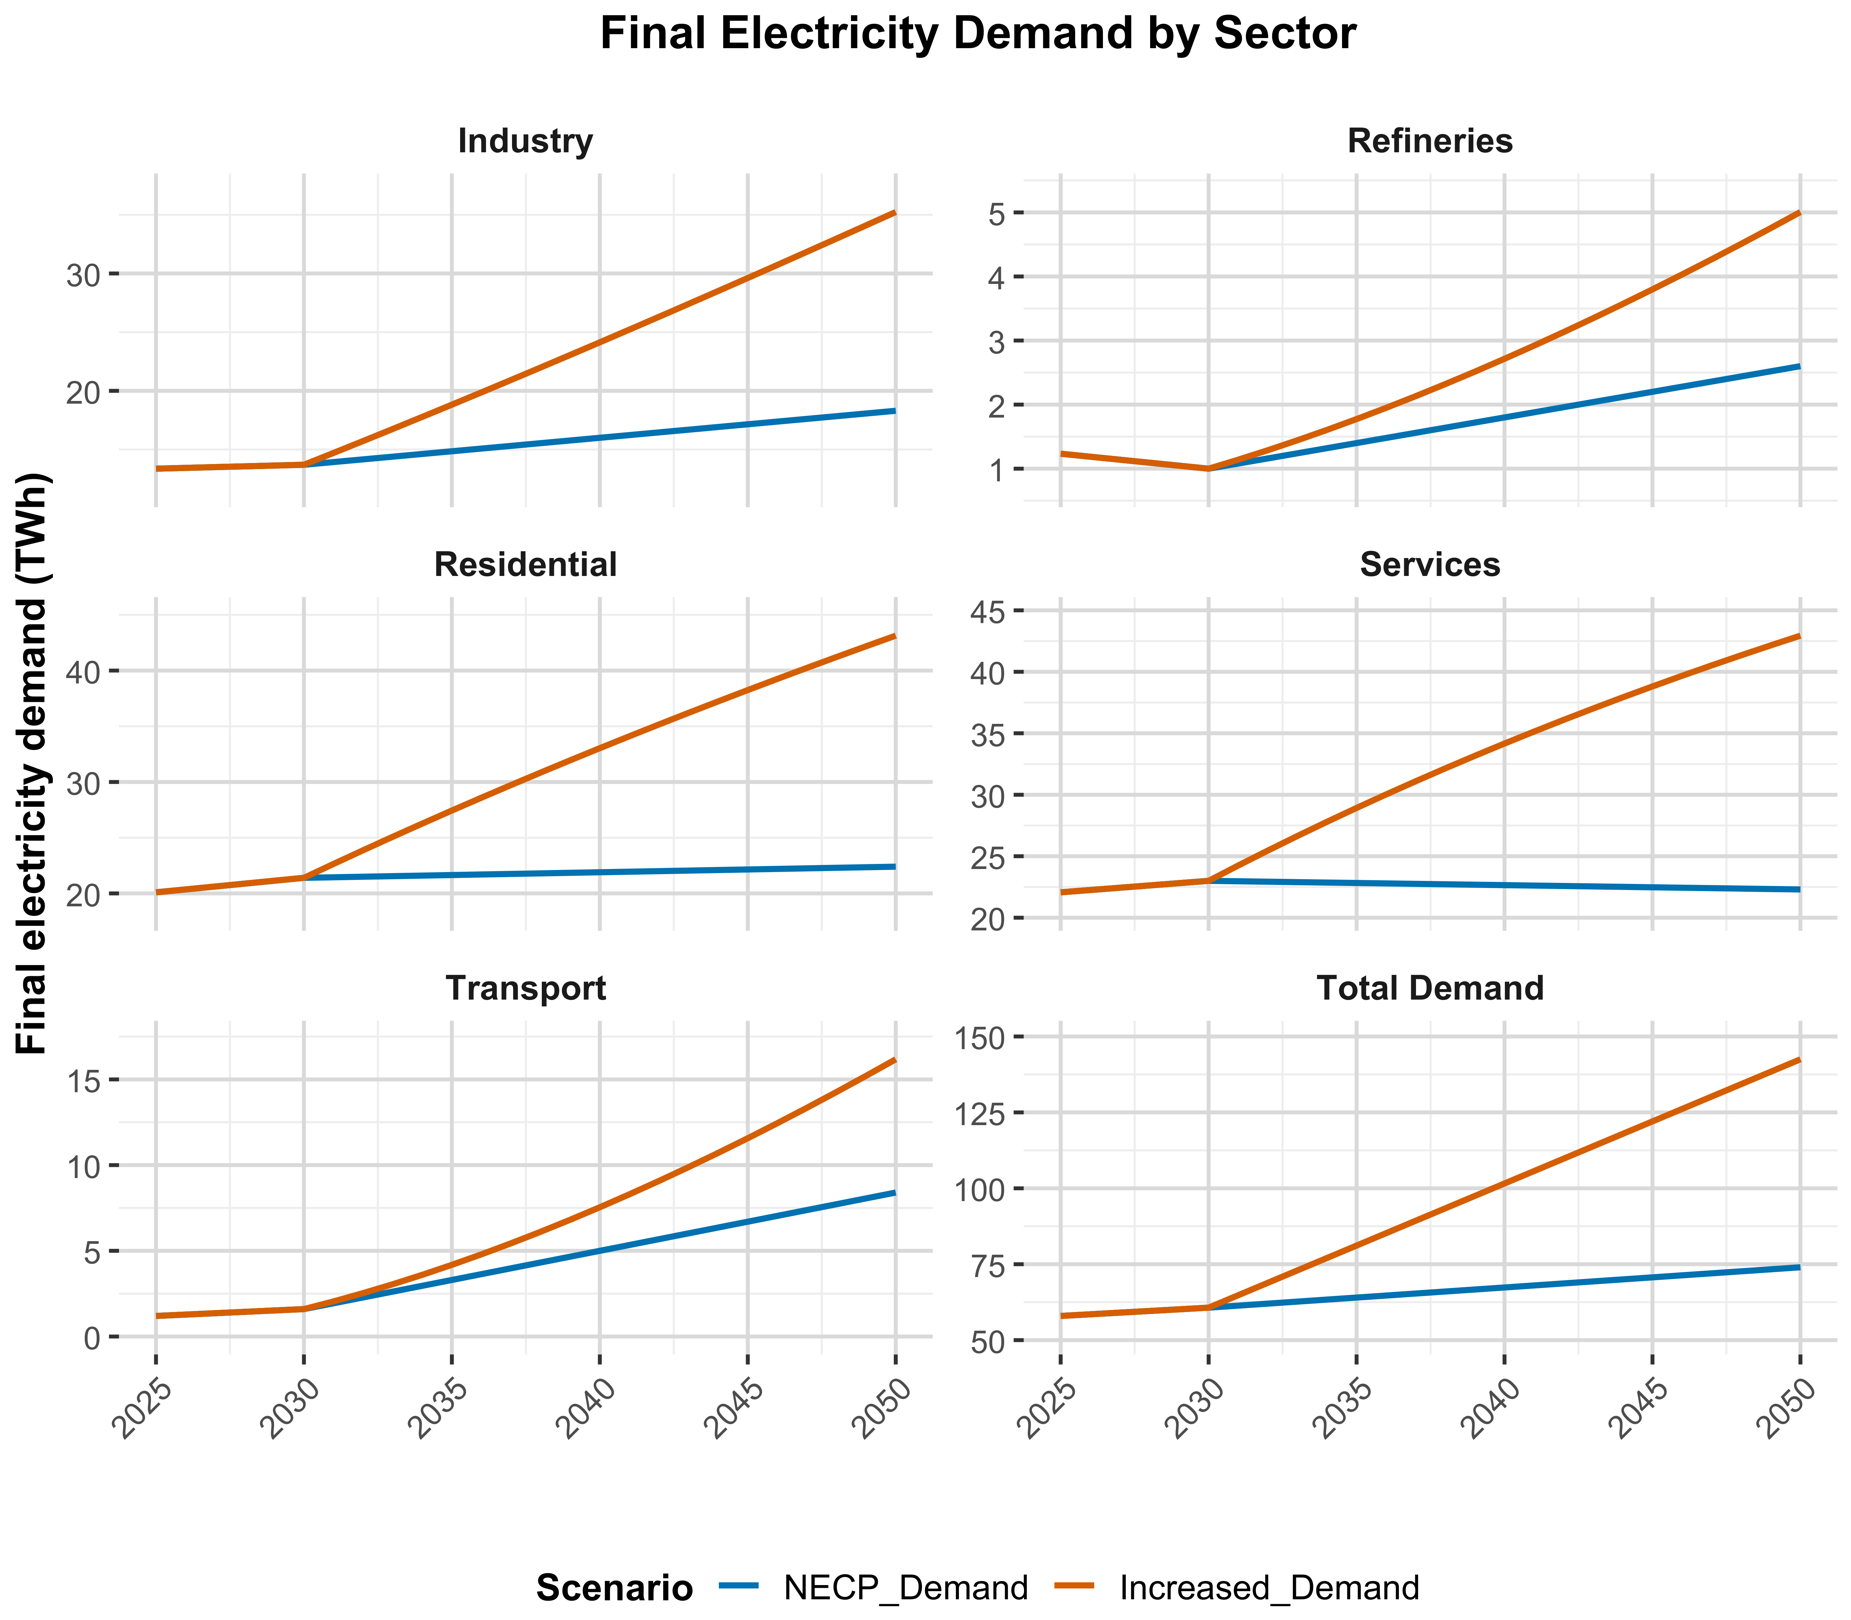
The final demand trajectories of these two scenarios over the 2025–2050 period are visualized in
Figure 2 on both sectoral-classification and total bases. As shown, while the industry, residential, and services sectors comprise the biggest consumers of electricity in the Greek economy, the transport sector is expected to see the biggest increase due to the envisioned aggressive electrification of this sector, accounting for a considerable share of total final electricity demand by the middle of this century.
The scenario framework regarding land supply for power generation is composed of an unconstrained land case, where the model selects the cost-optimal technology mix that achieves established mitigation targets and (no land-related) restrictions while meeting the final electricity demand. The other land scenarios are built based on the resulting land use in the unconstrained case. Specifically, the other scenarios consider a cap on the growth in land occupied for power generation in the range of 1%, 2%, 3%, 4%, and 5% from 2025 onward (
Figure 1).
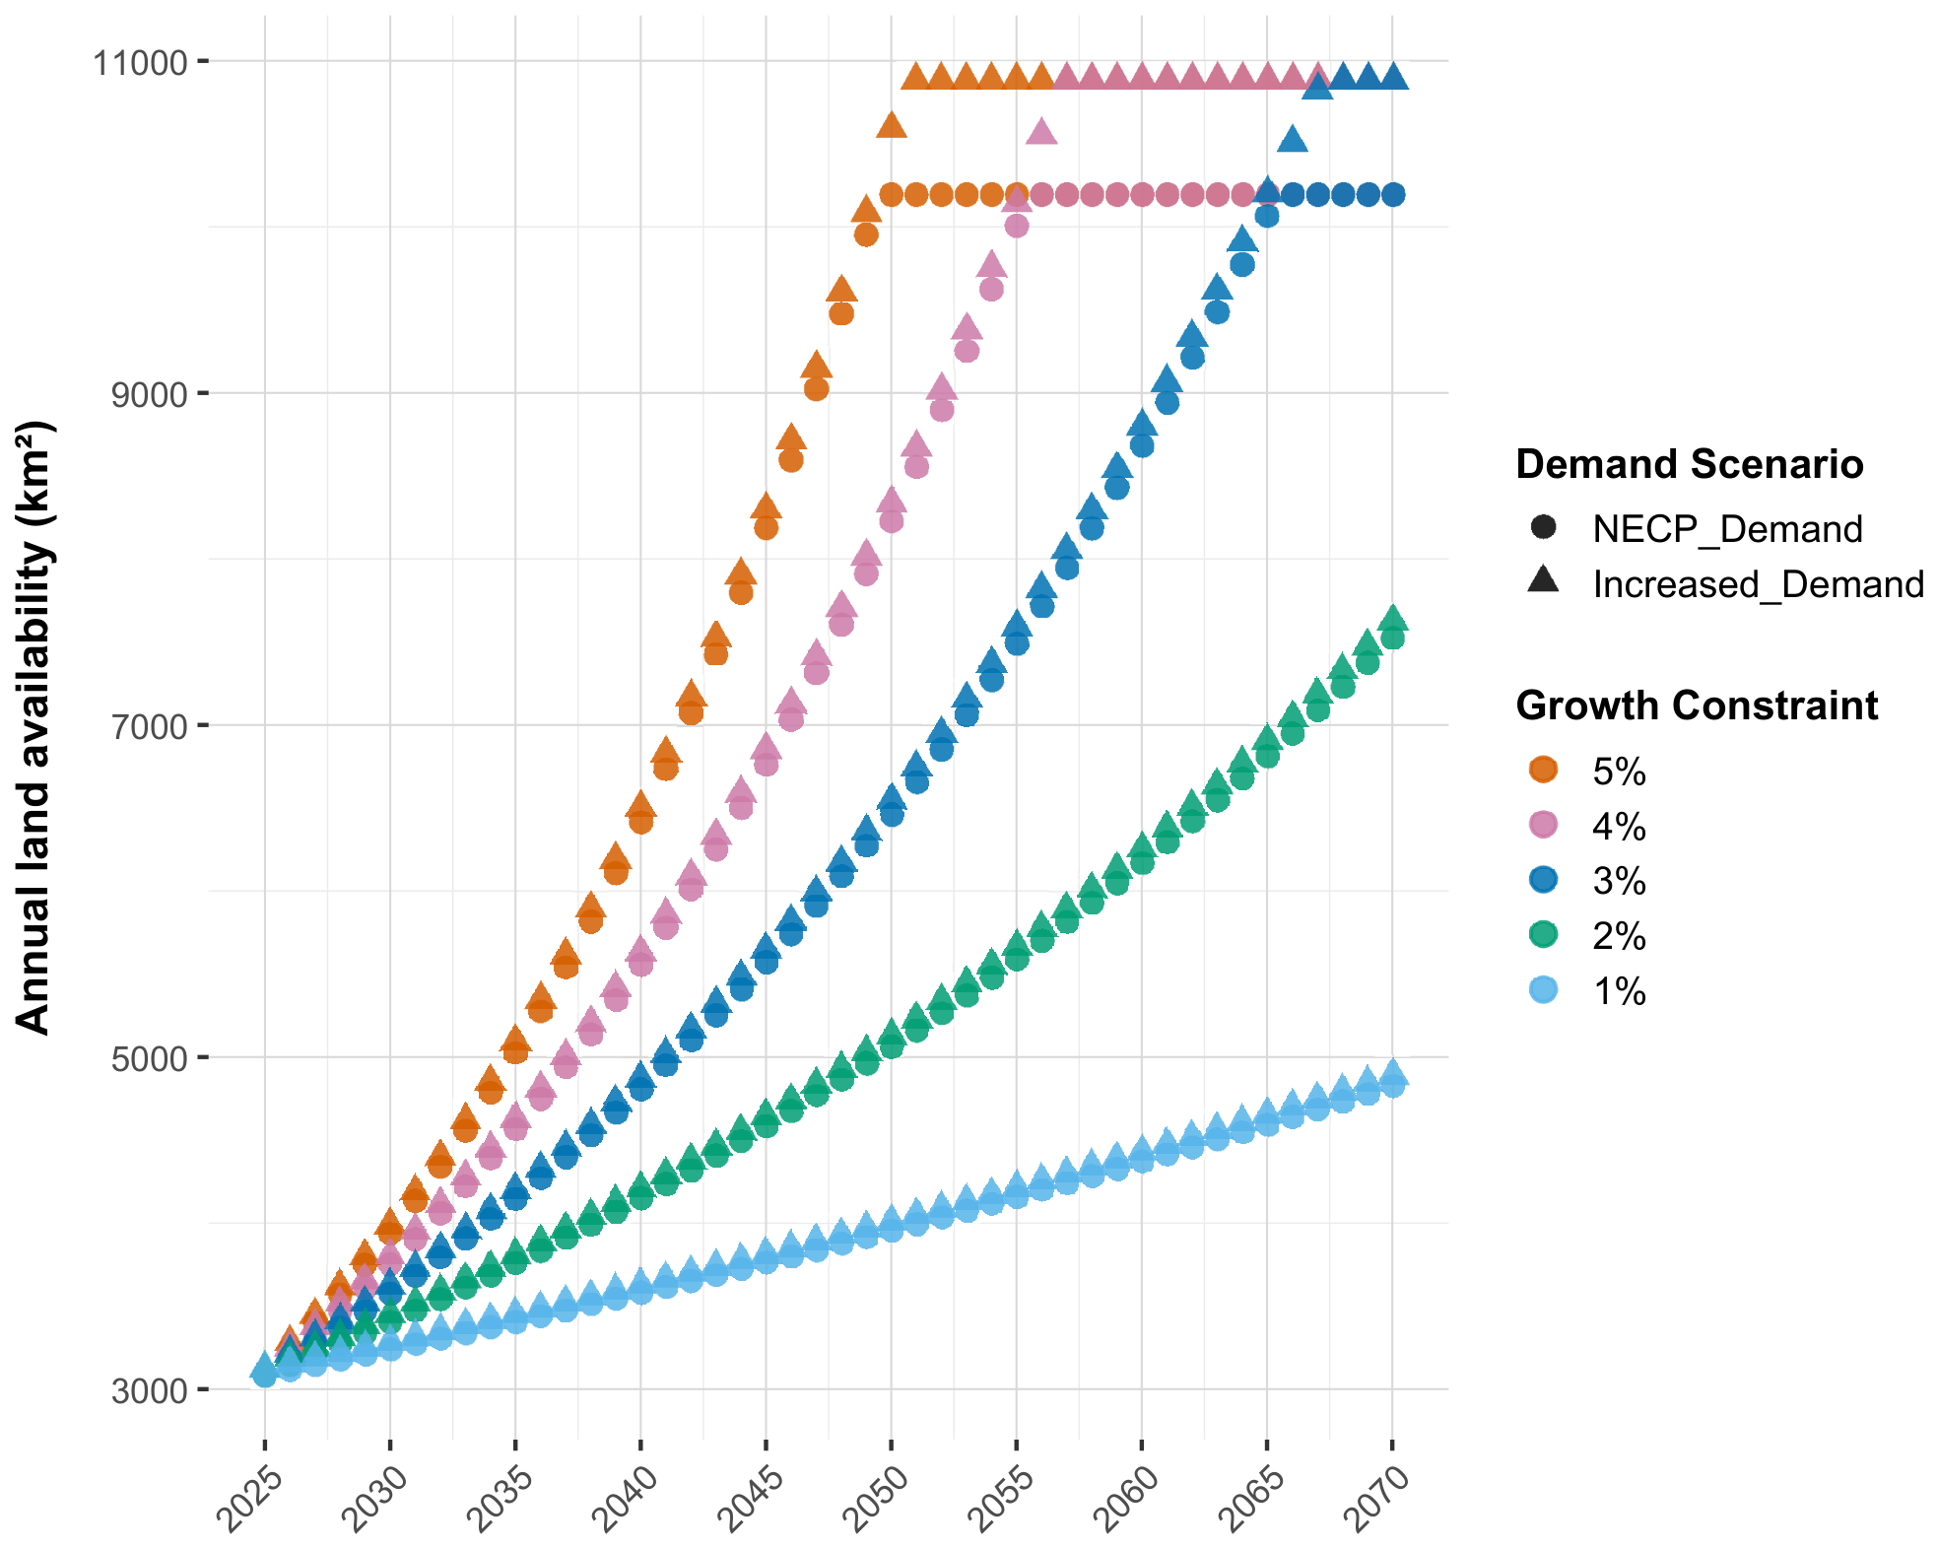
Beyond the annual land growth cap, a total annual land availability cap is applied, which corresponds to the maximum annual land use (in any year) over the modeling horizon in the unconstrained land scenarios. This means that in the land-constrained scenarios, land use can grow to a maximum according to the specified annual growth until reaching the total cap of total annual land use, which signifies the saturation of land availability from that point onward. The resulting land availability pathways yielded by this approach are presented in
Figure 3.
Based on this scenario framework, 12 scenarios are formulated and simulated (
Figure 1). It should be noted that, unlike the final electricity demand scenarios, the constructed land supply curves for Greece’s power generation do not represent potential actual pathways, nor are they empirically derived. Rather, we start from a land-unconstrained pathway determined solely by cost minimization, deriving the land growth rates observed along that pathway. We then apply, at high granularity, different levels of constraints on these land growth rates, ranging from low, medium, and high to very high pressure on permitted land growth. This approach allows construction of stylized land supply curves, thereby allowing us to assess the trade-offs between land availability and clean-energy expansion and explore the solution space. A further advantage of this approach is that it considers not only total land availability but also when land becomes available, making it more relevant to real-world conditions.
The assumptions for the decarbonization of the Greek power sector align with the official targets established by the Greek government in its NECP as well as with a scenario of a smooth phase-out of fossil fuels (e.g., no new investments in fossil-fuel power plants). Specifically, these assumptions can be summarized as follows:
Coal power plants will be phased out by 2028;
Non-interconnected islands will be integrated into the main grid by 2030;
New investment in fossil fuel power plants will be restricted;
Existing natural gas infrastructure will annually depreciate by 10%, reflecting a smooth energy transition;
The power sector will be fully decarbonized by 2050.
It should be noted that, beyond our main scenario configuration, we also examine two robustness check scenarios for the two extreme land-constrained cases (i.e., the 5% annual cap with NECP demand and the 1% annual land cap with increased demand). In these scenarios, we relax the model constraints on the phase-out of fossil fuel power technologies and transnational electricity trade. We do so to examine how the model responds to land constraints when it is flexible enough to revert to fossil-fuel-based power generation or rely more heavily on electricity imports. This does not change the main focus of our scenario design, which is to assess how land availability affects the optimal power technology portfolio, but rather serves as a robustness check of our results. Specifically, in these scenarios, we maintain the net-zero target for 2050 and carbon pricing while allowing new investments in natural gas infrastructure and reducing the depreciation rate of existing natural gas infrastructure from 10% to 5% annually. We also increase the flexibility of electricity imports in the model, allowing imports to exceed the official projections [
17] by up to 50% after 2030, which can be compared to the limit of 10% in the main scenario setting.
In a land-unconstrained scenario, the model selects the combination of technology usage and capacity additions, over the entire time horizon, that minimizes the total discounted system costs. However, when land constraints are factored into the optimization process, they shift the feasible solution space away from the previous global optimum. Consequently, the model now selects the technology combination that minimizes total system costs while also respecting land restrictions. In a scenario without restrictions on fossil fuel use and electricity trade, land constraints would lead the model to substitute curtailed power generation with the most cost-effective option between electricity imports, fossil fuel power generation, and alternative renewable-power generation. However, by limiting the flexibility of fossil fuel usage in power generation and electricity trade (for the reasons described above), the model instead identifies the alternative, less land-intensive renewable technology portfolio that satisfies land constraints and policy targets.
3. Results and Discussion
This section presents the main results of the analysis across the examined scenarios, each considering a different limit for land-use growth and energy demand. The analysis focuses on changes in key indicators of the power mix against varying land-use constraints, including cost-optimal power technology deployment, emissions, total system costs, and the distribution of land allocated to power generation across technologies. By examining these indicators, we aim to identify the type and magnitude of trade-offs that arise in power decarbonization pathways under land-use constraints as well as the key technology options that can hedge against land-use supply disruptions.
Commencing from the power mix,
Figure 4 and
Figure 5 illustrate the changes in the usage of power generation technologies in the cost-optimal power mix with respect to the different examined caps on land-use expansion and final electricity demand.
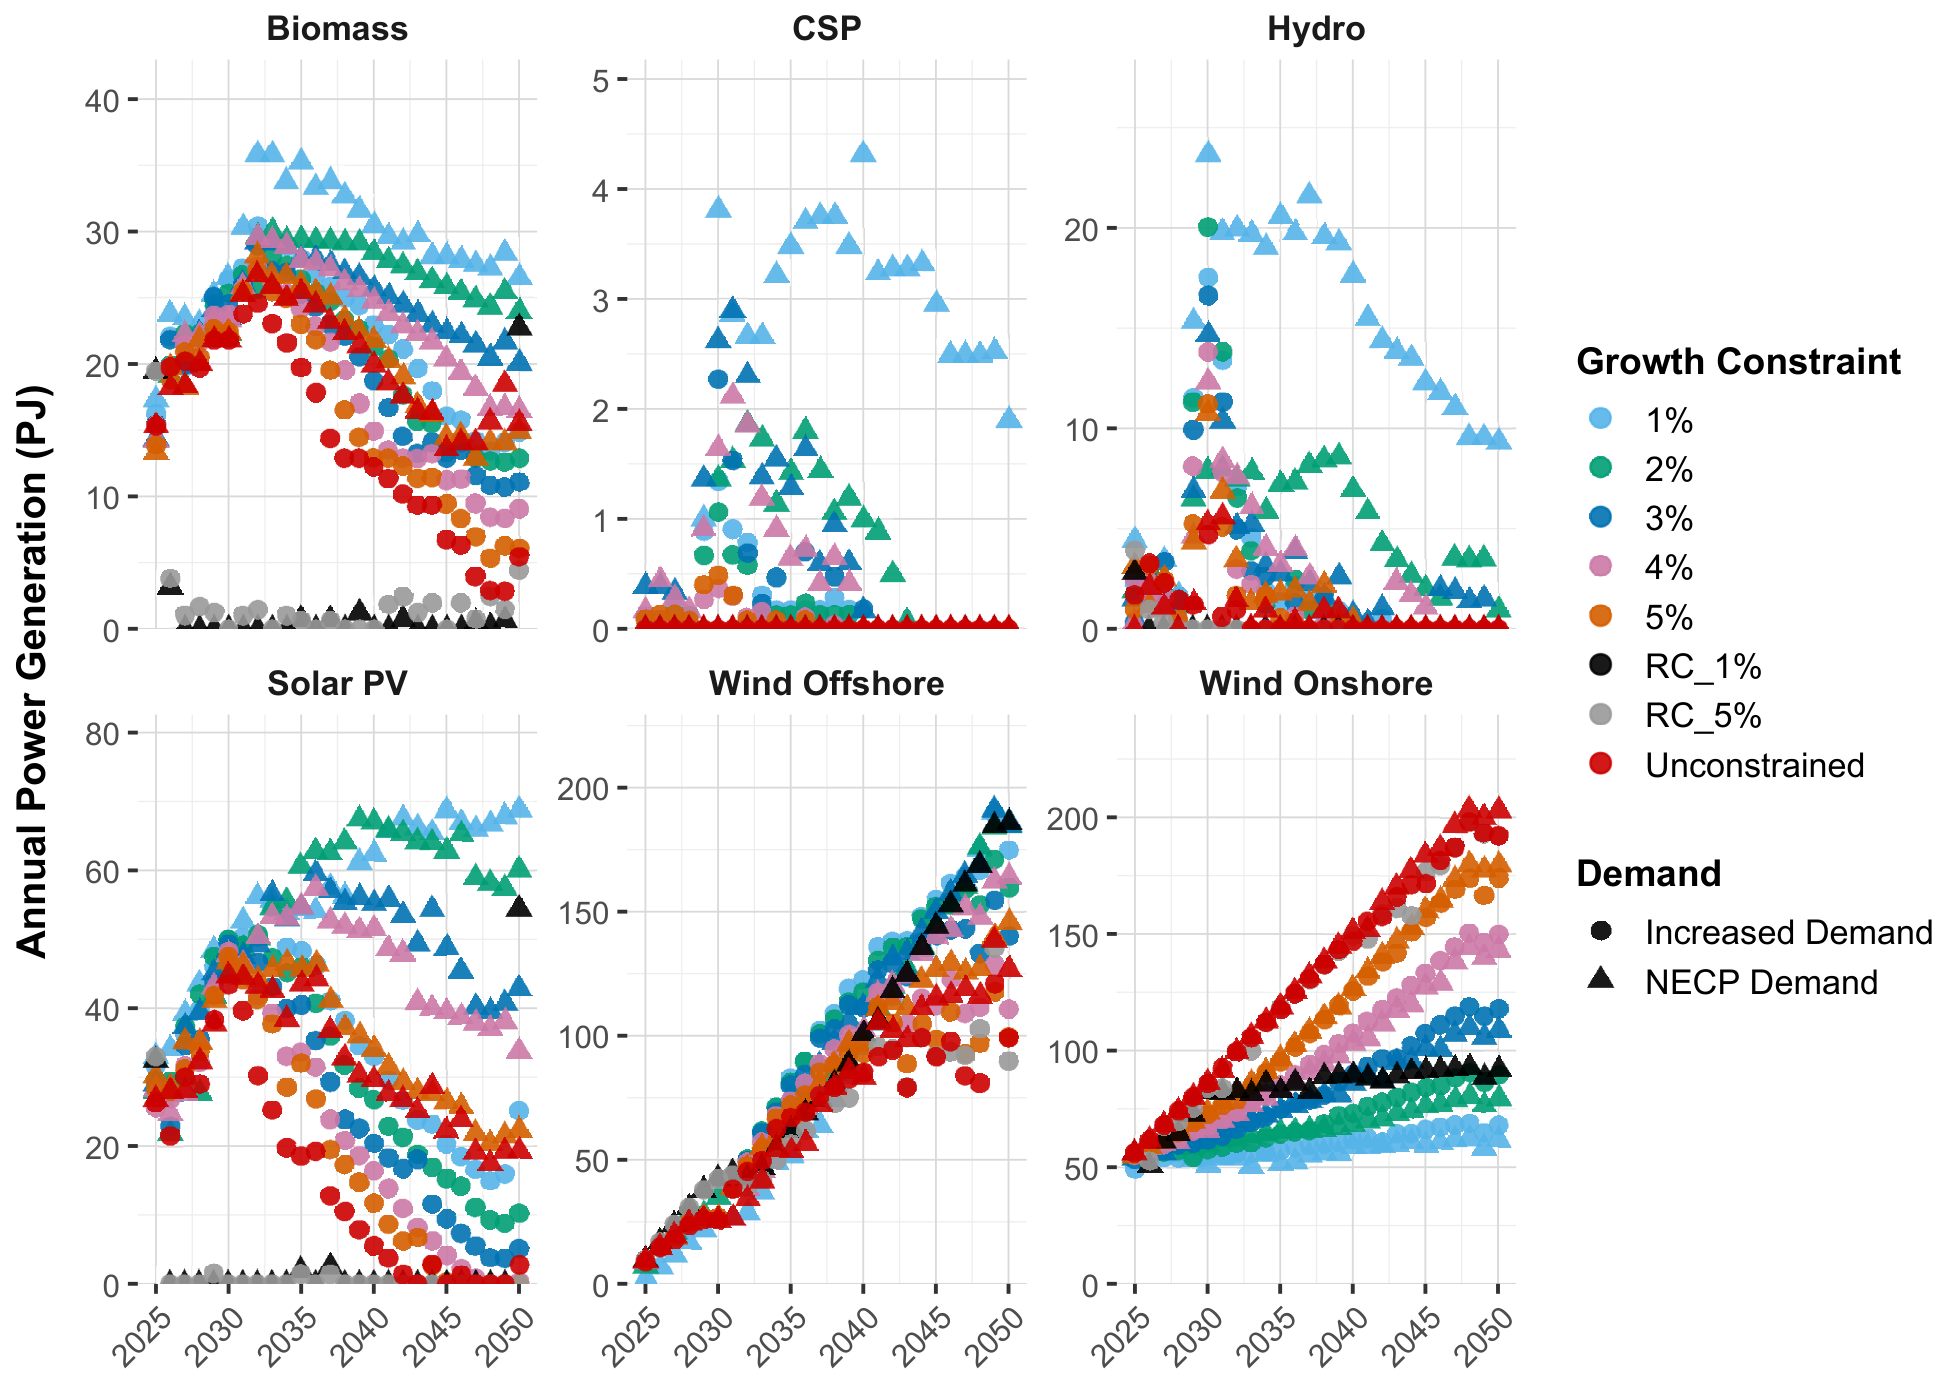
Figure 4 presents the technologies that exhibit high sensitivity to land availability, whereas
Figure 5 includes the technologies that reflect an insensitivity to land availability. Caps in annual land growth (1–5%, starting in 2025) are set as binding constraints in the model, thereby affecting the composition of the cost-optimal technology portfolio.
As shown in
Figure 4, under annual land-expansion caps and an eventual saturation ceiling, the highest sensitivity of the cost-optimal power mix against land constraints emerges during the 2030s, when the impact of land constraints on power capacity expansion starts to become significant. This behavior is consistent across both examined demand trajectories, with the substitution pattern remaining broadly unchanged. Higher demand primarily increases the overall level of power generation required (given that electricity imports are largely constrained) and consequently highlights the need for a more land-efficient power technology portfolio. With regard to individual technology options, onshore wind is the most land-sensitive option and therefore shows the largest variations across scenarios. In the unconstrained case, wind power generation increases by up to 300% over the 2025–2050 period. However, under strict land caps (1–2%), it is strongly curtailed to 55–80 PJ by 2050 (and 120–170 PJ under looser 4–5% caps). This reflects the increasing difficulty of expanding capacity as the land-use pathway approaches saturation, prompting the model to shift investments toward less land-intensive alternatives. It should be noted that such a large expansion in onshore wind under the land-unconstrained scenario may be subject to significant challenges in the real world, such as grid integration or regulatory constraints. In our analysis, though, we adopt an optimistic baseline scenario for onshore wind in order to better examine the trade-offs between land use and clean-energy development in subsequent land-constraint scenarios.
Offshore wind emerges as the primary substitute for constrained onshore wind deployment, as it combines substantial scalability (i.e., high installable capacity and capacity factors) with zero terrestrial land requirements. Consequently, while offshore wind power generation reaches 100–140 PJ by 2050 in the unconstrained pathway, it scales up by 50% under tighter land limits, increasing steadily through the 2030s and 2040s. This outcome indicates that offshore wind is the key long-run expansion lever under land scarcity conditions, thereby making it a key mitigation option against land-use supply disruptions.
Utility-scale photovoltaic (PV) deployment responds more conditionally to land constraints. When land caps become binding, solar power generation remains a material contributor, typically reaching 50–70 PJ by 2040–2050, thereby supporting supply when onshore wind is restricted. In the unconstrained case, PV power generation reaches around 45 PJ in the 2030s but declines towards 2050 as the system increasingly relies on onshore wind. This pattern indicates that solar PV chiefly serves as a flexible complement when land scarcity constrains onshore wind expansion. Onshore wind’s superiority relative to solar PV is based on the techno-economic assumptions with which the model was calibrated, particularly differences in technology capacity factors in Greece. Specifically, onshore wind is estimated to exhibit, on average, a capacity factor that is approximately 10% higher than that of solar PV, which significantly improves its levelized cost of electricity. As noted above, large-scale deployment of onshore wind may be subject to substantial real-world challenges; therefore, a more prominent role for solar PV in the power mix could be considered more plausible. In our analysis, however, we primarily aim to examine technology dynamics under different land availability constraints and identify the underlying drivers of these trends rather than project the exact power mix that will materialize in practice. Given the many contingencies involved in long-term energy system transitions, such projections would carry limited practical value.
Biomass and hydropower primarily play a complementary role in the power mix (
Figure 4), with contributions that rise temporarily before stabilizing at lower levels toward the mid-century. CSP is introduced in the power mix only under land-use constraints, peaking in the 2030s across most scenarios. This trend suggests that CSP functions as a short-term, low-land supplement rather than as a major long-term supporter. Biomass power generation commences at approximately 15–25 PJ in 2025, peaks near 25–35 PJ in the early to mid-2030s, and then tapers to roughly 5–25 PJ by 2050. This trajectory is consistent with a controllable bridge technology that becomes less necessary as offshore wind and PV capacities scale up. Hydropower exhibits the sharpest spikes, reaching 5–25 PJ around 2030–2035 in the most land-constrained cases before dropping back to 0–10 PJ in later decades. These findings highlight the role of this technology as a short-term flexibility option rather than as a source of sustained expansion.
Taken together, the results for the power mix indicate a land-driven re-optimization of the power system as constraints tighten in the 2030s. This re-balancing fundamentally leads to limited onshore wind growth, with offshore wind emerging as the main substitute. This trend is driven by offshore wind’s substantial scalability and complete lack of terrestrial land requirements. At the same time, solar PV and small-scale, low-land-intensity or dispatchable technologies contribute to maintaining system balance and adequacy. Furthermore, under strict land constraints, the system expands into technologies that are absent in other scenarios (e.g., CSP), reflecting the increasing value of diversification when land availability becomes scarce.
It should be noted that, under the robustness check scenarios, the model shifts toward increased natural gas power generation, while electricity imports remain largely unaffected. This shift in turn leads to reduced shares of solar PV, biomass, and hydropower in the electricity mix. This occurs because the model allocates the largest part of available land to onshore wind, with the remaining electricity demand mainly covered by natural gas, wind offshore, and electricity imports. This result supports the main assumption underlying the scenario design, in which hard constraints were imposed to prevent land limitations from triggering a rebound effect in fossil-fuel-based power generation.
The results reveal a clear trade-off between land use and renewable expansion pathways. With fewer constraints, the system favors cost-effective but land-intensive onshore wind. As land becomes scarce and the model does not have the flexibility to bounce back to natural gas power generation, it shifts toward alternative renewable technologies, most notably to offshore wind, thereby reducing land use but increasing costs. The trade-off is thus between land-intensive, lowest-cost pathways and more land-efficient but more expensive clean-energy options. These findings are broadly consistent with earlier studies showing that land constraints do not simply limit renewable expansion but rather actively reshape the cost-optimal portfolio toward less land-intensive alternatives.
Indicatively, Ref. [
11] also found that tighter land restrictions alter the power generation mix and increase reliance on alternative clean technologies, while earlier applications of OSeMOSYS-Greece (e.g., ref. [
8]) highlighted that higher electrification pathways in Greece are associated with substantially larger land requirements. The results of the present analysis extend this research for Greece by showing that, when land availability is internalized directly in the optimization problem, the response is not a generic reduction in renewable deployment but a distinct substitution pattern within the clean technology portfolio. In this case study, this adjustment is expressed mainly through a strong shift from onshore to offshore wind, with complementary contributions from solar PV, biomass, hydropower, and CSP.
Furthermore, the outcomes extend previous studies that also incorporated land-use requirements into energy-planning models by revealing stronger trade-offs between clean-energy expansion and land availability, particularly in regard to shaping the power mix during the transition of the electricity sector. This outcome is closely related to the characteristics of Greece’s high offshore wind and solar resource potential, together with binding decarbonization constraints that limit the scope for fossil fuel rebound, thereby forcing adjustments primarily within low-carbon technologies.
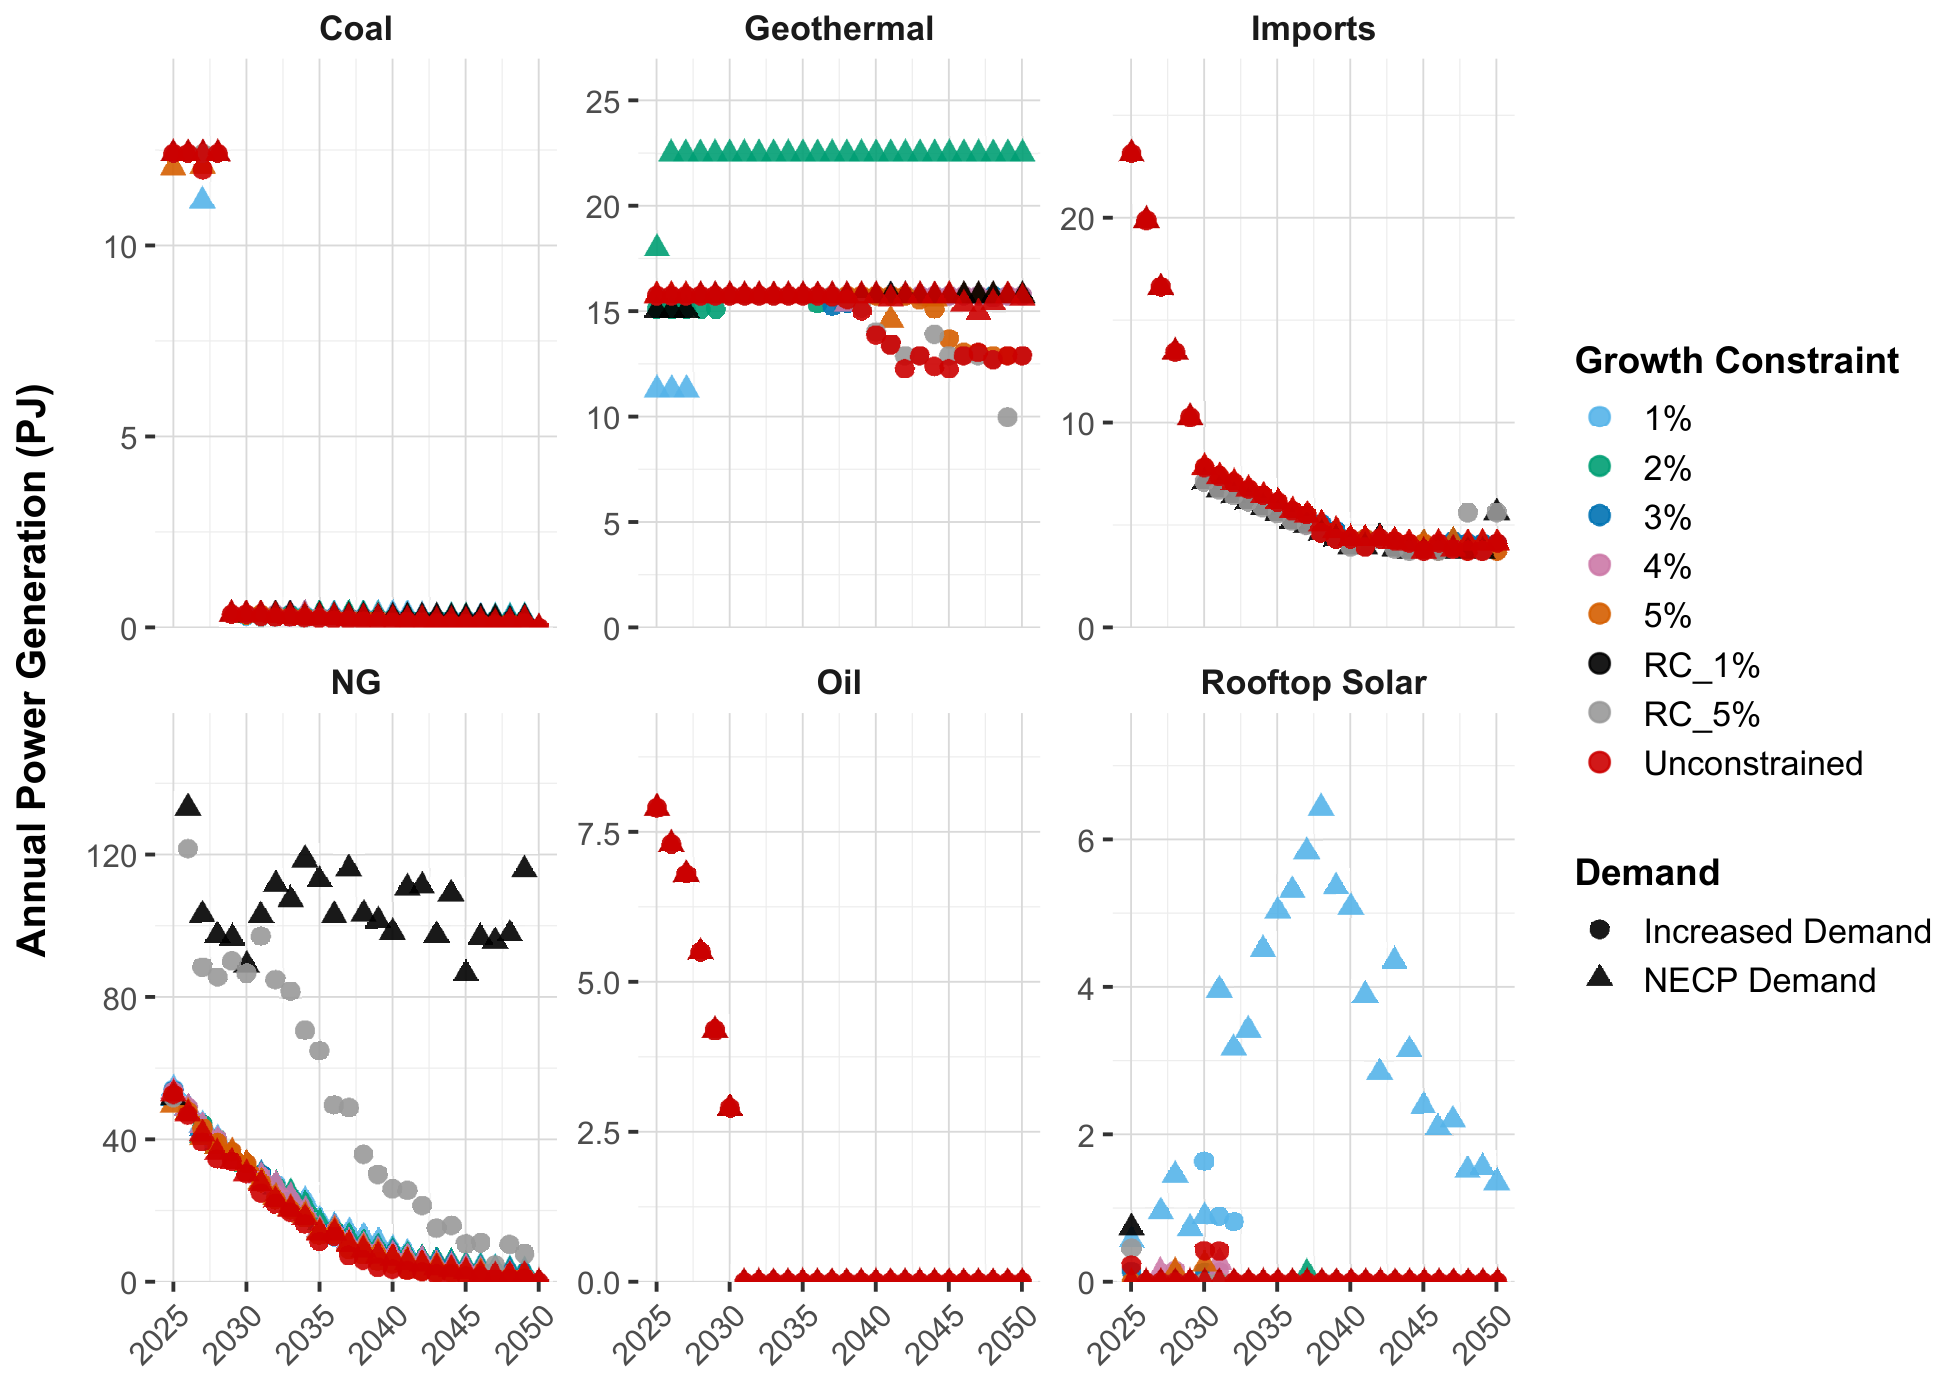
In contrast to the technologies presented in
Figure 4, for which land constraints substantially reconfigure participation in the cost-optimal technology portfolio,
Figure 5 displays technologies whose annual power generation exhibits zero or only minimal sensitivity to land availability. This phenomenon is a product of the fact that their trajectories are governed by binding policy and technical assumptions, which remain fixed across examined scenarios. Different land-growth caps therefore mainly change which clean technologies substitute for each other (
Figure 4) rather than inducing a rebound of fossil fuels or increased reliance on electricity imports.
Coal generation appears only in the early years and then drops to zero, while oil power generation phases out by around 2030 (when non-interconnected islands are integrated into the system). The nearly identical paths across all land and demand cases for these technologies reflect binding phase-out constraints imposed uniformly in the scenario set. Natural gas-fueled power generation decreases steadily from high levels in 2025 (approximately 50–55 PJ) until it is completely phased out by mid-century. This decline is largely constraint-driven, as (1) existing gas capacity depreciates over time, (2) new investments in gas power infrastructure are not allowed, and (3) the power system is required to fully decarbonize by 2050. Consequently, land availability mainly influences the replacement mix for gas power generation (e.g., offshore versus onshore wind), but it does not materially alter the declining gas trajectory itself. However, as noted above, this is not the case in the robustness check scenarios, where natural gas power generation increases its share in the electricity mix.
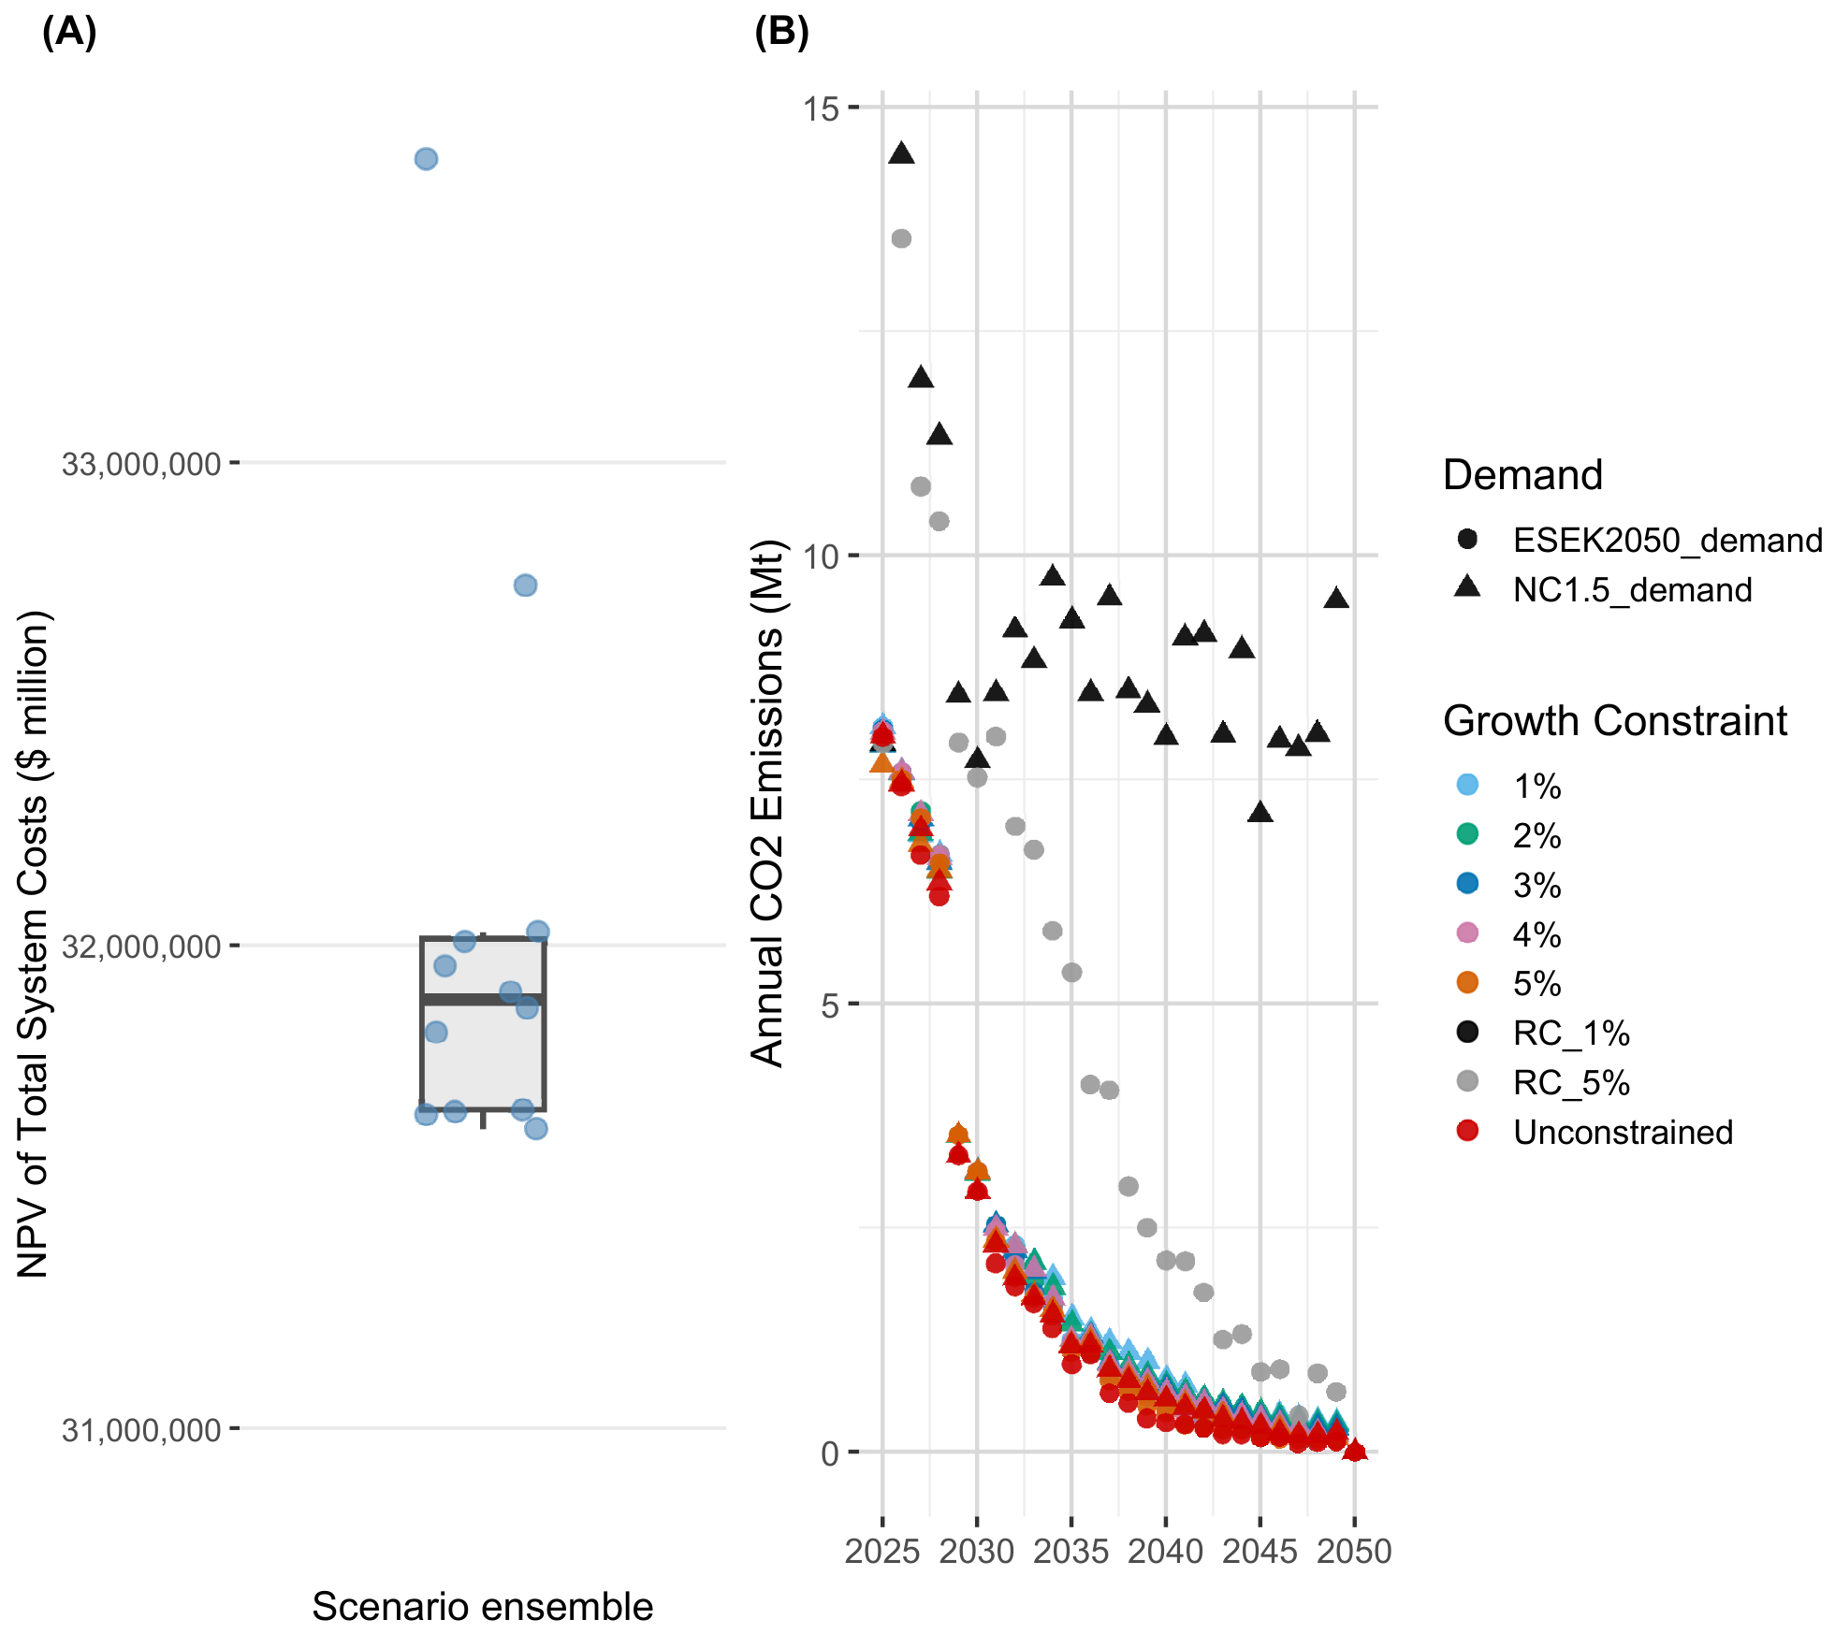
The slight sensitivity of natural gas usage to land constraints also induces variability in annual
emissions from power generation across the examined scenarios, as illustrated in panel (B) of
Figure 6. As shown, while the overall variation is modest,
emissions do respond to land constraints (to the extent this is allowed in the model), leading to somewhat inconsistent decarbonization pathways for the power sector under the land-constrained scenarios. This divergence becomes more pronounced in the post-2035 period, when power generation must simultaneously scale up to meet the rising electricity demand and continue decarbonizing. Under stringent land constraints, natural gas power generation is retained longer to provide system balance, and it is then phased out more abruptly by 2050 compared to less land-restricted pathways. Moreover, this sensitivity becomes particularly notable under the two robustness check scenarios. Consequently, in the absence of explicit constraints on fossil fuel use along the path to net zero, land scarcity can induce temporary or more permanent rebounds in power sector emissions, thereby leading to inconsistent decarbonization trajectories.
With regard to electricity imports, they decline from relatively high levels in the mid-2020s (roughly 20–25 PJ) toward a low and stable level by the 2040s. Import volumes show limited variability because cross-border trade follows an exogenous trajectory based on external projections rather than being modeled as a fully endogenous decision variable. Flexibility is limited to 10% post-2030 to deal with infeasibilities in highly land-constrained scenarios. This modeling choice prevents imports from further compensating for land scarcity and keeps the analysis focused on substitution among domestic generation technologies. However, even under the robustness check scenarios, imports remain largely unchanged, as in this model, it is more cost-effective to increase natural gas power generation to substitute for curtailed onshore wind generation.
Geothermal generation remains broadly flat at around 15–16 PJ over time across the examined scenarios. However, under stringent land constraints, its availability in the model is slightly increased to help meet the final electricity demand, thereby leading to a higher level of geothermal power generation relative to the lower land-restricted scenarios. Overall,
Figure 5 confirms the internal consistency of the scenario framework. Fossil phase-out pathways and trade assumptions remain effectively fixed, so the system’s primary response to land scarcity occurs through reallocation among clean technologies (as highlighted in
Figure 4) rather than through increased fossil fuel generation or greater reliance on imports. This sensitivity also distinguishes this study from more unconstrained system-transition analyses, as the imposed phase-out and no-new-fossil assumptions reduce the possibility that land scarcity would be compensated through expanded fossil generation. However, under the robustness check scenarios, natural gas power generation increases significantly.
The mechanism through which the re-configuration of the cost-optimal technology portfolio takes place in the model, as discussed above in detail, is as follows. Under the land-unconstrained case and based on the techno-economic assumptions embedded in the model, the optimization process determines the cost-optimal technology pathway that meets the final electricity demand and decarbonization targets. This pathway constitutes the global optimum of the problem, i.e., the sequence of “optimal” annual investment and power generation decisions that minimizes total discounted system costs over the planning horizon. When land constraints are introduced into the model, the feasible solution space is restricted, and the new “optimal” solution shifts away from the initial pathway, thereby resulting in increased total system costs relative to the initial optimum. This trend is illustrated in Panel (A) of
Figure 6, which presents the box plot of the net present value (NPV) of total system costs across the examined scenarios from 2019 to 2070, including the individual scenario outcomes. As shown, system costs are only marginally affected under mild land-use constraints (with a <1% change compared to the land-unconstrained pathway). However, system costs increase progressively as land constraints become more stringent, reaching a 6.3% increase under the pathway with a 1% land cap and higher demand relative to the land-unconstrained case. This pattern reflects strong nonlinearities between land-use and total system costs: as land constraints tighten, the marginal cost of maintaining a given level of electricity supply and policy ambition increases disproportionately.
This cost pattern is also consistent with the overall literature on land-constrained energy transitions, which shows that land-efficient power generation pathways typically require a departure from the lowest-cost technology mix. For example, Ref. [
11] similarly reported that stricter land constraints in Alberta increase total system costs by limiting the deployment of land-intensive renewable options and forcing reliance on more expensive alternatives. Our results confirm the same overall mechanism but also point to an important difference in the Greek case. Here, cost escalation remains relatively moderate under loose land constraints and becomes markedly steeper only under tighter land caps. This reflects the fact that, under low-level land restrictions, the system can still adjust through relatively cost-effective reallocation within the renewable portfolio, mainly by substituting power generation away from onshore wind. However, as land availability becomes more restrictive, the feasible solution space narrows significantly, and the model is increasingly forced toward technologies with greater system-wide integration and investment costs. In this sense, the Greek case adds to the literature by showing that the economic penalty of land scarcity is not linear but rather depends on the level at which the system can preserve access to low-cost renewable expansion options before being pushed into more constrained and capital-intensive pathways. Overall, the results show that land constraints not only reshape the renewable mix but also increase transition costs, particularly when the system is pushed away from its lowest-cost onshore pathway.
The total-system-cost results make the economic-versus-territorial trade-off particularly clear. Under unconstrained land availability, the model identifies the lowest-cost decarbonization pathway, which relies heavily on land-intensive but economically attractive renewable expansion, especially onshore wind. As progressively tighter land caps are imposed, the system is forced to move away from this cost-efficient pathway toward alternative configurations that require less land but involve greater investment and integration costs. In this sense, the territorial benefit of reducing occupied land does not come without a penalty; it is achieved at the expense of a higher total system cost. Moreover, the results suggest that this trade-off is not linear: under relatively mild land constraints, the cost increase remains limited because the system still retains some flexibility with respect to reallocation within the renewable portfolio, whereas under stricter caps, the economic penalty becomes more pronounced as low-cost expansion options are progressively exhausted. This highlights that land scarcity should be understood not only as a spatial constraint but also as a determinant of system-wide economic efficiency in long-term decarbonization planning.
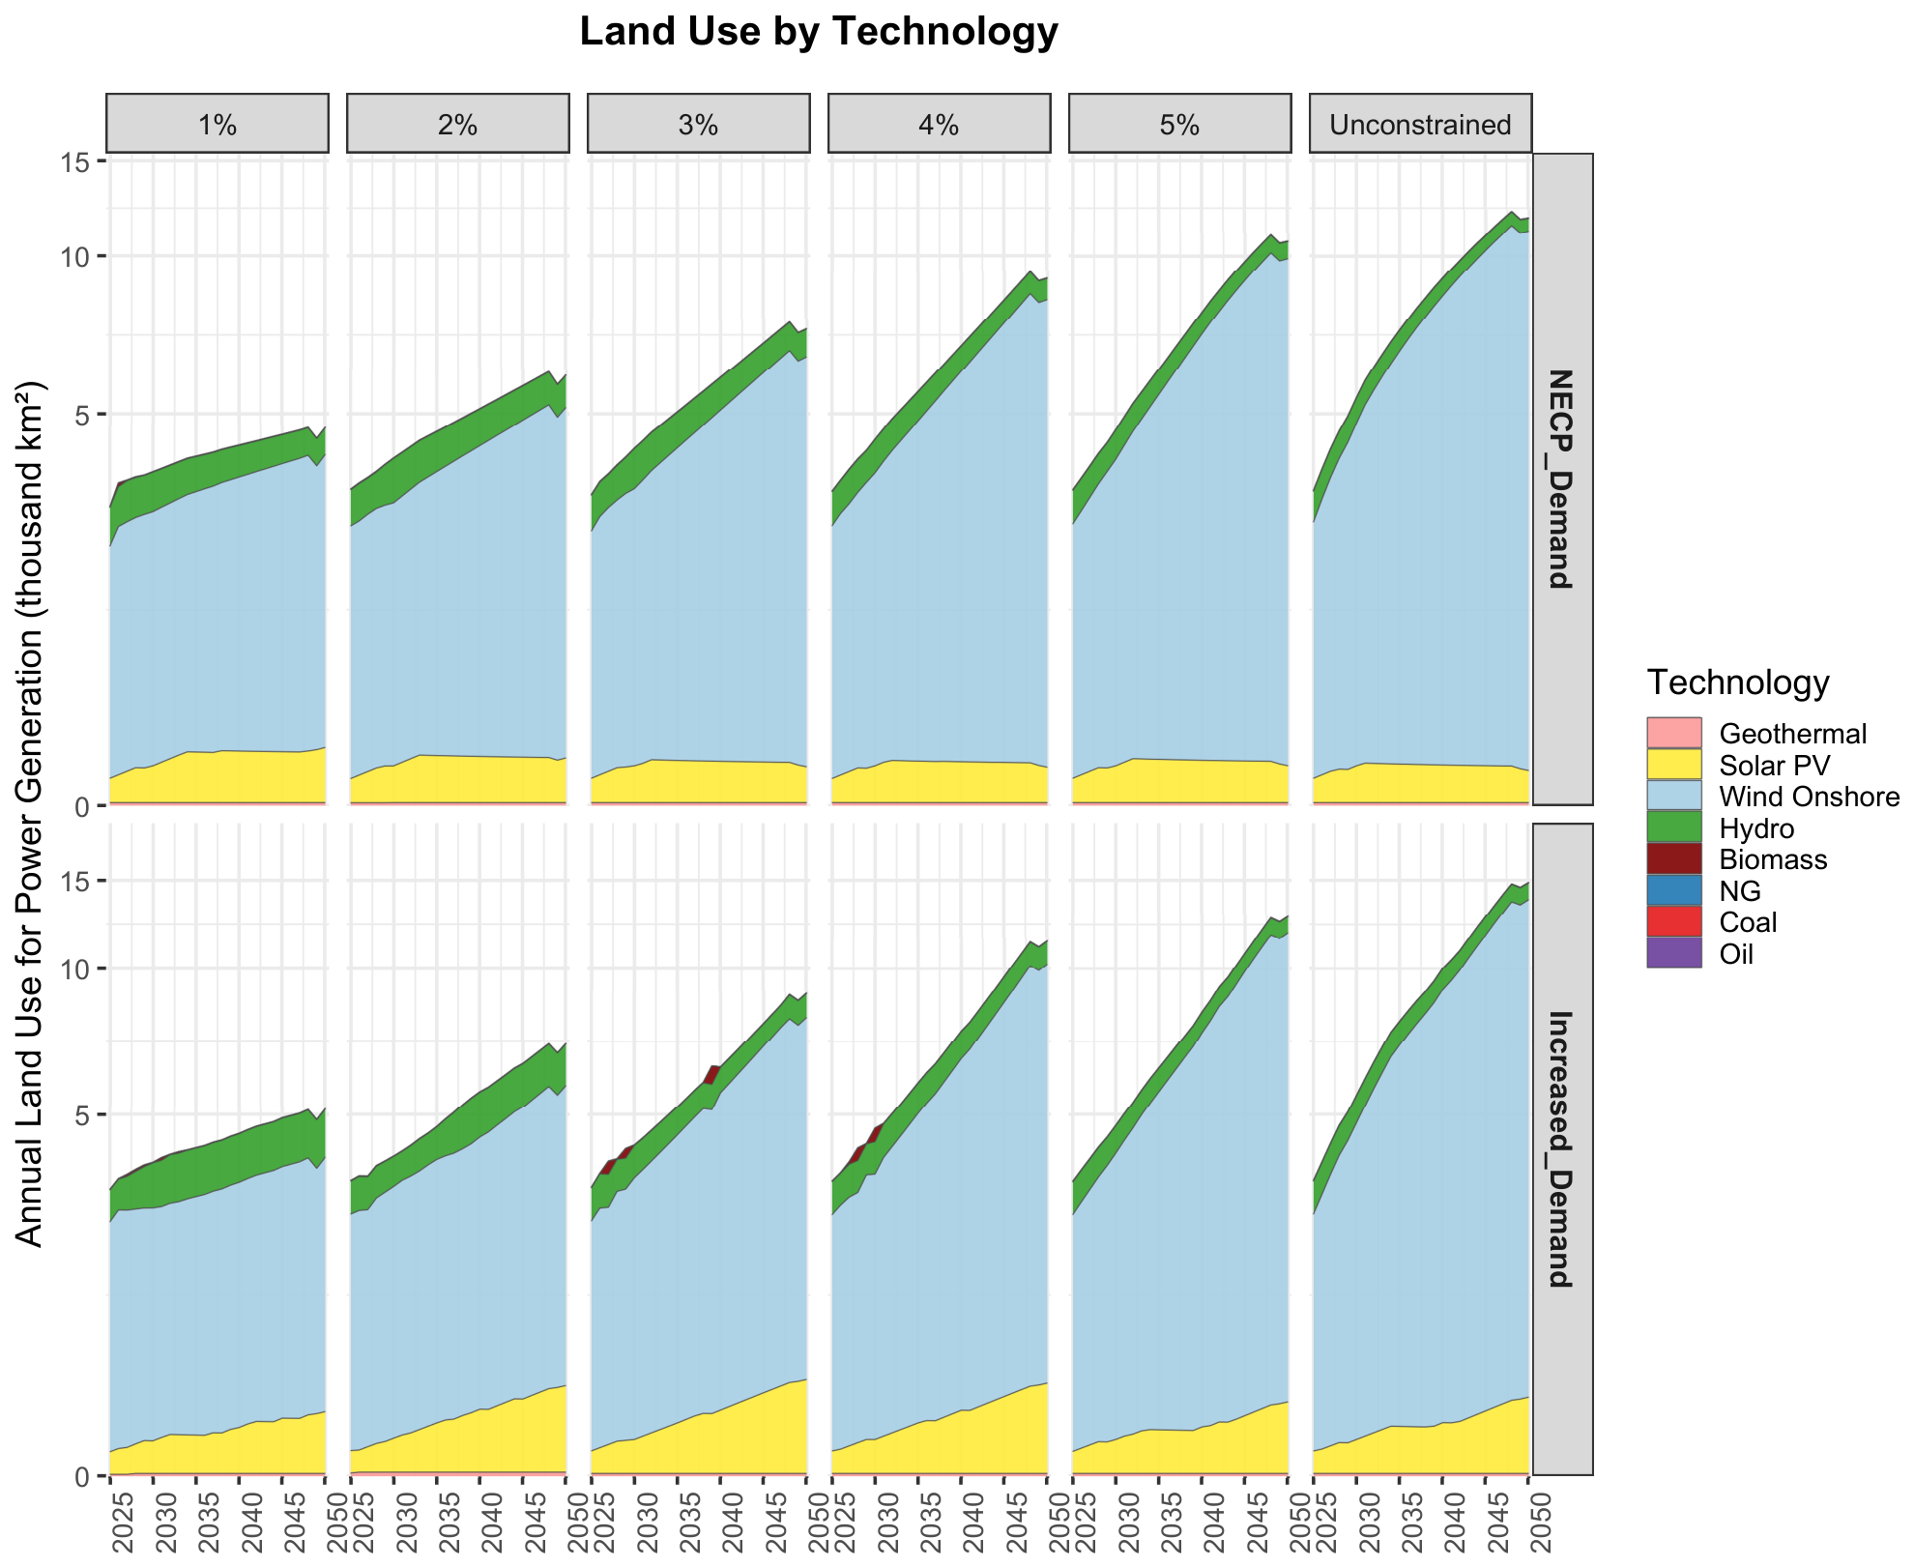
The reconfiguration of the cost-optimal power mix also alters the distribution of land occupied for power generation across technologies. The main trend observed is a shift from onshore wind toward hydropower and solar PV. This happens because the share of hydropower and solar PV technologies in the power mix increases (as discussed above) and the share of onshore wind decreases under land constraints, thereby changing the relative amount of occupied land. These trends can be observed in
Figure 7, which illustrates the annual land use for power generation in thousand km
2 across technologies, land-growth caps, and the two demand pathways. Beyond changes in the distribution of land across technologies, the figure also reveals how land-growth caps compress the feasible land-use pathway.
By 2050, the total occupied land is estimated to amount to around 5 thousand km
2 under the 1% cap, rising to roughly 9 thousand km
2 under the 3–4% caps and reaching about 11–12 thousand km
2 in the 5% and unconstrained cases under the NECP pathway. Under increased demand, the same order holds but at higher levels, reaching roughly 14–15 thousand km
2 by 2050 in the 5% and unconstrained cases while remaining closer to 5–7 thousand km
2 under the strictest cap. To put these land demands into perspective, they correspond to approximately 3.8% of Greece’s total land area under the 1% cap with NECP demand and up to about 11.6% under the land-unconstrained-case-with-increased-demand scenario [
27]. Therefore, the degree to which land-use efficiency is prioritized in energy planning can substantially affect overall land requirements and, potentially, the feasibility of power-sector decarbonization pathways.
As noted above, the unequal composition of land occupation reflects the land intensity of variable renewable generators, especially onshore wind and solar PV, alongside their significant shares in the power mix. Apart from hydropower, the remaining technologies account for a comparatively small share of total land occupation either because they contribute only modestly to electricity generation or because their land intensity is low. Biomass and hydropower appear as relatively thin layers that vary over time, because their deployment is limited by resource availability and system-balancing roles rather than large-scale spatial expansion. Moreover, fossil-fuel-powered technologies contribute little to land use in the later years due to the imposed phase-out and transition constraints. The two demand pathways mainly differ in the extent to which they push the system toward the land ceiling. Under NECP demand, total land use increases through the 2030s and then stabilizes, with the solar PV layer flattening once the onshore wind portfolio is largely established. Under increased demand, additional domestic energy is needed beyond what constrained onshore wind can supply, leading to more sustained expansion of utility-scale PV and a continued increase in its land footprint, resulting in an almost linear rise in the PV layer.
It should be noted that
Figure 7 tracks only onshore land occupation. Technologies without onshore land requirements in the adopted accounting framework, such as offshore wind and rooftop solar PV, do not appear in the land-use stack, even though they contribute to electricity generation. Overall,
Figure 7 reflects that land scarcity is concentrated in a small number of onshore technologies, primarily onshore wind and utility-scale PV. It also shows why substitution toward non-onshore options can alleviate spatial pressure without necessarily reducing electricity supply, even though such options are not reflected in land-use accounting.
4. Conclusions and Future Work
This paper quantifies the trade-offs between clean power expansion and land requirements for Greece by endogenizing land-area impacts within a long-term, least-cost planning framework. Using OSeMOSYS-Greece with a “footprint and spacing” land-accounting approach and alternative land-availability pathways (unconstrained versus capped annual land-use growth) under distinct electricity-demand trajectories, we produce a consistent ensemble of decarbonisation pathways that satisfy the imposed phase-out and clean-power targets while explicitly respecting land constraints. Across the scenario ensemble, land availability emerges as a binding system-design constraint rather than a passive post-processing metric: tightening land caps reshapes the cost-optimal technology portfolio and the temporal pattern of deployment.
The results highlight the strong substitution effects between land-intensive and less-land-intensive renewable options when bouncing back to fossil fuels is not an option for the system. Onshore wind exhibits the greatest sensitivity to land constraints, with wind power generation declining by up to approximately 70% in 2050 between the land-unconstrained case and the most stringent land-constrained scenario. This behavior is mainly driven by the assumptions made in the analysis regarding the estimated land requirements for onshore wind. Offshore wind emerges as the primary substitute for reduced onshore wind deployment, owing to its high scalability and capacity factors, as well as zero terrestrial land requirements. In practice, however, offshore wind also faces restrictions associated with marine spatial planning, which are beyond the scope of this analysis.
Biomass and, to a lesser extent, hydropower also play important roles in power system decarbonization, particularly in the medium term. Their contribution increases as land constraints tighten but declines in the long run when greater land availability allows the expansion of more cost-effective technologies. Under highly land-constrained pathways, the system also expands into alternative technologies—most notably concentrated solar power (CSP). We also found that land constraints can delay the energy transition by prolonging the use of fossil-fuel–based technologies, which exhibit lower land intensity. The delayed decarbonization can lead to a more abrupt decarbonization of the power sector at later dates, thereby raising feasibility and energy security concerns. In our modeling framework, however, this effect is allowed only to a limited extent, as the primary focus of the analysis is to examine substitution dynamics among clean technologies with differing land intensities.
Furthermore, improving land-use efficiency in the power sector while meeting the same decarbonization targets comes at the expense of higher total system costs, which we found increase in a non-linear fashion. Specifically, while total system costs rise by less than 1% under mild land constraints, as constraints become more stringent, they increase at higher rates. Furthermore, we found that integrated energy–land planning can have a huge impact on the land requirements of the power sector. Specifically, in a land-unconstrained pathway, total land occupation for the needs of power generation reaches approximately 11% of Greece’s total land area by 2050. Conversely, under highly stringent land constraints, this requirement can be reduced to roughly 3%. Beyond affecting the overall level of land requirements, integrated land–energy planning also alters the distribution of occupied land across technologies. In the unconstrained pathway, onshore wind accounts for as much as 93% of total occupied land in 2050, with solar PV and hydropower contributing only 7% and 1%, respectively. In highly land-constrained scenarios, however, the share of onshore wind declines to 73%, while the shares of solar PV and hydropower increase to 15% and 11%, respectively.
In general, explicitly internalizing land constraints improves the robustness and policy relevance of transition pathways in land-constrained contexts, highlighting the importance of coordinating energy policy, spatial planning, and permitting so that land scarcity does not become an avoidable bottleneck for clean-energy expansion. Unlike earlier studies, the present analysis, by focusing on a Mediterranean power system, reflects the strong trade-offs between clean-energy development and land availability as well as the reconfiguration of the cost-optimal renewable power technologies against various land constraints.
The results suggest that land availability should be treated as a core planning constraint from the outset in power-sector decarbonization strategies rather than as a secondary issue assessed after technology pathways have already been defined. Second, the strong substitution toward offshore wind under tighter land constraints indicates that policymakers should consider offshore deployment, marine spatial planning, and related permitting frameworks strategically important components of low-carbon transition planning in land-constrained contexts. Third, the results show that protecting land from extensive energy development is not cost-neutral but requires accepting higher total system costs in exchange for lower territorial occupation. This implies that decisions on land-use restrictions should be evaluated together with their economic consequences rather than in isolation. More broadly, the analysis highlights the need for stronger coordination between energy policy, spatial planning, and regulatory institutions so that decarbonization targets remain both economically credible and territorially feasible.
The findings also have several practical implications for policymakers and other stakeholders involved in long-term energy planning. Notably, “optimal”, least-cost pathways, when accounting for additional externalities or risks (e.g., energy security and social acceptability), may not be the strategies of choice for policy makers. For this reason, it is critical to evaluating power sector strategies not only in terms of desirability (e.g., economic efficiency) but also from the perspective of resilience, thereby identifying pathways that perform adequately against a wide variety of considerations. Here, we focus on land availability, revealing the impact it may have on the cost-optimal system configurations when treated as a driver of resulting pathways. Similarly, energy planning could factor in additional considerations beyond land requirements that may be important for decision-makers or may have a significant impact on energy planning, such as water demand [
28] or critical mineral requirements [
29].
This analysis comes with certain limitations. As its main goal was to examine the trade-offs between land use and clean energy, we kept constraints on technology potential and availability relatively relaxed so that we could study the solution space with a high level of granularity. In practice, though, this may be difficult to materialize. For example, onshore wind deployment reaches relatively high levels in the land-unconstrained case. This, in turn, reduces the role of solar PV in the power mix in these scenarios, as onshore wind exhibits a lower levelized cost of electricity (LCOE) compared to solar PV under the techno-economic assumptions adopted (see discussion above). This modeling outcome reflects the objective of the analysis—namely, to examine the trade-offs between land use and clean-energy development when land constraints are introduced. In practice, however, such large-scale onshore wind deployment may not be feasible (e.g., due to permitting or grid constraints), and therefore a more balanced power mix may be expected with higher participation from solar PV. Furthermore, this study accounts only for the terrestrial land requirements of power generation, thereby assuming there are zero land requirements for technologies such as offshore wind and rooftop solar PV. However, these technologies may also be subject to several deployment challenges, such as regulatory limitations and marine spatial constraints in the case of offshore wind. Future research should extend the framework to factor in these challenges as well, thereby making the analysis more realistic.
Furthermore, this study considers land requirements for power generation at an aggregate level. Future research could extend this analysis from an aggregated national representation of land availability to a spatially explicit planning framework that jointly considers renewable siting, emerging electricity demands (including power-to-hydrogen), and network implications. Recent evidence shows that the spatial allocation of electrolyzers can materially alter transmission reinforcement needs, congestion, and total system costs, thereby motivating coordinated planning of generation, hydrogen infrastructure, and grid expansion for 2050-style systems [
30]. In parallel, data-driven location analytics combining clustering, optimization, and explicit risk metrics (e.g., VaR/CVaR) could be used to construct empirically grounded land-availability supply curves and evaluate multi-hub deployment strategies under uncertain demand growth and siting feasibility [
31]. Finally, the deterministic perfect-foresight setting could be relaxed by embedding both exogenous uncertainties (e.g., technology costs) and endogenous, decision-dependent uncertainties (e.g., realized developable land after pilot interventions or policy actions) within multi-stage stochastic optimization, leveraging decomposition approaches to keep composite-uncertainty problems tractable [
32].