1. Introduction
Against the backdrop of the global energy transition toward clean and low-carbon sources [
1], renewable energy has emerged as a future direction of energy development due to its environmental friendliness and resource renewability [
2]. However, the inherent volatility and randomness of renewable energy sources like solar and wind power result in intermittent electricity generation. This unpredictable energy flow poses challenges for stable and continuous grid integration, potentially compromising grid security. Energy storage systems play a crucial role in flexibly regulating power distribution, thereby ensuring the stable operation of the power grid [
3].
Energy storage is a device capable of bidirectional conversion between electrical and chemical energy, playing an indispensable regulatory role in energy systems. It effectively smooths fluctuations in renewable energy output and balances peak-to-valley variations in user loads, significantly reducing curtailment of wind and solar power while enhancing the reliability and stability of energy system operations [
4,
5,
6]. As energy storage technologies become increasingly applied in the energy sector, safety concerns have also grown more prominent. Safety incidents triggered by abnormal operating conditions such as overcharging and over-discharging occur frequently, not only causing economic losses but also posing serious threats to public safety. According to the incomplete statistics of the industry database of China Chemical and Physical Power Supply Association (CESA), 87 accidents have occurred in energy storage power stations since November 2009, including user-side, power-side, grid-side, and other types of energy storage power stations. On 5 September 2024, one of the 24 battery storage containers of the U.S. San Diego Gas & Electric Company (SDG&E) caught fire; on 10 September 2024, a lithium battery exploded in Ali Yun’s Niigata Phi data center, causing service disruptions for related technology companies; and on 23 September 2024, a lithium battery container caught fire at the Port of Montreal terminal in Canada. In recent years, as the share of energy storage in the energy system has increased, the number of accidents related to energy storage systems has also increased.
The safety of energy storage systems diminishes with increasing charge–discharge cycles and aging of insulating components [
7,
8,
9]. Therefore, real-time status monitoring and fault detection are critical for energy storage systems. From the perspective of energy storage system structure, the battery system is the core of the entire energy storage system [
10], which is composed of hundreds of electric cells connected in series and parallel. To meet load voltage and power requirements, hundreds or thousands of cells connected in series and parallel form the core of the energy storage system—the battery pack. Due to minute variations in cell manufacturing and the impact of different operating environments, inconsistencies arise in internal cell impedance and charge and discharge states. To prevent overcharging and over-discharging, the performance and lifespan of energy storage systems are constrained by the weakest cell [
11], adhering to the law of the least. This significantly impacts the charging and discharging efficiency of the energy storage system [
12].
Therefore, analyzing and researching the consistency of energy storage systems holds significant practical and applied value [
13,
14]. From the current state of research, studies on the consistency of energy storage systems remain relatively scarce, with most focusing on fault identification and early warning for these systems.
For consistency monitoring [
15], the methodology can be divided into statistical-based methods and machine learning-based methods [
11]. Although these techniques have been widely studied, their limitations motivate the development of more robust and uncertainty-aware solutions.
Statistical methods, such as differential voltage analysis, standard deviation monitoring, and rule-based thresholds, are computationally efficient and easy to implement. However, their performance heavily depends on manually defined thresholds, which are sensitive to operating conditions, noise levels, and aging states. As a result, these methods often suffer from either excessive false alarms or missed detections when applied to large-scale energy storage systems with dynamic load profiles. More importantly, threshold-based techniques typically provide binary decisions without quantifying uncertainty, limiting their reliability in early-stage or borderline inconsistency scenarios.
Machine learning-based approaches attempt to overcome rigid thresholds by learning data patterns automatically. Clustering and distance-based methods can capture similarity relationships among cells, while supervised models achieve high accuracy under labeled conditions. Nevertheless, most existing ML methods implicitly assume clean data and balanced samples, and their decisions are often opaque and deterministic. In practice, battery data are noisy, incomplete, and affected by operational variability, which can significantly degrade model stability. Moreover, many ML approaches focus on classification accuracy alone and lack mechanisms to explicitly represent uncertainty, making them vulnerable to misclassification when cell behaviors overlap.
The most used statistical-based method is the threshold method, which establishes safety threshold ranges for critical parameters such as voltage and temperature, continuously monitoring deviations between individual cells and the average performance of the energy storage system. This approach relies heavily on the rationality of threshold selection and parameter choice, requiring adjustments to thresholds over time and based on charge and discharge states. The machine learning-based methods can be summarized into several steps, including data acquisition, feature calculation and extraction, and inconsistent evaluation [
11]. In the data acquisition process, signals such as voltage and temperature are acquired. During the feature calculation and extraction stage, parameters such as state of charge and internal resistance are calculated, and parameters irrelevant to consistency diagnosis are removed. In the inconsistent evaluation phase, two types of evaluation methods, regression methods and classification methods, are used for evaluation. Ref. [
16] proposes a data-driven method with charging rate, temperature, state of charge, and accumulated driving mileage as the inputs. Ref. [
17] adopts a capacity model based on the charging process for state of health estimation of lithium ion batteries. Ref. [
18] proposes an accurate charging model of battery energy storage, which closely approximates the real-life battery charging constraints, and this method is also a consistency detection method under laboratory conditions. Ref. [
19] designs a cyclic aging experiment scheme, and parameters such as open-circuit voltage, ohmic resistance, polarization resistance, and capacitance can be obtained during the experimental process. The parameter distributions are analyzed and merged as a decision method for consistency diagnosis. Ref. [
20] identifies ohmic internal resistance, electrochemical polarization internal resistance, and concentration difference polarization internal resistance from the real-time operating data. With the identified parameters, an improved autoregressive method is proposed to recognize inconsistencies. Ref. [
21] proposes a novel predictive energy management paradigm guided by deep reinforcement learning. By optimizing action space selection based on the degradation characteristics of the fuel cell (FC) system, the lifespan of FC is extended by 16.50%. Ref. [
22] proposes a novel energy management paradigm to achieve the comprehensive control of cabin comfort and fuel cell/battery durability. A twin delayed deep deterministic policy gradient algorithm is proposed in this paper, and the battery life is extended by at least 3.79%.
In summary, the current real-time inconsistency diagnostic methods for energy storage systems have low reliability, high misclassification rate, or no offline diagnostic methods, and there is no practical and highly accurate method for monitoring the consistency of energy storage system cores. Also, the majority of algorithms initially calculate parameters such as state of charge and internal resistance. By analyzing the distribution of these calculated parameters, the inconsistencies of cells can be identified. Nevertheless, the estimation of such parameters is typically subject to a certain degree of error, and such errors can also affect the consistency diagnosis results. Taking this into consideration, this paper proposes a consistency diagnosis method based on measurable parameters, in which the measurable parameters refer to voltage mostly. This paper proposes a consistency monitoring method for energy storage systems within a clustering-classification framework. The method employs peak confidence clustering to extract features from sample data and utilizes classification algorithms to characterize the probability of a cell belonging to a specific category or remaining unclassified. The validation results demonstrate that the algorithm can detect inconsistencies of cells accurately, and provide the confidence level m (Ω) to measure the probability of inconsistencies.
2. Belief Peaks Evidential Clustering
The clustering algorithm used in this paper is Belief Peaks Evidential Clustering (BPEC), which is an improved algorithm based on density peak clustering (DPC). The density peak clustering algorithm is a method proposed by Alex Rodriguez in 2014 [
23,
24], and its basic idea is that the density of points around the class centers is high and the distance between the class centers is relatively high. The number of points within a region is regarded as density.
where
ρi is the density of point
i,
dij is the distance between point
i and point
j, and
dc is the cutoff distance. Here,
is the argument of the indicator function χ(·).
The relative distance is calculated as the minimum distance between the point and a point with a greater density than that of the point:
where, for the sampling point with the highest density in the data, since no point with higher density can be found, its relative distance is the maximum distance between this point and all other points:
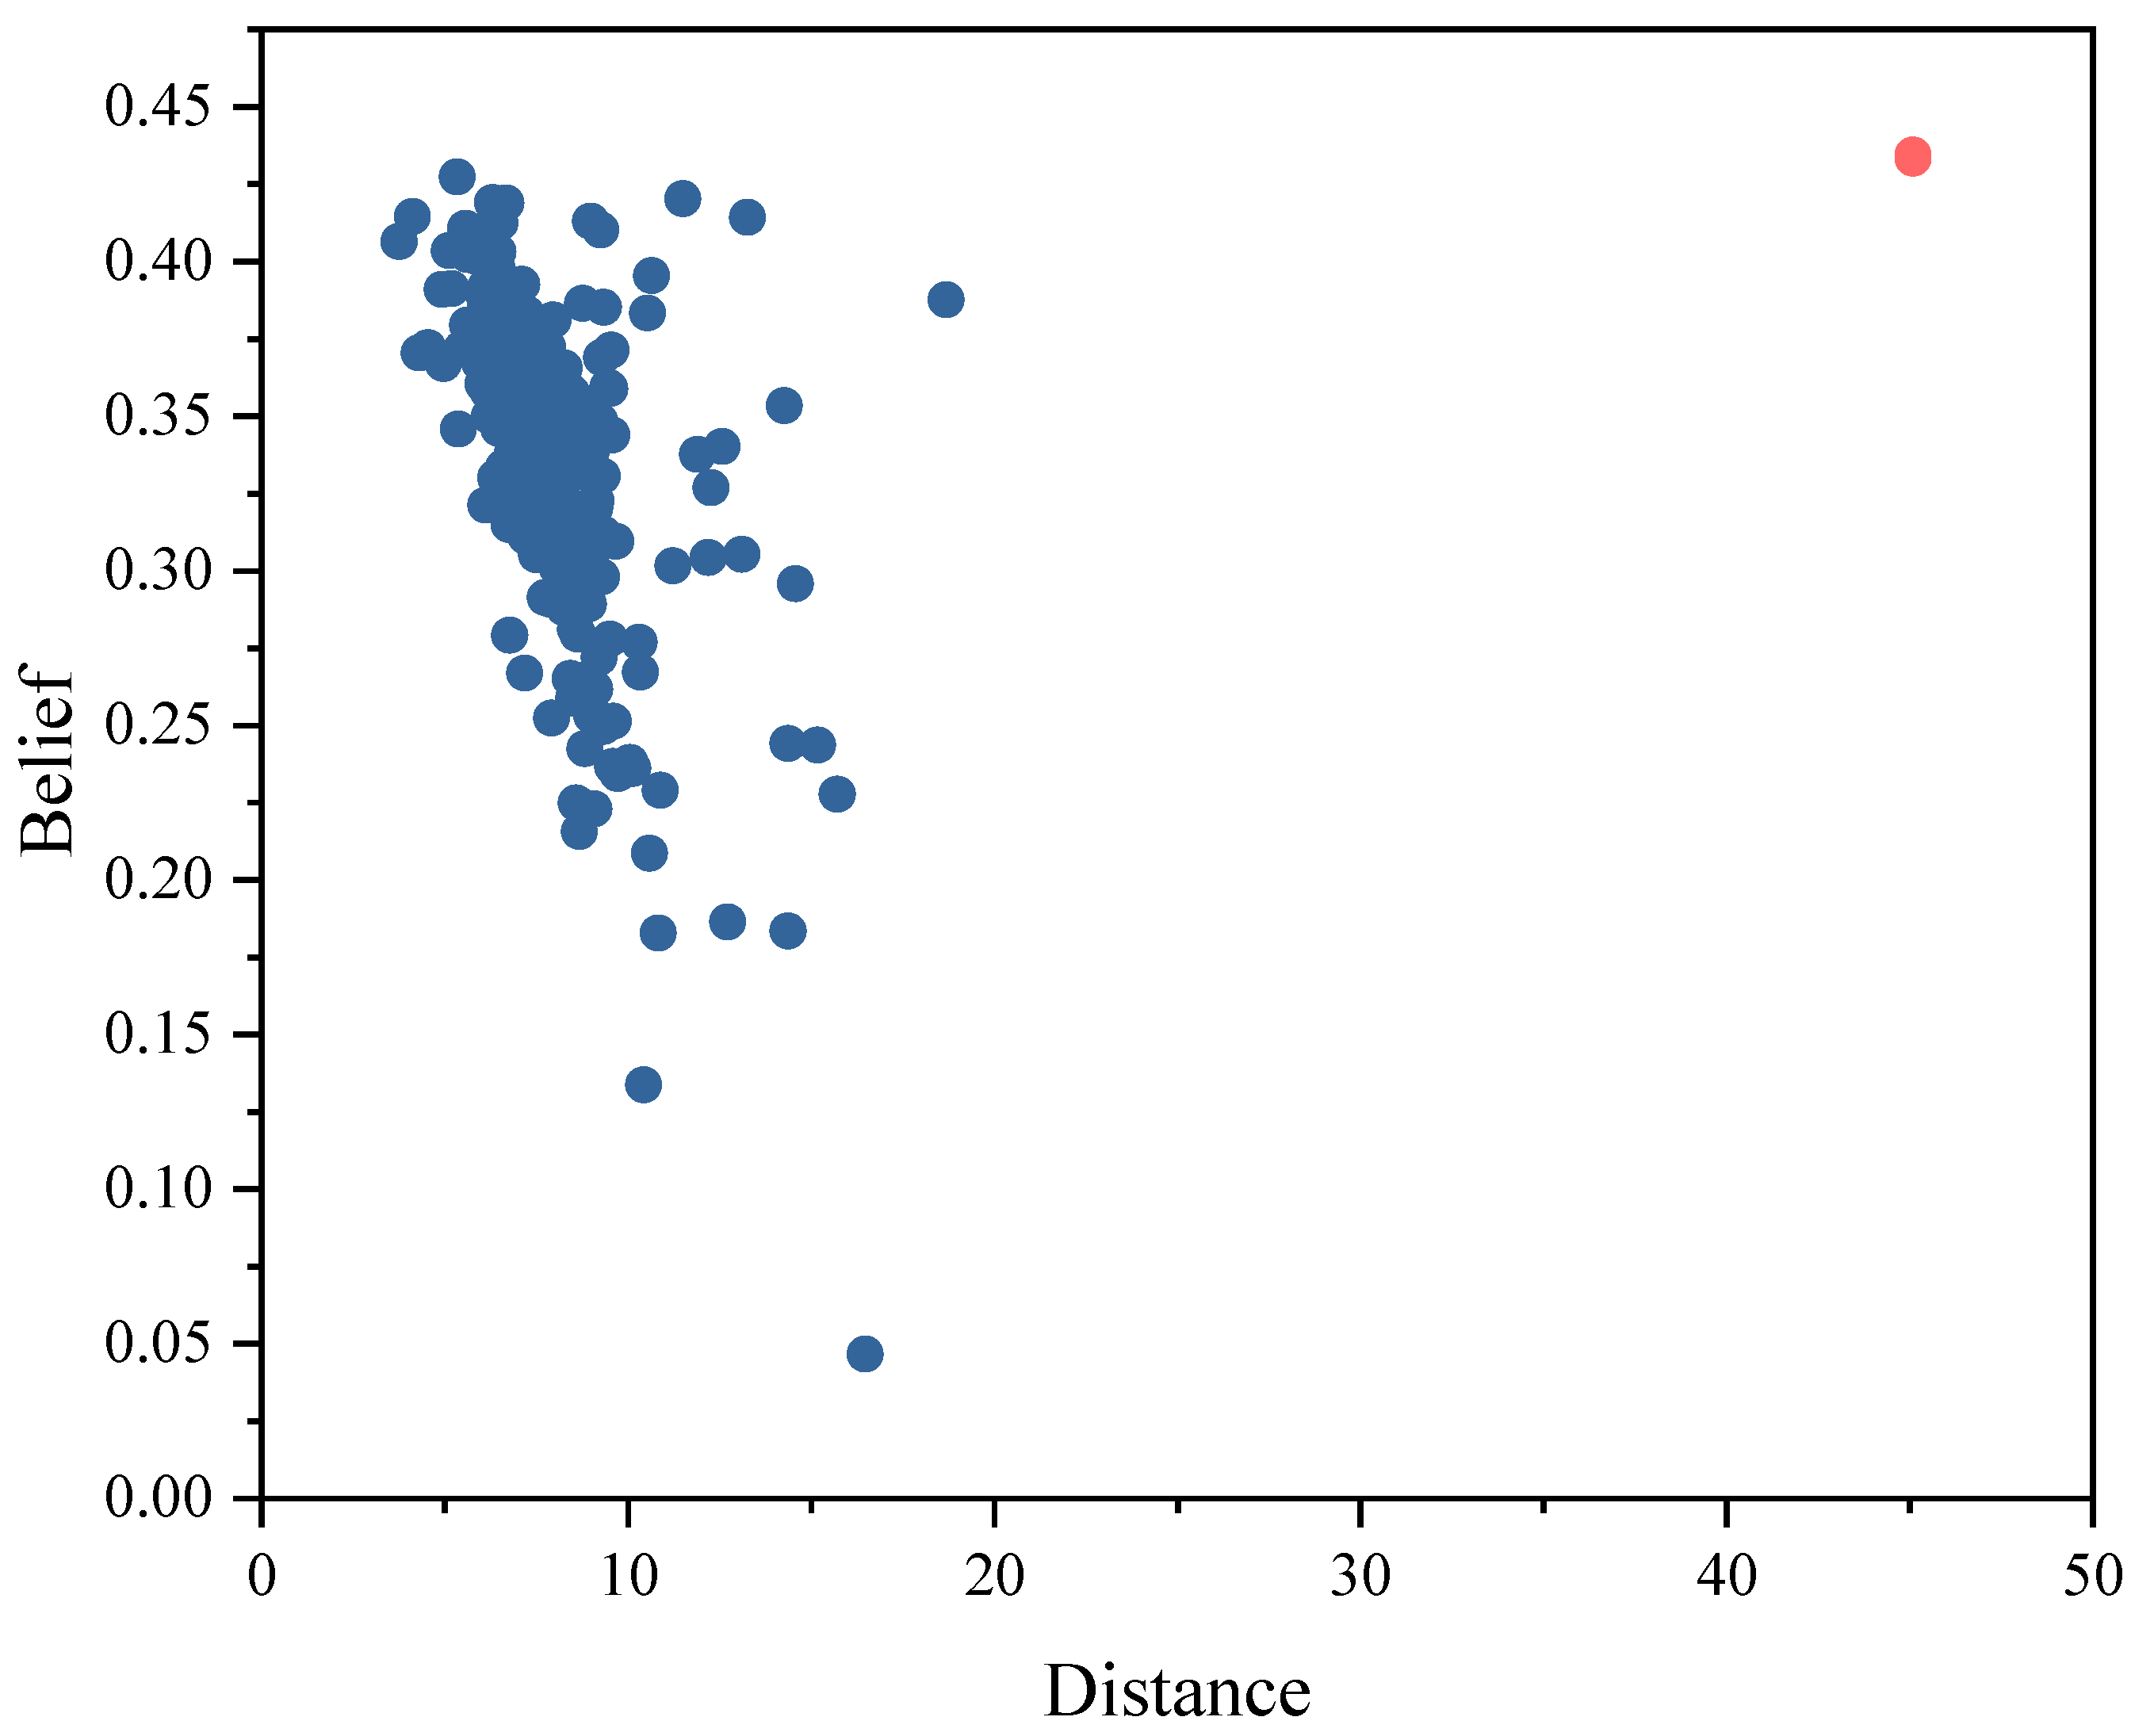
A decision map is displayed by calculating the density and distance of all sample points; the upper right corner of the decision map, which has high density and distance, is regarded as the center of the clustering. By following the above process, the algorithm can automatically determine the number of categories in the clustering process.
The BPEC algorithm is a clustering algorithm proposed on the basis of DPC [
25], by changing the density of the DPC algorithm to the confidence of becoming a class center based on the surrounding K nearest neighbors and their distances, which is discounted by evidence fusion.
The theory of evidence, Dempster–Shafer theory [
26,
27], was first proposed by Dempster in 1967 and then further refined by Shafer. The main difference between this theory and other algorithms is its ability to characterize imprecision and uncertainty. The theory differs from probabilistic theories in that it characterizes ignorance using a recognition framework Ω, which is the set of all possible values. Based on laws such as Dempster’s fusion, evidence fusion is used to process the effective new emergences that can be provided by different nearest neighbors into decisionable
BetP probability measures:
where
A is the value of the sample point, and in the clustering algorithm is whether a point is a sample point or not.
The main steps of the BPEC algorithm include determining the clustering centers and confidence divisions. The clustering center is determined by calculating the relative distance and confidence for each sample point, where the relative distance is consistent with the calculation of the DPC algorithm, and the confidence is calculated by searching for the K nearest neighbors with their closest distances around the sample point to be determined, calculating the Euclidean distances between the K nearest neighbors and the sample point to be determined, respectively, and discounting them into one piece of evidence:
where γ is the discount factor.
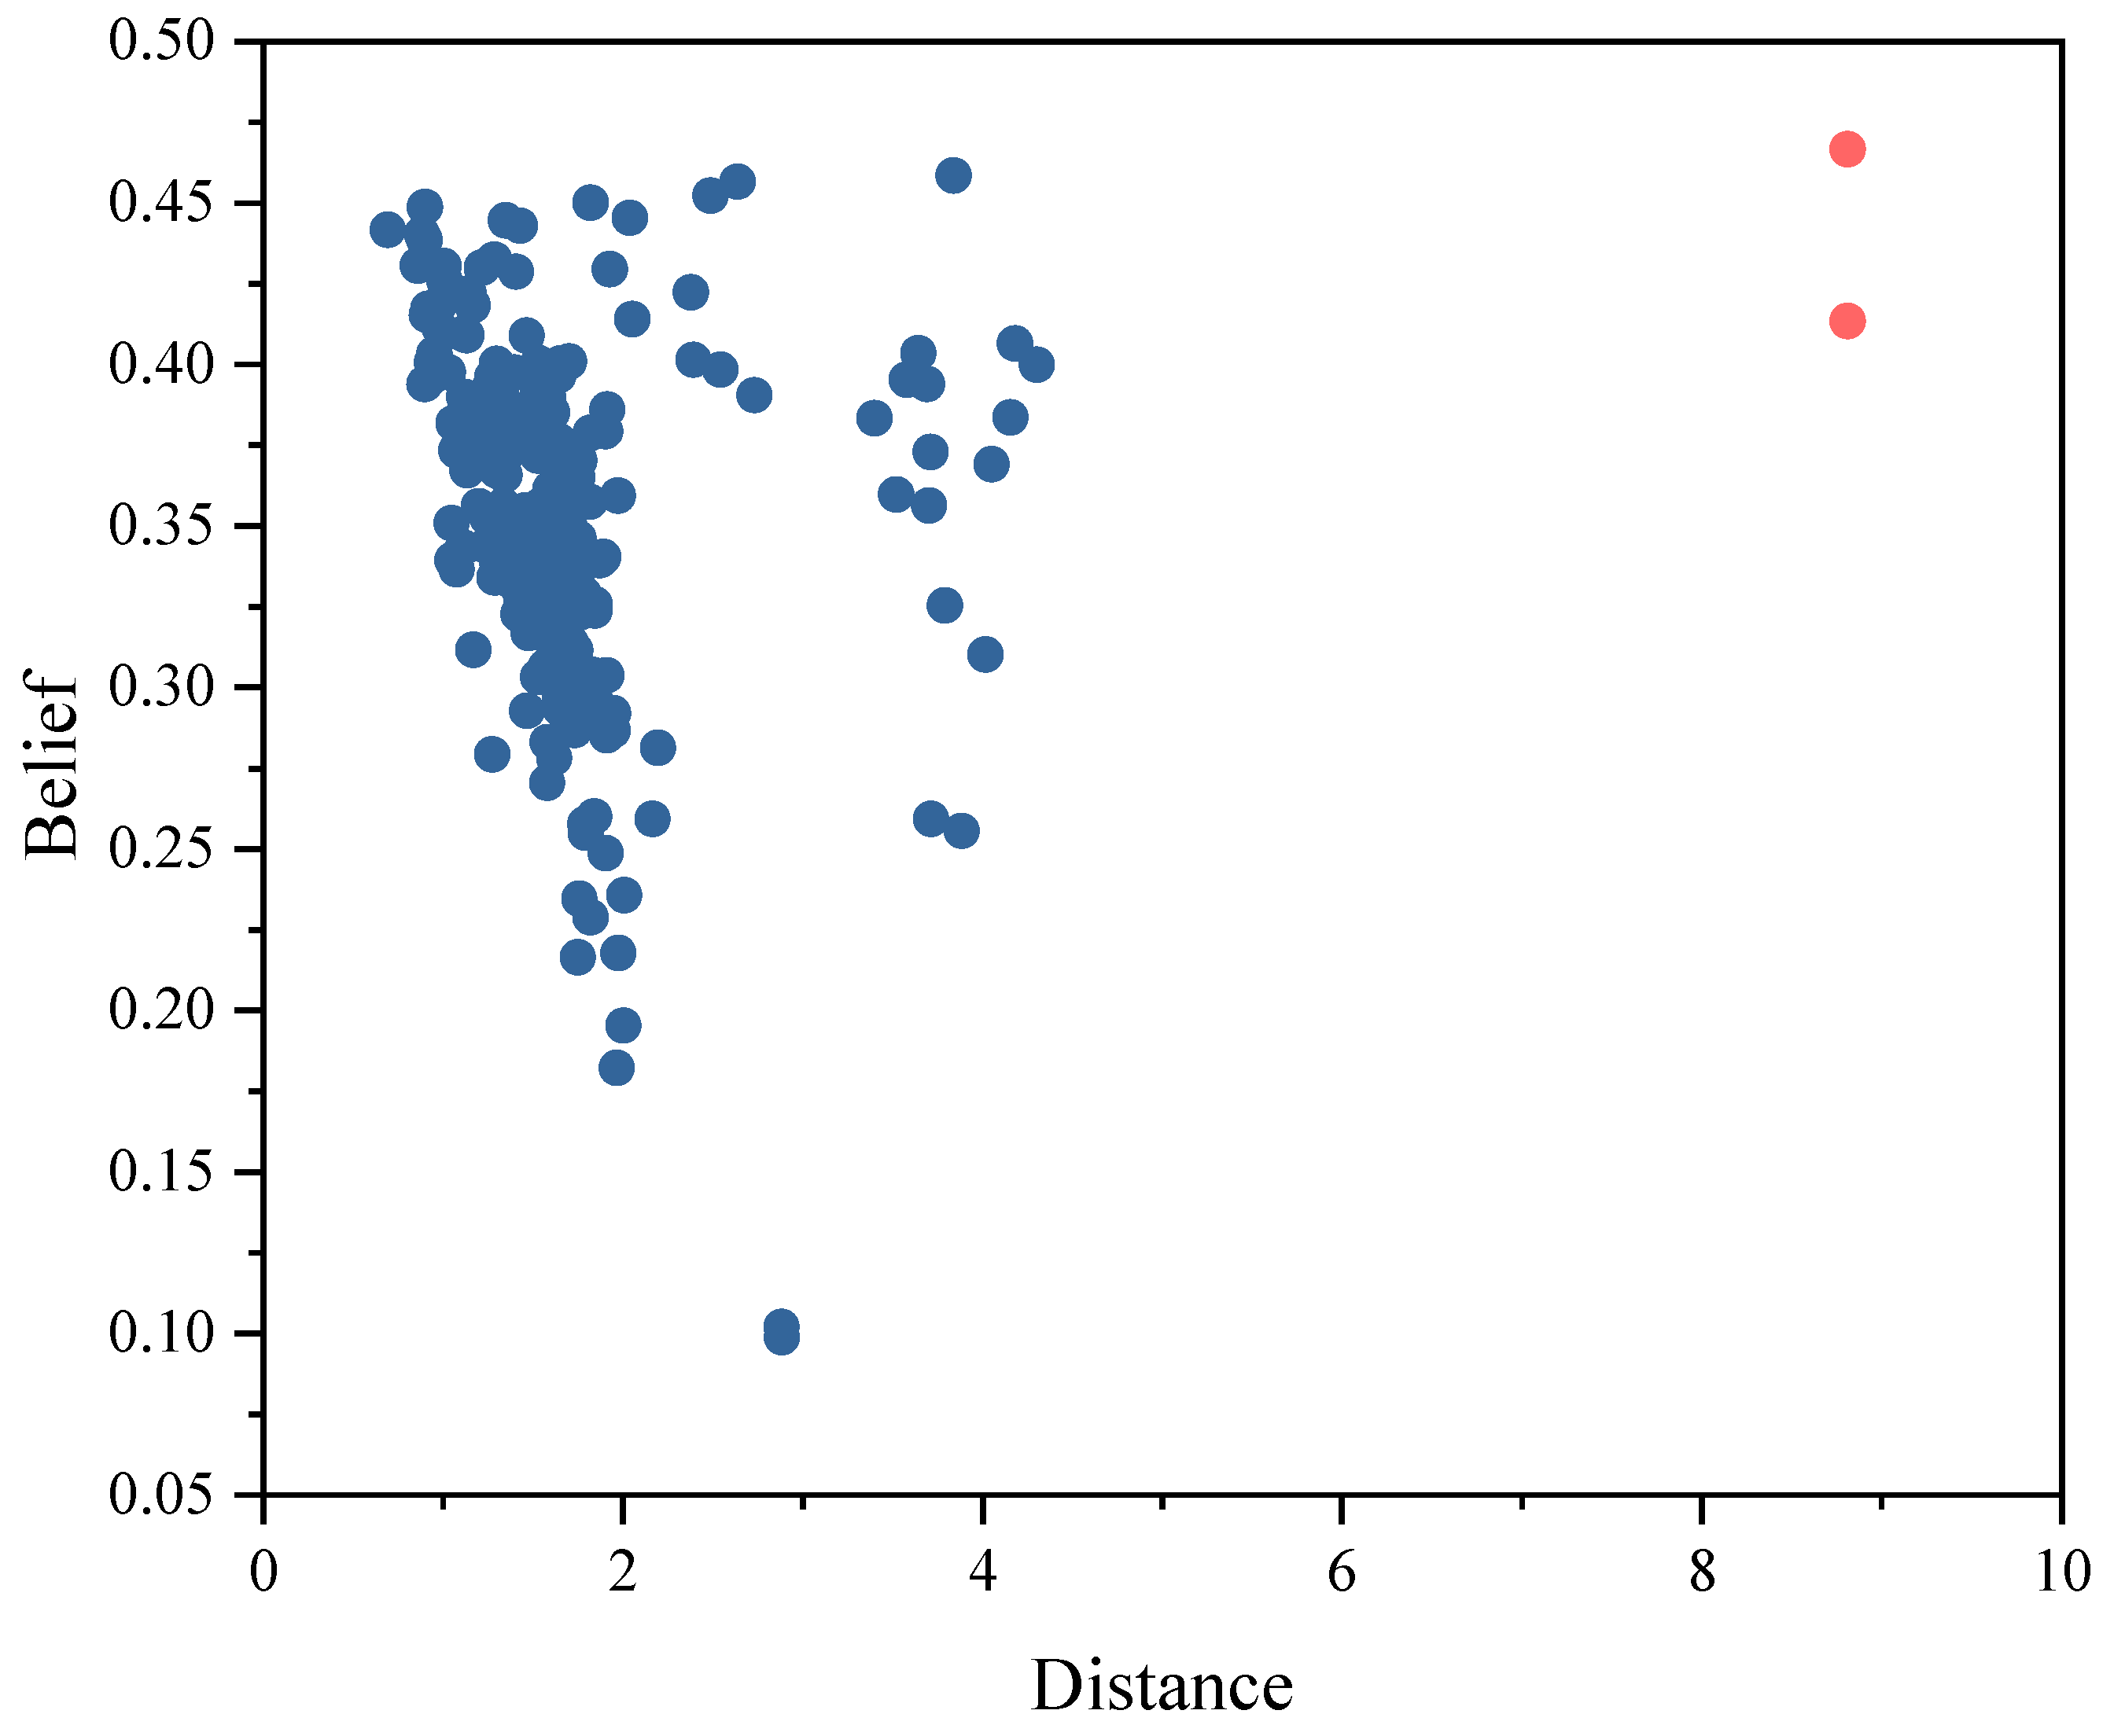
The K pieces of evidence available from the K nearest neighbors are fused to obtain the likelihood of the band determining the point to be the center of the class, the confidence level. The confidence and relative distance of each sample are used as the x-axis and y-axis to draw the decision diagram, respectively, and the sample point in the upper right corner of the decision diagram, the point with higher relative distance and confidence, is the class center. After completing the positioning of the class center, the confidence and recognition frame evidence of the sample points to be classified for each class can be calculated based on the relative distance of the sample points from the class center.
3. Evidential K-Nearest Neighbors Classification
On the basis of BPEC, the confidence of sample points for each category can be obtained, based on which the sample points to be judged are classified using the Evidential K-Nearest Neighbors (EKNN) algorithm. The EKNN classification algorithm was proposed by Denoeux [
28], which is mainly used for the classification of data with imprecise and uncertain information, and its basic concept is input similarity and output similarity. The kernel of this algorithm is the KNN algorithm, which determines the category information according to the category attributes of the K nearest neighbors around the point to be classified, and it is a hard classification. The EKNN algorithm exploits the information of the nearest neighbor points, including the distance, category, and other information on the basis of this algorithm.
The algorithm faces the situation where some sample points cannot be classified during the classification process, and its confidence for each class is at a low level, while most of the confidence is assigned to the identification frame Ω.
The specific steps of the algorithm are as follows: for the point to be classified, its distance from all points in the sample space is calculated, and K nearest neighbors is selected in accordance with the distance from the closest to the farthest; according to the distance between the point and the K nearest neighbors, based on Formula (6), the distance is converted into evidence. The K pieces of evidence obtained from the K nearest neighbors are fused:
Taking the nearest neighbors of
xs as an example, their confidence that
xs belongs to the category q is
where
K1 is the normalization factor,
I is the nearest neighbor,
ds,i is the Euclidean distance between
xs and
xi, and
α is the algorithm hyperparameter.
The confidence that
xs belongs to the identification framework Ω that can be provided by the nearest neighbors of
xs is
4. BPEC-EKNN-Based Consistency Monitoring Method for Energy Storage Cores
The main steps of the method are as follows:
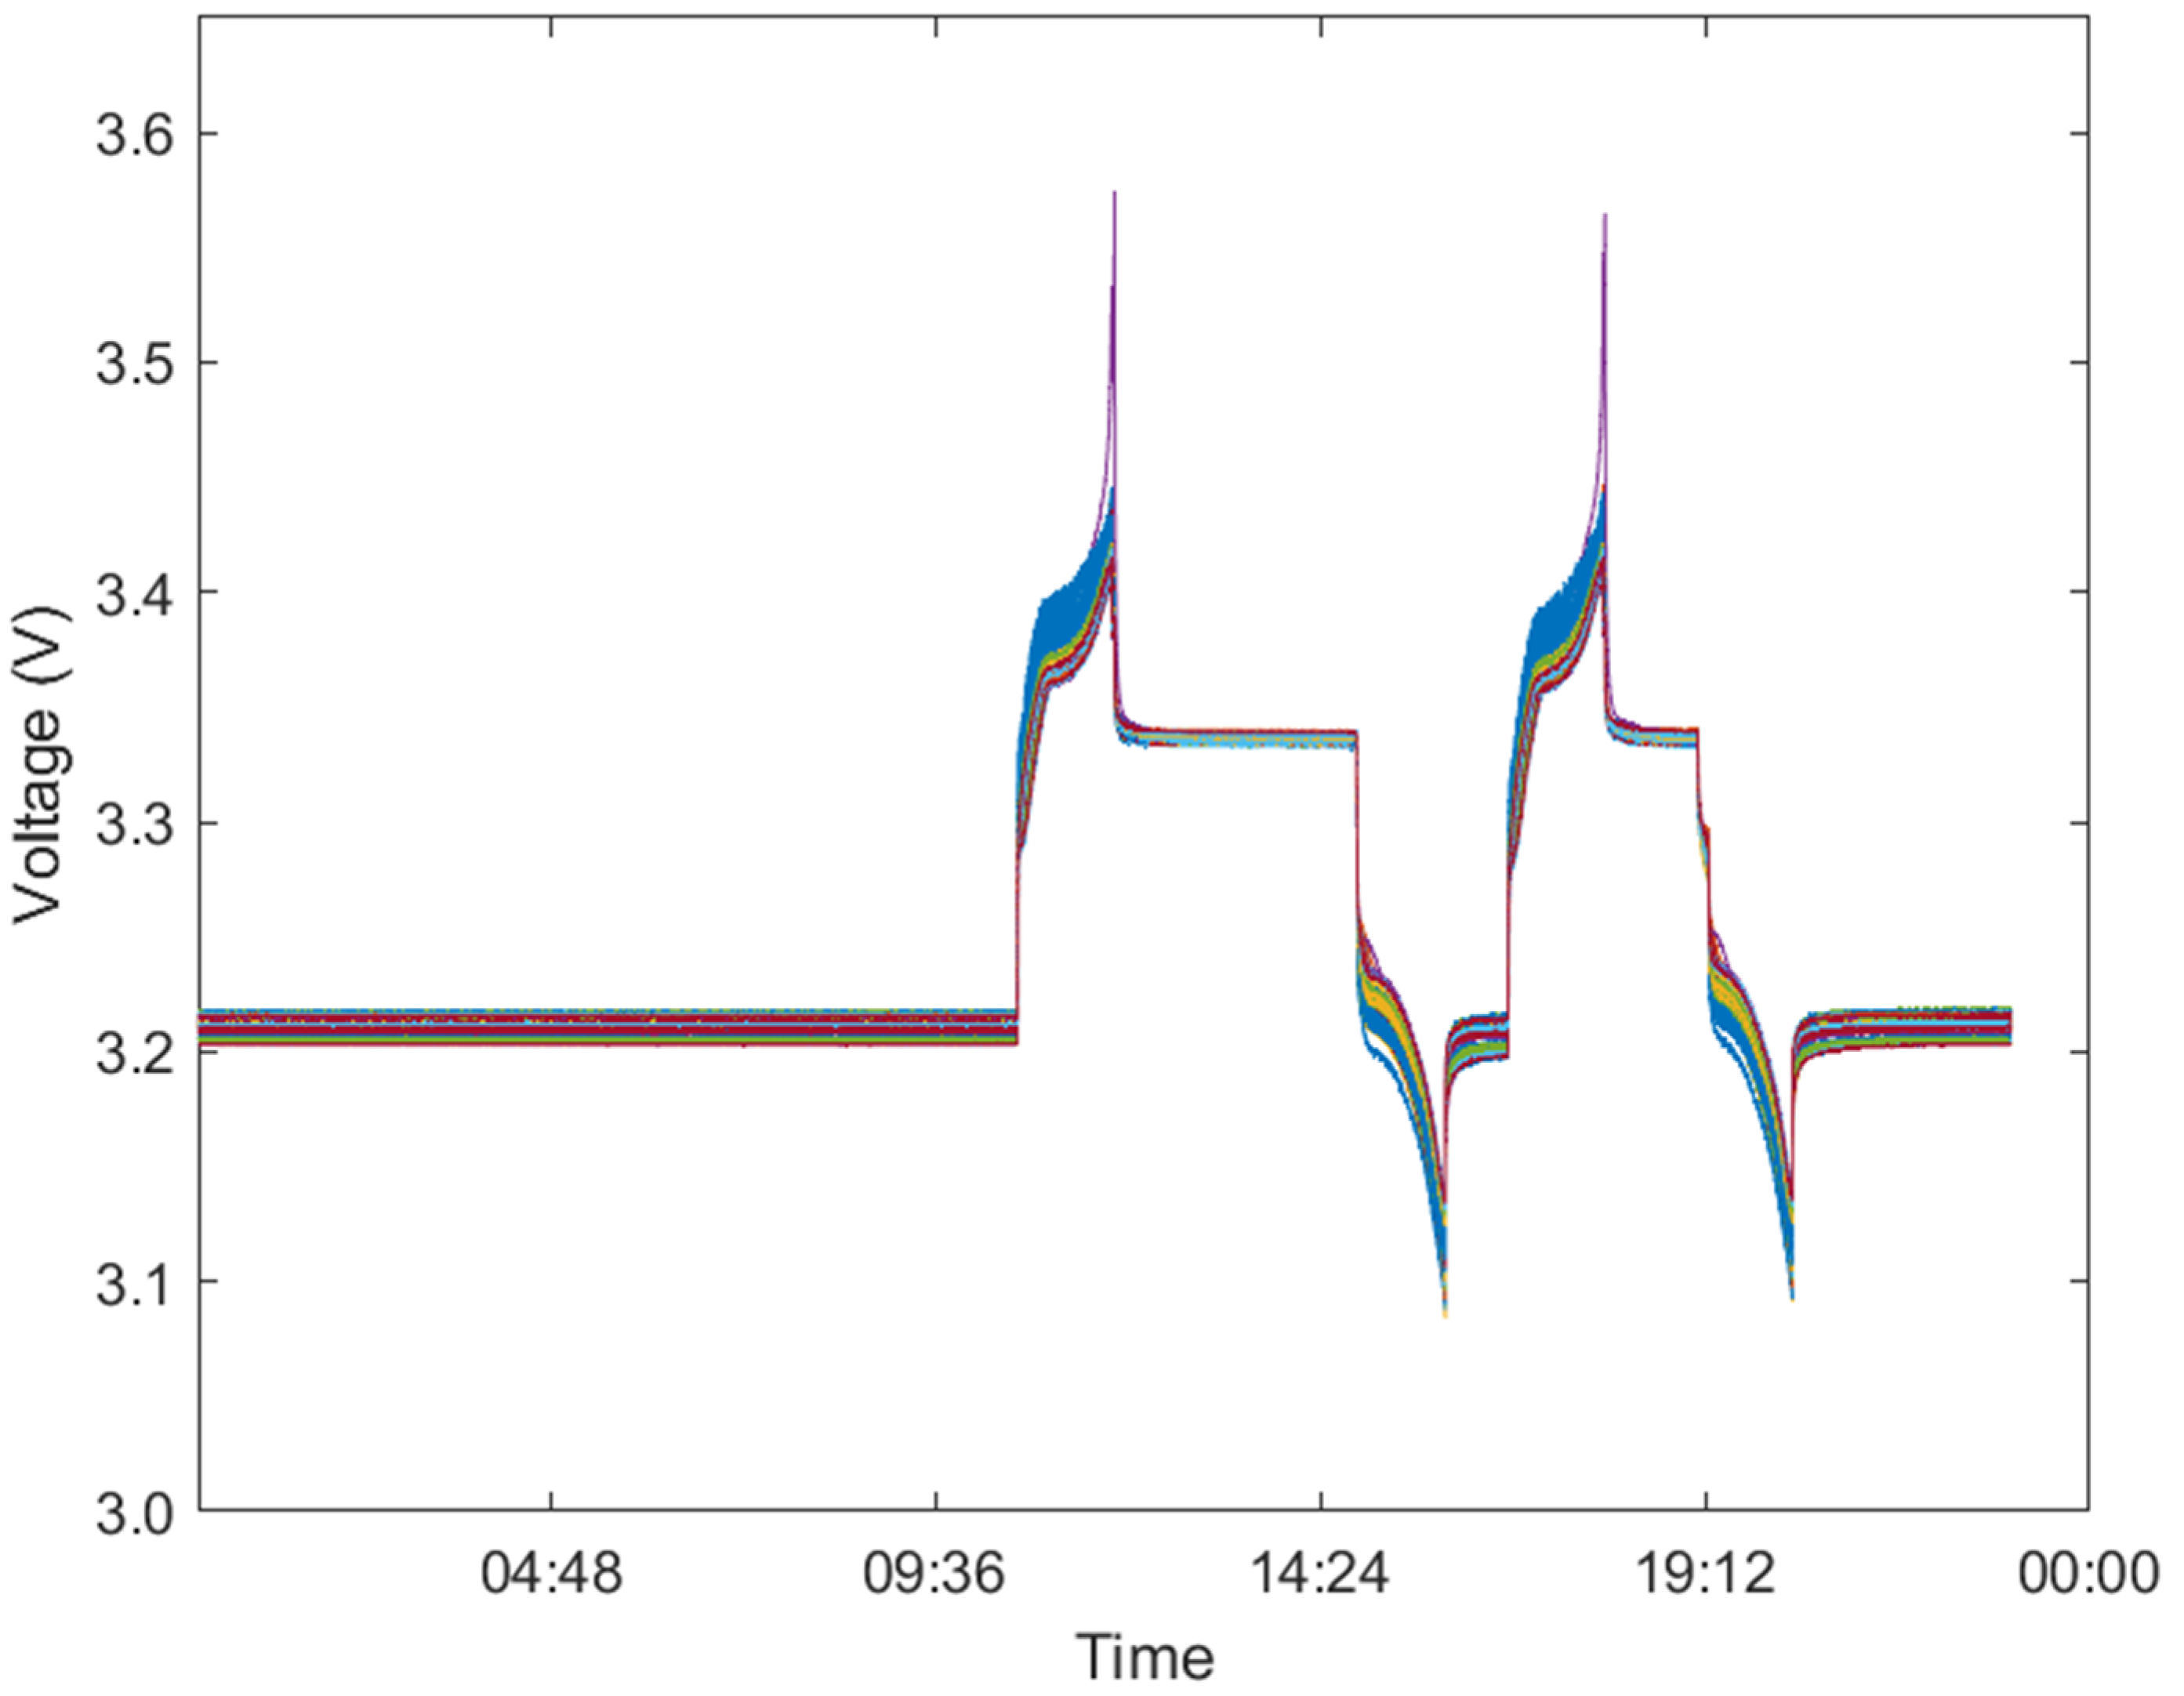
(1) Data collection, screening, and preliminary fault filtering. Collect and organize all parameters of the battery cells in the energy storage system, selecting key measurable parameters (primarily voltage) that characterize consistency status. The data is structured as time-series samples of fixed duration (e.g., 2 h windows) to capture charging/discharging dynamics.
During preprocessing, a preliminary fault filtering step is applied to remove cells exhibiting clear hardware or sensor failures, which could otherwise contaminate the dataset and inflate uncertainty in subsequent analysis. This filtering targets two types of evident faults: (i) voltages outside the physical operating range (3.0–3.7 V for the studied lithium-ion cells, based on manufacturer specifications), and (ii) extreme outliers deviating from the pack average by more than 3 standard deviations (σ), corresponding approximately to >0.1 V in this dataset, indicative of sensor malfunctions rather than operational inconsistencies.
This step is not intended for inconsistency detection but serves as a standard data quality assurance measure, akin to outlier removal in statistical analysis, ensuring the BPEC-EKNN algorithm focuses on subtle, operationally relevant inconsistencies rather than gross errors.
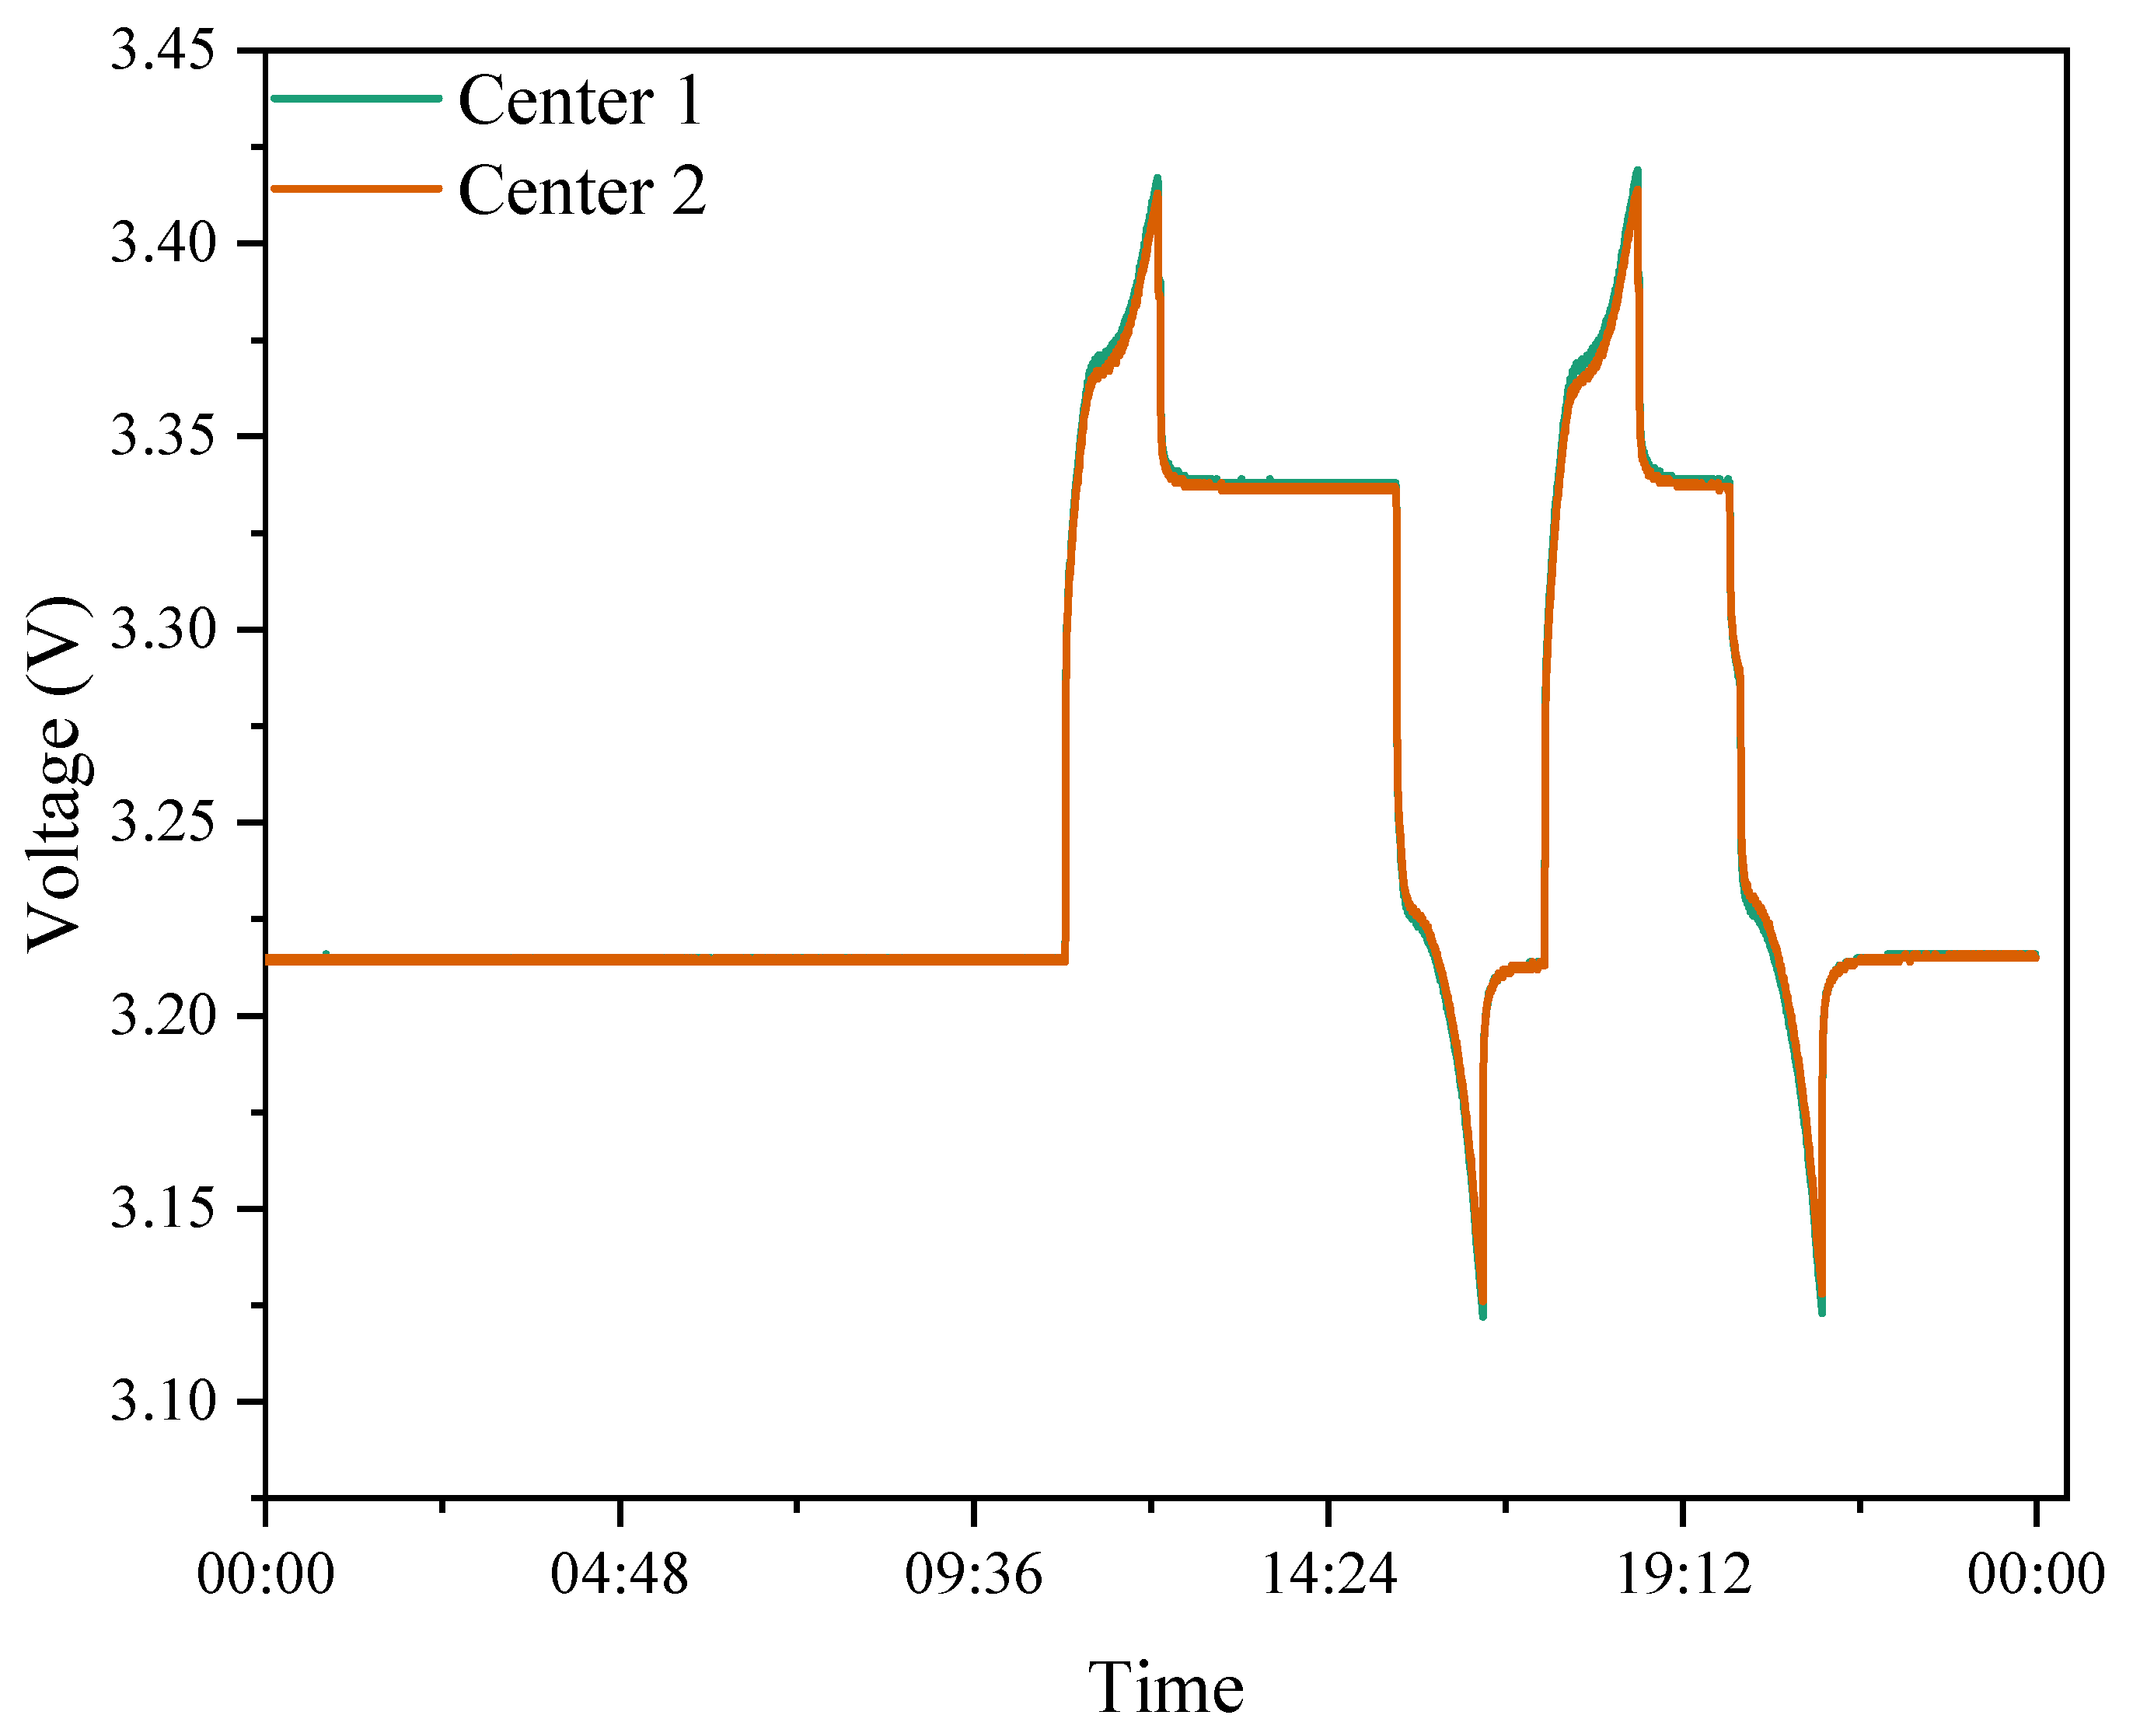
(2) Confidence and relative distance calculation. For each cell sample point (represented as a time-series voltage vector over a fixed window, e.g., 2 h), compute the relative distance δ using Equations (3) and (4) inherited from the DPC framework, and the confidence (belief) using the BPEC-specific evidence fusion in Equations (5) and (6). Plot the decision diagram with relative distance as the x-axis and confidence as the y-axis, and select points in the upper right corner as cluster centers, determining the number of cell state classes accordingly.
(3) Confidence classification and evidence base construction. According to the class centers obtained in step (2), calculate the relative distance of each cell sample point to each class center, and convert the distance to evidence according to Equation (6). Calculate the evidence of each sample point to each class and recognition framework, and use it as the battery evidence base TR.
(4) Neighborhood search for points to be classified. For each point to be classified, calculate its Euclidean distance from all points in the Battery Evidence Repository TR and use this as a basis to find its K nearest neighbors in the Battery Evidence Repository TR.
(5) Evidence fusion. Calculate the K nearest neighbors of the point to be classified (cell characteristic parameters) found in the battery evidence base TR in terms of distance, discount this distance according to Equation (6) to obtain K pieces of evidence, and fuse the K pieces of evidence according to Equations (7)–(9).
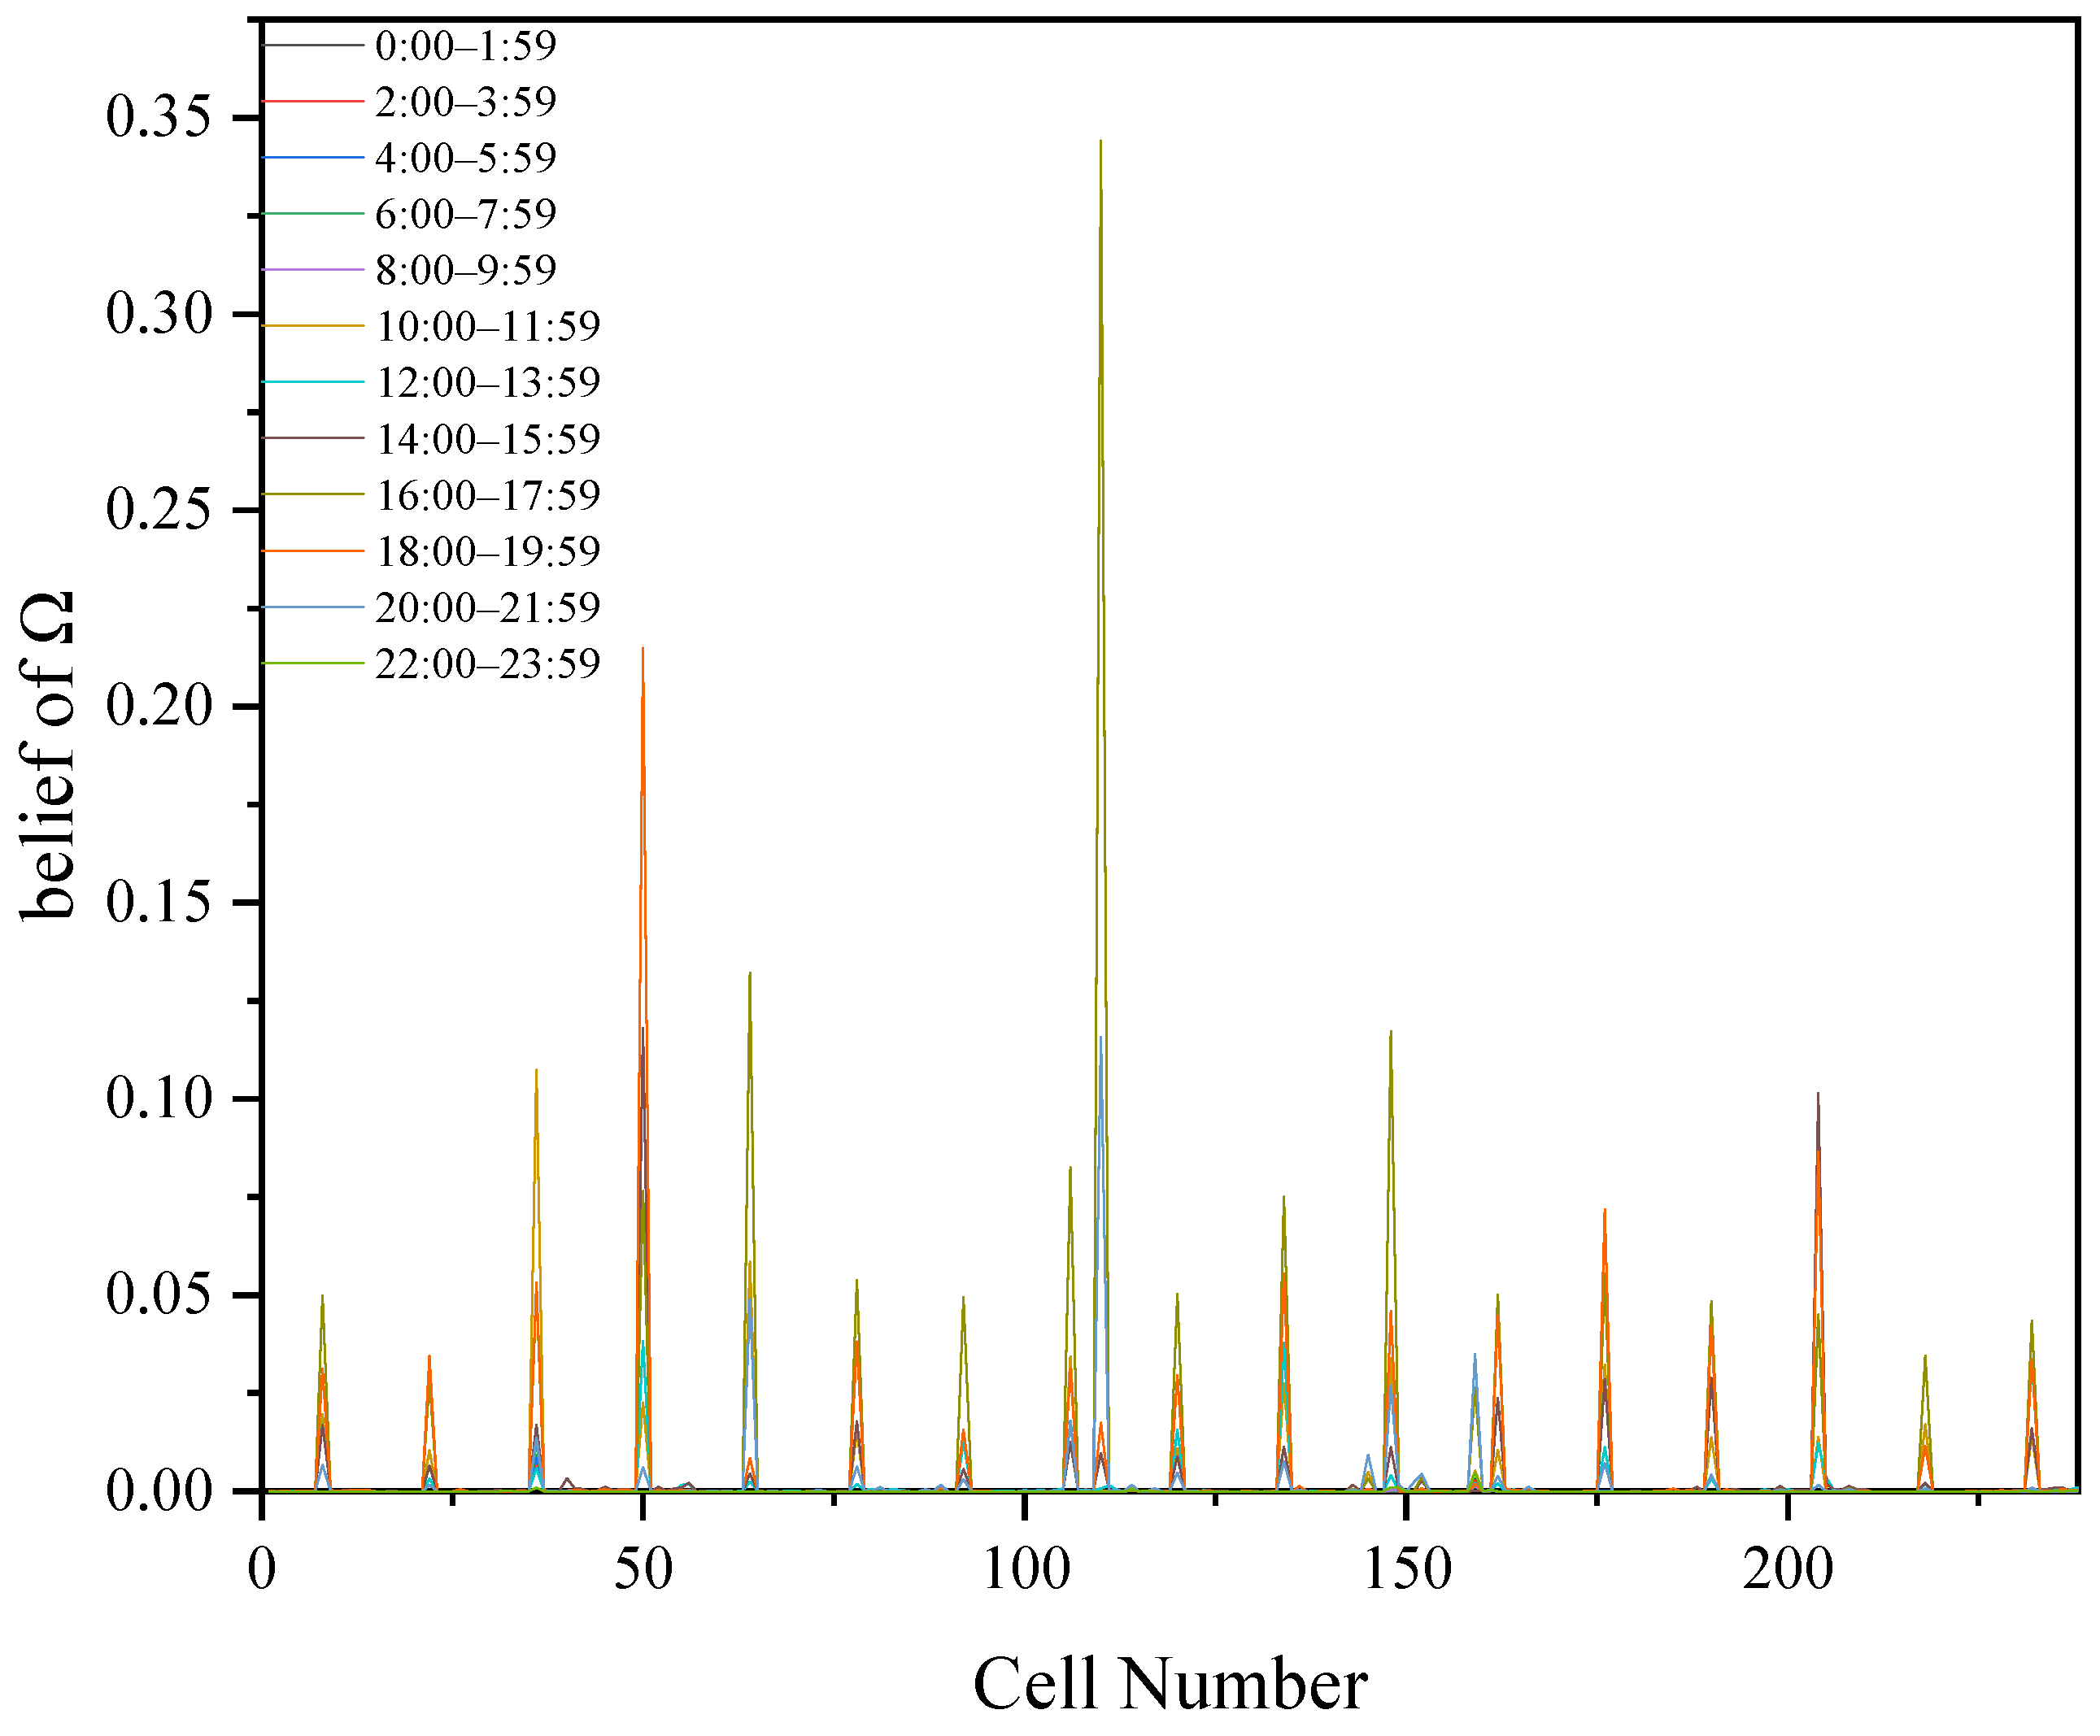
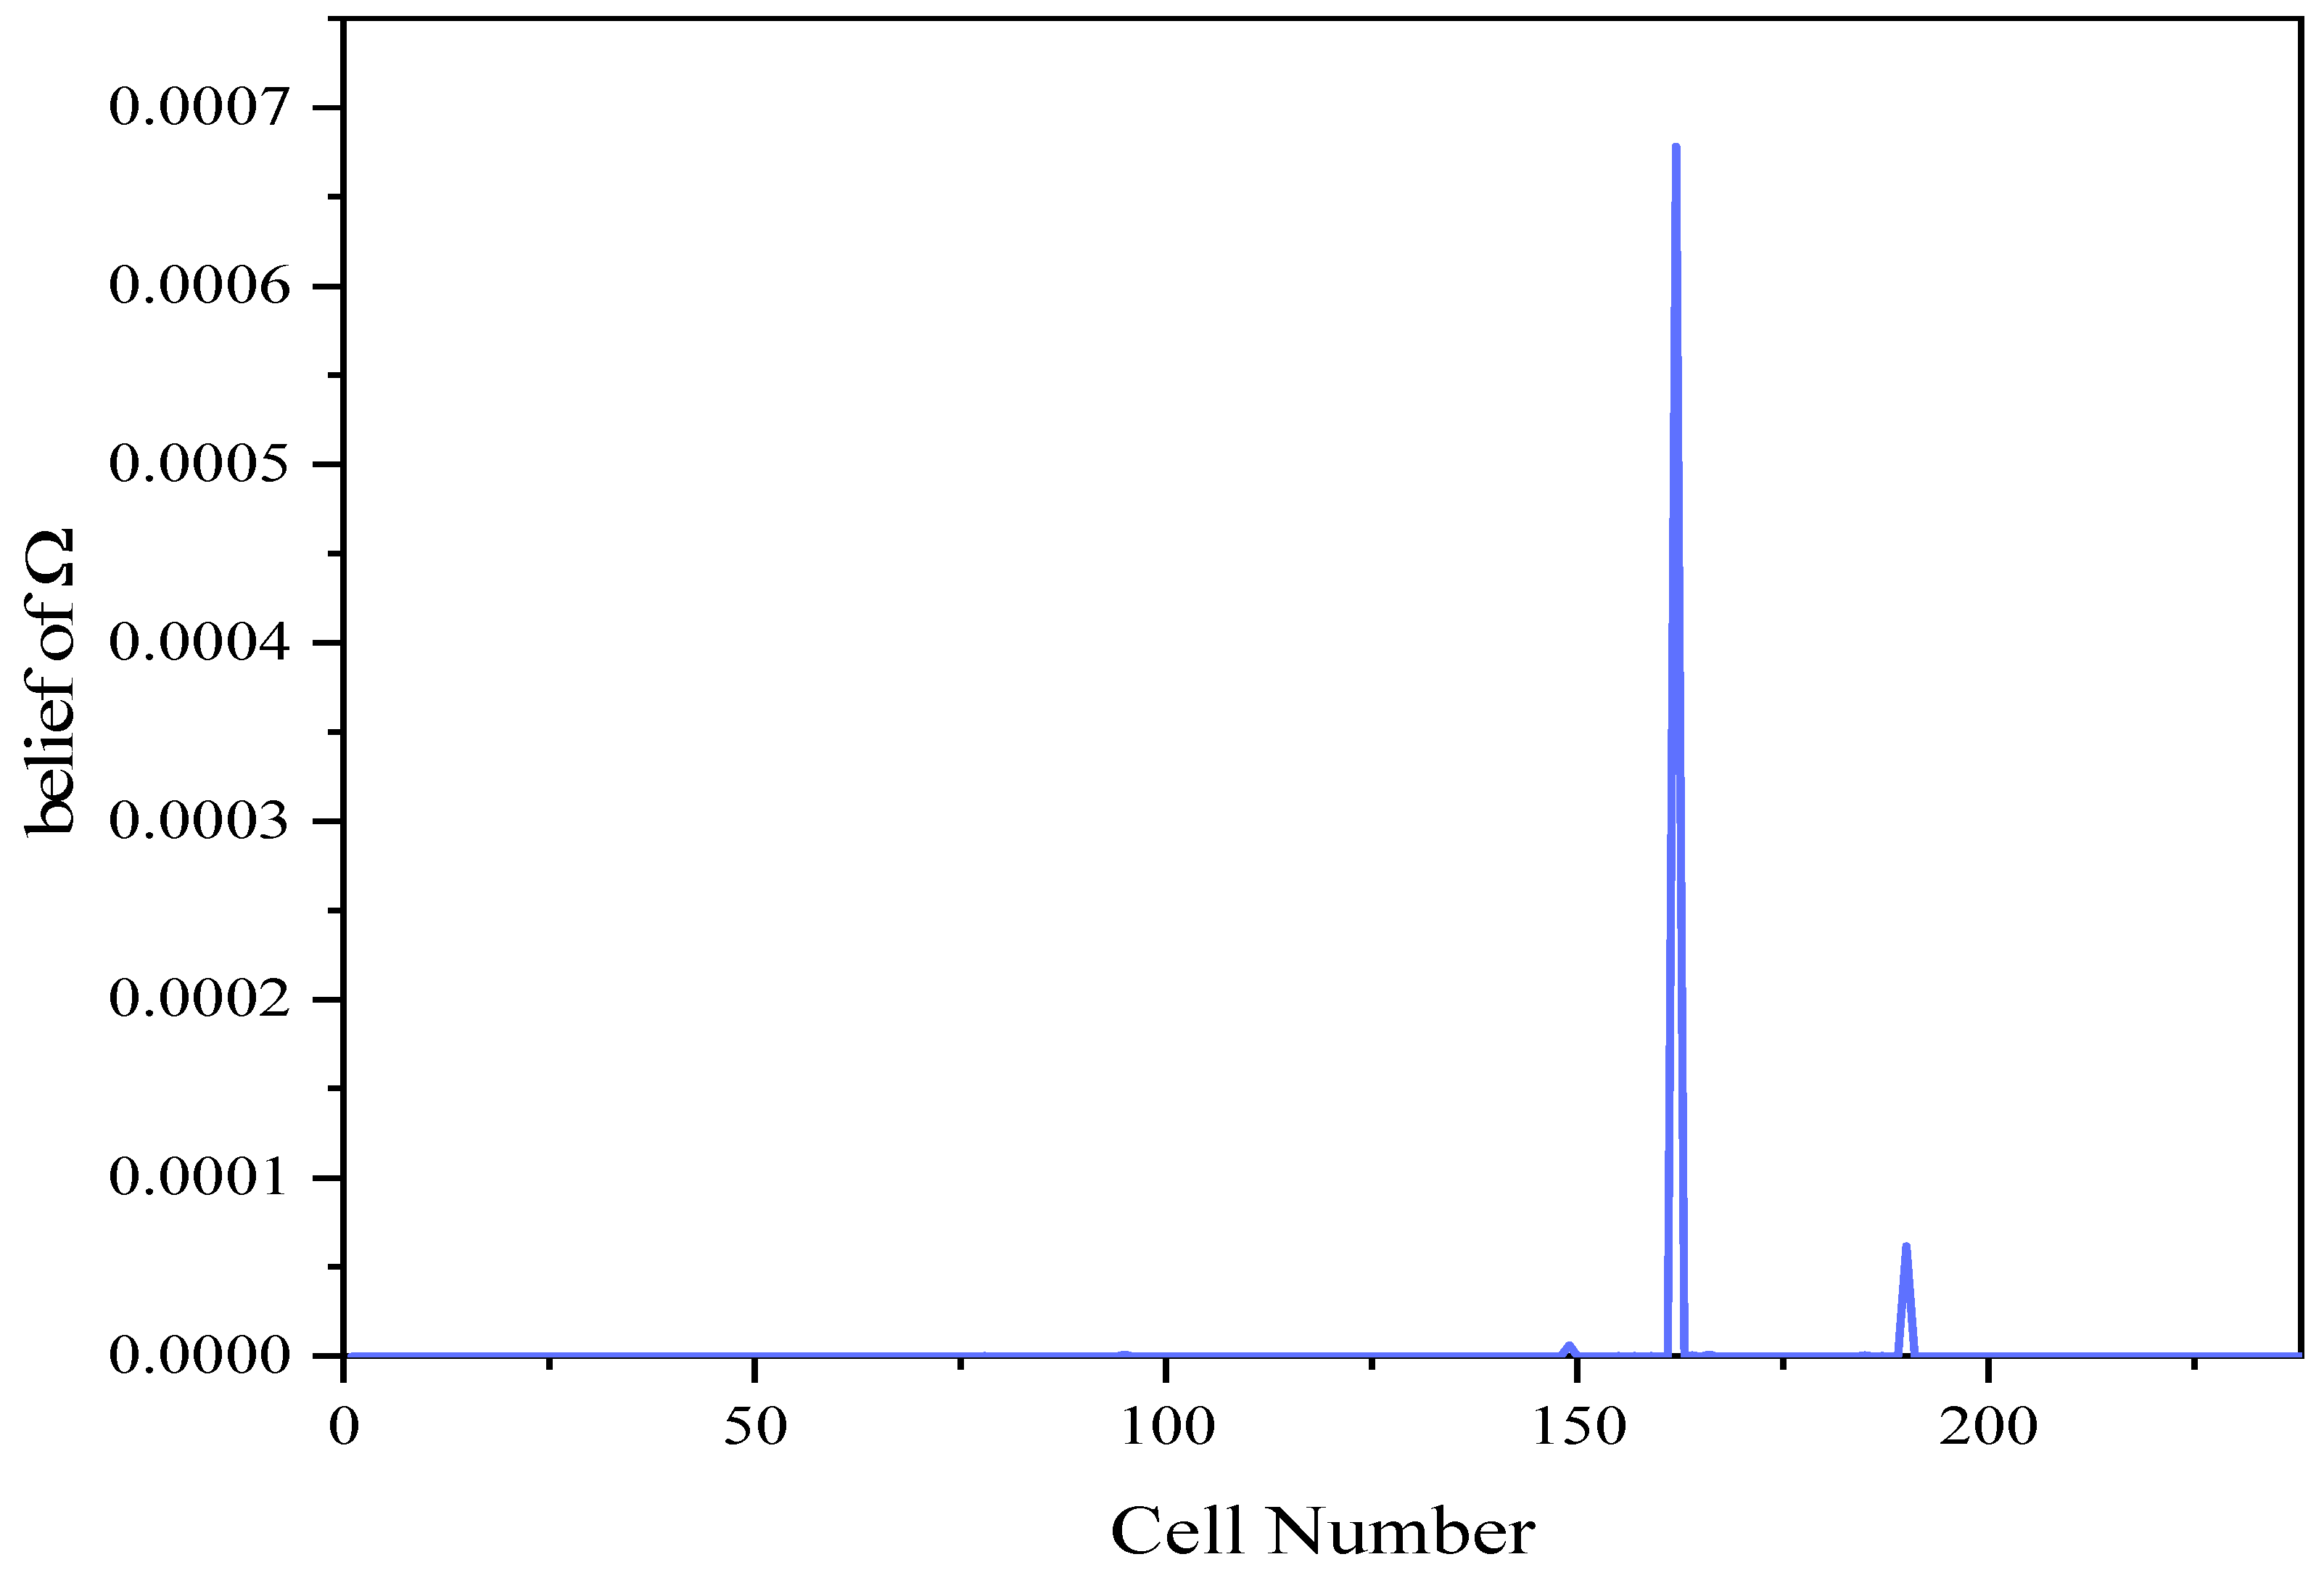
(6) Consistency monitoring. Based on the fused evidence, calculate the evidence that a cell belongs to each category and the identification framework evidence m (Ω); if m (Ω) is large, it indicates that the cell is an inconsistent cell; otherwise, it is a consistent cell.
The overall procedure of the proposed BPEC-EKNN method is summarized in Algorithm 1.
The pseudo-code for the BPEC-EKNN algorithm is as follows:
| Algorithm 1. BPEC-EKNN |
 |
6. Conclusions and Recommendations
6.1. Conclusions
This paper takes the energy storage system as the research object and proposes a consistency detection method based on the framework of clustering-classification for the inconsistency of the state of the electric cores in the energy storage system, in which the clustering algorithm adopts Belief Peaks Evidential Clustering (BPEC) and the classification algorithm adopts Evidential K-Nearest Neighbors (EKNN). The BPEC algorithm is used to cluster the core characteristic parameters under the time series data, analyze the category attributes of each core, judge the overall consistency level of the core, and form the core evidence base. Second, based on the core evidence base, the EKNN algorithm is used to categorize the test cores to judge the cores belonging to different categories and the confidence of the overall identification framework. The confidence of belonging to the identification framework is the consistency evaluation index adopted in this paper, which is also called the identification framework evidence. Finally, according to the value of the identification framework evidence, the consistency level of the core is judged, and a large identification framework evidence indicates that the possibility of the core being an inconsistent core is high; otherwise, the possibility of the core being an inconsistent core is low.
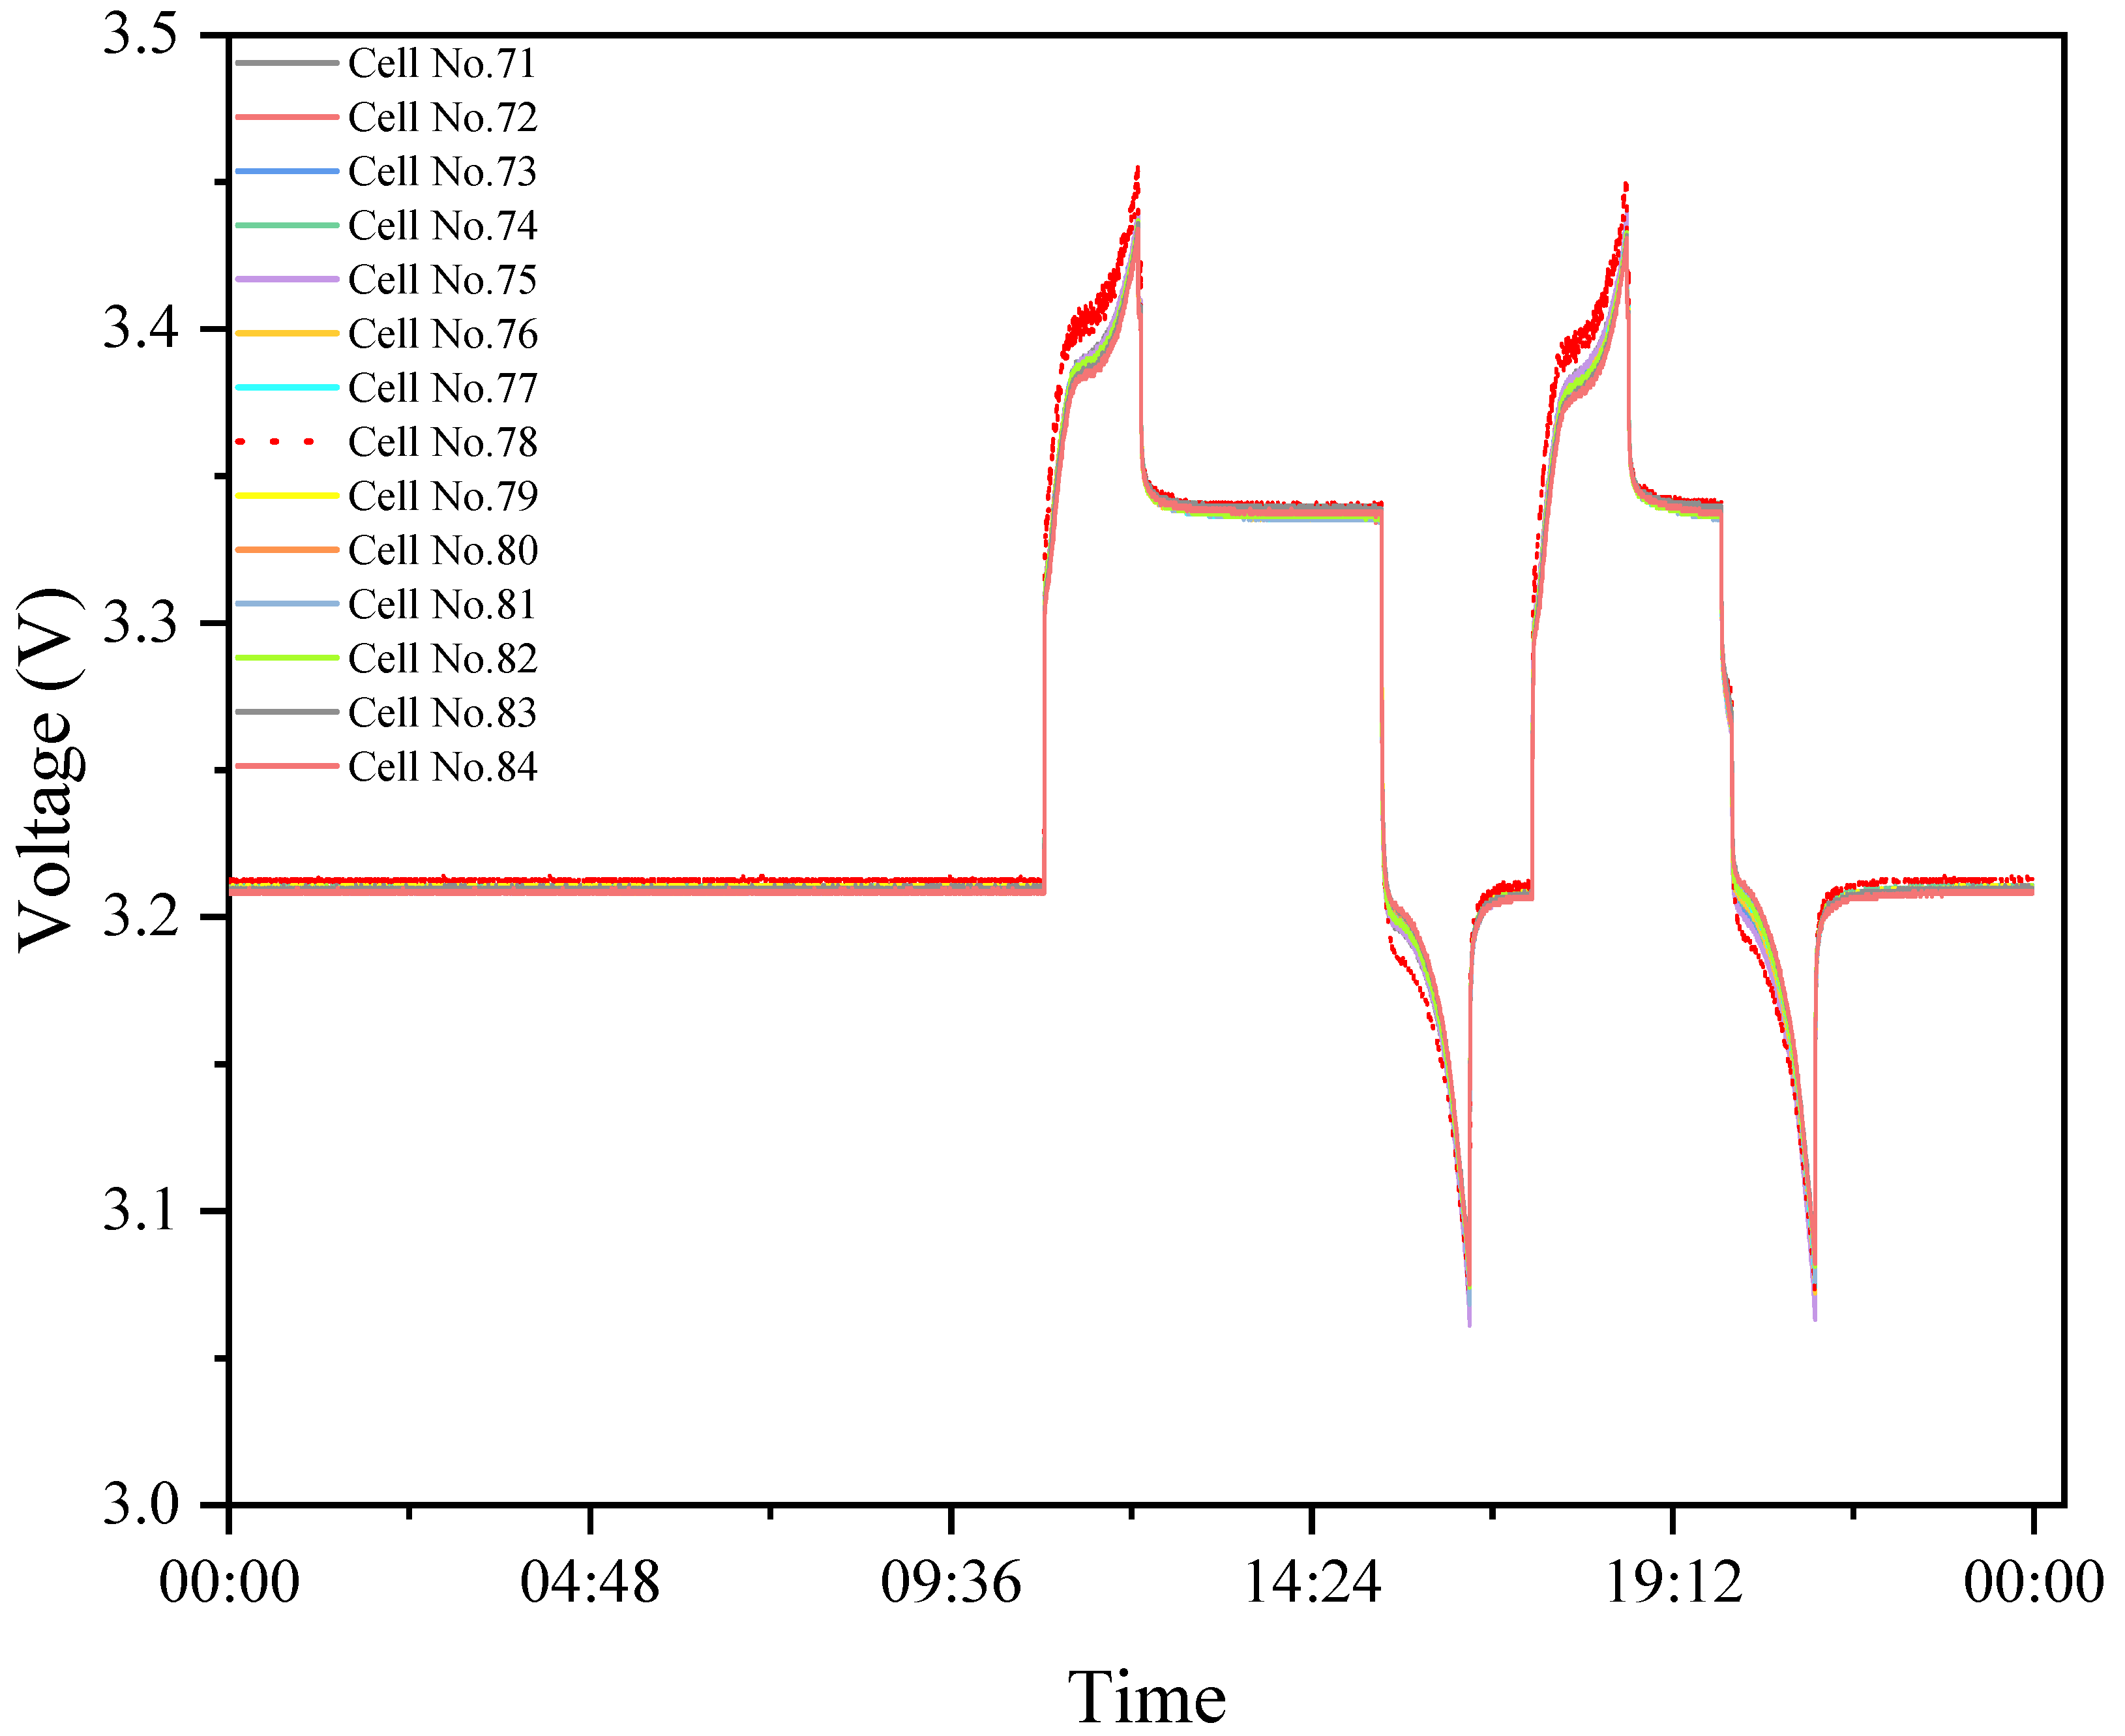
In order to verify the effectiveness of the BPEC-EKNN algorithm, this paper adopts the energy storage system in Jiangsu Jinhu as an example. Overall, the time series battery cell consistency detection method based on BPEC-EKNN proposed in this paper has strong reliability and feasibility, and can realize the consistency diagnosis of battery cells. The proposed method is directed toward diagnosing inconsistent battery cells and providing recommendations to operators for battery replacement. When the inconsistency exceeds 1, the battery requires replacement. The algorithm proposed in this paper is a consistency diagnosis method based on actual operating data. In this study, voltage is selected as the feature parameter, on the basis that it can be obtained in real time and each cell has a corresponding measurement point. Nonetheless, it is vital to emphasize that while the case studies presented herein focus on cell voltages during actual operation, this methodology remains applicable if alternative representative cell parameters are available. As a data-driven approach, this algorithm necessitates the maintenance of optimal data quality. When data quality deteriorates, such as the case of widespread sensor failures or significant data gaps, the accuracy and reliability of the algorithm simultaneously decrease. Moreover, the data-driven nature of the algorithm precludes its analysis of the underlying causes of inconsistencies in energy storage batteries. Consequently, this algorithm is capable of identifying cells that demonstrate inconsistencies while failing to provide a comprehensive analysis of the underlying causes of these inconsistencies and the consequent alterations in voltage curves.
Therefore, experimental verification is required to determine the specific mechanisms and components of the inconsistencies detected. We will conduct further research based on this point in the future.
6.2. Limitations and Practical Enhancement Strategies
Although the proposed BPEC-EKNN method demonstrates high reliability under the current operational dataset, its data-driven nature implies sensitivity to data quality. Scenarios involving widespread sensor failures, substantial missing data segments, or high noise levels may impair clustering performance and evidence fusion, resulting in reduced detection accuracy or inflated ignorance masses m (Ω).
To improve practical applicability, the following enhancement strategies are recommended: (1) robust data preprocessing using temporal-aware imputation or denoising techniques; (2) adaptive tuning of evidence discount rates based on real-time data quality assessment; (3) fusion of multi-parameter evidence (e.g., voltage, temperature, and current) to compensate for single-signal degradation; and (4) implementation of a hybrid fallback mechanism that activates simple threshold-based alarms when data quality drops critically. Future research will focus on validating these strategies on datasets with artificially injected faults and real fault records from operational energy storage stations.