Article

Drainage Characteristics and Heat Transfer Performance of Fin Surfaces in Desert Greenhouse Environments

1
College of Energy and Power Engineering, Inner Mongolia University of Technology, Hohhot 010051, China
2
Department of Railway Locomotives and Rolling Stock, Baotou Railway Vocational & Technical College, Baotou 014060, China
3
Department of Power Engineering, North China Electric Power University, Baoding 071003, China
4
Hebei Key Laboratory of Low Carbon and High Efficiency Power Generation Technology, North China Electric Power University, Baoding 071003, China
5
National Scientific Research Institute of Renewable Energy Sources, Ministry of Energy of Uzbekistan, Tashkent 100170, Uzbekistan
*
Author to whom correspondence should be addressed.
Energies 2025, 18(8), 2061; https://doi.org/10.3390/en18082061
Submission received: 13 March 2025 / Revised: 11 April 2025 / Accepted: 15 April 2025 / Published: 17 April 2025
(This article belongs to the Section J1: Heat and Mass Transfer)

Abstract

:
As desertification intensifies, greenhouses in arid regions are increasingly challenged by severe water scarcity and low water utilization efficiency. Traditional greenhouse HVAC systems are often inadequate in efficiently recovering condensate water. This study addressed these challenges by investigating, through wind tunnel experiments, the fin angle and inlet wind speed for optimal condensation and heat transfer performance of a straight-fin heat exchanger in desert greenhouse environments. The experimental findings revealed that under low-temperature conditions, vertical fins facilitated gravity-driven droplet removal, resulting in a maximum condensate amount of 524.2 g within 120 min. Conversely, under high-temperature conditions, a fin angle of 45° optimally balanced turbulent disturbances and liquid film stability, producing a condensate amount of up to 887.1 g in the same timeframe. Additionally, wind speed tests at a 45° fin angle identified a critical wind speed of 1.5 m/s, beyond which the condensate amount significantly decreased. Furthermore, when the fin inclination reached or exceeded 60°, flow separation occurred, reducing the effective heat transfer area and negatively impacting the exchanger efficiency. Overall, the study provides significant insights into water conservation and sustainable environmental utilization by enhancing condensate recovery efficiency.

1. Introduction

A greenhouse is a specialized facility designed to provide an optimal growth environment for plants [1,2]. By extending the growing season, greenhouses contribute to enhancing both the yield and quality of crops [3,4]. Furthermore, they regulate environmental factors such as temperature, humidity, and light, thereby creating ideal conditions for plant growth [5,6]. In China, solar greenhouses are predominantly located in the northern regions, accounting for over 85% of the country’s total greenhouse area. Although the northwest region occupies 42.3% of the national land area, its greenhouse usage is less than 11.9%. This discrepancy is primarily due to the region’s climate, characterized by hot and dry summers, cold and arid winters, and severe soil desertification. In desert areas, the internal air temperature of greenhouses can exceed 30 °C at noon during summer. To mitigate this, a combination of midday watering and physical ventilation is often employed to lower the internal temperature [7]. However, this method has significant drawbacks: high temperatures lead to substantial water evaporation, increasing agricultural water demands and resulting in water wastage; ventilation expels moisture to the outside, reducing the humidity inside the greenhouse, which is detrimental to crop growth.
In this context, developing methods for recovering moisture from the air inside greenhouses in desert regions at noon is of significant research importance. Utilizing heat exchanger fins to condense and recover atmospheric moisture not only reduces water wastage but also lowers greenhouse temperatures and minimizes humidity loss due to ventilation, thereby enhancing the controllability of the greenhouse microenvironment [8,9]. The efficiency of condensate removal from the surface of heat exchanger fins is crucial in this process. If the condensate is not promptly removed, it may form a water film, reducing the heat exchange efficiency and hindering further moisture recovery [10]. Therefore, investigating the discharge characteristics of condensate on heat exchanger fins is of critical engineering value for optimizing greenhouse environmental control, improving heat exchange efficiency, and reducing energy consumption.
Currently, optimizing the surface structure of fins is a key strategy for enhancing the heat exchange performance and drainage capacity of heat exchangers. Several studies have demonstrated that factors such as the inclination angle of the fins, surface wettability, and microstructure design significantly influence the processes of condensation, droplet sliding, and re-evaporation of the condensate [11]. Kim et al. [12,13,14] investigated the impact of inclination angles, reaching up to ±60°, on the condensate drainage performance of MCHX louvered fins. They reported that the pressure drop increases with the inclination angle due to unfavorable flow patterns caused by condensate bridges between louvers. Wang et al. [15] found that inclined louvered fin heat exchangers could reduce the condensate accumulation rate by half at an inclination angle of 20°. Sahin et al. [16] studied the effects of vertical, inclined, and horizontal surfaces on passive water collection and found that vertical surfaces exhibited the highest condensation rate, while horizontal surfaces achieved only one-fifth of the vertical rate. Inclination angles of less than 30° had minimal impact on performance, but the performance significantly declined when the inclination exceeded 30°.
Moreover, several studies have demonstrated that the inclination angle of fins significantly enhances the removal of condensate, as increasing the fin inclination angle facilitates the rapid sliding of water droplets, reduces the retention of water films, and improves the heat exchange capacity in the air side [17,18,19,20,21,22]. The inlet air velocity determines the shear sliding speed of the condensate, the evaporation rate, and the heat exchange capacity of the fins on the air side [23,24]. While a high air velocity can accelerate the removal of water droplets, it may also lead to the reattachment of droplets along the fins, thereby affecting the heat exchange performance. Jianan Yao et al. [25] found that under humid conditions at 20 °C, an increase in inlet air velocity (1–3 m/s) enhances convective heat transfer, raising the surface temperature of the fins, which reduces the condensation driving force and lowers the friction factor. Similarly, Ben V. Tarigan et al. [21] discovered that in a high-humidity PWAG system at normal temperature, increasing the inlet air velocity from 0.27 m/s to 0.97 m/s increased the amount of condensate. When the fins were inclined at 70°, the extended contact time between the airflow and the fins promoted water vapor condensation.
In summary, in recent years, domestic and international scholars have conducted extensive experimental and numerical simulation research on the regulation of temperature and humidity in greenhouse environments. However, the current research achievements primarily focused on greenhouse environments under conventional climatic conditions, with a lack of systematic investigation into the alterations in phase change heat and mass transfer characteristics induced by extreme environmental conditions, such as those in the arid desert regions of Northwest China. Experimental studies on the effects of air velocity and angle on the condensation efficiency of heat exchangers under high-temperature and high-humidity conditions in desert greenhouses remain limited. The optimal tilt angle of fins under different inlet air velocities remains controversial, particularly regarding its impact on condensate recovery efficiency in the high-temperature and high-humidity environments characteristic of desert greenhouses, which has not yet been clearly elucidated.
To address these issues, this study established a wind tunnel simulation experimental platform and employed the control variable method for experimental research. By exploring the drainage characteristics and heat exchange performance of fins under different environments, inlet air velocities, and fin inclination angles, this study aimed to determine the optimal inlet air velocity and fin inclination angle for moisture recovery in desert greenhouse environments. The findings will provide experimental evidence to improve the operational efficiency of heat exchangers and enhance condensate recovery management in desert greenhouse settings.

2. Experimental Tests

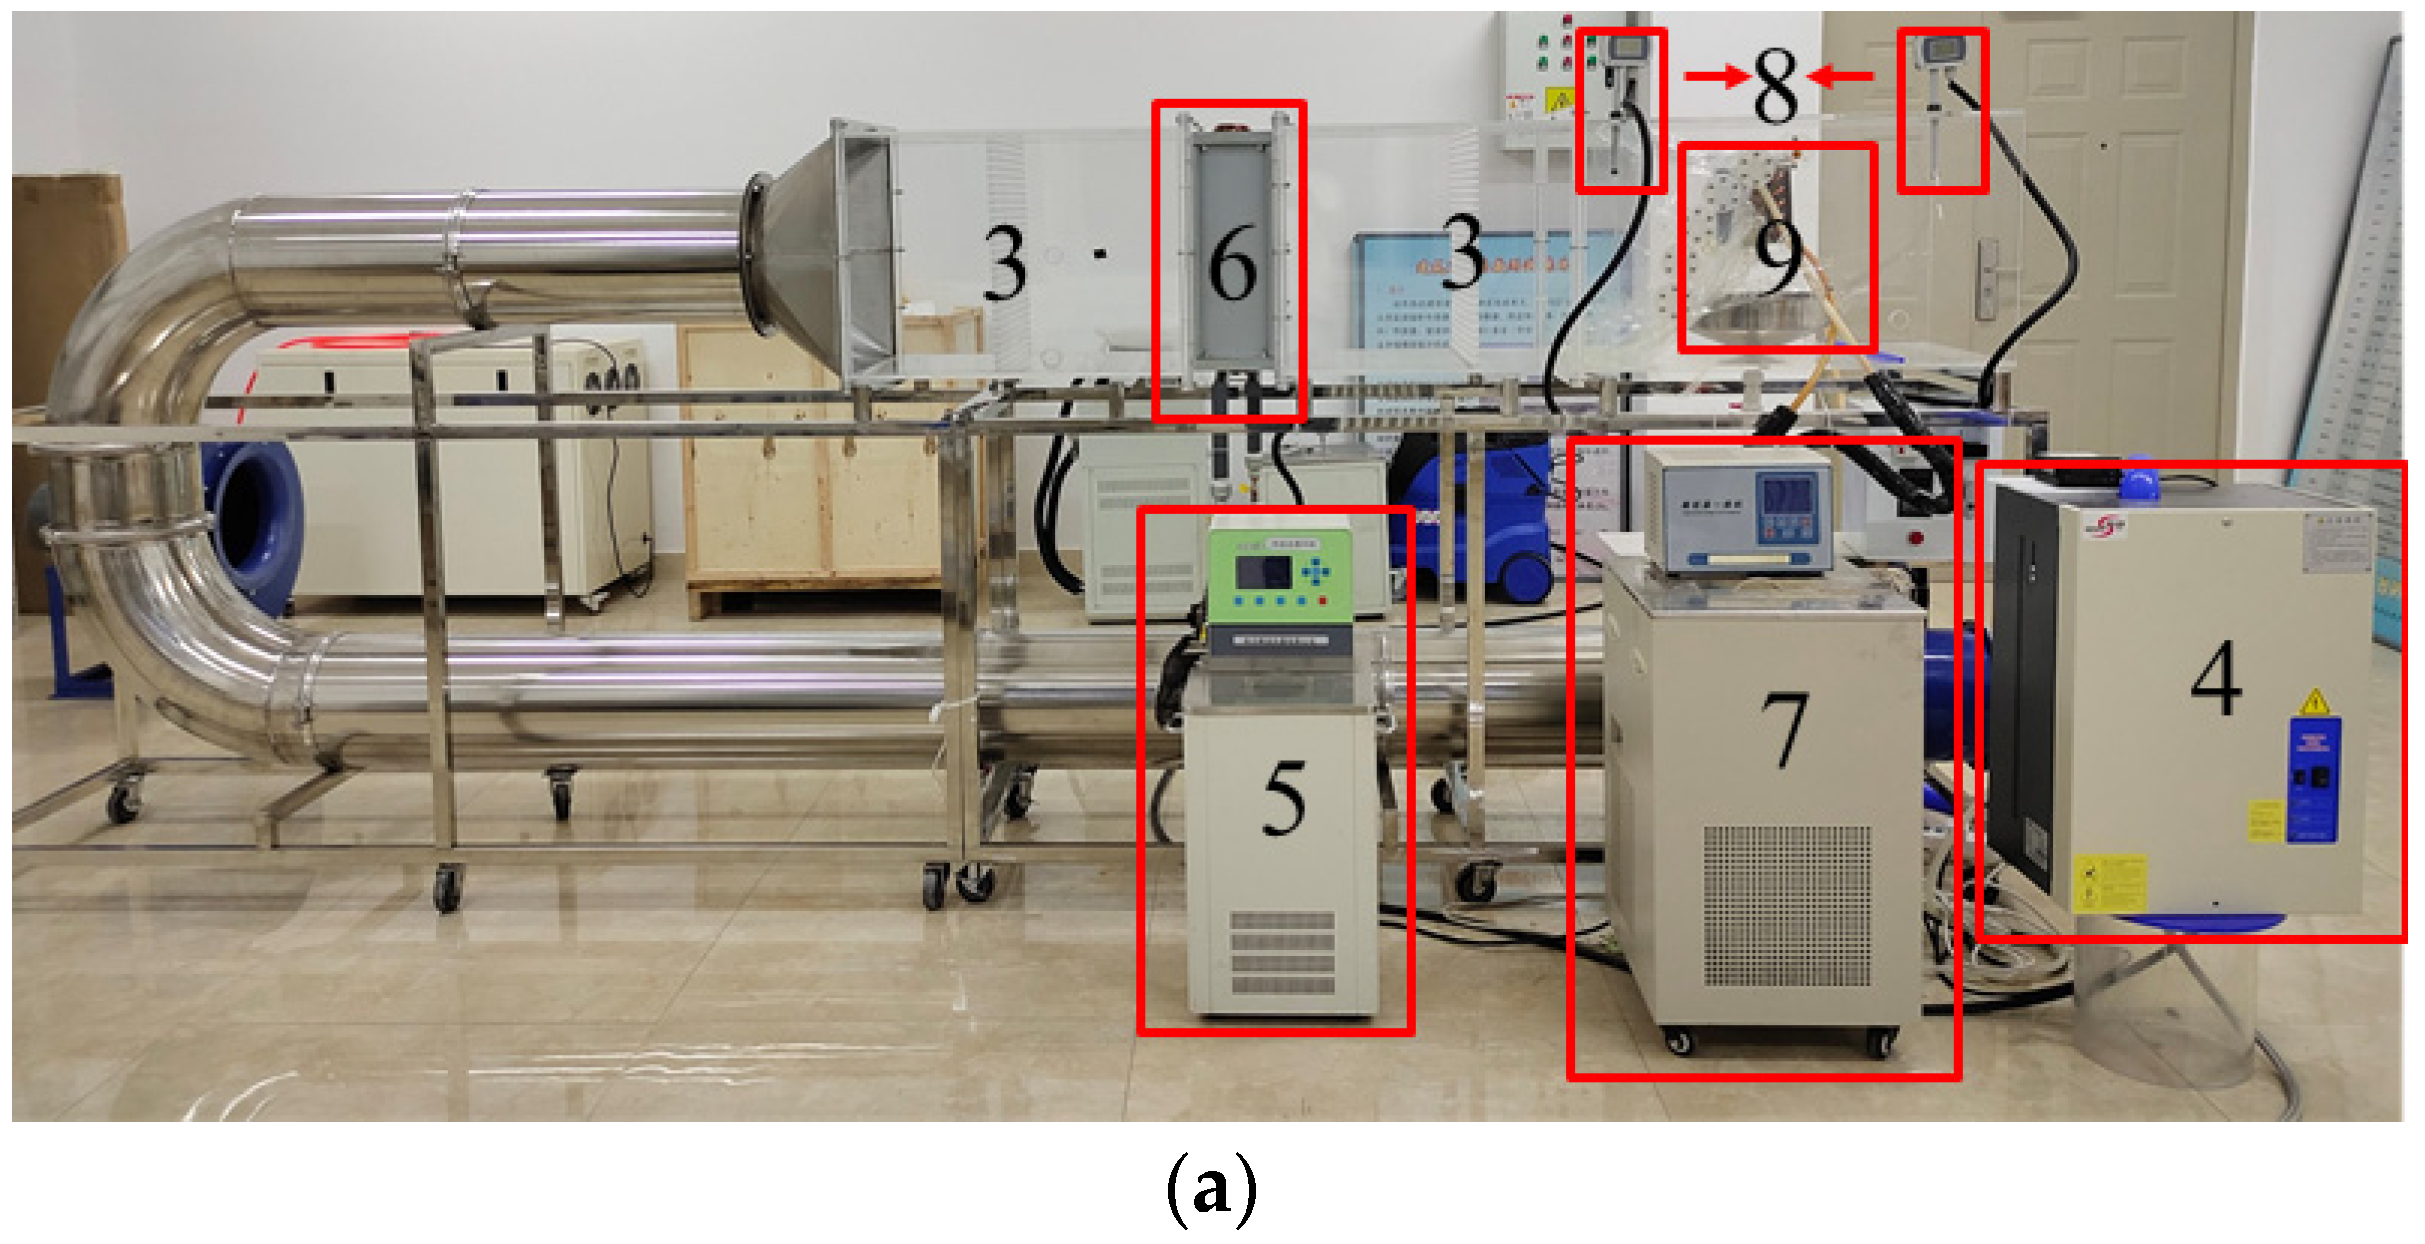
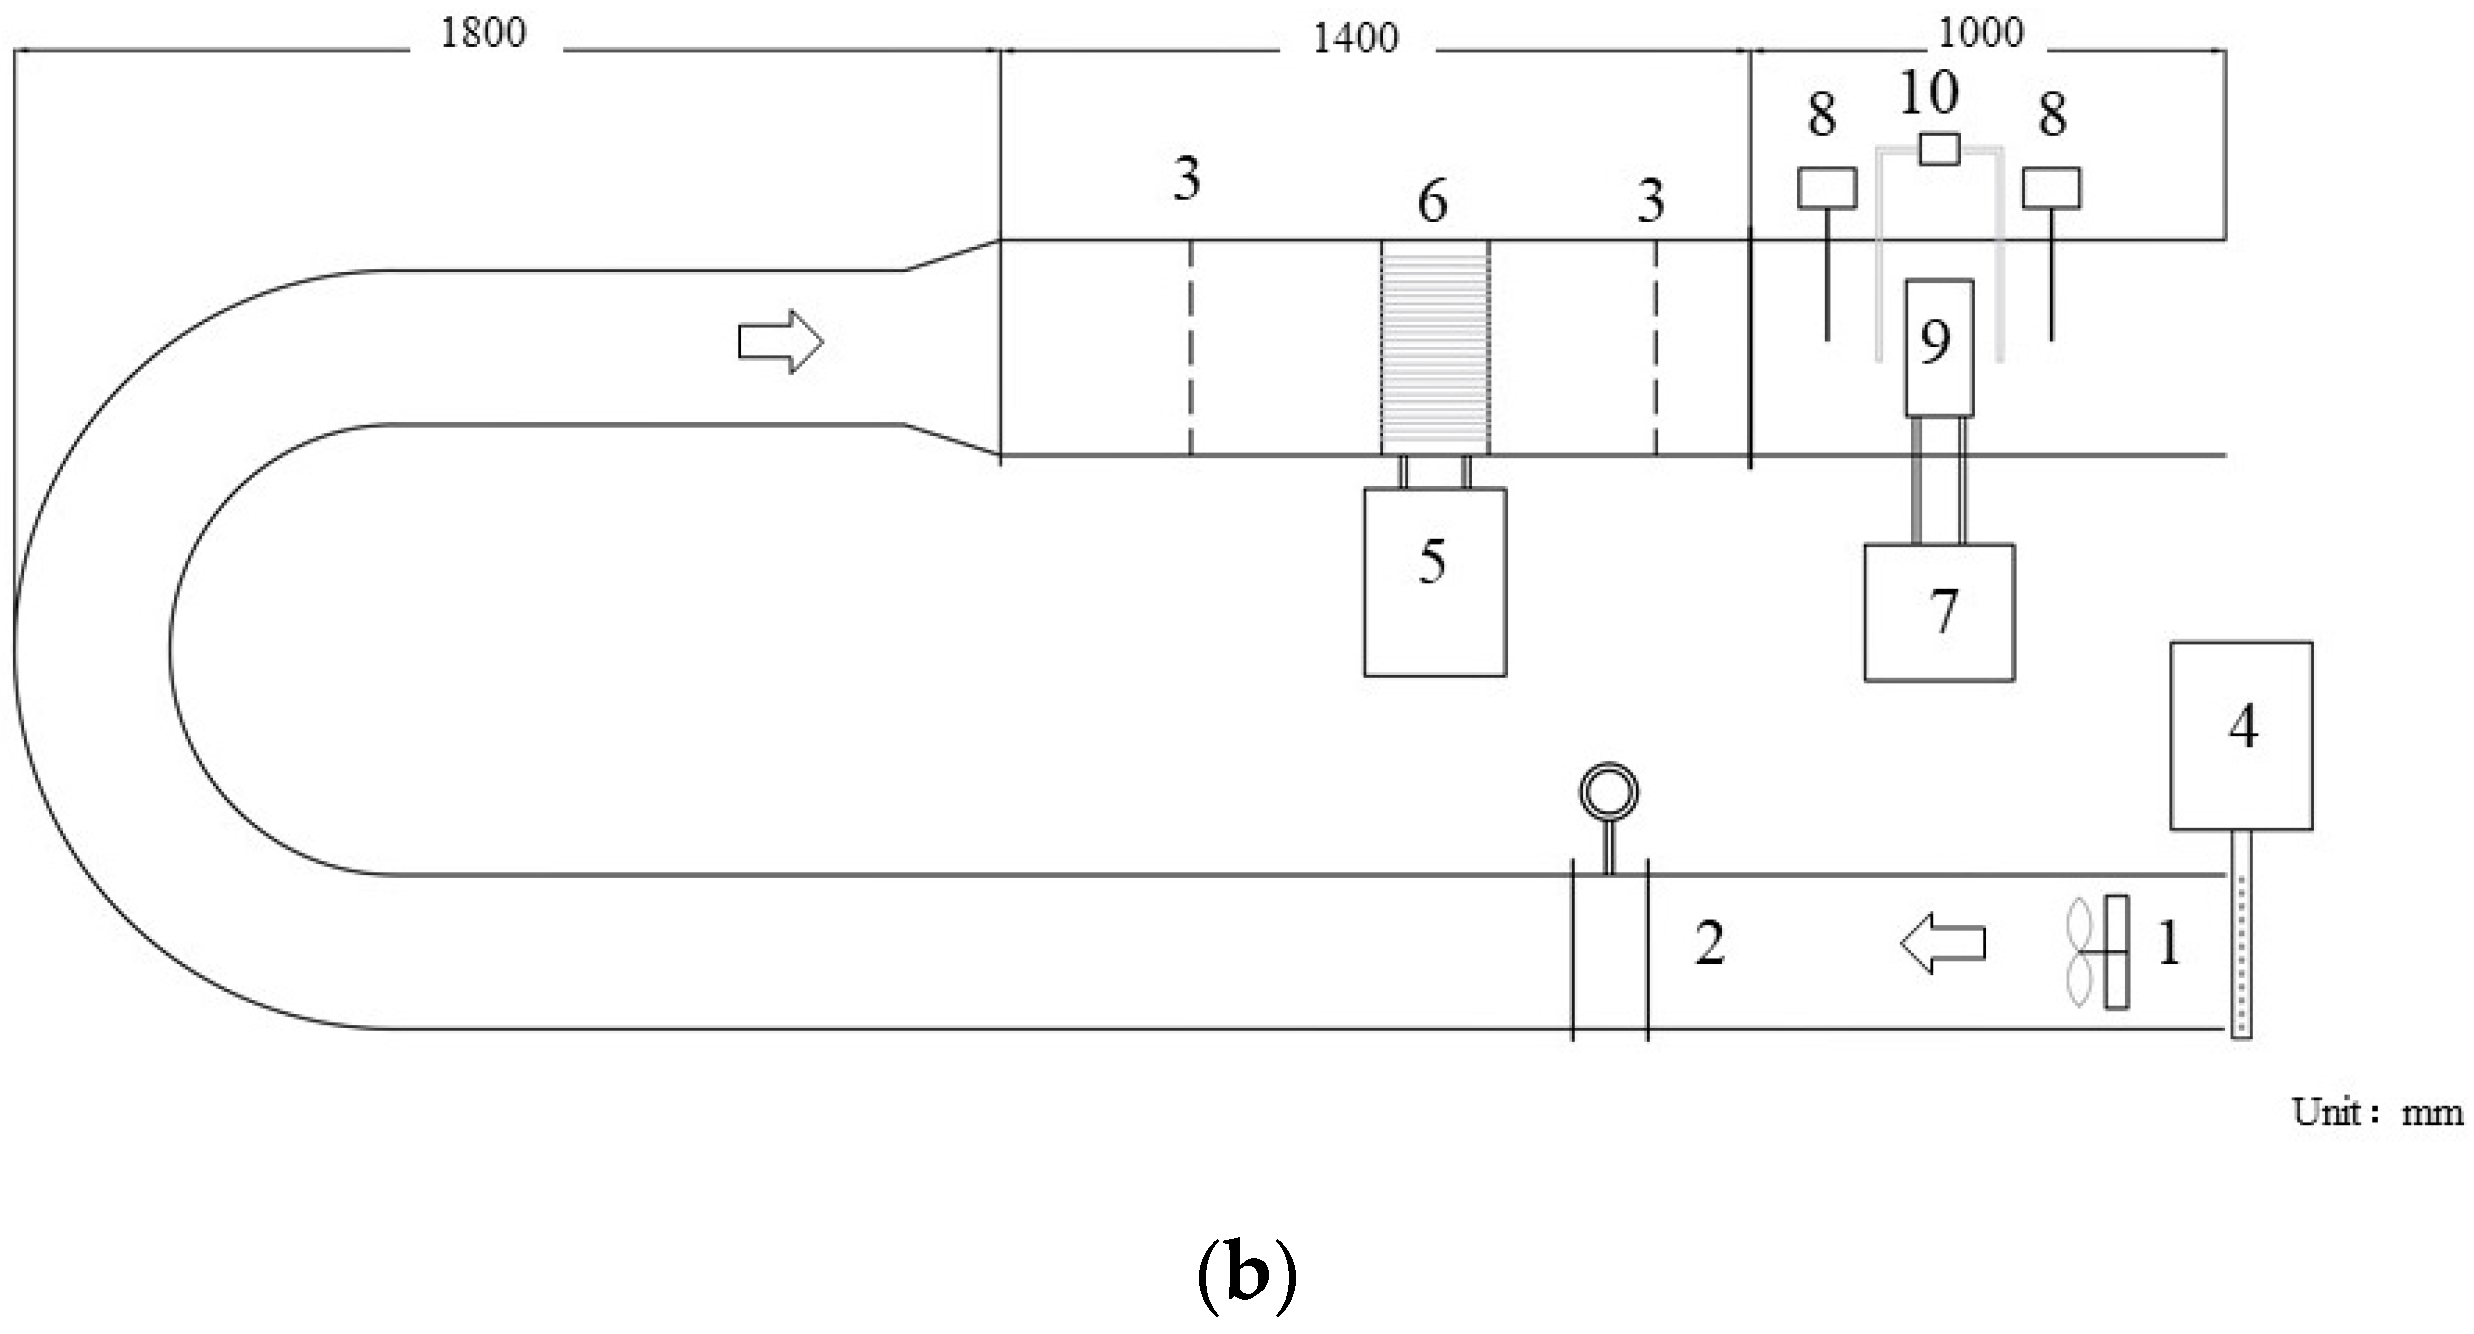
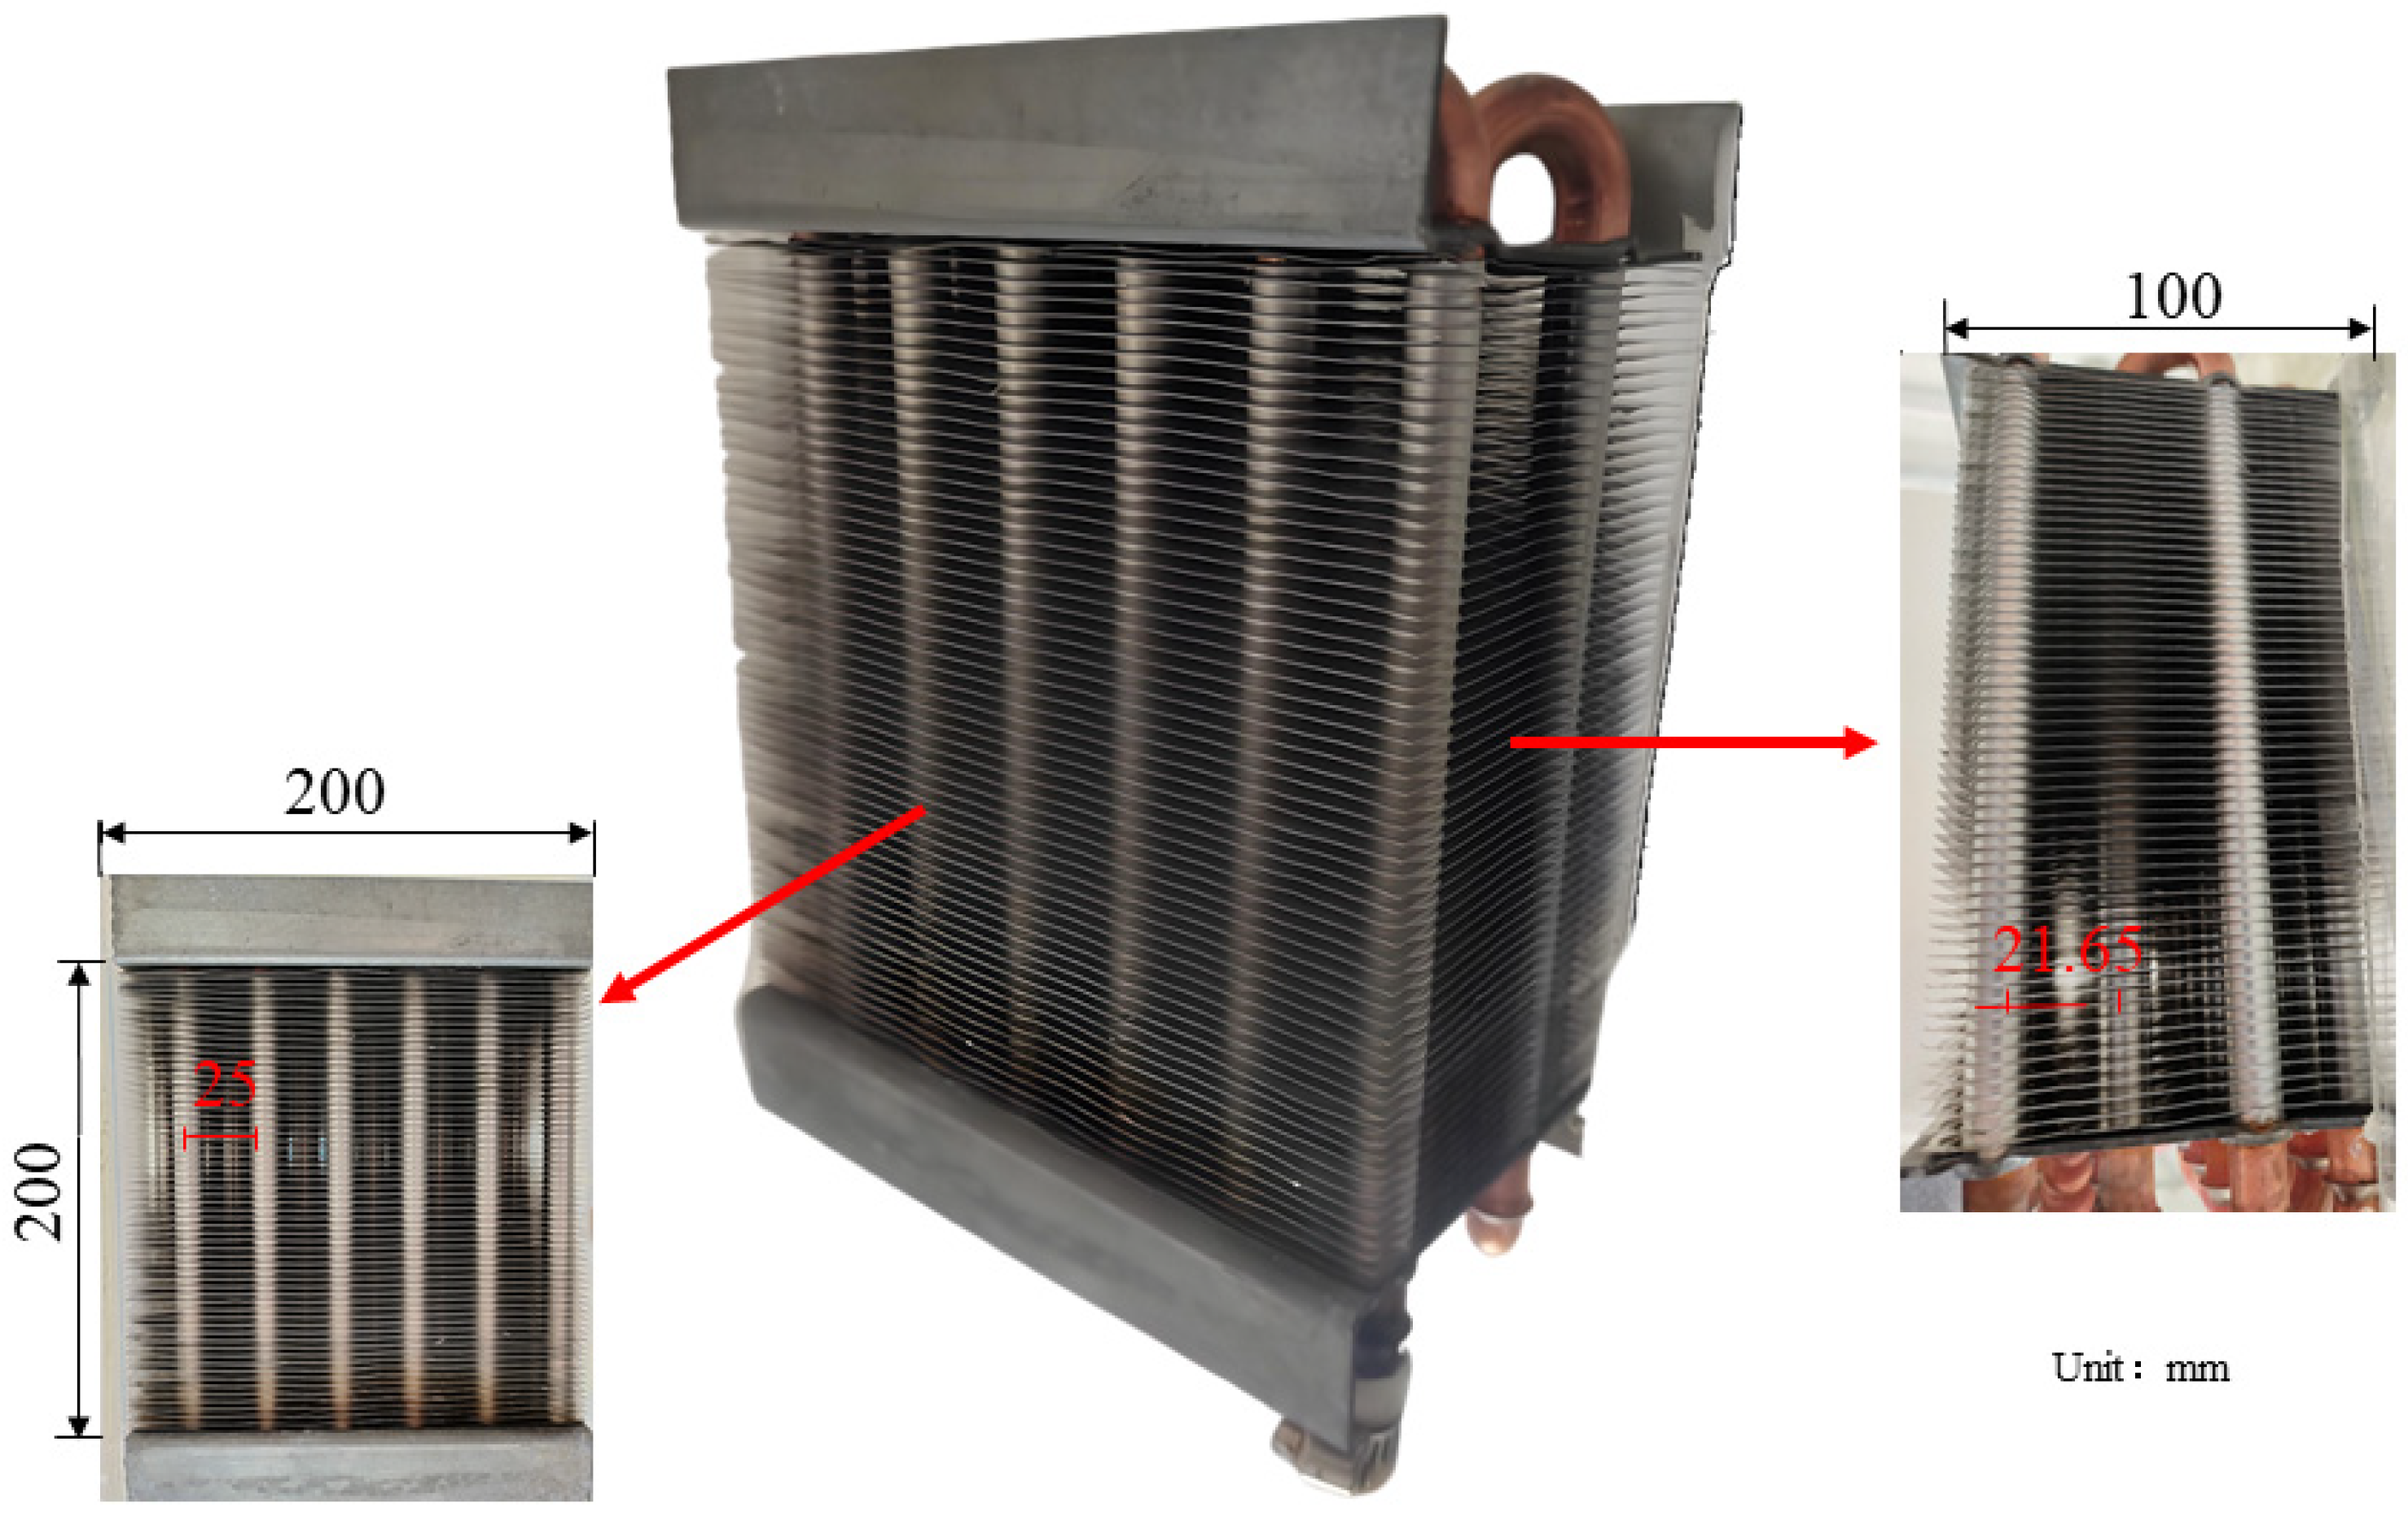
2.1. Experimental Setup

Figure 1 illustrates the small wind tunnel experimental system used in this study. The parameters of the test section are shown in the figure. The test section is 1000 mm long with a cross-sectional size of 400 mm × 400 mm. This open-system wind tunnel included a fan with a variable frequency airflow control system, an airflow measurement section, an air development section, an air conditioning section, and a test section. As depicted in Figure 1, the axial fan supplies air for the entire system, and the flow rate is measured by a vortex flowmeter. The air conditioning section, composed of an electrode humidifier, a low-temperature thermostatic water bath, and a heat exchanger, regulates the temperature and humidity to provide constant conditions for the test section. To ensure uniform airflow, a flow equalization board was installed within the system’s air channels.
As shown in Figure 2, the fin dimensions were 200 mm × 200 mm × 100 mm, with a straight fin design. The distance between the plain foil fins was 2.5 mm, with a hole spacing of 25 mm and a row spacing of 21.65 mm. A key focus of this experiment was to examine the impact of the fin inclination angle on condensation. The fin was mounted on an adjustable angle rail, with a collection bottle and electronic scale beneath to record the amount of condensed water in real time. The cooling source for the fin in the experimental section was provided by a water chiller.

2.2. Experimental Operation Flow

The data acquisition module comprised an anemometer, a vortex flowmeter, T-type thermocouples, a temperature and humidity meter, a micro-differential pressure gauge, electronic weighing scales, and a data collector. Eight pre-calibrated T-type thermocouples were strategically placed at the inlet and outlet of the test section to measure the dry bulb temperature of the air. The temperature and humidity meter was employed to assess the relative humidity and temperature at the test section’s entry and exit points, while the micro-differential pressure gauge measured the pressure drop on the air side of the heat exchanger. The parameters of each instrument are detailed in Table 1. The experiment was begun by activating the thermostatic water bath and setting the preheat temperature to 24 °C for a test condition of 22 °C and 40 °C for a test condition of 32 °C. Once the water bath reached the set temperature, circulation commenced. The cooling water circulator was set to 7 °C, and to mitigate the impact of ambient humidity during the preparatory phase, chilled water was introduced into the fins two minutes prior to the experiment’s commencement. Following the completion of preheating or precooling, the variable frequency fan was activated, and the frequency converter was adjusted until the anemometer indicated the required experimental wind speed. Subsequently, the electrode-type humidifier was turned on, and the test section was disassembled. Once the wind tunnel achieved stable temperature and humidity conditions, the test section was reassembled, the fin angle was adjusted, and the data collector was employed to monitor and record data from various measurement points. In this controlled and stable experimental environment, humid air, regulated by the electrode-type humidifier and the heat exchanger to control the humidity and temperature, entered the test section. After processing through the condensation device, the humid air flowed indoors. The condensed water droplets were collected in a funnel and stored in a water bottle placed on electronic weighing scales, enabling real-time, contactless collection of condensation data. To ensure experimental validity, data were recorded every minute, with each experimental group lasting two hours and repeated five times. A five-minute interval served as a data adjustment point, and the average value from the five experimental groups was calculated to provide valid data for this time point. Based on the overall distribution of the five repeated experiments, data points that deviated from the experimental group mean by more than ±2σ were excluded.

2.3. Experimental Error and Uncertainty

The flow of moist air slowed as it passed through the finned-tube heat exchanger due to losses encountered while moving through the wind tunnel.
Based on the direct measurement errors, an error analysis was conducted using the error propagation theory proposed by Kline and McClintock [26]. A simplified analytical method was then adopted to compute the errors of the indirectly measured parameters. By establishing mathematical models relating the primary outcome indicators to the directly measured parameters, the indirect error range of the secondary computed parameters was systematically quantified.
y = f x 1 , x 2 ,   , x n
ω y = y x 1 ω x 1 2 + y x 2 ω x 2 2 + + y x n ω x n 2
e = ω y y × 100 %
ω x = e x
Taking the operating conditions of an inlet temperature of 22 °C, relative humidity of 85%, and an air velocity of 1.5 m/s as an example, the error in the air-side heat exchange quantity was calculated.
The formula for the air-side heat exchange quantity Q is
Q = h a A ( T o u t T i n )
ω Q = Q h e h 2 + Q T in e T out 2 + Q T in e T in 2 = ( 7.2 × 1.74 ) 2 + ( 49.8 × 0.1414 ) 2 = 14.38   W
According to Equation (3), the relative error of the air-side heat exchange quantity Q is
e = ω y y × 100 % = 5.8 %
The analysis revealed that both the direct and indirect errors of the experimental system were less than 10%, meeting the error range requirements for engineering experiments.

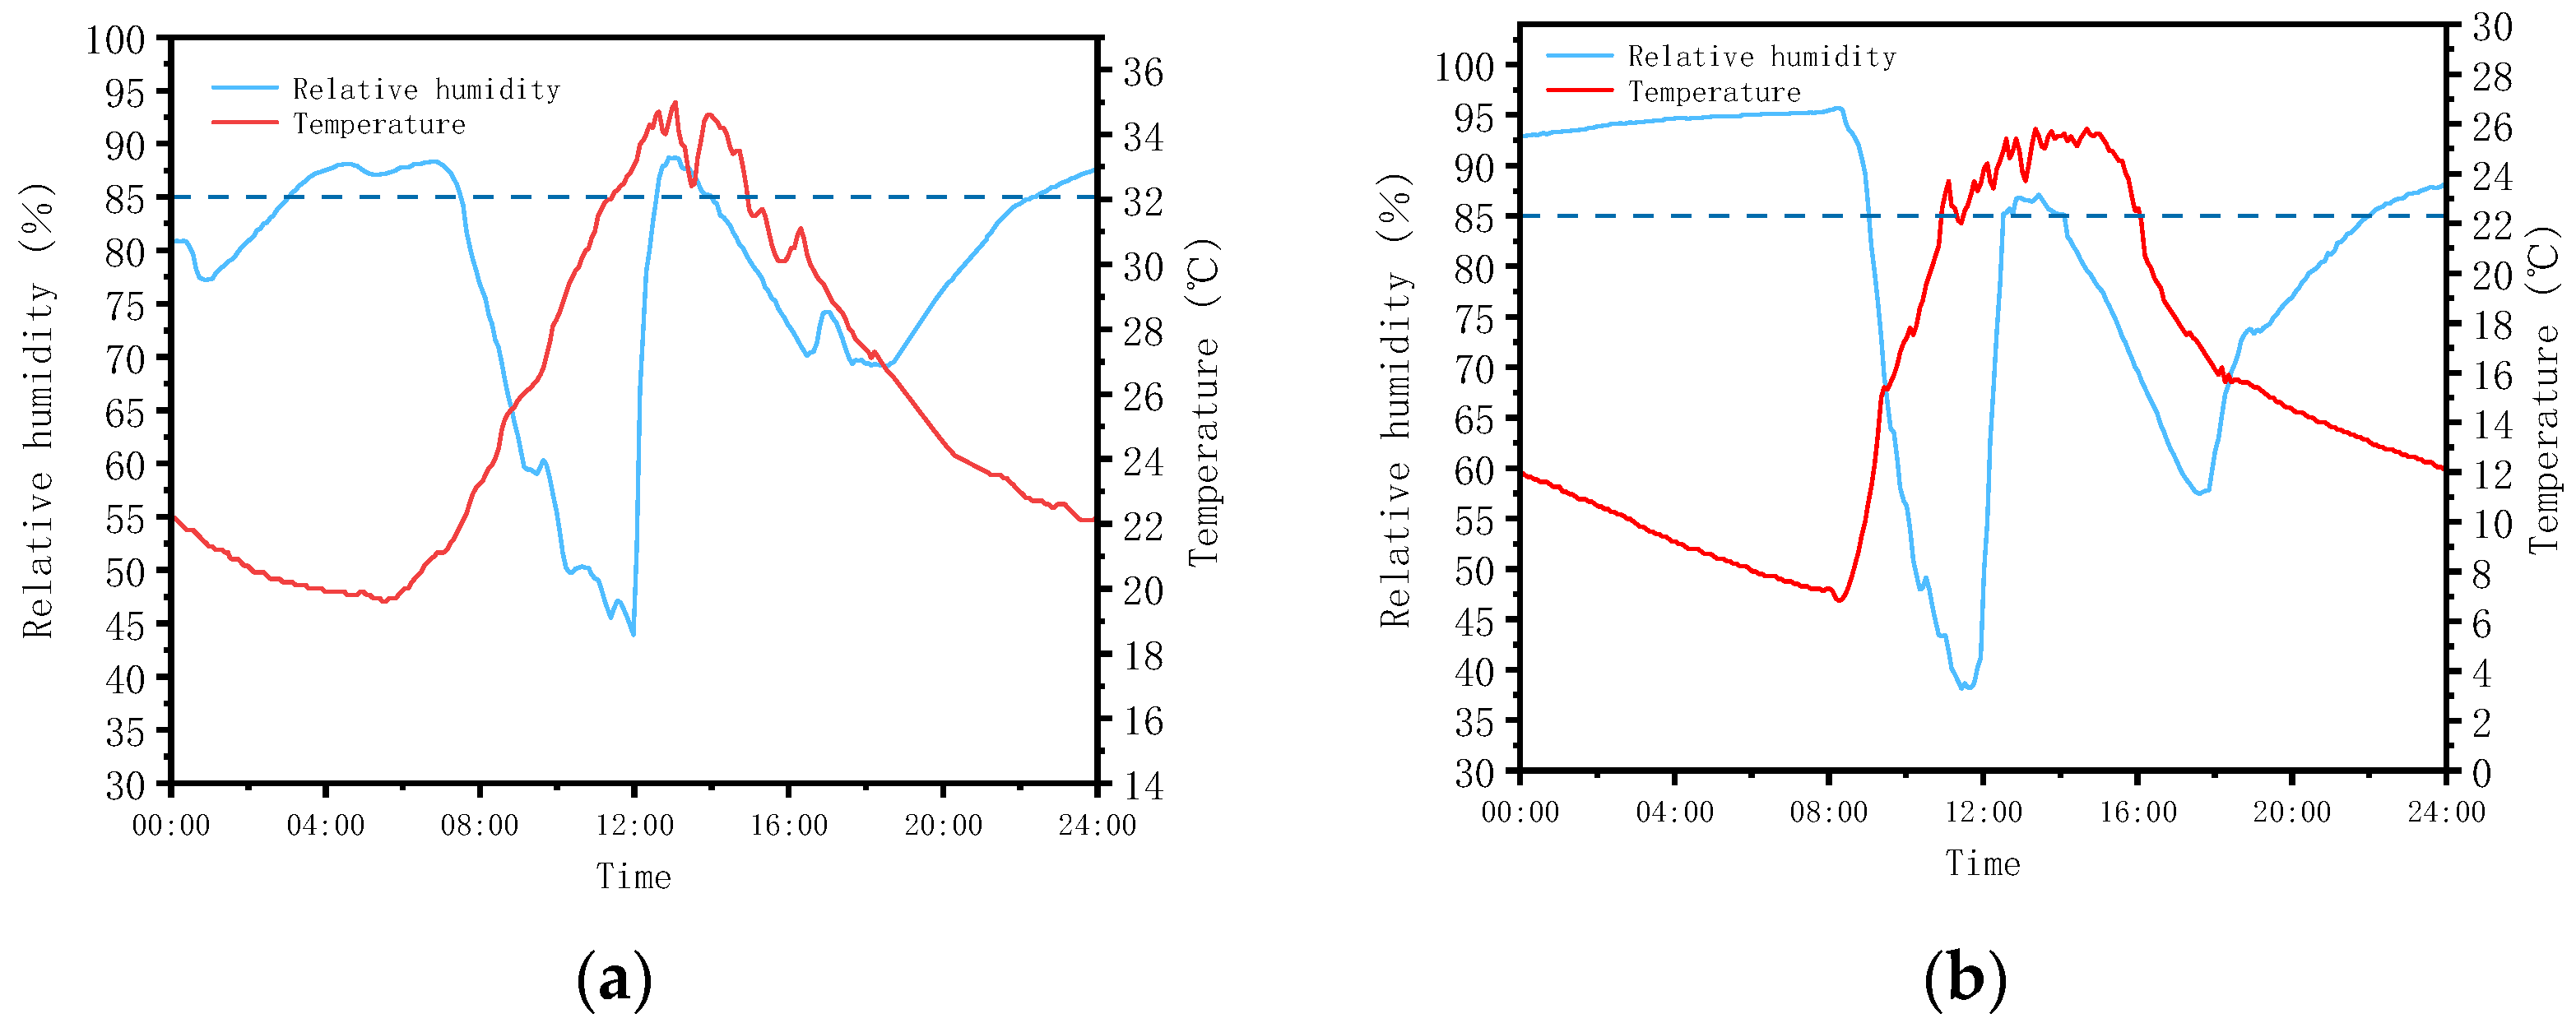
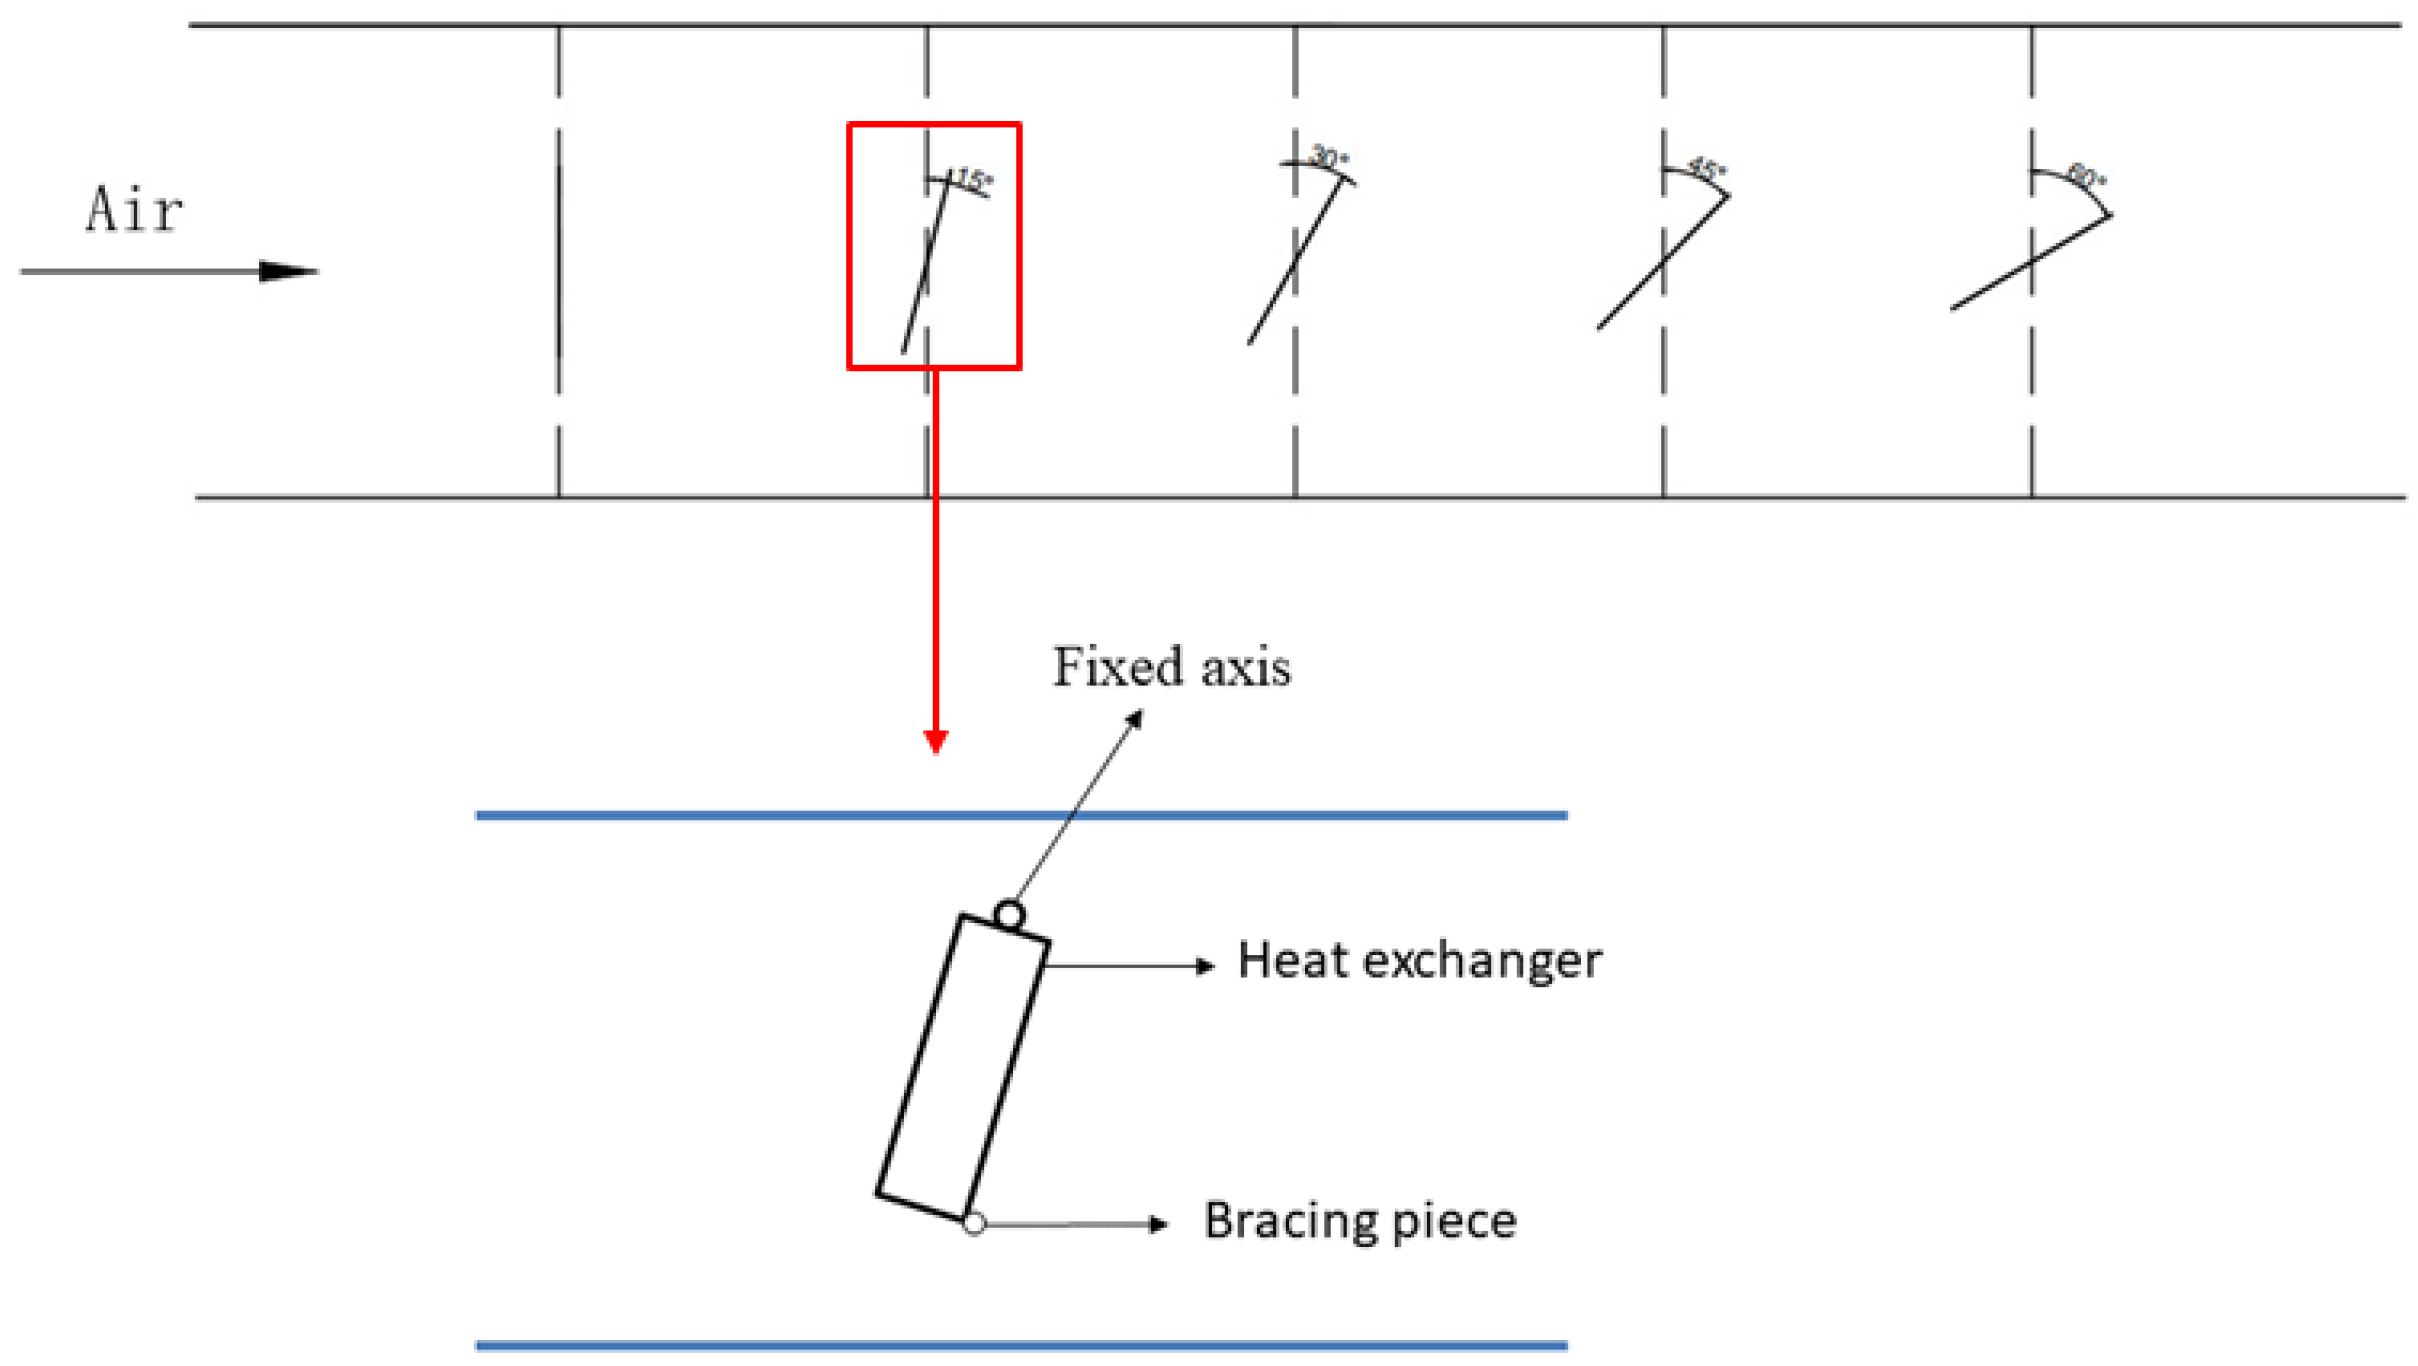
2.4. Selecting the Experimental Conditions

This study focused on the recovery of moisture from humid air after midday irrigation in desert areas. A preliminary experiment was conducted in a greenhouse located in Dalate Banner, Ordos City, Inner Mongolia, China (latitude 40°40′ N, longitude 110°03′ E), to inform the conditions for the wind tunnel experiments. In winter, the greenhouse is influenced by the northern branch of the westerly jet stream and the Mongolian high-pressure system, resulting in typical climatic features of frequent cold air flows, significant daily temperature fluctuations, rare snowfall, and prevalent northwesterly winds. In summer, the area is affected by continental low-pressure systems, leading to brief periods of high temperatures and precipitation, occasional thunderstorms, and rapid moisture evaporation. This is a typical climate for desert areas. Therefore, collecting environmental data from this greenhouse provided representative conditions for the wind tunnel experiments. The experimental data included air temperature and humidity at various measurement points.
The preliminary experiment was designed to investigate the changes in temperature and humidity within a greenhouse under nonventilated conditions after watering during the summer and winter seasons. This was achieved by placing temperature and humidity measurement points inside the greenhouse to collect relevant data, with the aim of selecting a typical greenhouse environment for the subsequent wind tunnel experiments. The experimental testing period spanned from 21 February to 25 February 2023, and from 21 July to 25 July 2024. Figure 3 illustrates the changes in temperature and humidity on a particular day in the greenhouse during summer (a) and winter (b). In winter, the relative humidity within a closed greenhouse is influenced by multiple factors, including thermodynamic processes, biological activity, and human interventions [27]. During the daytime warming phase (08:00–16:00), the increase in air temperature inside the greenhouse led to an exponential rise in the saturation vapor pressure. Although plant transpiration and soil evaporation collectively increased the vapor flux, the overall relative humidity decreased due to the rising temperature. Around noon, there was often an increase in relative humidity, as traditional greenhouses opt to water and ventilate at midday to reduce indoor temperatures, causing rapid vapor release through soil evaporation. During the nighttime cooling phase (19:00–08:00), the drop in air temperature led to a sharp decrease in the saturation vapor pressure, while the accumulated vapor from the day remained trapped due to the lack of ventilation, resulting in a continuous rise in relative humidity to near saturation. In summer, the relative humidity dynamics in the closed greenhouse exhibited a “daytime decrease and nighttime increase” trend, similar to winter. The daytime temperature increases led to a decrease in relative humidity, while concentrated irrigation enhanced soil evaporation and plant transpiration, causing a sudden rise in humidity and forming a multi-peak curve after watering. At night, the limited temperature dropped, along with vapor retention and residual evaporation, which caused a gradual rise in humidity, though the peak was lower than in winter. This study aimed to investigate the recovery of water from humid air lost through physical ventilation after midday watering to achieve water conservation and effectively prevent plant diseases caused by high temperature and humidity. The experiment revealed that without physical ventilation after watering, the humidity inside the greenhouse can exceed 85%, and it takes a considerable amount of time for the high-humidity environment to equilibrate with the external environment. The statistical analysis showed that, after midday watering, the number of days with temperatures exceeding 32 °C in summer and 22 °C in winter was over 80%. Therefore, the experimental conditions were chosen to be 22 °C and 32 °C with 85% humidity. To avoid sudden environmental changes due to high wind speeds that could be detrimental to crop growth, the study used a low wind speed range of 1 m/s to 2.5 m/s as the experimental condition. The specific conditions are detailed in Table 2.

2.5. Experimental Data Processing

In this study, the performance parameters of the condensation device included heat exchange, the air-side heat transfer coefficient, and the condensation amount. The heat exchange was calculated using the air enthalpy difference method. The calculation formulas were as follows [28]:
(1)
Heat transfer:
Q = Q l + Q s
(2)
Sensible heat transfer:
Q s = G C p T in T out
(3)
Latent heat transfer:
Q l = G r ( d 1 d 2 )
(4)
Air-side heat transfer coefficient:
h = Q A · Δ T l m
Δ T l m = T o u t T i n ln T w a l l T i n T w a l l T o u t
(5)
Nusselt number:
N u = h D 0 λ
D 0 = 4 L x A min A o
(6)
Reynolds number
Re = u m D 0 υ
(7)
Fin surface condensation generation rate:
V 1 = ( d 1 d 2 )
(8)
Fin surface condensation removal rate:
V 2 = Δ m Δ t

3. Results and Discussion

3.1. Effect of Fin Angle on Surface Drainage Characteristics

This study examined the impact of the fin inclination angle on the surface drainage characteristics and heat transfer performance. Six experimental conditions were established with the following parameters: inlet air temperatures of 22 °C and 32 °C, a relative humidity of 85%, chilled water supplied at 7 °C from a low-temperature thermostat, and an airflow velocity of 1.5 m/s. The variable in the study was the fin inclination angle, which was set at 0°, 15°, 30°, 45°, and 60°. The arrangement of the heat exchanger is illustrated in Figure 4. Since the condensation data for a 0° inclination angle were too low to effectively reflect condensation performance, the vertical position was defined as a 0° inclination angle, enabling comparative analysis with the performance of conventional dehumidifier condensers.

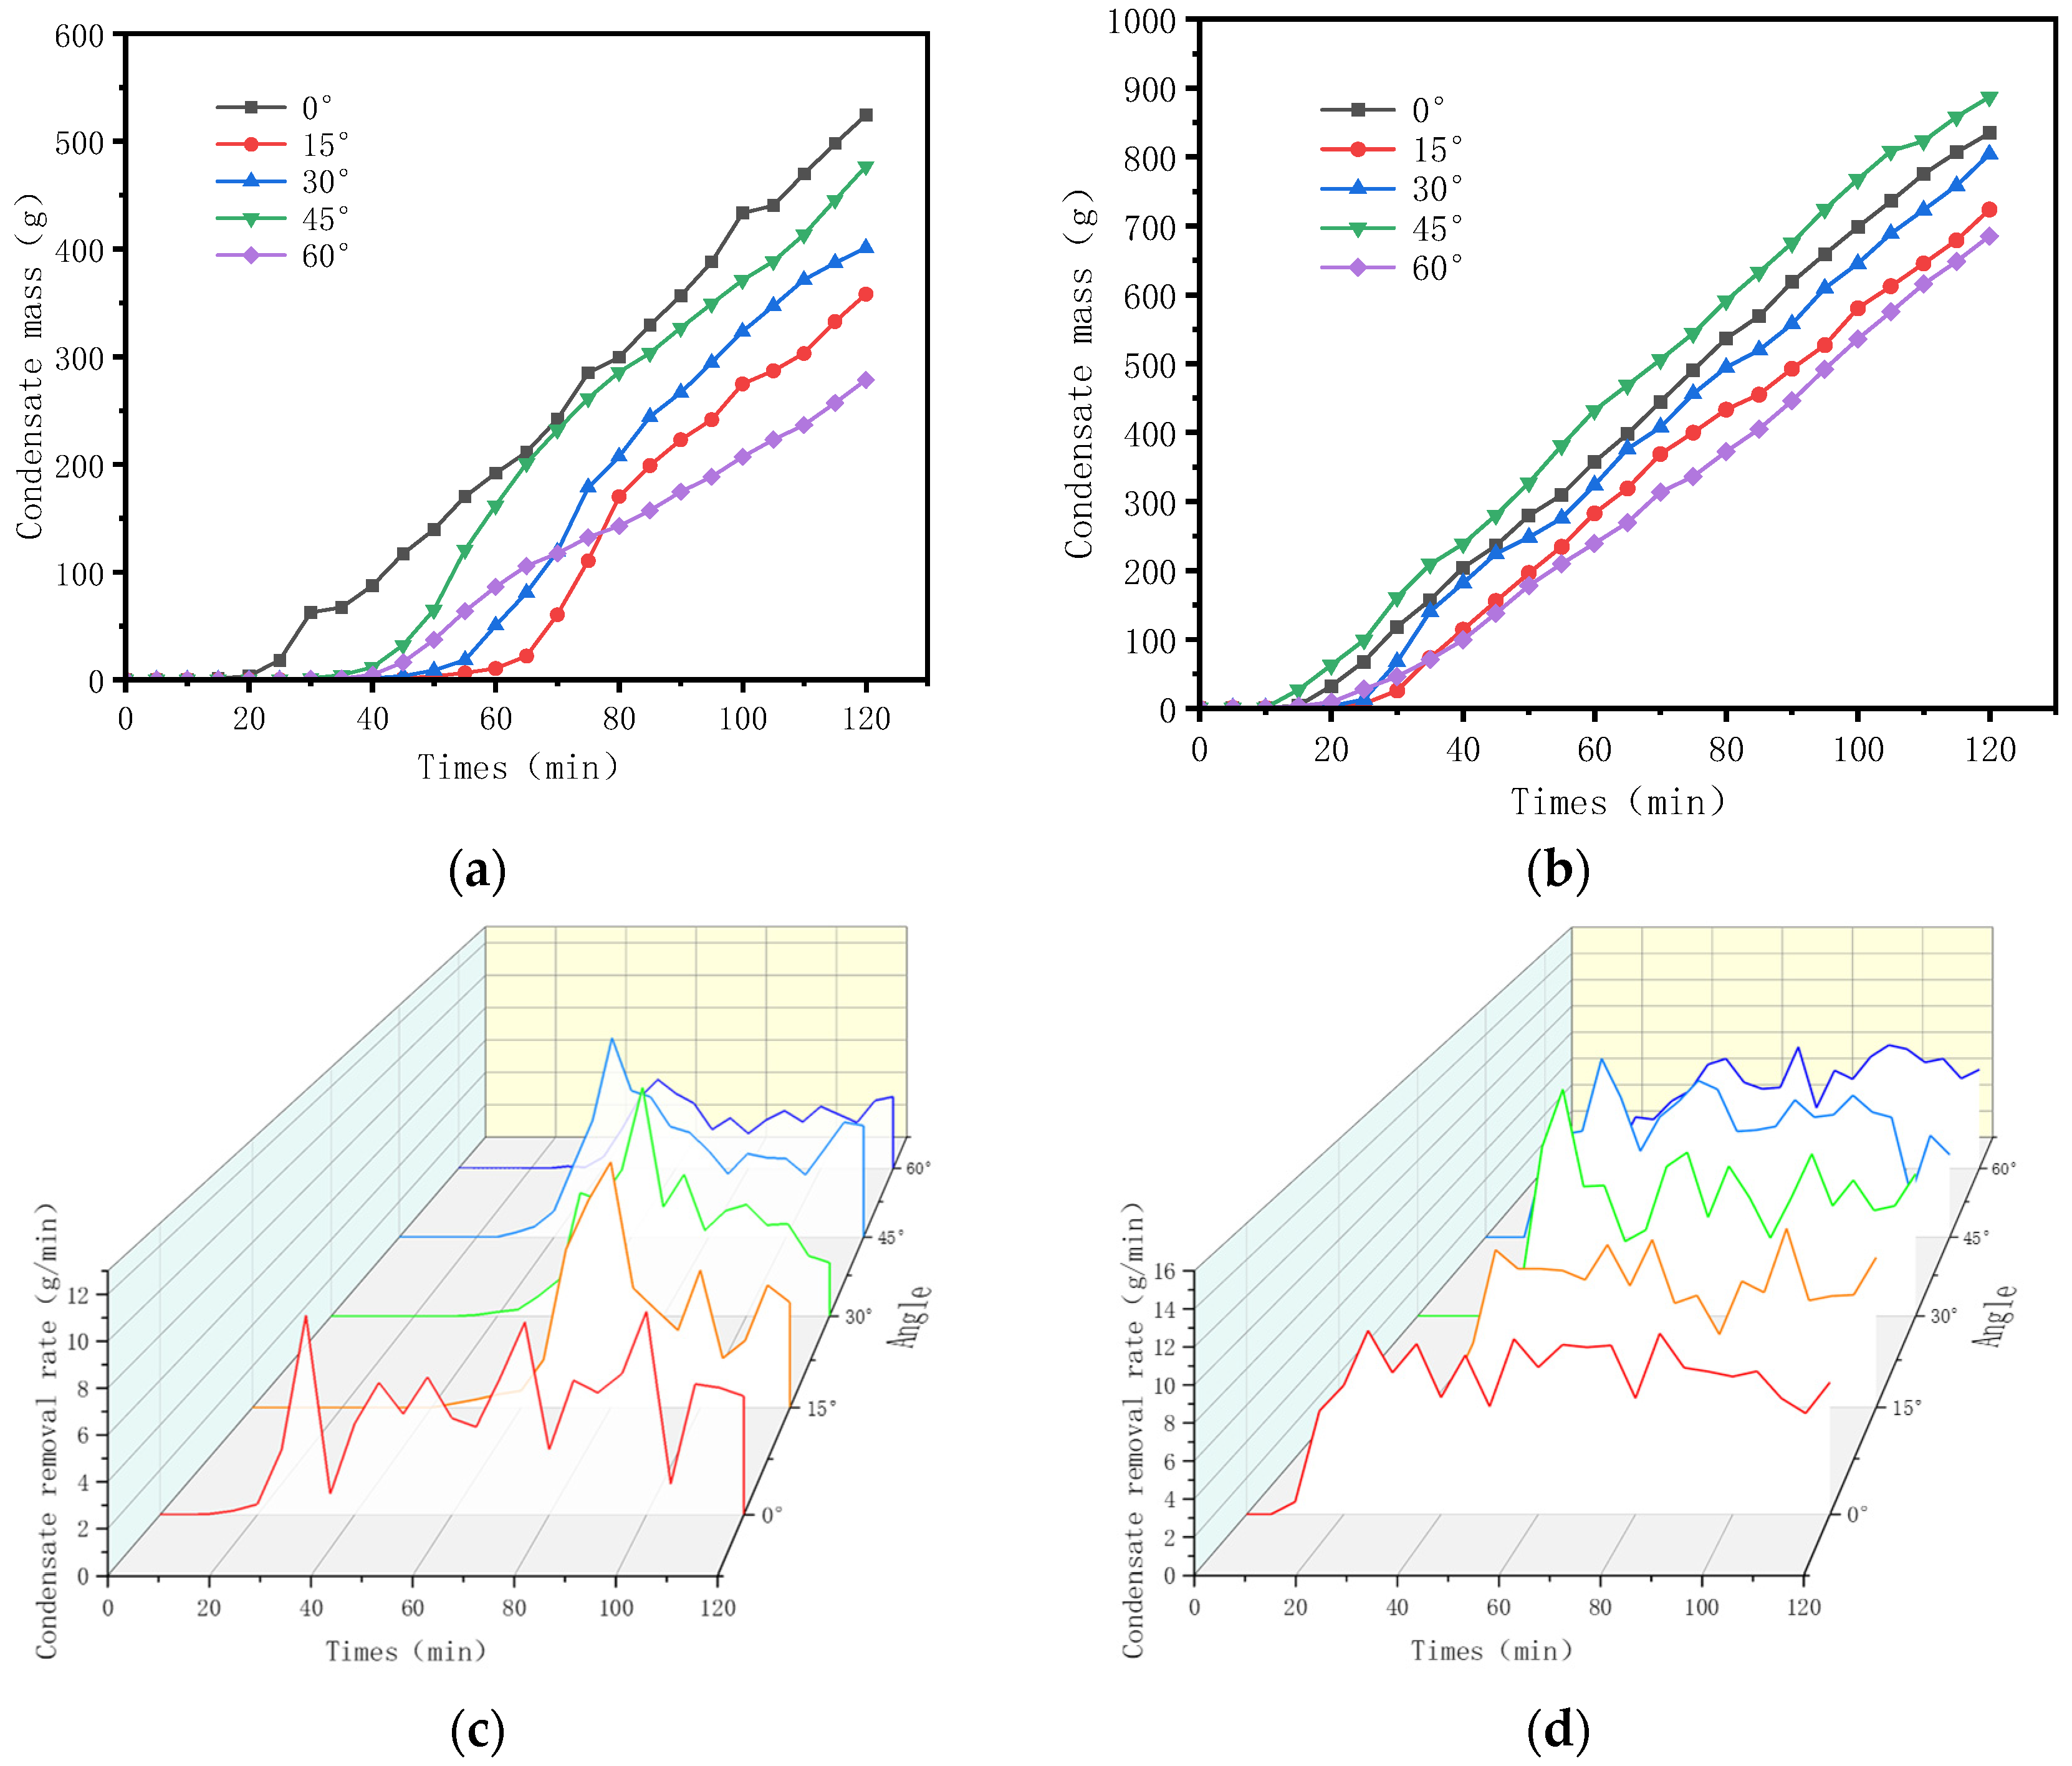
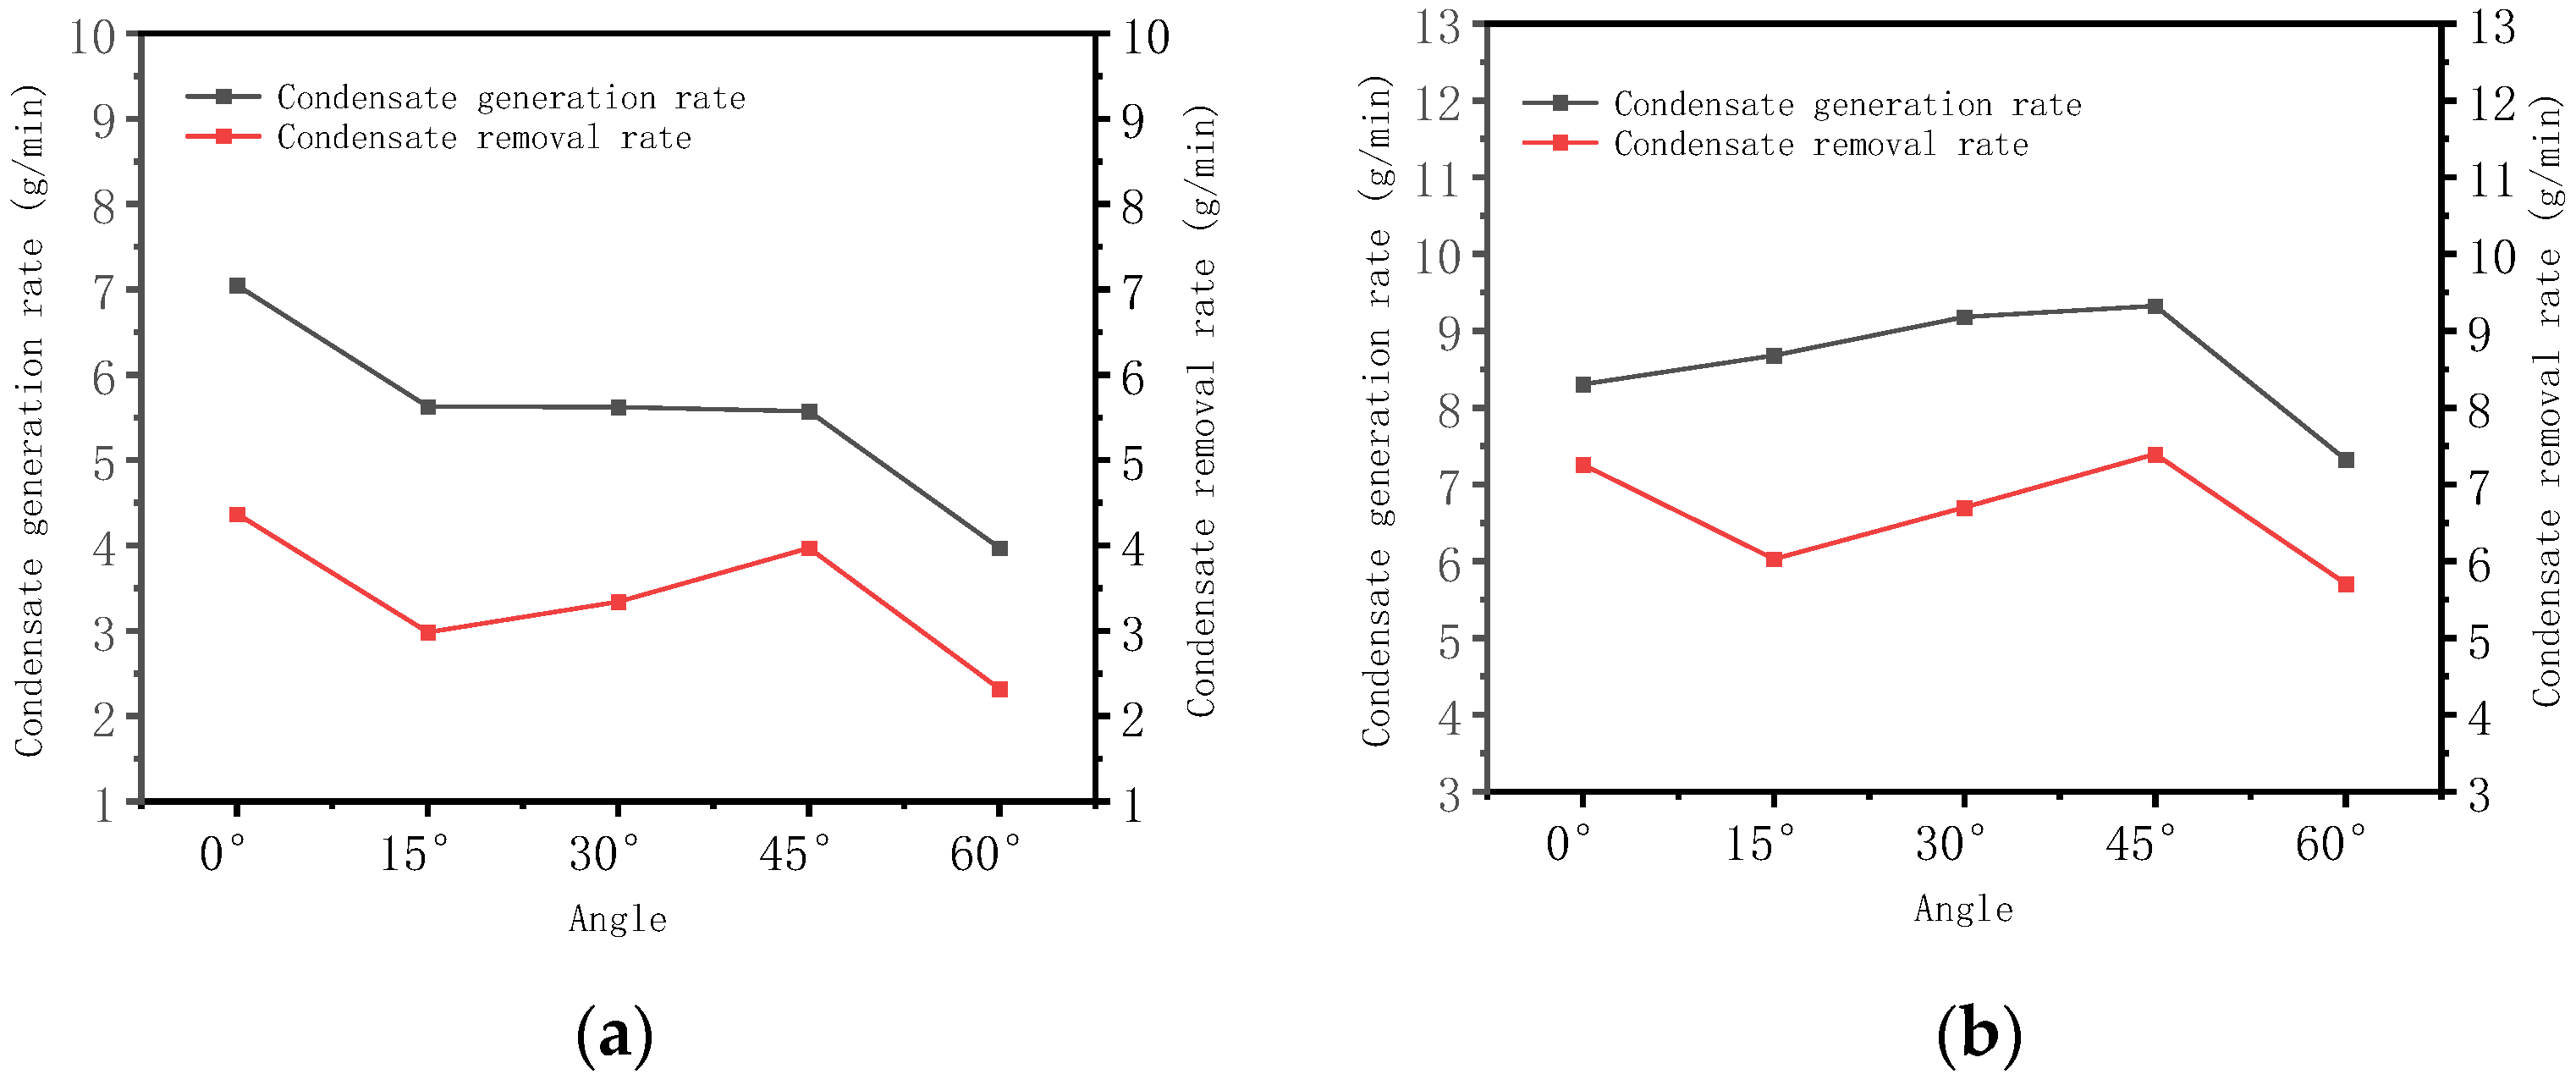
The Effect of Fin Inclination Angle on Condensate Mass and Condensation Rate

The inclination angle of the fins significantly influences the efficiency of condensate drainage. Increasing the fin inclination angle aids in the acceleration of droplet sliding, thereby reducing the retention of the water film [16]. Adjusting the fin inclination also enhances the disturbance within the internal flow field, which can strengthen heat transfer to a certain extent. As depicted in Figure 5, at a temperature of 22 °C and relative humidity of 85%, an inclination angle of 0° exhibited the best performance, with a condensate amount reaching 524.2 g in 120 min. In low-moisture environments, the mechanism of gravity-driven droplet sliding is particularly efficient. When the fins were positioned horizontally, the amount of condensate increased with the fin inclination angle. The flow separation effect between the fins intensified, which enhanced the internal disturbance and improved the heat transfer efficiency to some degree. The condensate amount increased from 358.0 g at a 15° angle to 476.7 g at a 45° angle, which is 9% less than that of vertical fins. However, further increasing the inclination angle exacerbated the adverse impact of flow separation on heat transfer, substantially reducing the heat transfer efficiency. Consequently, the condensate amount at a 60° angle was only 278.3 g. Under the conditions of 32 °C and 85% relative humidity, a 45° inclination angle demonstrated the best performance, with a condensate amount of 887.1 g in 120 min. This is because a moderate inclination angle balances turbulent disturbance and liquid film stability, effectively prolonging the air retention time and allowing complete latent heat release. In contrast, at a 0° inclination angle under high-temperature conditions, the reduction in liquid film viscosity and imbalance in shear force resulted in a condensate amount of approximately 5.8% less than that at a 45° inclination angle.
Analyzing the dynamic removal rates, it was observed that the fins oriented at various angles initially exhibited a zero-condensation removal rate, which then rapidly increased until reaching a peak, followed by a stable fluctuation phase. The time at which the peak dynamic removal rate occurred began to show an advancement trend from the 80th minute at a 15° inclination and reached the 55th minute at a 45° inclination. This indicates that increasing the fin inclination angle facilitates the earlier discharge of condensed liquid when the fins are oriented horizontally. Under conditions of 32 °C and 85% relative humidity, as the inclination angle increased from 15° to 45°, the condensation generation rate rose from 8.68 g/min to 9.32 g/min, and the removal rate increased from 6.03 g/min to 7.39 g/min. This was attributed to the higher moisture content in the air at elevated temperatures, which necessitates greater latent heat release. The 45° angle enhanced the condensation efficiency through improved surface liquid film distribution and the synergistic action of gravitational components, which boosted turbulent disturbance while maintaining film continuity. However, when the inclination angle reached 60°, the generation rate dropped sharply to 7.33 g/min, and the removal rate decreased to 5.71 g/min; this was primarily due to the flow separation effect reducing the effective heat exchange area and the disruption of the liquid film continuity. This suggests that in high-temperature environments, optimizing the inclination angle is crucial to delaying liquid film dispersion, whereas in low-temperature environments, transport pathways dominated by gravity are more effective.
Figure 6a,b illustrate the changes in the total condensation generation rate and total condensation removal rate with varying fin angles over a period of 120 min. As shown in the figure, under conditions of 22 °C and 85% relative humidity, the vertical fins exhibited the highest condensation generation and removal rates. This is because at a 0° angle, gravity directly influences the droplet’s descent, reducing the retention time of the liquid film and allowing efficient heat exchange between the moist air and the fins, and the Nusselt number reaches its maximum. When the angle increased to 15° and 30°, the Nusselt number gradually decreased, the condensation generation rate decreased to 5.62 g/min, and the removal rate dropped to 2.98 g/min and 3.34 g/min, respectively. At these angles, the condensation on the inclined surface is subjected to the combined forces of airflow drag and gravity along the fin direction. Due to the relatively small angle, the resultant force is less than the adhesion force of the wall, leading to localized droplet accumulation and a reduced heat transfer efficiency. Additionally, the turbulence induced by the inclined fins fails to effectively counteract the thickening of the liquid film. When the fin inclination was increased to 45°, the drainage rate rebounded to 3.97 g/min, and the Nusselt number reached the maximum value that was also observed with the horizontal fins. This indicates that a moderate inclination optimizes the dynamic balance of the liquid film, thereby enhancing droplet transport efficiency and heat transfer performance. During this phase, the component of gravity along the fin direction synergizes with the airflow shear force, preventing an excessive liquid film thickness from inhibiting heat transfer and reducing the retention of discrete droplets. However, when the angle further increased to 60°, the Nusselt number was at its minimum, the condensation generation rate sharply dropped to 3.97 g/min, and the removal rate decreased to 2.32 g/min. Excessive inclination results in increased resistance to incoming air and intensified disturbances within the fins, and at Re > 2300, the flow inside the fins is turbulent. Although the component of gravity along the fin direction is enhanced, the fluid kinetic energy within the boundary layer is gradually consumed by viscous forces, reducing flow speed to stagnation or even reverse flow. At this point, the originally attached streamlines detach, forming separation zones with vortices or backflow in certain areas [29,30]. The fluid within the separation zone detaches from the surface, significantly reducing or completely losing direct contact with the solid surface, resulting in flow separation effects and diminishing the effective heat exchange area of the fin surface.
In summary, as shown in the Figure 7, vertical or small angles (0°) are preferred at low temperatures to maximize the gravity effects, while moderate angles (45°) should be employed at high temperatures to balance turbulence and liquid film stability. This conclusion provides experimental evidence for the design and dynamic regulation of fin angles in condensers across varying temperature and humidity conditions.

3.2. The Effect of Flow Velocity on the Fin Surface Drainage Characteristics and Heat Transfer Performance

From the experiment in the previous section, 45 ° was found to be the optimal inclination angle. This section explores the influence of wind speed on the condensation removal and heat exchange efficiency of the heat exchanger with a 45 ° fin inclination angle. In order to avoid large changes in the greenhouse environment due to wind, which can negatively affect crop growth [31], this study used a low wind speed of 1–2.5 m/s as the experimental conditions.

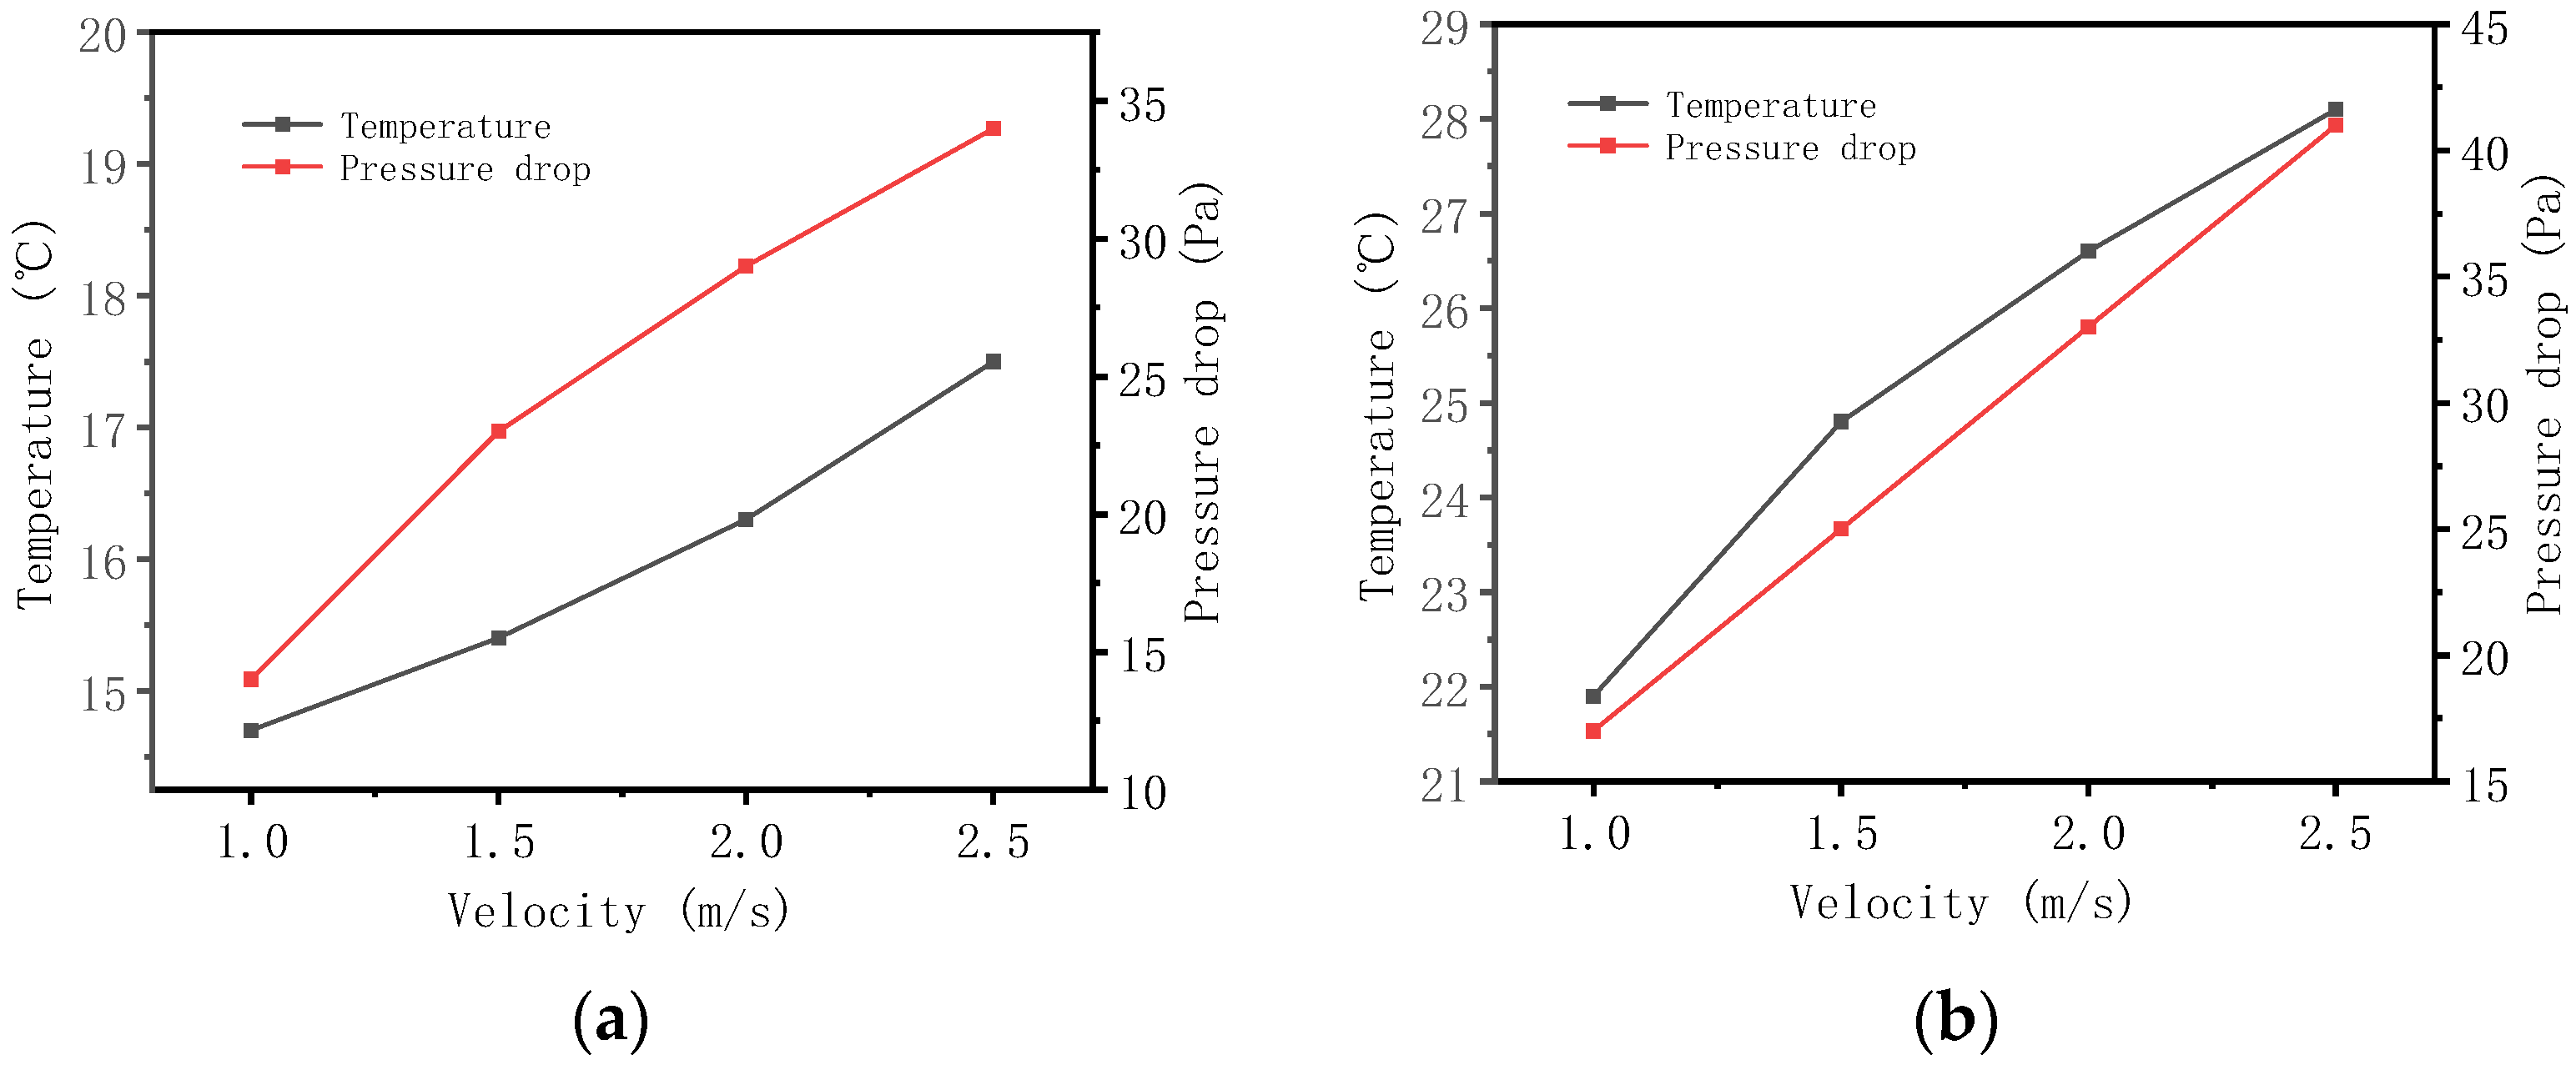
3.2.1. The Effect of Air Velocity on the Outlet Air Temperature and Pressure Drop

Figure 8 shows the impact of wind speed on the outlet air temperature and air-side pressure drop under an air inlet temperature of 22 °C and a relative humidity of 85%. Both the outlet air temperature and air-side pressure drop increased with higher wind speeds. As the wind speed rose from 1.0 m/s to 2.5 m/s, the outlet air temperature increased from 14.7 °C to 17.5 °C, and the air-side pressure drop rose from 14 Pa to 35 Pa. This indicates that wind speed significantly affects the heat transfer characteristics of airflow, with the outlet air temperature increasing by approximately 0.93 °C for every 0.5 m/s increase in wind speed.
The slope of the pressure drop curve indicated that the increase in pressure drop slowed as wind speed rose. As wind speed increases, the time that air spends passing through the fins decreases, preventing most of the air from fully exchanging heat. Additionally, with a constant duct cross-sectional area, the airflow volume increases. Consequently, both the heat exchange time and area per unit mass of air decrease, reducing the heat exchange per unit mass and raising the outlet temperature. Higher wind speeds create more air vortices between fins, increasing the internal viscous resistance and somewhat enhancing the heat exchange efficiency. However, increased wind speed also intensifies air turbulence through fin gaps, raising resistance losses. As shown in Figure 8, higher wind speeds increased surface condensation, reduced the flow area, and further elevated the airflow resistance. Thus, as wind speed increases, the air-side pressure drop also rises.

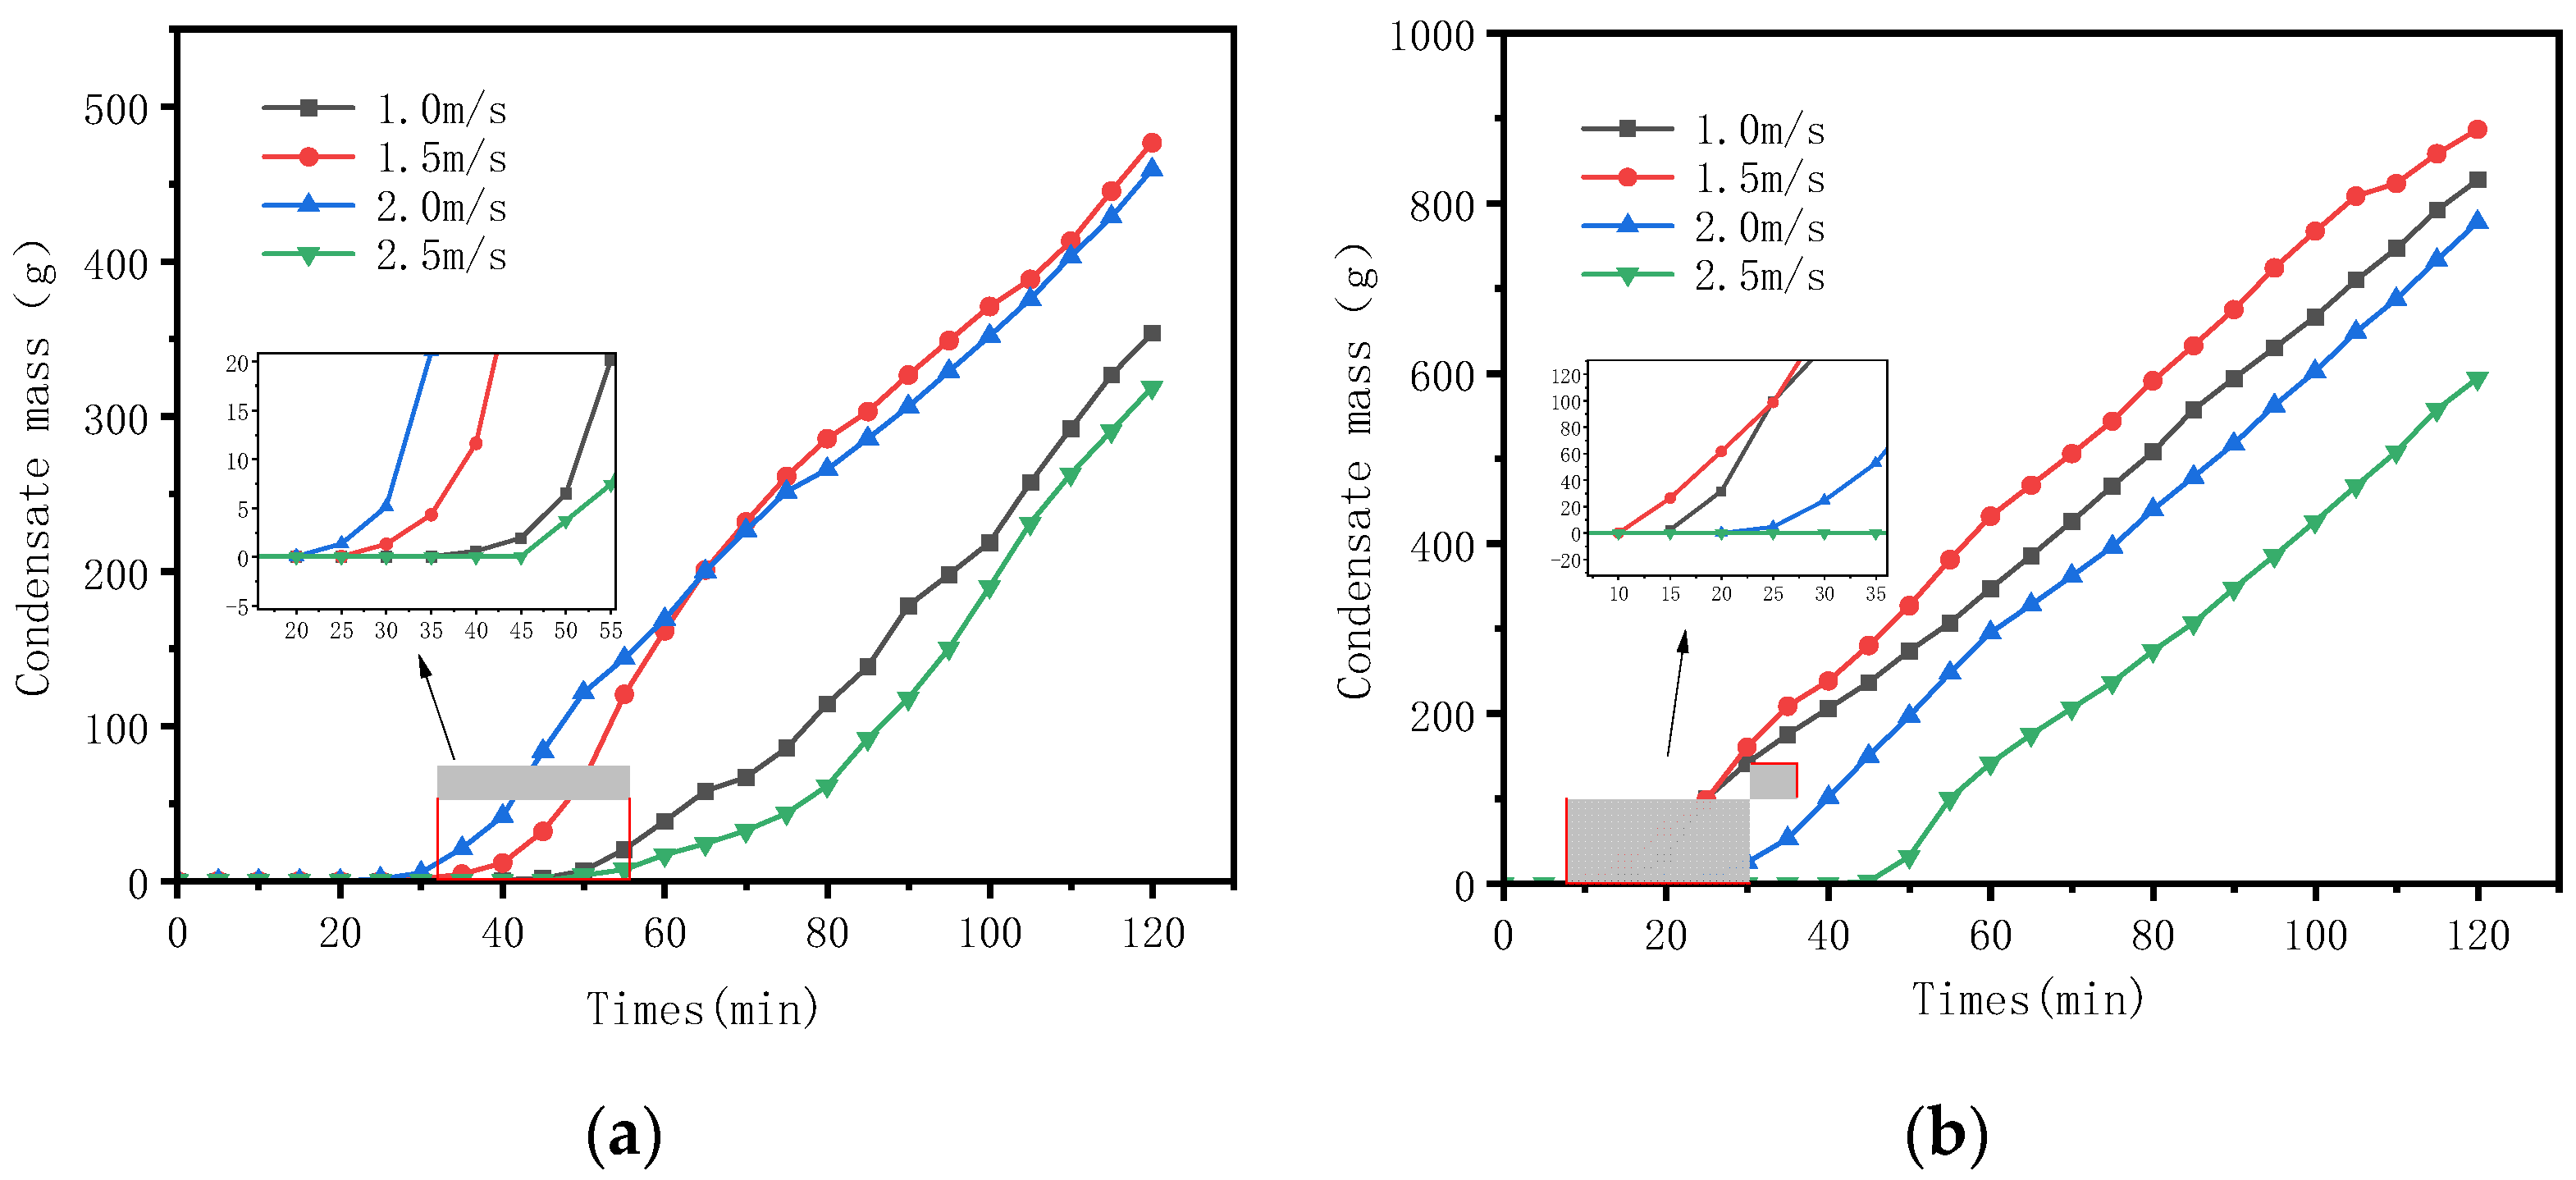
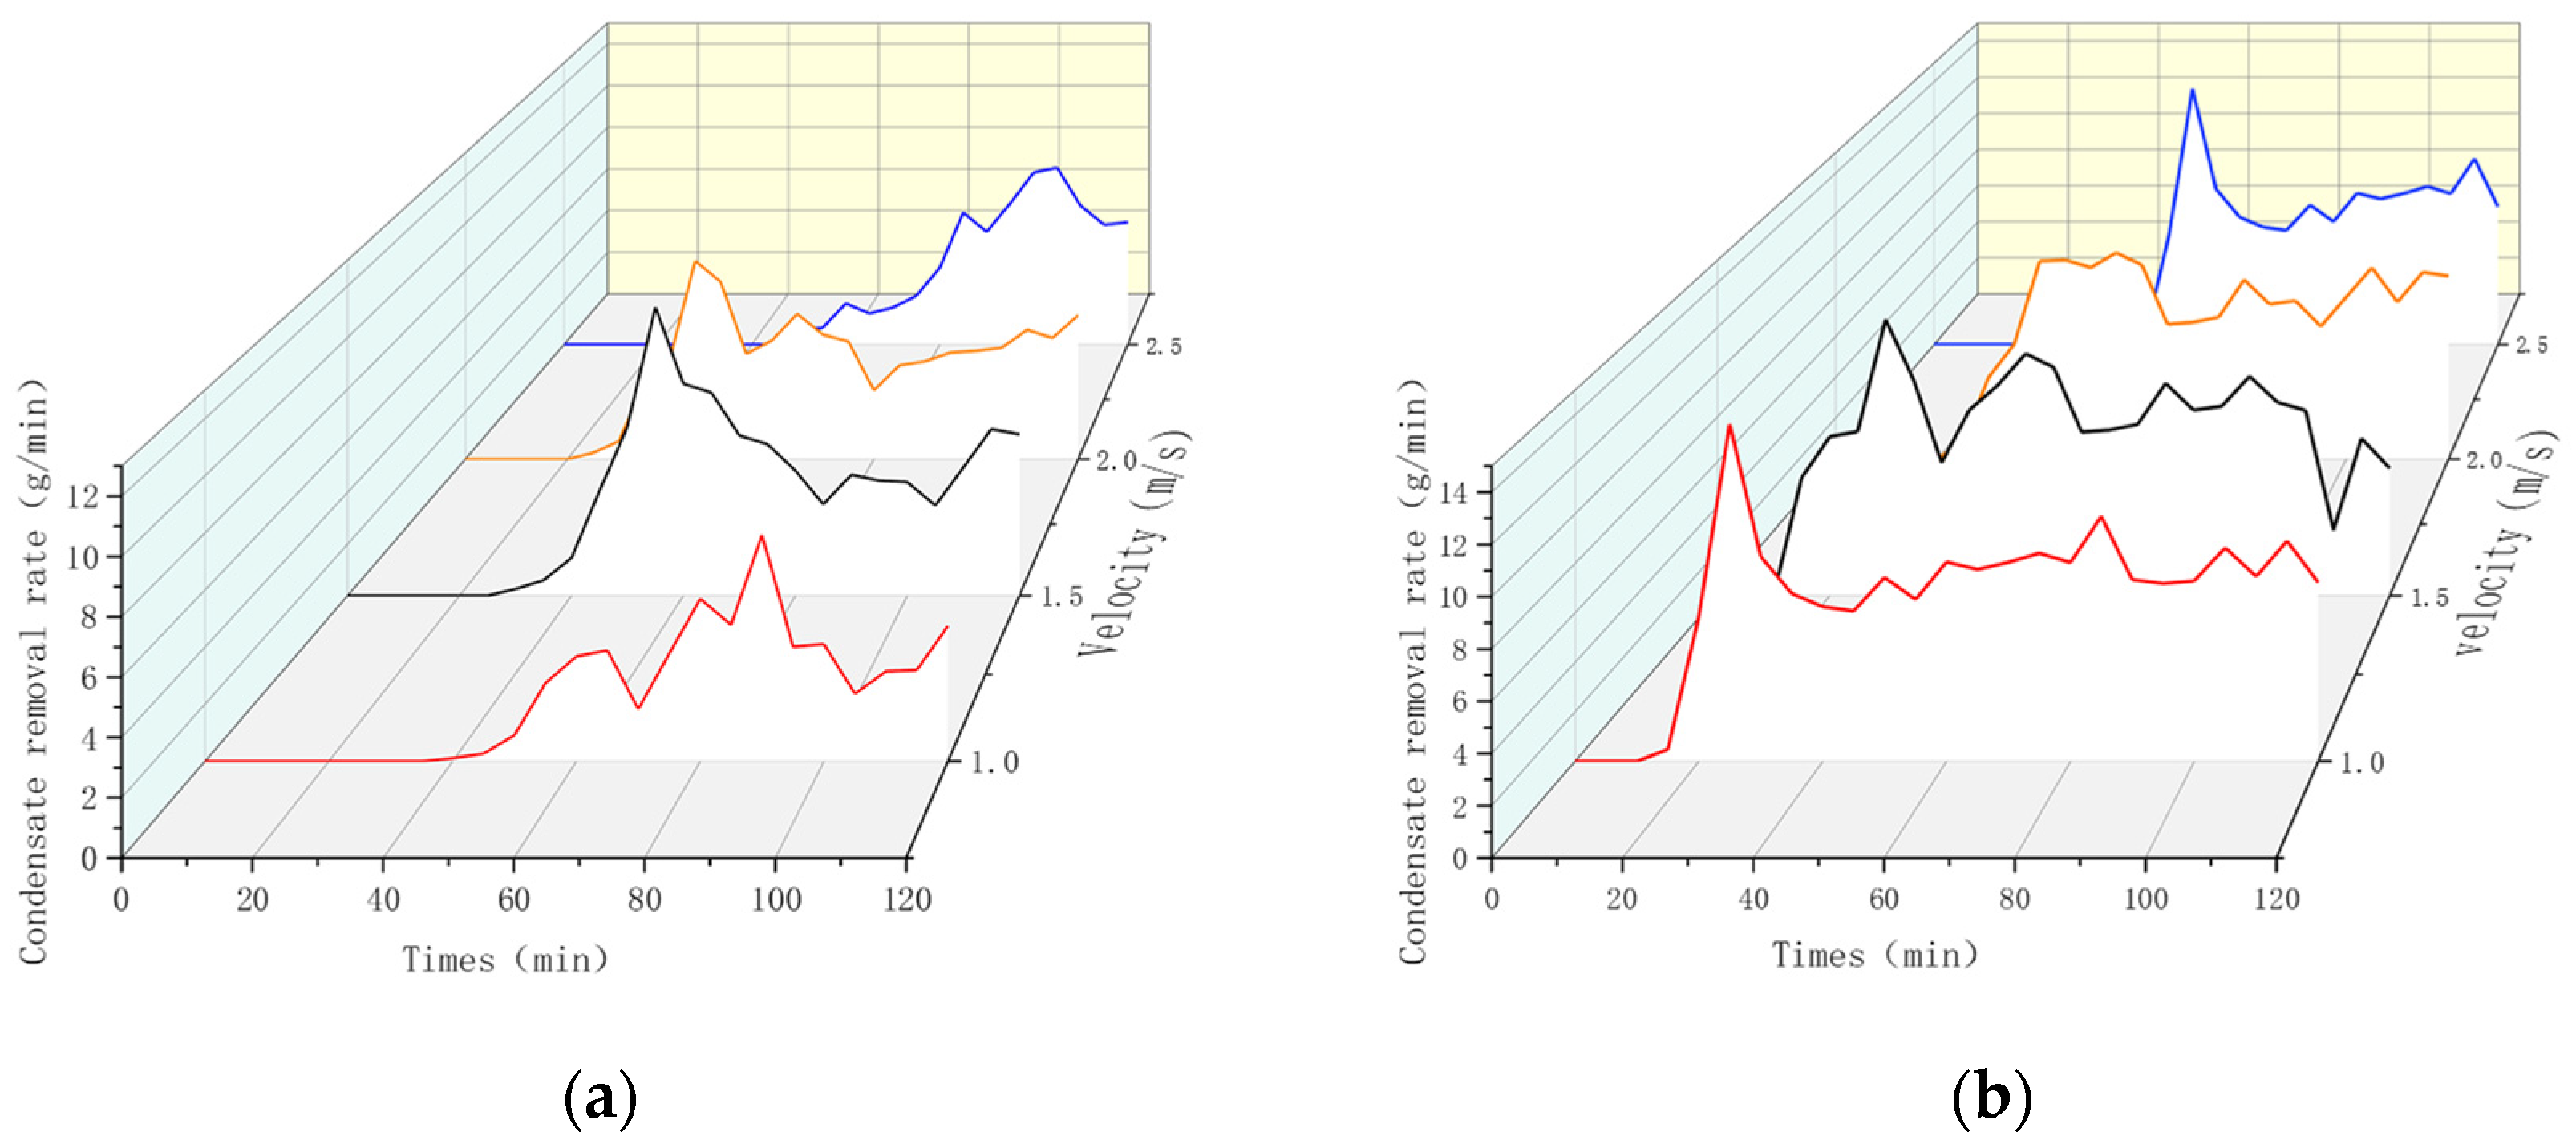
3.2.2. The Influence of Air Velocity on the Amount and Rate of Condensate Water

As depicted in Figure 9a, at a temperature of 22 °C, the final condensation amounts after a two-hour experiment were 353.80 g, 476.77 g, 459.40 g, and 318.68 g, respectively. An increase in wind speed from 1.0 m/s to 1.5 m/s resulted in a 34% rise in the condensation amount. However, when the wind speed was further increased to 2.0 m/s, there was a slight decrease of 3% in the condensation amount. A substantial decline of 33% was observed when the wind speed reached 2.5 m/s compared to the peak condensation amount. The accumulation of condensation exhibited nonlinear characteristics and a critical wind speed threshold effect. The 1.5 m/s and 2.0 m/s conditions demonstrated advantages at different stages: 1.5 m/s showed stable growth through continuous liquid film transport between the 50th and 90th minutes, while 2.0 m/s induced an increase in the condensation rate to 3.06 g/min between the 90th and 120th minutes due to enhanced inertial transport of discrete droplets, ultimately reaching a total of 459.4 g and surpassing the condensation amount at 1.5 m/s during the same period. In contrast, at 2.5 m/s, the excessive flow speed resulted in a shorter heat exchange time with the fins and a smaller latent heat exchange, leading to significantly lower condensation amounts compared to the other conditions. Condensation first appeared at the 25th minute under the 2.0 m/s wind speed, followed by 1.5 m/s, 1.0 m/s, and 2.5 m/s. The earlier onset of condensation removal at 2.0 m/s was due to multiple factors. According to thermal boundary layer theory, an appropriate wind speed enhances turbulence, which thins the thermal boundary layer, thereby increasing the heat transfer efficiency and accelerating latent heat release. Under this condition, excessively high wind speeds result in droplet retention, while wind speeds that are too low lead to overly thick liquid films. The retention time of air for heat exchange is also a factor influencing the condensation removal time; the downward removal of condensed liquid on the fins only begins when the force of gravity and the airflow drag exceed the resistance. In summary, a wind speed of 2.0 m/s induces an early start of the condensation process by balancing the nonlinear relationship between turbulence intensity, liquid film stability, and retention time.
Under high-temperature conditions, as shown in Figure 9b, condensation first appeared at the 10th minute at a wind speed of 1.5 m/s, followed by wind speeds of 1 m/s, 2 m/s, and 2.5 m/s. The amount of condensation varied significantly over time with the different wind speeds. At 1.0 m/s, the initial condensation growth was slow from 0 to 25 min, but the rate increased from 75 to 120 min. This indicates that at low wind speeds, the initial formation of condensate is slow, but it efficiently accumulates later through continuous liquid film transport.
Under a wind speed of 1.5 m/s, the system demonstrated the best performance, achieving a condensate amount of 887.1 g after 120 min. This was attributed to the moderate turbulence intensity, which ensures a balance between air retention time and the latent heat release requirement. In contrast, at 2.0 m/s, the initial rate of increase in condensate was relatively rapid; however, the subsequent rate slowed due to the disruption of the liquid film, limiting the efficiency of discrete droplet transport. At 2.5 m/s, the high-speed airflow resulted in a significant inertial effect, reducing the air retention time and consequently decreasing latent heat release, leading to a final condensate amount that was markedly lower than that of the other conditions. Overall, the wind speed of 1.5 m/s emerged as the best choice for high-temperature and high-humidity environments by effectively balancing turbulence disturbances with liquid film stability. This was due to the changes in the physical properties of humid air and condensate water on the fins at elevated temperatures, where the saturated vapor pressure of humid air increases, along with its specific heat capacity, thermal conductivity, and viscosity. Conversely, the surface tension, thermal conductivity, specific heat capacity, and viscosity of liquid water decrease with rising temperature, particularly the dynamic viscosity of water, which drops sharply. This allows stable transport at 1.5 m/s through a balance of shear force and gravity under high temperatures. In contrast, at 2.0 m/s, the excessive airflow drag causes liquid film dispersion, resulting in lower condensation efficiency compared to the other conditions. Under high-temperature conditions, the moisture content in the air doubles, and the latent heat required for liquefaction significantly increases, necessitating more heat exchange time for latent heat release. Consequently, the condensate amount at a wind speed of 1.0 m/s was higher than that at 2.0 m/s.
Figure 10 illustrates that under varying wind speed conditions, the rate of condensate removal exhibited significant fluctuations, which gradually diminished and eventually stabilized. Notably, the timing of condensate formation did not coincide with its removal, resulting in a drainage curve characterized by multiple peaks. Additionally, the experiments conducted at higher wind speeds revealed the presence of minute water droplets on the wind tunnel walls behind the fin’s outlet side. This observation indicates that higher air velocities can carry away small amounts of condensate, and some moist air is expelled from the fin before complete heat exchange occurs.
Figure 11 depicts the relationship between wind speed and the rates of both condensate formation and removal under steady-state conditions across different experimental setups. The data demonstrate that within the wind speed range of 1.0 m/s to 1.5 m/s, the condensate formation rate increased with rising wind speed. This increase was attributed to two factors: the enhanced turbulence effect, which improves the convective heat transfer coefficient between the fin surface and the air, and the increased volumetric flow rate of air, which raises the total amount of moist air involved in the phase change, thus promoting the condensation process. However, when the wind speed exceeded 1.5 m/s, a turning point occurred in the condensate formation rate. Although the turbulence intensity continued to rise with wind speeds up to 2.5 m/s, the reduced air residence time led to a decrease in the latent heat release per unit mass of air. Consequently, despite the increased total airflow, the effective amount of condensate per heat exchange cycle significantly declined, ultimately reducing the overall condensate formation rate. The relationship between the wind speed and condensate formation rate exhibited a unimodal characteristic, with the peak occurring at a wind speed of 1.5 m/s. This suggests the existence of a critical threshold in the coupling of aerodynamic characteristics and mass transfer processes, beyond which flow inertia dominates the heat exchange process.

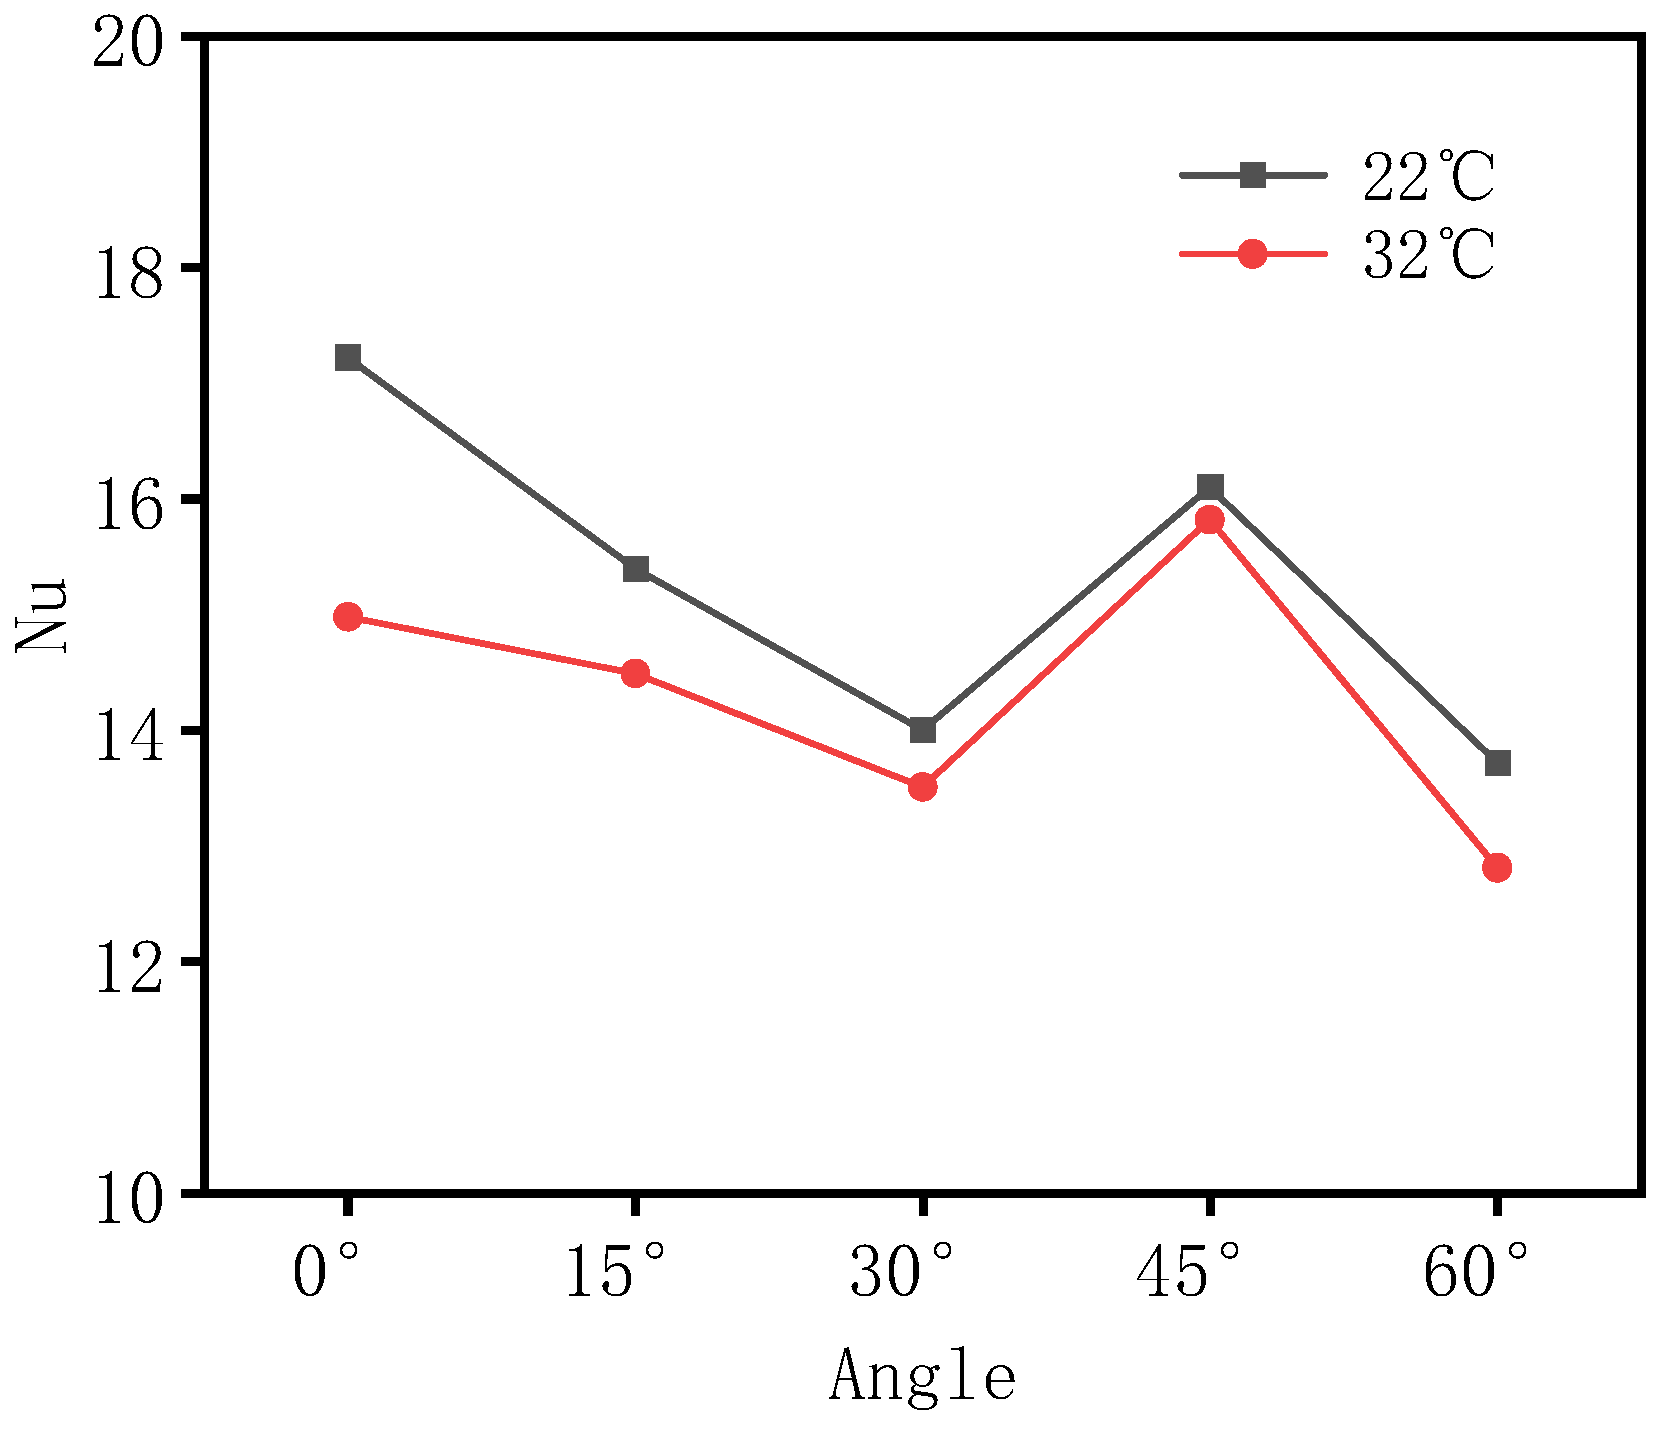
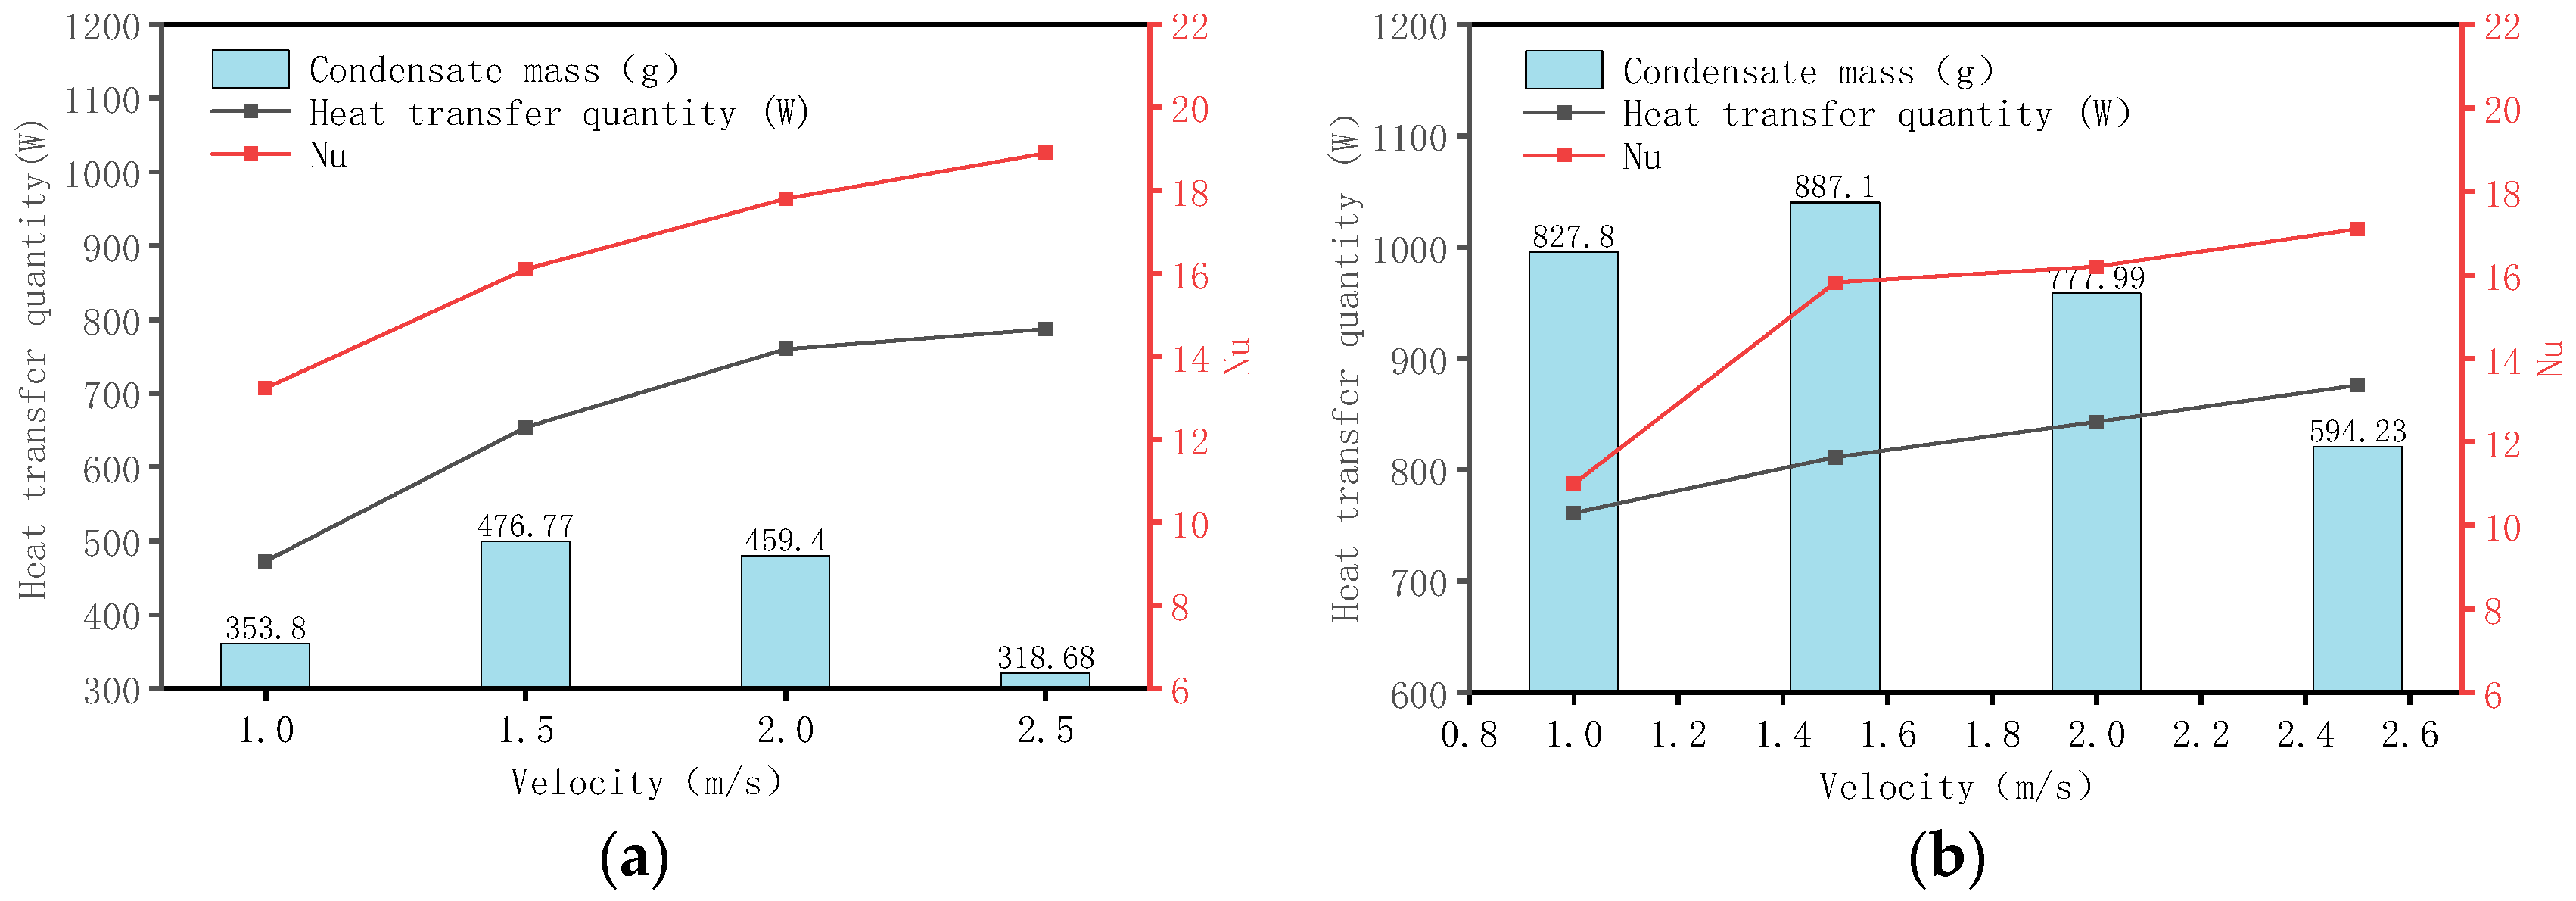
3.2.3. The Influence of Air Velocity on the Heat Transfer Efficiency of Fins

Figure 12 illustrates the variation in heat transfer and the air-side heat transfer coefficients with wind speed. An increase in wind speed from 1 m/s to 1.5 m/s resulted in enhancements in both heat transfer and condensation. At 22 °C and 85% relative humidity, the heat transfer increased from 472 W at 1 m/s to a peak of 787 W at 2 m/s, while the condensation amount rose from 353 g to 459 g. However, when the wind speed was further increased to 2.5 m/s, although the air-side convective heat transfer coefficient remained high, the condensate amount decreased by approximately 20% due to the combined effects of the shortened contact time between the air and the fin surface, the rebound of the fin surface temperature, and the removal of condensate by the airflow. Over the inlet wind speed range of 1.0 m/s to 2.5 m/s, the Nu increased with wind speed; compared to Tin = 32 °C, at Tin = 22 °C the Nu increased by approximately 0.16 to 0.75 times, which is consistent with the findings of Hu [10]. This reduction was attributed to the shortened contact time between the air and fin surface, the rise in the fin surface temperature, and the removal of condensation by the airflow. Under the conditions of 32 °C and 85% relative humidity, the absolute humidity was higher, resulting in greater overall heat transfer and condensation compared to the 22 °C condition, yet the effect of wind speed followed a similar trend, achieving optimal performance at moderate wind speeds. This phenomenon indicates that at low wind speeds, a thicker boundary layer results in insufficient heat transfer, whereas high wind speeds enhance convective heat transfer but are limited by other thermal resistances of the heat exchanger and insufficient air residence time on the fin surface, ultimately not improving the overall heat transfer capacity and condensation collection efficiency.
In terms of engineering applications, it is crucial to complete moisture recovery within two hours after watering in a greenhouse, as humid air begins to escape after this period. In the high-humidity environment of a summer greenhouse, a dynamic control strategy can be employed: initially (0–30 min), use a wind speed of 2.0 m/s to enhance turbulent disturbance and then quickly disrupt the initial humidity balance; in the middle phase (30–90 min), switch to 1.5 m/s to maintain liquid film continuity and ensure stable mass transfer; and in the final phase (after 90 min), adjust the wind speed to 1.0 m/s to extend the air residence time and fully release any residual latent heat. In a winter greenhouse, the strategy after midday watering should involve initially (0–50 min) using a wind speed of 1.5 m/s to establish a continuous liquid film, transitioning to 2.0 m/s in the middle phase to accelerate transport, and maintaining inertial effects in the final phase. This study elucidates the coupled mechanism of temperature, wind speed, and liquid film dynamics, providing experimental evidence for adaptive environmental parameter control in the retrofitting of existing greenhouse HVAC systems and the design of new greenhouse humid air recovery systems.

4. Conclusions

This study investigated the impact of fin inclination and airflow velocity on dehumidification efficiency and heat exchange performance under varying environmental conditions. Through wind tunnel simulation experiments, the effects of different humid air inlet velocities (1.0–2.5 m/s) and fin inclinations (0–60°) on the amount of condensate, the condensation rate, and the fin heat exchange performance were examined in two temperature environments (22 °C and 32 °C with 85% relative humidity). The condensation state on the fin surface and the dynamic characteristics of the liquid film during the condensation process were analyzed. The experimental results indicated the following:
  • At 22 °C with 85% relative humidity, the vertical fins (0° inclination) performed best, achieving a condensate amount of 524.2 g within 120 min. Gravity-driven droplet movement facilitated rapid sliding, minimizing the liquid film retention time and maximizing heat exchange. As the inclination increased, the liquid film coverage decreased, and flow separation effects became significant, leading to a reduced heat exchange efficiency and a decrease in the condensate amount to approximately 278.3 g.
  • At 32 °C with 85% relative humidity, a 45° inclination yielded the best performance, with a condensate amount of 887.1 g in 120 min. At this moderate inclination, a balance between turbulent disturbance and liquid film stability was achieved, extending the air residence time and enhancing latent heat release. In contrast, at 0° under high temperatures, the reduced viscosity of the liquid film and insufficient shear force resulted in a condensate amount approximately 5.8% lower than that at a 45° inclination.
  • When the wind speed increased from 1.0 m/s to 2.5 m/s, both the outlet air temperature and air-side pressure drop rose. The rate of condensation exhibited a unimodal characteristic, peaking at a wind speed of 1.5 m/s. Within the 1.0–1.5 m/s range, enhanced turbulence promoted convective heat exchange, and the condensation rate increased with wind speed; however, beyond 1.5 m/s, the reduced air residence time led to insufficient latent heat release, resulting in a lower condensation rate.
  • For desert greenhouses, a dynamic strategy for adjusting wind speed and fin heat exchanger angle is recommended. In low-temperature environments (22 °C and 85% humidity), vertical fins (0° inclination) combined with a wind speed of 2.0 m/s should be used to promote droplet sliding through gravity, avoiding flow separation induced by inclinations greater than 30°. In high-temperature environments (32 °C), switching to a 45° inclination and a wind speed of 1.5 m/s balances turbulent disturbance with liquid film stability.
This study provides experimental evidence for the design and dynamic fuzzy-controlled optimization of heat exchanger inclinations and air duct velocities under varying temperature and humidity conditions. By implementing fuzzy logic technology to intelligently adjust fin inclination angles and airflow speeds in response to real-time environmental parameters, the system achieves enhanced humid air recovery efficiency. The findings offer advanced theoretical support and practical engineering references for optimizing water recovery performance in desert greenhouse environments during noon periods through adaptive control strategies.
The findings of this study are applicable only to condensation and heat transfer in bare flat-fin heat exchangers. Surface coatings have a significant impact on the formation and drainage of condensate; hydrophilic coatings facilitate the formation of condensation nuclei, while hydrophobic coatings help the sliding off of condensation liquid, and their effects could differ from those reported in this study. As the use of hydrophobic and hydrophilic coatings in heat exchangers becomes increasingly widespread, research into their influence on surface condensate drainage characteristics and heat transfer performance warrants further attention. Furthermore, with the continual development of fin designs, the surface structures of heat exchangers are becoming more complex. Novel fin structures that address the distribution of condensate under inclined conditions can be developed to further enhance drainage performance.

Author Contributions

Conceptualization, M.Z. and F.B.; methodology, F.B.; software, F.B.; validation, F.B., Y.L. (Yuru Liu) and Y.L. (Yingjie Liu); formal analysis, F.B. and Y.M.; investigation, R.Y.; resources, M.Z.; data curation, F.B.; writing—original draft preparation, F.B.; writing—review and editing, M.Z.; visualization, F.B.; supervision, M.Z.; project administration, M.Z. and B.R.; funding acquisition, M.Z. All authors have read and agreed to the published version of the manuscript.

Funding

This work was supported by the National Key R&D Program of China (2022YFE0126900) under the project titled “Research and implementation of key technologies of clean energy supply system for energy-saving and water-saving agricultural greenhouses in arid areas” and the Inner Mongolia Science & Technology Plan (2023KJHZ0032) under the project titled “Design and Optimization of an Energy- and Water-Saving System Under the Coupling Effect of Solar Agricultural Greenhouses and Desert Ecological Environment”.

Data Availability Statement

The original contributions presented in the study are included in the article, further inquiries can be directed to the corresponding author.

Conflicts of Interest

The authors declare no conflicts of interest.

Nomenclature

Atotal surface heat transfer area [m2]∆Tlmlogarithmic mean temperature difference
Aminminimum cross-sectional area for flow in the flow channel [m2]Tininlet air temperature [°C]
Aototal interfacial area between the air-side fluid and the solid [m2]Toutoutlet air temperature [°C]
d1humidity of inlet air [g/kg]Twallwall temperature [°C]
d2humidity of outlet air [g/kg]umminimum flow surface air velocity [m/s]
erelative errorV1condensate formation rate [g/min]
Gair mass flow [kg/s]V2condensate removal rate [g/min]
hair-side heat transfer coefficient [kJ/kg]V3condensate aggregation rate [g/min]
haair-side convective heat transfer coefficient [W/(m K)] ω nabsolute error
hnair enthalpyxindependent variable
Lxlength of the heat transfer channel [m]ydependent variable
∆mcondensate water weight change value [g] λ air thermal conductivity [W/(m K)]
NuNusselt numberσstandard deviations
Qsensible heat transfer [kg/s] υ air kinematic viscosity [m2/s]
∆tcondensation time [min]

References

  1. Özçelep, Y.; Bekdaş, G.; Apak, S. Meeting the Electricity Demand for the Heating of Greenhouses with Hydrogen: Solar Photovoltaic-Hydrogen-Heat Pump System Application in Turkey. Int. J. Hydrogen Energy 2023, 48, 2510–2517. [Google Scholar] [CrossRef]
  2. Villagran, E.; Bojacá, C.; Akrami, M. Contribution to the Sustainability of Agricultural Production in Greenhouses Built on Slope Soils: A Numerical Study of the Microclimatic Behavior of a Typical Colombian Structure. Sustainability 2021, 13, 4748. [Google Scholar] [CrossRef]
  3. Miller, A.; Langenhoven, P.; Nemali, K. Maximizing Productivity of Greenhouse-Grown Hydroponic Lettuce during Winter. HortScience 2020, 55, 1963–1969. [Google Scholar] [CrossRef]
  4. Zhao, M.; Wang, N.; Chang, C.; Hu, X.; Liu, Y.; Liu, L.; Wang, J. Comparative Analysis of the Filling Mass of Vertical Heat Exchanger Tubes on the Thermal Environment of Arched Greenhouses. Energies 2023, 16, 5118. [Google Scholar] [CrossRef]
  5. Davies, P.A.; Zaragoza, G. Ideal Performance of a Self-Cooling Greenhouse. Appl. Therm. Eng. 2019, 149, 502–511. [Google Scholar] [CrossRef]
  6. Fatnassi, H.; Poncet, C.; Bazzano, M.M.; Brun, R.; Bertin, N. A Numerical Simulation of the Photovoltaic Greenhouse Microclimate. Sol. Energy 2015, 120, 575–584. [Google Scholar] [CrossRef]
  7. Albornoz, F.; Del Río, C.; Carter, V.; Escobar, R.; Vásquez, L. Fog Water Collection for Local Greenhouse Vegetable Production in the Atacama Desert. Sustainability 2023, 15, 15720. [Google Scholar] [CrossRef]
  8. Piscia, D. Analysis of Night-Time Climate in Plastic-Covered Greenhouses. Ph.D. Thesis, Universitat Politecnica de Catalunya, Barcelona, Spain, 2012. [Google Scholar]
  9. Maslak, K.; Nimmermark, S. Thermal Energy Use for Dehumidification of a Tomato Greenhouse by Natural Ventilation and a System with an Air-to-Air Heat Exchanger. Agric. Food Sci. 2017, 26, 56–66. [Google Scholar] [CrossRef]
  10. Hu, W.-L.; Ma, A.-J.; Guan, Y.; Cui, Z.-J.; Zhang, Y.-B.; Wang, J. Experimental Study of the Air Side Performance of Fin-and-Tube Heat Exchanger with Different Fin Material in Dehumidifying Conditions. Energies 2021, 14, 7030. [Google Scholar] [CrossRef]
  11. Muneeshwaran, M.; Wang, C.-C. Superhydrophobic Fins with Inclined Arrangement for Enhancing Energy Saving of Air-Cooled Wet Heat Exchangers. Int. J. Heat Mass Transf. 2021, 178, 121636. [Google Scholar] [CrossRef]
  12. Kim, M.-H.; Youn, B.; Bullard, C.W. Effect of Inclination on the Air-Side Performance of a Brazed Aluminum Heat Exchanger under Dry and Wet Conditions. Int. J. Heat Mass Transf. 2001, 44, 4613–4623. [Google Scholar] [CrossRef]
  13. Kim, M.-H.; Song, S.; Bullard, C.W. Effect of Inlet Humidity Condition on the Air-Side Performance of an Inclined Brazed Aluminum Evaporator. Int. J. Refrig. 2002, 25, 611–620. [Google Scholar] [CrossRef]
  14. Kim, N.-H.; Kim, D.-Y.; Hwang, J.-H. Wet Surface Heat Transfer and Pressure Drop of Aluminum Parallel Flow Heat Exchangers at Different Inclination Angles. J. Mech. Sci. Technol. 2008, 22, 2498–2508. [Google Scholar] [CrossRef]
  15. Wang, X.; Xu, W.; Chen, Z.; Xu, B. Dropwise Condensation Heat Transfer on Nanostructured Superhydrophobic Surfaces with Different Inclinations and Surface Subcoolings. Int. J. Heat Mass Transf. 2021, 181, 121898. [Google Scholar] [CrossRef]
  16. Gungor, S. Analytical investigation on the condensation performance of vertical, tilted and horizontal surfaces for passive water harvesting. Mugla J. Sci. Technol. 2023, 9, 63–73. [Google Scholar] [CrossRef]
  17. Li, G.; Cao, B.; Zhou, S.; Bian, H.; Ding, M. Effects of Inclination and Flow Velocity on Steam Condensation Consisting of Air on Tube Bundle External Surfaces. Prog. Nucl. Energy 2021, 136, 103722. [Google Scholar] [CrossRef]
  18. Li, B.; Wang, X.; Tam, L.; Zeng, M.; Wang, Q. Impact of Inclination Angle on Flow Boiling Heat Transfer of Refrigerants in Elliptical Mini-Channel with Micro Fins. Appl. Therm. Eng. 2025, 269, 126184. [Google Scholar] [CrossRef]
  19. Havlík, J.; Dlouhý, T. Effect of Flow Velocity on the Process of Air-Steam Condensation in a Vertical Tube Condenser. EPJ Web Conf. 2018, 180, 02033. [Google Scholar] [CrossRef]
  20. Babaei, M.; Etemad, S.G.; Haghshenasfard, M.; Kruczek, B.; Morante, E.J.; Thibault, J. Water Extraction from Air via Passive Plate Condensation: Potential and Limitations. JFFHMT 2020, 7, 12–26. [Google Scholar] [CrossRef]
  21. Tarigan, B.V.; Gere, Y.V.; Jafri, M.; Riwu, D.B.N.; Adoe, D.G.H. Analisis pengaruh kecepatan udara masuk PAWG terhadap volume kondensat, kinerja sistem, Psys dan COP. Armatur 2023, 4, 87–95. [Google Scholar] [CrossRef]
  22. Wirangga, R.; Mugisidi, D.; Sayuti, A.T.; Heriyani, O. The Impact of Wind Speed on the Rate of Water Evaporation in a Desalination Chamber. ARFMTS 2023, 106, 39–50. [Google Scholar] [CrossRef]
  23. Chávez-Modena, M.; Broatch, A.; García-Tíscar, J.; Felgueroso, A.; González, L.M.; Valero, E. Numerical and Experimental Analysis of Rounded Fins for High Speed Air-Cooled Heat Exchangers. SSRN J. 2022, 1–34. [Google Scholar] [CrossRef]
  24. Vu, T.X.; Dhir, V.K. Enhancement of air-side heat transfer in air-cooled heat exchangers using dimpled fins. J. Enhanc. Heat Transf. 2021, 28, 63–84. [Google Scholar] [CrossRef]
  25. Yao, J.; Wang, X.; Zhu, J.; Wang, B.; Niu, J. Experimental Investigation of a Novel Extracting Water System from Air by Soil Cold Source. Math. Probl. Eng. 2021, 2021, 2740081. [Google Scholar] [CrossRef]
  26. Kline, S.; McClintock, F. Describing Uncertainties in Single-Sample Experiments. Am. Soc. Mech. Eng. 1953, 75, 3–8. [Google Scholar]
  27. Appolloni, E.; Paucek, I.; Pennisi, G.; Manfrini, L.; Gabarrell, X.; Gianquinto, G.; Orsini, F. Winter Greenhouse Tomato Cultivation: Matching Leaf Pruning and Supplementary Lighting for Improved Yield and Precocity. Agronomy 2023, 13, 671. [Google Scholar] [CrossRef]
  28. Liu, Q.; Liu, J.; Zhang, L.; Xu, X. Effect of Environmental Pressure on Heat and Mass Transfer Characteristics for Fin-and-Tube Heat Exchangers under Non-Unit Lewis Factor. Appl. Therm. Eng. 2017, 116, 784–791. [Google Scholar] [CrossRef]
  29. Roge, N.H.; Krishnan, S.; Prabhu, S.V. Local Heat Transfer Distribution in Channel Flow through a Periodic Octet Foam with Separation of Fin and Wall Heat Transfer. Appl. Therm. Eng. 2025, 260, 124945. [Google Scholar] [CrossRef]
  30. Bouzennada, T.; Mechighel, F.; Ismail, T.; Kolsi, L.; Ghachem, K. Heat Transfer and Fluid Flow in a PCM-Filled Enclosure: Effect of Inclination Angle and Mid-Separation Fin. Int. Commun. Heat Mass Transf. 2021, 124, 105280. [Google Scholar] [CrossRef]
  31. Bi, X.; Ma, Q.; Wang, X.; Zhang, X. Application of Phase Change Material on Solar-Greenhouse Back Wall and Its Effects on Indoor Thermal Environment and Cucumber Production in Winter. J. Build. Eng. 2024, 93, 109883. [Google Scholar] [CrossRef]
Figure 1. (a) Actual picture of the experimental wind tunnel; (b) schematic diagram of the experimental wind tunnel. 1. Frequency conversion fan; 2. Vortex flowmeter; 3. Flow equalization board; 4. Electrode humidifier; 5. Thermostatic water bath; 6. Heat exchanger; 7. Cooling water circulator; 8. Inserted temperature and humidity meter; 9. Test finned-tube heat exchanger; 10. Differential pressure meter.
Energies 18 02061 g001aEnergies 18 02061 g001b
Figure 2. Actual picture of the fin.
Energies 18 02061 g002
Figure 3. Changes in temperature and relative humidity in (a) summer and (b) winter.
Energies 18 02061 g003
Figure 4. Schematic diagram of heat exchanger installation with inclination angle.
Energies 18 02061 g004
Figure 5. Temporal variations in condensate mass and removal rate under different fin inclination angles at inlet air temperatures of (a) 22 °C, (b) 32 °C, (c) 22 °C, (d) 32 °C.
Energies 18 02061 g005
Figure 6. Total condensate generation rate and removal rate as functions of fin inclination angles at inlet air temperatures of 22 °C (a) and 32 °C (b).
Energies 18 02061 g006
Figure 7. Variation in the Nusselt number with fin inclination.
Energies 18 02061 g007
Figure 8. Variation in outlet air temperature and pressure drop with air velocity at inlet air temperatures of (a) 22 °C and (b) 32 °C.
Energies 18 02061 g008
Figure 9. Temporal variation in condensate mass under different air velocities at inlet air temperatures of (a) 22 °C and (b) 32 °C.
Energies 18 02061 g009
Figure 10. Temporal evolution of condensate removal rate under varying air velocities at inlet air temperatures of (a) 22 °C and (b) 32 °C.
Energies 18 02061 g010
Figure 11. Total condensate generation rate and removal rate as functions of air velocity at inlet air temperatures of (a) 22 °C and (b) 32 °C.
Energies 18 02061 g011
Figure 12. Variations in heat transfer rate and coefficient under different air velocities at inlet air temperatures of (a) 22 °C and (b) 32 °C.
Energies 18 02061 g012
Table 1. Measuring equipment and precision.
EquipmentMeasuring RangeAccuracy/Error Limit
T-type thermocouple−50.0–200.0 °C±0.5 °C
Temperature and humidity meter−40–125 °C
0–100% RH
±0.3 °C
±2% RH
Vortex flowmeter0.1–7 m/s≤±0.75%
Differential pressure meter0–100 hpa±0.25% FS
Anemometer0.3–45 m/s±3% + 0.1 dgt
Frequency converter0–60 Hz0.01 Hz
Table 2. Experimental conditions.
TemperatureRelative HumidityVelocityAngle
22 °C85%1.5 m/s
15°
30°
45°
60°
32 °C85%1.5 m/s
15°
30°
45°
60°
22 °C85%1.0 m/s45°
1.5 m/s
2.0 m/s
2.5 m/s
32 °C85%1.0 m/s45°
1.5 m/s
2.0 m/s
2.5 m/s
Disclaimer/Publisher’s Note: The statements, opinions and data contained in all publications are solely those of the individual author(s) and contributor(s) and not of MDPI and/or the editor(s). MDPI and/or the editor(s) disclaim responsibility for any injury to people or property resulting from any ideas, methods, instructions or products referred to in the content.

