Article

Effect of Lignite Composition on Mercury Removal from Flue Gas in Sulfide Forced Wet Flue Gas Desulfurization (WFGD) Installations—Full-Scale Experiments

by
Dariusz Łuszkiewicz
1,*,†,
Maria Jędrusik
1,†,
Arkadiusz Świerczok
1,†,
Mariola Kobylańska-Pawlisz
2,†,
Karel Borovec
3,† and
Lukas Pilar
4
1
Department of Thermal Sciences, Wrocław University of Science and Technology, 50-370 Wrocław, Poland
2
Rafako S.A., 47-100 Racibórz, Poland
3
Energy Research Centre, VSB Technical University of Ostrava, 708 00 Ostrava, Czech Republic
4
Energy Department, Czech Technical University in Prague, 166 29 Prague, Czech Republic
*
Author to whom correspondence should be addressed.
These authors contributed equally to this work.
Energies 2025, 18(8), 1982; https://doi.org/10.3390/en18081982
Submission received: 26 February 2025 / Revised: 2 April 2025 / Accepted: 9 April 2025 / Published: 12 April 2025
(This article belongs to the Section B: Energy and Environment)

Abstract

:
In this article, the results of full-scale experiments on the addition of a sodium sulfide to the CaCO 3 slurry circuit in a wet flue gas desulfurization (WFGD) plant are presented. Tests are performed on two comparable WFGD installations (spray tower, 4 spraying levels and two stage gypsum de-watering by hydrocyclones and vacuum belt filter) which allows the investigation of the influence of lignite composition (lignite mined in Poland and the Czech Republic are compared) on the reduction in mercury emission. Additionally, the efficiency of precipitation of metals from the slurry (Hg, Zn, Pb, Cd, Cr, Cu, Ni, Fe, Se, and Mn) is investigated as the result of sulfide addition. For both objects, mercury re-emission from absorber occurs (the concentration of mercury in the chimney is higher than that before the WFGD absorber) and the sulfide addition to WFGD slurry stops this phenomenon. The addition of sulfide works effectively (mercury removal efficiency from flue gas reaches up to 88% for Polish tests and up to 87% for Czech Republic tests). For the tests in the Poland power plant, all of measured metals are precipitated from the slurry (precipitation of metals efficiency varied from 2% for zinc to 88% for mercury), but in the case of the test in the power plant in the Czech Republic, there is no effect on manganese, iron, and lead (precipitation of metals efficiency varied from 6.5% for copper to 86% for mercury). The addition of sulfide works effectively for lignite mined in Polish and Czech power plants under the conditions of similar WFGD installations.

1. Introduction

Lignite and other fossil fuels will remain an important energy source in energy and industry worldwide in the coming decades in different parts of the world [1]. During the combustion of solid fuels (coal, lignite, and biomass) for the industry, several pollutants are emitted into the atmosphere, including carbon oxides (CO and CO 2 ), sulfur oxides ( SO x -sum of SO 2 and SO 3 ), nitrogen oxides ( NO x -sum of NO and NO 2 ), fluoric acid (HF), chloric acid (HCl), voltaic organic compounds (VOC), particular mater (PM), and heavy metals (e.g., Hg) [2]. Emissions from burning fossil fuels cause damage to the environment and society (responsible for one in five deaths worldwide) [3]. In connection with the above, research on limiting the negative impact of conventional energy sources on the environment should not be abandoned. One of the most harmful pollutants for human health generated during solid fuel combustion is mercury (especially when lignite is combusted) [4].
The mercury content in the fuel determines its concentration in the flue gases [5]. The concentration of mercury in solid fuels ranges from 0.003 to 10.5 mg/kg [6]: the average concentration in hard coal is 0.1 mg/kg worldwide, and 0.3 mg/kg for lignite [7]. The mercury in the fuel during the combustion process transforms into the gas phase as elemental mercury Hg 0 [8], which is insoluble in water [9]. Flue gas flowing through heat exchangers lowers their temperature and causes partial oxidation of the Hg 0 to the Hg 2 + form (called ionic mercury or oxidized mercury) [9]. Oxidized mercury is the name of all water-soluble mercury compounds, for example, during the combustion of fuel with high halide content (hard coal), HgCl 2 is the main compound of Hg 2 + [10]. In the case of lignite combustion, due to the lack of halides ( Cl 2 , Br 2 , and I 2 ), the share of Hg 2 + in the flue gases behind the boiler is small. When Hg 2 + is absorbed on the surface of fly ash (mainly in unburned carbon particles), Hg(p) is created [11]. In the atmosphere, the three mentioned species of mercury are emitted during combustion processes and cause damage in all environmental spheres [12].
Various countries have adopted regulations limiting mercury and other pollutant emissions (PM, SO x , NO x , HF, and HCl) into the atmosphere (USA [13], European Union [14], China [15]). Due to the regulations introduced, the power plants fueled by solid fuels are equipped with flue gas cleaning installations. For a typical solid fuel-powered power plant, the following devices are used:
  • Semi-dry or wet desulfurization methods for SO x and acid gases control [16];
  • Bag filters or electrostatic precipitators (ESPs) for dust control [17];
  • Combined primary methods with SCR (Selective Catalytic Reduction) or SNCR (Selective Non-Catalytic Reduction) installations for NO x control [18]).
Due to the use of these installations, there is an effect of the partial removal of mercury from flue gases in these installations (the efficiency of mercury removal depends on the species of mercury). Particulate-bound mercury Hg(p) is almost completely removed in dust collectors [9]. Oxidized mercury is removed in WFGD installations with high efficiency (up to 95%) [19]. The conversion of Hg 0 to Hg 2 + in flue gas is a key factor to achieve a high total mercury removal rate because the removal efficiency of metallic mercury in existing flue gas cleaning devices is low. Some of the metallic mercury occurs in the flue gas and is oxidized in the installation of SCR in the presence of HCl [20]. Taking the above into account, to meet the mercury emission standards, it is necessary to properly understand the phenomena occurring in wet flue gas desulfurization plants. The efficiency of mercury removal in the WFGD absorber is presented in Table 1.
Numerous research papers have reported that for typical configurations of flue gas cleaning devices (SCR + ESP + WFGD), the total mercury removal ranged from 15.1 to 95.6% [6,22,25]. The factor that influences the mercury removal rate the most is its re-emission from the WFGD absorber. Mercury re-emission is defined when the Hg 0 concentration downstream of the absorber is higher than the Hg 0 concentration at the inlet [26]. In WFGD, oxidized mercury is reduced to elemental mercury emitted into the atmosphere [27]. As reducing agents for oxidized mercury, sulfite ions and organic acids (formic, adipic, and others) were identified in the WFGD slurry [28]. The intensity of the mercury re-emission plays an important role as an operating parameter of the absorber (pH, ORP, slurry temperature, air stream fed to the absorber) and Hg 2 + concentration in the flue gas upstream of the absorber [26,28,29,30].Methods of reducing the mercury re-emission of the absorber consist of modifying the operating parameters of the absorber [31] and adding additives to the slurry in the WFGD absorber [28]. The modification of absorber operation parameters is difficult to achieve in industrial conditions due to the need to maintain the required quality of gypsum [32]. Different types of sulfide (organic and inorganic) additions to the WFGD slurry have been tested for permanently binding to mercury through the formation of HgS to stop mercury re-emission [27,28,30,33]. Based on the data from the literature and tests carried out in industrial conditions, Na 2 S is the most used additive.
In Poland, in power plants combining heat and other plants burning fossil fuels, desulfurization installations are commonly used, mainly using semi-dry and wet methods (except for fluidized bed boilers, where dry processes are successfully used). In turn, the problem of excessive nitrogen oxide emissions is solved by combining primary methods with SCR or SNCR installations. For particulate matter, bag filters and electrostatic precipitators are commonly used.
In the Czech Republic, lignite is combusted in sources that combine the production of electricity and heat. For flue gas desulfurization, it is mostly used in wet and semi-dry processes. However, WFGD is used mainly in sources with a heating input greater than 300 MW t 
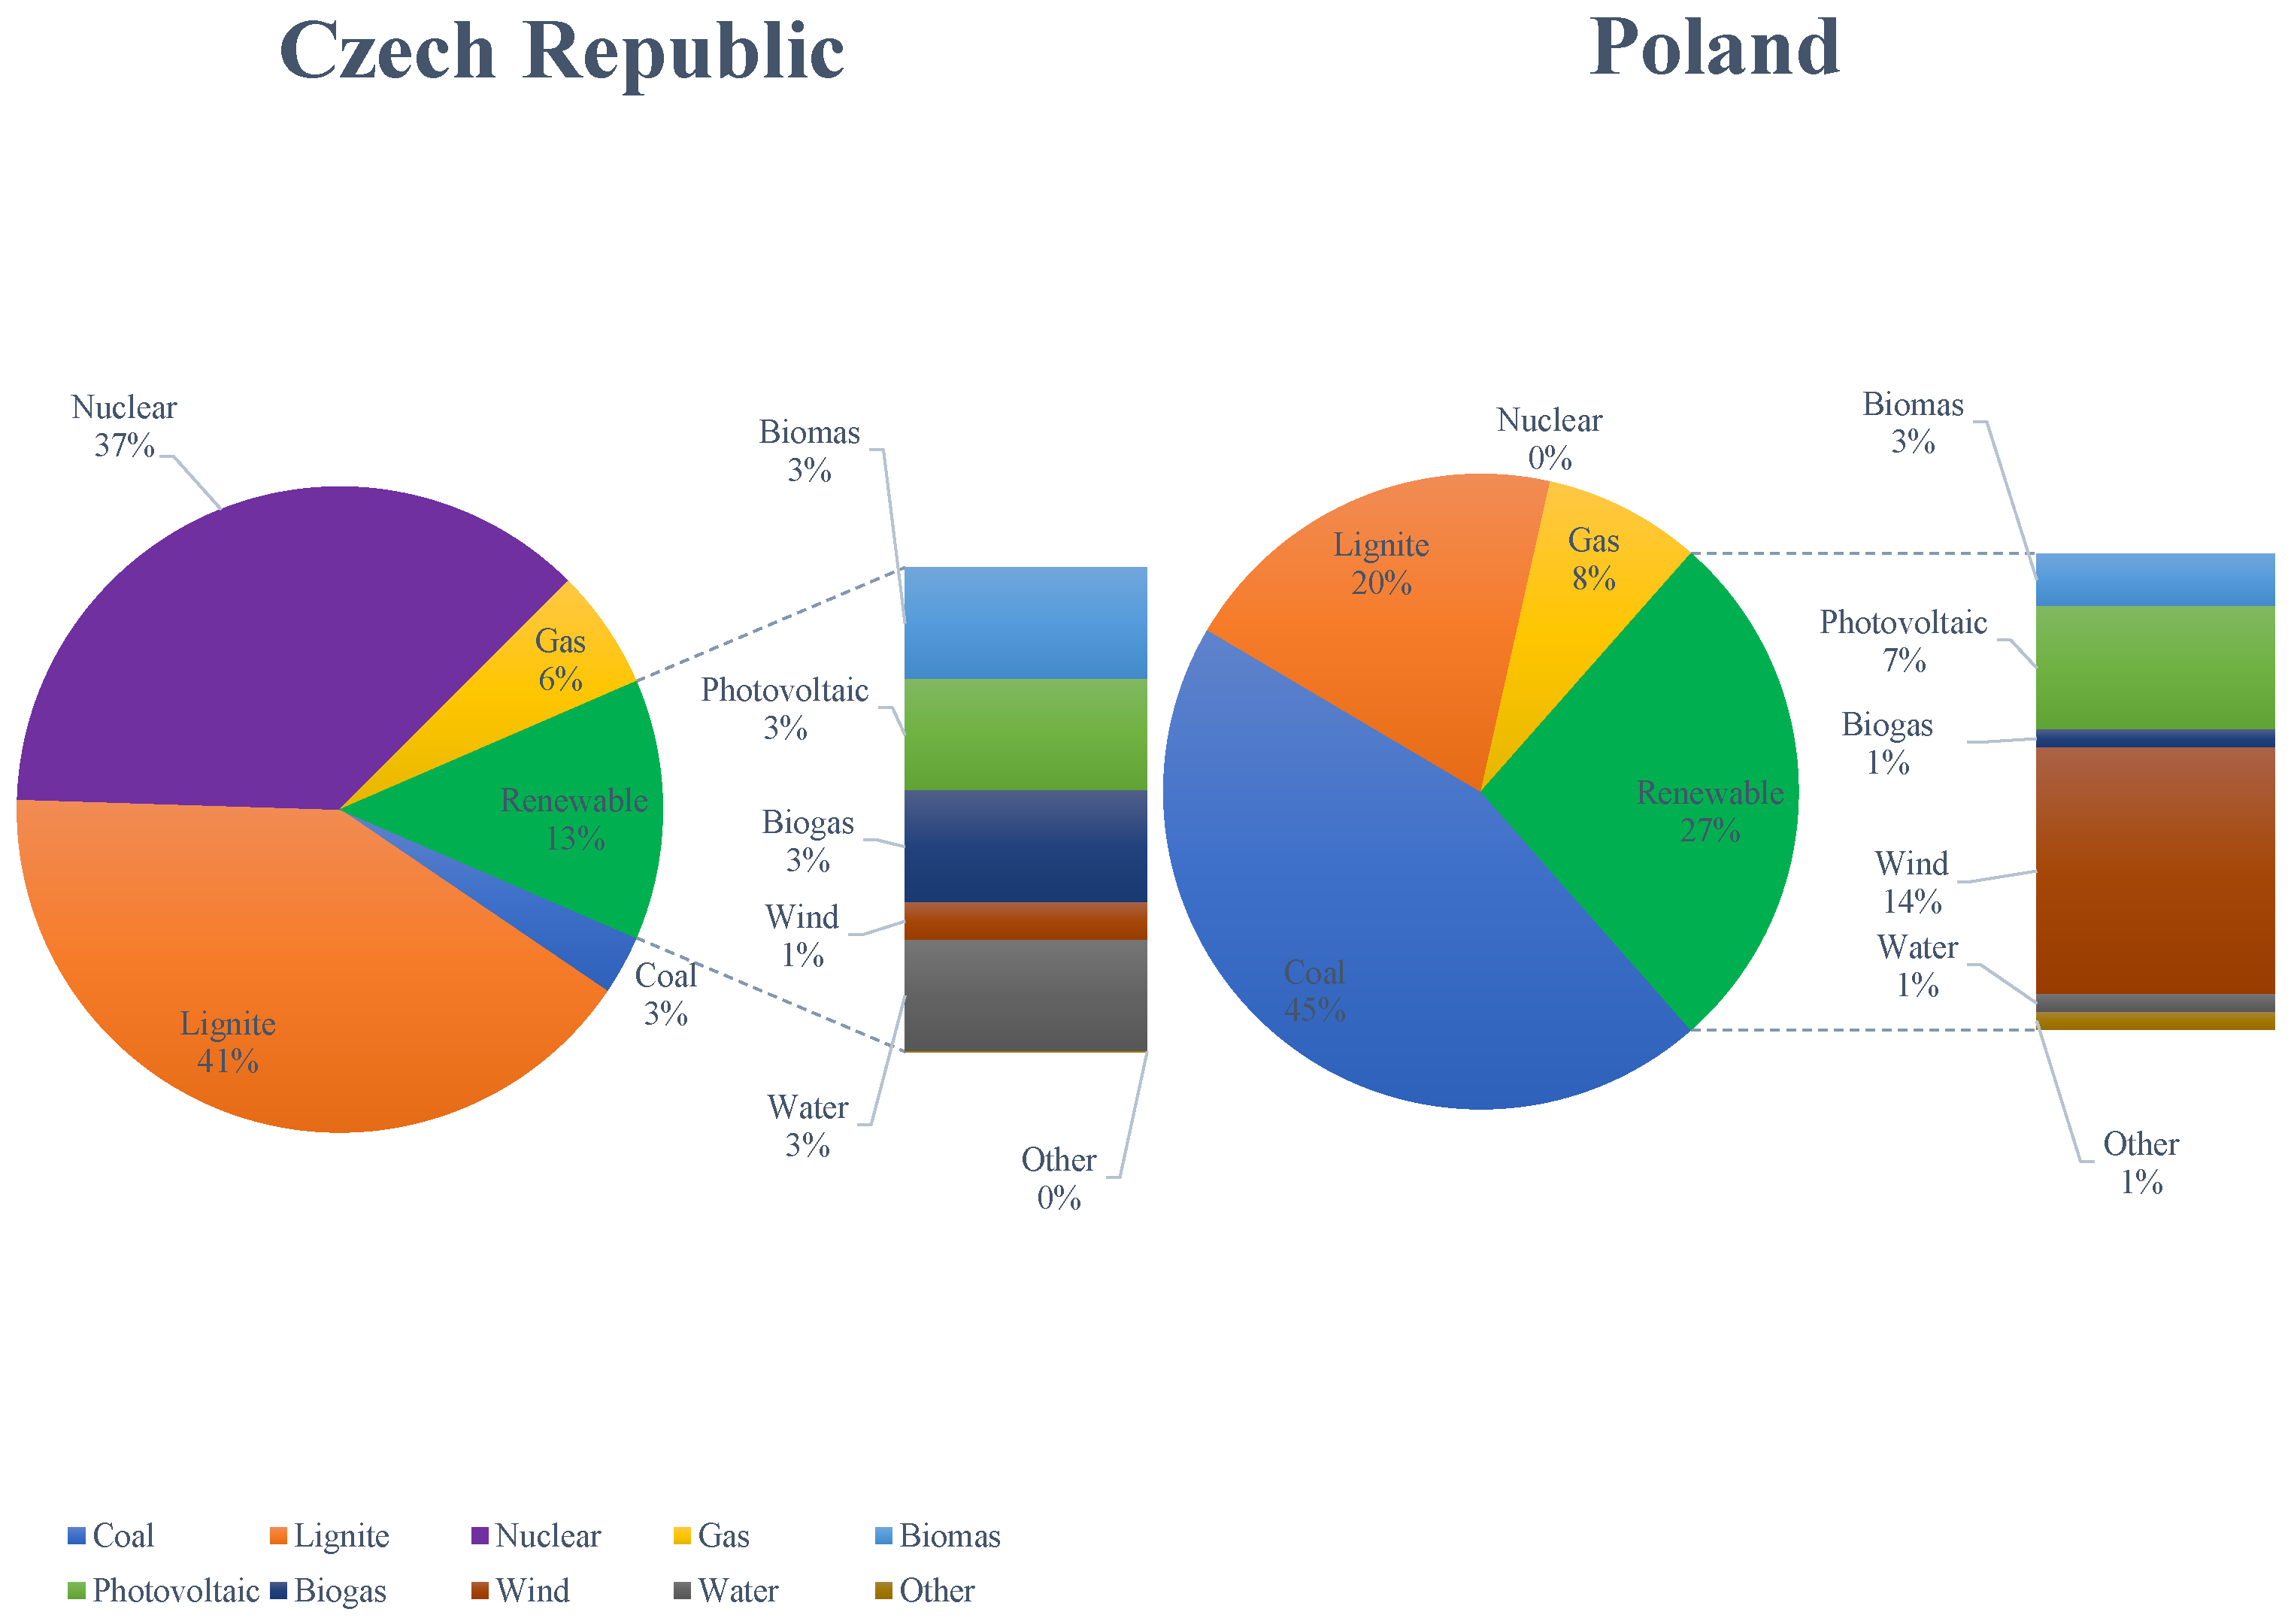
. From the point of view of combustion itself, lignite is combusted to a greater extent in pulverized bed boilers and in several fluid boilers. SNCR methods and/or primary measures are used to reduce nitrogen oxides. Only one heating plant uses SCR technology in a high dust configuration. Fabric filters and electrostatic precipitators are used to capture solid particles. In the Czech Republic, hard coal is burned for only one large combustion source, which has already been shut down. The comparison of the production of electric energy by sources in the Czech Republic and Poland in 2023 is presented in Figure 1.
In the Czech Republic, the combustion of lignite accounts for about 41% of the electricity production, and coal only up to 3%. Therefore, it is still one of the main sources of electricity and heat production in the Czech Republic. The main deposits are in Northern Bohemia, especially in Podkrunoho (near Most, Chomutov, and Sokolov). In Poland, coal combustion is responsible for 45% of the electricity production. The combustion of lignite remains an important source, comprising 20% of the total electricity production (after coal and renewable energy sources). The change in the structure of energy production will progress towards an increase in the share of renewable energy sources in the energy mix; however, in the current state of the power industry (for example, in Poland or the Czech Republic), it is hard to imagine the country’s energy system without regulatory energy sources such as coal-fired, biomass-fired, gas-fired power plants, and nuclear power plants.
In connection with the above, the results of full-scale tests on re-emission control by additive addition (sodium sulfide) to WFGD slurry are presented. Full-scale tests are performed on two comparable WFGD installations (spray tower, four spraying levels, and two-stage gypsum de-watering by hydrocyclones and vacuum belt filter). The novelty of the work is that the similarity of these two installations allows the comparison of the influence of fuel composition on mercury removal by stopping mercury re-emission. Comparisons are made between lignite combusted in Poland and the Czech Republic on the efficiency of mercury removal in the WFGD absorber, and the precipitation of heavy metals from the WFGD slurry is investigated.

2. Materials and Methods

Research is carried out on two industrial WFGD absorbers (manufactured by Rafako S.A. in case of Czech Republic tests by Hitachi) that purify the flue gases from lignite combustion. Absorbers work on the basis of the limestone method with the production of synthetic gypsum (wet flue gas desulfurization (WFGD) with limestone forced oxidation (LSFO)). The research objects are located in Poland and the Czech Republic, and the influence of lignite composition on mercury removal efficiency and precipitation of heavy metals from the WFGD slurry is investigated.

2.1. Research Objects

For the purpose of this article, the following names are proposed for research objects:
  • Object 1: power plant located in Poland powered by Polish lignite;
  • Object 2: power plant located in Czech Republic powered by Czech Republic lignite.
In Poland (object 1), the WFGD installation is equipped with four spray levels and a system for the dosing of adipic acid in the slurry. It treats flue gas from a pulverized coal boiler for a 400 MWe unit equipped with an electrostatic precipitator and SNCR for nitrogen oxide removal. The volume of the slurry tank is 3400 m 3 . The dewatering of the gypsum suspension is carried out using a two-stage dewatering technology, where the first stage uses a hydrocyclone and then a vacuum belt to reduce the required gypsum moisture content.
In the Czech Republic (object 2), tests are carried out on the absorber equipped with four spray levels and the volume of an absorber slurry tank was 2400 m 3 . The installation purifies the flue gas from 2 lignite-fired blocks with a capacity of 200 MWe each. For flue gas denitrification, an SNCR technology is used in each unit. For reduction in PM emission, the ESP in one unit and the fabric filter in another were used. The dewatering of the gypsum suspension was the same as in object 1. The similarity of these two installations allows for the comparison of the results on mercury removal by a sulfide-based additive.
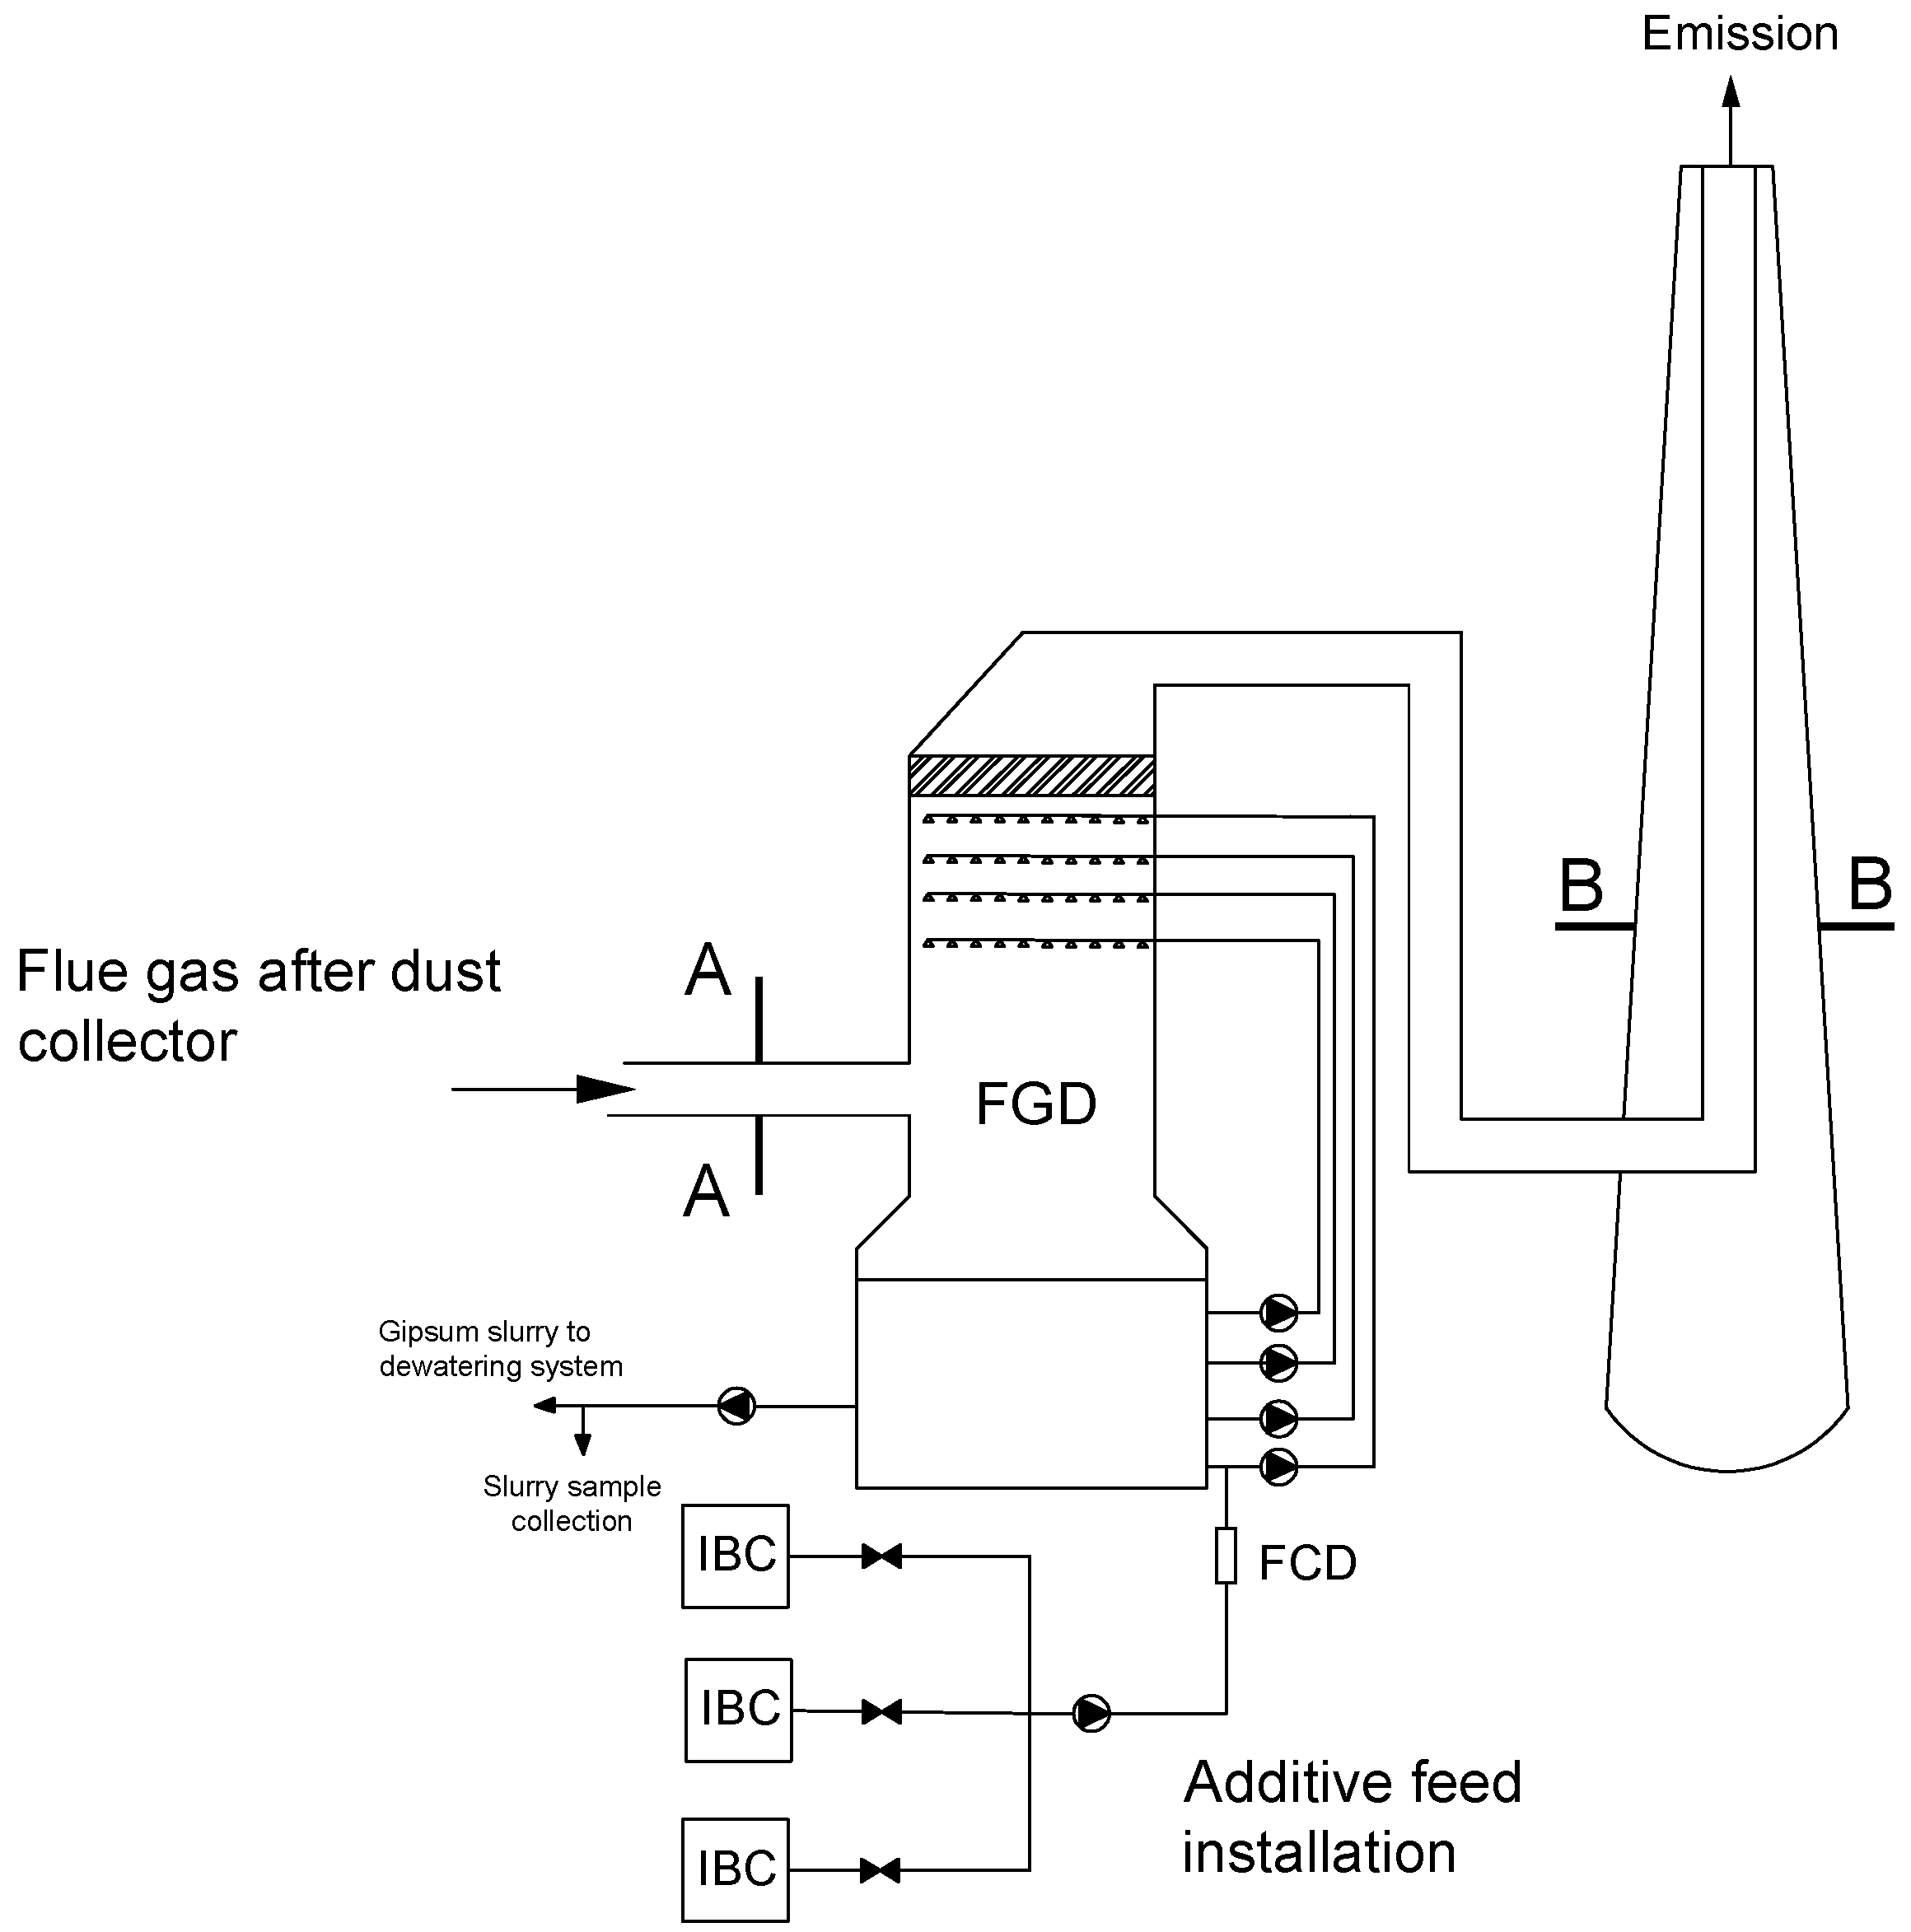
A precipitating agent in the form of an aqueous Na 2 S solution (technical grade concentration 10% w/w) is fed to the absorber through a specially mounted system (constructed from IBC containers, flexible pipes, valves, rotameter and pump) for the highest spraying level. The same installation is used for both research objects. The test installation schematically is shown in Figure 2.

2.2. Fuel Composition

The main types of coal include anthracite, bituminous, subbituminous, and lignite, which are classified according to the carbon and voltaic contents [34]. Other fuel parameters that are important for the combustion process are the calorific value, and the hydrogen, sulfur, ash, humidity, mercury, and chlorine content [35]. During the tests, lignite samples are collected and prepared according to ISO standards ISO/IEC 17025:2017 in a certified laboratory. All results presented in the article include fuel analysis, which consists of measurements of the calorific value, and the coal, hydrogen, sulfur, ash, humidity, mercury, and chlorine content. These results are presented in the working state of the fuel in which the fuel goes directly to the furnace. For both objects, samples are collected with a frequency of one per day. The basic fuel parameters and the range of their variability during full-scale tests are presented in Table 2.
For the lignite from the tests conducted for object 1, higher values of sulfur, moisture, and mercury are measured. The lignite combusted in object 2 is characterized by a higher calorific value, ash content, and carbon content. Based on the fuel parameters, the highest emission of mercury and sulfur dioxide is expected in the case of object 1.

2.3. Slurry Analyses

The concentration of metals can be detected in slurry samples by various analytical methods, including electrothermal atomic absorption spectrometry (ET-AAS), flame atomic absorption spectrometry (FS-AAS), cold vapor-atomic absorption spectrometry (CV-AAS), fluorescence spectrometry (XRF), inductively coupled plasma-optical emission spectrometry (ICP OES), inductively coupled plasma- mass spectrometry (ICP-MS), or HPLC-inductively coupled plasma-mass spectrometry (HPLC-ICP-MS) [36]. The slurry samples collected from the WFGD absorber in object 1 are filtered, and the filtrate obtained is tested for heavy metal content using the following analytical methods: Hg atomic absorption spectrometry with the amalgamation technique (MA-2 mercury analyzer by Nippon Instruments Corporation, accuracy <2% of measurement results), Zn, Pb, Cd, Cr, Cu, Ni, Fe, and Mn inductively coupled plasma atomic spectrometry (ICP-AES) by ICP-AES iCAP 7400 analyzer from Thermo Scientific (Waltham, MA, USA), with an accuracy of <2% of the measurement results.
Slurry samples collected from the FGD absorber in object 2 and the concentrations of Hg in the liquid samples are determined in the approved laboratory using the AMA 254 mercury analyzer (LECO Corporation, St. Joseph, MI, USA), accuracy <2% of measurement results. The concentration of metals in the slurry samples is determined using the ICP-AES method using the same apparatus as in object 1.
On the basis of the measurement results, the amount of precipitating agent that is to be added to the slurry is determined. The tests are performed as a function of the molar ratio Y defined as
Y = Additive / sum of metals , mol / mol
The samples of slurry collected from the pipeline are filtrated and analyzed for metal content. The efficiency of metal precipitation from the slurry is calculated by comparing the value before and after the administration of sodium sulfide:
η M e = ( 1 ( M e 1 / M e 2 ) ) · 100 %
where we have the following:
M e 1 —concentration of selected metal (Hg, Zn, Pb, Cd, Cr, Cu, Ni, Fe, Se, and Mn) in the sample collected after the addition of the precipitating agent;
M e 2 —concentration of selected metal (Hg, Zn, Pb, Cd, Cr, Cu, Ni, Fe, Se, and Mn) in the sample collected before adding the precipitating agent to the absorber.

2.4. Mercury Measurements

To determine the influence of the injection of a precipitating agent on the effectiveness of reducing mercury emissions into the atmosphere, continuous measurements of the total mercury concentration in the flue gas are carried out using two analyzers installed in front of the installation of the WFGD (cross section A) and in the chimney (cross section B). Based on the measurement results, the effectiveness of mercury removal from the flue gas is determined according to the formula
η H g = ( 1 ( H g B T / H g A T ) ) · 100 %
where we have the following:
H g A T —average total mercury concentration in the measurement cross section (A), μ g / m ref 3 ;
H g B T —average total mercury concentration in chimney (B), μ g / m ref 3 .
ref—reference conditions: T = 273.15 K, P = 1013.25 hPa, humidity < 0.005 kg H 2 O /kg dry gas , calculated for the oxygen content in the combustion gas O 2 = 6%.
In object 1, two CMM systems with a CVAF mercury analyzer of Gasmet, accuracy <2% of measurement range are used. In object 2, two Durag-Verewa HM 1400 TRX continuous systems (Durag Group, Hamburg, Germany), with an accuracy of 1% of the measurement range, are used. In parallel with the measurements made by the monitoring system, samples are taken in the same measurement sections to determine the concentration of mercury using the Ontario Hydro method [37] to identify the concentration of Hg 0 and Hg 2 + in the exhaust gas. The Ontario Hydro method consists of collecting mercury from a partial stream of flue gas in a series of eight washers with sorption solution (three washers with KCl solution, one washer with mixture H 2 O 2 and HNO 3 , three washers with mixture of KMnO 4 and H 2 SO 4 , and the last silica gel). Based on mercury concentrations in washers (in washers with KCl oxidized mercury is captured and metallic mercury is captured in washers with mixture of KMnO 4 and H 2 SO 4 ), the concentrations of metallic and oxidized mercury are calculated. Other flue gas parameters are supplied from the continuous monitoring emission systems of the power plant. A summary of the exhaust gas measurement results and their variability during the tests is presented in Table 3.
For both tests, the flue gas stream and temperature are at a comparable level. The concentrations of mercury and sulfur dioxide are higher for tests in object 1 than in object 2.

3. Results

Research on the use of a precipitating agent is carried out in full-scale installations in two stages. In the first stage, blank tests are made without Na 2 S addition to the slurry. In the second stage, full-scale tests are conducted on the effectiveness of mercury removal and precipitation of metals from the WFGD slurry. In each stage, mercury concentrations in front of and behind WFGD are measured, and samples of slurry are taken. The results of the measurements conducted in Poland presented in the article are partially described in the literature [24], where the all-research program is presented from laboratory to full-scale investigations.

3.1. Full-Scale Tests Results in Poland (Object 1)

For the purpose of the article, the names of measurement series are proposed:
  • Series 0: test without additive injection to the slurry;
  • Series I: injection of 2 m 3 of the precipitating agent and continuous feeding of 250 dm 3 /h to WFGD absorber.
Before adding the Na 2 S to the WFGD suspension, changes in mercury concentration are observed upstream and downstream of the absorber (Figure 3). During series 0, mercury re-emission occurs (these periods are marked in Figure 3), and the concentration of the total mercury upstream absorber is higher than that in the chimney. In addition, the Ontario Hydro measurements are made during series 0 to determine a speciation of mercury in the flue gas upstream and downstream of the WFGD absorber (Table 4).
During the measurements, adipic acid is fed to the absorber (amount of adipic acid added to the absorber during the tests is not known), the addition of which can influence the observed mercury re-emission. The data presented (in Table 4) confirm that the re-emission of Hg 0 occurs even when the concentrations of Hg T observed in the stack are not higher than those in front of the absorber (for measurements No. 2 and 3). In the case of measurement No. 1, re-emission from the absorber is not observed. The re-emission from the absorber is not always visible in the Hg T measurement in the chimney; very often, it is only visible in the measurement of the speciation of mercury [26].
In Figure 4, the results of the total mercury measurements in front and after the WFGD absorber are presented during series 1 of the additive addition. In the first stage, 2 m 3 of additive is pumped into the WFGD absorber, and after that, the continuous feeding of 250 dm 3 is carried out. Subsequently, the total concentration of mercury in the flue gas in the chimney is limited below the level of 3 µg/m ref 3 for 8 h. The maximum efficiency of mercury removal from the flue gas reaches 88%. After stopping the feeding of sodium sulfide into the absorber slurry circuit, the mercury concentration in the stack returns to the pre-experimental level. There is a visible re-emission pick from the WFGD absorber in the period after the additive feeding is stopped.
During the experiments, slurry samples are taken: for series 0, one sample, and for series I, one before and one 2 h after sodium sulfide are fed to the absorber. The samples are prepared according to the methodology described in Section 2.2 and the analysis of metal content. Table 5 summarizes the results of the concentration of metals in the filtrate and the efficiency of the precipitation of metals (Hg, Zn, Pb, Cd, Cr, Cu, Ni, Fe, and Me) from the WFGD slurry. All detected metals are precipitated from the slurry (efficiency varies from 2 to 88%). The highest precipitation efficiency is achieved for mercury.

3.2. Full-Scale Tests in Czech Republic (Object 2)

During the tests for object 2, three days of experiments are performed with the addition of sodium sulfide to the WFGD slurry circuit in various amounts (for the purpose of the article, all doses in object 2 are called series II). Before the dosing of the additive to the WFGD slurry, the mercury concentration is measured in front of and behind the WFGD absorber to analyze the re-emission in the absorber that will occur. The results of these measurements are presented in Figure 5. After this measurement, the initial dose of additive 2 m 3 /h is fed to the WFGD absorber, and then the continuous feeding in the amount of 200 dm 3 /h is carried out.
Parallel measurements of mercury speciations are made using the Ontario Hydro method. The results of these measurements are presented in Table 6. Surprisingly, in the case of a lignite-fired boiler in object 2, the concentration of oxidized mercury is relatively high. Measurements made before WFGD show that the concentration of oxidized mercury is higher than that of metallic mercury. Oxidized mercury is effectively captured in the absorber, and the efficiency of mercury removal prior to additive injection is 59.6% and reaches 74% after injection. Unfortunately, the observed removal efficiency is too low to achieve the target of 7 μ g/m ref 3 . In addition, tests with lower mercury content lignite are planned the next day. The composition of lignite used in these tests is compared in Table 7.
The new fuel is characterized by a low mercury content, while other fuel parameters are comparable.
On the second day of the test, a fuel change is carried out (low-mercury lignite starts about 11:00). The concentration of mercury in the flue gas in front of and behind the WFGD absorber is presented in Figure 6. Before fuel change, the mercury removal efficiency is 85.7%, and the mercury concentration in the chimney ranges from 6.2 to 9.8 μ g/m ref 3 . After fuel change, the mercury concentration ranges from 6.4 to 4.2 μ g/m ref 3 , and the mercury removal efficiency is 77.3%. Due to the high degree of Hg removal from the flue gases, the amount of additive fed to the absorber is limited to 150 dm 3 /h, and this dose is maintained during the third day of the experiments. The results of the mercury measurements are presented in Figure 7. The concentration of mercury before the WFGD absorber varies from 14.63 to 35.42 μ g/m ref 3 , and from 0.90 to 6.62 μ g/m ref 3 in the chimney. The average concentration of mercury in front of the WFGD is 22.96 μ g/m ref 3 and 3.04 μ g/m ref 3 in the chimney, and the efficiency of mercury removal in the WFGD absorber is 86.9%. As in tests conducted in object 1, absorber slurry samples are taken and analyzed for heavy metal content (Hg, Zn, Pb, Cd, Cr, Cu, Ni, Fe, Mn and Se) in a clear filtrate. The suspension samples are taken, one per day, and the results are summarized in Table 8.
As a result of the addition of sulfide to the WFGD slurry, the concentration of Hg, Zn, Cd, Cr, Cu, Ni, and Se decreases. The highest precipitation rate is achieved for mercury. In contrast to the results conducted in object 1, there are no effects on manganese and iron.

4. Discussion

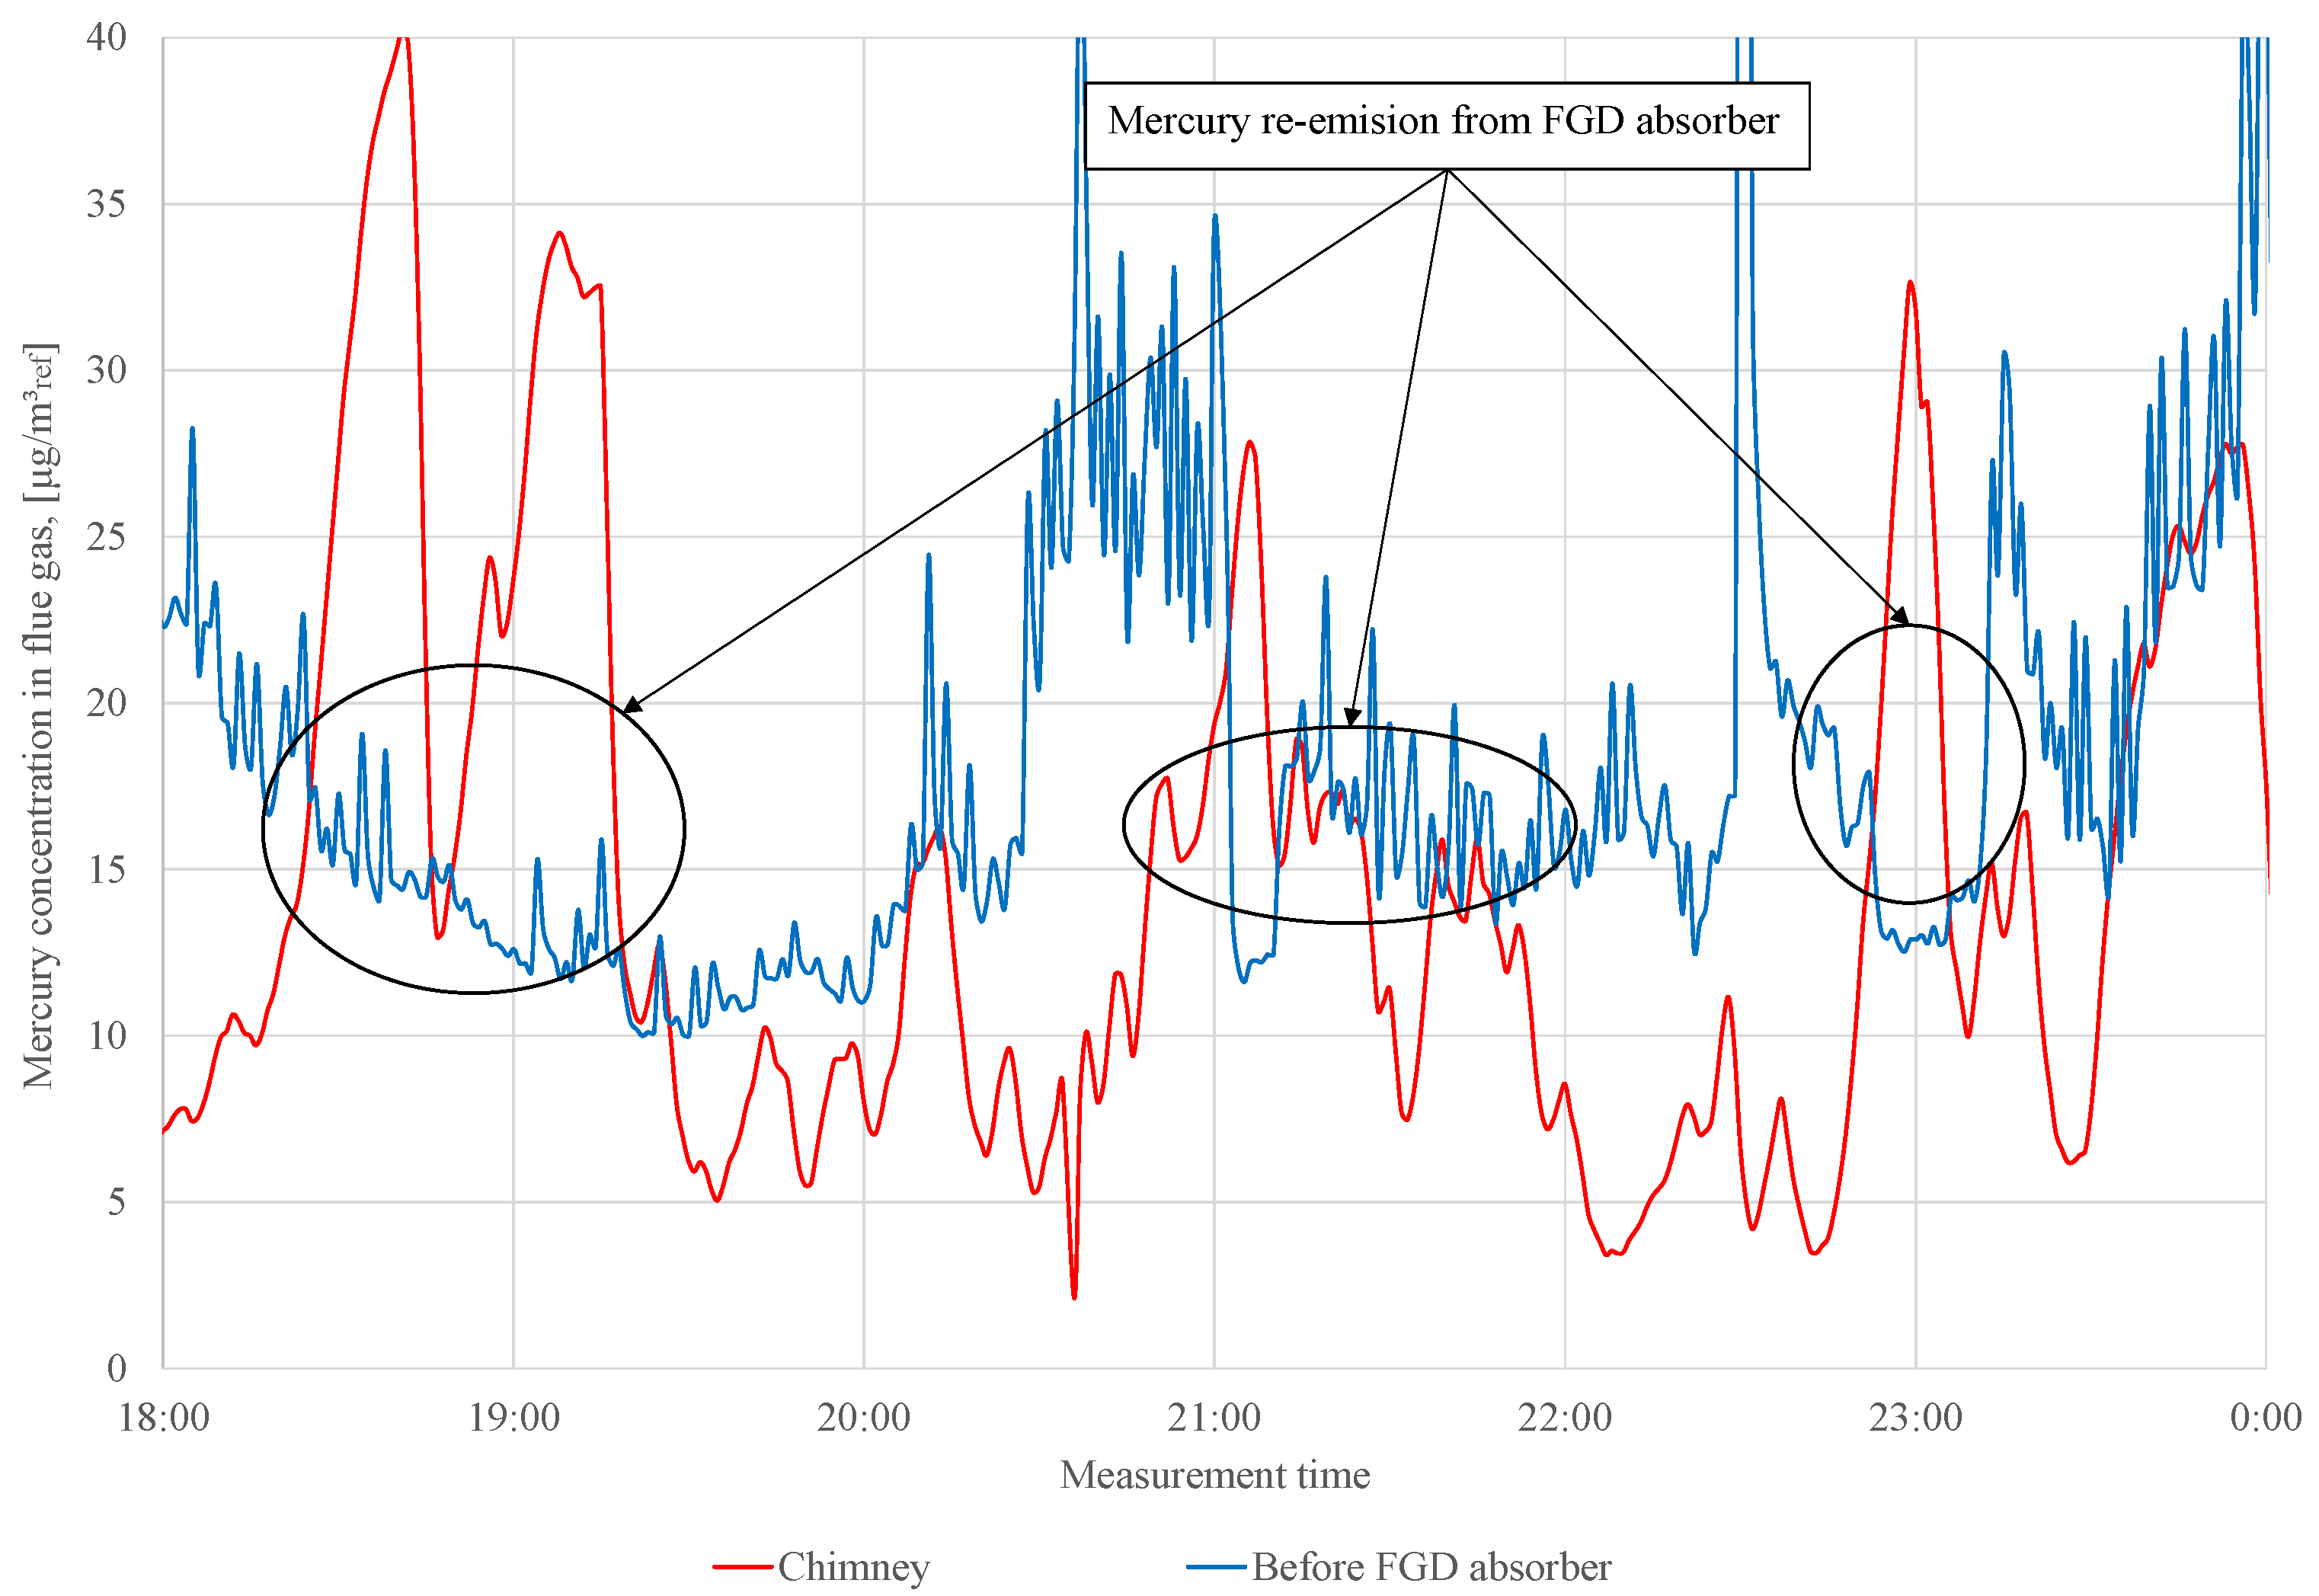
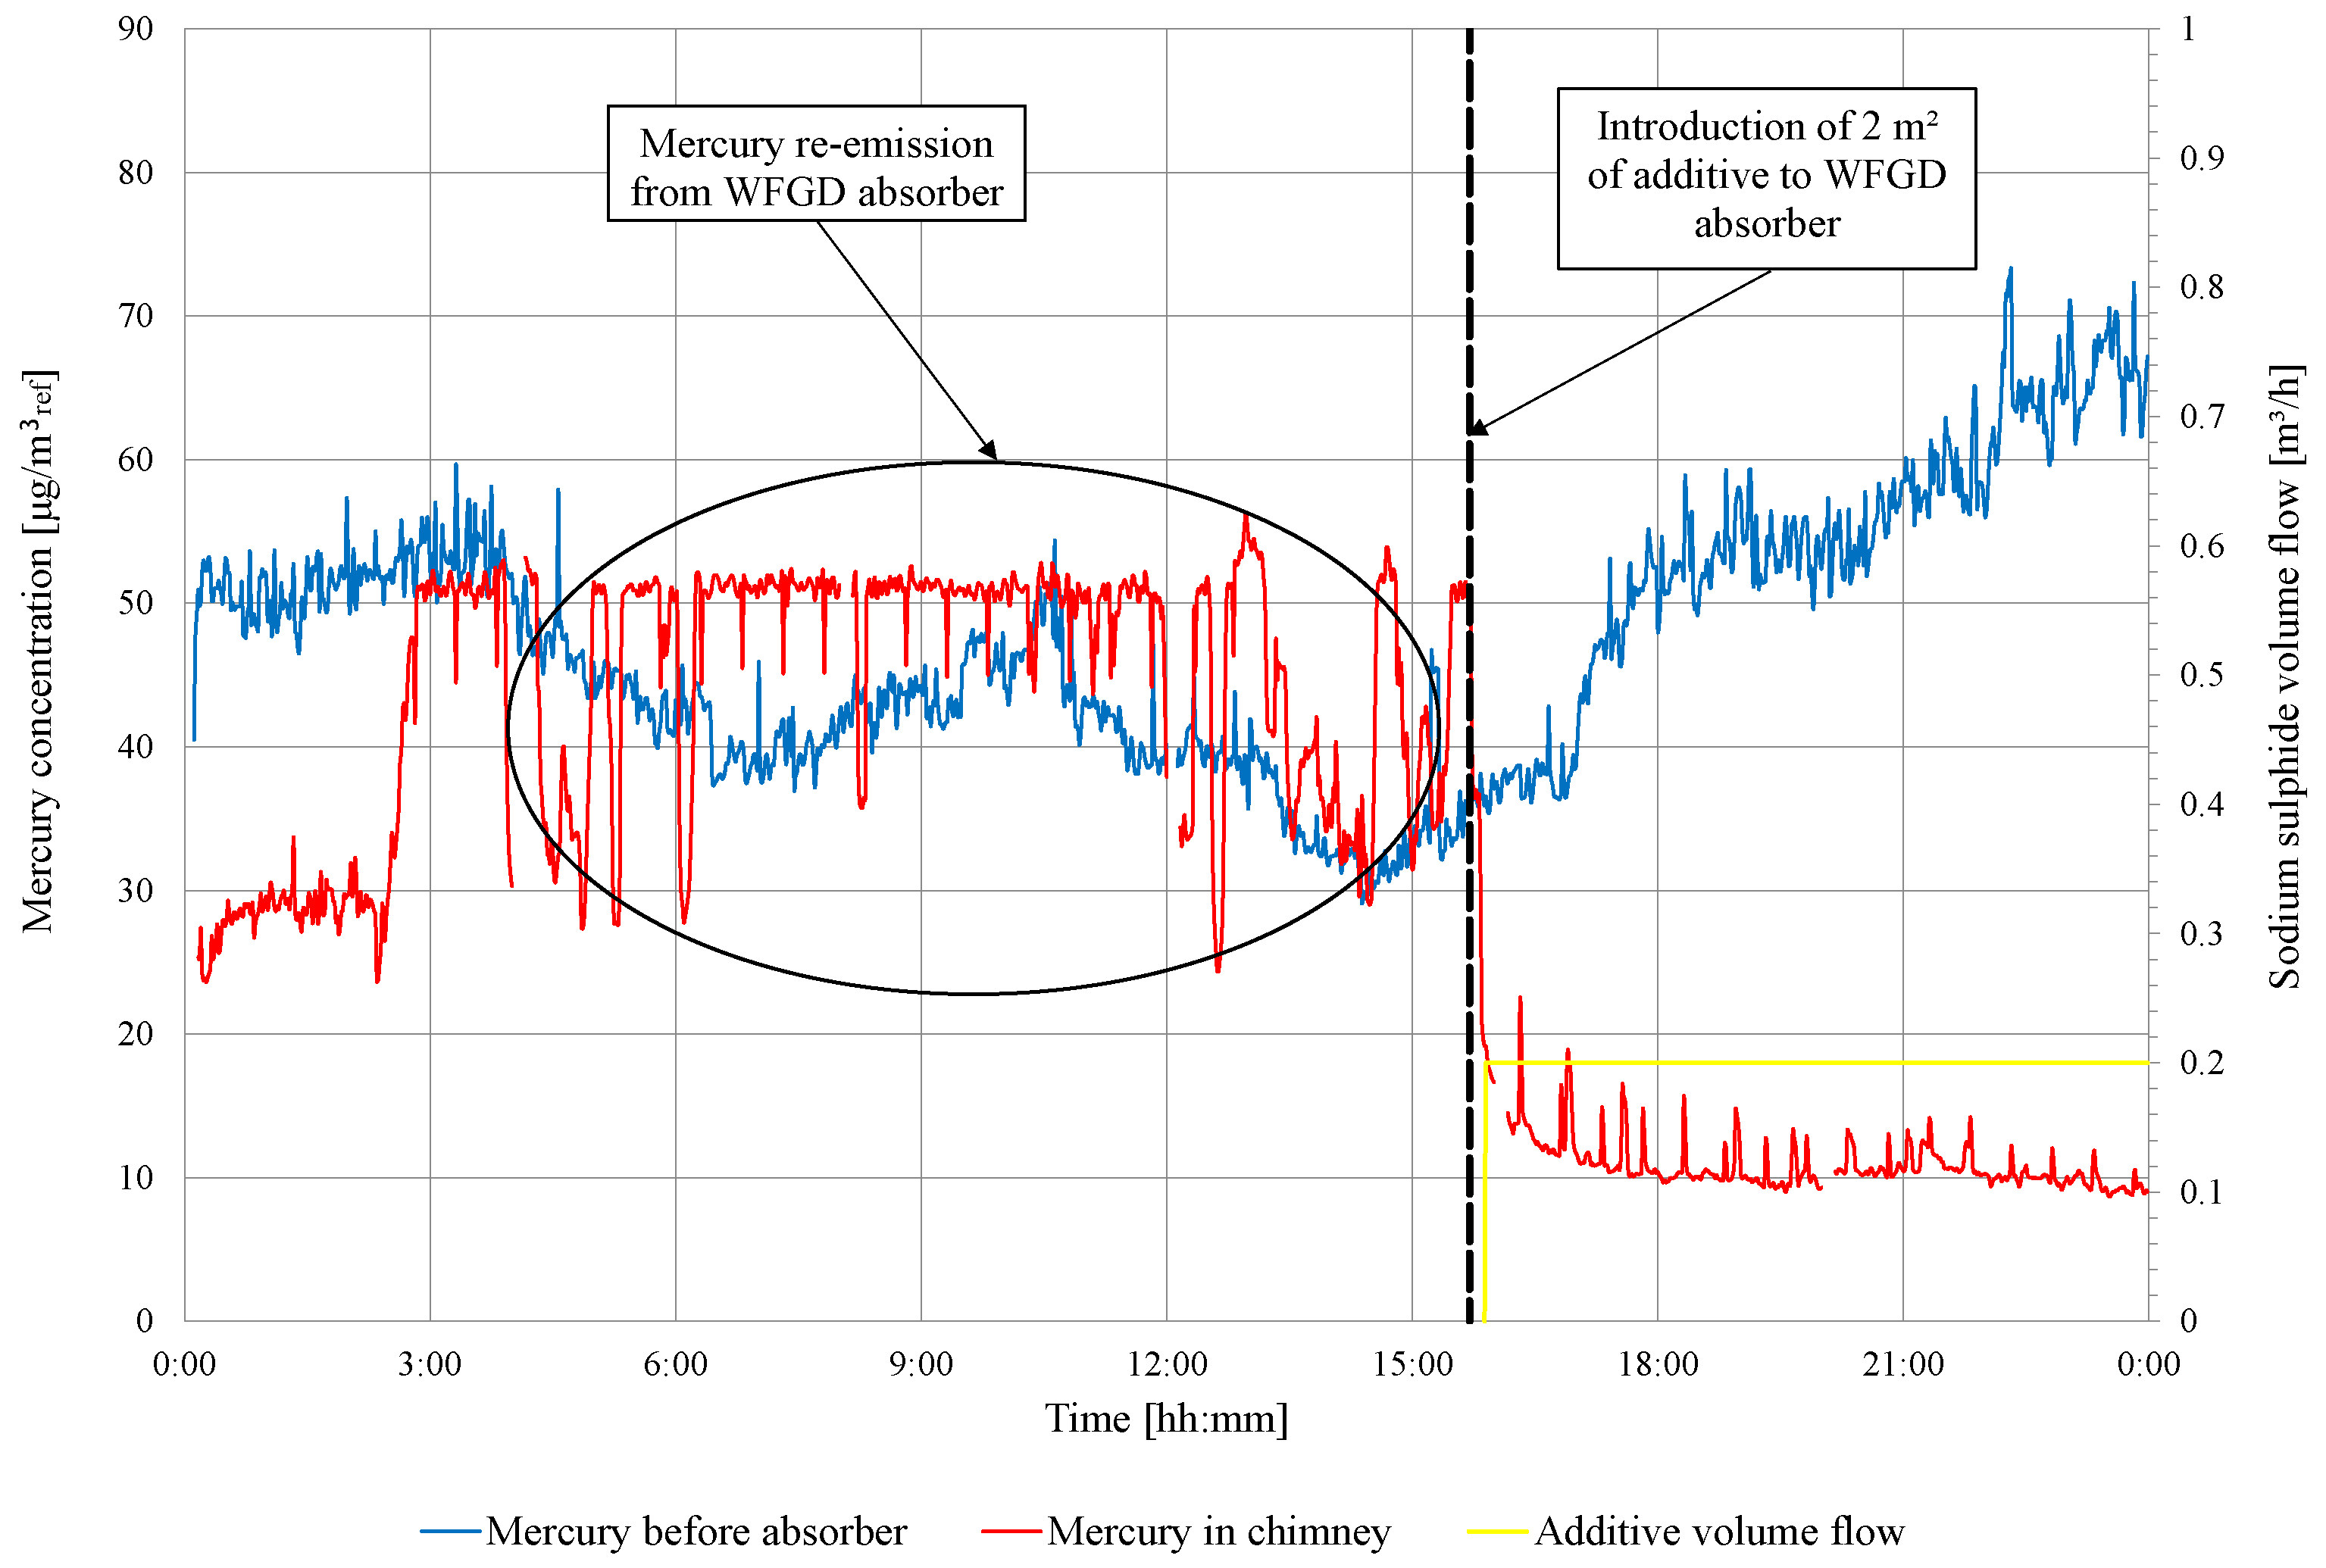
For both lignite-fired facilities, the mercury concentration measurements upstream and downstream of the WFGD absorber have shown the occurrence of the re-emission phenomenon. Measurements made using the Ontario Hydro method show that mercury in the metallic form Hg 0 is re-emitted (Table 4 and Table 6). The observed re-emission phenomenon is visible in continuous measurements (Figure 3 and Figure 5). For the test in object 1, the highest mercury concentration in the chimney is 40 μ g/m ref 3 , while the concentration in front of the WFGD absorber is approximately 15 μ g/m ref 3 (2.7 times higher mercury concentration in the chimney than in front of WFGD). In case of the test in object 2, the maximum observed re-emission is 55 μ g/m ref 3 in the chimney, while the concentration in front of the WFGD is approximately 40 μ g/m ref 3 . The observed re-emission phenomenon is lower in the object 2 tests than observed in those for object 1. It should be noted that the intensity of mercury re-emission is affected by many factors, including WFGD operation parameters such as the pH, ORP, slurry temperature, and sulfate concentration in the sorption solution [26,38]. Another factor that influences mercury re-emission is the concentration of halides (chlorine, bromine, and fluor) in the fuel; the following relation occurs: the higher the concentration of halides in the fuel, the lower the intensity of the Hg 0 re-emission from the WFGD absorber [21]. A significant difference between object 1 and object 2 is the use of adipic acid in the absorber liquid cycle (in object 1), which may have an impact on the higher observed re-emission rate [28]. Organic acids play the role of a reducing agent for mercury dissolved in the WFGD slurry.
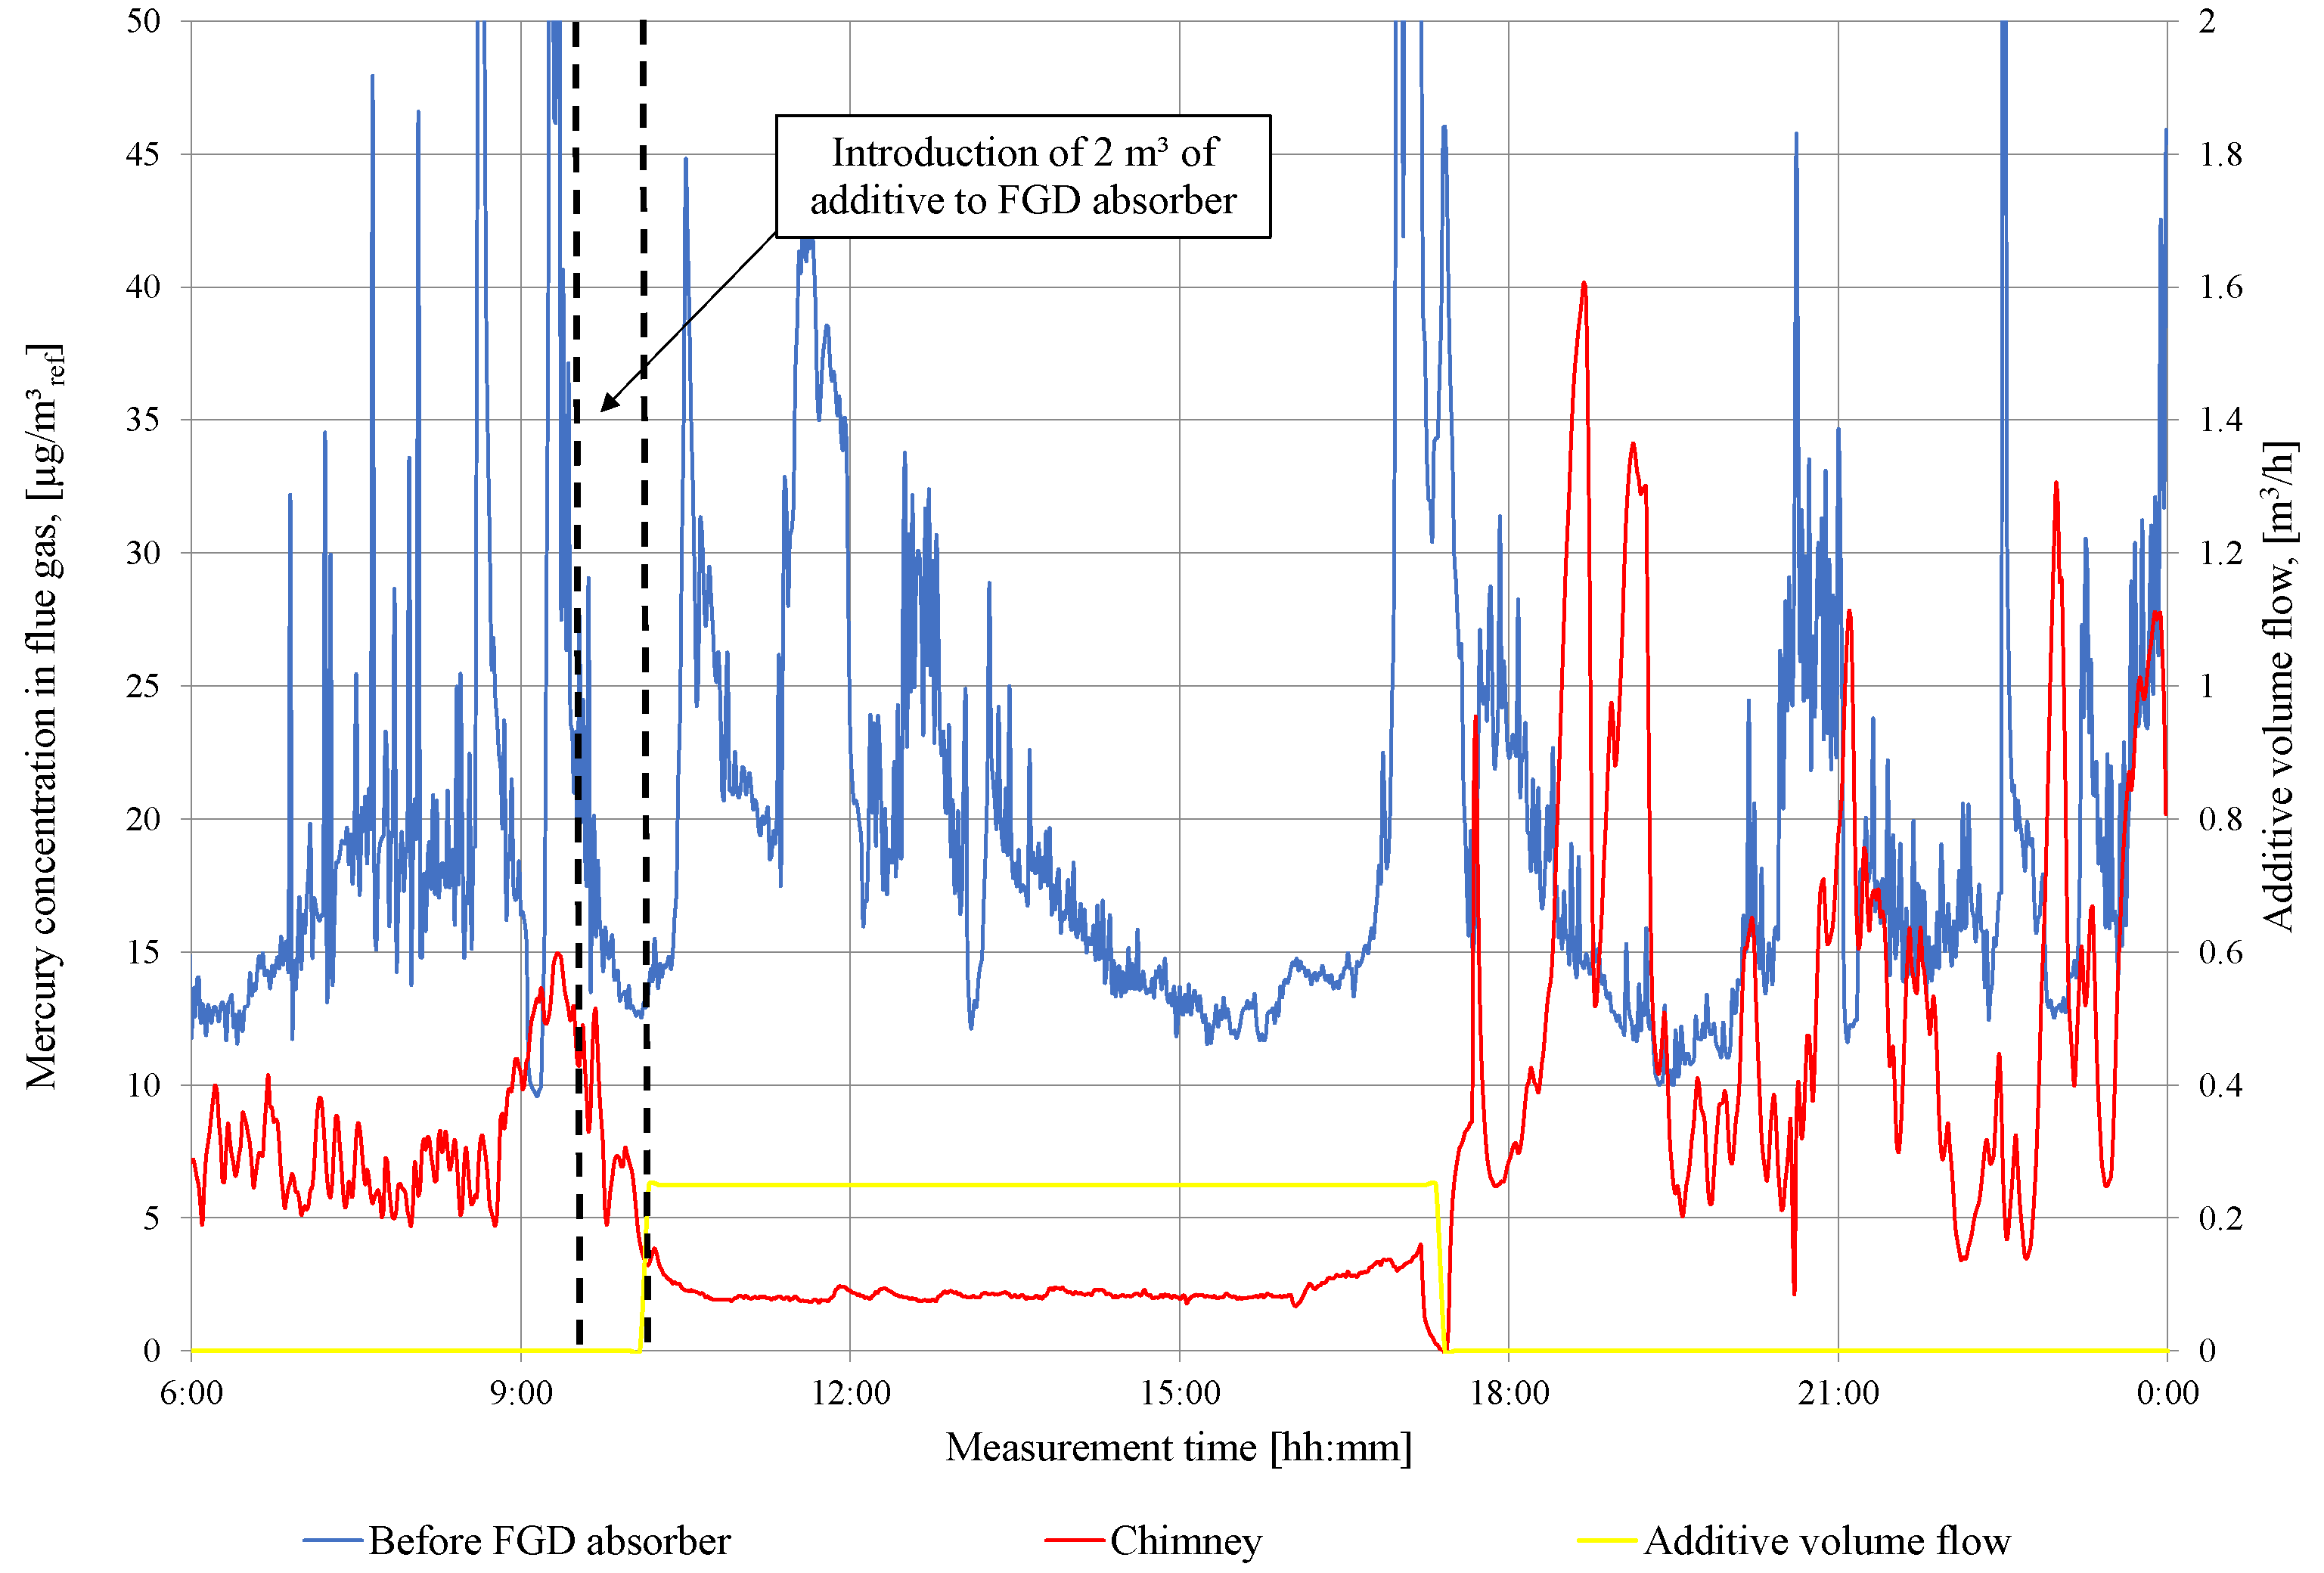
During industrial tests, a 10% w/w sodium sulfide solution (technical grade) is fed to the absorber in two ways. At the beginning of the tests, the initial dose is fed as quickly as possible to the WFGD slurry (2 m 3 ), and after that, continuous feeding with a small amount (to 250 dm 3 /h) is carried out. The real molar ratio of the additive is calculated on the basis of the metals concentration dissolved in the slurry. For object 1, the concentration is 0.18 mmol/dm 3 and 1.32 mmol/dm 3 for tests in object 2. The calculated molar ratio of the precipitating agent introduced to the FGD slurry at the beginning of the tests is the following:
  • For tests in object 1, 2 m 3 of additive is fed to the FGD absorber Y = 4.27;
  • For tests in object 2, 2 m 3 of additive is fed to the FGD absorber Y = 0.81.
For both installations, the efficiency of the precipitation of mercury from the slurry is high, with 85.9% for object 2, and 88.1% for object 1. For object 1 tests, the molar ratio Y is more than four times higher than in object 2 tests. This large difference in the results of the additive dose calculation is due to the assumption that the concentration of metals dissolved in the slurry is 1.50 mmol/dm 3 (real concentration measured is 0.18 mmol/dm 3 
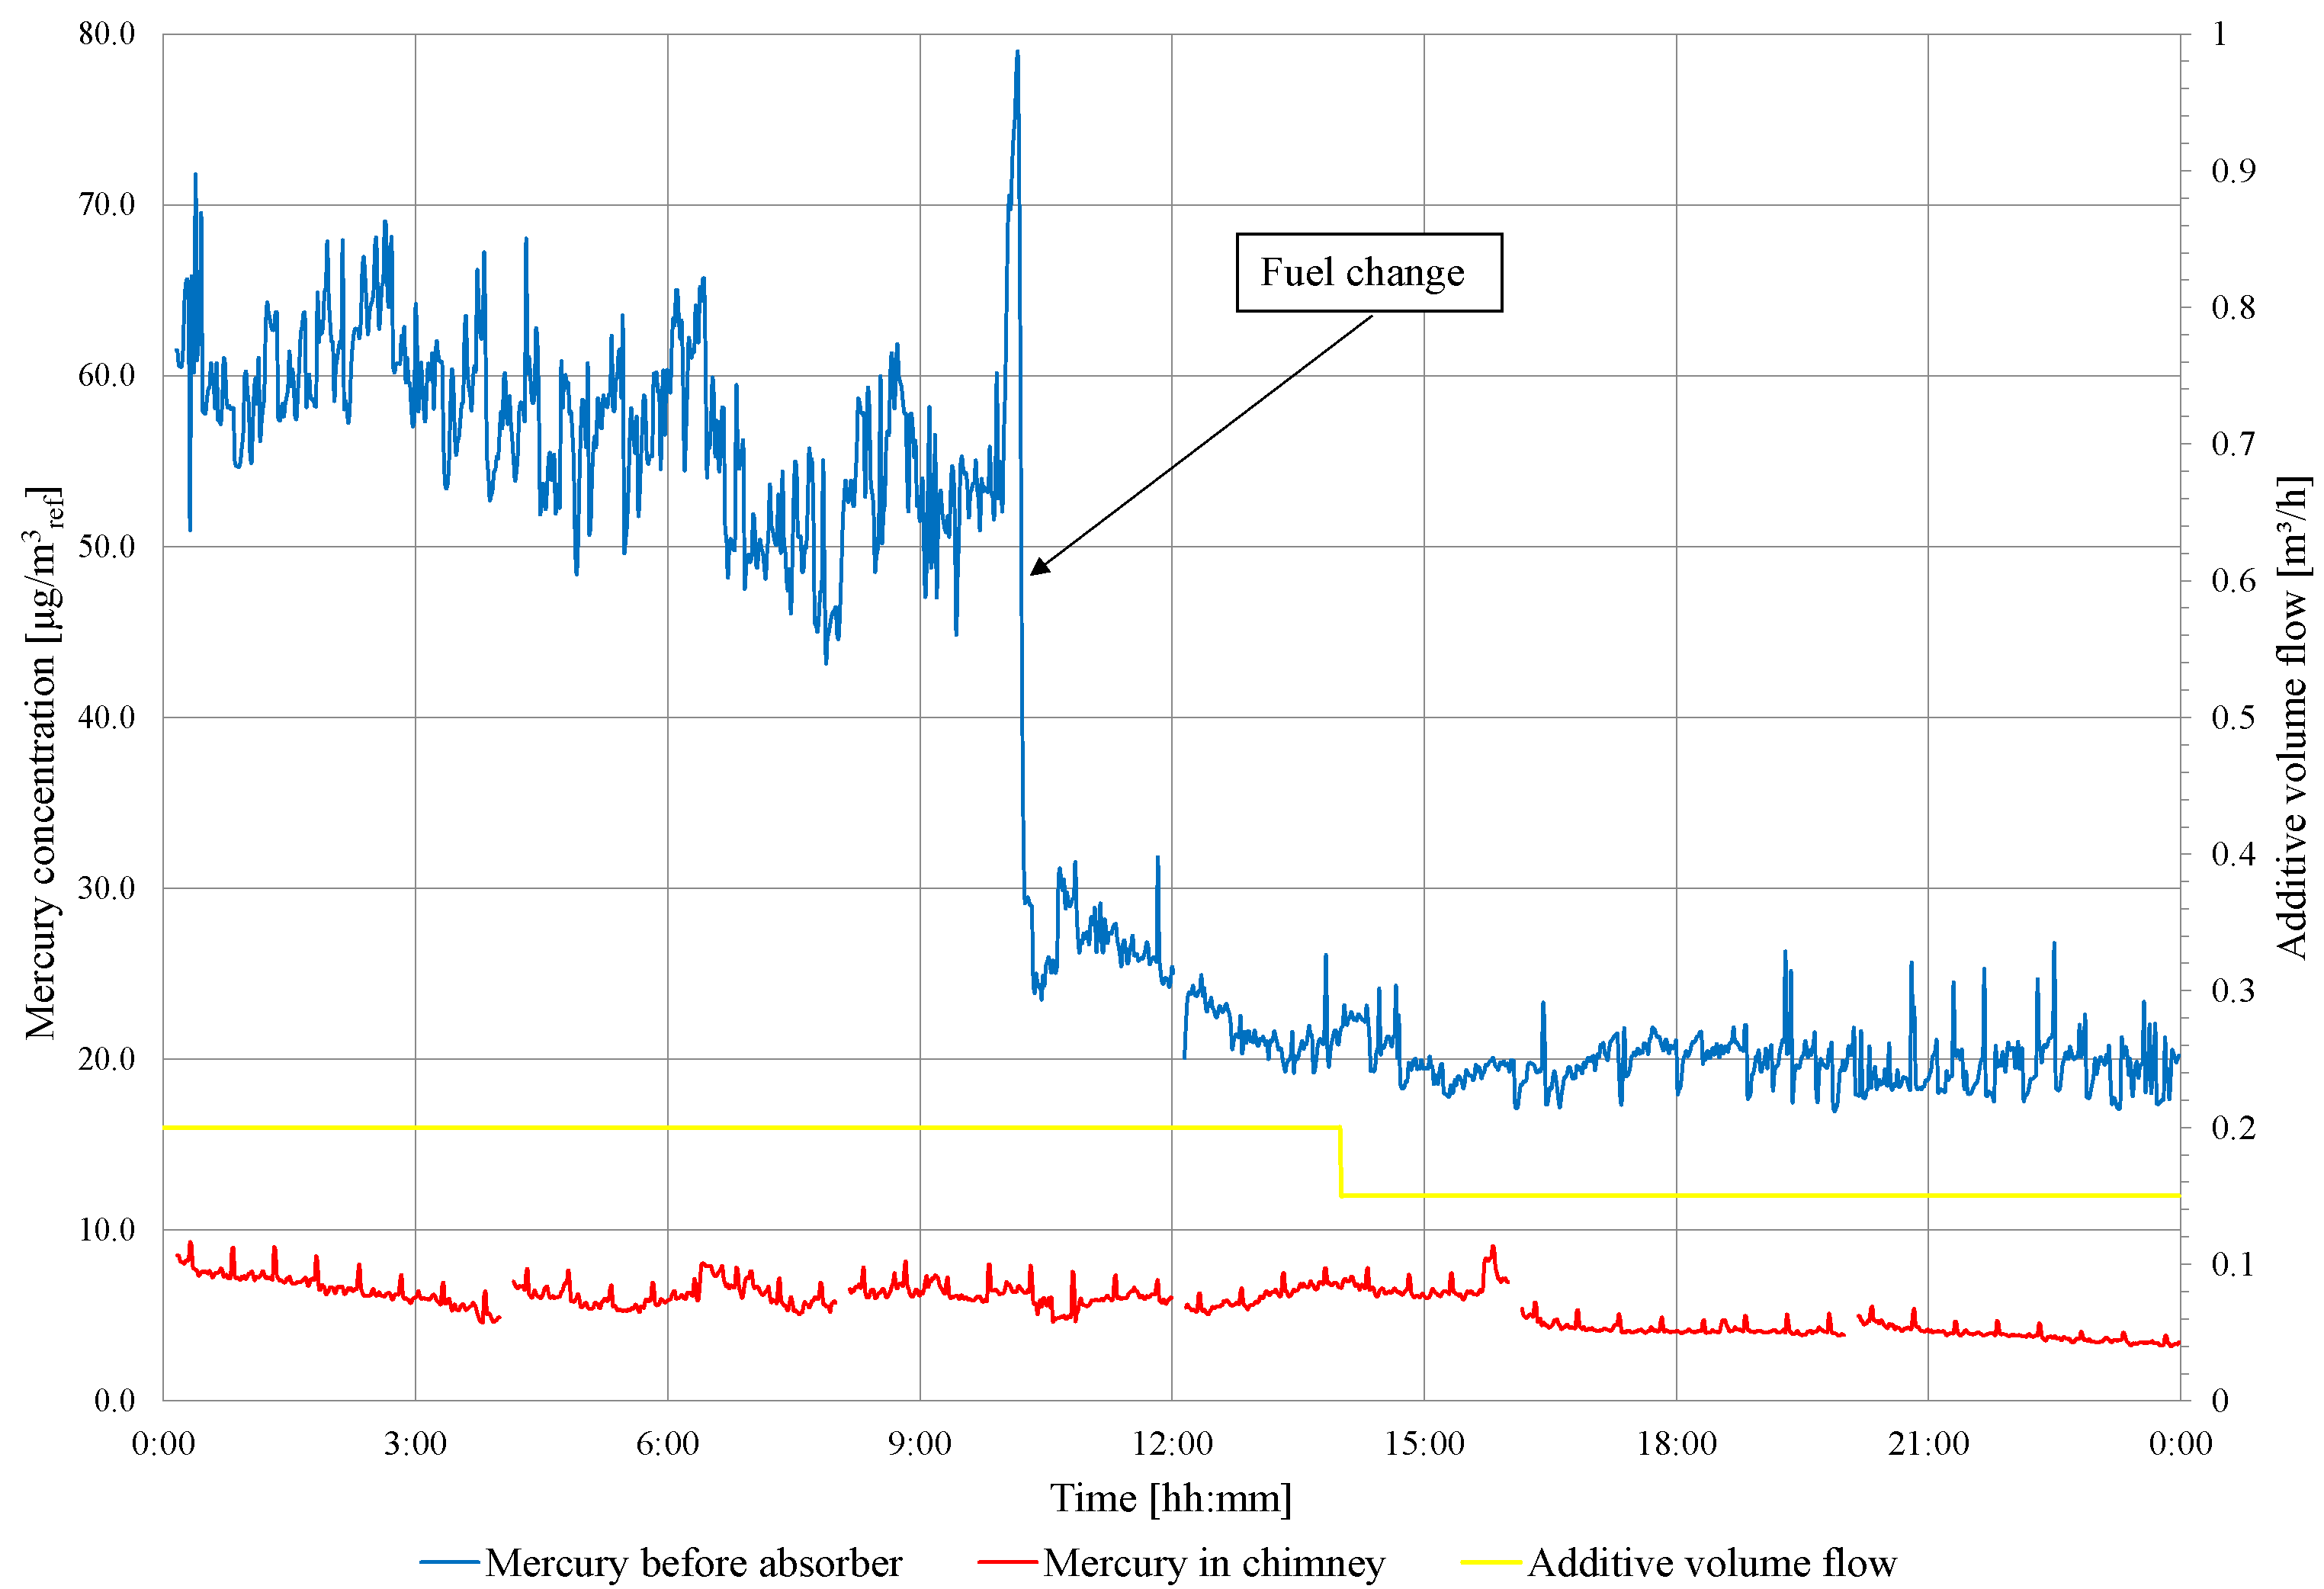
). The efficiency of mercury removal from the flue gas increases from level 56.9 to 74% in the case of the object 2 tests, which is too low to meet the emission standard (
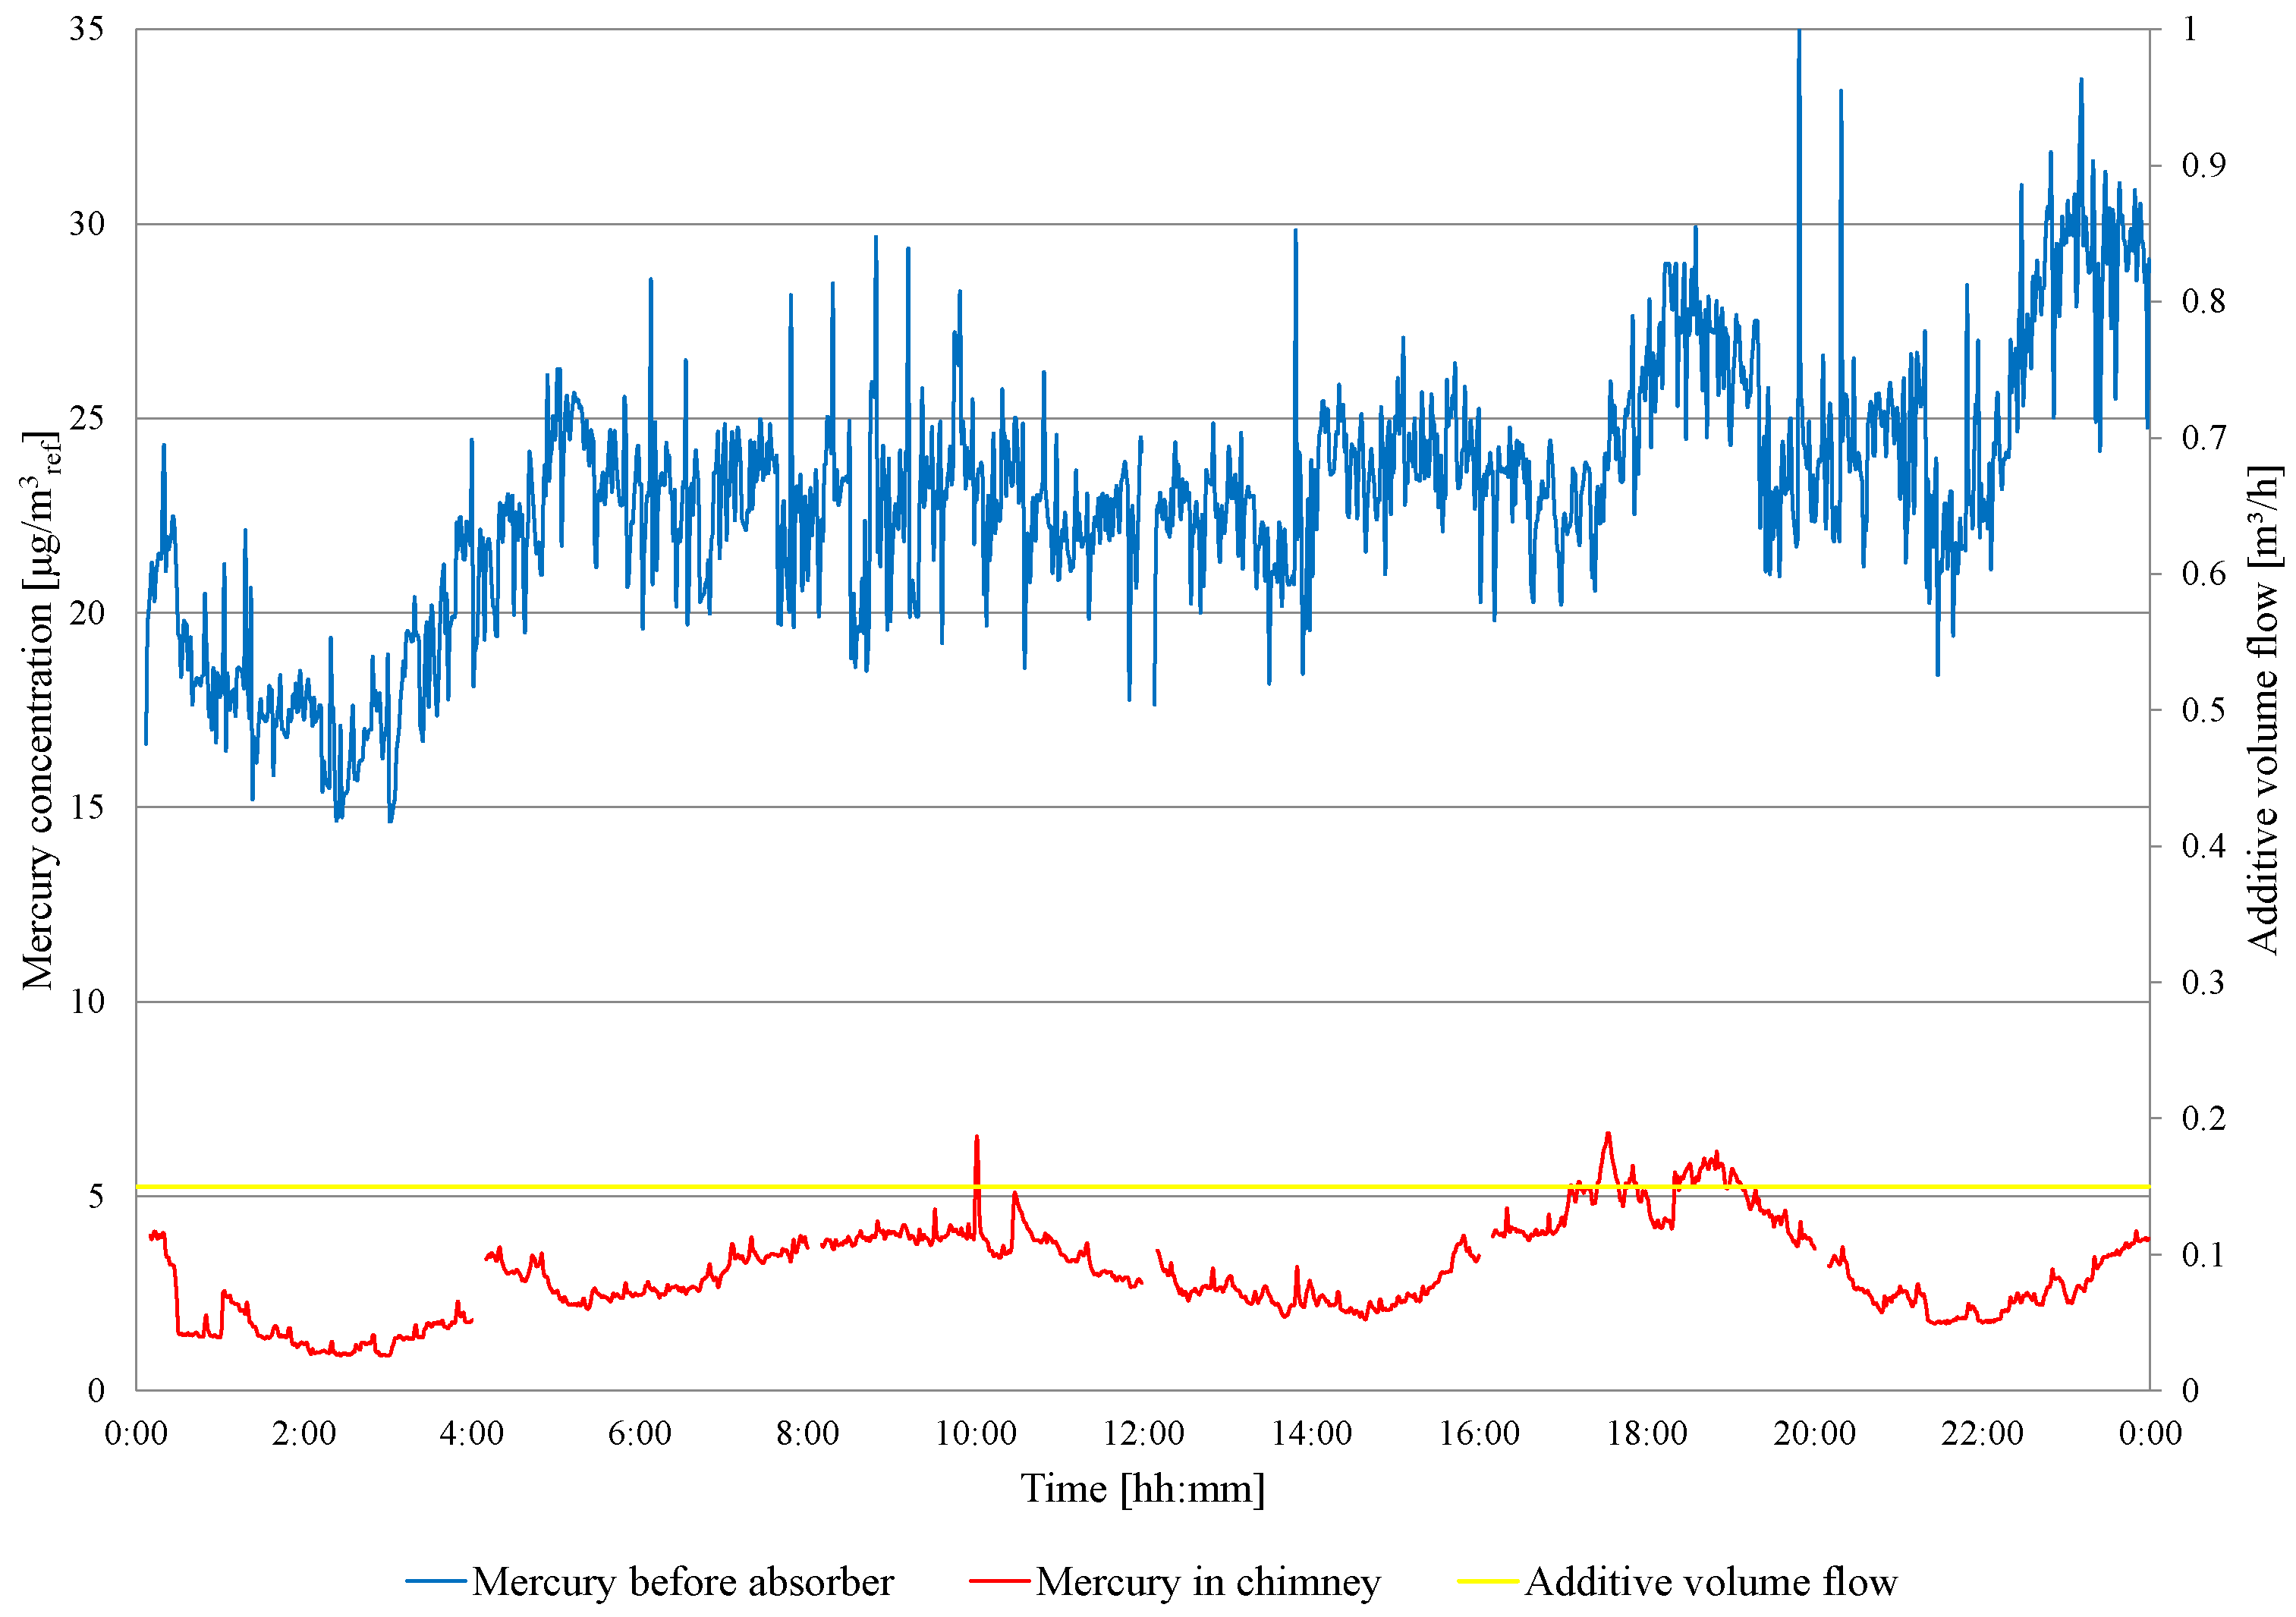
Figure 5). In the case of the tests in object 1, the mercury removal efficiency is higher and reaches 85%, and the emission requirement is met (Figure 4). The combustion of high mercury lignite in object 2 is also significant in achieving emission requirements; therefore, the concentration of Hg in front of the absorber is higher than in the tests carried out in object 1 (Figure 4 and Figure 5). When the lignite in the test of object 2 is changed to one with a low mercury content (Table 7), it allows to meet the emission standards, and the efficiency of mercury removal is at a level of 77.3%.
The analyses of the metal content in the absorber-filtered slurry show that the addition of sodium sulfide causes the precipitation of all the metals determined in the case of object 1. For object 2, there is no effect on the precipitation of manganese, iron, and lead. The observed phenomenon is related to a higher molar ratio Y during object 1 tests than in object 2 tests. The highest efficiency is achieved for mercury (object 1—88.1%, object 2—85.9%), which confirms the selectivity of sodium sulfide [39]. The precipitation efficiency of the remaining metals ranges from 2 to 70%. In general, reactions of the precipitation of mercury and metals contained in the slurry, with the use of sodium sulfide, can be written using the formula [30]
N a 2 S ( a q ) + H g ( a q ) 2 + H g S ( s ) + 2 N a +
N a 2 S ( a q ) + M e ( a q ) n + M e 2 / n S ( s ) + 2 N a +
As a result of the precipitation of mercury and other metals from the slurry liquid phase, its concentration decreases in WFGD raw wastewater (Table 5 and Table 8), which can influence the lifetime of the treatment system.

5. Conclusions

The addition of sodium sulfide to the slurry in the WFGD absorber effectively reduces the phenomenon of re-emission under conditions of real power units powered by lignite. The maximum reduction in mercury emission to the atmosphere is achieved at a level of 86.9% for the tests in object 2 and 88% for the tests in object 1. Comparison of the results from research objects allows us to draw the following conclusions.
  • For both measurement objects, the absorber construction, exhaust gas composition, and thermodynamic parameters of flue gas are at a similar level, which allows a comparison of the results;
  • The lignite from the tests conducted in object 1 is characterized by higher values of sulfur, moisture, and mercury than the lignite combusted in object 2. The lignite combusted in object 2 test is characterized by a higher calorific value, ash content, and carbon content;
  • For both objects, mercury re-emission occurs, and the sulfide addition to FGD slurry stops this phenomenon;
  • The permissible level of mercury emission is reached for both installations (although in the object 2 test, only in the case of the low-mercury lignite);
  • For the high-mercury lignite in the object 2 tests, the additional oxidation of metallic mercury in the flue gas is needed (for example, by oxidant injection to the flue gas) to achieve the proper emission level;
  • For object 1 tests, all of the measured metals are precipitated from the slurry, but in the case of the object 2 test, there is no effect on manganese, iron, and lead. The observed difference in the results of the metal precipitation may result in a higher molar ratio Y in object 1 of more than four times that in object 2.
Considering the fact that solid fuels will be a significant source of energy in the coming decades, the addition of sulfide to the WFGD absorption liquid circuit allows us to comply with emission standards with respect to mercury. The addition of sulfide works effectively for Polish and Czech lignite under the conditions of similar WFGD installations. The addition of an additive causes the precipitation of metals dissolved in the suspension in the form of metal sulfides, which is safe (mercury sulfide is insoluble in water). The presented method can be used wherever solid fuels are burned (coal, lignite, biomass, and RDF) and a WFGD installation is used.

Author Contributions

Investigation, Writing—original draft, Writing—review and editing, D.Ł. and L.P.; Investigation, A.Ś., M.K.-P. and K.B.; Supervision, M.J. All authors have read and agreed to the published version of the manuscript.

Funding

This research received no external funding.

Data Availability Statement

Data are unavailable; the authors have no permission to share the raw data from the industrial objects on which the research was carried out.

Conflicts of Interest

The authors declare the following potential conflicts of interest: Mariola Kobylańska-Pawlisz declare employment in Rafako S.A.; Dariusz Łuszkiewicz, Arkadiusz Świerczok, and Maria Jędrusik declare consultancies in Rafako S.A.; and Karel Borovec and Lukas Pilar declare no potential conflicts of interests.

Abbreviations

A r Ash content in fuel;
(aq)Liquid phase;
Br 2 Bromine;
C r Carbon content in fuel in working state;
CdCadmium;
CrChrome;
CMMContinuous monitoring system;
COCarbon monoxide;
CO 2 Carbon dioxide;
Cl r Chlorine content in fuel in working state;
Cl 2 Chlorine;
CuCooper;
CV-AASCold vapor-atomic absorption spectrometry;
ESPsElectrostatic precipitators;
ET-AASElectrothermal atomic absorption spectrometry;
FCDFlow control device;
FeIron;
FS-AASFlame atomic absorption spectrometry;
H r Hydrogen content in fuel in working state;
HClHydrogen chloride;
HFHydrogen fluoride;
H 2 O 2 Hydrogen peroxide;
HNO 3 Nitric acid;
H 2 SO 4 Sulfuric acid;
HgMercury;
Hg r Mercury content in fuel in working state;
Hg 0 Metallic mercury;
Hg 2 + Oxidized mercury;
Hg T Total mercury (sum of Hg 0 , Hg 2 + and Hg(p));
Hg(p)Mercury absorbed in particle surface;
HgCl 2 Mercury chloride;
HgSMercury sulfide;
HPLC-ICP-MSHPLC-inductively coupled plasma-mass spectrometry;
I 2 Iodine;
ICP-OESInductively coupled plasma-optical emission spectrometry;
ICP-MSInductively coupled plasma-mass spectrometry;
KClPotassium chloride;
KMnO 4 Potassium permanganate;
LSFOLimestone forced oxidation;
MnManganese;
MW t Megawatt of thermal energy;
MW e Megawatt of electric energy;
MeConcentration of metal dissolved in WFGD slurry;
Me n + Metal cation;
Na 2 SSodium sulfide;
Na + Sodium cation;
NiNickel;
NONitrogen oxide;
NO 2 Nitrogen dioxide;
NO x Nitrogen oxides (sum of NO and NO 2 );
ORPOxidation-reduction potential;
PbLead;
pHRelative amount of free hydrogen and hydroxyl ions in water;
PMParticular matter;
RDFRefuse derived fuel;
ref.Reference conditions;
S r Sulfur content in fuel in working state;
(s)Solid phase;
SCRSelective catalytic reduction;
SeSelenium;
SO 2 Sulfur dioxide;
SO 3 Sulfur trioxide;
SO x Sum of SO 2 and SO 3 ;
SNCRSelective non catalytic reduction;
WFGDWet flue gas desulfurization plant;
XRFfluorescence spectrometry;
YMolar ratio of additive to sum of metals dissolved in WFGD slurry;
ZnZinc;
η M e Efficiency of precipitation of metals from slurry by Na 2 S;
η H g Efficiency of mercury removal;

References

  1. Ritchie, H.; Rosado, P. Energy Mix. Our World in Data. 2020. Available online: https://ourworldindata.org/energy-mix (accessed on 1 January 2020).
  2. Wu, D.; Zheng, H.; Li, Q.; Jin, L.; Lyu, R.; Ding, X.; Huo, Y.; Zhao, B.; Jiang, J.; Chen, J.M.; et al. Toxic potency-adjusted control of air pollution for solid fuel combustion. Nat. Energy 2022, 7, 194–202. [Google Scholar] [CrossRef]
  3. Vohra, K.; Vodonos, A.; Schwartz, J.; Marais, E.A.; Sulprizio, M.P.; Mickley, L.J. Global mortality from outdoor fine particle pollution generated by fossil fuel combustion: Results from GEOS-Chem. Environ. Res. 2021, 195, 110754. [Google Scholar] [CrossRef]
  4. Ha, E.; Basu, N.; Bose-O’Reilly, S.; Dórea, J.G.; McSorley, E.; Sakamoto, M.; Chan, H.M. Current progress on understanding the impact of mercury on human health. Environ. Res. 2017, 152, 419–433. [Google Scholar] [CrossRef] [PubMed]
  5. Lorenz, U.; Grudziński, Z. Zawartość rtęci jako potencjalny czynnik ograniczający wartość użytkową węgla kamiennego i brunatnego. Górnictwo Geoinżynieria 2007, 31, 335–349. [Google Scholar]
  6. Zhao, S.; Pudasainee, D.; Duan, Y.; Gupta, R.; Liu, M.; Lu, J. A review on mercury in coal combustion process: Content and occurrence forms in coal, transformation, sampling methods, emission and control technologies. Prog. Energy Combust. Sci. 2019, 73, 26–64. [Google Scholar] [CrossRef]
  7. Yudovich, Y.E.; Ketris, M. Mercury in coal: A review: Part 1. Geochemistry. Int. J. Coal Geol. 2005, 62, 107–134. [Google Scholar] [CrossRef]
  8. Niksa, S.; Fujiwara, N. The Impact of Wet Flue Gas Desulfurization Scrubbing on Mercury Emissions from Coal-Fired Power Stations. J. Air Waste Manag. Assoc. 2005, 55, 970–977. [Google Scholar] [CrossRef]
  9. Zhang, L.; Wang, S.; Wu, Q.; Wang, F.; Lin, C.J.; Zhang, L.; Hui, M.; Yang, M.; Su, H.; Hao, J. Mercury transformation and speciation in flue gases from anthropogenic emission sources: A critical review. Atmos. Chem. Phys. 2016, 16, 2417–2433. [Google Scholar] [CrossRef]
  10. Senior, C.L.; Sarofim, A.F.; Zeng, T.; Helble, J.J.; Mamani-Paco, R. Gas-phase transformations of mercury in coal-fired power plants. Fuel Process. Technol. 2000, 63, 197–213. [Google Scholar] [CrossRef]
  11. Jędrusik, M.; Świerczok, A. Usuwanie rtęci w elektrofiltrach. Przemysł Chem. 2014, 93, 1885–1888. [Google Scholar]
  12. Li, Q.; Li, Q.; Wu, J.; Li, X.; Li, H.; Cheng, Y. Wellhead Stability During Development Process of Hydrate Reservoir in the Northern South China Sea: Evolution and Mechanism. Processes 2025, 13, 40. [Google Scholar] [CrossRef]
  13. EPA. National Emission Standards for Hazardous Air Pollutants. US EPA. 2024. Available online: https://www.epa.gov/stationary-sources-air-pollution/final-rule-national-emission-standards-hazardous-air-pollutants-0 (accessed on 20 December 2024).
  14. Commission Implementing Decision (EU) 2021/2326 of 30 November 2021 establishing best available techniques (BAT) conclusions, under Directive 2010/75/EU of the European Parliament and of the Council, for large combustion plants (notified under document C (2021) 8580). Off. J. Eur. Union 2021.
  15. Li, J.; Diao, C. Mercury Emission Abatement Strategies of China’s Coal-Fired Power Plants. Austin Public Health 2017, 2, 1008. [Google Scholar]
  16. Jafarinejad, S. 5—Control and Treatment of Air Emissions. In Petroleum Waste Treatment and Pollution Control; Jafarinejad, S., Ed.; Butterworth-Heinemann: Oxford, UK, 2017; pp. 149–183. [Google Scholar] [CrossRef]
  17. Kwiatkowski, S.; Polat, M.; Yu, W.; Johnson, M.S. Industrial Emissions Control Technologies: Introduction. In Encyclopedia of Sustainability Science and Technology; Meyers, R.A., Ed.; Springer: New York, NY, USA, 2019; pp. 1–35. [Google Scholar] [CrossRef]
  18. Gao, W.; Yin, J.; Liu, M.; Zhao, Y.; Wang, C.; Yan, J. Enhancement of SCR denitrification control strategy considering fluegas temperature fluctuation: Fundamental principle and performance evaluation. Fuel 2024, 359, 130453. [Google Scholar] [CrossRef]
  19. Krzyzynska, R.; Hutson, N.D. Effect of solution pH on SO2, NOx, and Hg removal from simulated coal combustion flue gas in an oxidant-enhanced wet scrubber. J. Air Waste Manag. Assoc. 2012, 62, 212–220. [Google Scholar] [CrossRef]
  20. Li, C.; Sriram, V.; Liu, Z.; Brewe, D.; Lee, J.Y. Sequentially prepared Mo-V-Based SCR catalyst for simultaneous Hg0 oxidation and NO reduction. Appl. Catal. Gen. 2021, 614, 118032. [Google Scholar] [CrossRef]
  21. Krzyżyńska, R.; Szeliga, Z.; Pilar, L.; Borovec, K.; Regucki, P. High mercury emission (both forms: Hg0 and Hg2+) from the wet scrubber in a full-scale lignite-fired power plant. Fuel 2020, 270, 117491. [Google Scholar] [CrossRef]
  22. Jędrusik, M.; Gostomczyk, M.A.; Świerczok, A.; Łuszkiewicz, D.; Kobylańska, M. Mercury re-emission from adipic acid enhanced FGD absorber—Full scale investigations on ∼400 MWe boiler (lignite) with oxidant injection to flue gas. Fuel 2019, 238, 507–513. [Google Scholar] [CrossRef]
  23. Córdoba, P. Status of Flue Gas Desulphurisation (FGD) systems from coal-fired power plants: Overview of the physic-chemical control processes of wet limestone FGDs. Fuel 2015, 144, 274–286. [Google Scholar] [CrossRef]
  24. Łuszkiewicz, D.; Jędrusik, M.; Świerczok, A.; Kobylańska-Pawlisz, M. Effect of addition of sulphide based additive to WFGD slurry on mercury removal from flue gas. Energy 2023, 270, 126953. [Google Scholar] [CrossRef]
  25. Pavlish, J.H.; Sondreal, E.A.; Mann, M.D.; Olson, E.S.; Galbreath, K.C.; Laudal, D.L.; Benson, S.A. Status review of mercury control options for coal-fired power plants. Fuel Process. Technol. 2003, 82, 89–165. [Google Scholar] [CrossRef]
  26. Jędrusik, M.; Łuszkiewicz, D.; Świerczok, A.; Gostomczyk, M.A.; Kobylańska-Pawlisz, M. Simultaneous removal of NOx, SO2, and Hg from flue gas in FGD absorber with oxidant injection (NaClO2)– full-scale investigation. J. Air Waste Manag. Assoc. 2020, 70, 629–640. [Google Scholar] [CrossRef] [PubMed]
  27. Ochoa-González, R.; Díaz-Somoano, M.; Rosa Martínez-Tarazona, M. Control of Hg0 re-emission from gypsum slurries by means of additives in typical wet scrubber conditions. Fuel 2013, 105, 112–118. [Google Scholar] [CrossRef]
  28. Heidel, B.; Hilber, M.; Scheffknecht, G. Impact of additives for enhanced sulfur dioxide removal on re-emissions of mercury in wet flue gas desulfurization. Appl. Energy 2014, 114, 485–491. [Google Scholar] [CrossRef]
  29. Omine, N.; Romero, C.E.; Kikkawa, H.; Wu, S.; Eswaran, S. Study of elemental mercury re-emission in a simulated wet scrubber. Fuel 2012, 91, 93–101. [Google Scholar] [CrossRef]
  30. Hsu, C.J.; Atkinson, J.D.; Chung, A.; Hsi, H.C. Gaseous mercury re-emission from wet flue gas desulfurization wastewater aeration basins: A review. J. Hazard. Mater. 2021, 420, 126546. [Google Scholar] [CrossRef] [PubMed]
  31. Wang, Y.; Liu, Y.; Wu, Z.; Mo, J.; Cheng, B. Experimental study on the absorption behaviors of gas phase bivalent mercury in Ca-based wet flue gas desulfurization slurry system. J. Hazard. Mater. 2010, 183, 902–907. [Google Scholar] [CrossRef]
  32. Aakriti.; Maiti, S.; Jain, N.; Malik, J. A comprehensive review of flue gas desulphurized gypsum: Production, properties, and applications. Constr. Build. Mater. 2023, 393, 131918. [Google Scholar] [CrossRef]
  33. Chen, C.; Liu, S.T.; Gao, Y.; Liu, Y. Investigation on Mercury Reemission from Limestone-Gypsum Wet Flue Gas Desulfurization Slurry. Sci. World J. 2014, 2014, 581724. [Google Scholar] [CrossRef]
  34. Singh, S.B.; Haskin, N.; Dastgheib, S.A. Coal-based graphene oxide-like materials: A comprehensive review. Carbon 2023, 215, 118447. [Google Scholar] [CrossRef]
  35. Liangxu, Y.; Wanghuo, X.; Yunwang, L.; Bogao, Y.; Chenglv, Z.; Weimi, X.; Shengguo, Y. Microscopic and macroscopic characteristics for coal spontaneous combustion under pre-oxidation and stress. Fuel 2024, 366, 131340. [Google Scholar] [CrossRef]
  36. Arjomandi, M.; Shirkhanloo, H. A review: Analytical methods for heavy metals determination in environment and human samples. Anal. Methods Environ. Chem. J. 2019, 2, 97–126. [Google Scholar] [CrossRef]
  37. ASTM D6784-02; Ontario-Hydro Method. ASTM International: West Conshohocken, PA, USA, 2016.
  38. Krishnakumar, B.; Niksa, S. Interpreting the Re-Emission of Elemental Mercury During Wet FGD Scrubbing. In Proceedings of the International Conference on Air Quality VIII, UND EERC, Arlington, VA, USA, 24–27 October 2011. [Google Scholar]
  39. Wu, H.; Sun, J.; Zhou, C.; Yang, H. Effect of additives on stabilization and inhibition of mercury re-emission in simulated desulphurization slurry. Int. J. Environ. Sci. Technol. 2019, 16, 7705–7714. [Google Scholar] [CrossRef]
Figure 1. Comparison of electric energy production by sources in the Czech Republic and Poland in 2023.
Energies 18 01982 g001
Figure 2. Schematic diagram of test installation: A and B—measurement cross sections, FGD—Flue Gas Desulfurization. FCD—flow control device, IBC—pallet container.
Energies 18 01982 g002
Figure 3. Measurement results of total mercury concentration in flue gas in front of WFGD absorber and in the chimney (series 0).
Energies 18 01982 g003
Figure 4. Measurement results of total mercury concentration in flue gas in front of WFGD absorber and in the chimney (series I).
Energies 18 01982 g004
Figure 5. Measurement results of the total mercury concentration in the flue gas in front of the WFGD absorber and in the chimney for series II of introducing additive (2 m 3 ).
Energies 18 01982 g005
Figure 6. Measurement results of total mercury concentration in flue gas in front of the WFGD absorber and in the chimney (during the continuous feeding of the additive to the absorber).
Energies 18 01982 g006
Figure 7. Measurement results of the total mercury concentration in the flue gas in front of the WFGD absorber and in the chimney—during the continuous feeding of the additive to the absorber.
Energies 18 01982 g007
Table 1. Efficiency of mercury species removal in WFGD absorber.
ParameterUnitValueCommentaryRefs.
Metallic mercury removal%-Metallic mercury is insoluble in water and efficiency of total mercury removal depends of oxidation rate Hg 0 to Hg 2 + [6]
Oxidized mercury removal%up to 95Efficiency depends on operating parameters of absorber and is limited by mercury re-emission[21,22,23]
Particle bound mercury removal%up to 95Residual particle bound mercury is captured[22,24]
Table 2. Lignite properties during tests.
ParameterUnitObject 1Object 2
Average Minimum Maximum Average Minimum Maximum
calorific valueMJ/kg10.105.5512.1012.109.3015.20
C r %25.2015.1030.1032.6025.6038.90
S r %1.060.701.520.860.611.18
A r %12.306.9028.9029.8820.9837.48
W%49.0043.7052.7024.4022.7725.92
Hg r mg/kg0.3530.2150.7010.1090.0530.173
Table 3. Flue gas composition (before WFGD absorber) during tests.
ParameterUnitObject 1Object 2
Average Minimum Maximum Average Minimum Maximum
Flue gas stream m ref 3 / h 2,010,0001,140,0002,118,0001,660,000731,0002,350,000
Flue gas temperature°C168162170179155188
O 2 %5.14.06.06.55.09.3
NOx mg/m ref 3 198182219242175306
SO 2 mg/m ref 3 620044507540361225726115
HCl mg/m ref 3 3.405.5---
Hg µg/m ref 3 34157321.412.138.3
Table 4. Results of mercury forms measurements by the Ontario Hydro method (series 0).
MeasurementBefore WFGDIn Chimney
Hg 2 + Hg 0 Hg T Hg 2 + Hg 0 Hg T
μ g/ m ref 3 μ g/ m ref 3 μ g/ m ref 3 μ g/ m ref 3 μ g/ m ref 3 μ g/ m ref 3
No. 12.9929.6032.591.7915.9017.69
No. 23.1112.6015.710.8617.8018.66
No. 32.5118.2020.711.5023.4024.90
Table 5. Concentration of heavy metals in filtrate of CaCO 3 slurry collected from WFGD absorber.
MetalSeries 0Value Series I
No Additive, Before Additive Injection, After Additive Injection (2 h), Precipitation Efficiency η Hg ,
μ g / m 3 μ g / m 3 μ g / m 3 %
Hg12.7110.181.2188.1
Zn136100982.0
Pb31332524.2
Cd48552554.5
Cr2933309.1
Cu52512649
Ni2702242192.2
Fe75575012.3
Mn93709180678026.1
Table 6. Results of mercury speciation measurements by Ontario Hydro method for object 2.
MeasurementBefore WFGDIn Chimney
Hg 2 + Hg 0 Hg T Hg 2 + Hg 0 Hg T
μ g/ m ref 3 μ g/ m ref 3 μ g/ m ref 3 μ g/ m ref 3 μ g/ m ref 3 μ g/ m ref 3
Before dosing of additive21.2622.2143.471.9215.6517.57
After dosing of additive17.245.8923.133.557.8511.40
Table 7. Coal properties before and after fuel change.
ParameterUnitBefore Fuel ChangeAfter Fuel Change
Calorific valueMJ/kg13.0414.10
C r %25.5927.54
H r %2.572.66
S r %0.610.77
A r %37.4836.75
W%24.5023.41
Cl r %<0.004<0.004
Hg r mg/kg0.1670.061
Table 8. Concentration of heavy metals in the filtrate of the CaCO 3 slurry collected from the WFGD absorber in object 2.
MetalBefore Additive Injection,After Additive Injection (Day 1),After Additive Injection (Day 2),Precipitation Efficiency, η Hg ,
μ g / m 3 μ g / m 3 μ g / m 3 %
Hg111.151.115.785.9
Zn18201390151017.0
Pb<10<10<10-
Cd80.860.74544.3
Cr10.110.47.426.7
Cu21.621.220.26.5
Ni104094391212.3
Fe12789132-
Mn66,90073,30078,800-
Se44603590317028.9
Disclaimer/Publisher’s Note: The statements, opinions and data contained in all publications are solely those of the individual author(s) and contributor(s) and not of MDPI and/or the editor(s). MDPI and/or the editor(s) disclaim responsibility for any injury to people or property resulting from any ideas, methods, instructions or products referred to in the content.

