Abstract
In recent years, the effects of global climate change have become more apparent, and reducing energy-derived CO2 emissions has become an important issue. The purpose of this study is to evaluate the CO2 emission reduction effect according to energy conservation scenarios in the residential sector, based on actual data. In this study, we set up energy-saving scenarios assuming the implementation of energy-saving behavior and the replacement of energy-consuming equipment and calculated the CO2 emission reduction effects of energy conservation for cooling, heating, and hot water using individual data from a large-scale survey of 29,161 samples. Consequently, we could quantify the relationship between the set scenarios and the associated CO2 reduction effects. Based on the results, we compared countermeasures and considered their respective potentials. However, despite there being an aggressive scenario in which all households implemented energy conservation measures, the calculated savings were limited. Therefore, we also considered the potential of demand response as a rough estimate. The results indicated that, while continued efforts to curb energy demand are necessary, a comprehensive countermeasure approach is important for achieving carbon neutrality.
1. Introduction
The reduction in greenhouse gas emissions has become an urgent need as the impacts of global climate change have become apparent in recent years. Considering that CO2 emissions from energy consumption account for a large proportion of greenhouse gas emissions, energy conservation represents an important measure. Therefore, research concerning energy conservation has been conducted from various perspectives, such as the widespread use of energy-saving technologies [1,2], improvements to urban thermal environments [3,4,5], development of energy-saving buildings [6,7,8,9,10,11], and energy-saving behavior [12,13]. In addition, as renewable energy has become increasingly widespread, research challenges have changed considerably recently. The instability of major renewable energy sources, such as solar and wind power, which are affected by weather and other factors, is a fundamental problem [14,15,16]. Hence, in recent years, considerable research has been conducted regarding energy management methods to achieve supply and demand balance adjustment, such as the use of storage batteries [17] and electric vehicle batteries [18] to smooth the supply and demand of renewable energy sources, the generation of hydrogen using surplus electricity from renewable energy sources [19,20], and demand response in which the energy demand side uses electricity in response to fluctuations in the supply side [21,22]. Therefore, in recent years, measures to reduce greenhouse gas emissions from energy sources have become extremely diverse and beyond simply reducing energy demand.
Japan has set a goal of achieving carbon neutrality by 2050 [23,24]. Because the cooperation of citizens is essential for achieving such a target, efforts in the residential sector will play a key role. However, Japan is far from achieving this goal, and further measures are required. Although residential sector CO2 emissions have declined in recent years [25], significant efforts are required to decarbonize society. Several studies have been conducted concerning energy consumption and CO2 emissions from consumers in Japan’s residential sector [26,27,28,29]. However, previous surveys have used limited sample sizes and only published aggregated results, making it possible to grasp the actual situation but difficult to grasp the effectiveness of measures. In contrast, studies that clarify the effectiveness of countermeasures [30,31,32] are often based on simulations of energy consumption behavior, in which case the results depend on assumptions and are challenging to verify. Research is being conducted to evaluate the effectiveness of countermeasures using measured electricity consumption data [33]. However, in this case [33], the effectiveness of the energy conservation campaign was measured by comparing the results before and after the provision of energy conservation incentives, which may lead to errors due to various factors, such as changes in weather during the campaign period. Although randomized controlled trials would be useful for a more rigorous evaluation [34], there are few study examples because large sample sizes are required to compare different households. A randomized controlled trial is a social experiment that compares a group that receives a countermeasure with a group that does not. Moreover, it is usually evaluated based on the results of providing incentives over a short period of time. However, short-term measures are less effective over time [33], and it is unclear whether they lead to sustainable energy savings. Therefore, studies that use real data to link the factors of everyday life with energy consumption and quantify their impact are needed.
Regarding international studies, sample surveys have been conducted in various regions. For example, Thogersen [35] analyzed the results of a large-scale questionnaire survey conducted in 10 European countries and clarified the influence of home-related lifestyle factors on daily energy-saving behavior. Poruschi and Ambrey [36] analyzed data from the Household Energy Consumption Survey conducted in Australia to assess how income, dwelling type, tenure type, and city living affect direct energy consumption. Vogiatzi et al. [37] conducted a survey on 451 people in Athens and identified the components of energy consumption behavior through principal component analysis. In addition, Pavón-Tapia et al. [38] used actual measurement data from 50 households in Extremadura to elucidate the performance improvements and energy-saving effects of buildings and equipment, so as to propose energy-saving measures. Chung et al. [39] analyzed electricity consumption reduction measures from the perspective of saving electricity bills, using metering data from 13,332 households in the Republic of Korea. Using carbon footprint data and various independent variables (age, education level, employment status, occupation, income level, social and economic development of the district, building density, socioeconomic status of the neighborhood, dwelling size, and dwelling type), Yologlu and Halisdemir [40] discussed the social determinants of household carbon emissions based on a sample of 4000 households in Mersin, Turkey. Bustamante et al. [41] measured the electricity consumption of 312 people in student housing and determined how the daily activities of the individuals influenced their electricity consumption. Using data from a large-scale survey of 14,928 households in China, Qu et al. [42] quantified the impact of various factors (household size, education level, income level, and consumption tendency) on each city’s CO2 emissions and modeled them using multiscale geographically weighted regression. Meanwhile, Xie et al. [43] conducted a detailed on-site survey of 66 households in Guangzhou, China, and discussed the factors influencing cooling, domestic hot water, lighting, appliances, and cooking, using multiple regression models. Based on data from 5400 nationally representative US homes, Kumar et al. [44] analyzed energy efficiency, energy curtailment, and their regulatory drivers. Han and Cudjoe [45] conducted a multiple regression analysis using data from 200 samples collected through an online survey in Myanmar and showed that knowledge of energy issues, the degree of concern, perceived energy-saving control, and sense of responsibility were potential determinants of energy-saving behavior. Although this study contributed remarkably to clarifying the factors that encourage energy-saving behavior, it did not quantify the impact of individual energy-saving efforts on CO2 reduction. Moreover, although methods of quantifying energy consumption based on the usage time and power consumption of each device exist [46,47], they do not reflect energy conservation considerations in detail, and the results depend on the calculation conditions and are difficult to corroborate with actual data. In addition, because energy consumption is affected by factors such as climate and lifestyle, more evaluation cases across various regions should be considered.
We have already analyzed relationships between CO2 emissions and various factors, including consumption behavior [48], housing and household attributes [49], and regional conditions [50]. However, all these factors are averages of macro estimates based on the Family Income and Expenditure Survey [51] and the National Survey of Family Income and Expenditure [52]. It is necessary to understand energy consumption in greater detail based on the lifestyle and actual energy use in specific regions and individual households.
When seeking to achieve carbon neutrality for the society as a whole, it is necessary to consider CO2 emission reduction measures across sectors, including the deployment of renewable energy incorporating a consumer demand response [53,54], reducing life-cycle CO2 in the industrial sector through consumer lifestyle changes [55,56], and energy management using electric vehicle batteries [57,58]. As a part of this assessment, it is necessary to clarify the magnitude of the reduction potential in the residential sector. In particular, we believe that measures in the residential sector will have to change significantly in the future; however, the direction of this change is open to debate. As mentioned above, measures to reduce energy-related greenhouse gas emissions are now becoming very diverse. During the Kyoto Protocol era, the reduction target of Japan was a 6% reduction during the first commitment period, and energy conservation occupied a prominent position [59]. On the other hand, under the Paris Agreement [60], the current goal is to achieve carbon neutrality by 2050. Naturally, carbon neutrality cannot be achieved by simply maintaining energy-saving behavior for a long period; therefore, long-term goals are not extensions of short-term goals. In this context, the importance of energy conservation remains the same as before; however, in recent years, the importance of the introduction of renewable energy and associated energy management for adjusting the supply and demand balance has increased [61,62]. We believe that clarifying the public’s efforts in mitigating climate change is important for the future. In particular, demand response has been studied in recent years as a means of contributing to energy management by targeting the behavior of homeowners [22,63,64], while an increasing number of studies have targeted residential buildings [65]. For example, Zou et al. [66] proposed a carbon-aware demand-response model based on the assumption that electricity carbon intensity and real-time electricity prices were adjusted using an actual residential smart building as a model. Furthermore, they proposed an energy management optimization model based on simulations incorporating electric vehicles as well as various home appliances. Demand response can also be a suitable measure in Japan, as retail electricity sales were liberalized in 2016 and the number of electric-power companies using dynamic pricing to set electricity prices is expected to increase in the future. Given the abovementioned issues, a detailed data analysis considering the room for reduction through various measures at the residential level is essential.
Given this background, this study aimed to quantify the CO2 reduction effects of energy-saving activities in consumer homes using large-scale survey data. Our study used individual household data collected from the Survey on the Actual Conditions of Carbon Dioxide Emissions from the Residential Sector [67] (Residential CO2 Emissions Survey). In this study, we quantified the effects of CO2 reduction based on household energy-saving scenarios. For this purpose, we set up simplified energy-saving scenarios that did not excessively emphasize feasibility for two reasons. First, presenting scenarios that prioritize clarity makes it easier to use the results. In many previous studies on measures, especially energy conservation behavior studies, priority has been given to assuming realistic scenarios for the level of measures that should be introduced, which often results in difficult-to-handle results. In contrast, we believe that the CO2 reduction effects of such measures and the discussion of strategies to achieve them should be considered separately. Research has also been conducted on the factors that encourage energy-saving behavior [68,69,70,71]. Knowledge of these behavioral drivers is important for effectively promoting the adoption of energy-saving behaviors. However, researchers do not decide on the level at which measures should be introduced; rather, actors such as policymakers and environmentally conscious individuals make such decisions. Therefore, we believe that the relationship between the level of measures and the resulting CO2 reductions should be presented using simple scenarios and that scientific evidence should be obtained to help specific actors make decisions. Second, it aimed to demonstrate the limits of CO2 reduction possibilities through measures to reduce individual energy demands. The scenarios discussed in this study, in which measures were introduced to all households, cannot be considered highly feasible. Moreover, even under these aggressive scenarios, there is still a long way to go to achieve our carbon neutrality goal. As mentioned, measures for reducing energy-related greenhouse gas emissions have become extremely diverse in recent years. Encouraging people to adopt an energy-saving lifestyle was an effective measure implemented during the Kyoto Protocol. Nevertheless, continued efforts toward energy conservation are important. However, to achieve carbon neutrality, cooperation in introducing renewable energy sources and demand responses to adjust the supply and demand balance is likely to be more important than efforts to further reduce energy consumption. To recognize the need for such policy changes, we believe that it is meaningful to quantify CO2 reduction effects based on sufficiently aggressive scenarios.
2. Materials and Methods
2.1. Individual Data from Household Surveys
The Ministry of the Environment (MOE) has been conducting the Residential CO2 Emission Survey [67] since FY2017 to assess residential sector CO2 emissions and energy consumption. The survey covers all of Japan, with 13,000 households randomly sampled from the Basic Resident Register and purposively sampled through online surveys. In conducting this survey, statistical information was compared across the United States, Canada, the United Kingdom, Germany, Russia, China, India, South Korea, and the EU as a whole [72]. An international comparison of lighting, window performance, and insulation performance was conducted across the United States and South Korea [73] under the MOE initiative.
The main survey items in the Residential CO2 Emissions Survey [67] are as follows:
- Monthly CO2 emissions estimated from energy use (electricity, gas, kerosene, gasoline, and diesel).
- Solar power generation (monthly power generation, electricity sales, and total solar photovoltaic generation capacity).
- Facilities and equipment (presence/absence of home energy management systems, energy storage systems, cogeneration systems, and electricity sales contracts).
- Households (household members, people present in the house on weekdays, and household income).
- Residence (type and date of construction, ownership, total floor area, number of rooms, and double-pane glass doors/windows installed or uninstalled).
- Home appliances (usage of TVs, refrigerators, air conditioners, lighting, etc.; energy-saving behaviors related to home appliances; types of lighting for each use area; energy-saving behaviors related to lighting).
- Hot water supply (water heater type, bathing conditions during winter and summer, and energy-saving behaviors related to bathing, and hot water use).
- Stoves and cooking (stove type, number of meals prepared, and energy-saving behaviors related to cooking).
- Automobiles (usage of vehicles, type of fuel, engine displacement, fuel consumption, frequency of use, annual distance traveled, and energy-saving behaviors related to automobile use).
- Heating equipment (ownership and use).
- Reasons for engaging in energy-saving behaviors.
To ensure an adequate sample size for analyzing the individual household data from the Residential CO2 Emission Survey, we combined data from 2017 to 2019. Data from 2020 onward was not used as we determined that the effects of temporary changes on lifestyle due to the COVID-19 pandemic were highly likely. This survey will only publish aggregated values, but to contribute to academically based measures against global warming in cooperation with the MOE, we are independently obtaining and using individual data from this survey. The number of valid datasets with no incomplete questionnaire responses was 29,161 samples over the three years combined.
2.2. Methods
In this study, we focused on implementing energy-saving behaviors and replacing energy-consuming equipment, assumed scenarios for the introduction of each measure and calculated the decarbonization effect on energy savings. As mentioned above, the assumed scenarios were simplified, and ease of understanding was prioritized over feasibility. This study aimed to provide consumers and policymakers with the information they need to make decisions. To evaluate the actual possibility of CO2 reduction based on the results of this study, it is necessary to consider separate strategies to provide incentives.
The method for calculating the amount of CO2 reduction for each scenario was to use household CO2 statistics to estimate the reduction effect from the relationship between lifestyle or installed equipment items and energy consumption and then calculate the reduction amount when it spreads to multiple households. However, equipment efficiency data from the equipment catalog were used as supplements when necessary. Details concerning the calculation method are explained for each item in the Results Section.
The seasonal pattern of changes in CO2 emissions was used to disaggregate energy use, including heating and cooling, from CO2 emission statistics, referring to the methods of previous research [26,27,28]. The emissions reduction effect was calculated based on the energy consumed for heating and cooling. Details of this process are described in the following subsections.
To evaluate household sizes, we divided households into three categories: single-person households, two-person households, and households with three or more people. Although evaluation of the effect of household size was not an objective of our study because factors other than the number of household members, such as age, local conditions, and housing conditions, may have induced bias in the results for single- and two-person households, they were placed in separate categories. Due to the sample size and other factors, households with three or more people were grouped. In addition, because the type of housing construction affects air-conditioning loads, calculations were performed for each building type as necessary. Housing was divided into detached houses and apartment buildings, with row houses included in apartment buildings.
2.3. Estimation of CO2 Emissions by Energy Use
In this study, we assumed scenarios for heating, cooling, and hot water supply and calculated the decarbonization effects of energy savings. To achieve this, we obtained values for CO2 emissions by energy use using the following method: First, for annual CO2 emissions from hot water and heating, we used the estimates for each sample included in the Residential CO2 Emissions Survey [67]. These data are estimates and therefore contain uncertainty; however, they are estimated based on the energy sources and equipment used in each sample, as well as the CO2 emissions of each energy source. In addition, hot water fluctuates less than during space heating and cooling. Therefore, it is considered best to use these values. On the other hand, heating and cooling vary greatly depending on building structures and consumer behavior patterns, but it is expected that estimations will be possible by matching regional temperature data. Therefore, we tabulated each sample city or town included in the Residential CO2 Emission Survey [67] into Japan’s energy conservation region classifications [74] and compared the data with the monthly average temperature data [75] for each region.
Using energy consumption data from the commercial sector, we proposed a method to decompose the data into base demands that were considered stable across seasons based on monthly patterns of variation and summer and winter increments [76]. In this method, the month with the lowest energy consumption was set as the base demand month, and the energy consumption of that month was considered the base demand. The difference in emissions from other months was then calculated from the base demand, which was taken as the increment due to temperature. If the temperature of that month is higher than that of the base demand month, the seasonal fluctuation is considered to be a summer increment, and if it is lower, it is considered to be a winter increment. The summer increment is thought to represent CO2 from cooling energy, whereas the winter increment generally represents CO2 from heating energy. However, in our previous study [76], we did not use the terms cooling or heating because they did not capture the seasonal variations in the energy consumption for hot water heating. However, in this study, it was necessary to calculate CO2 emissions from energy consumption for cooling and heating. Therefore, this method was applied after subtracting CO2 emissions from the hot water supply, taking into account seasonal changes.
Therefore, we investigated a method to estimate the seasonal patterns of change in hot water supply. First, we extracted only households that used gas for hot water but not for space heating and plotted the relationship between CO2 emissions from gas use and temperature (Figure 1). Consequently, a linear relationship was observed. This is reasonable considering that the air temperature and water supply temperature correspond well and that energy consumption is proportional to the difference between the hot water temperature and the water supply temperature. The intercept of the temperature axis calculated from the regression line based on the monthly average values of all samples (dashed line in Figure 1) was 37.9 °C. Therefore, the total annual amount of CO2 used for hot water heating was allocated in proportion to the difference between the temperature of each month and 37.9 °C, and monthly patterns were obtained. After subtracting this monthly hot water CO2, we decomposed it into the winter increment, summer increment, and base demand mentioned above and set each of them as heating, cooling, lighting, and power use. Although this decomposition was performed for each individual sample, the monthly pattern of the average values for all samples is shown in Figure 2. Figure 3 shows the total annual emissions from housing and household attributes.
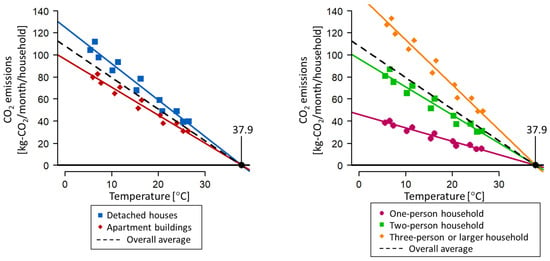
Figure 1.
Relationship between the monthly temperature and CO2 emissions from gas use.
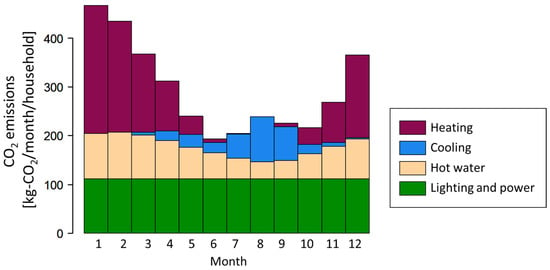
Figure 2.
CO2 emissions disaggregated by use based on monthly patterns.
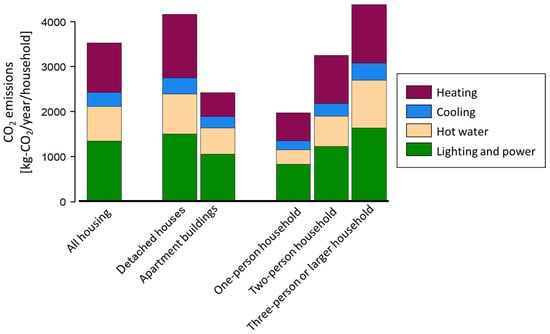
Figure 3.
CO2 emissions disaggregated by use (housing type and household type).
3. Results
3.1. Implementation of Energy-Saving Behavior
3.1.1. Heating and Cooling
The relationships between the CO2 emissions from heating, cooling, and the temperature settings are shown in Figure 4 and Figure 5. The results clearly showed that lower temperature settings for heating and higher temperature settings for cooling resulted in lower CO2 emissions. Thus, the energy-saving behavior scenario was set as a 1 °C temperature-setting reduction for heating and a 1 °C temperature-setting increase for cooling. The number of households with extremely high- or low-temperature settings is small, and they may exceed the limits of the capacity of the air-conditioning equipment, making them unreliable. Therefore, we extracted the ranges of 19 to 26 °C for heating and 24 to 29 °C for cooling as ranges where values are generally stable and created a regression equation. These ranges covered more than 85% of the samples that responded to the temperature settings for both cooling and heating. The rough reduction effects for heating, calculated using a simple regression equation, were 48.5 kg-CO2/°C for detached houses and 24.7 kg-CO2/°C for apartment buildings. For cooling, the rough reduction effect was 32.8 kg-CO2/°C for detached houses and 32.3 kg-CO2/°C for apartment buildings. If the scenario was implemented for all households, CO2 emissions from heating would be reduced by 3.7% (1.1% of the total residential sector emissions), while CO2 emissions from cooling would be reduced by 10.7% (0.97% of the total residential sector emissions).
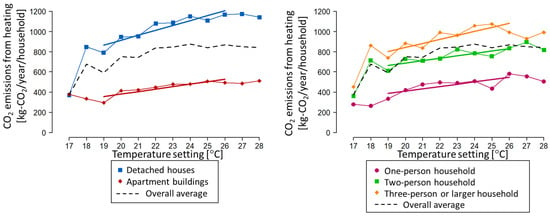
Figure 4.
Relationship between the heater temperature setting and heating CO2 emissions.
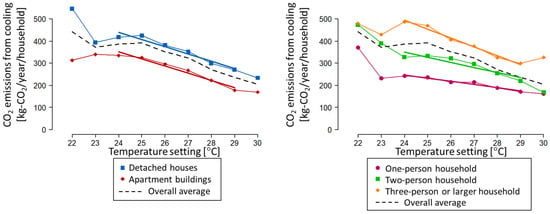
Figure 5.
Relationship between the air conditioner temperature setting and CO2 emissions for cooling.
3.1.2. Hot Water
For the hot water supply, while there is a strong correlation between the number of bathing days and CO2 emissions from the hot water supply, measures to reduce the number of bathing days have low acceptance; thus, the feasibility of scenarios for universal reduction in bathing frequency is low. Thus, based on the survey items of the Residential CO2 Emission Survey [67], we evaluated the differences in CO2 emission depending on implementation of the following four measures: “the water is not left running unnecessarily when taking a shower”, “family members soak in the bath one after another”, “the water is not left running unnecessarily when washing dishes by hand”, and “the power for the controller is turned off when the hot water heater is not being used”. The results in Figure 6 suggest that each measure reduced CO2 emissions. However, because households with high energy-saving awareness are likely to implement multiple measures. Figure 6 does not quantify the individual effects of each measure. Therefore, when a scenario involving the implementation of multiple measures is assumed, it is inappropriate to sum the effects of the individual measures, as shown in Figure 6. Therefore, only households implementing all four measures (for single-person households, all three measures other than “family members soak in the bath one after another”) were extracted, and CO2 emissions were calculated. When households implementing all measures were compared with other households, a reduction of approximately 20% was observed, irrespective of construction type or household size. When we used this reduction rate to calculate the CO2 emission reduction effect, assuming that all of the households implemented all measures, the reduction effect for hot water supply CO2 emissions was estimated to be 19.3% (4.4% of the total residential sector emissions).
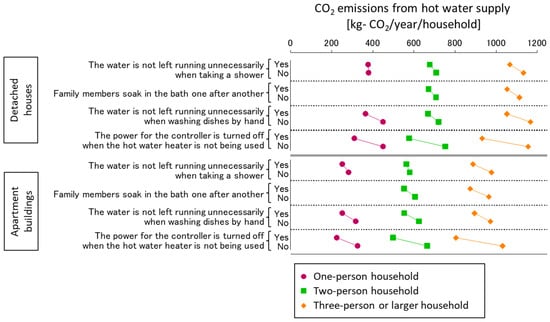
Figure 6.
Relationship between the energy-saving behavior related to hot water use and CO2 emissions from the hot water supply.
3.2. Replacement of Energy-Consuming Equipment
3.2.1. Cooling
We evaluated the CO2 emissions reduction effects of deploying the latest high-efficiency equipment to replace energy-consuming equipment. First, the relationship between the manufacturing date of the air conditioners and CO2 emissions from cooling was examined, and it was found that the most recent equipment had slightly lower CO2 emissions (Figure 7). Although the electric power consumption of air-conditioning equipment has decreased significantly since 1995 (Figure 8), the actual reduction in CO2 emissions, as shown in Figure 7, was relatively small. We believe that this is mainly due to high-efficiency equipment being operated for longer periods and older equipment being used in rental apartment buildings, where the cooling loads are lower. To compare the performance under the same conditions, CO2 emissions were calculated for each year and 2019 using the energy efficiencies for equipment manufactured that year. These efficiencies were estimated based on the annual power consumption ratios in the Energy-Saving Performance Catalog [77] and other sources (see Figure 8) and were applied for all of the equipment deployed in a given year. The reduction in CO2 emissions due to replacement with the latest equipment was found to be 10.9% (0.99% of total residential sector emissions).
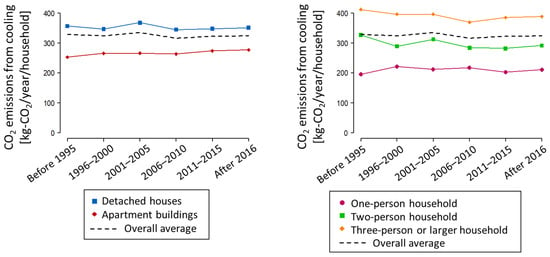
Figure 7.
Relationship between the air conditioner manufacturing date and CO2 emissions.
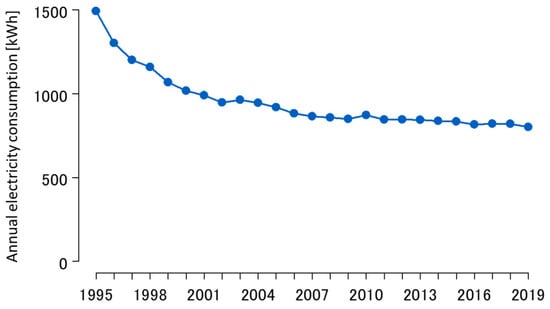
Figure 8.
Trend in annual electricity consumption by air conditioners.
3.2.2. Heating
We investigated the relationship between the most widely used heating equipment and CO2 emissions and found that households using electric thermal storage systems, central heating systems, and kerosene hot water floor heating systems had high CO2 emissions (Figure 9). However, because the influence of the housing size is probably not completely eliminated, it is difficult to compare it with other types of heating systems. In addition, as it is difficult to upgrade such “built-in” systems to newer versions, scenarios that assume universal upgrading to air conditioner/heater units are unlikely to be feasible. Thus, we restricted our analysis to air conditioners (electric), electric-resistant heaters, gas heaters, and kerosene heaters, which can be easily replaced. These four types, in addition to heated carpets, kotatsu, and no heating equipment, cover more than 90% of the households. The scenarios we set were as follows: For households using air conditioners (electric), we assumed the achievement of the same efficiency improvements discussed above for cooling by updating equipment, and calculations were made using the same procedure as for air conditioners described above. We assumed that households using electric-resistance heaters, gas heaters, or kerosene heaters would be replaced with air conditioners. Calculations were performed using the average values of the air conditioners by housing type and household size. The results showed that updating heating equipment reduced CO2 emissions by 23.0% (a 6.9% reduction in the residential sector).
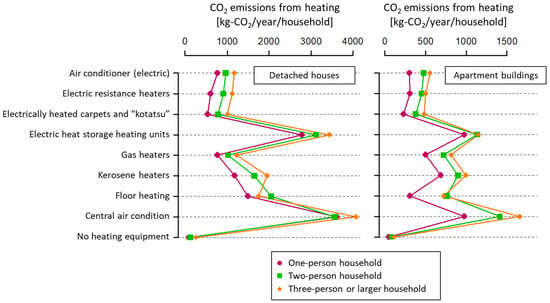
Figure 9.
Relationship between the heater type and CO2 emissions for heating.
3.2.3. Hot Water
The relationship between the hot water supply equipment and CO2 emissions from the hot water supply (Figure 10) was investigated to calculate the effect of updating the hot water supply equipment. The results showed that replacing electric water heaters, which have high CO2 emissions, with heat-pump water heaters significantly reduced CO2 emissions. In addition, Figure 10 shows that gas water heaters had slightly lower CO2 emissions than heat-pump water heaters. Under the same equipment usage conditions, it is expected that more efficient heat-pump water heaters will emit less CO2 than gas water heaters, and it is possible that the effect of housing size is not eliminated. Therefore, for cooling and heating, the effects of the equipment updates were calculated using values from the Energy-saving Performance Catalog and other sources. The efficiency of heat-pump water heaters was assumed to be 3.3 (assuming the fully automatic type, 330 to 550 L tank capacity) and the efficiency of combustion-type water heaters was assumed to be 0.9. The CO2 emission coefficient for electricity was set at 0.457 kg-CO2/kwh as reported by the Tokyo Electric Power Company. The emission coefficients for the fuels used were 14.04 t-C/TJ for city gas, 16.38 t-C/TJ for LPG, and 18.71 t-C/TJ for kerosene. The effect of upgrading the electric water heater to a heat pump water heater was calculated by dividing the CO2 emissions of current electric heaters by the efficiency of the heat-pump water heaters. When replacing combustion-type water heaters with heat-pump water heaters, the reduction in CO2 emissions based on the above parameter settings was calculated to be 31% for city gas, 41% for LPG, and 48% for kerosene. The replacement of all of the equipment based on the aforementioned assumptions reduced CO2 emissions by 28.9%, equivalent to 6.6% of the residential sector emissions.
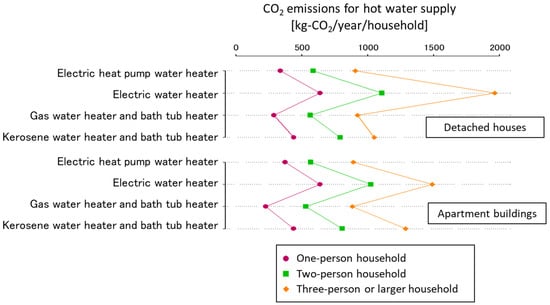
Figure 10.
Relationship between the hot water supply equipment and CO2 emissions for hot water supply.
4. Discussion
4.1. Comparison of Measures
The measures were compared in terms of effectiveness to allow consumers to select the most effective one. However, the reduction effects shown in this study were scenario-dependent; therefore, a direct comparison of the numerical results was not appropriate. Therefore, as a rough comparison standard, we converted the number of measures required to reduce CO2 emissions by 1 Mt-CO2.
First, regarding the energy-saving behavior case, to reduce cooling-derived CO2 emissions by 1 Mt-CO2 by changing the temperature setting of an air conditioner, all households would need to raise the temperature setting by 0.55 °C. A similar reduction could be expected for heating by lowering the set temperature by 0.48 °C. With regard to hot water, similar reduction effects could be expected if the number of households implementing the series of measures shown in Figure 6 increased by 14% of the total number of households.
In replacing energy equipment, to reduce CO2 emissions by 1 Mt-CO2 from cooling alone, 54% of households would need to upgrade their air conditioners to the latest equipment. However, heat-pump air conditioners also have a high heating efficiency, and it was assumed that all heating equipment targeted in the heating-equipment-replacement scenario of this study would be replaced by the most efficient heat-pump air conditioners. Therefore, in the case of equipment replacement, when combining the effects of increasing the efficiency of both cooling and heating, it was estimated that 6.8% of households could reduce their CO2 emissions by 1 Mt-CO2 by replacing their current equipment with the most efficient equipment. In reality, this is likely to be achieved with a smaller number of households, as households with older, less efficient equipment are prioritized for equipment replacement. Regarding hot water, if 9.4% of households that owned the equipment covered in this study were to replace it with a heat-pump water heater, 1 Mt-CO2 would be reached. In particular, for electric hot-water heaters, which consume a substantial amount of electricity, if 22% of households that own them were to replace them with a heat-pump water heater, 1 Mt-CO2 would be reached, which is 2.0% of the total number of households.
This comparison shows that replacing heating and hot-water equipment is effective. Japanese households consume large amounts of energy for heating and hot water. Additionally, many households use kerosene for heating and gas to supply hot water. Electrification of heating and hot-water supply by replacing existing equipment with the latest high-efficiency heat pumps has been shown to have a relatively large potential for reducing CO2 emissions. With regard to cooling, although there is some opportunity to reduce energy consumption by replacing equipment, the high rate of electrification of residential air conditioning means that the reduction potential would not be not significant. However, owing to the considerable improvements in the energy efficiency of equipment in the 1990s (Figure 8), although the effect of a universal replacement scenario on society as a whole would not be large, it can be surmised that replacement would have a substantial effect on energy consumption at the household level. Therefore, while the objective of our study was to evaluate the potential for reducing CO2 emissions in society as a whole, making detailed proposals based on the future situation of individual households is important.
On the other hand, the effect of changing the cooling and heating temperature settings on reducing CO2 emissions was limited. Comparing the energy-saving behavior case and the equipment replacement case on an equal footing is not appropriate because their barriers to implementation differ. However, under an aggressive scenario in which all households implement these initiatives, it is expected that it will be difficult to continue these efforts until 2050, which is the target year for achieving carbon neutrality. Incidentally, we compared the reduction per 1 Mt-CO2 as a rough standard for comparing different scenarios on an equal footing. However, 1 Mt-CO2 represented only approximately 0.9% of residential CO2 emissions and approximately 0.1% of Japan’s total CO2 emissions, including those from other sectors (e.g., commercial, industrial, and transport). Therefore, although energy-saving efforts will need to continue (unless CO2 emissions from power sources are reduced to zero), achieving carbon neutrality in 2050 will require both energy conservation and other integrated efforts.
4.2. Potential for Introducing Demand Response
In this study, despite setting an aggressive scenario in which all households implemented measures, the calculated result that only a reduction in several percentages could be achieved was significant. As previously explained, measures to reduce greenhouse gas emissions have diversified greatly in recent years. Under such circumstances, energy conservation must continue. However, significant reductions are required to achieve carbon neutrality. Therefore, suppressing energy demands and combining them with other measures are becoming important for promoting comprehensive approaches. Many measures can be taken by citizens, such as installing solar photovoltaic (PV) and Vehicle-to-Home (V2H) systems on the roofs of their homes, establishing large-scale renewable-energy facilities in their local communities, and adopting energy consumption behavior that considers the demand response. Therefore, when encouraging CO2 emission reductions, it is important to promote broader policies, rather than focusing solely on promoting energy-saving behavior.
Based on the results of this study, we examined the potential of the demand response as a measure that residents can implement in their homes. For this, we performed rough calculations to obtain only a rough estimate of the potential. To quantify the effect of adjusting the supply and demand balance through energy management that incorporates the demand response, data that capture the specific temporal changes in both demand and supply are required.
Demand response includes downward demand response (down-DR), which is activated during power shortages and prioritizes both energy conservation and power saving, and upward demand response (up-DR), which creates a demand during a power surplus. As Japan aims to become a carbon-neutral society, it will inevitably rely on solar power generation, and electricity surpluses and shortages are expected to increase during the day and at night, respectively. Therefore, because the electricity consumption in the residential sector is high at night, down-DR would be advantageous.
Cooling and heating are compatible with down-DR because the demand is higher at night, as this is when many residents are at home. For example, if the supply and demand balance is adjusted using oil-fired power generation, a reduction of 0.695 t-CO2/kWh can be expected. Meanwhile, the results presented in the previous section were calculated using the average emission intensity of each power company, and the weighted average value based on the number of samples was 0.507 t-CO2/kWh. Therefore, if electricity is saved when there is no surplus electricity generated by solar power, as a down-DR, a greater reduction in CO2 emissions can be expected. For instance, in the energy-saving behavior case, the value of the CO2 reduction effect in a scenario in which all households raised their air-conditioning temperature settings by 1 °C was 1.81 Mt-CO2. However, if this was recalculated based on the assumption that the supply and demand balance was adjusted by oil-fired power generation, a reduction effect of 2.36 Mt-CO2 could be expected. In reality, even further reductions can be achieved if peak loads are reduced and the supply and demand are equalized. Such measures are expected to improve the efficiency of power plants that cannot be shut down frequently and to curb the launch of new power plants. More information should be considered in conjunction with the power supply planning model.
However, hot-water supply is well suited for up-DR because surplus electricity can be used to heat and store water. In the future, the number of solar panels will have to increase for carbon neutrality to be achieved; thus, surplus electricity is expected to always occur during daytime. In the equipment replacement case, CO2 emissions could be significantly reduced by replacing water heaters with high-efficiency heat-pump water heaters. Furthermore, the electrification of water heaters made it possible to boil water using surplus electricity during the day, further reducing CO2 emissions. If all hot water energy could be covered by surplus electricity generated by solar power during the day, there would be a reduction of 43.4 Mt-CO2, which exceeds the effect of energy-saving actions. Because solar radiation varies greatly depending on the weather, the extent to which hot-water heating energy can be covered by surplus electricity would depend on the amount of solar power generated in the future. Further information must be considered regarding the potential of solar power generation. Therefore, the discussion herein is based on a rough estimate. However, to achieve carbon neutrality, energy conservation measures must be considered to curb demand, and the application of this technology to energy management must be determined to adjust the supply and demand balance as renewable energy is introduced.
4.3. Limitations of This Study and Future Challenges
This study provides a basis for performing more realistic and detailed evaluations. To understand the relationship between reduction scenarios and the associated reductions in CO2 emissions, we set approximate scenarios that prioritized easy understanding rather than feasibility. The CO2 reduction effects associated with each measure were quantified, providing results that could serve as a reference for energy consumers and policymakers in their decision-making. These results can be incorporated into macro-integrated assessment models to map future regional scenarios. However, the results of this study did not necessarily indicate the actual CO2 reduction potential. In the future, in addition to using the results obtained in this study, measures considering factors such as consumer acceptability and cost and linking these to more realistic estimates of CO2 reduction effects should be obtained.
CO2 emissions from the residential sector are influenced by factors such as the insulation of buildings, surrounding thermal environment, performance of home appliances, and lifestyle of residents, most of which cannot be assessed using the Residential CO2 Emission Survey [67]. Given that numerous studies have explored these topics [31,55,78,79,80], in the future, we will combine existing information with the results of this study to assess feasible CO2 reduction measures.
5. Conclusions
Our study used individual household data from the Residential CO2 Emissions Survey [67] to evaluate CO2 emission reductions based on scenarios of implementing energy-saving behaviors and replacing energy-consuming equipment. As the calculation results are dependent on the scenario set, the numerical results cannot be generalized. Thus, we believe that we were able to approximately quantify the potential magnitude of CO2 emissions reduction by energy-saving measures in the residential sector based on the assumed scenarios. Previous research attempting to quantitatively evaluate the effectiveness of such measures has faced difficulties, such as evaluations based on simulations [30,31,32] being dependent on models and difficult to verify and evaluations based on social experiments [33,34] tending to have temporary effects, making it difficult to evaluate whether the effects will be sustained. Considering these points, the fact that this study quantified the effects of CO2 reduction using large-scale survey data is of great significance. In the future, we need to consider more realistic scenarios based on feasibility and discuss strategies for implementing these scenarios.
Although the calculated results of our study are based on an aggressive scenario to an extent assuming universal implementation of the measures by all households, in most cases, the emission reduction effects were limited to several percent of the residential sector CO2 emissions. Although there is no doubt that energy conservation efforts will continue to be necessary, there are limits to the contribution of energy conservation measures in achieving the goal of carbon neutrality by 2050. The situation has changed since the era of the Kyoto Protocol, which aimed for a 6% reduction in emissions compared with 1990. Thus, the deployment of renewable energy sources has become increasingly important in recent years. For the residential sector, future measures will require not only energy conservation to reduce total energy consumption but also an evaluation of the potential demand-side response by consumers and its effect on the supply and demand balance when large amounts of renewable energy are introduced. In particular, Japan is considered less suitable for wind power generation than European countries; therefore, the introduction of renewable energy relies on solar power generation. In this context, the business sector is relatively efficient because it consumes a lot of electricity during the day, but the residential sector consumes a lot of electricity at night. Therefore, if solar power generation is increased in the future in order to achieve carbon neutrality, energy management such as peak shifting will become important. A mix of measures will need to be evaluated, such as the use of surplus electricity from solar power generation for heat-pump water heaters, and the residential use of electric vehicle batteries charged by solar power generation.
Author Contributions
Conceptualization, Y.H.; data curation, Y.H., Y.Y. (Yukiko Yoshida), T.Y., S.M. and J.X.; formal analysis, Y.H.; funding acquisition, Y.H. and Y.Y. (Yoshiki Yamagata); investigation, S.M. and J.X.; methodology, Y.H. and S.M.; project administration, Y.H. and Y.Y. (Yoshiki Yamagata); resources, S.M. and J.X.; supervision, T.Y., S.M. and Y.Y. (Yoshiki Yamagata); validation, Y.H.; writing—original draft, Y.H.; writing—review and editing, Y.H. and Y.Y. (Yukiko Yoshida). All authors have read and agreed to the published version of the manuscript.
Funding
This work was supported by the Council for Science, Technology, and Innovation (CSTI), Cross-Ministerial Strategic Innovation Promotion Program (SIP), 3rd period of SIP “Smart energy management system” (grant number: JPJ012207; funding agency: JST), MEXT Program for Research and Development for Accelerating Local Climate Actions in Partnership of Universities (grant number: JPJ010039), and JSPS KAKENHI (grant number: JP23H01546).
Data Availability Statement
Restrictions apply to the availability of these data. Data were obtained from the MOE and are available from the MOE, Japan, with the permission of the MOE, Japan.
Acknowledgments
We thank Takuro Kobashi (Tohoku University) for helpful discussions and comments. We thank the MOE and the Institute for Global Environmental Strategies (IGES) for their cooperation in using the survey data.
Conflicts of Interest
Authors Suguru Mizutani and Ji Xuan were employed by the company Jyukankyo Research Institute Inc. Kioi-cho ARK Bldg. The remaining authors declare that the research was conducted in the absence of any commercial or financial relationships that could be construed as a potential conflict of interest.
References
- Capros, P.; Paroussos, L.; Fragkos, P.; Tsani, S.; Boitier, B.; Wagner, F.; Busch, S.; Resch, G.; Blesl, M.; Bollen, J. Description of models and scenarios used to assess European decarbonisation pathways. Energy Strategy Rev. 2014, 2, 220–230. [Google Scholar] [CrossRef]
- Zhou, N.; Fridley, D.; Khanna, N.; Ke, J.; McNeil, M.; Levine, M. China’s energy and emissions outlook to 2050: Perspectives from bottom-up energy end-use model. Energy Policy 2013, 53, 51–62. [Google Scholar] [CrossRef]
- Akbari, H.; Konopacki, S. Calculating energy-saving potentials of heat-island reduction strategies. Energy Policy 2005, 33, 721–756. [Google Scholar] [CrossRef]
- Touchaei, A.; Hosseini, M.; Akbari, H. Energy savings potentials of commercial buildings by urban heat island reduction strategies in Montreal (Canada). Energy Build. 2016, 110, 41–48. [Google Scholar] [CrossRef]
- Hirano, Y.; Fujita, T. An Estimation of Air-Conditioning Energy-Saving Effects Through Urban Thermal Mitigation. In Urban Heat Island (UHI) Mitigation: Hot and Humid Regions; Springer: Singapore, 2021; pp. 61–106. [Google Scholar] [CrossRef]
- Cao, X.; Dai, X.; Liu, J. Building energy-consumption status worldwide and the state-of-the-art technologies for zero-energy buildings during the past decade. Energy Build. 2016, 128, 198–213. [Google Scholar] [CrossRef]
- Sadineni, S.; Madala, S.; Boehm, R. Passive building energy savings: A review of building envelope components. Renew. Sustain. Energy Rev. 2011, 15, 3617–3631. [Google Scholar] [CrossRef]
- Belussi, L.; Barozzi, B.; Bellazzi, A.; Danza, L.; Devitofrancesco, A.; Fanciulli, C.; Ghellere, M.; Guazzi, G.; Meroni, I.; Salamone, F.; et al. A review of performance of zero energy buildings and energy efficiency solutions. J. Build. Eng. 2019, 25, 100772. [Google Scholar] [CrossRef]
- Lee, G.; Avelina, N.; Rim, D.; Chi, S.; Ahn, H. Systematic review of carbon-neutral building technologies (CNBTs) by climate groups and building types. J. Build. Eng. 2023, 78, 107627. [Google Scholar] [CrossRef]
- GhaffarianHoseini, A.; Dahlan, N.; Berardi, U.; GhaffarianHoseini, A.; Makaremi, N.; GhaffarianHoseini, M. Sustainable energy performances of green buildings: A review of current theories, implementations and challenges. Renew. Sustain. Energy Rev. 2013, 25, 1–17. [Google Scholar] [CrossRef]
- Zhu, W.; Zhang, J.; Dai, J.; Wang, D.; Ma, C.; Xu, Y.; Chen, Y. Study on the Spatiotemporal Evolution Characteristics and Influencing Factors on Green Building Development of City Clusters in the Yangtze River Delta Region in China. Sustainability 2023, 15, 9457. [Google Scholar] [CrossRef]
- Zhang, X.; Nketiah, E.; Shi, V.; Cheng, J. Who Will Save Energy? An Extension of Social Cognitive Theory with Place Attachment to Understand Residents’ Energy-Saving Behaviors. Sustainability 2024, 16, 213. [Google Scholar] [CrossRef]
- Zhang, Y.; Zhang, B.; Hou, J. Simulation Study on Student Residential Energy Use Behaviors: A Case Study of University Dormitories in Sichuan, China. Buildings 2024, 14, 1484. [Google Scholar] [CrossRef]
- Laugs, G.; Benders, R.; Moll, H. Maximizing self-sufficiency and minimizing grid interaction: Combining electric and molecular energy storage for decentralized balancing of variable renewable energy in local energy systems. Renew. Energy 2024, 229, 120703. [Google Scholar] [CrossRef]
- Chen, Q.; Kuang, Z.; Liu, X.; Zhang, T. Energy storage to solve the diurnal, weekly, and seasonal mismatch and achieve zero-carbon electricity consumption in buildings. Appl. Energy 2022, 312, 118744. [Google Scholar] [CrossRef]
- Deng, X.; Lv, T.; Hou, X.; Xu, J.; Pi, D.; Liu, F.; Li, N. Regional disparity of flexibility options for integrating variable renewable energy. Renew. Energy 2022, 192, 641–654. [Google Scholar] [CrossRef]
- Deguenon, L.; Yamegueu, D.; Kadri, S.; Gomna, A. Overcoming the challenges of integrating variable renewable energy to the grid: A comprehensive review of electrochemical battery storage systems. J. Power Sources 2023, 580, 233343. [Google Scholar] [CrossRef]
- Chung, K.; Ryu, J. Economic Value Assessment of Vehicle-to-Home (V2H) Operation under Various Environmental Conditions. Energies 2024, 17, 3828. [Google Scholar] [CrossRef]
- Jaradat, M.; Almashaileh, S.; Bendea, C.; Juaidi, A.; Bendea, G.; Bungau, T. Green Hydrogen in Focus: A Review of Production Technologies, Policy Impact, and Market Developments. Energies 2024, 17, 3992. [Google Scholar] [CrossRef]
- Sarker, A.; Azad, A.; Rasul, M.; Doppalapudi, A. Prospect of Green Hydrogen Generation from Hybrid Renewable Energy Sources: A Review. Energies 2023, 16, 1556. [Google Scholar] [CrossRef]
- Ju, Y.; Hiltunen, P.; Jokisalo, J.; Kosonen, R.; Syri, S. Benefits through Space Heating and Thermal Storage with Demand Response Control for a District-Heated Office Building. Buildings 2023, 13, 2670. [Google Scholar] [CrossRef]
- Gharbi, A.; Ayari, M.; Yahya, A. Demand-Response Control in Smart Grids. Appl. Sci. 2023, 13, 2355. [Google Scholar] [CrossRef]
- The Cabinet Secretariat of Japan. Local Decarbonization Roadmap. Available online: https://www.cas.go.jp/jp/seisaku/datsutanso/pdf/20210609_chiiki_roadmap.pdf (accessed on 20 January 2025). (In Japanese)
- Ministry of the Environment, Japan, 2050 Zero Carbon Cities in Japan. Available online: https://www.env.go.jp/en/earth/cc/2050_zero_carbon_cities_in_japan.html (accessed on 20 January 2025).
- Center for Global Environmental Research, National Institute for Environmental Studies, National Greenhouse Gas Inventory Document of JAPAN. 2024. Available online: https://cger.nies.go.jp/publications/report/i170/i170.pdf (accessed on 20 January 2025).
- Sawachi, T.; Bohgaki, K.; Yoshino, H.; Suzuki, K.; Akabayashi, S.; Inoue, T.; Ohno, H.; Matsubara, N.; Hayashi, T.; Morita, D. Energy consumption for different uses in dwelling and its estimation formulas: Study of energy consumption in residential buildings from the viewpoint of life style, on the basis of national scale surveys Part 1. J. Archit. Plan. (Trans. AIJ) 1994, 462, 41–48. (In Japanese) [Google Scholar] [CrossRef]
- Miura, S. Study on the Regional Characteristics of Energy Consumption and Its Uses of Housing All Over Japan. J. Archit. Plan. (Trans. AIJ) 1998, 63, 510. (In Japanese) [Google Scholar]
- Mizutani, S.; Inoue, T.; Oguma, T. Energy Consumption for Different Uses in Housing and Energy Usage: Analysis based on national scale questionnaire. J. Environ. Eng. (Trans. AIJ) 2006, 609, 117–124. (In Japanese) [Google Scholar] [CrossRef]
- Honjo, K.; Fujii, M. Impacts of demographic, meteorological, and economic changes on household CO2 emissions in the 47 prefectures of Japan. Reg. Sci. Policy Pract. 2014, 6, 13–30. [Google Scholar] [CrossRef]
- National Institute for Environmental Studies. “2050 Japan Low-Carbon Society” Scenario Team. Japan Scenarios and Actions Towards Low-Carbon Societies (LCSs). Available online: http://2050.nies.go.jp/report/file/lcs_japan/2050_LCS_Scenarios_Actions_English_080715.pdf (accessed on 20 January 2025).
- Taniguchi-Matsuoka, A.; Shimoda, Y.; Sugiyama, M.; Kurokawa, Y.; Matoba, H.; Yamasaki, T.; Morikuni, T.; Yamaguchi, Y. Evaluating Japan’s national greenhouse gas reduction policy using a bottom-up residential end-use energy simulation model. Appl. Energy 2020, 279, 115792. [Google Scholar] [CrossRef]
- Shimoda, Y.; Asahi, T.; Taniguchi, A.; Mizuno, M. Evaluation of city-scale impact of residential energy conservation measures using the detailed end-use simulation model. Energy 2007, 32, 1617–1633. [Google Scholar] [CrossRef]
- Otsuka, A.; Hirano, Y.; Nakamura, S.; Fujita, T.; Narumi, D. Longitudinal Evaluation of Energy-saving Effects and Their Implication Using Electricity Monitoring Data in Shinchi Town, Fukushima. Glob. Environ. Res. 2021, 24, 207–216. [Google Scholar]
- Ito, K.; Ida, T.; Tanaka, M. Moral Suasion and Economic Incentives: Field Experimental Evidence from Energy Demand. Am. Econ. J. Econ. Policy 2018, 10, 240–267. [Google Scholar] [CrossRef]
- Thogersen, J. Housing-related lifestyle and energy saving: A multi-level approach. Energy Policy 2017, 102, 73–87. [Google Scholar] [CrossRef]
- Poruschi, L.; Ambrey, C. On the confluence of city living, energy saving behaviours and direct residential energy consumption. Environ. Sci. Policy 2016, 66, 334–343. [Google Scholar] [CrossRef]
- Vogiatzi, C.; Gemenetzi, G.; Massou, L.; Poulopoulos, S.; Papaefthimiou, S.; Zervas, E. Energy use and saving in residential sector and occupant behavior: A case study in Athens. Energy Build. 2018, 181, 1–9. [Google Scholar] [CrossRef]
- Pavón-Tapia, M.A.; Carmona-Fernández, D.; Dimitrova-Angelova, D.; González-González, J.F. Data Analysis of the Situation of the Residential Sector in Extremadura and Its Energy Classification. Designs 2024, 8, 122. [Google Scholar] [CrossRef]
- Chung, Y.M.; Chung, B.J.; Kim, D.S. Electricity Bill Savings from Reduced Household Energy Consumption in Apartment Complexes. Energies 2024, 17, 5488. [Google Scholar] [CrossRef]
- Yologlu, A.C.; Halisdemir, B. Understanding the Social Determinants of Household Carbon Emissions for Carbon Mitigation Policies: The Case of Mersin, Turkey. Sustainability 2024, 16, 6012. [Google Scholar] [CrossRef]
- Bustamante, C.; Bird, S.; Legault, L.; Powers, S.E. Energy Hogs and Misers: Magnitude and Variability of Individuals’ Household Electricity Consumption. Sustainability 2023, 15, 4171. [Google Scholar] [CrossRef]
- Qu, J.; Liu, L.; Zeng, J.; Maraseni, T.N.; Zhang, Z. City-Level Determinants of Household CO2 Emissions per Person: An Empirical Study Based on a Large Survey in China. Land 2022, 11, 925. [Google Scholar] [CrossRef]
- Xie, Y.; Noor, A.I.M. Factors Affecting Residential End-Use Energy: Multiple Regression Analysis Based on Buildings, Households, Lifestyles, and Equipment. Buildings 2022, 12, 538. [Google Scholar] [CrossRef]
- Kumar, P.; Caggiano, H.; Shwom, R.; Felder, F.A.; Andrews, C.J. Saving from home! How income, efficiency, and curtailment behaviors shape energy consumption dynamics in US households? Energy 2023, 271, 126988. [Google Scholar] [CrossRef]
- Han, M.S.; Cudjoe, D. Determinants of energy-saving behavior of urban residents: Evidence from Myanmar. Energy Policy 2020, 140, 111405. [Google Scholar] [CrossRef]
- Bulbaai, R.R.; Halman, J.I.M. Energy Awareness, Energy Use, and Energy-Saving Opportunities in the Caribbean: The Island Curaçao as a Case Study. Energies 2024, 17, 4829. [Google Scholar] [CrossRef]
- Widera, B. Energy and Carbon Savings in European Households Resulting from Behavioral Changes. Energies 2024, 17, 3888. [Google Scholar] [CrossRef]
- Hirano, Y.; Ihara, T.; Yoshida, Y. Estimating Residential CO2 Emissions based on Daily Activities and Consideration of Methods to Reduce Emissions. Build. Environ. 2016, 103, 1–8. [Google Scholar] [CrossRef]
- Hirano, Y.; Ihara, T.; Togawa, T.; Gomi, K.; Okuoka, K.; Kobayashi, G. Investigation of Low-carbon Lifestyles Based on Direct/Indirect Residential CO2 Emissions. Environ. Sci. 2017, 30, 261–273. (In Japanese) [Google Scholar]
- Hirano, Y.; Ihara, T.; Hara, M.; Honjo, K. Estimation of Direct and Indirect Household CO2 Emissions in 49 Japanese Cities with Consideration of Regional Conditions. Sustainability 2020, 12, 4678. [Google Scholar] [CrossRef]
- Statistics Bureau of Japan, Family Income and Expenditure Survey. Available online: https://www.stat.go.jp/data/kakei/ (accessed on 20 January 2025).
- Statistics Bureau of Japan, National Survey of Family Income and Expenditure. Available online: https://www.stat.go.jp/data/zensho/2014/index.html (accessed on 20 January 2025).
- Iwafune, Y.; Ikegami, T.; Fonseca, J.G.S., Jr.; Oozeki, T.; Ogimoto, K. Cooperative home energy management using batteries for a photovoltaic system considering the diversity of households. Energy Convers. Manag. 2015, 96, 322–329. [Google Scholar] [CrossRef]
- Hayashi, Y. Japanese energy management in smart grid after the great East Japan earthquake. Electr. Eng. Jpn. 2014, 189, 20–25. [Google Scholar] [CrossRef]
- Koide, R.; Kojima, S.; Nansai, K.; Lettenmeier, M.; Asakawa, K.; Liu, C.; Murakami, S. Exploring carbon footprint reduction pathways through urban lifestyle changes: A practical approach applied to Japanese cities. Environ. Res. Lett. 2021, 16, 084001. [Google Scholar] [CrossRef]
- Koide, R.; Lettenmeier, M.; Kojima, S.; Toivio, V.; Amellina, A.; Akenji, L. Carbon Footprints and Consumer Lifestyles: An Analysis of Lifestyle Factors and Gap Analysis by Consumer Segment in Japan. Sustainability 2019, 11, 5983. [Google Scholar] [CrossRef]
- Kobashi, T.; Choi, Y.; Hirano, Y.; Yamagata, Y.; Say, K. Rapid rise of decarbonization potentials of photovoltaics plus electric vehicles in residential houses over commercial districts. Appl. Energy 2022, 306, 118142. [Google Scholar] [CrossRef]
- Kataoka, R.; Ogimoto, K.; Iwafune, Y. Marginal Value of Vehicle-to-Grid Ancillary Service in a Power System with Variable Renewable Energy Penetration and Grid Side Flexibility. Energies 2021, 14, 7577. [Google Scholar] [CrossRef]
- Ministry of the Environment, Japan, Kyoto Protocol Target Achievement Plan. Available online: https://www.env.go.jp/content/900447426.pdf (accessed on 20 January 2025). (In Japanese)
- United Nations 2015, Paris Agreement. Available online: https://unfccc.int/sites/default/files/english_paris_agreement.pdf (accessed on 20 January 2025).
- Silva, D.; Ashina, S. Characterization of the proximity to urban areas of the global energy potential of solar and wind energies. Environ. Res. Commun. 2023, 5, 071001. [Google Scholar] [CrossRef]
- Onodera, H.; Delage, R.; Nakata, T. The role of regional renewable energy integration in electricity decarbonization—A case study of Japan. Appl. Energy 2024, 363, 123118. [Google Scholar] [CrossRef]
- Chen, Y.; Xu, P.; Gu, J.; Schmidt, F.; Li, W. Measures to improve energy demand flexibility in buildings for demand response (DR): A review. Energy Build. 2018, 177, 125–139. [Google Scholar] [CrossRef]
- Kim, H.; Choi, H.; Kang, H.; An, J.; Yeom, S.; Hong, T. A systematic review of the smart energy conservation system: From smart homes to sustainable smart cities. Renew. Sustain. Energy Rev. 2021, 140, 110755. [Google Scholar] [CrossRef]
- Li, H.; Wang, Z.; Hong, T.; Piette, M.A. Energy flexibility of residential buildings: A systematic review of characterization and quantification methods and applications. Adv. Appl. Energy 2021, 3, 100054. [Google Scholar] [CrossRef]
- Zou, J.; Liu, S.; Ouyang, L.; Ruan, J.; Tang, S. Carbon-Aware Demand Response for Residential Smart Buildings. Electronics 2024, 13, 4941. [Google Scholar] [CrossRef]
- Ministry of the Environment. Survey on the Actual Conditions of Carbon Dioxide Emissions from Residential Sector. Available online: https://www.env.go.jp/earth/ondanka/ghg/kateiCO2tokei.html (accessed on 20 January 2025).
- Dincă, V.M.; Busu, M.; Nagy-Bege, Z. Determinants with Impact on Romanian Consumers’ Energy-Saving Habits. Energies 2022, 15, 4080. [Google Scholar] [CrossRef]
- Belaïd, F.; Joumni, H. Behavioral attitudes towards energy saving: Empirical evidence from France. Energy Policy 2020, 140, 111406. [Google Scholar] [CrossRef]
- Pothitou, M.; Hanna, R.F.; Chalvatzis, K.J. Environmental knowledge, pro-environmental behaviour and energy savings in households: An empirical study. Applied Energy 2016, 184, 1217–1229. [Google Scholar] [CrossRef]
- Ma, Y.; Liu, C. Configuration analysis of influencing factors of energy-saving behaviors: From the perspective of consumers’ pro-environmental characteristics and environmentally friendly social atmosphere. Energy 2023, 278 Pt A, 127906. [Google Scholar] [CrossRef]
- Intage, Jyukankyo Research Institute, Report on the Commissioned Task of Detailed Understanding of Carbon Dioxide Emissions in the Residential Sector. 2016. Available online: https://www.env.go.jp/content/900447026.pdf (accessed on 20 January 2025). (In Japanese)
- Intage, Jyukankyo Research Institute, Report on the Commissioned Survey of the Actual Status of CO2 Emissions in the Residential Sector. 2020. Available online: https://www.env.go.jp/content/900446988.pdf (accessed on 20 January 2025).
- Ministry of Land, Infrastructure, Transport and Tourism (MLIT), National Institute for Land and Infrastructure Management, Relevant Materials for 2016 Building Energy Efficiency Standard, Manual for Model Building Method Input Assistant Tool. Available online: https://www.kenken.go.jp/becc/documents/building/Manual/modelv3_manual_20211014.pdf (accessed on 20 January 2025).
- Japan Meteorological Agency. Available online: http://www.jma.go.jp/jma/indexe.html (accessed on 20 January 2025).
- Hirano, Y.; Gomi, K.; Nakamura, S.; Yoshida, Y.; Narumi, D.; Fujita, T. Analysis of the impact of regional temperature pattern on the energy consumption in the commercial sector in Japan. Energy Build. 2017, 149, 160–170. [Google Scholar] [CrossRef]
- Agency for Natural Resources and Energy. Energy-Saving Performance Catalog. Available online: https://seihinjyoho.go.jp/frontguide/catdl.html (accessed on 20 January 2025).
- Hasegawa, K.; Yoshino, H.; Matsumoto, S. Energy consumption of well-insulated and airtight houses in Tohoku District: From the viewpoint of energy consumption for space heating. J. Archit. Plan. (Trans. AIJ) 2002, 557, 49–56. (In Japanese) [Google Scholar] [CrossRef] [PubMed]
- Hirano, Y.; Fujita, T. Simulating the CO2 reduction caused by decreasing the air conditioning load in an urban area. Energy Build. 2016, 114, 87–95. [Google Scholar] [CrossRef]
- Shimoda, Y.; Sugiyama, M.; Nishimoto, R.; Momonoki, T. Evaluating decarbonization scenarios and energy management requirement for the residential sector in Japan through bottom-up simulations of energy end-use demand in 2050. Appl. Energy 2021, 303, 11751. [Google Scholar] [CrossRef]
Disclaimer/Publisher’s Note: The statements, opinions and data contained in all publications are solely those of the individual author(s) and contributor(s) and not of MDPI and/or the editor(s). MDPI and/or the editor(s) disclaim responsibility for any injury to people or property resulting from any ideas, methods, instructions or products referred to in the content. |
© 2025 by the authors. Licensee MDPI, Basel, Switzerland. This article is an open access article distributed under the terms and conditions of the Creative Commons Attribution (CC BY) license (https://creativecommons.org/licenses/by/4.0/).