Article

Spatial–Temporal Evolution Patterns and Drivers of Embodied Energy Transfer Along with Industrial Transfer in China: From a Regional–Sectoral Perspective

1
Business School, Hohai University, Changzhou 213022, China
2
Department of Economics, Soochow University, 56, Kueiyang St., Sec. 1, Taipei 10048, Taiwan
*
Author to whom correspondence should be addressed.
Energies 2025, 18(8), 1965; https://doi.org/10.3390/en18081965
Submission received: 15 February 2025 / Revised: 4 April 2025 / Accepted: 9 April 2025 / Published: 11 April 2025
(This article belongs to the Section B: Energy and Environment)

Abstract

:
China, as the world’s largest energy consumer, is currently facing energy and environmental challenges. Research on embodied energy transfer along with industrial transfer is vital to achieving “dual control of energy”. Considering regional heterogeneity, this research employs the multi-regional input–output model to analyze the spatial–temporal evolution patterns of embodied energy transfer in 2012, 2015, and 2017. Furthermore, structural decomposition analysis is used to determine the key factors affecting embodied energy transfer. The results show that (1) Total embodied energy use increased from 5.14 × 10⁹ tce to 6.00 × 109 tce by 2017, at an average per annum growth of 3.36%. The middle Yellow River comprehensive zone consumed the most embodied energy. The embodied energy growth rate in the northeast zone declined. (2) The overall trend of spatial–temporal evolution patterns of net embodied energy transfer in conjunction with industrial transfer was similar, with a clear “southward” trend. Embodied energy transfer was influenced by factors other than industrial transfer. (3) The vital factors affecting the embodied energy transfer were final consumption and investment, particularly pronounced in the middle Yellow River comprehensive zone with 2.72 × 10⁸ tce. Energy intensity and production structure effects in the sectors of Manufacturing and Electricity, hot water, gas, and water production and supply had a significant inhibitory impact. This research provides a reference for implementing regional differentiated energy control.

1. Introduction

Energy is a vital environmental factor that influences social and economic development. Both industries and households require energy to support production, daily life, and transportation [1], and energy demand is also on the rise [2]. The United Nations has also emphasized the significance of affordable clean energy by incorporating it into its global sustainable development goals. Nevertheless, climate warming, environmental degradation, and primary energy shortage pose challenges to low-carbon sustainable development for the survival of mankind, which has exacerbated the local energy crisis.
As the biggest energy consumer [3], China is experiencing tremendous pressure due to energy shortages and environmental problems. Consequently, China has implemented policies to encourage energy transformation and clean energy development to alleviate the energy crisis and realize “dual control of energy”. Data from the China National Energy Administration show that the proportion of clean energy consumption has reached 26.4% in 2023, 10.9% higher than that in 2013, while the proportion of coal consumption decreased by 12.1%. The power generation of clean energy is about 3.8 trillion kWh, accounting for 39.7% of the total power generation, which has increased by about 15% since 2013, indicating a continuous enhancement in China’s “green” energy content. The 14th Five-Year Plan (2021–2025) explicitly advocates for accelerating the deployment of clean energy, highlighting the key role of optimizing resource allocation across areas. Although the goal of “dual control of energy” is being realized, energy shortages and environmental problems persist due to the inadequate utilization of renewable energy, high energy consumption, and regional differences.
With the intensification of competition in the international product market and the escalation of Sino–US relations, the pace of industrial transfer and transformation is accelerating. The emergence of the fourth wave of global industrial transfer and the change in its main frontiers have quietly led to a shift in China’s stance on industrial transfer. China has launched a new “dual-cycle” development pattern to facilitate high-quality development. The new development pattern aims to expand the scale of inland employment and the consumer market through industrial adjustment and transfer from a spatial perspective of sustainable economic development. This approach creates ample economic opportunities for the domestic and international “dual cycle”, subsequently facilitating the coordinated development of the regional economy [4]. In the 13th Five-Year Plan (2016–2020), China has allocated the “dual control of energy” targets to various regions and provinces, indicating the importance of fair and just solutions to environmental problems [5]. However, domestic and international trade involves significant energy consumption, leading to an imbalance of environmental pressure between regions and increased challenges in finding fair and effective solutions to environmental problems [1].
Both industrial transfer and embodied energy transfer play significant roles in the economic cycle [6]. The theories of industrial structure adjustment, comparative advantage, the Environmental Kuznets Curve, and the ecological footprint provide a theoretical basis for studying the relationship between industrial transfer and embodied energy transfer. Take the analysis of the ecological footprint theory as an example, the size of a region’s ecological footprint is closely related to industrial production activities [7]. As an important aspect of the industrial production process, the flow of embodied energy will also be influenced by the ecological footprint. In order to reduce its own ecological footprint, a region may transfer out industries with high energy consumption and high ecological footprints, thus leading to the outflow of embodied energy. In the regions where industrial transfer is taking place, their ecological footprints will increase with the development of the industries, and the embodied energy will flow in correspondingly. Industrial transfer, particularly in high-energy-consuming industries, significantly affects embodied energy transfer. Energy-intensive industries transfer can fundamentally reduce the energy consumption of local producers, stimulate the growth of low-energy-consuming industries, and subsequently influence the regional energy flow pattern. Additionally, the transfer of upstream and downstream industries facilitates adjustments in the local industrial production structure, subsequently impacting local energy efficiency and consumption. However, it may also result in the “pollution shelter” phenomenon and “carbon leakage” effect, thus posing a threat to the local ecosystem [4].
Therefore, it is worthing to accurately quantify the net embodied energy transfer, clarify the scale and paths of embodied energy transfer along with industrial transfer, and identify the drivers of embodied energy transfer. These actions can not only effectively promote regional coordinated development, narrow the economic gap and alleviate the energy crisis, but also advance the “energy dual control” and “double-cycle” strategy. In addition, analyzing the spatial–temporal evolution patterns from the regional–sectoral level can more accurately identify the environmental responsibilities of various regions, and help to formulate more effective and fair energy-saving schemes. So, this research not only draws attention to the mismatch and imbalance between regional industry and energy development but also promotes energy reform.
This research’s main contributions are as follows: (1) Investigating the relationship and impact mechanisms between industrial transfer and embodied energy transfer by using MRIO. The existing literature predominantly studied single topics such as virtual water, energy, carbon emissions, or multi-topics like industry and carbon emissions, virtual water–energy–food [1,8,9]. There were few studies on the dual connections of industry trade and embodied energy. (2) Comparing the long-term dynamic spatial–temporal evolution paths of embodied energy transfer along with industrial transfer. Previous research mainly concentrated on carbon emissions, embodied energy transfer paths, or the industrial energy intensity [5,10], while ignoring comparing the relationships and differences between their transfer paths from a spatial–temporal heterogeneity perspective. (3) Profoundly revealing the factors affecting embodied energy transfer at regional–sectoral levels. Previous studies utilizing MRIO and SDA for dynamic analysis of virtual water, carbon emissions, or embodied energy mostly focused on analyzing at either the provincial level or a single sectoral level [1,8,11]. The analysis in this paper can provide detailed references for differentiated policies.

2. Literature Review

As the inevitable result of the economy, industrial transfer means the re-selection of industrial locations resulting from changes in the industrial competitive advantage among regions within a certain period, which leads to the industrial structure being restructured in space [12]. The early research on industrial transfer mainly focused on the theory, motivation, methods, and effects of industrial transfer. The most representative industrial transfer models are the flying geese model, product life cycle theory, and gradient transfer theory. These models analyze the motivation and mode of international industrial transfer from the macro-abstract point of view. In quantitative measurement, the commonly used methods are input–output analysis (IOA), index analysis, deviation-share method, and variable substitution method. Among them, IOA is a common approach to exploring China’s inter-regional industrial transfer and resource flow, including spatial path and scale [13]. The primary quantitative approaches mainly assessed the extent of industrial transfer rather than the exact scale of interregional movement. For instance, industrial transfer between provinces was often seen as the output from one driven by final demand in another during a specific period [5]. Thus, IOA has become the most common method for measuring this phenomenon [9]. This method allows for a detailed analysis of the spatial routes and magnitudes of industrial transfer, significantly enhancing the accuracy of the findings [12].
As the world pays more and more attention to environmental problems, the environmental impacts of industrial transfer are deeply concerned in recent studies [2], particularly the effects of industrial transfer and environmental pollution leakage. For one thing, industrial transfer has been associated with pollutant leakage [14] and a rise in total energy consumption [15,16]. For another, some scholars have found that industrial transfer can promote economic growth [15,17,18], affecting the amount of energy use or reducing energy intensity [5,19]. The transfer and adjustment of regional industries stimulated industrial production in the transferred regions and increased energy usage [20,21]. Moreover, research on industrial transfer and its influence on environmental pollution in China has mainly focused on the urban agglomeration [5], the Pearl River Delta [22], and the eastern, middle, and western regions [8]. The embodied energy consumption along with industrial transfer was also measured [12]. Some have studied the links between economic growth and resource conservation, such as industrial energy intensity [23], carbon emissions and flow, and the spatial transfer paths of China’s industry and carbon transfer [9,24]. It showed that the two paths were not completely consistent, and industrial transfer was not the sole factor influencing carbon transfer.
Embodied energy is the total amount of primary energy inputs needed to produce products in the economy [2]. Energy flow analysis, IOA, and life cycle assessment have further promoted the development of embodied energy research. In contrast, the accounting method based on IOA has obvious advantages. IOA is further subdivided into the single-regional input–output model and the multi-regional input–output (MRIO) model. Current literature on embodied energy sources also mainly relies on MRIO. At the global level, it mainly studied the global industrial chain, value chain [25], supply chain [26], primary energy, coal consumption [27], etc. At the national level, it mainly studied Sino–US trade, energy use, and flow in the Belt and Road [10], Australia [28], and BRICS countries [29]. At the regional level, embodied energy consumption and flow are mostly concentrated in urban regions, the Yangtze River Delta, Pearl River Delta, and Jing-Jin-Ji [30], Shanxi [31], and so on. Additionally, many scholars have studied energy–virtual water [32], the virtual water–energy–food nexus [33,34], and the drivers that affect the change in energy–virtual water flow in domestic and foreign trade [1]. These provided valuable references for the connection between the environment and energy conservation.
Structural decomposition analysis (SDA) is a classic method to analyze the driving factors of embodied energy. Based on input–output analysis, the observed changes of physical variables (such as embodied energy) with time are decomposed into the changes in their physical and economic determinants, such as the changes in energy intensity, production structure, and final demand structure, so as to quantify the influence of these factors on the changes in embodied energy transfer. A comprehensive understanding of energy environmental problems can be obtained by combining the MRIO model with SDA [35]. Through decomposition, many scholars have concluded that final demand is the biggest influencing factor of energy use [1,36]. However, reducing energy consumption hinges on changes in energy intensity and production structure [8]. The intensity effect of carbon emissions is the key driving factor to reduce emissions and pollution [37]. Among these studies, many of them also discussed in-depth research on energy from the specific categories of the final demand side: household life consumption [38,39], investment [40], and export [41].
The related research has made great achievements, but there are still some research gaps. (1) Previous studies mainly paid attention to the single theme of industrial trade or embodied energy utilization, and there were few studies on the links and influence between the closely related embodied energy transfer along with industrial transfer. (2) Driven by the new development model of the “double cycle”, China’s industrial system has changed, which will affect the regional embodied energy consumption and spatial–temporal evolution patterns. Previous studies mainly focused on exploring regional or provincial embodied energy transfer paths, without comparing embodied energy transfer along with industrial transfer paths by considering spatial–temporal heterogeneity. (3) Due to the complexity of MRIO data, the multi-topics relationships between economy and resources, such as industrial trade and embodied energy, virtual water–carbon emissions, are mostly focused on one of the inter-provincial level, regional level, or sectoral level. The analysis of multi-topics from the provincial–sectoral level is less. Moreover, from the perspective of the fair and reasonable division of energy control and responsibility saving, the spatial–temporal evolution paths of industrial transfer and embodied energy transfer in the dynamic period of China are worth studying.

3. Methodology and Data

This research uses MRIO and the SDA to conduct a detailed exploration of the evolution patterns and major drivers of embodied energy transfer along with industrial transfer. The overall research framework is displayed in Figure 1. Firstly, incorporate the factor of energy intensity to construct the embodied energy input–output table, and use the MRIO model to measure the total amount of embodied energy transfer accompanying industrial transfer and conduct scale analysis, mainly from analyzing the regional and sectoral levels. Secondly, analyze the spatial–temporal evolution path of the embodied energy transfer accompanying industrial transfer at the regional level, and analyze and compare the consistency of the spatial–temporal paths between industrial transfer and embodied energy transfer. Thirdly, use the SDA to further decompose ∆Y, ∆L, and ∆E, conduct a detailed analysis of the factors influencing the embodied energy transfer, and clarify the importance degree of each factor.

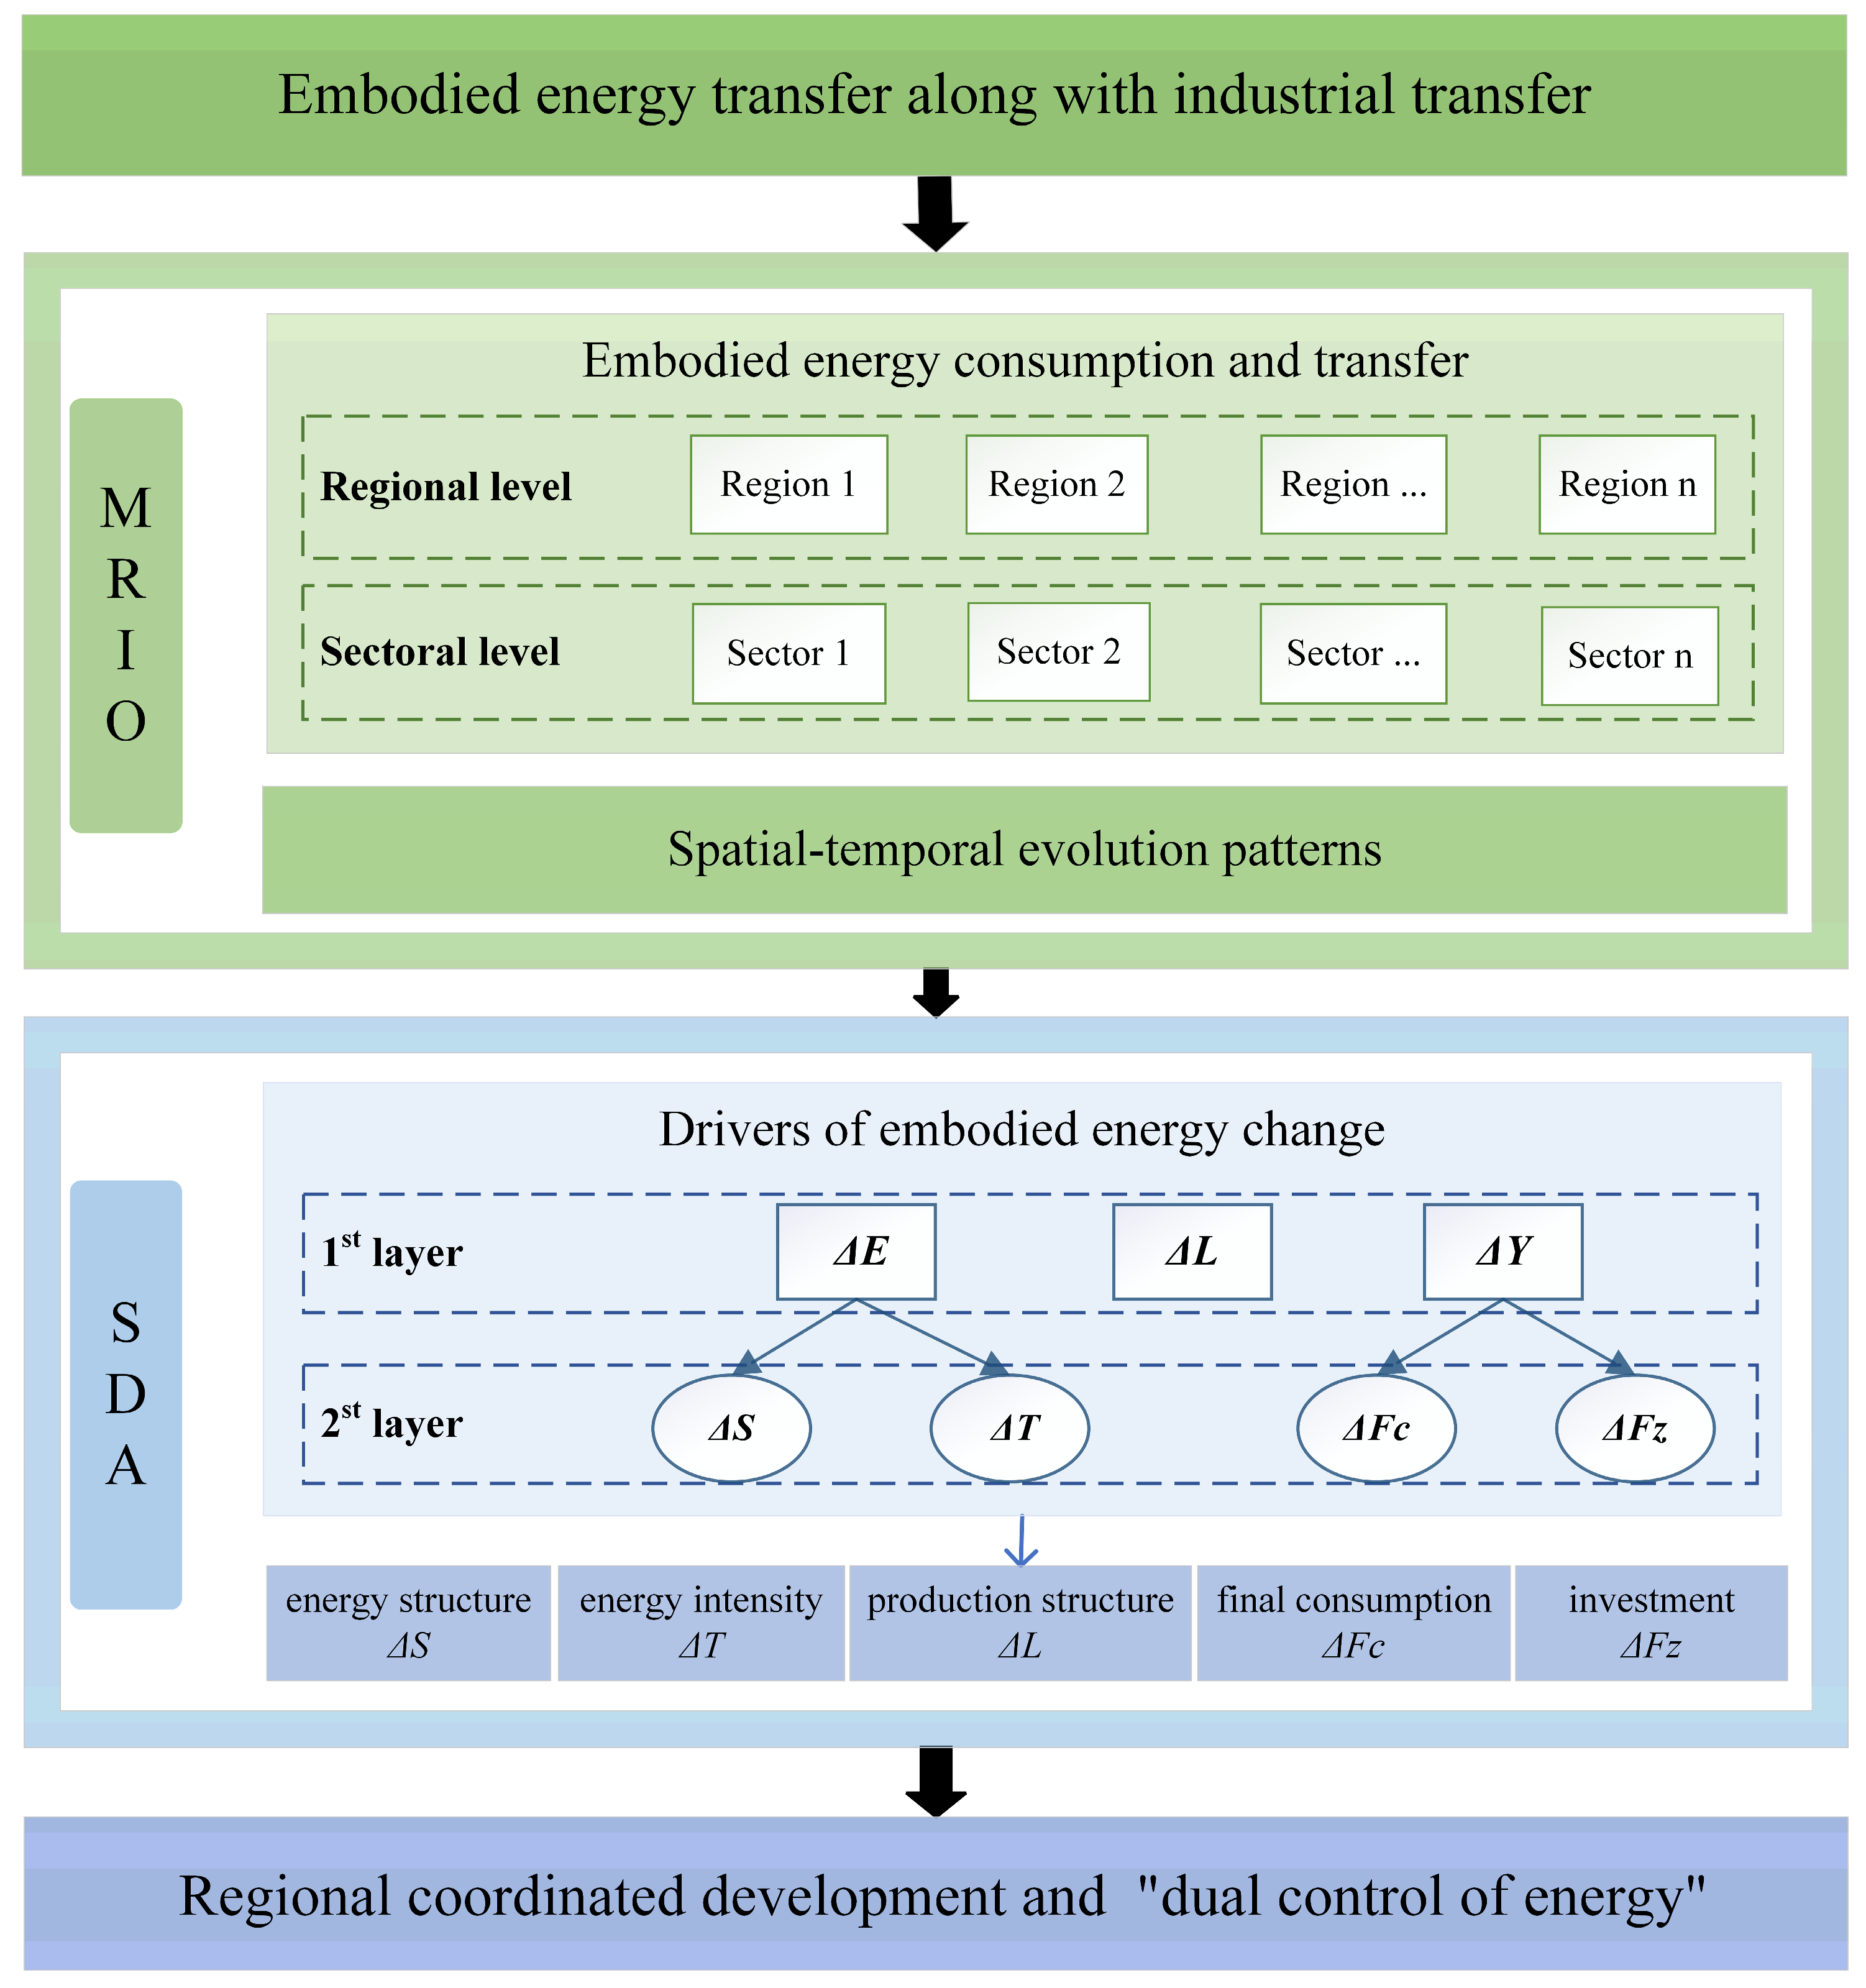
3.1. The MRIO Method

The MRIO model is a classical mathematical method used to quantify the environmental interaction that is caused by regional differences [42]. The MRIO model can thoroughly explore and discuss the quantitative dependency of input–output in economic activities based on a multi-regional view [8]. It effectively links regional production, cross-regional inter-departmental mobility, and final demand. In recent years, the MRIO model has become an effective tool for analyzing the utilization of embodied energy and environmental impact [43]. Therefore, we apply MRIO to explore the embodied energy transfer along with industrial transfer in 2012, 2015, and 2017, respectively.
Assume that there are m regions, and one region involves n sectors. The MRIO model is expressed as Equation (1):
X i r = s j x i j r s + s Y i r s
where Xir, xijrs, and Yjrs are the total output, intermediate use, and final consumption matrixes of sector i in region r, respectively.
The standard matrix form of MRIO is as follows:
X = A X + Y = ( I A ) 1 Y = L Y
where X is the total output matrix of a region, representing the industrial total output in this paper. Y is the final demand matrix, A X represents the intermediate input of all departments, and (I − A)−1 is the Leontief inverse matrix.
Industrial total output is the total value of goods and services produced by the industry during the accounting period [12,13]. Based on the principle of input–output balance, industrial consumption is the total value of goods and services consumed by industrial production. The industrial total output includes both the newly added value in the accounting period and the transfer value of intermediate inputs, which reflects the total scale of production activities in different economic industrial sectors [9]. According to [5], industrial transfer can be defined as one’s final demand leading to the output of other regions. The MRIO model is also used to measure industrial transfer.
Firstly, assuming there are regions r and s, total output X is expressed as Equation (3):
X r r X r s X s r X s s = I A r r A r s A s r I A s s 1 Y r r Y r s Y s r Y s s
where Xrs represents the change in the total output of region r caused by the final demand of region s, and so does Xsr.
According to [44,45], the net transfer of industry transfer is expressed as:
X i n = r s n X s r   or   X o u t = r s n X r s
X n e t = X i n X o u t
where Xin means industry transfer from region s to region r, Xout represents industry transfer from region r to region s, and Xnet refers to the net transfers between them. If Xnet > 0, it shows that region r is the industrial net transfer-in place, attracting industrial agglomeration. If Xnet < 0, vice versa.
Calculating the direct energy consumption coefficient is a necessary step before measuring embodied energy transfer, it is calculated as:
e i r = w i r / x i r
E = d i a g ( e ) = e 1 0 e i 0 e n
where E is the direct energy intensity matrix; eir, wir, and xir represent the direct energy intensity, energy consumption, and total output of sector i in region r, respectively.
According to the input–output theory, the embodied energy matrix is expressed as Equation (8):
W = E ( I A ) 1 Y = E L Y
where W means embodied energy transfer matrix; E, L, and Y represent the embodied energy consumption coefficient vector, Leontief inverse matrix, and final demand matrix, respectively.
Similarly, the net transfer value can indicate the direction of embodied energy transfer along with industrial transfer. The net transfer of embodied energy transfer is expressed as:
W i n = r s n W s r   or   W o u t = r s n W r s
W net = W i n W o u t
where Win represents embodied energy transfer from region s to region r, and Wout is embodied energy transfer from region r to region s. Wnet refers to the net transfers between region s to region r. Thus, if Wnet > 0, it shows that region r consumes more energy. If Wnet < 0, vice versa.

3.2. The SDA Method

SDA is an integrated approach based on the input–output framework, which is popular in the research of embodied energy use due to various economic elements. The SDA is based on input–output analysis, and mathematical methods are used to decompose the changes in embodied energy into the changes in multiple factors. These factors usually include energy intensity, production structure, final demand structure, and so on. Then, by comparing the changes of each factor in the input–output tables at different times, the contribution degree of each factor to the changes in embodied energy can be quantified. Some scholars found that the mean value of bipolar structure decomposition forms can be similar to all n! decompositions. Therefore, we apply bipolar structure decomposition to explore key driving factors [44], to make the effects of various driving factors as clear as possible and analyze the drivers into two stages [46].
According to the SDA method, the effect of embodied energy change (ΔW) in two different periods can be expressed as:
Δ W = 1 2 ( Δ E L 0 Y 0 + Δ E L t Y t ) Δ E + 1 2 ( E t Δ L Y 0 + E 0 Δ L Y t ) Δ L + 1 2 ( E t L t Δ Y + E 0 L 0 Δ Y ) Δ Y
Δ is the change from period 0 to t. ∆Y is the final demand effect, ∆L represents the production structure effect, and ∆E is the total energy intensity effect.
The final demand can be divided into final consumption (Fc) and investment (Fz), and the specific expression, as in Equation (12):
Δ Y = Δ F c + Δ F z
And the total energy intensity can be further divided into energy structure and energy intensity coefficient effect as follows:
Δ E = S t T t S 0 T 0 = 1 2 ( Δ S T t + Δ S T 0 ) + 1 2 ( S t Δ T + S 0 Δ T )
where S is the energy structure matrix; T is the energy intensity effect matrix, m; and n is the number of energy categories and sectors.
Next, by bringing Equations (12) and (13) into Equation (11), the SDA model can be obtained to decompose the drivers that affect the embodied energy in 2012–2015 and 2015–2017, as shown in the Equation (14):
Δ W = 1 4 Δ S ( T t + T 0 ) ( L t F c t + L t F z t + L 0 F c 0 + L 0 F z 0 ) Δ S + 1 4 Δ T ( S t + S 0 ) ( L t F c t + L t F z t + L 0 F c 0 + L 0 F z 0 ) Δ T + 1 2 Δ L ( S 0 T 0 F c t + S 0 T 0 F z t + S t T t F c 0 + S t T t F z 0 ) Δ L + 1 2 Δ F c ( S 0 T 0 L 0 + S t T t L t ) Δ F c + 1 2 Δ F z ( S 0 T 0 L 0 + S t T t L t ) Δ F z
Through the SDA method, the drivers of embodied energy are finally divided into energy structure effect (∆S), energy intensity coefficient effect (∆T), production structure effect (∆L), final consumption effect (∆Fc), and investment effect (∆Fz).

3.3. Data Sources

The MRIO tables (https://www.ceads.net.cn/data/input_output_tables/, accessed on 4 October 2023) of 2012, 2015, and 2017 are acquired from China Emission Account and Datasets (CEADs), including 42 departments and 30 provinces (excluding Tibet, Hong Kong, Macao, and Taiwan). The basic unit of the China MRIO table is monetary value (i.e., RMB), which is the basis and direct data source of industrial transfer calculation. The regional and sectoral energy consumption of 30 provinces in 2012–2017 came from the Province Energy Inventory of CEADs (https://www.ceads.net.cn/data/province/energy_inventory/, accessed on 4 October 2023). The data of the sub-regional energy balance table come from the China Energy Statistics Yearbook. The combination of MRIO data and energy consumption data in the production process can be converted into a specific energy input–output table measured in tons of standard coal equivalent (i.e., tce). Since the sector classification of MRIO tables is not completely the same as that of the energy lists, there is uncertainty in data matching. So, we combined 42 departments in the MRIO tables into 30 departments to match the energy lists based on the official sector classification standard and minimized the uncertainty of the data. Additionally, for the convenience of result analysis display, we further merged 30 departments into 7 sectors, referring to authoritative literature [1], as shown in Table 1.
Referring to the Report on Strategies and Policies for Coordinated Regional Development of the State Council Development Research Center, 30 provinces are differentiated into 8 major economic regions to facilitate the display of spatial mobility, as shown in Table 2. Specifically, there are the following main reasons for studying energy transfer at the level of China’s eight major regions: (1) the division of the eight major economic regions takes into account various factors such as geography, economic development levels, and industrial structures. It enables us to grasp the characteristics and laws of energy transfer in different regions from a more macroscopic perspective and reflects the commonalities of energy transfer in regions with similar economic structures and development models. (2) Conducting research with economic regions as the unit is more conducive to formulating targeted and regional energy policies and development strategies. It promotes energy cooperation and coordinates development among provinces within the region, reduces energy competition and conflicts within the region, and realizes the optimal allocation of energy resources on a larger scale. (3) Studying the eight major economic regions can effectively reduce the number of research objects, lower the complexity of data collection, collation, and analysis, and improve research efficiency. At the same time, it can also highlight the key points and more clearly demonstrate the main trends and key issues of energy transfer.

4. Results Analysis

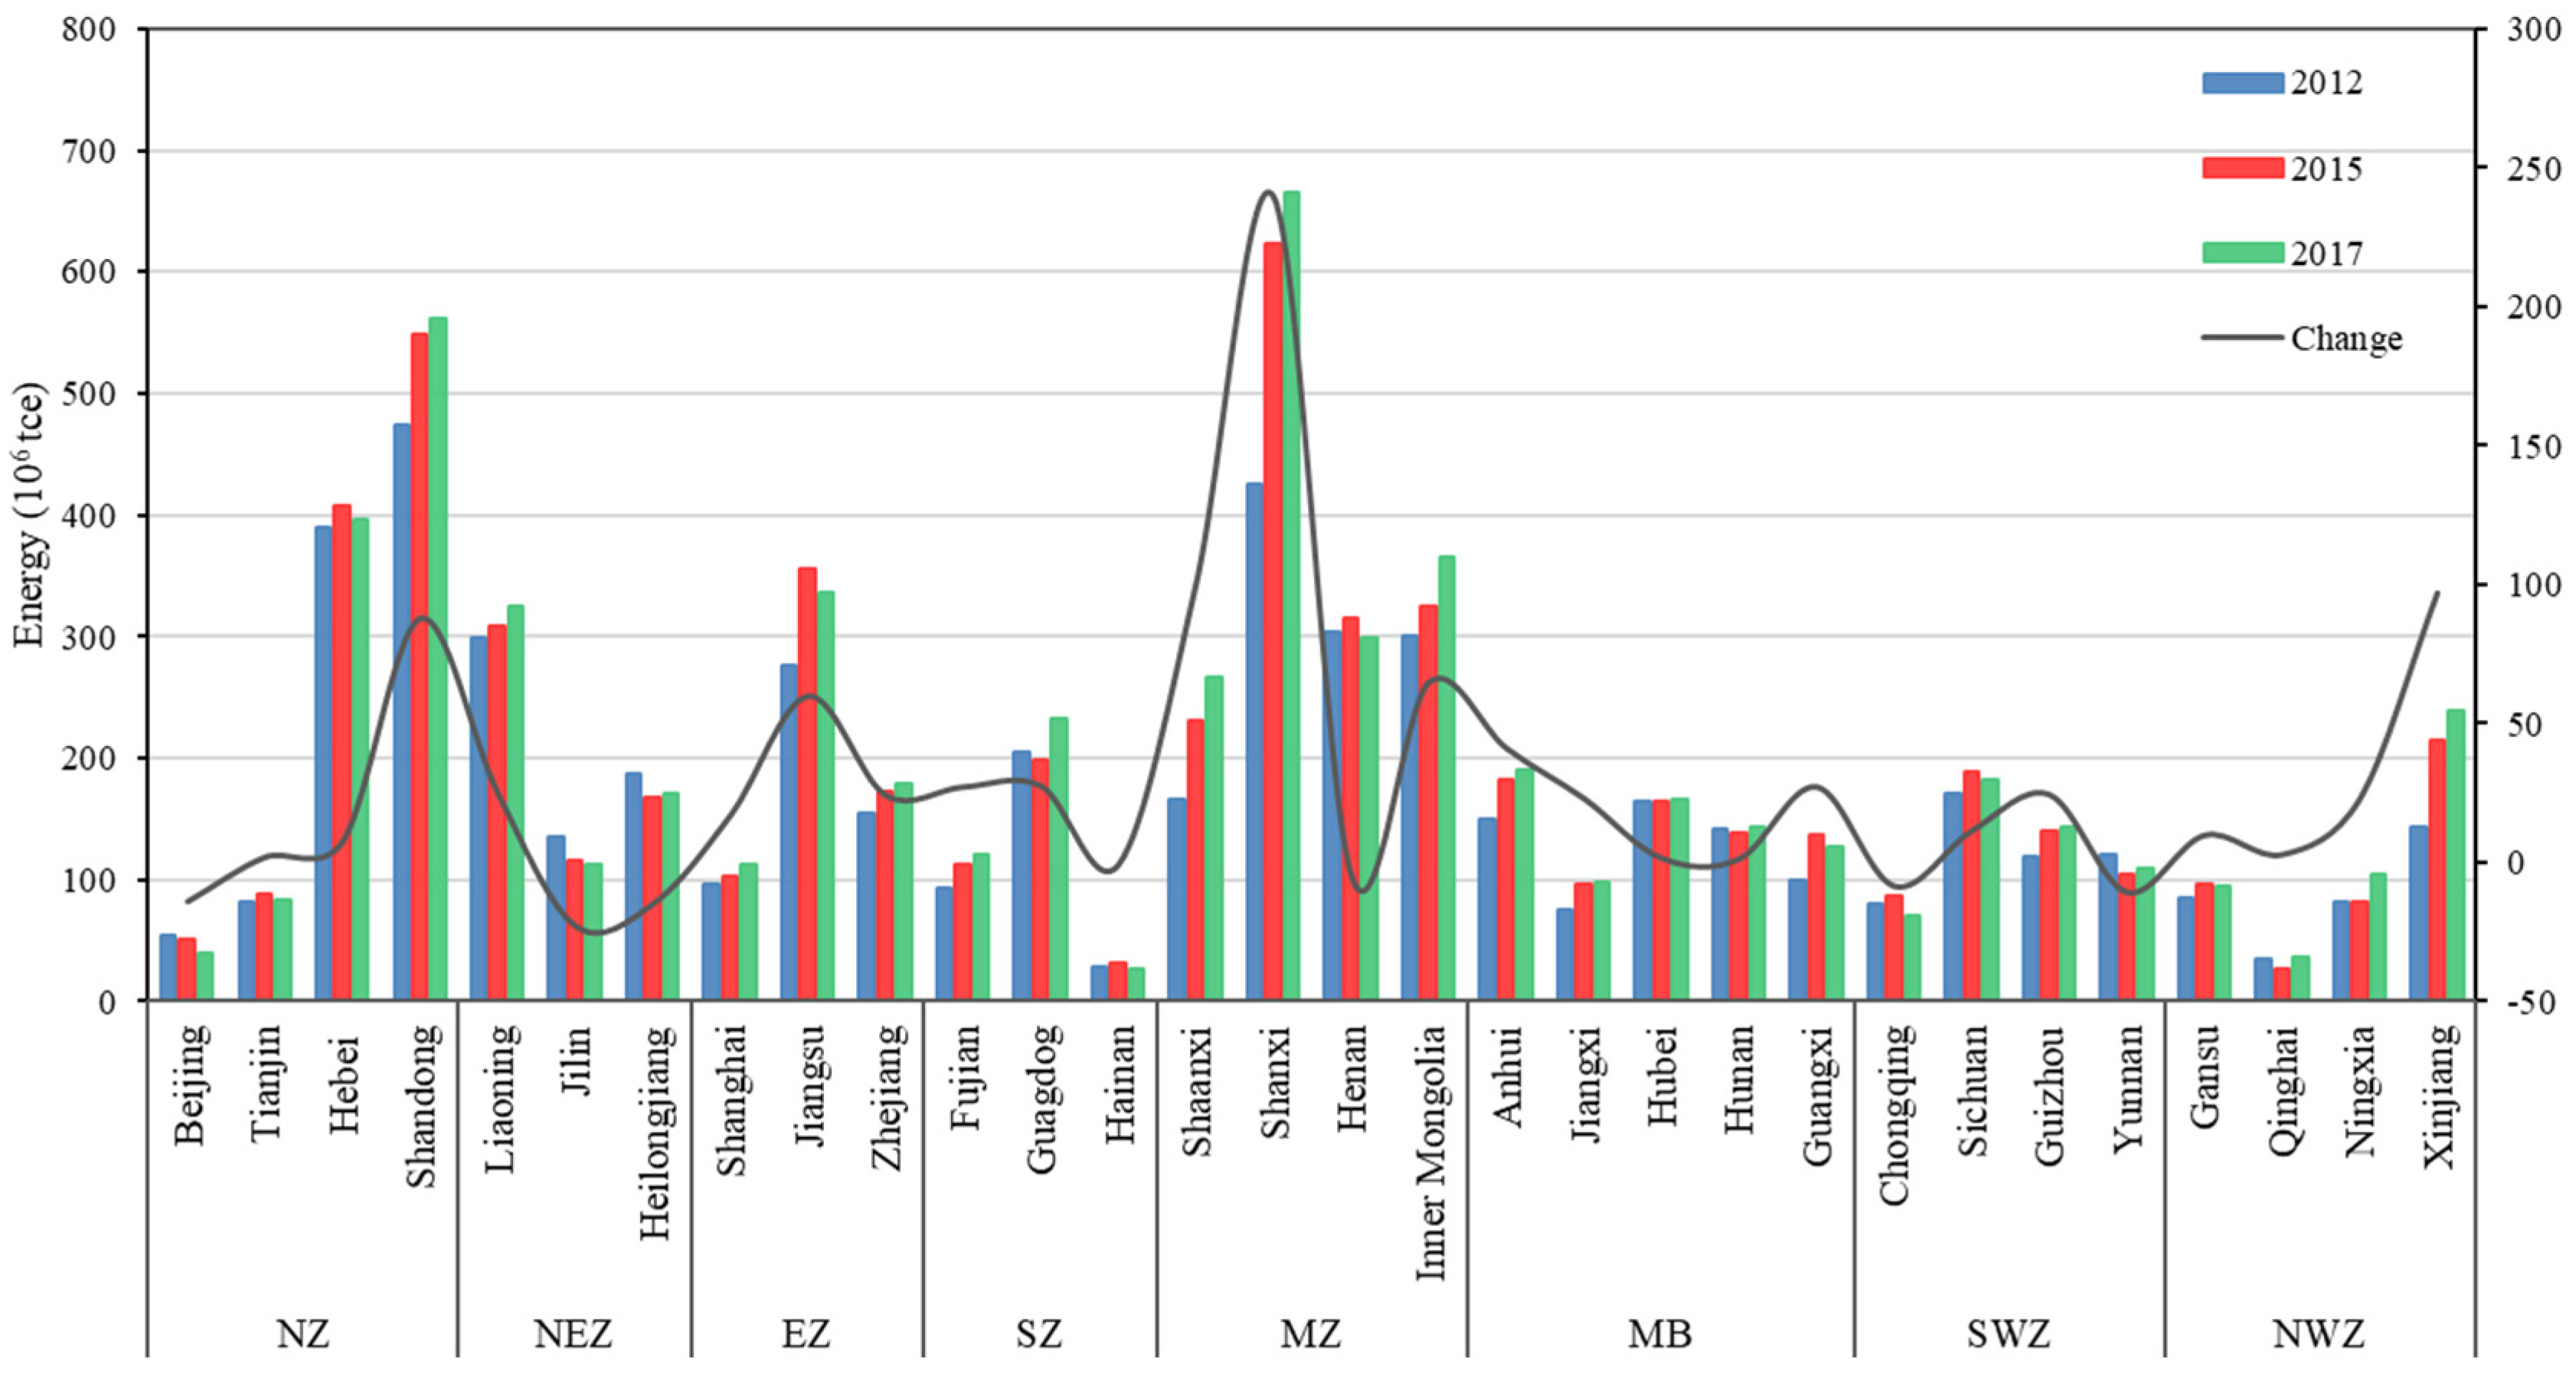
4.1. Industrial Consumption and Embodied Energy Consumption

Figure 2 illustrates 30 provinces’ industrial consumption in China. Among them, Shandong, Jiangsu, Guangdong, Henan, and Zhejiang experienced the largest industrial consumption and the most significant changes from 2012 to 2017. Generally, industrial consumption increased from 1.25 × 10¹⁴ RMB to 1.85 × 1014 RMB by 2017, at an average per annum growth of 48.69%. At the regional level, the middle Yellow River comprehensive zone had the largest total output among the eight regions, followed by the middle Yangtze River comprehensive belt. In contrast, the area with minimal industrial change was mainly the northeast zone, where the heavy industry base in Liaoning experienced negative growth. This decline was primarily due to the region’s energy shortage and the decline of heavy industry.
Figure 3 displays China’s embodied energy consumption in 30 provinces. Firstly, in 2012, Shandong, Shanxi, Hebei, Henan, and Inner Mongolia were the most energy-consuming provinces. By 2015 and 2017, Jiangsu surpassed Henan to become one of the top five provinces in energy consumption, driven by rapid economic development and large energy demand. During the research stage, the middle Yellow River comprehensive zone was also the region with the highest energy consumption, indicating a correlation between high industrial value and high energy consumption. Further strengthening technological innovation and improving energy efficiency are very important. Overall, total embodied energy use increased from 5.14 × 10⁹ tce to 6.00 × 109 tce by 2017, at an average per annum growth of 3.36%. In 2012–2017, seven provinces achieved negative growth in embodied energy consumption, including Jilin, Heilongjiang, Beijing, Yunnan, Chongqing, Henan, and Hainan. The northeast comprehensive economic zone was the only region with negative growth in energy consumption, attributed to the decline of heavy industry in the area. It demonstrates the close link between industry and embodied energy, with industrial changes influencing embodied energy flow.
From the sectoral perspective (Figure 4a), D24 was the highest department with embodied energy consumption, totaling approximately 1.75 × 10⁹ tce during 2012–2017. Subdivisions of the manufacturing industry, such as D11, D2, and D14, require significant energy for production, resulting in large energy consumption. However, D26, D21, and D22 exhibited lower energy consumption among the 30 departments. In contrast to embodied energy consumption, in Figure 4b, the larger sectors of industrial consumption were D30, D27, and D12, accounting for almost 44.80% of the total industrial consumption in 2017. Additionally, D29 and D6 exhibited relatively large industrial consumption. It displays that the layout and structure of industries also obviously affect the output value, and the economic output value is not completely interdependent with energy use. Therefore, to alleviate the energy crisis and environmental pollution, we must further adjust the industrial structure and improve energy efficiency.

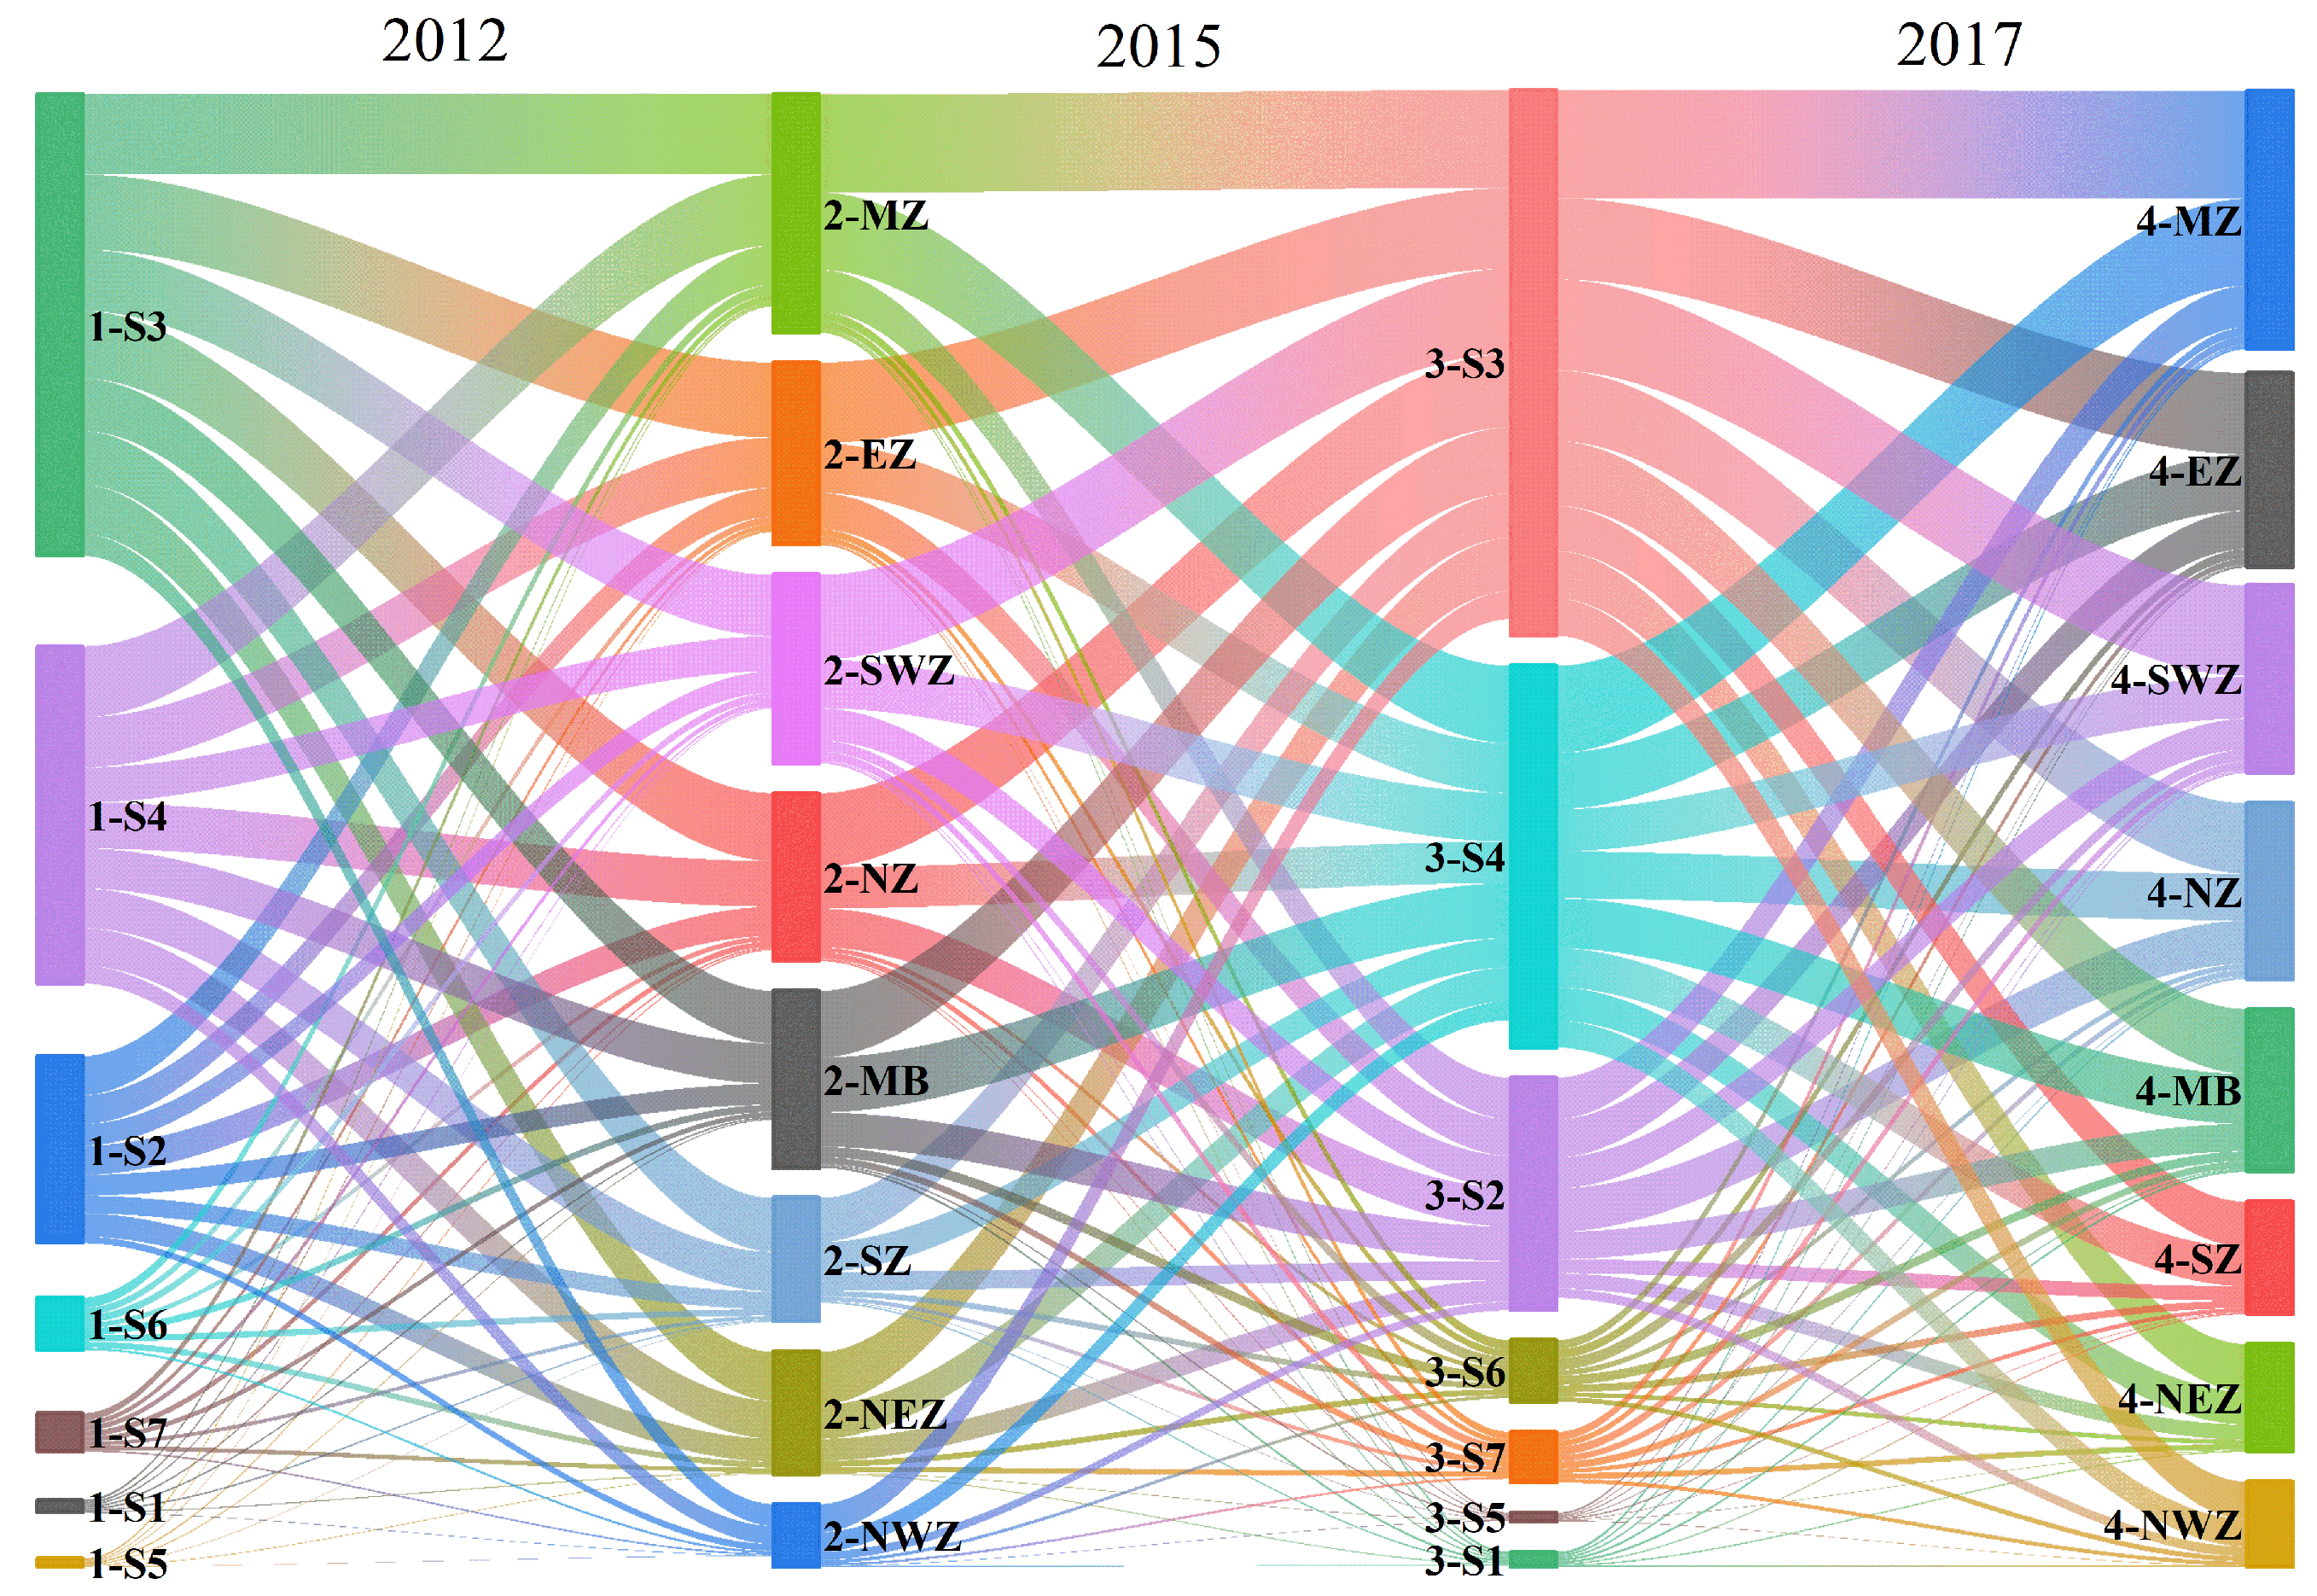
4.2. Industrial and Embodied Energy Transfers

Embodied energy transfers between sectors and regions in 2012, 2015, and 2017 are presented in Figure 5. Chain width indicates different flow values. S1–S7 denotes seven sectors, and MZ to NWZ denotes the abbreviations of eight regions. See Table 1 and Table 2 for a detailed division. Labels 1-S1 represent the S1 sector in the first column, and 2-NEZ indicates the northeast comprehensive economic zone in the second column. The preceding number indicates the number of columns. Other labels express similar meanings. The first column displays the sectors where embodied energy is transferred out, and the second column represents the regions where embodied energy is transferred in. The first column to the second column represents regional–sectoral embodied energy flows in 2012, and so on. There are four columns in total, representing three stages. The first, second, and third stages represent embodied energy flow across sectors and regions in 2012, 2015, and 2017, respectively. Fig 6 has a similar meaning. At the sectoral level, the order of embodied energy transfer was S3, S4, S2, S6, S7, S1, and S5. S3 and S4 exported the most concrete energy to all eight regions, primarily to the middle Yellow River comprehensive zone, the eastern coastal zone, and the southwest zone. In the northwest zone, it accounted for the smallest proportion. By 2017, S3 still had the biggest amount of embodied energy transfer, which shows that focusing on industries with high-energy consumption is vital to promote cross-regional embodied energy flow and the key to realizing “dual control of energy”.
In Figure 6, the amount of industrial transfer between sectors and regions was ranked as follows: S3, S7, S5, S1, S6, S4, and S2. S3 was the sector with the most industrial transfer, mainly flowing into the middle Yellow River comprehensive zone, the eastern coastal zone, the middle Yangtze River comprehensive belt, and so on. It indicates that the strategy of the rise of central China has achieved certain results, but the regional economy and urban development were still unbalanced. Therefore, further promoting regional coordinated development is necessary. In contrast to embodied energy transfer, S7 was the second sector with the most industrial transfer, and its output value kept increasing, mainly flowing to the eastern coastal zone, the middle Yangtze River comprehensive belt, the southwest zone, and so on. Their location is mainly in the southern, middle, and coastal regions with fast economic development and high industrial levels. Furthermore, S2 was the sector with the smallest output value flow, but it was accompanied by greater energy consumption.

4.3. Evolution Patterns of Net Industrial Transfer and Net Embodied Energy Transfer

4.3.1. Spatial–Temporal Paths of Net Industrial Transfer

Figure 7 displays the paths of net industry transfer at the regional level and the most significant net flows among them in 2012, 2015, and 2017. The black number represents the total net transfer amount of each region. Note that there are positive (net inflow) and negative (net outflow). White numbers represent the most representative flow values.
In Figure 7a, the eastern coastal zone was the primary net industrial transfer-out region in 2012, mainly transferring to the southern coastal zone (9.50 × 10¹¹ RMB), the southwest zone (6.10 × 10¹¹ RMB), and the northern coastal zone (5.30 × 10¹¹ RMB), among others. The southern coastal zone was the region that undertook the most industrial transfer (net transfer-in region), primarily receiving from the middle Yellow River comprehensive zone (7.20 × 10¹¹ RMB) and the middle Yangtze River comprehensive belt (5.70 × 10¹¹ RMB). Additionally, the industries transferred from the eastern coastal zone to other regions were mainly concentrated in manufacturing, especially D13 and D14.
As shown in Figure 7b, the eastern coastal zone remained the largest net industrial transfer-out region in 2015, transferring out approximately 4.04 × 10¹² RMB. With the speedy economic development and serious environmental problems, the southeast coastal zone has become a major promoter of net industrial transfer to the northwest and southwest regions. By 2015, the southwest zone has become the most significant net transfer-in region, mainly absorbing industries from the eastern coast zone, the middle Yellow River, and the Yangtze River comprehensive belt. This is mainly attributed to the region’s superior location, abundant mineral resources, and policy support for industries from other regions. Additionally, the northeast zone was transformed into a net industrial transfer region in 2015, and the reasons for the change were coal shortages and industrial adjustments.
In Figure 7c, the eastern coastal zone was also the most typical net industrial transfer-out region in 2017, and the industrial transfer-out regions showed a northward trend. It can be found that in 2017, the industrial transfer absorbed by the northwest and southwest zones increased significantly compared to 2012. The middle and southeast coastal regions were the major sources of industrial transfer in the western regions. The findings suggest that China’s strategy to promote regional coordinated development has achieved remarkable results.
The paths of net industrial transfer were primarily from the developed coastal regions in the east and north and were directed toward the inland developing middle and western regions. Transfer-out regions were mostly in the coastal zones and the middle Yangtze River comprehensive belt, with relatively developed economies and high GDP. This demonstrates significant gaps in industrial development, structure, and layout among regions. According to [9,24], the eastern coastal zone was in the post-industrialization period, while the middle, western regions were still in the middle industrialization period. The industrial adjustment between manufacturing and non-manufacturing industries drove the regional embodied energy transfer. Additionally, industrial transfer did not follow the strict spatial and geographical sequence of east, middle, and west, but exhibited an obvious trend of “westward” and “southward” transfer, which can be supported by the findings of [9].

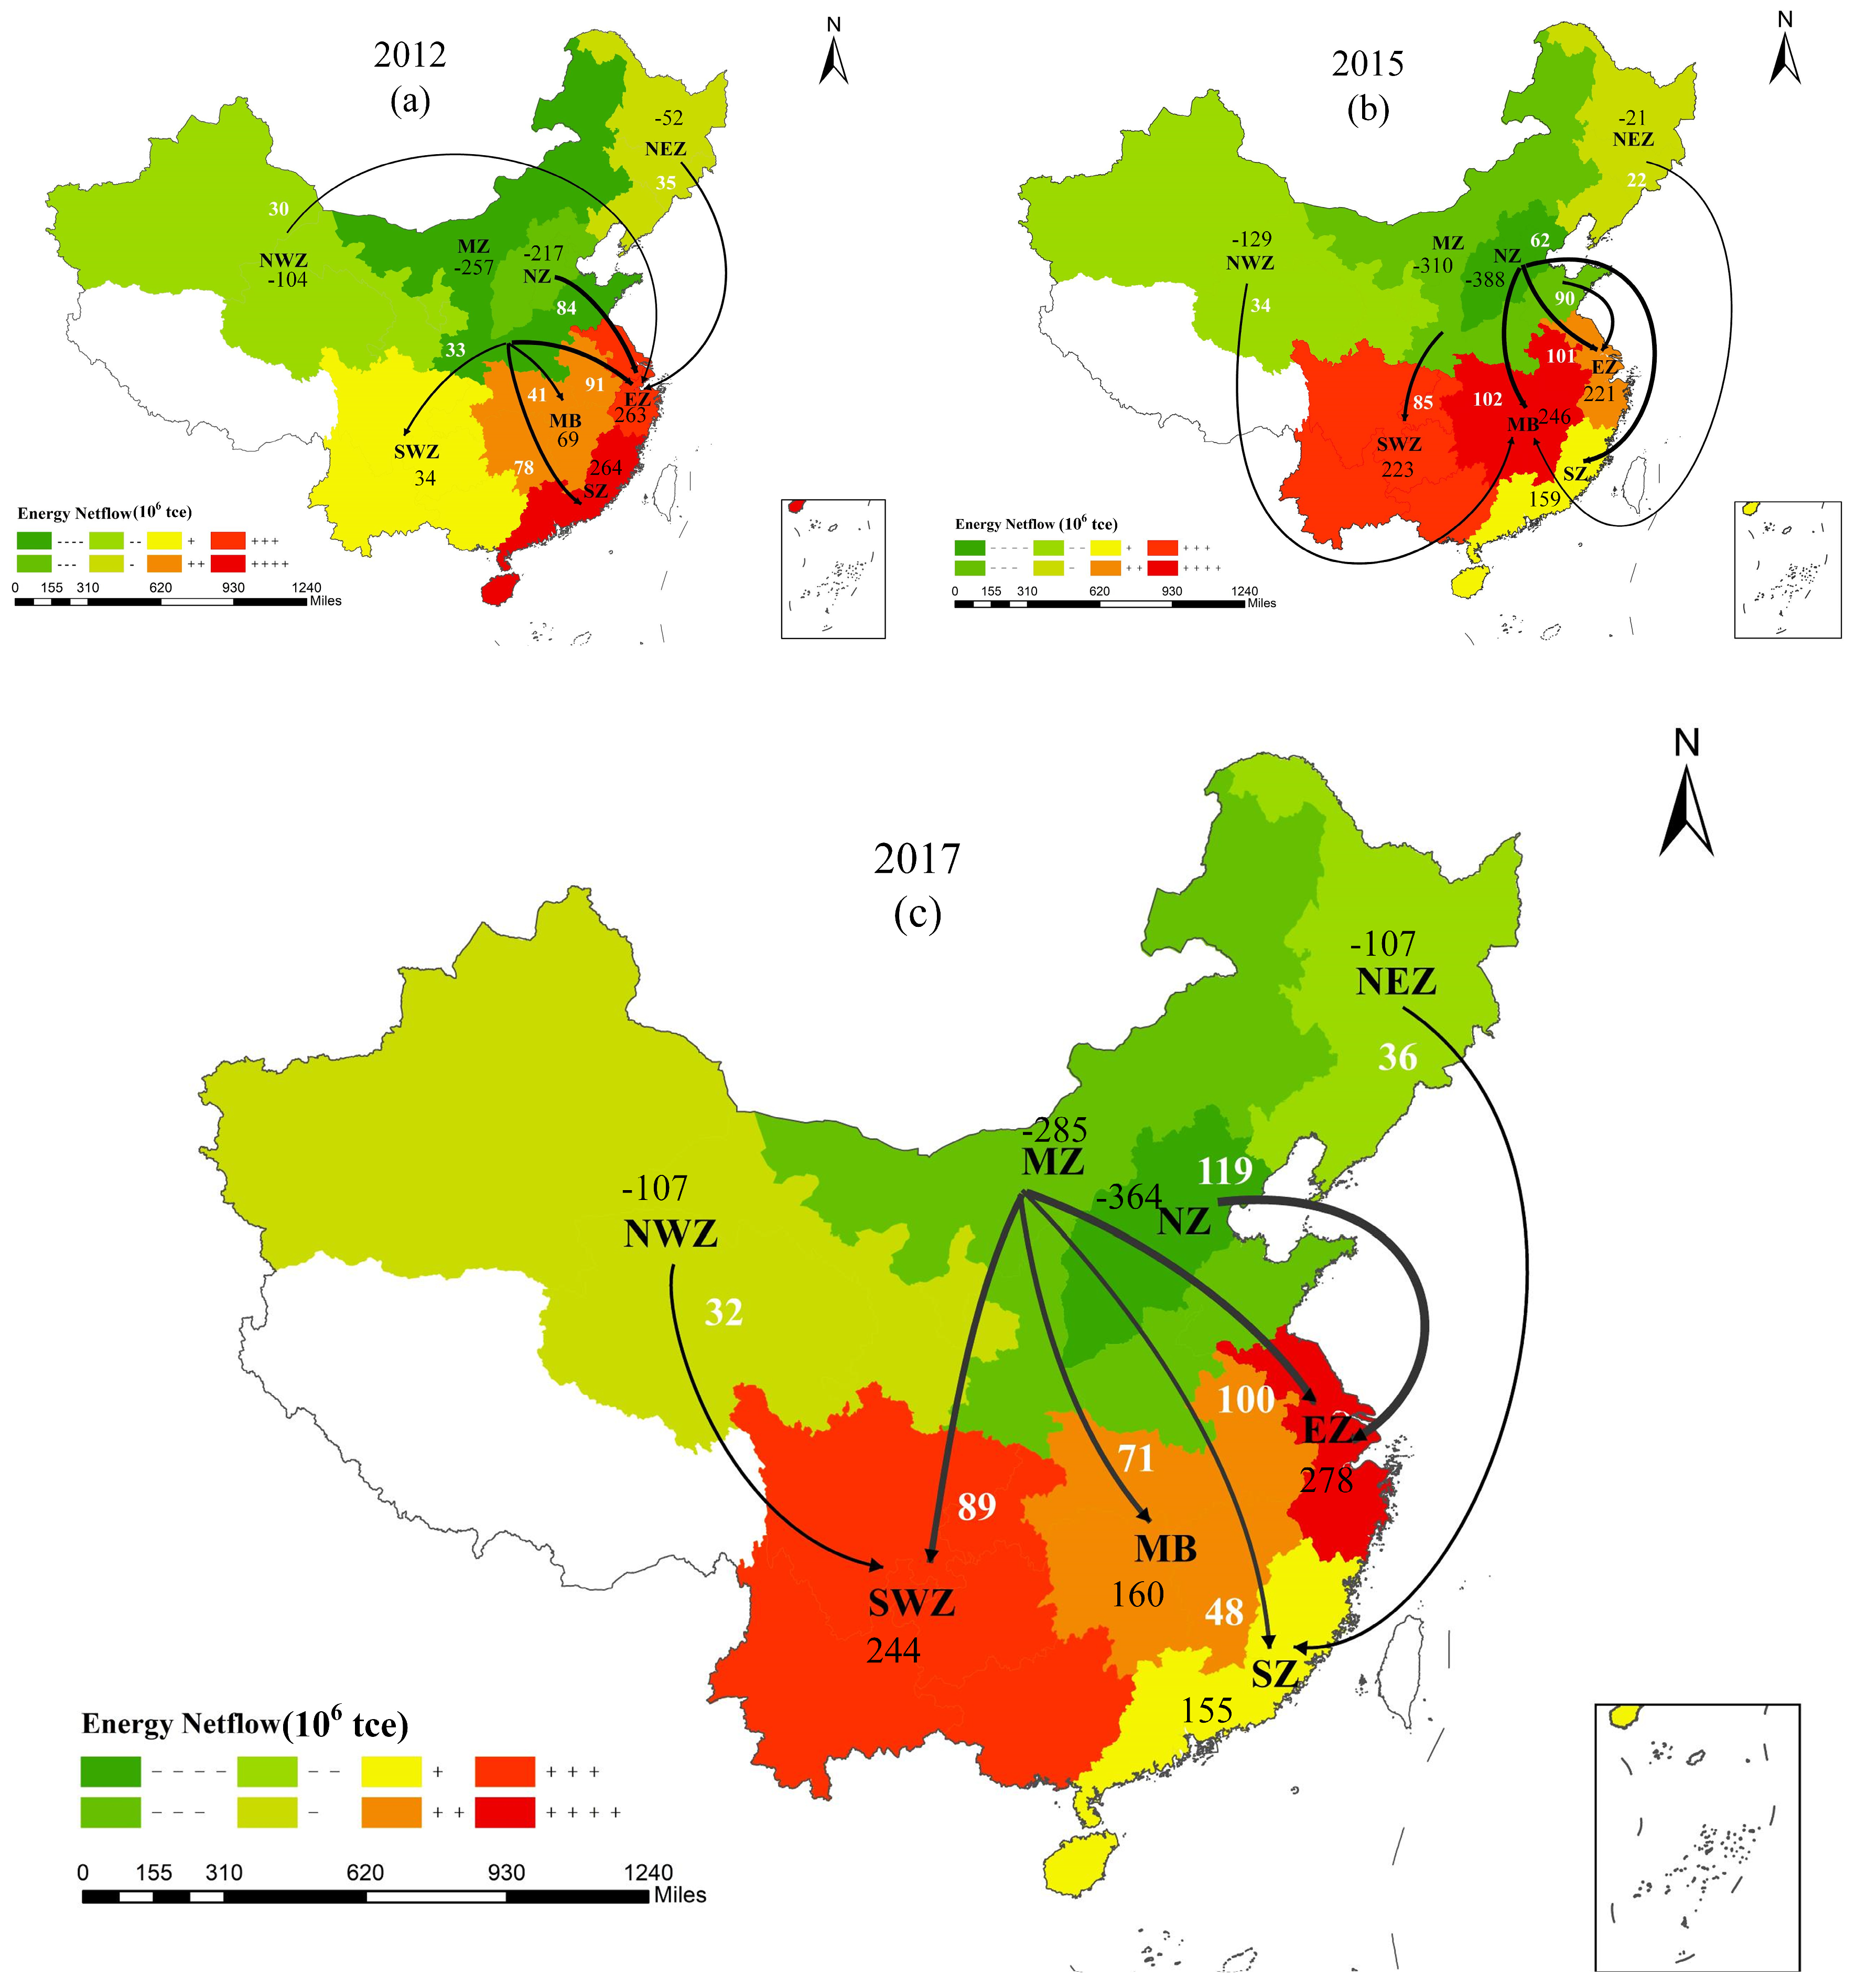
4.3.2. Spatial–Temporal Paths of Net Embodied Energy Transfer

The spatial–temporal net transfer paths of embodied energy are displayed in Figure 8a. In Figure 8a, the middle Yellow River comprehensive zone was the biggest net embodied energy transfer-out region, having transferred 2.57 × 10⁸ tce. The northern coastal zone was also the important net embodied energy transfer-out region, followed by the northeast zone and northwest zone. Furthermore, the southern coastal zone and the eastern coastal zone were the largest net embodied energy transfer-in regions. The eastern coastal zone undertook 2.63 × 10⁸ tce, mainly from the middle Yellow River comprehensive zone (9.10 × 10⁷ tce), the northern coastal zone (8.40 × 10⁷ tce), the northeast zone (3.50 × 10⁷ tce), and others. Additionally, the middle Yangtze River comprehensive belt and the southwest zone were also significant net embodied energy transfer-in regions. The analysis indicates that many regions with net embodied energy inflow were economically developed, densely populated, and had high energy demand.
In Figure 8b, the northern coastal and the middle Yellow River zones were the main net embodied energy transfer-out regions in 2015. They mainly transferred to the middle Yangtze River comprehensive belt, and southwest, eastern, and southern coastal zones. Additionally, the northwest and northeast zones were also important net embodied energy transfer-out regions. In the northeast zone, the downfall of heavy industry and the adjustment of industrial structure decreased the local demand for energy, while the external demand increased. The eastern coastal zone was the largest net embodied energy transfer-in region, undertaking 2.21 × 10⁸ tce. The middle Yangtze River comprehensive belt was also a key net embodied energy transfer-in region, mainly from the northwest zone (3.40 × 10⁷ tce) and the northern coastal zone (2.20 × 10⁷ tce), besides the eastern coastal zone.
In Figure 8c, the middle Yellow River comprehensive zone remained the most crucial net embodied energy transfer-out region in 2017. Its main outflow regions included the eastern coastal zone (1.00 × 10⁸ tce), the southwest zone (8.90 × 10⁷ tce), the middle Yangtze River comprehensive belt (7.10 × 10⁷ tce), and the southern coastal zone (4.80 × 10⁷ tce). The northern coastal zone was also a key net embodied energy transfer-out region, followed by the northeast and northwest zones. The eastern coastal zone was the largest net embodied energy transfer-in region, receiving 2.78 × 10⁸ tce, which mainly came from the northern coastal zone (1.19 × 10⁸ tce). Furthermore, other important regions that received net embodied energy transfer included the southwest zone, the middle Yangtze River comprehensive belt, and the southern coastal zone. In the research stage, the northwest zone has consistently been a net embodied energy exporter due to its abundant energy resources, but its economic development was slow.
The paths of net embodied energy transfer mainly originated from the middle and northwest and were directed toward the developed coastal regions. The eastern coastal zone was the biggest net embodied energy transfer-in region. The middle Yellow River was the biggest net embodied energy transfer-out region, which is very significant in connecting the east with the west. During the research stage, the net transfer patterns of embodied energy showed an obvious “eastward” and “southward” trend, and the net embodied energy transfer undertaken by the southwest region increased significantly. There are abundant primary energy resources such as coal and oil in the middle and western regions, which are the most transferring regions. These regions provided many energy products for developed regions and became net embodied energy transfer-out regions. The southern and the eastern coastal zones, relying on the more developed economy and higher GDP, imported energy products from the middle and western regions and have become the major net embodied energy transfer-out regions.

4.3.3. Comparative Analysis of the Evolution Patterns

From 2012 to 2017, there was a marked increase in the transfer of undertaking industries in the southwest and northwest zones, with the southwest zone experiencing the highest increase. Generally, the net transfer of industry showed an obvious “westward” and “southward” trend. By 2017, the amount of net embodied energy transferred to the southwest zone had significantly increased compared to 2012. In short, the direction of net embodied energy transfer from 2012 to 2017 showed a more obvious “southward” and “eastward” trend. For example, the southwest zone is not only a net industrial transfer-in region but also a net embodied energy transfer-in region. It is because all energy-consuming industries, such as S2, S3, and S6, have been transferred in, making the southwest region a net embodied energy inflow region.
When comparing the spatial–temporal evolution patterns of net industrial transfer and net embodied energy transfer, we found that their overall transfer trends are similar, with a clear “southward” trend. It suggests that industrial transfer is the main factor influencing net embodied energy transfer. This conclusion can be supported by [9,24]. They discovered that the spatial paths of industrial transfer and carbon emission transfer are similar, and industrial transfer is the main factor affecting resource flow and carbon emission. One of the reasons is the difference in resource endowment between regions. There are a lot of fossil energy resources in the developing middle and western regions, but the factors of production are lower, which leads to a willingness to sacrifice the environment to achieve faster economic growth. Additionally, the developed economy and rapid technological development in the southeast coastal zones have facilitated the flow of resources, thereby promoting the net transfer of energy. Secondly, optimizing regional industrial structure, especially transferring production resources of heavy industries, has promoted cross-regional energy flow. For instance, China’s eastern coastal zone with rapid economic development mainly imports products with lower added value and higher energy use from the middle and western regions, thereby creating a net embodied energy transfer-in region. However, the eastern coastal zone, for example, was the biggest industrial transfer-out region and the biggest net embodied energy transfer-in region. The spatial–temporal evolution patterns between them are not completely coupled, which shows that embodied energy transfer is also affected by other factors besides industrial transfer.

4.4. Decomposition of Drivers of Embodied Energy Change

4.4.1. Regional-Level Drivers

The drivers of embodied energy transfer among the eight regions from 2012 to 2017 (two stages: 2012–2015 and 2015–2017) are displayed in Figure 9. To take account of the variation, we set different abscissa values. Overall, the total embodied energy transfer increased in China. The largest increase was in the northern coastal zone, with 5.84 × 10⁸ tce. In the first stage, energy intensity contributed to a positive effect of 3.20 × 10⁸ tce, while other factors remained unchanged. In the second stage, the most key positive drivers were the final consumption (1.38 × 10⁸ tce) and investment effect (0.68 × 10⁸ tce). However, energy intensity and production structure effects were the major negative restraining factors with −1.38 × 10⁸ tce, indicating that technology and investment are the key influencing embodied energy transfer in the northern coastal zone. Next, embodied energy growth occurred in the middle Yellow River comprehensive zone. The final consumption effect and investment effect were the most influential factors on embodied energy transfer in the two stages, with 2.72 × 10⁸ tce.
The smallest change in the two stages was in the southern coastal zone (1.32 × 10⁸ tce), followed by the eastern coastal zone (1.80 × 10⁸ tce). Among these driving factors, energy intensity and production structure effects led to a decrease in embodied energy transfer-in, but the superposition of final consumption and investment effects (1.90 × 10⁸ tce) eventually led to an increase in embodied energy transfer-in. In the second stage along the eastern coast, the production trade structure (−0.42 × 10⁸ tce) had a major negative effect, partially offsetting the positive effect of the other drivers. In the southwest zone and the middle Yangtze River comprehensive belt, the decreased energy intensity with −1.09 × 10⁸ tce had the major inhibiting effect in the two stages. Similarly, the production structure played the most critical negative role in the northwest and northeast zones, especially in the second stage of embodied energy transfer with −0.78 × 10⁸ tce.
In general, the leading factors that promoted the increase during the two stages of embodied energy transfer were final consumption and investment, which made the greatest contributions to the middle Yellow River comprehensive zone and the northern zone. During the first stage, the energy structure and energy intensity effects had a major effect on restraining the change in embodied energy transfer. The energy intensity in the middle and south regions has dropped most obviously, indicating the effectiveness of clean energy policies, for example, coal consumption restrictions [47]. In the second stage, the production structure was the key to restraining embodied energy transfer, primarily benefiting from the middle Yellow River comprehensive zone, eastern zone, and so on. As mentioned above, these highly developed service-oriented zones require intermediate products, high-energy goods, and services provided by the middle and western regions, which will inevitably result in a significant influx of embodied energy.

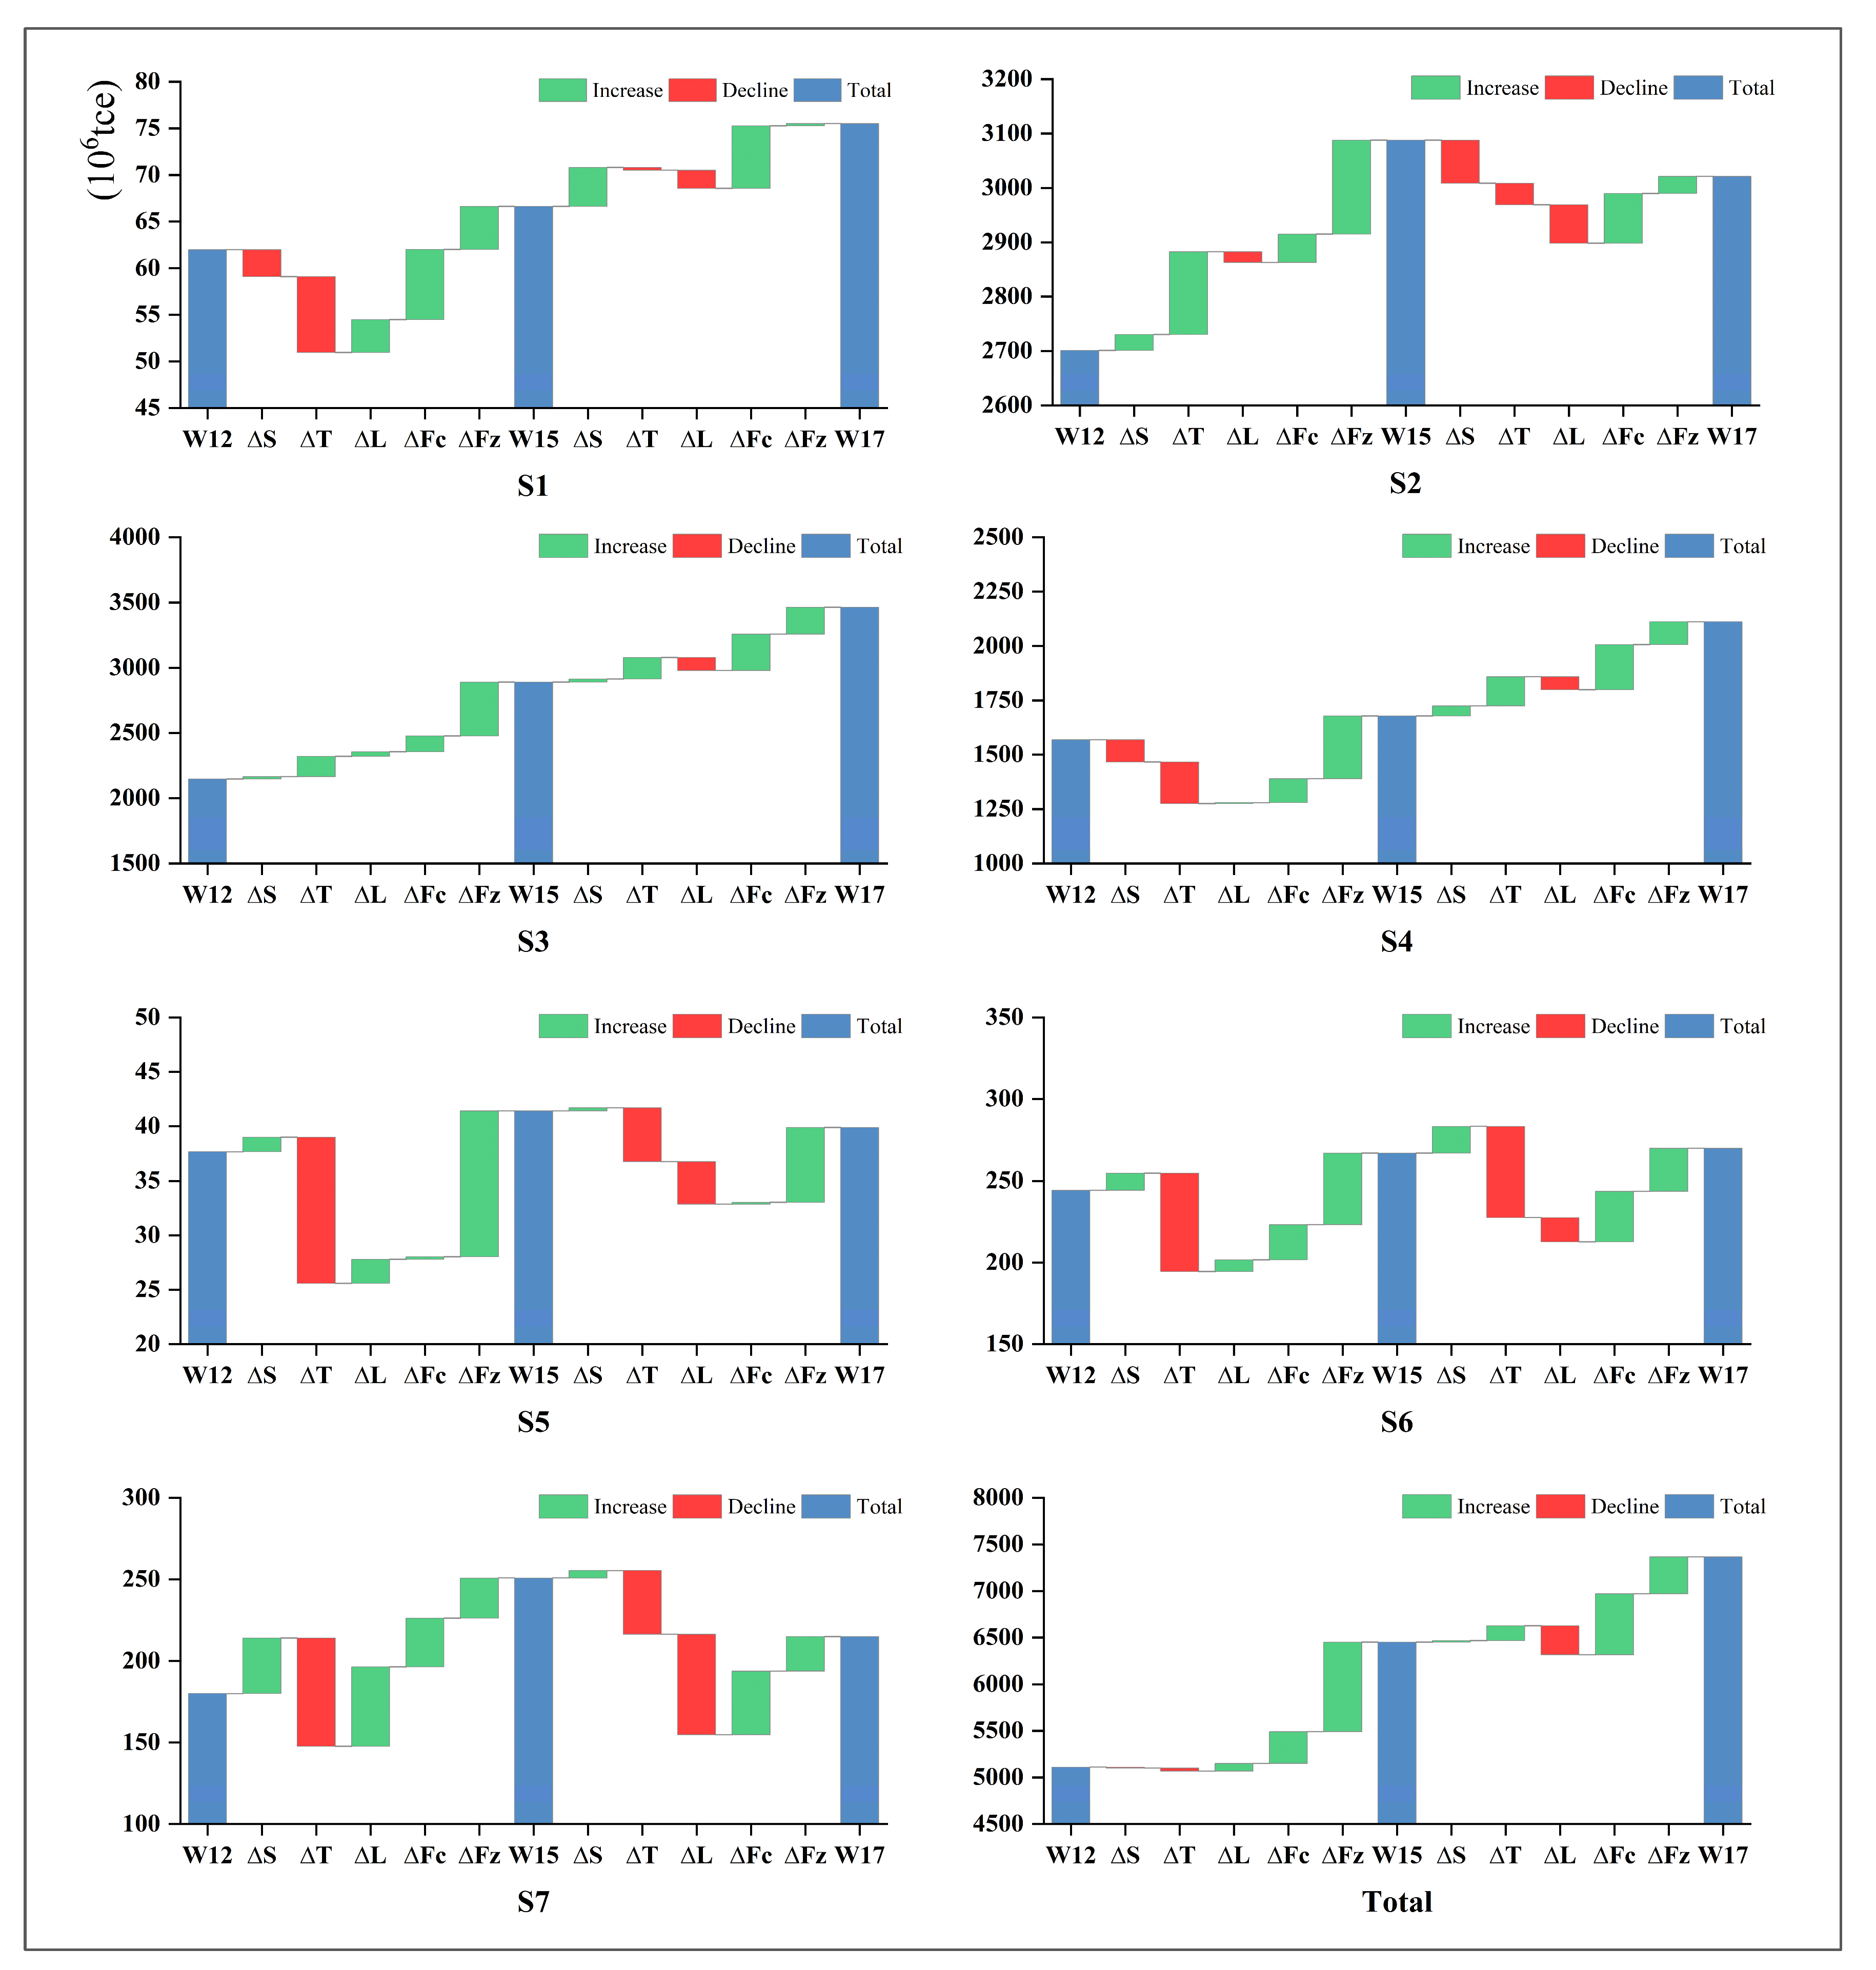
4.4.2. Sectoral-Level Drivers

Figure 10 displays the drivers of embodied energy transfer from the industry sector perspective during 2012–2017. S1 and S5 had the smallest changes from 2012 to 2017 with 0.15 × 10⁸ tce, consistent with the conclusions in Section 4.2. The key negative effects of the change in embodied energy transfer were energy intensity and production structure effects (3.44 × 10⁸ tce). The embodied energy consumption of S3 experienced a marked increase with 13.22 × 10⁸ tce, primarily due to the positive promotion of final consumption (4.00 × 10⁸ tce), investment effect (6.17 × 10⁸ tce), and energy intensity (3.20 × 10⁸ tce). Results also suggested that the changes in embodied energy transfer in S4 were largely determined by the energy structure change, energy intensity, and production structure effects in the first and second stages with −3.94 × 10⁸ tce. From 2012 to 2015, the embodied energy of S2 increased with 3.86 × 10⁸ tce, and then decreased −0.68 × 10⁸ tce from 2015 to 2017. Generally, the embodied energy transfer of S2 increased during the whole study period from 2012 to 2017. Among other factors, only the production structure offset the embodied energy growth with 1.00 × 10⁸ tce, suggesting that adjusting the production structure can enhance energy efficiency and advance energy control and safety. In S6 and S7, the overall changes in embodied energy were the smallest, among which energy intensity and production structure effects played key inhibitory roles from 2015 to 2017.
In summary, from the sectoral perspective, final consumption (9.98 × 10⁸ tce) and investment (13.56 × 10⁸ tce) were the major drivers of the change in embodied energy in the two stages. They had the greatest impact on S3, S2, and S4. However, energy structure and energy intensity changes (−0.43 × 10⁸ tce) were the key factors restraining embodied energy growth in the first stage. It shows that promoting technological progress in energy-intensive industries and adjusting energy structures are effective ways to save energy. In the second stage, the production structure effect with −3.12 × 10⁸ tce mainly suppressed the transfer of embodied energy, with the main contributions coming from S3 and S2. It indicates that the structural adjustment of China’s industries achieved remarkable results, and technological progress promoted energy conservation.

4.5. Discussion

This research compares the consistency of the evolution paths of embodied energy transfer along with industrial transfer. Considering the time dynamics and spatial heterogeneity, this research comprehensively explores the laws and drivers of embodied energy transfer. It provides a reference for the fair realization of the “dual control of energy”.
Research found that the study period was similar to the past trend [48], the total industrial value and total embodied energy consumption increased, but the embodied energy growth rate slowed down. As [49] speculated, national energy consumption generally maintained a growth trend, and the economy and society developed steadily. Industry and embodied energy were inseparable, and high output value was accompanied by high embodied energy usage [5,21]. The biggest net industrial transfer-out region and the biggest net industrial transfer-in region were the eastern coastal zone and the southwest zone, respectively. This can be supported by previous literature [9,24]. It shows that traditional industries have migrated to the inland regions of the middle and western, making room for high-end production in coastal regions [4].
The eastern coastal zone was the biggest net embodied energy transfer-in region, and the middle Yellow River comprehensive zone was the biggest net embodied energy transfer-out region. Like the analysis performed by [24], the middle region played the role of connecting the east and the west regions. Not only has it undertaken many export-oriented industries in coastal regions, but it has also transferred many consumer industries to the northwest and northeast regions. So, the middle Yellow River comprehensive zone was the biggest embodied energy transfer-out region, as emphasized by [11]. In the middle Yellow River comprehensive zone, where fossil energy is dominated, the energy efficiency is relatively low. The government has introduced a series of policies for energy conservation and emission reduction, encouraging enterprises to improve their energy efficiency and restricting the development of high-energy-consuming industries. This has in turn led to the transfer of some high-energy-consuming industries to regions with higher energy efficiency, making this area the largest embodied energy transfer-out region. In contrast, in regions with higher energy efficiency, such as the southeastern coastal areas, the government may further increase its support for new energy and energy-saving and environmental protection industries, attracting more related industries to settle in, thus making these regions become the largest embodied energy net transfer-in region. The trend of spatial–temporal evolution patterns of net industrial transfer and net embodied energy transfer is similar, but not entirely consistent. The findings show that industrial transfer is the key factor of embodied energy pollution and carbon emission transfer, but energy pollution emission transfer is also affected by other factors. This can be supported by previous literature [9,24].
The results show that the important promoting factors influencing the transfer of embodied energy are final consumption and investment. Final consumption and investment have the greatest impact on the middle Yellow River comprehensive zone and the northern zone, and they have the most significant influence on the Mining (S2), Manufacturing (S3), and Electricity, hot water, gas, and water production and supply (S4). This is consistent with the research findings of previous scholars [1,36,50], verifying the robustness of the research results of this paper. Moreover, the embodied energy driven by investment accounted for approximately 60.10% of the total change in embodied energy by 2017, serving as a stable factor promoting the growth of embodied energy.
It can be observed that energy intensity changes and production structure effects played major inhibitory roles that restrict embodied energy change. This is consistent with the research findings of previous scholars [8,30], and it further demonstrates the reliability of the research results of this study. In the middle Yellow River economic zone and the northwest, where the energy efficiency is low, the energy structure is rather simple. These regions mainly rely on traditional fossil energy industries such as Manufacturing (S3), Electricity, hot water, gas, and water production and supply (S4). The transfer of embodied energy in these areas is mainly concentrated in the field of traditional energies such as petroleum. Moreover, due to the low energy efficiency, the volume of embodied energy transfer is relatively large, which also exerts greater pressure on the environment. Among them, the effects of energy intensity and production structure in the eastern coastal regions were less than those in the developing regions. Due to the limitation of energy structure in the central and western regions, some industries may move to the eastern coastal areas with better energy structure, thus attracting hidden energy inflows. As [24] emphasized, lowering energy intensity and improving efficiency are the keys to controlling energy usage. In middle and western regions, the influence of technological improvement on embodied energy consumption is more significant. Therefore, encouraging technological progress, and optimizing industrial production factors are the most efficient actions hindering the continuous increase in embodied energy.

5. Conclusions and Policy Implications

This research employs MRIO to explore the embodied energy transfer along with industrial transfer, and the spatial–temporal transfer patterns of embodied energy along with industrial transfer are analyzed and compared by considering regional heterogeneity. Then, we use SDA to explain the drivers of embodied energy change and transfer. Some key findings have been obtained:
(1)
The middle Yellow River comprehensive zone is the most important area of embodied energy and industrial consumption, with Manufacturing (S3) being the main sector experiencing growth in both industry and embodied energy consumption. By 2017, industrial transfer has increased by nearly 60.10%. However, the embodied energy consumption growth rate has declined. Manufacturing (S3), Electricity, hot water, gas, and water production and supply (S4) were the highest consumer sectors of embodied energy.
(2)
The directions of embodied energy transfer with industrial transfer are not perfectly consistent. The paths of net industrial transfer were primarily from the developed coastal regions in the east and north and were directed toward the inland developing middle and western regions. The middle and western regions are the leading contributors to embodied energy transfer in other regions. The net embodied energy transfer paths primarily originated in the middle and northwest and directly flowed into the developed coastal regions. Regional disparities can be observed: economy and industry in the middle and western regions are developing slowly, so it mainly exports embodied energy to developed regions. Meanwhile, the highly developed regions of the southern and coastal zones consume a lot of embodied energy, which leads to import and transfer.
(3)
In the sectoral and regional analysis of drivers, energy intensity and production structure effects are the major inhibiting factors. Final consumption and investment are the main factors promoting embodied energy change, indicating that the existing production and consumption still involve high embodied energy use. The rapid economic development in the developed regions has driven the consumer market and generated significant energy demand. It, in turn, has resulted in the agglomeration of industries with low energy efficiency in developing regions, ultimately affecting the embodied energy consumption and transfer between regions. These trends pose significant challenges to the realization of the “dual control of energy” goal.
According to the above findings, some policy implications are as follows:
Firstly, we can implement comprehensive upstream and downstream management of industries involved in high-energy-consuming sectors. Manufacturing (S3), Electricity, hot water, gas, and water production and supply (S4) consumed a significant amount of embodied energy and provided many intermediate products for other sectors. Hence, S3 and S4 should increasingly strengthen energy-saving measures, enhance industrial chain management, and make full use of the products of downstream industries. Aiming at the bottleneck of energy saving, it is very critical to use clean and green energy. The government can adopt a policy of taxing the use of fossil energy and providing subsidies for green renewable energy to promote cleaner production.
Secondly, in the spatial–temporal evolution patterns of industrial transfer and embodied energy transfer, policymakers should consider spatial heterogeneity and prioritize regional coordinated development. The government should lead all localities to rationally carry out industrial transfer according to resource endowment and industrial development foundation. In areas dominated by fossil energy, the government should pay attention to the clean utilization of traditional energy sources, energy conservation, and emission reduction, and limit the development of energy-intensive industries. For example, in the middle Yellow River comprehensive zone and western regions, on the one hand, we can promote energy conservation by improving energy efficiency, evident innovation, and technological progress. On the other hand, we can achieve structural-oriented improvement by adjusting production structure. Not only will this be conducive to enhancing energy efficiency, but it will also increase the possibility of decoupling economic benefits from environmental pollution. Additionally, the top embodied energy consumers located on the eastern coastal zone and southeast coast should actively take on environmental responsibilities and provide technical support for the developing regions in northwest China. This can promote coordinated and sustainable development among regions.
Thirdly, by analyzing the drivers, it becomes evident that the growth of investment and final consumption in the two stages has consistently posed the primary challenge for absolute energy conservation in China. Therefore, policymakers should constantly promote energy conservation and environmental protection by optimizing consumption structure. In the middle Yellow River comprehensive zone and the northern zone, final consumption actively promotes embodied energy transfer, and it is necessary to strengthen government supervision and encourage social commercial capital to invest in clean production, green and low carbon, energy saving, and other related fields. Additionally, the adjustment of production structure in Mining(S2), Manufacturing(S3), Electricity, hot water, gas, and water production and supply (S4) is the key to realizing “dual control of energy” in the future. For the developing regions, technological innovation should be strengthened to upgrade the production structure and promote sustainable production.
This research makes a comprehensive and detailed study of the spatial–temporal evolution patterns and drivers of embodied energy transfer along with industrial transfer. But there are still some deficiencies and regions to be further explored. Firstly, for the limitation of data updates in the MRIO tables, this paper was only conducted during 2012–2017, and the current study may have a time lag. The latest data can be considered in future research to fully and timely understand the dynamic evolution characteristics of embodied energy transfer. The implementation effect of relevant policies will be tested, to provide more timely suggestions for China’s economic and industrial development and global sustainable development. Secondly, the process of combining the energy list with the MRIO (Multi-Regional Input–Output) model is subject to uncertainties. Referring to China’s industry classification standards, this study merged the inter-provincial energy inventories and CEADs (China Emission Accounts and Datasets) data into 30 sectors. And for the convenience of presenting the results, these 30 sectors were further combined into 7 sectors, which might have led to the loss of some details. In future research, a detailed investigation can be carried out into these 30 industries. Alternatively, the manufacturing industry can be divided into sub-sectors such as high-energy-consuming and low-energy-consuming industries. This will help analyze which industries are more likely to cause significant embodied energy transfers.

Author Contributions

Conceptualization, X.L.; Methodology, Q.P., L.Z. and Y.C.; Software, L.Z.; Formal analysis, X.L. and Y.C.; Writing—original draft, X.L. and L.Z.; Writing—review & editing, Q.P. and Y.C.; Project administration, Q.P. All authors have read and agreed to the published version of the manuscript.

Funding

This research received no external funding.

Data Availability Statement

Relevant data are available in https://www.ceads.net.cn/data/.

Acknowledgments

This paper is supported by the Humanities and Social Science Research General Project of the Ministry of Education of China (No. 22YJAZH086) and the Fundamental Research Funds for the Central Universities (No. B220207024).

Conflicts of Interest

The authors declare no conflict of interest.

References

  1. Wang, Z.; Zhang, H.; Li, H.; Wang, S.; Wang, Z. Identifying the key factors to China’s unsustainable external circulation through the accounting of the flow of embodied energy and virtual water. Renew. Sustain. Energy Rev. 2023, 173, 113115. [Google Scholar] [CrossRef]
  2. Chen, G.Q.; Wu, X.F. Energy overview for globalized world economy: Source, supply chain and sink. Renew. Sustain. Energy Rev. 2017, 69, 735–749. [Google Scholar] [CrossRef]
  3. Yongwei, C.; Dong, M.; Huanyu, R.; Tijun, F.; Jianbang, D. Using a temporal input-output approach to analyze the ripple effect of China’s energy consumption. Energy 2020, 211, 118641. [Google Scholar] [CrossRef]
  4. Zhao, X.; Lu, F. Spatial distribution characteristics and convergence of China’s regional energy intensity: An industrial transfer perspective. J. Clean. Prod. 2019, 233, 903–917. [Google Scholar] [CrossRef]
  5. Li, Y.; Sun, L.; Zhang, H.; Liu, T.; Fang, K. Does industrial transfer within urban agglomerations promote dual control of total energy consumption and energy intensity? J. Clean. Prod. 2018, 204, 607–617. [Google Scholar] [CrossRef]
  6. Xue, L.; Li, H.; Xu, C.; Zhao, X.; Zheng, Z.; Li, Y.; Liu, W. Impacts of industrial structure adjustment, upgrade and coordination on energy efficiency: Empirical research based on the extended STIRPAT model. Energy Strategy Rev. 2022, 43, 100911. [Google Scholar] [CrossRef]
  7. Zhan, L.; Lei, Y.; Li, L.; Ge, J. Interprovincial transfer of ecological footprint among the region of Jing-Jin-Ji and other provinces in China: A quantification based on MRIO model. J. Clean. Prod. 2019, 225, 304–314. [Google Scholar] [CrossRef]
  8. Wang, X.; Huang, H.; Hong, J.; Ni, D.; He, R. A spatiotemporal investigation of energy-driven factors in China: A region-based structural decomposition analysis. Energy 2020, 207, 118249. [Google Scholar] [CrossRef]
  9. Li, M.; Li, Q.; Wang, Y.; Chen, W. Spatial path and determinants of carbon transfer in the process of inter provincial industrial transfer in China. Environ. Impact Assess. Rev. 2022, 95, 106810. [Google Scholar] [CrossRef]
  10. Zhang, Z.; Chen, W. Embodied carbon transfer between China and the Belt and Road Initiative countries. J. Clean. Prod. 2022, 378, 134569. [Google Scholar] [CrossRef]
  11. Mi, Z.; Meng, J.; Guan, D.; Shan, Y.; Song, M.; Wei, Y.M.; Liu, Z.; Hubacek, K. Chinese CO2 emission flows have reversed since the global financial crisis. Nat. Commun. 2017, 8, 1712. [Google Scholar] [CrossRef] [PubMed]
  12. Liu, H.; Liu, W.; Liu, Z. Quantitative measurement of interregional Industrial Transfer—Based on Interregional input-output table analysis. China Ind. Econ. 2011, 6, 79–88. [Google Scholar] [CrossRef]
  13. Yin, J.; Zheng, M.; Li, X. Interregional transfer of polluting industries: A consumption responsibility perspective. J. Clean. Prod. 2016, 112, 4318–4328. [Google Scholar] [CrossRef]
  14. Liu, C.; Hong, T.; Li, H.; Wang, L. From club convergence of per capita industrial pollutant emissions to industrial transfer effects: An empirical study across 285 cities in China. Energy Policy 2018, 121, 300–313. [Google Scholar] [CrossRef]
  15. Omri, A.; Kahouli, B. Causal relationships between energy consumption, foreign direct investment and economic growth: Fresh evidence from dynamic simultaneous-equations models. Energy Policy 2014, 67, 913–922. [Google Scholar] [CrossRef]
  16. Yang, R.; Long, R.; Yue, T.; Shi, H. Calculation of embodied energy in Sino-USA trade: 1997–2011. Energy Policy 2014, 72, 110–119. [Google Scholar] [CrossRef]
  17. Abbes, S.M.; Mostéfa, B.; Seghir, G.; Zakarya, G.Y. Causal Interactions between FDI, and Economic Growth: Evidence from Dynamic Panel Co-integration. Procedia Econ. Financ. 2015, 23, 276–290. [Google Scholar] [CrossRef]
  18. Rahman, M.M.; Mamun, S.A.K. Energy use, international trade and economic growth nexus in Australia: New evidence from an extended growth model. Renew. Sustain. Energy Rev. 2016, 64, 806–816. [Google Scholar] [CrossRef]
  19. Shi, X.; Chu, J.; Zhao, C. Exploring the spatiotemporal evolution of energy intensity in China by visual technology of the GIS. Energy 2021, 228, 120650. [Google Scholar] [CrossRef]
  20. Zhang, B.; Chen, Z.M.; Xia, X.H.; Xu, X.Y.; Chen, Y.B. The impact of domestic trade on China’s regional energy uses: A multi-regional input–output modeling. Energy Policy 2013, 63, 1169–1181. [Google Scholar] [CrossRef]
  21. Zhang, B.; Qiao, H.; Chen, Z.M.; Chen, B. Growth in embodied energy transfers via China’s domestic trade: Evidence from multi-regional input–output analysis. Appl. Energy 2016, 184, 1093–1105. [Google Scholar] [CrossRef]
  22. Chen, L.; Xu, L.; Yang, Z. Accounting carbon emission changes under regional industrial transfer in an urban agglomeration in China’s Pearl River Delta. J. Clean. Prod. 2017, 167, 110–119. [Google Scholar] [CrossRef]
  23. Zheng, Y.; Qi, J.; Chen, X. The effect of increasing exports on industrial energy intensity in China. Energy Policy 2011, 39, 2688–2698. [Google Scholar] [CrossRef]
  24. Wang, Y.; Wang, X.; Chen, W.; Qiu, L.; Wang, B.; Niu, W. Exploring the path of inter-provincial industrial transfer and carbon transfer in China via combination of multi-regional input–output and geographically weighted regression model. Ecol. Indic. 2021, 125, 107547. [Google Scholar] [CrossRef]
  25. Pan, A.; Xiao, T.; Dai, L.; Shi, X. Global transfer of embodied energy: From source to sink through global value chains. Sustain. Prod. Consum. 2022, 31, 39–51. [Google Scholar] [CrossRef]
  26. Li, Y.; Chen, B.; Li, C.; Li, Z.; Chen, G. Energy perspective of Sino-US trade imbalance in global supply chains. Energy Econ. 2020, 92, 104959. [Google Scholar] [CrossRef]
  27. Wu, X.F.; Chen, G.Q. Coal use embodied in globalized world economy: From source to sink through supply chain. Renew. Sustain. Energy Rev. 2018, 81, 978–993. [Google Scholar] [CrossRef]
  28. He, H.; Reynolds, C.J.; Li, L.; Boland, J. Assessing net energy consumption of Australian economy from 2004–05 to 2014–15: Environmentally-extended input-output analysis, structural decomposition analysis, and linkage analysis. Appl. Energy 2019, 240, 766–777. [Google Scholar] [CrossRef]
  29. Ren, B.; Li, H.; Shi, J.; Liu, Y.; Qi, Y. Identifying the key sectors and paths of the embodied energy in BRICS nations: A weighted multilayer network approach. Energy 2022, 239, 122091. [Google Scholar] [CrossRef]
  30. Sun, X.; Li, J.; Qiao, H.; Zhang, B. Energy implications of China’s regional development: New insights from multi-regional input-output analysis. Appl. Energy 2017, 196, 118–131. [Google Scholar] [CrossRef]
  31. Zhang, X.; Su, B.; Yang, J.; Cong, J. Analysis of Shanxi Province’s energy consumption and intensity using input-output framework (2002–2017). Energy 2022, 250, 123786. [Google Scholar] [CrossRef]
  32. Zhang, K.; Lu, H.; Tian, P.; Guan, Y.; Kang, Y.; He, L.; Fan, X. Analysis of the relationship between water and energy in China based on a multi-regional input-output method. J. Environ. Manag. 2022, 309, 114680. [Google Scholar] [CrossRef] [PubMed]
  33. Zhang, P.; Zhou, Y.; Xie, Y.; Wang, Y.; Li, B.; Li, B.; Jia, Q.; Yang, Z.; Cai, Y. Assessment of the water-energy-food nexus under spatial and social complexities: A case study of Guangdong-Hong Kong-Macao. J. Environ. Manag. 2021, 299, 113664. [Google Scholar] [CrossRef] [PubMed]
  34. Song, S.; Chen, X.; Liu, T.; Zan, C.; Hu, Z.; Huang, S.; De Maeyer, P.; Wang, M.; Sun, Y. Indicator-based assessments of the coupling coordination degree and correlations of water-energy-food-ecology nexus in Uzbekistan. J. Environ. Manag. 2023, 345, 118674. [Google Scholar] [CrossRef]
  35. Wang, Q.; Liu, Y. India’s renewable energy: New insights from multi-regional input output and structural decomposition analysis. J. Clean. Prod. 2021, 283, 124230. [Google Scholar] [CrossRef]
  36. Wu, Y.; Huang, H.; Hong, J.; Wang, X.; Wu, Y.; Wu, Y. Transfer patterns and driving factors of China’s energy use in trade: Evidence from multiregional input–output analysis and structural decomposition analysis. Energy Rep. 2022, 8, 10963–10975. [Google Scholar] [CrossRef]
  37. Dong, B.; Xu, Y.; Li, Q. Carbon transfer under China’s inter-provincial trade: Evaluation and driving factors. Sustain. Prod. Consum. 2022, 32, 378–392. [Google Scholar] [CrossRef]
  38. Pang, Q.; Dong, X.; Zhang, L.; Chiu, Y.-H. Drivers and key pathways of the household energy consumption in the Yangtze river economic belt. Energy 2023, 262, 125404. [Google Scholar] [CrossRef]
  39. Wang, Z.; Cui, C.; Peng, S. How do urbanization and consumption patterns affect carbon emissions in China? A decomposition analysis. J. Clean. Prod. 2019, 211, 1201–1208. [Google Scholar] [CrossRef]
  40. Amin, S.; Jamasb, T.; Nepal, R. Regulatory reform and the relative efficacy of government versus private investment on energy consumption in South Asia. Econ. Anal. Policy 2021, 69, 421–433. [Google Scholar] [CrossRef]
  41. Zhu, B.; Su, B.; Li, Y.; Ng, T.S. Embodied energy and intensity in China’s (normal and processing) exports and their driving forces, 2005–2015. Energy Econ 2020, 91, 104911. [Google Scholar] [CrossRef] [PubMed]
  42. Tang, M.; Hong, J.; Liu, G.; Shen, G.Q. Exploring energy flows embodied in China’s economy from the regional and sectoral perspectives via combination of multi-regional input–output analysis and a complex network approach. Energy 2019, 170, 1191–1201. [Google Scholar] [CrossRef]
  43. Wang, X.-C.; Yang, L.; Wang, Y.; Klemeš, J.J.; Varbanov, P.S.; Ouyang, X.; Dong, X. Imbalances in virtual energy transfer network of China and carbon emissions neutrality implications. Energy 2022, 254, 124304. [Google Scholar] [CrossRef]
  44. Li, X.; Zeng, Z.; Zhang, Z.; Yao, Y.; Du, H. The rising North-South carbon flows within China from 2012 to 2017. Struct. Change Econ. Dyn. 2023, 64, 263–272. [Google Scholar] [CrossRef]
  45. Li, W.; Wang, Q.; Jin, B.; Li, G.; Su, B. Multiregional input–output analysis of carbon transfer in interprovincial trade and sectoral strategies for mitigation: Case study of Shanxi province in China. J. Clean. Prod. 2023, 391, 136220. [Google Scholar] [CrossRef]
  46. Dong, S.; Xia, B.; Li, F.; Cheng, H.; Li, Z.; Li, Y.; Zhang, W.; Yang, Y.; Liu, Q.; Li, S. Spatial–temporal pattern, driving mechanism and optimization policies for embodied carbon emissions transfers in multi-regional tourism: Case study of provinces in China. J. Clean. Prod. 2023, 382, 135362. [Google Scholar] [CrossRef]
  47. Yan, J.; Li, Y.; Su, B.; Ng, T.S. Contributors and drivers of Chinese energy use and intensity from regional and demand perspectives, 2012–2015–2017. Energy Econ. 2022, 115, 106357. [Google Scholar] [CrossRef]
  48. Yang, S.; Shi, L. Prediction of long-term energy consumption trends under the New National Urbanization Plan in China. J. Clean. Prod. 2017, 166, 1144–1153. [Google Scholar] [CrossRef]
  49. Yan, J.; Su, B. What drive the changes in China’s energy consumption and intensity during 12th Five-Year Plan period? Energy Policy 2020, 140, 111383. [Google Scholar] [CrossRef]
  50. Li, Q.; Wu, S.; Lei, Y.; Li, S.; Li, L. Evolutionary path and driving forces of inter-industry transfer of CO2 emissions in China: Evidence from structural path and decomposition analysis. Sci. Total Environ. 2021, 765, 142773. [Google Scholar] [CrossRef]
Figure 1. The research framework.
Energies 18 01965 g001
Figure 2. Industrial consumption of China in 2012–2017.
Energies 18 01965 g002
Figure 3. Embodied energy consumption of China in 2012–2017.
Energies 18 01965 g003
Figure 4. Industry and energy consumption of 30 departments in 2012, 2015, and 2017. (a) represents energy consumption and (b) represents industrial consumption.
Energies 18 01965 g004
Figure 5. Seven-sector embodied energy transfer in 2012–2017.
Energies 18 01965 g005
Figure 6. Seven-sector industrial transfer in 2012–2017.
Energies 18 01965 g006
Figure 7. Spatial–Temporal evolution paths of net industrial transfer. (a) for 2012, (b) for 2015 and (c) for 2017.
Energies 18 01965 g007
Figure 8. Spatial–Temporal evolution paths of net embodied energy transfer. (a) for 2012, (b) for 2015 and (c) for 2017.
Energies 18 01965 g008
Figure 9. Drivers of regional embodied energy change.
Energies 18 01965 g009
Figure 10. Drivers of sectoral embodied energy change.
Energies 18 01965 g010
Table 1. Sector consolidated statement.
CodesSectorsCodesDepartments
S1AgricultureD1Farming, Forestry, Animal Husbandry, and Fishery
S2MiningD2Coal mining and washing
D3Petroleum and Natural Gas Extraction
D4Metals Mining and Dressing
D5Nonmetal and other Minerals Mining and Dressing
S3ManufacturingD6Food, Beverage, and Tobacco Processing and Production
D7Textile Industry
D8Fiber, Leather, Furs, and related products.
D9Timber Processing, Bamboo, Cane, Palm Fiber, Straw Products, and Furniture Manufacturing
D10Paper Making, Printing, and Related Products, Cultural, Educational, and Sports Articles
D11Petroleum Processing and Coking
D12Chemical and Pharmaceutical Products, Chemical Fiber, Rubber, and Plastic Products
D13Nonmetal Mineral Products
D14Smelting and Pressing of Metals
D15Metal Products
D16Ordinary Machinery
D17Equipment for Special Purpose
D18Transportation Equipment
D19Electric Equipment and Machinery
D20Electronic and Telecommunication Equipment
D21Instruments, Meters, Cultural and Office Machinery
D22Other Manufacturing Industry
D23Metal products, machinery, and equipment repair services
S4Electricity, hot water, gas, and water production and supplyD24Electric Power, Steam, and Hot Water Production and Supply
D25Gas Production and Supply
D26Production and Supply of Tap Water
S5ConstructionD27Construction
S6TransportationD28Transportation, Storage, Post and Telecommunication Services
S7ServicesD29Wholesale, Retail trade, Accommodation, and Catering
D30Other Services
Table 2. Eight regions in China.
AbbreviateRegionsProvinces
NZNorthern coastal comprehensive economic zoneBeijing, Tianjin, Hebei, Shandong
NEZNortheast comprehensive economic zoneLiaoning, Jilin, Heilongjiang
EZEastern coastal comprehensive economic zoneShanghai, Jiangsu, Zhejiang
SZSouthern coastal economic zoneFujian, Hainan, Guangdong
MZMiddle Yellow River comprehensive economic zoneShaanxi, Shanxi, Henan, Inner Mongolia
MBMiddle Yangtze River comprehensive economic beltHubei, Hunan, Jiangxi, Anhui
SWZSouthwest comprehensive economic zoneYunnan, Guizhou, Sichuan, Chongqing, Guangxi
NWZNorthwest comprehensive economic zoneGansu, Qinghai, Ningxia, Xinjiang
Disclaimer/Publisher’s Note: The statements, opinions and data contained in all publications are solely those of the individual author(s) and contributor(s) and not of MDPI and/or the editor(s). MDPI and/or the editor(s) disclaim responsibility for any injury to people or property resulting from any ideas, methods, instructions or products referred to in the content.

