Review

The Progress and Prospect of Gap Breakdown Characteristics and Discharge Mechanisms of Overhead Transmission Lines Under Vegetation Fire Conditions

1
College of Electrical Engineering and New Energy, China Three Gorges University, Yichang 443002, China
2
Transmission Line Engineering Technology Research Center of Hubei, Yichang 443002, China
3
School of Electrical Engineering and Automation, Wuhan University, Wuhan 430000, China
*
Author to whom correspondence should be addressed.
Energies 2025, 18(8), 1946; https://doi.org/10.3390/en18081946
Submission received: 25 February 2025 / Revised: 28 March 2025 / Accepted: 7 April 2025 / Published: 10 April 2025

Abstract

:
Wildfires frequently occur, posing a significant threat to the operational stability of transmission lines across mountainous forest areas. Therefore, this paper reviews numerous studies conducted by domestic and international scholars on the gap breakdown tests and discharge mechanisms of transmission lines under simulated wildfire conditions. It analyses and summarizes the physical parameter measurement methods commonly used in current experiments. Combining the results of existing experiments, this study analyzes the discharge mechanisms, including the research progress made in numerical simulations. The conclusion is that existing tests are limited in their measurement methods of the physical quantities related to breakdown characteristics, and it is not easy to strictly control experimental variables when considering complex factors. Numerical simulations mainly focus on multi-physical field simulations, which consider the characteristics of vegetation fires in short gaps. The synergistic mechanism of environmental factors on gap breakdown characteristics remains unclear. This paper points out the breakdown characteristics and discharge mechanisms derived from existing experiments and numerical simulations under various influencing factors, highlighting their applicability and limitations, which differ from complex actual transmission lines in the environment. Then, we look forward to the future development of simulation test platforms that could better reflect the actual transmission line corridor environment, incorporating multi-parameter measurement and in-depth numerical simulation works that consider climate and terrain factors.

1. Introduction

The distribution pattern of energy resources and electricity load determines the development demand for long-distance, high-capacity transmission in China, making it inevitable that transmission line corridors will need to pass through areas prone to wildfires. Wildfires, due to their inherent combustion characteristics, conductivity, ash, and particles, along with the complex interaction of environmental factors such as variable wind speeds and intricate terrain in line corridors, can significantly reduce the insulation strength of transmission line gaps, leading to line tripping and low reclosure success rates, which severely threaten the reliability of transmission line operations.
According to the statistics from the China Southern Power Grid, forest fires in regions such as Yunnan, Guangxi, Guangdong, Hainan, and Guizhou within its jurisdiction account for over 80% of the national total yearly [1]. The distribution statistics of line tripping caused by wildfires in various jurisdictions from 2015 to 2020 are as follows: Yunnan 88 times, Guizhou 68 times, Guangxi 59 times, Guangdong 73 times, Hainan 54 times, and the UHV company 35 times (accounting for 9.3%). The amount of line tripping caused by wildfires in each provincial grid was over 50 times, with Yunnan having the highest tripping rates, accounting for 23.3% of the total number in the Southern Power Grid jurisdiction [2]. Wildfire remains one of the primary causes threatening the safe and stable operation of transmission lines.
Analyzing the breakdown characteristics and discharge mechanisms of air gaps under wildfire conditions is essential for transmission line risk assessments and early warnings. As shown in Table 1, experimental simulations using conductor–plate configurations and woodpile fires enable the preliminary replication of wildfire scenarios, allowing for the measurement of breakdown voltage and leakage current under varying conditions. However, key microscopic parameters such as charged particle distribution and electric field strength, which are difficult to observe experimentally, can be effectively analyzed using numerical simulation methods.
This paper reviews the current research on gap breakdown characteristics and discharge mechanisms under simulated wildfire conditions, both domestically and internationally, and emphasizes their applicability and limitations relative to real-world transmission line environments. Then, it looks ahead to future research on constructing realistic experimental platforms that simulate composite environmental factors. The aim is to achieve comprehensive parameter measurements and multi-physics coupling gap discharge models.

2. Materials and Methods

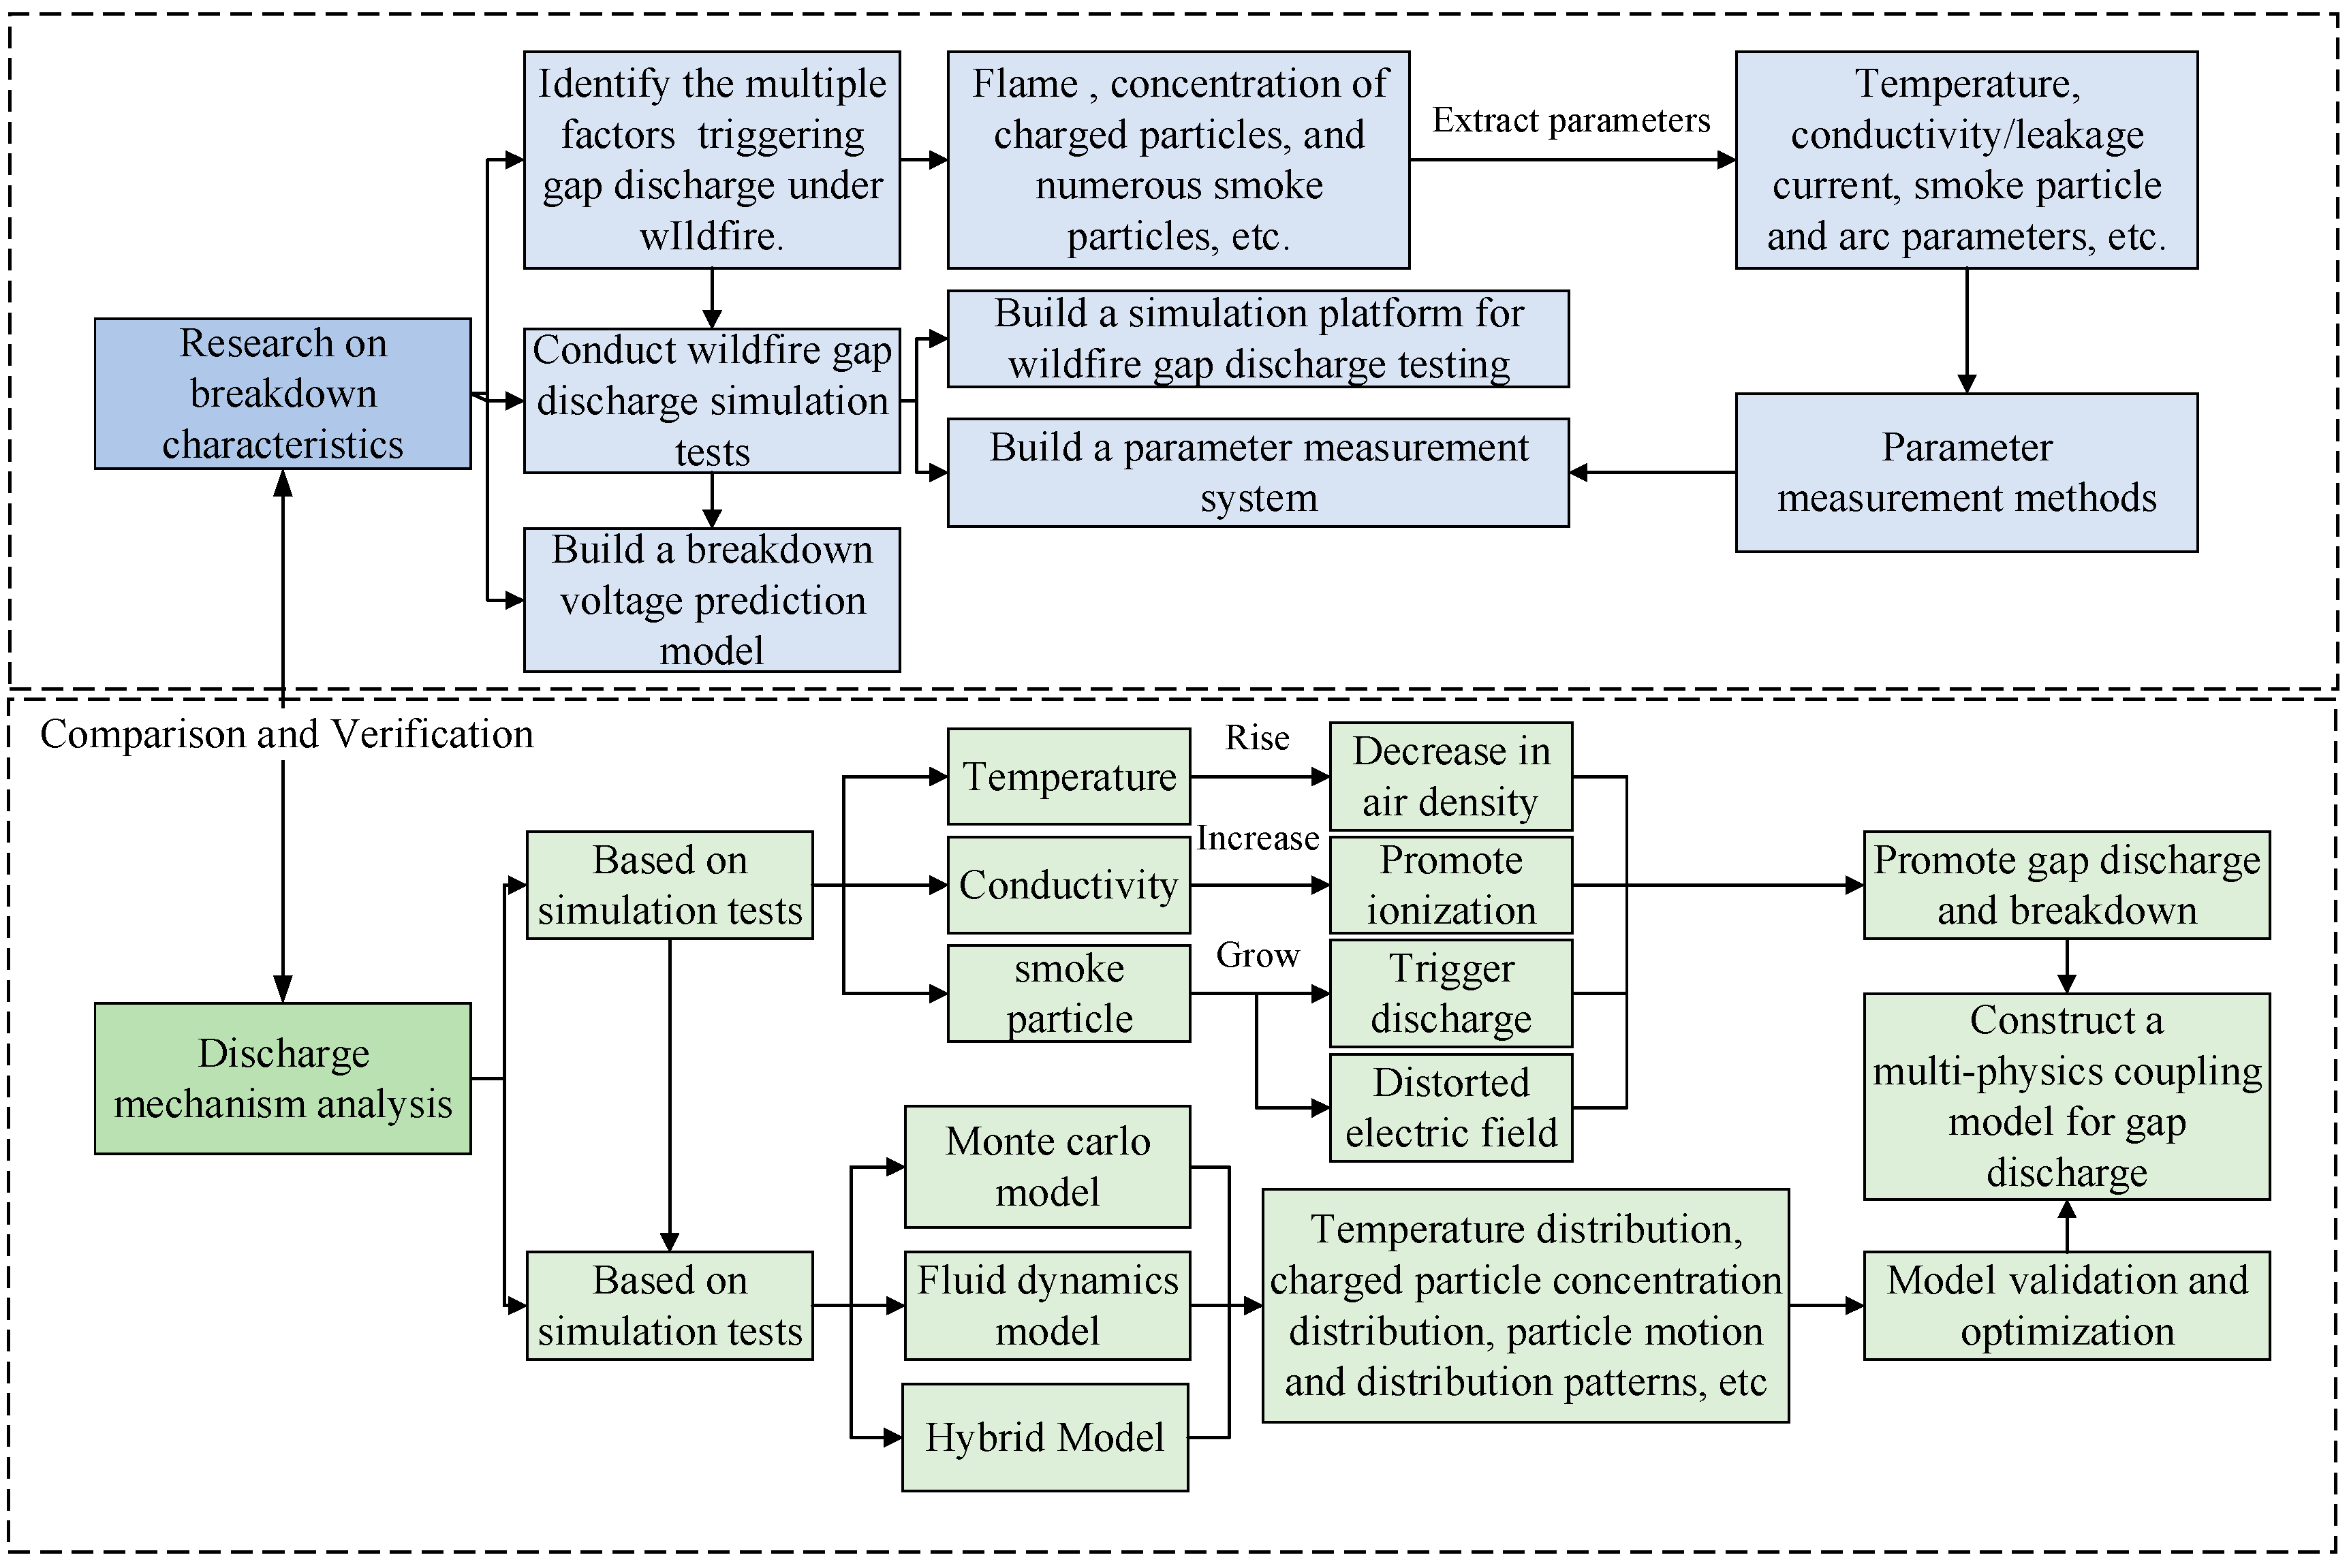
2.1. Research on Breakdown Characteristics

2.1.1. Analysis of the Factors Affecting Power Line Tripping Caused by Wildfires

Figure 1 shows the primary research approach for gap breakdown characteristics and discharge mechanisms under vegetation fire conditions. Due to the high cost, long duration, and poor repeatability of conducting large-scale wildfire breakdown characteristic tests on actual transmission lines, current research mainly focuses on simulating wildfire gap conditions.
The gap breakdown characteristics of transmission lines under wildfire conditions involve numerous and complex influencing factors, with each factor being highly coupled and interacting synergistically in the discharge process of the flame gap [3]. Based on the research outcomes of domestic and international academic teams, key influencing factors have been summarized, including temperature, conductivity, and smoke particles. Some researchers have also conducted numerous experiments focusing on factors such as vegetation type, wind speed, slope, and altitude [4,5,6].

2.1.2. Parameter Measurement Methods

In response to the above-influencing factors, the physical parameters involved in wildfire simulation experiments include temperature, conductivity, smoke particle parameters, and arc parameters.
  • Temperature measurement
Thermocouples are commonly used for temperature measurements in wildfire simulation experiments. Lu Wei and others conducted combustion characteristic experiments on common vegetation types in transmission line environments, using K-type, armored thermocouple trees to collect temperature data at different flame heights. The maximum temperatures recorded for the combustion of 21 × 21 × 10 cm3 piles of cedar, pine, and eucalyptus were 747 °C, 719 °C, and 687 °C, respectively [7]. The thermocouple temperature measurement is a common contact-based method. In recent years, non-contact temperature measurement techniques have developed rapidly. These methods do not physically contact the measured temperature field, avoiding interference. They offer advantages such as non-invasiveness, fast response times, high-resolution, and real-time measurements, making them promising methods for application in high-voltage breakdown tests. Table 2 compares the advantages and disadvantages of thermocouples with several non-contact temperature measurement methods.
2.
Conductivity Measurement
The measurement of conductivity also involves the collection of leakage current. Measurement methods include microwave measurement and local average conductivity, among others.
Lu Wei et al. conducted conductivity characteristic experiments under high-risk vegetation fire conditions. They collected leakage current using a sampling resistor module, data acquisition card, and PC-based system. They found that the local conductivity of the fir pile flames was approximately 30 μS/cm, with conductivity decreasing as the flame height increased [7]. Due to its low-temperature weak plasma, the local conductivity of flames can also be measured using laser interferometry, which offers high spatiotemporal resolution. This method allows for the plasma refractive index, electron density, expansion evolution profile, and expansion velocity, among other state parameters, to be determined. A Mach–Zehnder interferometer splits a laser beam into two coherent beams using a beam splitter. One beam serves as the reference light, and the other interferes with the probe light that passes through the plasma to be measured, with the resulting image captured by a CCD camera. The phase changes in the plasma are extracted from the interference pattern obtained, and the spatial refractive index of the plasma is obtained using Abel transform. Local conductivity and other microscopic parameters can be diagnosed based on the intrinsic relationship between the refractive index and plasma [8].
3.
Smoke Particle Parameter Measurement
Smoke particle parameters include smoke concentration, particle size, and the particle charge-to-mass ratio.
Particle concentration can be measured using smoke sensors or lidar monitoring systems. Yang Nongchao et al. studied the effect of vegetation combustion smoke on the gap breakdown strength under voltages of 10–35 kV. They installed a smoke sensor 1 m above the conductor to analyze the effects of smoke alone [9].
Smoke, as an aerosol, undergoes Mie scattering and attenuation when laser light strikes its surface, generating optical signals that reflect the physical state of smoke. These signals are then converted to electrical signals to calculate smoke concentration [10]. Liu Xinyang et al. designed an experimental platform for measuring smoke concentrations composed of a pulsed laser emission system, smoke chamber, and pulsed laser reception system. They tested the scattering characteristics of four typical types of smoke, including beechwood and incense, and used the Winner318 laser particle size analyzer to measure the smoke particle size distribution [11].
The particle charge-to-mass ratio refers to the ratio of the charge carried by the particle to its mass. Wang Ziming et al. built an experimental platform with which to measure the particle charge-to-mass ratio. The equipment for measuring the particle charge includes a Faraday cup and a high-precision charge meter, while the particle mass is measured using a high-precision electronic balance. The measured charge-to-mass ratio for 20-mesh particles showed the slightest relative error of 16.96% compared to the theoretical value, demonstrating a higher measurement accuracy for larger particles [12].
Table 2. Comparison of various temperature measurement methods.
Temperature MeasurementPrincipleStructureAdvantagesDisadvantages
ContactThermocouple, thermistor, and expansion thermometer [13]Using temperature measurement elements in direct contact with the object to be measured, reaching thermal equilibrium.Energies 18 01946 i001
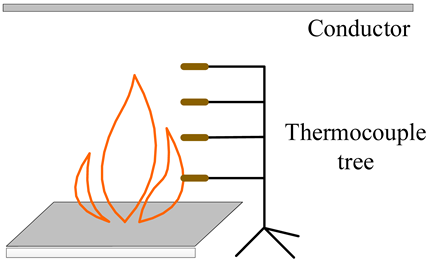
Simple structure, easy to use, highly reliability, and can directly obtain the variation curve of flame temperature with time and height.Interference with the measured flow field achieved, slow response speed, and not suitable for transient temperature measurement.
Non-contactAcoustic method [14]The propagation speed of sound waves in a medium is functionally related to its temperature and type.Energies 18 01946 i002The response speed has been improved.Easily affected by dust, particulate matter, and airflow.
Infrared radiation [14]Identifying and measuring the thermal radiation spectrum of an object.Energies 18 01946 i003Fast response speed, high resolution, and capable of providing 2D and 3D flame temperature distributions.Unable to provide dynamic monitoring of the measured object and work in rainy conditions.
Holographic interference [15,16]Using light interference passing through the measured medium, the temperature distribution is obtained by processing recorded light information.Energies 18 01946 i004
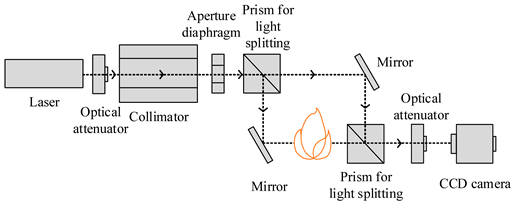
Suitable for quantitative and qualitative measurements of dynamic objects in real-time measurement.Includes optical instruments with complex experimental setups for measuring 3D turbulent flames.
4.
Arc Parameter Measurement
Arc parameters include electrical, morphological, and microscopic parameters. Electrical parameters include the discharge initiation phase flow path and the electric field distribution at the arc head. Morphological parameters include the arc radius, development speed, length, and offset angle. Microscopic parameters include the density distribution of charged particles within the flame and their dynamic evolution.
Currently, the focus on arc parameters is mainly concentrated on their macroscopic morphological characteristics, primarily recorded by cameras. Using ICCD cameras with nanosecond shutter speeds, the morphology of the flowing arc can be captured, and the development rate of the arc can be estimated [17]. Many high-speed cameras available on the market can meet the experimental requirements for studying the arc path in vegetation fire gap breakdowns. In addition to using ICCD cameras, relevant scholars have also measured the development speed of the flow arc using photomultiplier tubes (PMTs) and scanning cameras. Grangel calculated the average development speed of the dry air gap flow arc at atmospheric pressure by analyzing the signal time differences collected at different locations using a PMT. The resulting speed is typically on the order of 0.01 mm/ns [18]. Sigmond used scanning camera technology to study the flow discharge speed of a needle-plate electrode gap of 0.5 cm and 1 cm, finding that the flow speed gradually slowed as it moved from the needle electrode toward the plate electrode, eventually reducing to 1.4 mm/ns when it contacted the plate electrode [19]. Existing research mainly focuses on measuring the flow arc development speed in short gaps in pure air and has not profoundly discussed the impact of firelight in the gap on the detection efficiency of photodetectors. Therefore, the direct application of ICCD cameras to arc observation in simulated wildfire environments has limitations.
Flow discharge’s electric field strength measurement tends to use optical field sensors based on the electro-optic effect. Hidaka from the University of Tokyo developed a sensor utilizing the Pockels effect to measure the electric field of positive flow discharge in a 10 cm needle-plate gap [20,21]. The research team from Tsinghua University developed a photodetector sensor based on the Mach–Zehnder interference principle to measure the spatial electric field of flow discharge. However, when the flow channel extends near the sensor, oscillations in the detected electric field occur, indicating that optical field sensors still have limitations in measuring the internal electric field of the flow discharge [22,23].
Currently, the development direction of parameter measurement technology is mainly used to meet the demands of high detection accuracy, multi-environment adaptability, and cost-effectiveness. Under simulated wildfire conditions, environmental factors include high flame temperature, strong spatial electric fields, and abundant ash smoke. Regarding the measurement of macro parameters such as temperature, conductivity, and smoke, traditional close-contact parameter measurement systems require high standards for equipment’s high-temperature resistance, insulation performance, and dust prevention measures. On the other hand, constructing a remote non-contact measurement system involves considering the overall layout of the experimental platform and space utilization, which increases the design complexity and cost. There are limited methods for measuring microscopic parameters such as charged particle concentration, arc development speed, and background electric field strength, and there is a lack of cases applied to simulated experiments.

3. Results

3.1. Breakdown Characteristic Experiments

Foreign studies on the breakdown characteristics of wire-to-ground gaps under simulated wildfire conditions began early, as shown in Table 3. The applied voltage types include both AC and DC conditions, and the gap distances range from centimeter-level short gaps to several meters in scale in the simulated full-scale tests. However, early simulated breakdown tests considered relatively few influencing factors, had limited testing methods, and exhibited poor reproducibility of the test fire sources. As a result, the average breakdown voltage values obtained by different scholars have varied significantly.
The teams from Wuhan University and the University of Science and Technology of China have conducted extensive research on the breakdown characteristics of gaps under simulated wildfire conditions, considering factors such as flame temperature, high conductivity, numerous smoke particles, wind speed, slopes, and other terrain influences. Table 4 summarizes the simulated wildfire gap breakdown tests conducted by different research teams, addressing gaps of various scales and influencing factors. Significant progress has been made in monitoring changes in breakdown voltage and leakage current, arc breakdown paths, and altitude corrections. These advancements have provided a wealth of reference data for further understanding the gap discharge mechanism.
Based on the above research, it is evident that the primary method for studying the breakdown characteristics of transmission line gaps under wildfire conditions remains the simulation of wire-to-ground gaps and the generation of vegetation fires using vegetation stacks. However, the vegetation stacks arranged in a regular, equal-volume pattern neglect the impact of the actual growth shape of tree canopies on flame characteristics and discharge properties, such as the conical shape of mature fir trees and the pagoda-like shape of pine trees. Different canopy shapes and vegetation densities shield the electric field beneath the lines, affecting the surrounding electric field distribution [39,40]. At the same time, the current experimental platforms cannot meet the real-time multi-parameter observation requirements during the gap discharge process in actual wildfires. This undoubtedly increases the overall test volume and makes acquiring and analyzing more parameters concurrently under the same operating conditions challenging. There is still a lack of effective variable control methods for smoking concentration, particle size, and the gap-bridging ratio. The mechanisms of environmental wind speed, complex terrain slopes, and different altitudes that affect gap breakdown characteristics still require further study. Large-scale simulated tests for transmission line gap distances under higher voltage levels, such as UHVDC and UHVAC, are relatively rare. This makes providing adequate data support and guidance for insulation failure risk assessment and dynamic defense work for UHV transmission lines under wildfire conditions difficult.

3.2. Breakdown Voltage Prediction Model

As shown in Table 5, scholars have proposed empirical or semi-empirical formulae for the breakdown voltage of gaps under wildfire conditions based on various simulated experimental data and numerical simulation results both domestically and internationally [41].
Model validation and error estimation are critical steps in constructing breakdown voltage prediction models, serving as key references for assessing model accuracy and applicability. Common validation methods include comparing experimental data and analyzing real transmission line case studies. Models are refined based on prediction outcomes, and targeted follow-up studies are conducted to improve their completeness and accuracy. The prediction model developed by Li Peng et al. achieved errors within 7.8% between predicted and measured values under different vegetation types and heights. This model was preliminarily applied to 220 kV and 500 kV systems with gap lengths of 6.5 m and 11 m, respectively, but it could not predict breakdown conditions dominated by herbaceous vegetation ash [34]. Shao Youguo et al. proposed a prediction model incorporating flame zoning and particulate corrections and applied it to 1000 kV UHV and 500 kV EHV cases. They found that UHV systems were more susceptible to inter-phase breakdown under the same smoke concentration compared to EHV systems [44].
These theoretically derived breakdown voltage models often fail to fully account for the correction effects of various influencing factors or validate the model while neglecting specific variables. Consequently, their applicability to predicting wildfire-induced tripping probabilities on real transmission lines remains limited.
Many studies have considered breakdown voltage prediction under high temperature, conductivity, smoke particles, and correction factors for different vegetation types. The breakdown voltage prediction formulae proposed within the context of their respective experiments offer some reference value for specific conditions. However, the transmission line corridor in an actual wildfire environment, in addition to the above factors, also includes real-time varying micro-meteorological data, such as environmental wind speed, precipitation, and humidity, as well as the complex terrain of specific regions, such as slope, slope orientation, and unique topographical features, all of which must be considered for their impact on the gap breakdown voltage. At the same time, the many influencing factors involved in the transmission line tripping process triggered by wildfires are interrelated. While prediction models built under independent conditions of each factor show good consistency in experimental studies, they are challenging to apply to actual line-tripping warnings under wildfire conditions. Therefore, constructing breakdown voltage prediction models under the influence of various factors requires a balance between comprehensiveness and coupling.

3.3. Discharge Mechanism Analysis

3.3.1. Mechanism Analysis Based on Simulated Experiments

Based on simulated experimental data and the derivation of breakdown prediction models, combined with the theoretical analysis of extended air gap discharge under uneven electric fields, scholars both domestically and internationally have proposed three basic theoretical models that consider the decrease in air density, the increase in flame conductivity, and particle-triggered discharge, as shown in Table 6, to reveal the discharge mechanism of gaps in vegetation fires.
  • Flame Temperature
From a macroscopic perspective, according to the ideal gas law, under constant pressure conditions, the high temperature of the flame continuously heats the gas in the gap, causing the gas volume to expand and the relative density of the gas to decrease, which is closely related to the breakdown voltage of the gap. You Fei et al. [49] studied the breakdown characteristics of a cedar pile fire under high-voltage power frequency, comparing the effects of high temperature and the addition of KCl to promote ionization on the breakdown voltage. They found that the decrease in air density due to the high temperature was the main reason for the reduction in gap insulation strength. Zhou Enze et al. [6], based on wildfire simulation breakdown test data at different altitudes, found that the effect of air density on flame gap insulation strength decreases with increasing altitude. The air density of the gap is also affected by the environmental altitude.
From a microscopic perspective, the high temperature of the flame affects the chemical reaction rate during vegetation combustion, the number of charged particles, and the development rate of the discharge in the arc. Feng Jing et al. developed a plasma microscopic numerical simulation model based on chemical–fluid dynamics to study the effect of flame gap temperatures of 293.15 K, 473.15 K, 673.15 K, and 873.15 K on discharge development. They found that at the exact moment when the maximum temperature was 873.15 K, the high electron density region advanced to a distance of 4 mm from the sample. In comparison, at 293.15 K, the high-electron-density region only advanced to 1.8 mm from the anode. Further calculations of discharge development rates revealed that at 873.15 K, the average development rate of the discharge could reach 0.427 mm/ns, which is an increase of 39% compared to normal temperature conditions [47].
Under the influence of a high flame temperature, the decrease in air density and the increased ionization of microscopic, charged particles promote the development rate of discharge in the gap, ultimately forming a discharge arc that threatens the insulation performance of the transmission line gap.
2.
Conductivity
Many charged particles are generated during vegetation combustion through ionization and chemical reactions. These particles are influenced by flame convection and electric fields and enter the flame channel. This is macroscopically reflected by flame conductivity. These positive and negative ions converge into the discharge channel, providing the conditions for penetration.
In simulation experiments, the leakage current is an essential physical quantity reflecting flame conductivity. Huang Daochun et al. [30] observed the leakage current waveforms of three types of vegetation flames: straw, reed, and fir branches. The combustion-related chemical reactions in fir branches were the most intense, with a leakage current peak value of 27 mA, which is much higher than the other two vegetation types, and its breakdown voltage was also the lowest. Lu Wei et al. [7] studied the leakage current waveforms of multiple high-risk vegetation flames and found that their changes were consistent with flame morphology. This indicates that flame conductivity is almost synchronized with the intensity of combustion. At the peak of the fire, it has high conductivity, making it highly susceptible to gap discharge.
3.
Smoke Particles
Due to the incomplete combustion of forest vegetation, the flame gap is filled with ash and particles. On the one hand, these particles can form particle chains that short-circuit the gap, increasing the risk of discharge during the non-bridging phase of the flame; on the other hand, the presence of particles distorts the electric field, forming localized substantial spatial charges, which promote the development of the discharge channel, eventually leading to gap discharge breakdown.
Yao Wenjun et al. from the Huazhong University of Science and Technology described the development process of the discharge channel in the presence of particles in the gap. The front of the discharge channel approaches the particles, and under the influence of the electric field at its head, the polarization of the particles is enhanced. The interaction with charged particles in the field causes the surrounding environmental electric field to distort. These particles also occupy space for electron avalanche development, revealing a competitive relationship between the two. The development of the discharge channel also depends on the particle size, with the channel containing particles of the same size or developing branches on the surface of larger particles [46].
The mechanism analysis based on simulation experiments primarily relies on theoretical models and experimental data to reveal the intrinsic coupling relationships between flame temperature, conductivity, smoke particles, and other environmental factors and physicochemical phenomena. However, due to the limitations of experimental conditions, there is still significant difficulty in conducting mechanism analysis for physical quantities that cannot or are difficult to be directly measured by experimental methods.

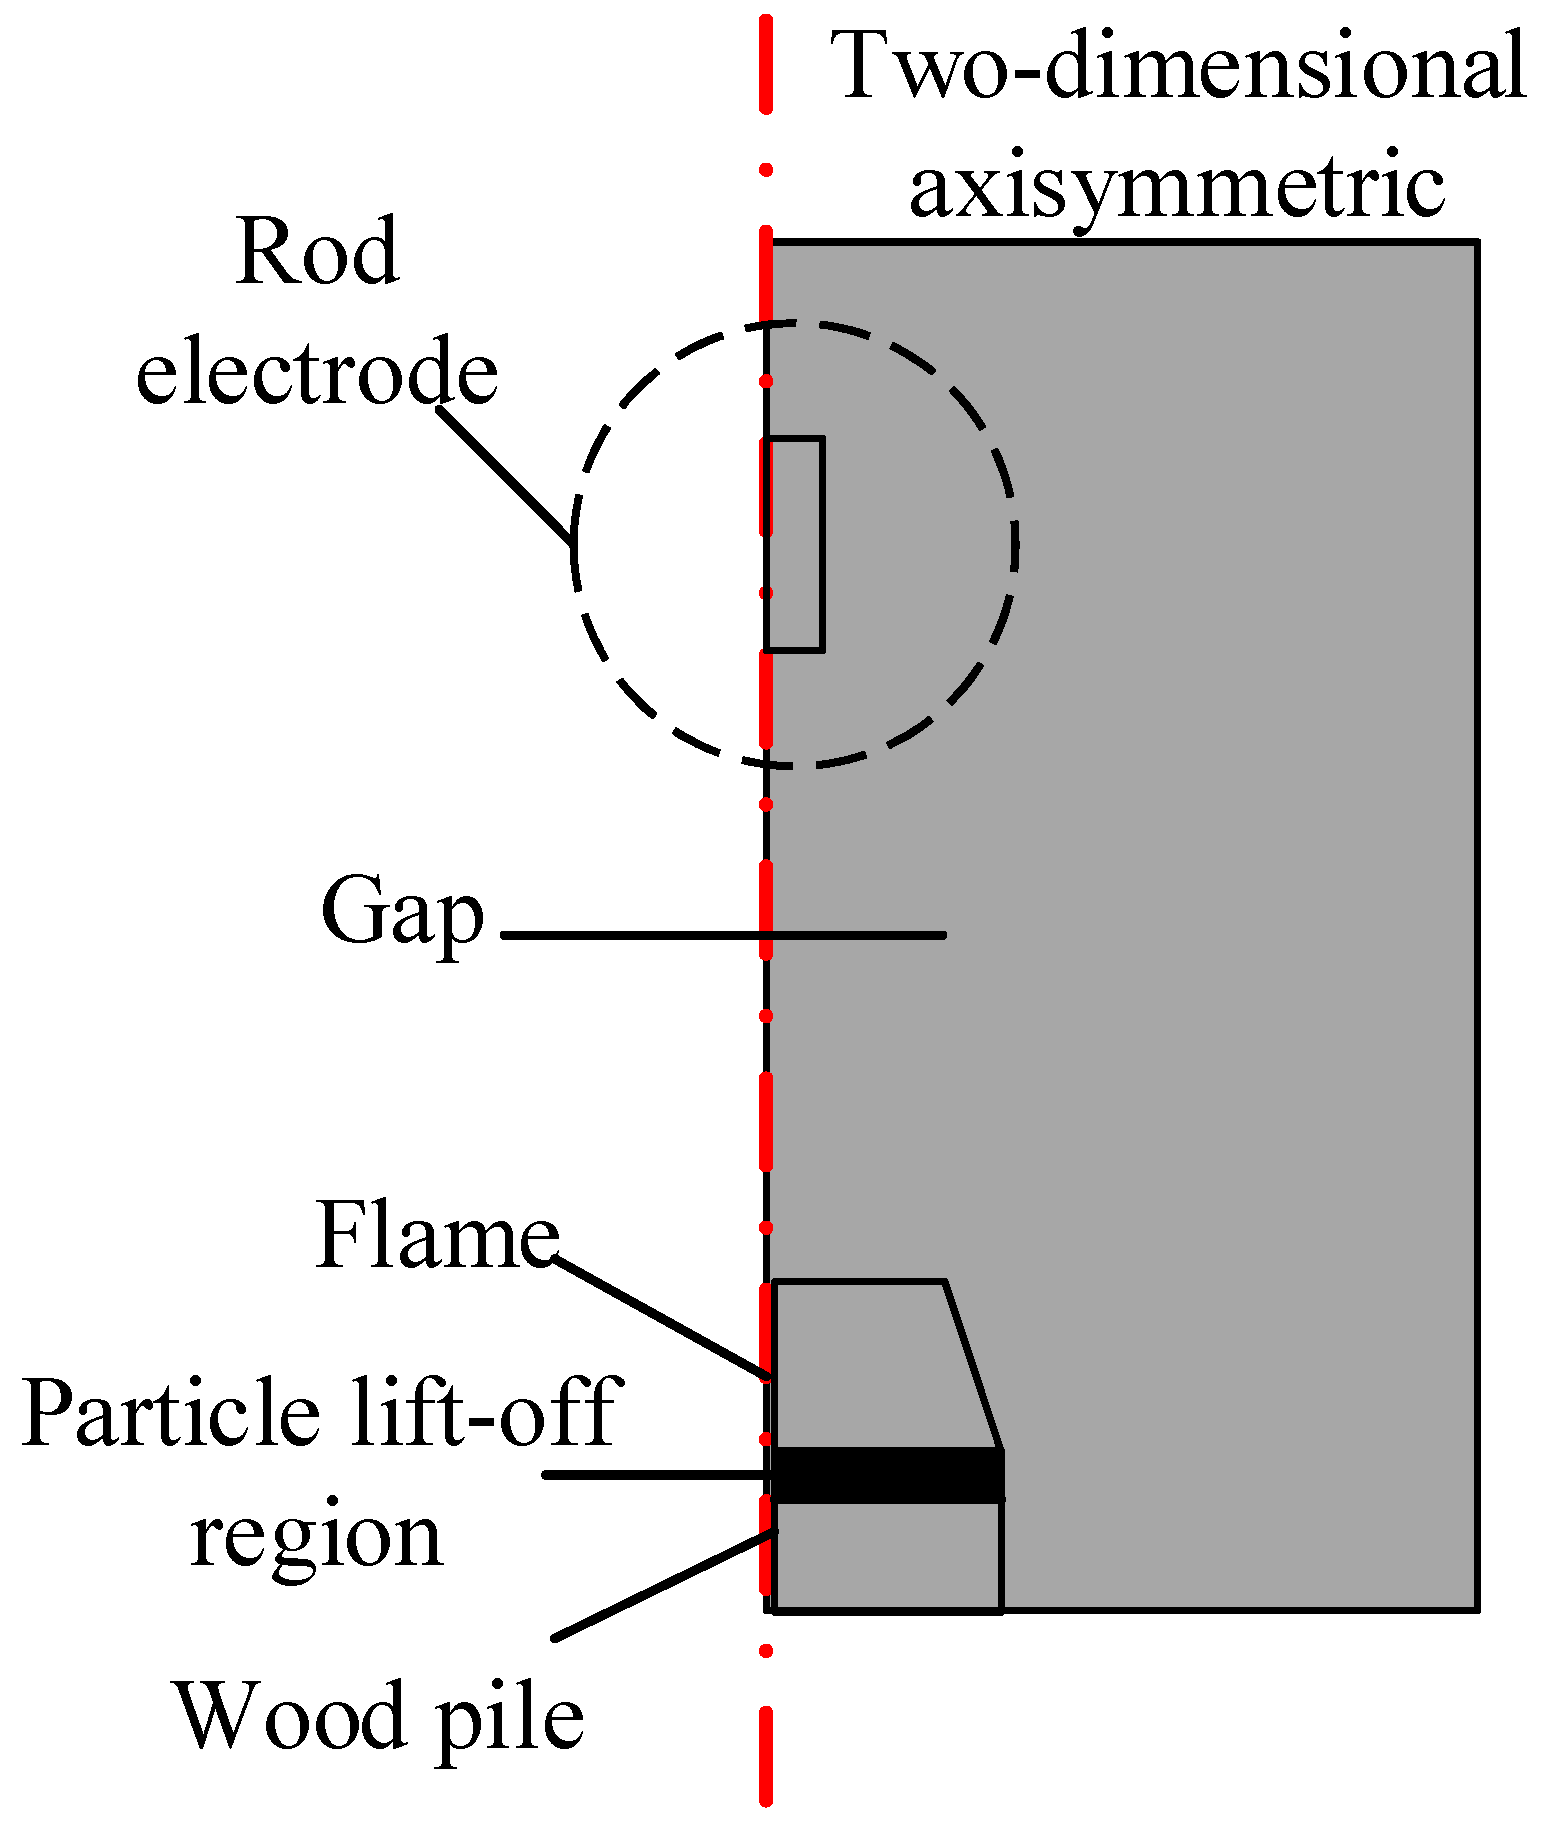
3.3.2. Mechanism Analysis Based on Numerical Simulation

The discharge channel is regarded as low-temperature plasma and is the main process of gap discharge. The development of gap discharge to break down under wildfire conditions is accompanied by various physical phenomena such as multiphase heat transfer, mass transfer, photoelectric effects, and complex chemical reactions, making it a typical multi-physics coupling problem. Its coupling relationships are shown in Figure 2.
Three types of plasma discharge models have been proposed to address the coupling of multiple physical fields: the Particle-in-Cell/Monte Carlo Collision (PIC/MCC) model, the fluid dynamics model, and the hybrid model.
  • Particle-in-Cell/Monte Carlo Collision (PIC/MCC) Model
This model is a key theoretical tool for studying streamers and other plasmas. It combines Particle-in-Cell (PIC) technology with Monte Carlo Collisions (MCCs) to simulate discharge streamers and can describe the motion of individual simulated electrons in the discharge process in real time. Y. Wang et al. conducted numerical simulations using a three-dimensional Particle-in-Cell/Monte Carlo Collision (PIC-MCC) model. Based on the assumptions of the field enhancement factor and field emission mechanism, they systematically analyzed the nanosecond pulsed breakdown characteristics of nitrogen spark switches at atmospheric pressure [50]. Numerical investigations of the plasma system were carried out by Z. Chen et al. using a 2D3V (two-dimensional, three-velocity-component) Particle-in-Cell model integrated with Monte Carlo Collision processes (PIC-MCCs). The temporal sampling of plasma and electromagnetic field distributions enabled the extraction of detailed information regarding the internal evolution of the plasma jet and the localized enhancement of electric fields [51].
However, this model has a significant drawback: it requires substantial computational resources and has a long convergence time, making it difficult to apply widely [52,53].
2.
Fluid Dynamics Model
Baisen Lin and others from the South China University of Technology established a multi-physics coupling simulation model involving the electric field, thermal field, fluid field, chemical field, and particle motion to analyze the breakdown mechanism of air gaps under AC and DC conditions influenced by smoke particles. Compared to DC conductors, the percentage of smoke components entering the AC conductor detection area was 34.1% higher, and the smoke bridging percentage was 45% higher, increasing the likelihood of gap breakdown. This study examined the inherent mechanism of air gap electric field distortion at the microscopic level, providing theoretical support for revealing the breakdown process of transmission line gaps under wildfire conditions [54].
Jiang Wenquan from Hunan University established an arc discharge model to study the effects of high temperature and particulate matter on gap discharge. A two-dimensional axisymmetric model was chosen for the simulation. The data provided by the LXcat database [55] were directly used in the study. The discharge characteristics of the gap were studied under the effects of high temperature, particles, and the combination of high temperature–particle influence.
Pu Ziheng and others simulated the temperature distribution of the straw flame gap, the force analysis of burning particles, and the motion distribution based on existing experimental data [56]. A two-dimensional axisymmetric model, as shown in Figure 3, was adopted to simplify the calculations and facilitate convergence. The vegetation stack and the flame body were simplified as a cylinder and a frustum of a cone, respectively. The microscopic reasons for the particles moving away from and being absorbed by the electrodes were explained, and a criterion for determining whether the electrodes absorb particles was proposed by calculating the critical charge-to-mass ratio. The chemical reaction equations were further considered, simulating the effects of positive and negative polarity DC voltages on the flame morphology and particle concentration during the combustion of the wood stack. The intrinsic causes of positive and negative polarity DC voltages affect the temperature, height, and morphological changes in the vegetation flame, and the concentration of charged particles was revealed from a microscopic mechanism perspective [57].
Wang Ziming and others developed the saturation charge and charge-to-mass ratio of graphite particles with three different mesh sizes based on the particle charge-to-mass ratio and established a coupled simulation model for the temperature field, fluid field, particle dynamics field, and electric field. They studied the particle distribution patterns and electric field distortion characteristics under different charge states and particle sizes, as well as the synthetic field strength distribution curves of a single-flame “unimodal” (without considering space charge density) and “bimodal” (with space charge density) model. They also analyzed the discharge characteristics with the lowest insulation strength in the gap during a single oscillation cycle. Their flame turbulence model simultaneously considers the effects of a low Reynolds number flow and a vortex correction model, which can represent the phenomenon of vortex flames in the flame body [12].
However, multiple simplifications were made during the model construction process, such as assuming particles that have saturated charge, neglecting differences in particle shapes, and treating them all as spherical. Furthermore, the impact of factors such as wind speed and slope in the actual wildfire environment was not considered, so the simulation results needed further refinement.
3.
Hybrid Model
The hybrid model is an improved model proposed by researchers based on the study of the stream discharge theory and the mechanism of gap discharge.
Farouk et al. proposed a fluid dynamics model that incorporates the Boltzmann electron equation, which combines the advantages of the particle/Monte Carlo model and traditional fluid dynamics models, achieving a balance between solution speed and computational accuracy [58]. Li and Ebert et al. divided the development space of the flow discharge into regions. In the flow channel area with intense ionization and low-field strength, they used a fluid dynamics model to describe the process, while in the region where the flow discharge was not reached, with lower electron density, the Monte Carlo model was more appropriate. At the boundary between these two regions, both models needed corrections to accurately describe the flow discharge development process [59].
However, the application cases of this hybrid model are limited, and its application environment is constrained, requiring further optimization in future research [60,61,62,63].
In conclusion, numerical simulation methods can partially compensate for the limitations of observing microscopic physical parameters in wildfire discharge simulation experiments. Analyzing parameters such as changes in charged particle concentrations, electric field distributions, and the motion trajectories and distribution patterns of particles in the discharge gap helps reveal the mechanisms of gap discharge [64,65]. Among them, numerical simulation methods using fluid dynamics models as the modeling approach are relatively mature and widely applied. However, existing research mostly uses rod-to-plate or sphere-to-plate two-dimensional axisymmetric models to simulate the uneven field discharge environment of actual power transmission lines to the ground. In the current advancement of large-scale gap discharge experiments, there is a lack of numerical simulation validation for long gap scales [66]. There is insufficient research on establishing numerical simulation models that closely reflect the actual transmission line corridor environment and meet the requirements for convergence and accuracy, as well as on the mechanisms of the inherent coupling effects of factors such as temperature, charged particle concentration, and particles [67].

4. Discussion

In summary, domestic and international research has extensively studied the breakdown characteristics of air gaps in transmission lines under wildfire conditions and developed gap breakdown voltage prediction models suitable for various wildfire scenarios. However, the current research on gap breakdown characteristics under wildfire conditions primarily relies on breakdown simulation experiments with limited experimental conditions. Domestic and international studies lack experimental data for gap distances of 9 m or more, which hinders their ability to provide references for large-scale gap line breakdown risk assessments under complex terrain and meteorological wildfire conditions.
Therefore, considering the need for improved temperature measurement methods that can capture discharge arc parameters and simulate the complex geographical conditions of actual transmission lines, the future development of a simulation experiment platform that closely aligns with the actual transmission line corridor environment, incorporating multi-parameter measurements and conducting in-depth numerical simulation considering climate and terrain factors, is envisioned.
1. The theoretical models with which to determine various influencing factors are independently scattered. The breakdown of transmission line gaps under wildfire conditions results from the coupling of multiple influencing factors. Domestic and international studies often consider single influencing factors. It is recommended that the coupled mathematical relationships of multiple wildfire characteristic parameters be studied, a discharge mathematical model for transmission lines under wildfire conditions based on multi-factor interactions be established, and measured data for correction be used to improve the accuracy of breakdown voltage predictions.
2. There are few simulation experiments on the long-gap AC and DC discharge characteristics of actual transmission lines under flame conditions. The review summarizes many small-scale simulation experiments, mostly at the centimeter level and below 4 m. Establishing a long-gap, multi-parameter real-time monitoring, and multi-variable, effectively controllable composite functional simulation experiment platform is urgently needed. This platform can conduct simulation tests closer to the actual transmission line corridor environment, providing practical reference data and conclusions for guiding insulation failure risk assessments and dynamic defense work for ultra-high voltage transmission lines under wildfire conditions.
3. Research on arc morphology and discharge parameters during the discharge process needs further investigation. Currently, high-speed cameras can be used to capture the macroscopic shape and direction of the arc during discharge, and multi-physics coupled fluid dynamics models can be constructed to simulate the changes in microparameters, such as local electric field strength, arc radius, and development rate, during the development of discharge streamers to analyze their mechanisms. However, there is still a lack of intuitive observational methods with which to capture the guiding effect of ash particles on the arc. Furthermore, numerical models constructed to meet the requirements of computational convergence and simplified analysis processes still cannot accurately simulate the complex and variable meteorological and topographical environments around actual transmission lines. For example, the effects of wind speed on arc path deviation and the influence of particle movement and distribution on guiding the arc path remain unclear, leaving significant room for further research.

5. Conclusions

1. Research on breakdown characteristics still mainly relies on conducting simulated gap breakdown experiments under wildfire conditions. Factors such as high flame temperature, high electrical conductivity, and dense smoke particles have always been the focus of experimental research. In addition, independent experiments have been conducted on various factors, including heat release rates and combustion calorific values, vegetation types, wind speed, and slopes. This also requires higher demand for the experimental platform’s measurement system, which must be capable of handling multi-parameter, high-precision, and fast-response measurements. Comprehensive and accurate data collection from experiments is a prerequisite for reducing errors in the breakdown voltage prediction model. In simulated experiments, considering the coupling of multiple influencing factors and constructing a breakdown voltage prediction model with correction factors for each influencing factor is essential to effectively guide insulation failure risk assessment and dynamic defense measures for ultra-high voltage transmission lines under wildfire conditions.
2. The mechanism analysis based on simulated experiments primarily relies on three fundamental theoretical models: the decrease in air density, high flame conductivity, and particle-triggered discharge, combined with simulation experiment data to analyze the discharge mechanism of flame gaps. Progress has been made in studies on coupling decreases in air density with altitude factors, coupling high-flame conductivity with chemical reactions, and the interaction between smoke particles and streamer discharge. However, due to limitations in experimental conditions, many microscopic physical quantities are difficult to observe directly, hindering the ability to conduct more in-depth mechanism analysis.
3. Mechanism analysis based on numerical simulation transforms flame gap discharge into a multi-physics coupling problem, constructing simulation models to study the microscopic physical parameters during the discharge process, which, to some extent, compensates for the limitations of observing microscopic physical parameters in wildfire discharge simulations. Among these, the numerical simulation method based on fluid dynamics models is relatively mature and widely applied, which may be the most accurate and applicable model for gap discharging simulations under mountain fires, especially considering temperature, conductivity, and ash. However, there is a lack of numerical simulation validation for long-gap breakdown experiments. There is insufficient research on the inherent coupling mechanisms of temperature, charged particle concentrations, and particle matter when establishing a simulation model closely resembling the actual transmission line corridor environment.

Funding

This research was funded by the National Natural Science Foundation of China, grant number 51677138.

Conflicts of Interest

The authors declare no conflict of interest.

References

  1. He, C.; Shu, L. Study on Environmental Characteristics of High Voltage Line Trip Caused by Mountain Fire in Guangxi Region. Fire Sci. Technol. 2020, 39, 1626–1629. [Google Scholar]
  2. Zhou, E.; Gong, B. Statistics and Analysis on Tripping Fault of Overhead Transmission Lines Caused by Mountain Fires in China Southern Power Grids. Guangdong Electr. Power 2022, 35, 80–86. [Google Scholar]
  3. Zhou, Z. Research on Risk Assessment of Power Grid Transmission-Line Trips Due to Wildfire Disasters; North China Electric Power University: Beijing, China, 2019. [Google Scholar] [CrossRef]
  4. Li, P.; Ruan, J. Influence Factors Analysis of the Conductor-Plane Gap Breakdown Characteristic Under Simulation Forest Fire Condition. Trans. China Electrotech. Soc. 2018, 33, 195–201. [Google Scholar] [CrossRef]
  5. Long, M.; Huang, D. Influence of the Typical Vegetation Ashes/Particles on the Discharge Characteristics of Conductor-Plane Air Gap. Trans. China Electrotech. Soc. 2018, 33, 627–633. [Google Scholar] [CrossRef]
  6. Zhou, E.; Fan, L. Breakdown Characteristics of Conductor-plane Gap Under Vegetation Fire at the Altitude of 2013 m. High Volt. Eng. 2022, 48, 4316–4322. [Google Scholar] [CrossRef]
  7. Lu, W. Simulated Experimental Study on the Breakdown Characteristics of the Gap with High-Risk Vegetation Flame. Master’s Thesis, Wuhan University, Wuhan, China, May 2019. [Google Scholar]
  8. Wu, M. The Evolution of Gas Laser Al Plasma in the Background Interference Diagnosis Research. Master’s Thesis, Northwest Normal University, Lanzhou, China, May 2023. [Google Scholar] [CrossRef]
  9. Yang, N.; Yang, B. Experimental Research on Impact of Mountain Fire Smoke on Insulation of 10~35 kV Transmission Lines. Sichuan Electr. Power Technol. 2022, 45, 6–9. [Google Scholar] [CrossRef]
  10. Hu, C. Research on External Insulation Characteristics And Laser Lidar Monitoring System of Forest Fire in Transmission Line. Master’s Thesis, South China University of Technology, Guangzhou, China, 2016. [Google Scholar]
  11. Liu, X. Study on Smoke Concentration Measurement by Pulse Laser. Master’s Thesis, Beijing Institute of Technology, Beijing, China, January 2016. [Google Scholar]
  12. Wang, Z. Research on the Distribution Law of Charged Particles in the Insulation Gap and the Characteristic of Synthetic Electric Field Distortion under Mountain Fire. Master’s Thesis, China Three Gorges University, Yichang, China, May 2022. [Google Scholar]
  13. Ma, Q.; Zhang, R.; Wang, W. Research on Effect of Single Thermocouple’s Placement on Temperature Calibration for Fire Test. In Proceedings of the 2020 IEEE 2nd International Conference on Civil Aviation Safety and Information Technology, Weihai, China, 14–16 October 2020; pp. 996–1003. [Google Scholar] [CrossRef]
  14. Chen, Y.; Zhang, H. Two-dimensional temperature field measurement by laser interference based on fringes Fourier transformation. J. Univ. Sci. Technol. China 2020, 50, 832–838. [Google Scholar]
  15. Sun, Z. Research on Flame Temperature Based on Laser Interferometry. Master’s Thesis, North China Electric Power University, Beijing, China, April 2020. [Google Scholar] [CrossRef]
  16. Lin, T.; Deng, Y. Flame Temperature Measurement Based on Atomic Spectroscopy. J. Instrum. Anal. 2021, 40, 785–789. [Google Scholar]
  17. Jiang, W. Impacts of Forest Fire on Streamer Discharge of Transmission Line GAP. Master’s Thesis, Hunan University, Changsha, China, April 2019. [Google Scholar] [CrossRef]
  18. Grange, F.; Soulem, N. Numerical and Experimental Determination of Ionizing Front Velocity in a DC Point-to-Plane Corona Discharge. J. Phys. D Appl. Phys. 1995, 28, 1619. [Google Scholar]
  19. Sigmond, R.S. The Residual Streamer Channel: Return Strokes and Secondary Streamers. J. Appl. Phys. 1984, 56, 1355–1370. [Google Scholar]
  20. He, H.; He, J. On the Positive upward Leader in Response to Downward Stepped Leader in a 10 m Rod-to-Rod Long Air Gap. In Proceedings of the International Conference on Lightning Protection, New York, NY, USA, 25–30 September 2016. [Google Scholar] [CrossRef]
  21. Hidaka, K.; Fujita, H. A New Method of Electric Field Measurements in Corona Discharge Using Pockels Device. J. Appl. Phys. 1982, 53, 5999–6003. [Google Scholar] [CrossRef]
  22. Zeng, R.; Zhuang, C. Electric Field Step in Air Gap Streamer Discharges. Appl. Phys. Lett. 2011, 99, 221503. [Google Scholar] [CrossRef]
  23. Zeng, R.; Wang, B. Design and Application of an Integrated Electro-optic Sensor for Intensive Electric Field Measurement. IEEE Trans. Dielectr. Electr. Insul. 2011, 18, 312–319. [Google Scholar] [CrossRef]
  24. Chun, K.; Song, D.; Kim, K. Study on the Decrease in Air Dielectric Strength of DC Voltage According to the Ignition Properties of Combustibles. Appl. Sci. 2022, 12, 2216. [Google Scholar] [CrossRef]
  25. Ntshangase, Z.; Swanson, A.; Ijumba, N.M.; Britten, A.C. An Empirical Model of Fire-Induced Airgap Voltage Breakdown Characteristics Under HVDC Conditions. In Proceedings of the 2017 IEEE AFRICON: Science, Technology, and Innovation for Africa, Cape Town, South Africa, 18–20 September 2017; pp. 1283–1289. [Google Scholar]
  26. Robledo-Martinez, A.; Guzman, E.; Hernandez, J.L. Dielectric Characteristics of a Model Transmission Line in the Presence of Fire. IEEE Trans. Electr. Insul. 1991, 26, 776–782. [Google Scholar] [CrossRef]
  27. Fonseca, J.R.; Tan, A.L. Effects of Agricultural Fires on the Performance of Overhead Transmission Lines. IEEE Trans. Power Deliv. 1990, 5, 687–694. [Google Scholar] [CrossRef]
  28. Moreno, M. Performance of External Insulation in Presence of Flames Due to Sugar Cane Burning; CIGRE: Paris, France, 1985; CIGRE WG 33-07/10 IWD. [Google Scholar]
  29. Lanoie, R.; Mercure, H. Influence of Forest Fires on Power Line Insulation. In Proceedings of the 6th International Symposium on High Voltage Engineering (ISH), Xi’an, China, 21–26 November 2021; pp. 12–18. [Google Scholar]
  30. Huang, D.; Lu, W.; Yao, T.; Xia, J.; Quan, W. Study on Leakage Current Characteristics of Conductor-Plane Short Air Gap Under Vegetation Fire Condition. J. Electr. Eng. Technol. 2019, 34, 3487–3493. [Google Scholar] [CrossRef]
  31. Huang, D.; Lu, W. Influence of Typical Vegetation Ashes on DC Breakdown Characteristics of Conductor-Plane Air Gap. Power Syst. Technol. 2018, 42, 1668–1674. [Google Scholar] [CrossRef]
  32. Huang, D.; Chen, X. Breakdown Voltage of Conductor-Plane Gap Under Vegetation Fire Condition Considering Division of Flames. Power Syst. Technol. 2023, 47, 3467–3474. [Google Scholar] [CrossRef]
  33. Huang, D.; Zhou, S. ACAC Breakdown Characteristics of Overhead Transmission Line Phase-Ground Long Air Gap Under Vegetation Fire Conditions. Proc. CSEE 2024, 7, 373. [Google Scholar] [CrossRef]
  34. Li, P.; Ruan, J. Study on Breakdown Characteristic and Discharge Model of Conductor-Plane Gap Under Typical Vegetation Flame. Proc. CSEE 2016, 36, 4001–4011. [Google Scholar] [CrossRef]
  35. Yang, K. Simulative Experimental and Numerical Study of Wildfire Induced Breakdown of Transmission Lines. Master’s Thesis, University of Science and Technology of China, Hefei, China, May 2016. [Google Scholar]
  36. Zhou, E.; Rao, Z.; Liu, Q.; Huang, Y.; Xiang, Z.; Wang, H.; Huang, D. Breakdown Characteristics of Conductor-Plane Gap Under Typical High Risk Vegetation Fire Condition. High Volt. Appar. 2024, 60, 179–185. [Google Scholar] [CrossRef]
  37. Chen, X.; Wei, H. Study on the Influence of Flame Height on Gap Breakdown Characteristics of Transmission Lines. Electr. Power 2015, 48, 134–138. [Google Scholar]
  38. Wang, T.; Zhou, E. Influence Factor Analysis of Conductor-Plane Gap Breakdown Characteristic Under Vegetation Fire at High Altitude Condition. Guangdong Electr. Power 2024, 37, 70–76. [Google Scholar]
  39. Liu, H.; He, Z. Research of electric field characteristics of high-voltage overhead transmission lines adjacent to trees. Zhejiang Electr. Power 2023, 42, 70–78. [Google Scholar] [CrossRef]
  40. Wang, D.; Lu, T. Modelling and Characteristic Research of Total Electric Field Around Trees Near ±1100 kV UHVDC Transmission Lines. Power Syst. Technol. 2017, 41, 3441–3447. [Google Scholar] [CrossRef]
  41. Shu, S.; Liu, C.; Ruan, J. Review on Prediction Methods for Breakdown Voltage of Air Gap. High Volt. Appar. 2016, 52, 19–26+32. [Google Scholar] [CrossRef]
  42. Khan, I.; Ghassemi, M. A Probabilistic Approach for Analysis of Line Outage Risk Caused by Wildfires. Int. J. Electr. Power Energy Syst. 2022, 139, 108042. [Google Scholar] [CrossRef]
  43. Song, J.; Guo, C.; Zhang, J.; Wang, Y.; Sheng, K. A Probabilistic Model of Overhead Transmission Line Outage due to Forest Fire. Power Syst. Technol. 2013, 37, 100–105. [Google Scholar] [CrossRef]
  44. Shao, Y.; Li, H.; Zhao, J.; Zou, J.; Zhou, X.; Chang, Q. Study and Analysis of Breakdown Probability Model of UHV Transmission Line under Forest Fire Conditions. Electr. Meas. Instrum. 2018, 55, 31–35+42. [Google Scholar]
  45. Zhou, C. Numerical Simulation Study on the Influence of Wildfire on Gap Discharge of Transmission Line. Master’s Thesis, Chongqing University, Chongqing, China, June 2021. [Google Scholar] [CrossRef]
  46. Yao, W. The Research on the Characteristics of the Two-Phase Mixture Discharges under the DC Voltage. Ph.D. Thesis, Huazhong University of Science and Technology, Wuhan, China, November 2013. [Google Scholar]
  47. Feng, J. Study on Gap Discharge Mechanism of Power Transmission and Distribution Lines Under Different Wildfire Conditions. Master’s Thesis, Xihua University, Chengdu, China, April 2023. [Google Scholar] [CrossRef]
  48. Huang, D.; Li, P. Review on Discharge Mechanism and Breakdown Characteristics of Transmission Line Gap Under Forest Fire Condition. High Volt. Eng. 2015, 41, 622–632. [Google Scholar] [CrossRef]
  49. You, F.; Chen, H. Experimental Study on Flashover of High-voltage Transmission Lines Induced by Wood Crib Fire. J. Proc. CSEE 2011, 31, 192–197. [Google Scholar] [CrossRef]
  50. Wang, Y.; Li, J.; Li, C. The effects of field-enhancement factor on the nanosecond pulsed breakdown of nitrogen spark switch at atmospheric pressure with 3D PIC-MCC model. In Proceedings of the 2024 IEEE International Conference on Plasma Science (ICOPS), Beijing, China, 16–20 June 2024; p. 1. [Google Scholar] [CrossRef]
  51. Chen, Z.; Liu, M.; Xia, G.; Huang, Y. PIC/MCC Simulation of the Ionization Process for Filamentary Streamer Plasma Jet at Atmosphere Pressure in Argon. IEEE Trans. Plasma Sci. 2012, 40, 2861–2865. [Google Scholar] [CrossRef]
  52. Babaeva, N.Y.; Kushner, M.J. Effect of Inhomogeneities on Streamer Propagation: I. Intersection with Isolated Bubbles and Particles. Plasma Sources Sci. Technol. 2009, 35, 035009. [Google Scholar]
  53. Peng, Q. Research of Plasma Chemical Model and Analysis of Influencing Factors of Streamer Discharge in Air. Ph.D. Thesis, Chongqing University, Chongqing, China, October 2012. [Google Scholar]
  54. Lin, B. Simulation Analysis on the Synergistic Effect of Vegetation Ashes and Charged Particles on the Gap Electric Field Distortion. J. Phys. D Appl. Phys. 2024, 57, 205501. [Google Scholar] [CrossRef]
  55. Hagelaar, G.J.M.; Pitchford, L.C. Solving the Boltzmann Equation to Obtain Electron Transport Coefficients and Rate Coefficients for Fluid Models. Plasma Sources Sci. Technol. 2005, 14, 722–733. [Google Scholar]
  56. Pu, Z.; Wang, Z. Motion and Distribution of Combustion Particles in Flame Gap Under DC Voltage. Trans. China Electrotech. Soc. 2020, 35, 612–619. [Google Scholar] [CrossRef]
  57. Pu, Z.; Sun, R. Mechanism Analysis of Effect of Electric Field on Vegetation Flame Under DC Voltage. J. Combust. Sci. Technol. 2022, 28, 379–388. [Google Scholar]
  58. Farouk, T.; Farouk, B. Simulation of DC Atmospheric Pressure Argon Microglow-Discharge. Plasma Sources Sci. Technol. 2006, 15, 676–688. [Google Scholar]
  59. Li, C.; Ebert, U.; Hundsorfer, W. Spatially Hybrid Computations for Streamer Discharges with Generic Features of Pulled Fronts: I.Planar Fronts. J. Comput. Phys. 2010, 229, 200–220. [Google Scholar] [CrossRef]
  60. Yang, J.; Ren, X.; Wang, X.; Zhang, X.; Fan, S.; Chen, T. Experimental Research on Influence of Mountain Fire on Safe Operation of 10~35 k V Transmission Lines. Sichuan Electr. Power Technol. 2022, 45, 1–5. [Google Scholar] [CrossRef]
  61. Yuan, T.; Yang, Z. Study on Impluse Flashover Arc Observation and Post-Arc Gas Dissipation Process in the Semienclosed Chamber. Trans. China Electrotech. Soc. 2024, 39, 924–934. [Google Scholar] [CrossRef]
  62. Liu, S. Observation of Vacuum Arc Morphology and Microscopic Particle Dynamics. Master’s Thesis, Huazhong University of Science and Technology, Wuhan, China, May 2021. [Google Scholar] [CrossRef]
  63. Yang, C.; Ning, X.; Xu, H.; Chen, T.; Zeng, C.; Yang, S. Overview of Mountain Fire Monitoring and Early Warning for Power Grid Demand. Power Syst. Technol. 2023, 47, 4765–4777. [Google Scholar] [CrossRef]
  64. Zhang, K.; Wu, X. Real-Time Wildfire Risk Assessment Model for Transmission Corridors Based on Feature Engineering and Boosting Integrated Learning Model, Ensemble Learning, and Model Fusion. Power Syst. Technol. 2023, 47, 4727–4738. [Google Scholar]
  65. Song, H.; Meng, X.; Sheng, G.; Jiang, X. Overview of Experimental Observation Technology for Short Air Gap Streamer Discharge. Power Syst. Technol. 2022, 46, 774–785. [Google Scholar] [CrossRef]
  66. Wang, P.; Liu, X. Stepped Propagation Characteristics of Leader for Positive Discharge in Long Air Gaps. Power Syst. Technol. 2021, 45, 818–824. [Google Scholar] [CrossRef]
  67. Zhou, E.; Fan, L. Risk Distribution Assessment of Wildfire-Induced Trips in Transmission Line Based on Flame Combustion Model. Power Syst. Technol. 2022, 46, 2778–2785. [Google Scholar] [CrossRef]
Figure 1. Mind map of gap breakdown characteristics and discharge mechanisms of overhead transmission lines under vegetation fire conditions.
Energies 18 01946 g001
Figure 2. Multi-physics field coupling relationship.
Energies 18 01946 g002
Figure 3. Schematic diagram of the simulation model.
Energies 18 01946 g003
Table 1. Comparison of existing research methods.
MethodsAdvantagesDisadvantages
Experimental simulationReal-world environment conditions.Susceptible to extreme weather, especially in outdoor long-gap tests.
Woodpile combustion with good repeatability.Difficult to capture microphysical phenomena during discharge.
Direct observation of gap discharge phenomena and data recording.Challenging to isolate and control single variables accurately.
Numerical simulationTransformed into solvable multi-physics coupling problems.Simplified model assumptions with deviation.
Capable of simulating microscopic parameters.Less directly applicable simulation conclusions.
Reveal underlying discharge mechanisms.A lack of sufficient experimental reference data for accuracy and reliability.
Contributions
Experimental and numerical methods are mutually supportive. Experiments provide key discharge data for model development and validation, while simulations offer mechanistic insights into microparameters beyond experimental research.
Table 3. Summary of international research status on the line gap breakdown test under simulated wildfire conditions.
ScholarsFactorsGap Distance/mFire SourceMain Conclusions
Chun K [24]Heat release rate and effective combustion heatWithin 1Cypress, fir, and two types of plastic resins: PP and PEGap dielectric strength can be predicted based on the ignition characteristics of vegetation and building materials
Z. Ntshangase [25]Flame temperature0.5SugarcaneUnder negative polarity voltage, the breakdown voltage under flame conditions decreases by 50%, whereas the number is 55% under positive polarity voltage.
A. Robledo-Martinez [26]Flame temperature, electrical conductivity, and smoke particles0.85~2.0Horticultural waste, sugarcane bagasse, branches and leaves, and butane gasThe main factors for gap insulation performance are high temperature, the ionization of multiphase component mixtures, and smoke particles.
Fonseca [27]Type of vegetation1Grass and sugarcaneThe insulation requirements for AC transmission lines were established through the test.
Moreno [28]Non-fire and high-temperature flames3SugarcaneThe insulation strength under gap flame conditions is significantly weakened compared to a purely high-temperature, non-flame environment.
Lanoie [29]Gap distance6EucalyptusThe gap breakdown voltage gradients with and without considering the eucalyptus tree’s height were 32.8 kV/m and 58.4 kV/m, respectively.
Table 4. Summary of domestic research status of line gap breakdown tests under simulated wildfire conditions.
ScholarsFactorsGad Distance/mFire SourceMain Conclusions
Huang, D. [30,31,32,33]Vegetation type and combustion intensity0.45Cedar (trunk and branches), straw, and reed grassThe peak leakage current in the positive polarity of the cedar branch flame gap (27 mA) is much higher than that under a negative polarity voltage (0.6 mA).
Ash particles0.40, 0.45Reed grass, straw, and cedar branchesThe average breakdown voltage gradient of the conductor-to-plate gap (1.4 kV/cm) decreases by 71% compared to that under pure air conditions (4.5 kV/cm).
Flame-bridging ratio1.2, 1.7, 2.2, 2.7Cedarwood stackThe flame region is divided into continuous, discontinuous, and smoke zones based on the flame morphology and its impact on discharge characteristics.
Vegetation moisture content3Cedarwood stackThe linear fitting formula was obtained between the average gap breakdown voltage gradient and vegetation stack humidity, with a high correlation coefficient of 0.9998.
Li, P. [4,34]Wind speed0.40~0.80Cedar (branches and trunk), straw, and reed grassWhen vegetation combustion is sufficient, wind speed significantly affects the flame-bridging gap ratio, with the breakdown voltage increasing as wind speed rises.
SlopeThe breakdown voltage increases by 32% as the slope rises from 0° to 19°, and the breakdown location shifts toward the upper-middle part.
Long, M. [5]Ash particles and vegetation type0.40, 0.45, 0.50, 0.55Reed grass, straw, cedar leaves, and branchesThe effect of particles on discharge development is positively correlated with particle size.
Yang, K. [35]Temperature, conductivity, and ash particles1N-heptane and wood stack blocksThe breakdown field strength decreases to 9.5% at a gap of 10–50 cm and 3.7% at 30–70 cm in pure air, respectively.
Zhou, E. [6,36]Altitude1.2~1.7Cedarwood stackA method for the altitude correction of air gap breakdown voltage under vegetation fire conditions is proposed.
Vegetation types, combustion characteristics, etc.1.7, 3, 4Metasequoia, Yunnan pine, fast-growing eucalyptus, shrubs, and reed grassThe average voltage gradient ratios of Yunnan pine, fast-growing eucalyptus, shrubs, and reed grass relative to Metasequoia were 1.13, 0.96, 0.93, and 0.88, and used as vegetation characteristic parameters.
Chen, X. [37]Flame height1Cedarwood stackThe breakdown voltage is not strictly negatively correlated with flame height.
Wang, T. [38]Smoke-bridging ratio4Cedarwood stackThe breakdown voltage under full smoke conditions is 582.25 kV, which is 45.59% of that under pure air conditions.
Table 5. Summary of research status of breakdown voltage prediction models.
ScholarsPrediction ModelKey Physical QuantitiesApplications and Conclusions
Imtiaj Khan, Mona Ghassemi [42] U ^ 50 = U 50 × C T × C S
U 50 = 912.75 l o g X + 640.8
Temperature correction factor CTA steady-state probability model of line interruption is established considering breakdown voltage, line tripping, and aging failure.
Particle correction factor CS
Zhou, E. [36] y 100 = 2.19 x 1 0.02 x 2 1.89 x 3 4.54 x 4 + 164.88
y 75 = 18.34 x 1 0.016 x 2 10.15 x 3 6.15 x 4 + 240.03
y100 and y75: Average breakdown voltage gradient at 100% and 75% flame-bridging ratios.The average voltage gradient prediction models under flame-bridging ratios of 100% and 75% are obtained, with a coefficient of determination of 1 and good data fitting.
x1: Flame height;
x2: Maximum flame temperature;
x3: Ash content by mass;
x4: Calorific value of combustible material.
Li, P. [34] U a p = E x x C n g + E H H C a C b C g Ex and EH: Average breakdown voltage gradients in the non-flame and flame zones (kV/m).The breakdown voltages of different flame gaps are predicted, with an error between the predicted and actual values of less than 7.8%, validating the feasibility of the prediction model.
x and H: Gap lengths in the non-flame and flame zones (m).
Shao, Y. [34,43,44] U = h H K t K p 1 U 0 + ( 1 h H ) K p 2 U 0
K t = K d K h
U: Line frequency breakdown voltage under wildfire conditions;
U0: Line frequency breakdown voltage under standard atmospheric conditions.
The breakdown characteristics of a typical 1000 kV ultra-high voltage double-circuit line are analyzed, and the main factors of gap insulation strength
are
comprehensively considered.
Kt, Kd, and Kh: Atmospheric, air density, and humidity correction factors.
Kp1 and Kp2 are the particle correction factors for the flame zone and non-flame zone.
Zhou, Z. [3] U f = z a l D 1 + z d E 0 T a T f d z Ta: Ambient temperature (K);
A: Flame height conversion coefficient;
zd: Vegetation height (m);
Tf: Flame zone temperature (K)
Breakdown voltage prediction models are proposed for each different flame zone by height, considering mathematical relationships with vegetation, wind speed, and terrain parameters.
E0: Breakdown field strength in standard atmospheric conditions;
D: Gap distance (m);
D1: Height of the flame zone (m).
Table 6. Mechanism of vegetation fire gap discharge.
FactorsKey MechanismsModes of Action
Temperature [45]Decrease in air density Positive correlation between the gas’s relative density and the gap’s breakdown voltage
Conductivity [35,46,47]Generating charged particles.Collisional ionization and photoionization
Thermal ionization
Chemical ionization
Ash particle [48]Bridging the gap, and distorting the electric fieldConstructing particle chains and short-circuiting the gap
The superposition effect of the charged particle and background electric fields.
Disclaimer/Publisher’s Note: The statements, opinions and data contained in all publications are solely those of the individual author(s) and contributor(s) and not of MDPI and/or the editor(s). MDPI and/or the editor(s) disclaim responsibility for any injury to people or property resulting from any ideas, methods, instructions or products referred to in the content.

