
Effect of Al2O3 Particle Addition on Fluidized Bed Thermochemical Heat Storage Performance of Limestone: From Instability Mitigation to Efficiency Enhancement

Abstract
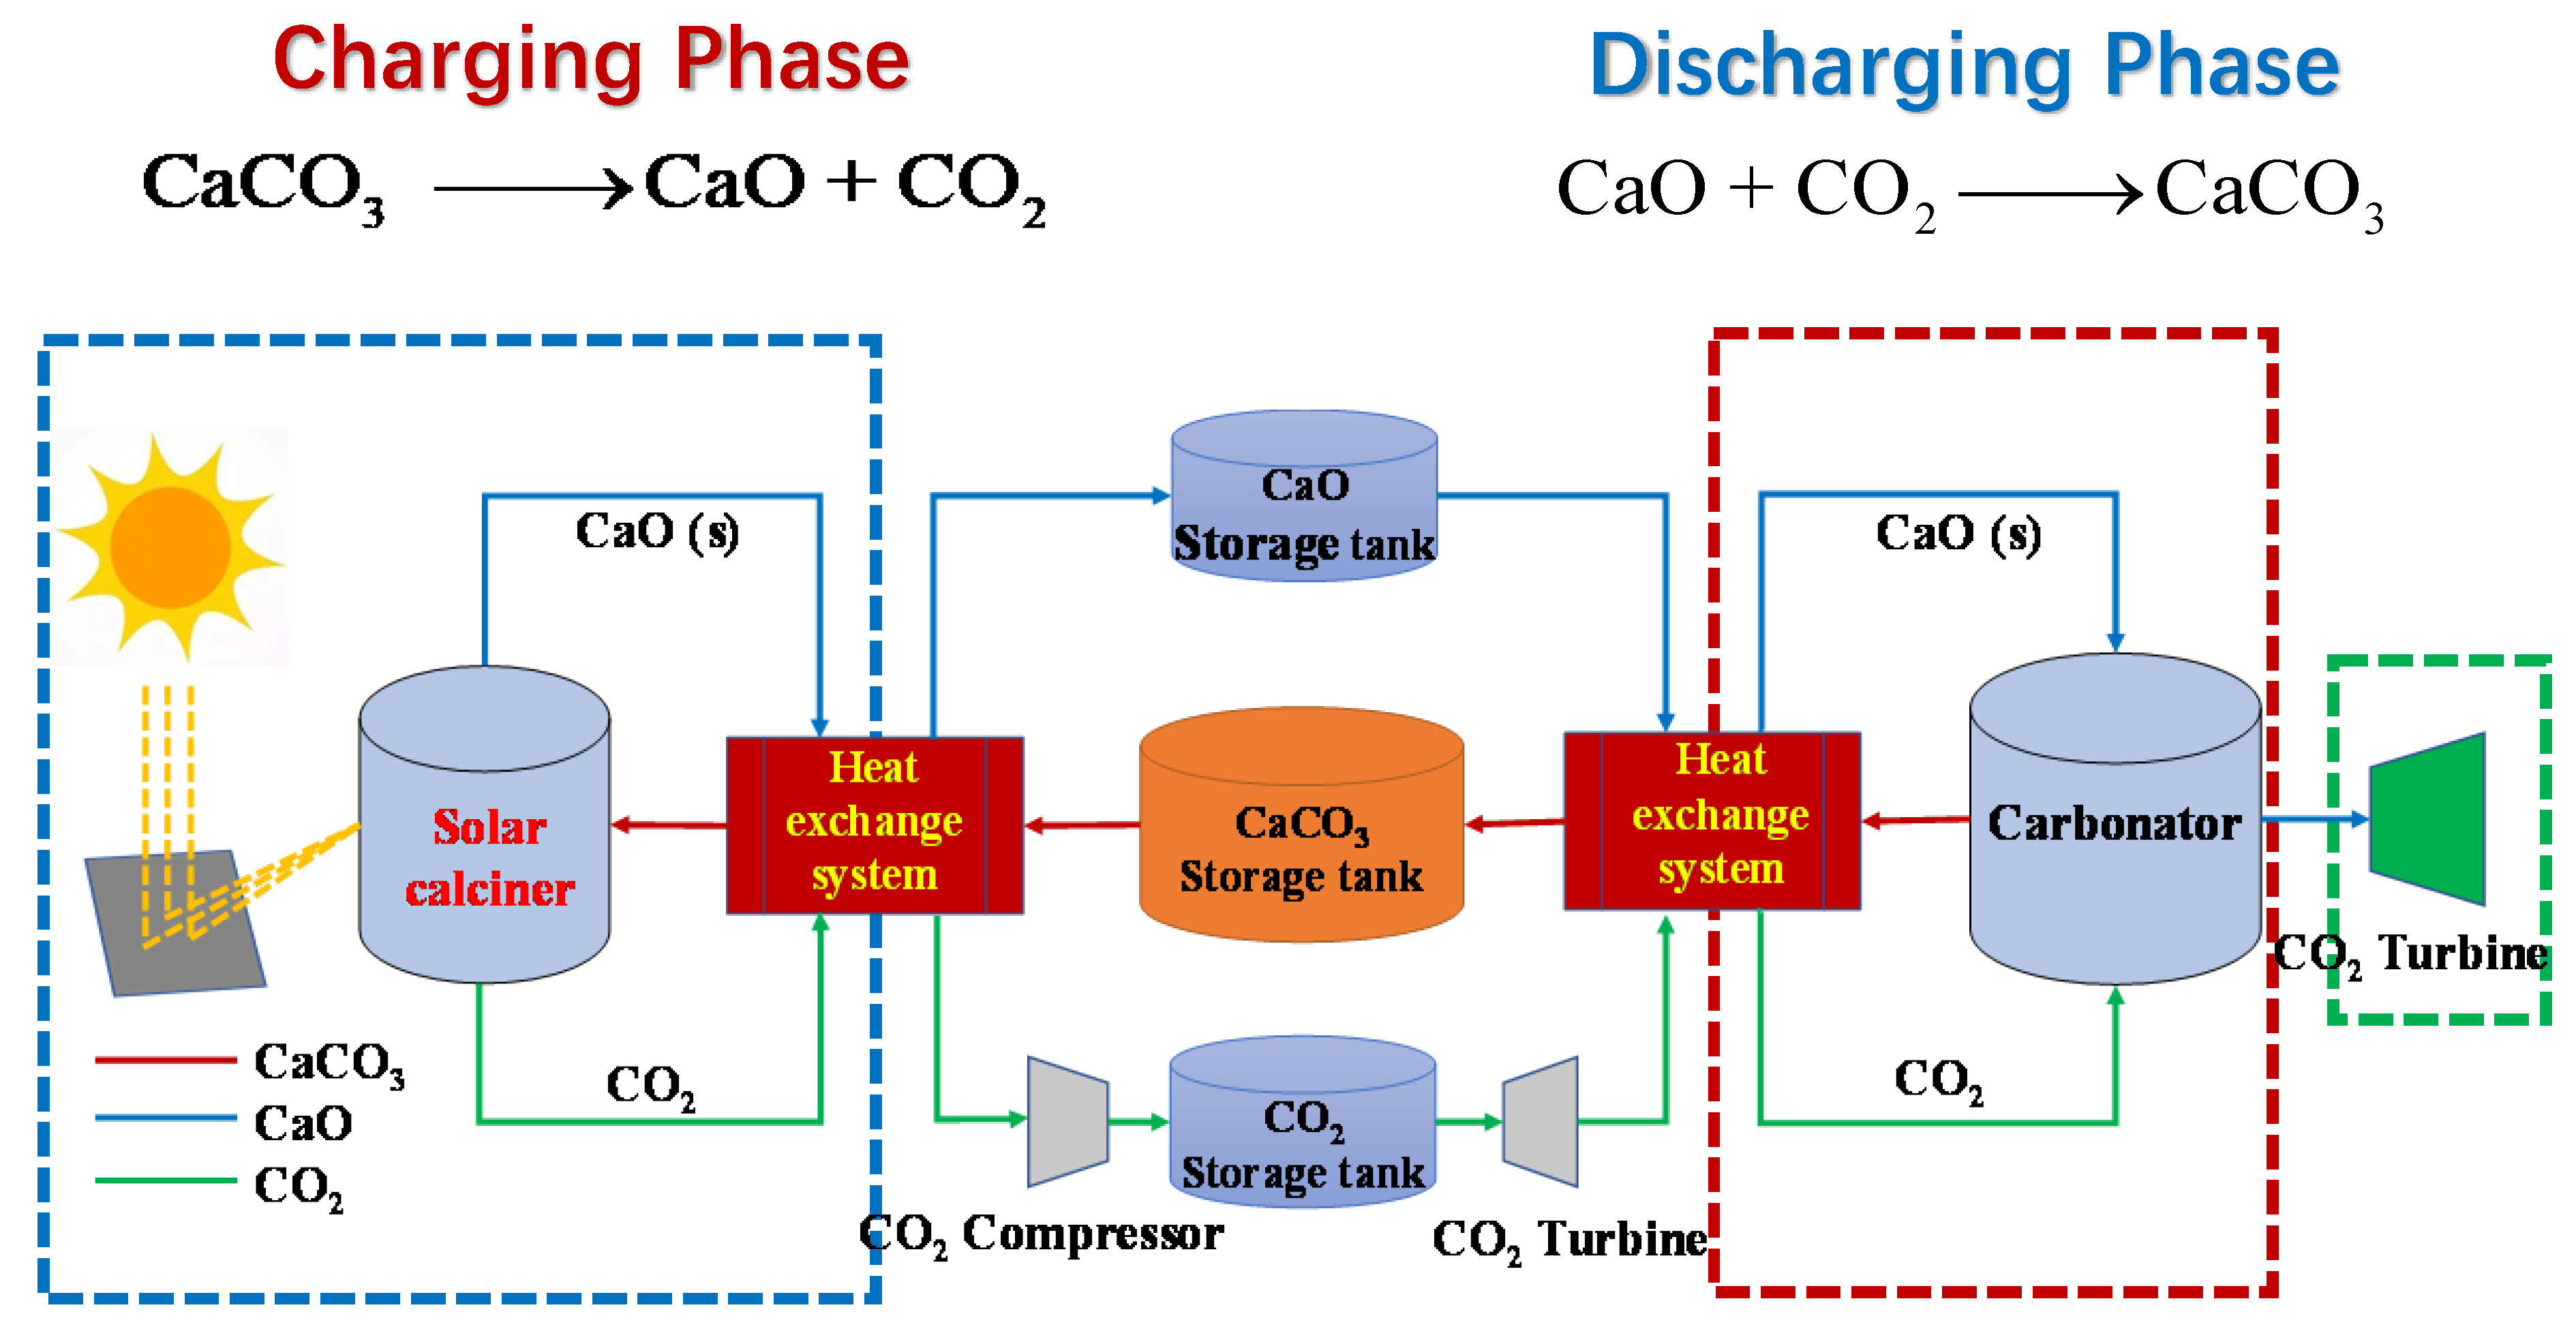
1. Introduction
2. Materials and Methods
2.1. Experimental Materials
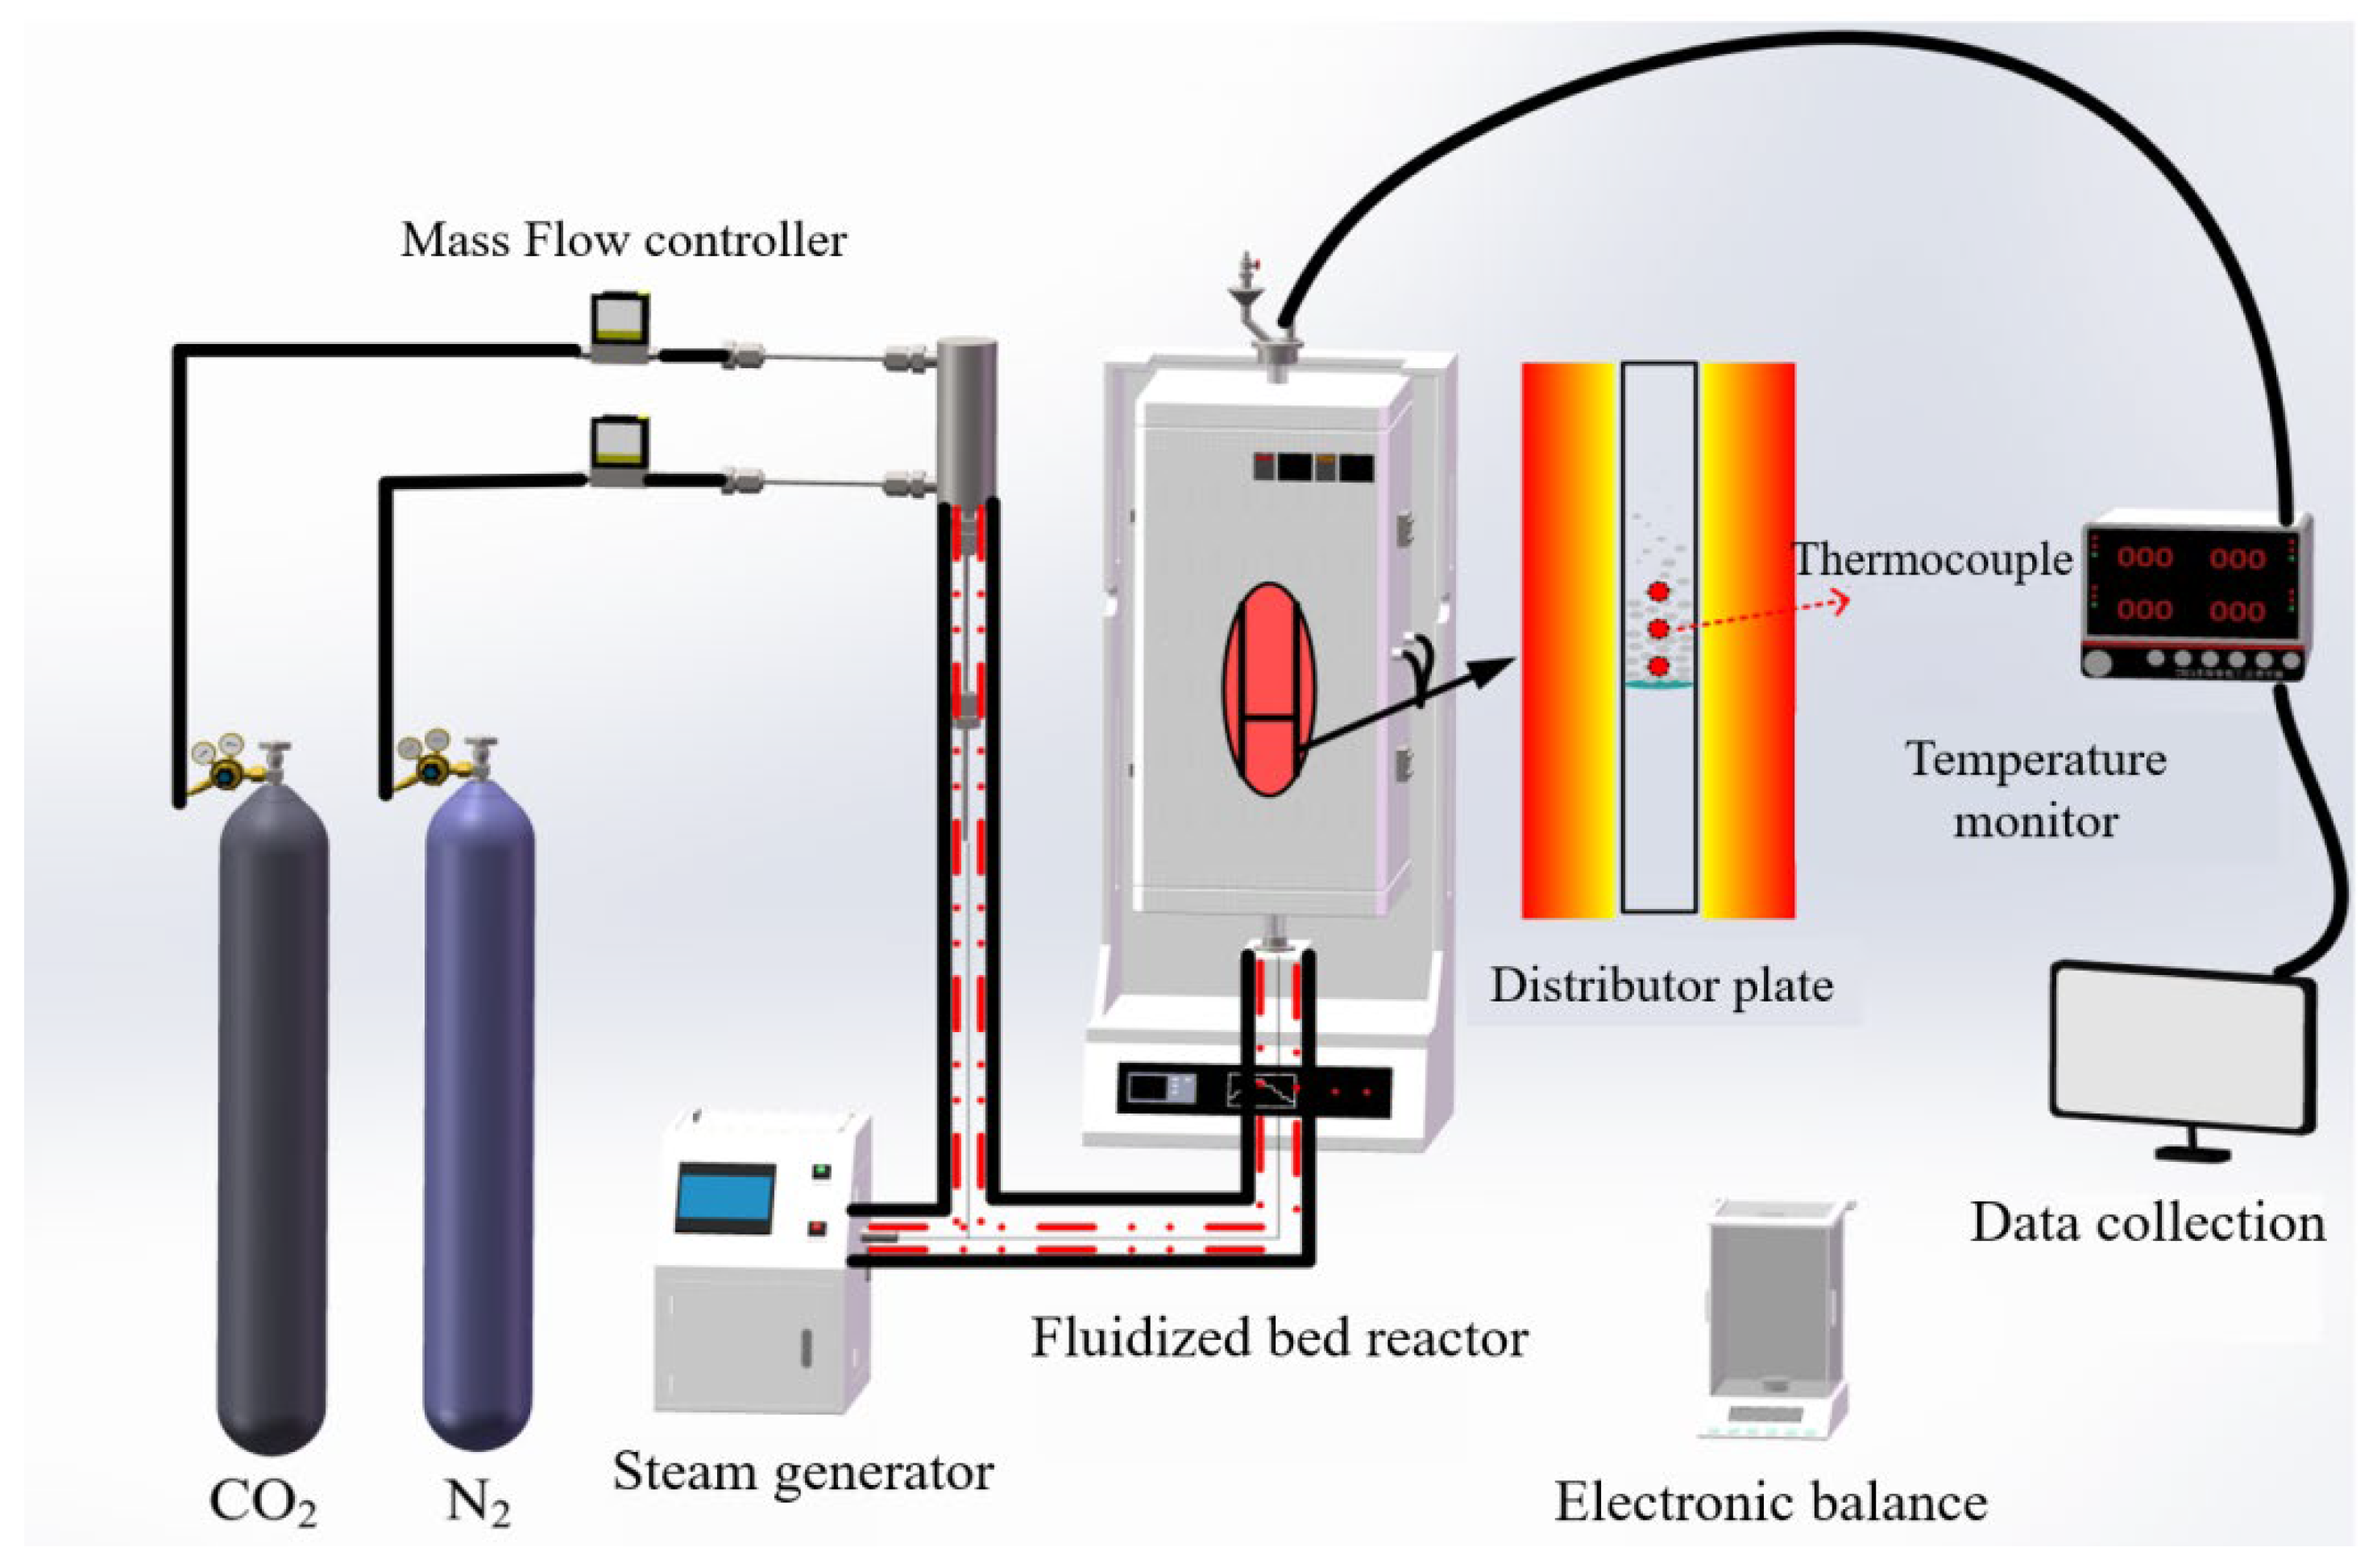
2.2. Experimental Device
2.3. Performance Evaluation Metrics
3. Results and Discussion
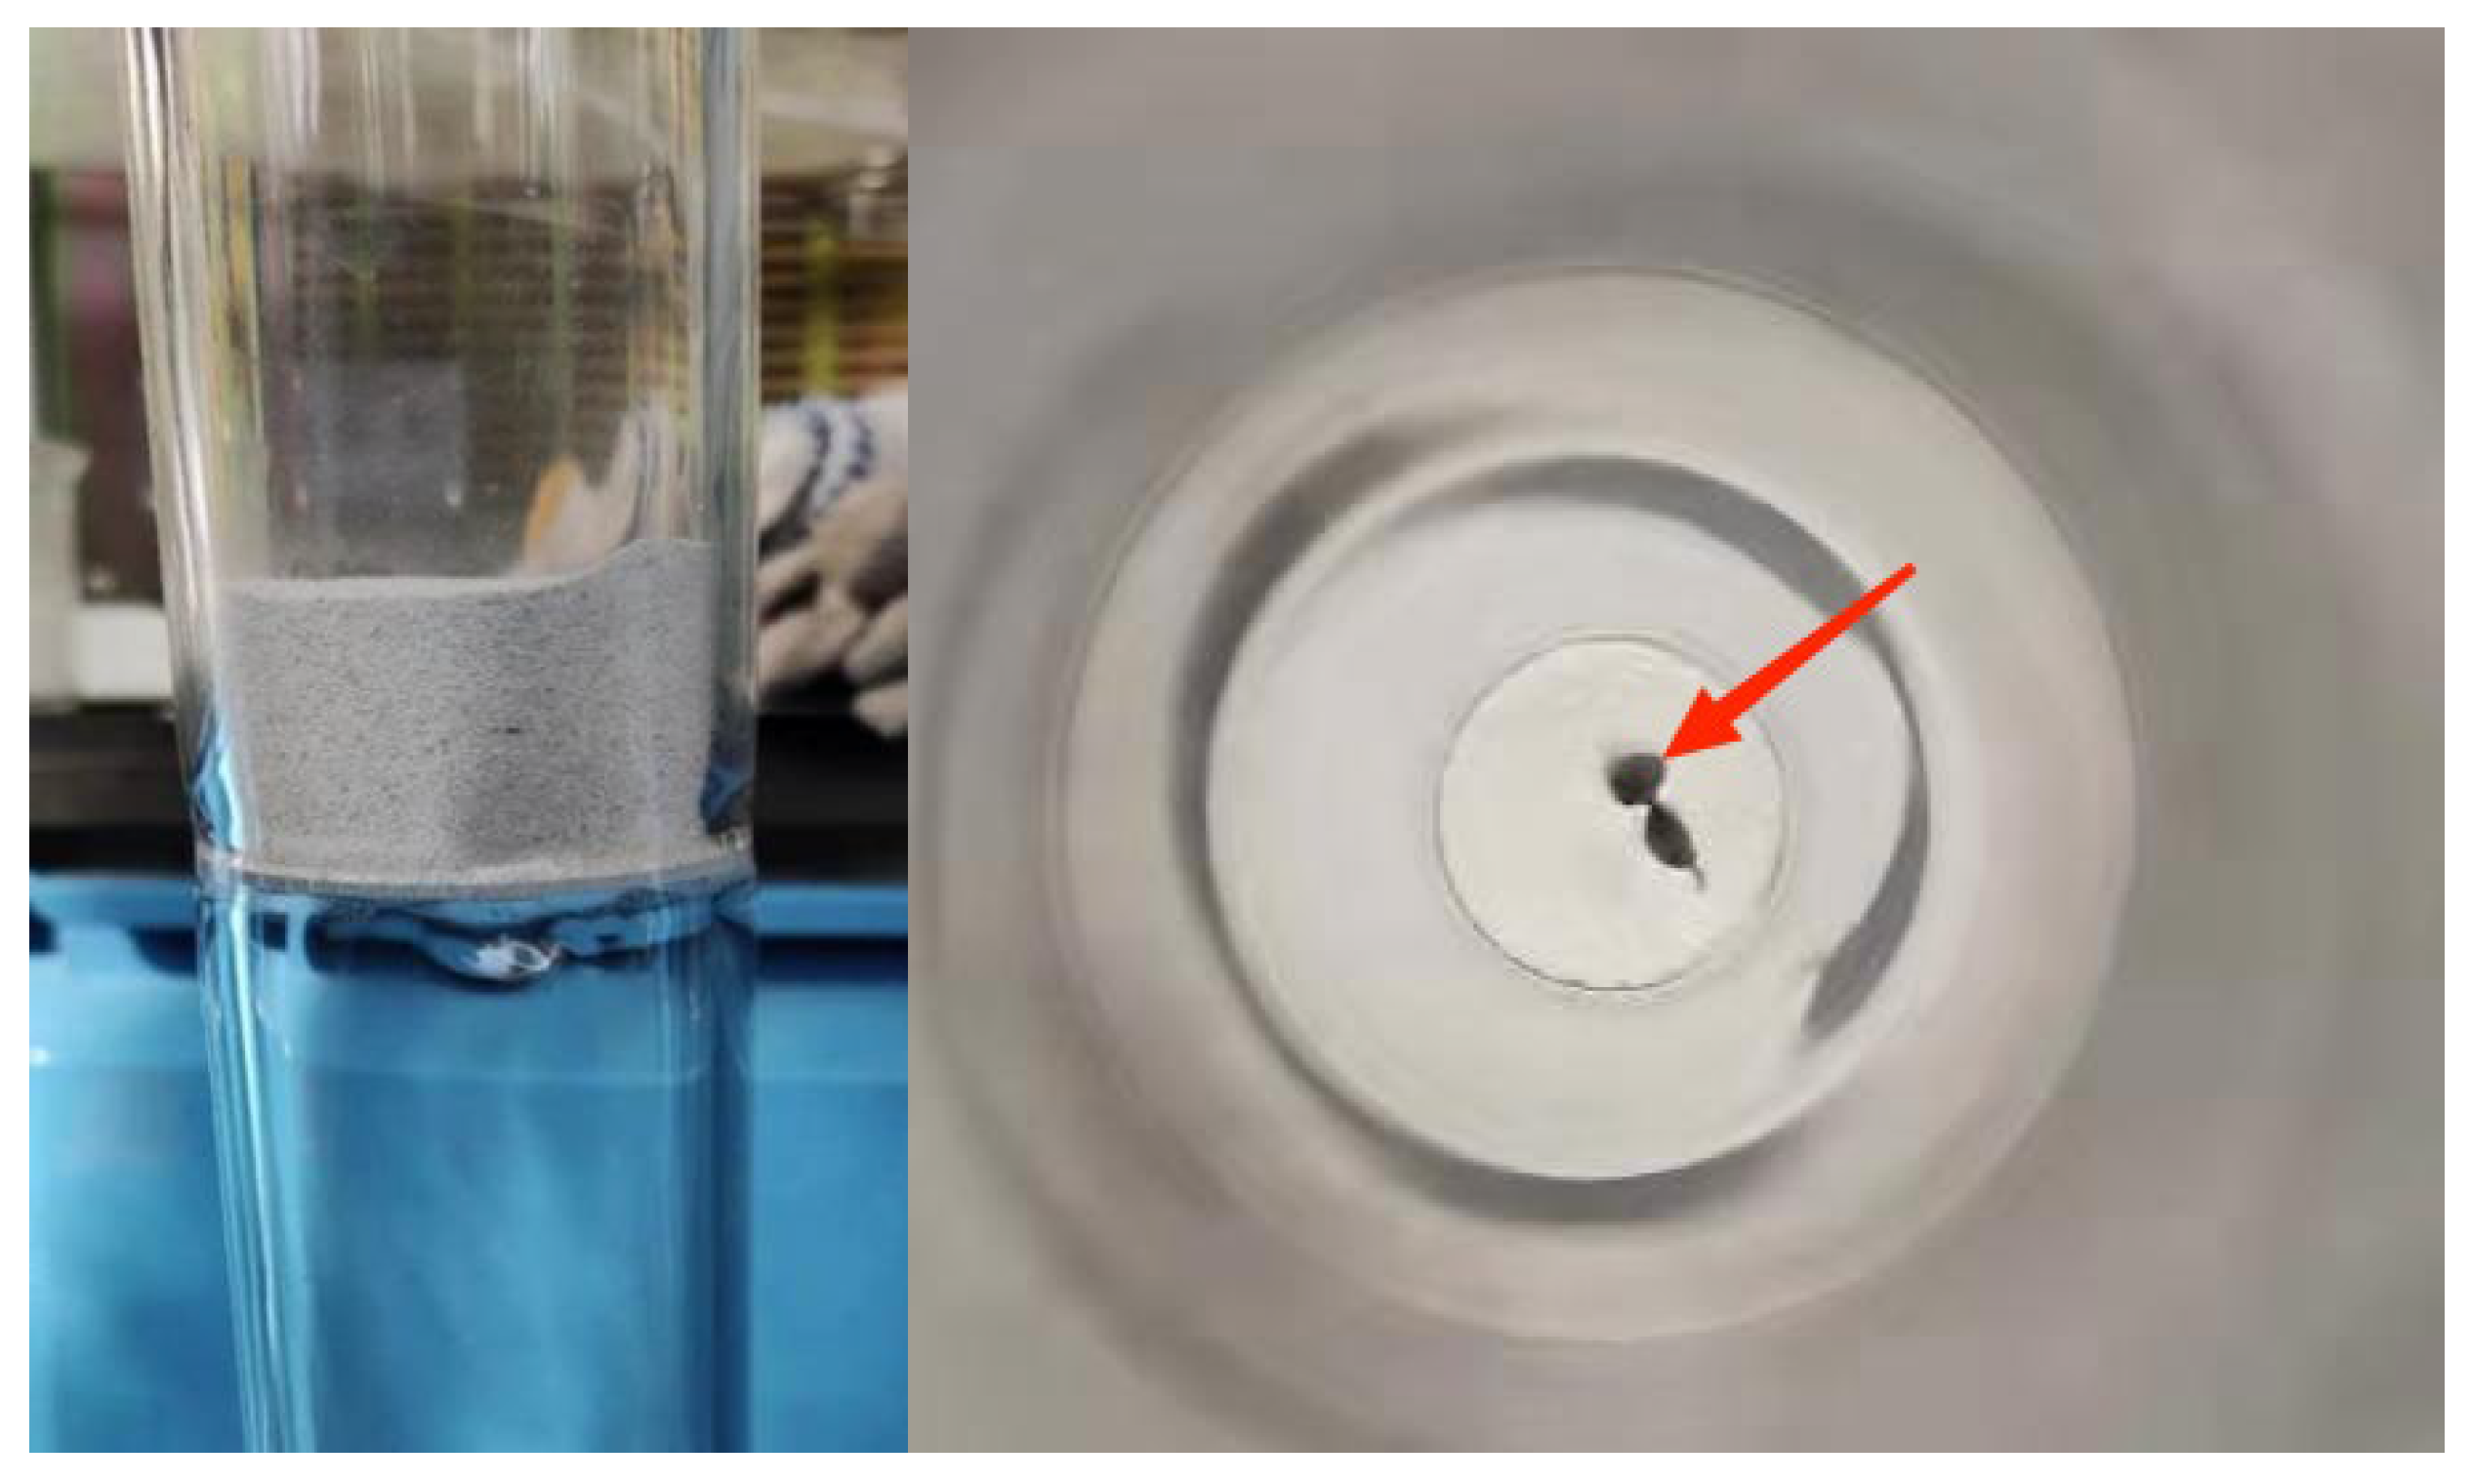
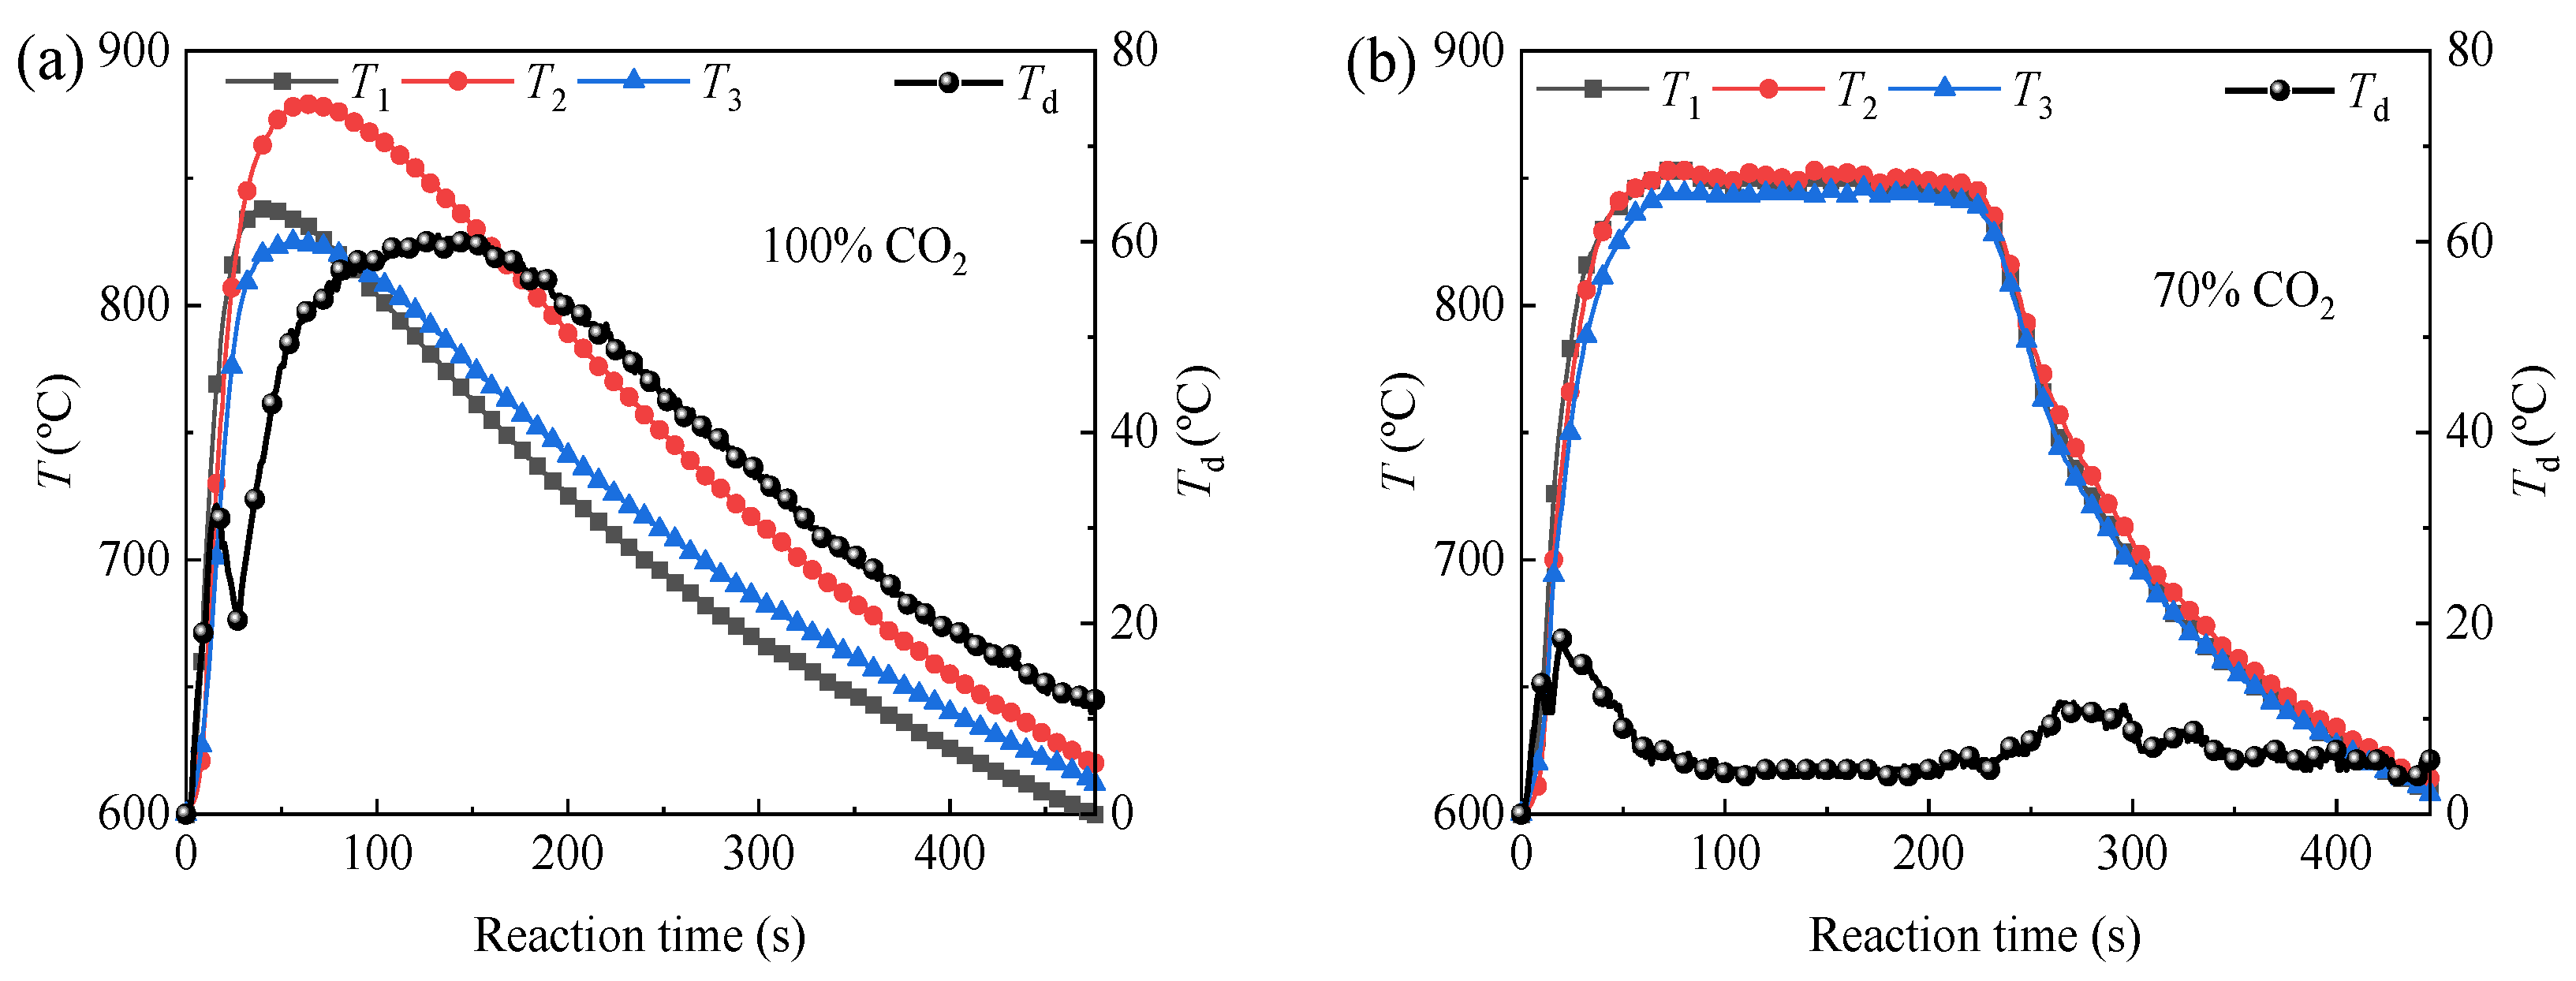
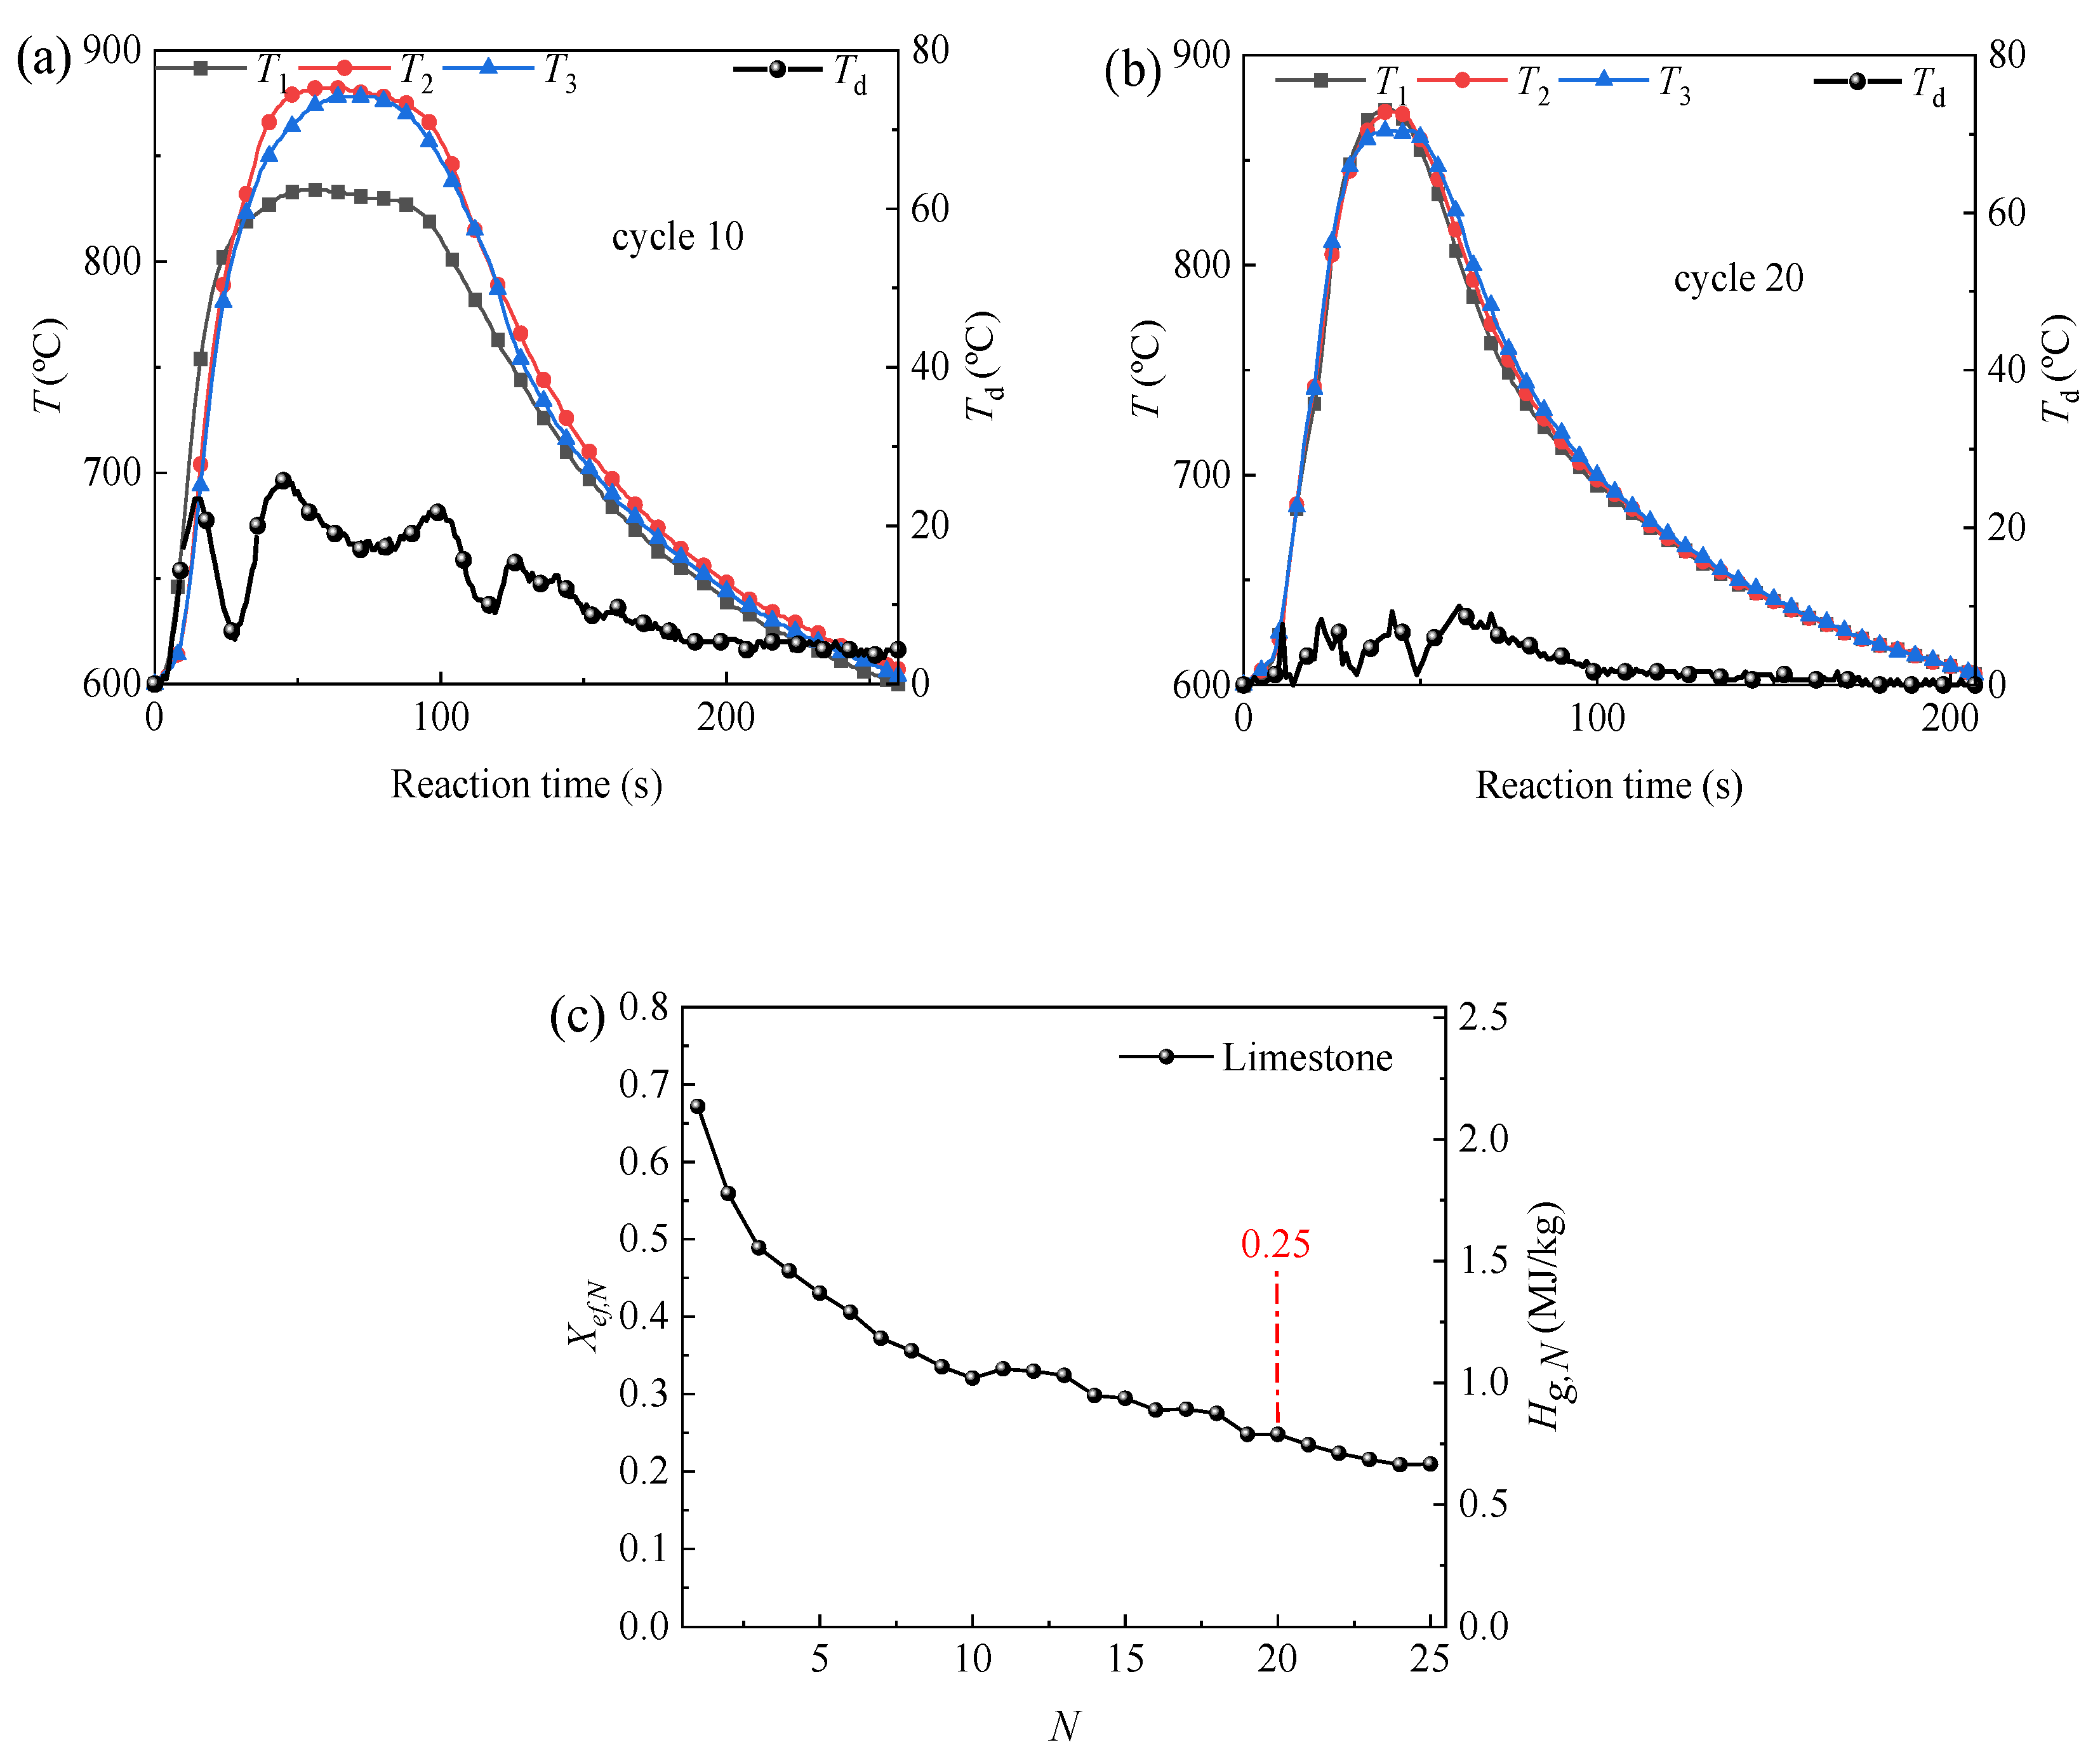
3.1. Fluidization Instability and Its Impact on Limestone’s Exothermic Performance
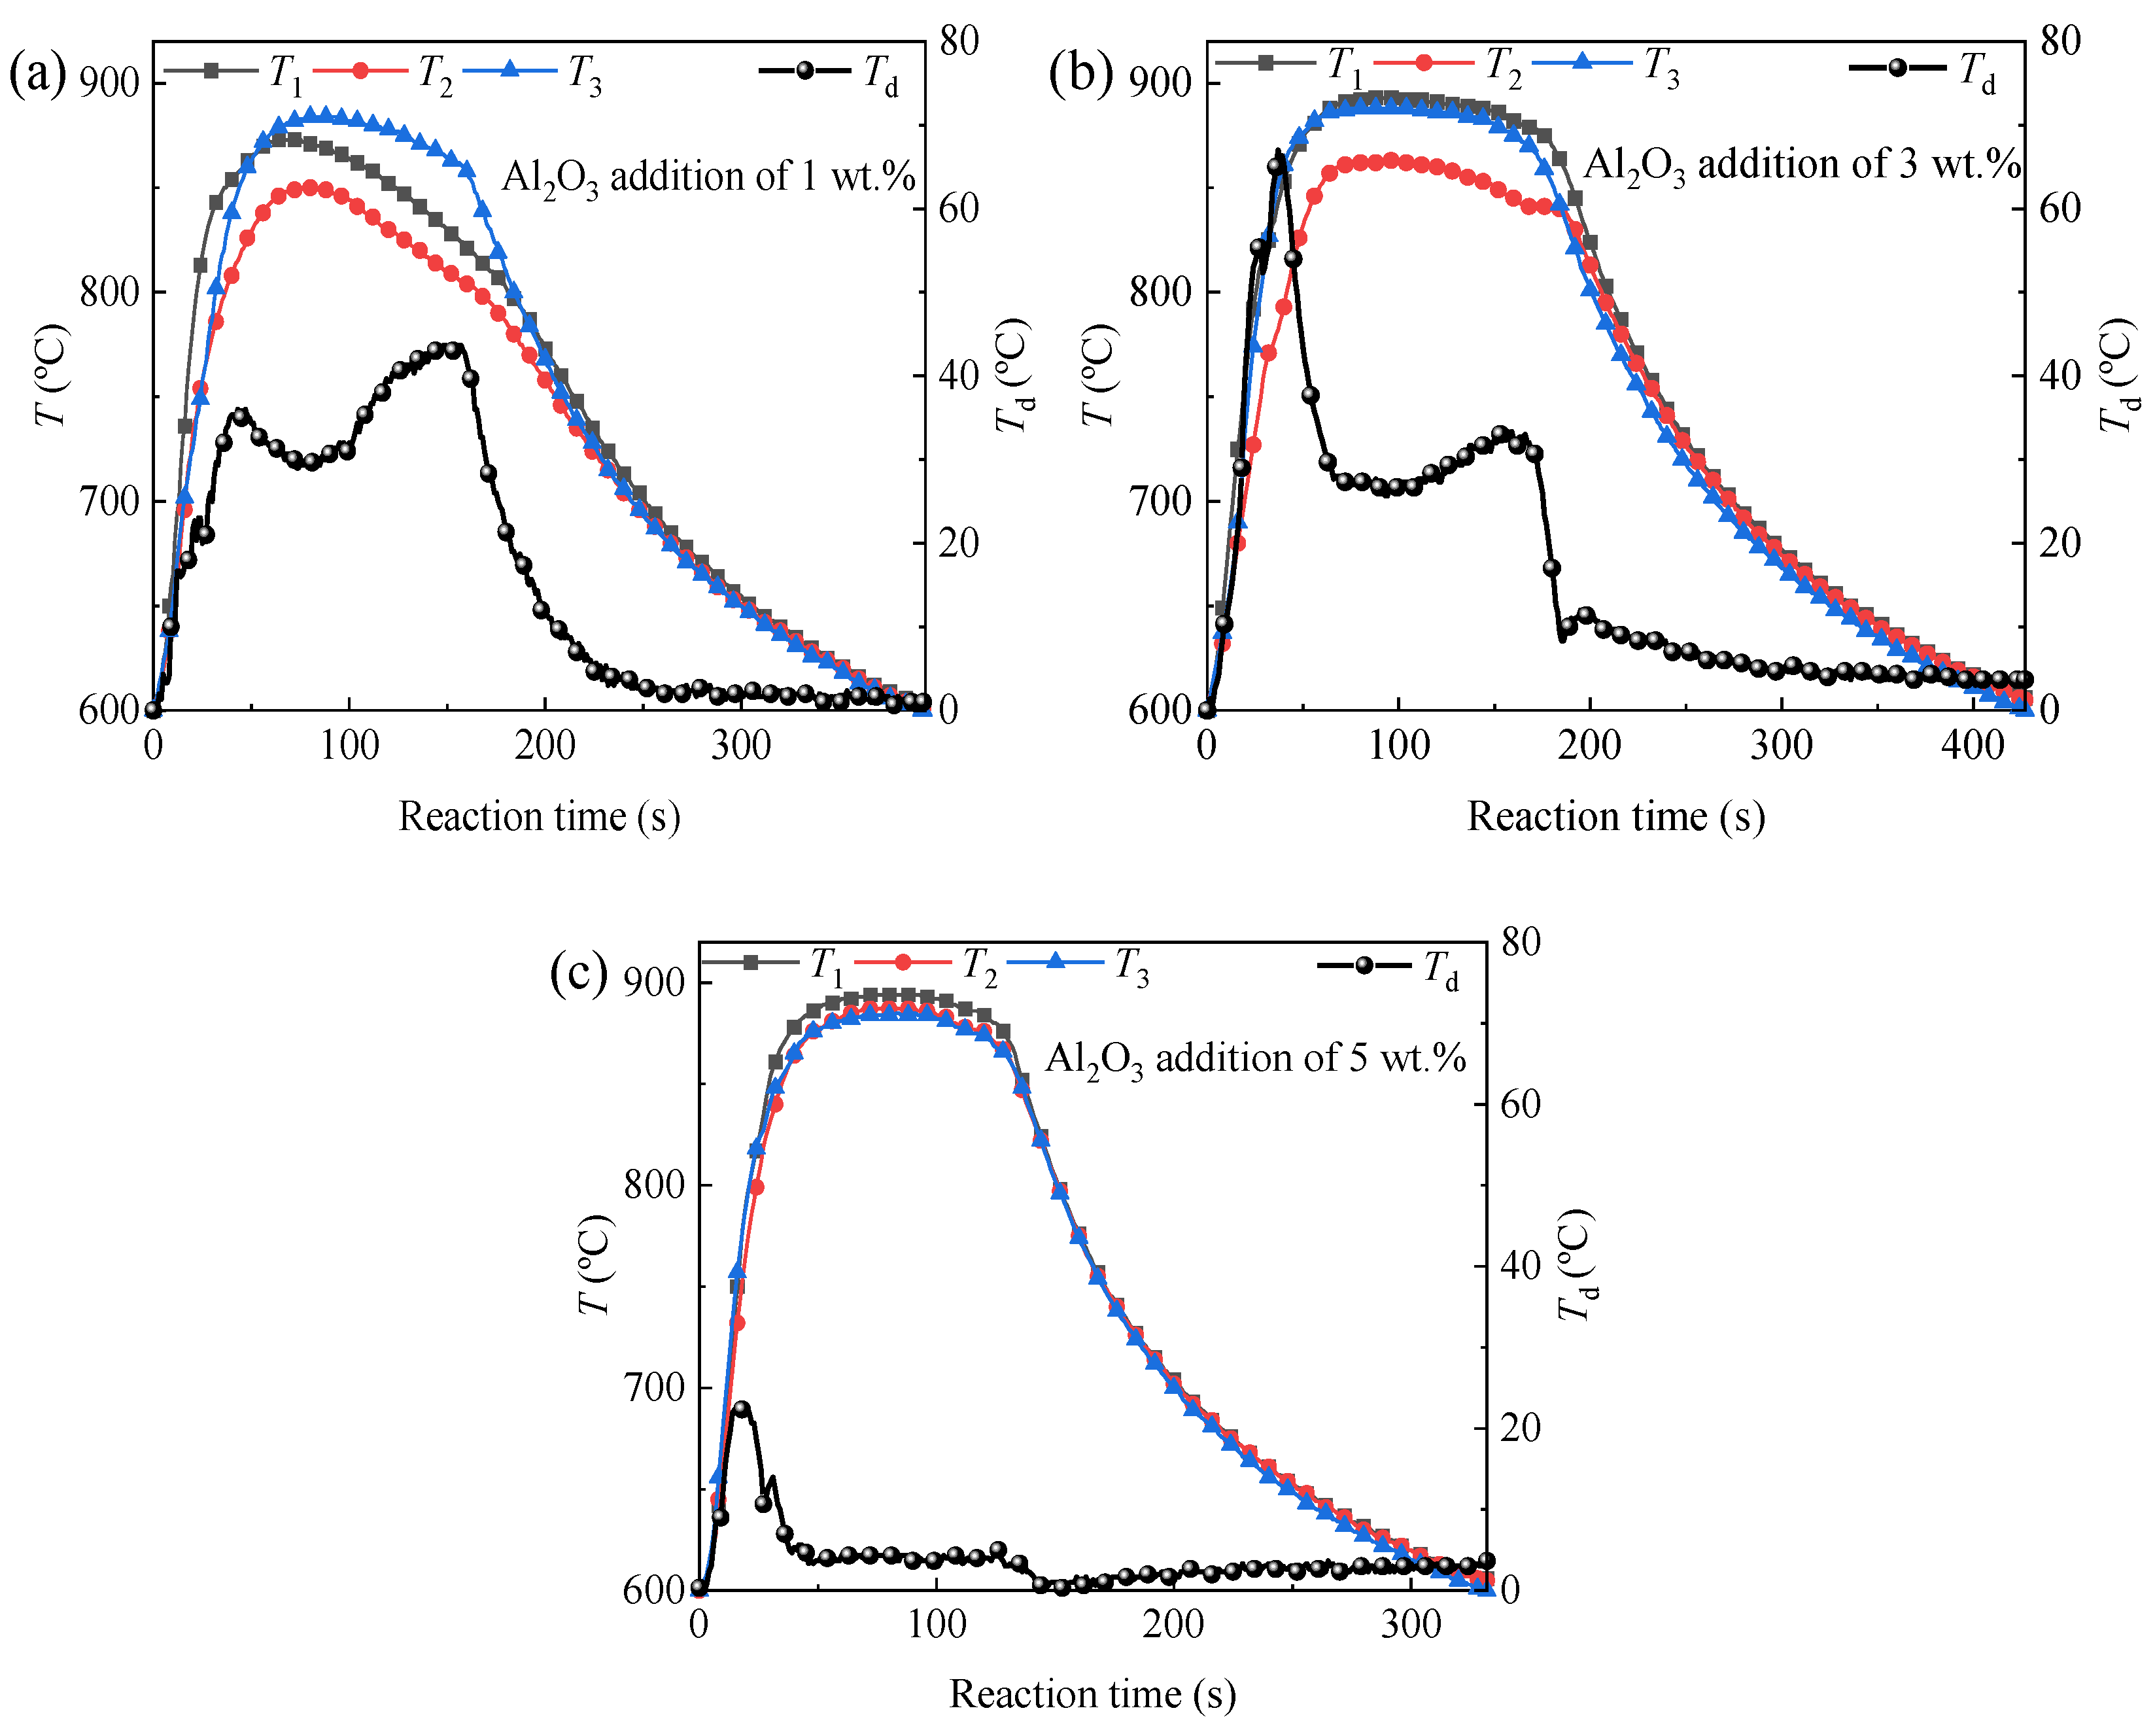
3.2. Effect of Al2O3 Particle Addition on Limestone’s Exothermic Performance
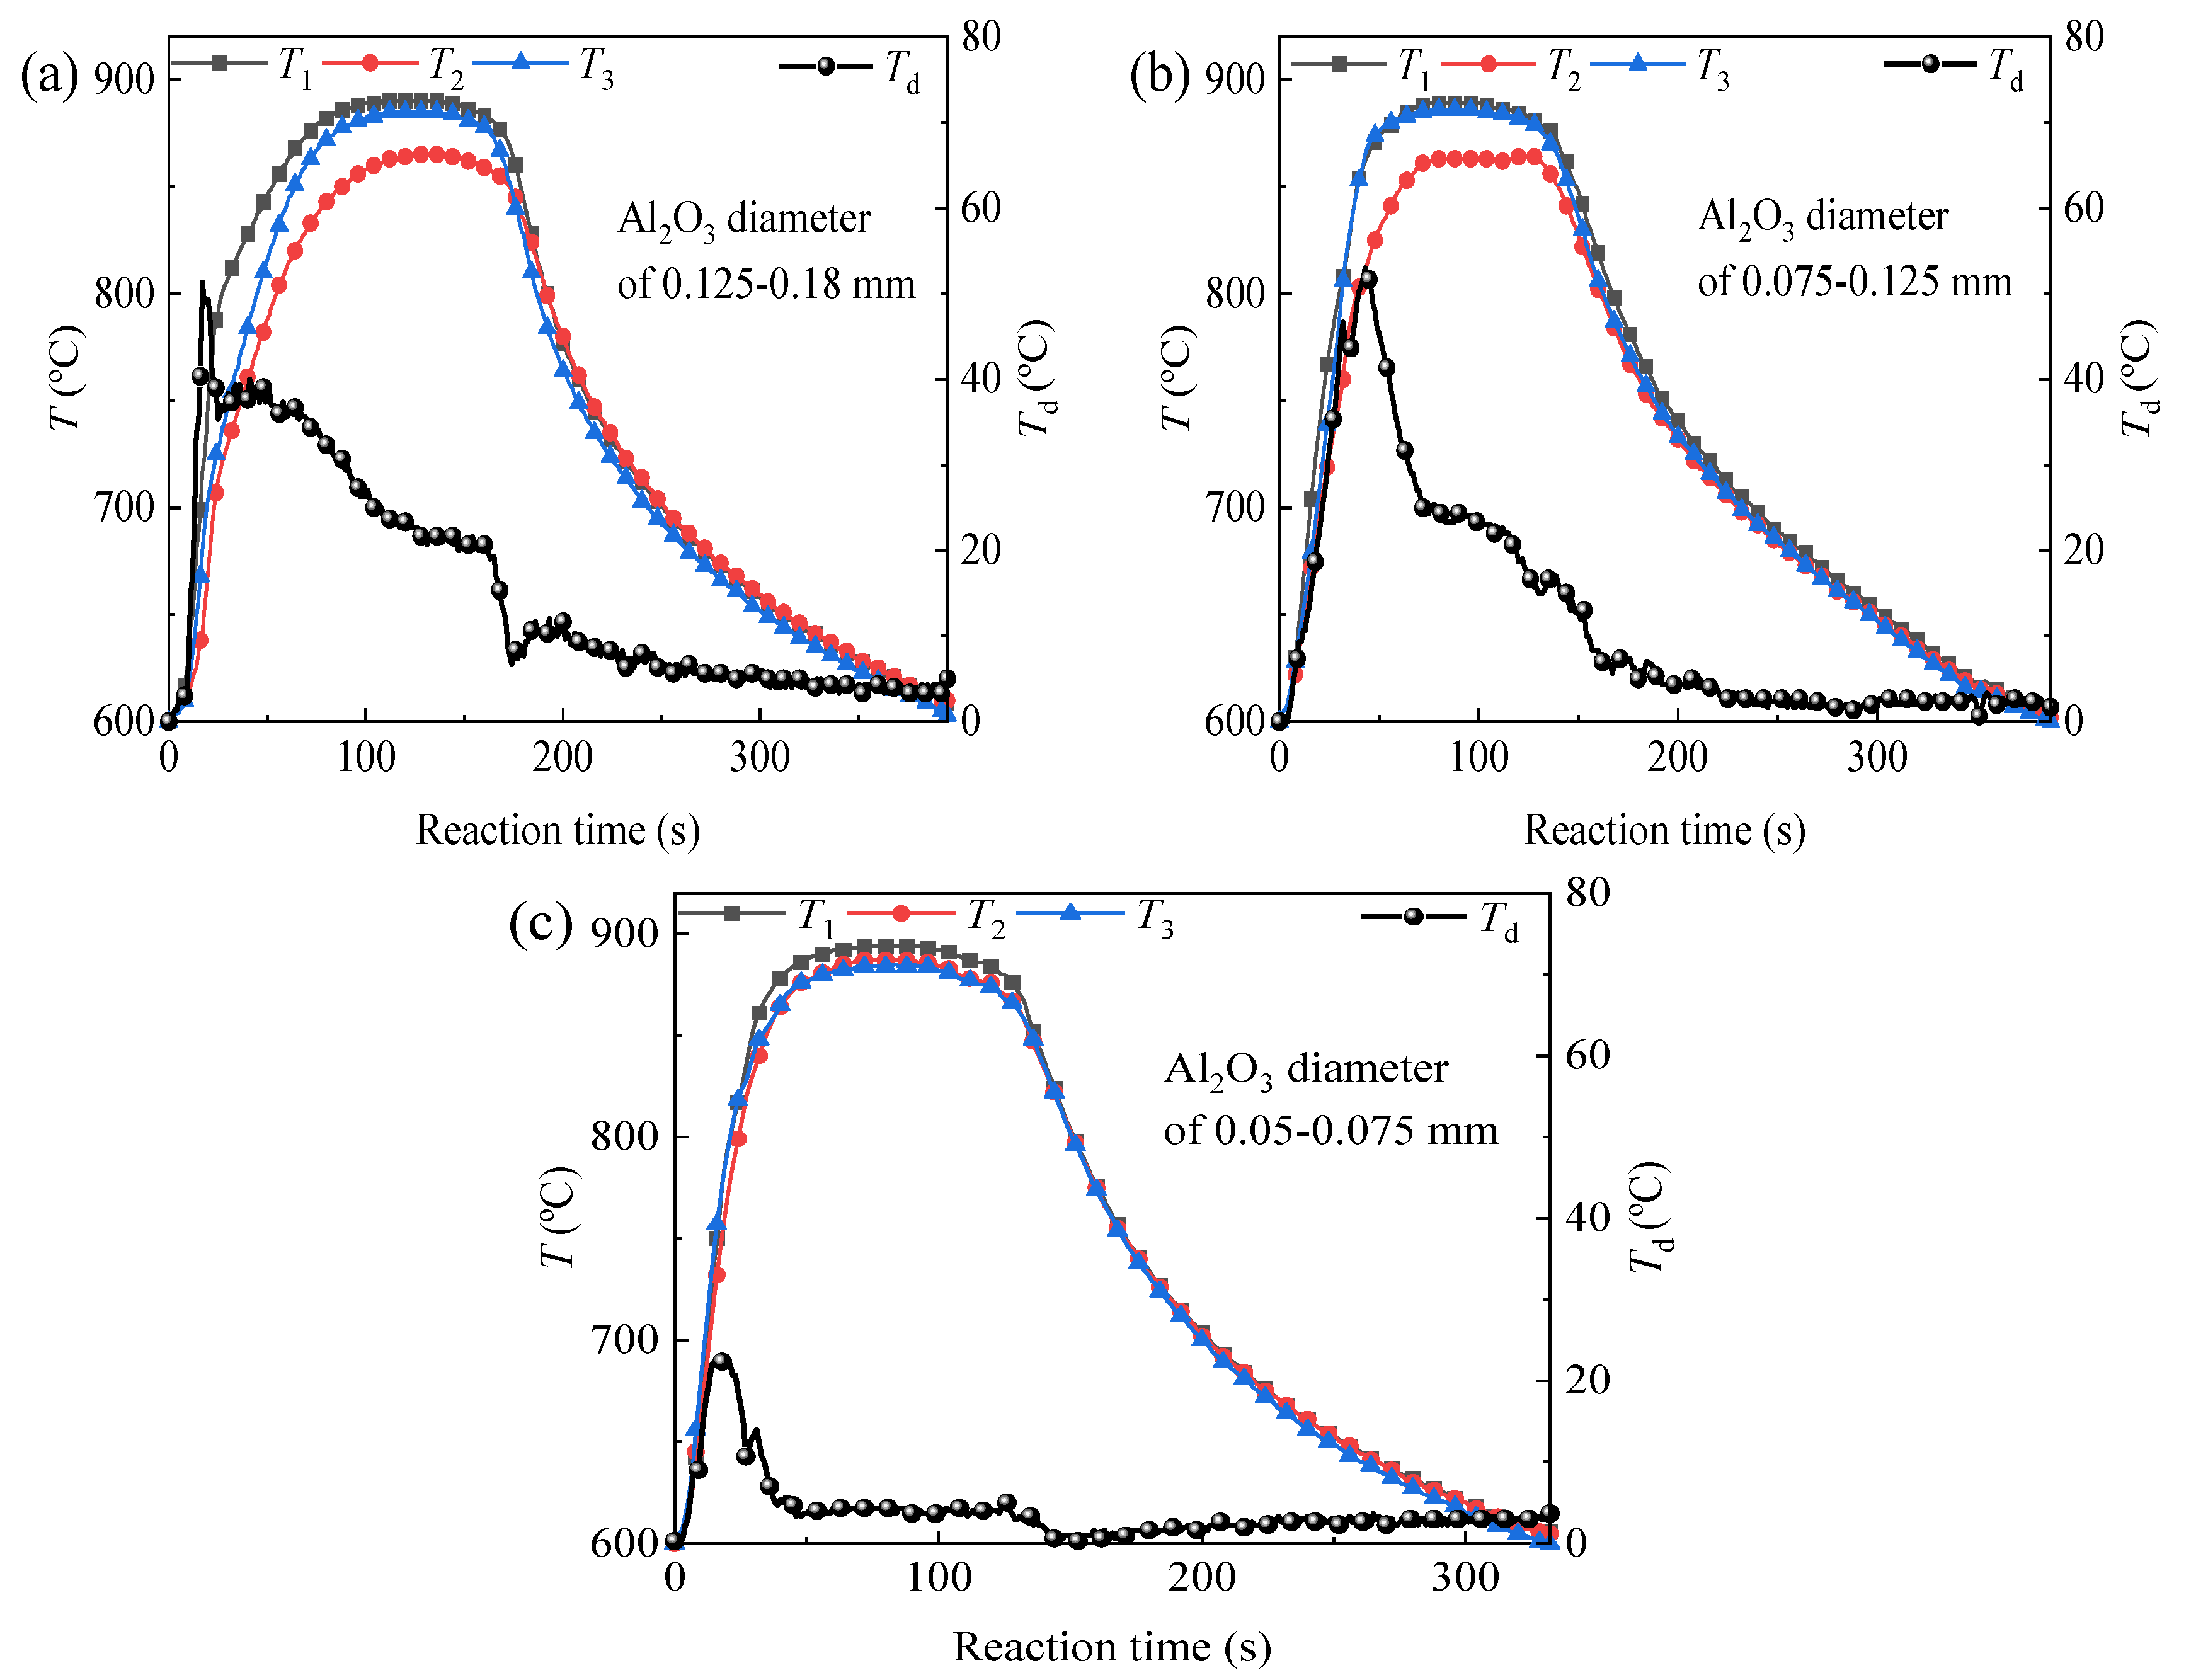
3.3. Effect of Al2O3 Particle Size on Limestone’s Exothermic Performance
4. Conclusions
Author Contributions
Funding
Data Availability Statement
Conflicts of Interest
Nomenclature
| N | number of CaCO3/CaO heat storage cycles. |
| Xef,N | effective heat storage conversion rate at the N-th cycle. |
| Hg,N | heat storage density at the N-th cycle (MJ/kg). |
| mcar,N, mcal,N | mass of CaO after the N-th carbonation and calcination, respectively (g). |
| m0 | initial mass of calcined sample (g). |
| MCaO, MCO2 | molar masses of CaO (56.08 g/mol) and CO2 (44.01 g/mol). |
| ΔH⁰ | standard enthalpy of the carbonation reaction (0.178 MJ/mol). |
| Ta | average exothermic temperature (°C). |
| T1, T2, T3 | exothermic temperatures at monitoring points 1, 2, and 3 (°C). |
| Td,max | maximum temperature difference among the three monitoring points during carbonation. The maximum value of Td. |
| Td,avg | average temperature difference among the three monitoring points during carbonation. The average value of Td. |
References
- Prasad, J.S.; Muthukumar, P.; Desai, F.; Basu, D.N.; Rahman, M.M. A critical review of high-temperature reversible thermochemical energy storage systems. Appl. Energy 2019, 254, 113733. [Google Scholar]
- Burgaleta, J.; Arias, S.; Ramirez, D. Gemasolar, the first tower thermosolar commercial plant with molten salt storage. In Proceedings of the 2011 solar PACES, Concentrating Solar Power and Chemical Energy Systems Conference, Granada, Spain, 20–23 September 2011. [Google Scholar]
- Romero, M.; Steinfeld, A. Concentrating Solar Thermal Power and Thermochemical Fuels. Energy Environ. Sci. 2012, 5, 9234–9245. [Google Scholar]
- Wentworth, W.E.; Chen, E. Simple Thermal Decomposition Reactions for Storage of Solar Thermal Energy. Sol. Energy 1976, 18, 205–214. [Google Scholar]
- Ortiz, C.; Valverde, J.; Chacartegui, R.; Perez-Maqueda, L.; Giménez, P. The Calcium-Looping (CaCO3/CaO) process for thermochemical energy storage in Concentrating Solar Power plants. Renew. Sustain. Energy Rev. 2019, 113, 109252. [Google Scholar]
- Benitez-Guerrero, M.; Sarrion, B.; Perejon, A.; Sanchez-Jimenez, P.E.; Perez-Maqueda, L.A.; Valverde, J.M. Large-scale high-temperature solar energy storage using natural minerals. Sol. Energy Mater. Sol. Cells 2017, 168, 14–21. [Google Scholar]
- Perejón, A.; Valverde, J.M.; Miranda-Pizarro, J.; Sánchez-Jiménez, P.E.; Pérez-Maqueda, L.A. Large-Scale Storage of Concentrated Solar Power from Industrial Waste. ACS Sustain. Chem. Eng. 2017, 5, 2265–2272. [Google Scholar]
- Valverde, J.M.; Miranda-Pizarro, J.; Perejón, A.; Sánchez-Jiménez, P.E.; Pérez-Maqueda, L.A. Calcium-Looping performance of steel and blast furnace slags for thermochemical energy storage in concentrated solar power plants. J. CO2 Utlization 2017, 22, 143–154. [Google Scholar]
- Wang, W.; Zhang, J.; Gu, Y.; Luo, Q.; Zhou, G.; Li, A.; Lu, G.; Ma, T.; Zhao, Y.; Chang, Y.; et al. Recent Progress on Thermal Energy Storage for Coal-Fired Power Plant. J. Therm. Sci. 2024, 33, 2138–2150. [Google Scholar]
- Sun, H.; Li, Y.; Bian, Z.; Yan, X.; Wang, Z.; Liu, W. Thermochemical energy storage performances of Ca-based natural and waste materials under high pressure during CaO/CaCO3 cycles. Energy Convers. Manag. 2019, 197, 111885. [Google Scholar]
- Yang, Y.; Li, Y.; Yan, X.; Zhao, J.; Zhang, C. Development of Thermochemical Heat Storage Based on CaO/CaCO3 Cycles: A Review. Energies 2021, 14, 6847. [Google Scholar] [CrossRef]
- Shamsi, S.S.M.; Barberis, S.; Maccarini, S.; Traverso, A. Large scale energy storage systems based on carbon dioxide thermal cycles: A critical review. Renew. Sustain. Energy Rev. 2024, 192, 114245. [Google Scholar]
- Zhang, Q.; Feng, P.; Shen, X.; Cai, Y.; Zhen, H.; Liu, Z. Comparative analysis of carbonation strengthening mechanisms in full solid waste materials: Steel slag vs. carbide slag. Cem. Concr. Compos. 2025, 157, 105927. [Google Scholar]
- Gao, C.; Liu, X.; Zhang, Y.; Jin, F.; Li, D. Energy-storage materials with stable structure through carbide slag modification by acid impregnation and manganese doping. React. Chem. Eng. 2025, 10, 428–439. [Google Scholar]
- Baharoon, D.A.; Rahman, H.A.; Omar, W.Z.W.; Fadhl, S.O. Historical development of concentrating solar power technologies to generate clean electricity efficiently-A review. Renew. Sustain. Energy Rev. 2015, 41, 996–1027. [Google Scholar]
- Barin, I. Thermochemical Data of Pure Substances; VCH: Weinheim, Germany, 1989. [Google Scholar]
- Kyaw, K.; Kubota, M.; Watanabe, F.; Matsuda, H.; Hasatani, M. Study of carbonation of CaO for high temperature thermal energy storage. J. Chem. Eng. Jpn. 1998, 31, 281–284. [Google Scholar]
- Tregambi, C.; Di Lauro, F.; Montagnaro, F.; Salatino, P.; Solimene, R. 110th Anniversary: Calcium Looping Coupled with Concentrated Solar Power for Carbon Capture and Thermochemical Energy Storage. Ind. Eng. Chem. Res. 2019, 58, 21262–21272. [Google Scholar]
- Sun, J.; Liu, W.; Chen, H.; Zhang, Y.; Hu, Y.; Wang, W.; Li, X.; Xu, M. Stabilized CO2 capture performance of extruded-spheronized CaO-based pellets by microalgae templating. Proc. Combust. Inst. 2017, 36, 3977–3984. [Google Scholar]
- Alovisio, A.; Chacartegui, R.; Ortiz, C.; Valverde, J.; Verda, V. Optimizing the CSP Calcium Looping cycle integration for thermochemical energy storage. Energy Convers. Manag. 2017, 136, 85–98. [Google Scholar]
- Chacartegui, R.; Alovisio, A.; Ortiz, C.; Valverde, J.; Verda, V.; Becerra, J. Thermochemical energy storage of concentrated solar power by integration of the calcium looping process and a CO2 power cycle. Appl. Energy 2016, 173, 589–605. [Google Scholar]
- Edwards, S.E.B.; Materić, V. Calcium looping in solar power generation plants. Sol. Energy 2012, 86, 2494–2503. [Google Scholar]
- Karasavvas, E.; Panopoulos, K.D.; Papadopoulou, S.; Voutetakis, S. Design of an integrated CSP-calcium looping for uninterrupted power production through energy storage. Chem. Eng. Trans. 2018, 70, 2131–2136. [Google Scholar]
- Karasavvas, E.; Panopoulos, K.D.; Papadopoulou, S.; Voutetakis, S. Energy and exergy analysis of the integration of concentrated solar power with calcium looping for power production and thermochemical energy storage. Renew. Energy 2020, 154, 743–753. [Google Scholar] [CrossRef]
- Xu, T.X.; Tian, X.K.; Khosa, A.A.; Yan, J.; Ye, Q.; Zhao, C.Y. Reaction performance of CaCO3/CaO thermochemical energy storage with TiO2 dopant and experimental study in a fixed-bed reactor. Energy 2021, 236, 121451. [Google Scholar] [CrossRef]
- Ma, Z.; Li, Y.; Zhang, W.; Wang, Y.; Zhao, J.; Wang, Z. Energy storage and attrition performance of limestone under fluidization during CaO/CaCO3 cycles. Energy 2020, 207, 118291. [Google Scholar] [CrossRef]
- Abba, L.A.; Grace, J.R.; Bi, H.T. Variable-gas-density fluidized bed reactor model for catalytic processes. Chem. Eng. Sci. 2002, 57, 4797–4807. [Google Scholar] [CrossRef]
- Kai, T.; Toriyama, K.; Nishie, K.; Takahashi, T.; Nakajima, M. Effect of volume decrease on fluidization quality of fluidized catalyst beds. AIChE J. 2006, 52, 3210–3215. [Google Scholar] [CrossRef]
- Kai, T.; Takahashi, T. Formation of particle agglomerates after switching fluidizing gases. AIChE J. 1997, 43, 357–362. [Google Scholar] [CrossRef]
- Kai, T.; Furukawa, M.; Nakazato, T.; Tsutsui, T.; Mizuta, K.; Nakajima, M. Analysis of fluidization quality of a fluidized bed with staged gas feed for reactions involving gas-volume reduction. AIChE J. 2010, 56, 2297–2303. [Google Scholar] [CrossRef]
- Kai, T.; Furukawa, M.; Nakazato, T.; Nakajima, M. Prevention of defluidization by gas dilution for reactions involving gas-volume reduction. Chem. Eng. J. 2011, 166, 1126–1131. [Google Scholar] [CrossRef]
- Chu, Y.; Chu, B.; Wei, X.; Zhang, Q.; Wei, F. An emulsion phase condensation model to describe the defluidization behavior for reactions involving gas-volume reduction. Chem. Eng. J. 1987, 2012, 364–370. [Google Scholar] [CrossRef]
- Kai, T.; Furukawa, M.; Toriyama, K.; Nakazato, T.; Nakajima, M. Elimination of defluidization caused by reactions involving a volume reduction in a fluidized catalyst bed and improvement of fluidization by two-stage feeding. J. Chem. Eng. Jpn. 2009, 42, 733–738. [Google Scholar] [CrossRef]
- Lepek, D.; Valverde, J.M.; Pfeffer, R.; Dave, R.N. Enhanced nanofluidization by alternating electric fields. AIChE J. 2009, 1, 54–65. [Google Scholar]
- Guo, Q.J.; Li, Y.; Wang, M.H.; Shen, W.Z.; Yang, C.H. Fluidization characteristic of SiO2 nanoparticles in an acoustic fluidized bed. Chem. Eng. Technol. 2010, 29, 78–86. [Google Scholar]
- Quevedo, J.; Pfeffer, R.; Shen, Y.; Dave, R.; Nakamura, H.; Watano, S. Fluidization of nanoagglomerates in a rotating fluidized bed. AIChE J. 2010, 52, 2401–2412. [Google Scholar]
- Esmailpour, A.; Mostoufi, N.; Zarghami, R. An improved model for estimating fractal structure of silica nano-agglomerates in a vibro-fluidized bed. Int. J. Multiphysics 2015, 9, 325–340. [Google Scholar]
- Lv, B.; Deng, X.; Shi, C.; Fang, C. Effect of agitation on hydrodynamics and separation performance of gas-solid separation fluidized bed. Powder Technol. 2021, 388, 129–138. [Google Scholar] [CrossRef]
- Xiao, Y.; Sun, W.; Peng, J.; Han, H.S.; Xie, L. Experimental and CFD simulation study on interphase interaction of the fluidization behavior for spherical and irregular coarse particles. J. Cent. S. Univ. 2023, 30, 1915–1931. [Google Scholar]
- Zhou, Y.; Zhu, J. Group C+ particles: Enhanced flow and fluidization of fine powders with nano-modulation. Chem. Eng. Sci. 2019, 207, 653–662. [Google Scholar] [CrossRef]
- Al-Ghurabi, E.; Ajbar, A.; Asif, M. Improving fluidization hydrodynamics of group C particles by mixing with group B particles. Appl. Sci. 2018, 8, 1469. [Google Scholar] [CrossRef]

| CaO | MgO | SiO2 | Al2O3 | Fe2O3 | K2O | Others |
|---|---|---|---|---|---|---|
| 95.28 | 1.53 | 2.25 | 0.38 | 0.28 | 0.25 | 0.03 |
| Point | Tmax (°C) | th (s) | Rh (°C/s) | Td,max | Td,avg | |
|---|---|---|---|---|---|---|
| 100% CO2 | 1 | 838.0 | 21 | 7.12 | 60 | 38 |
| 2 | 879.0 | 29 | 5.39 | |||
| 3 | 825.0 | 32 | 5.05 | |||
| 70% CO2 | 1 | 853.0 | 134 | 3.95 | 18 | 7 |
| 2 | 853.0 | 154 | 3.95 | |||
| 3 | 845.0 | 144 | 3.67 |
| N | Point | Tmax (°C) | th (s) | Rh (°C/s) | Td,max | Td,avg |
|---|---|---|---|---|---|---|
| 10 | 1 | 834.0 | 36 | 5.25 | 25 | 12 |
| 2 | 882.0 | 34 | 5.81 | |||
| 3 | 878.0 | 25 | 4.79 | |||
| 20 | 1 | 874.0 | 10 | 7.53 | 9 | 3 |
| 2 | 873.0 | 9 | 7.27 | |||
| 3 | 864.0 | 15 | 7.22 |
| Additive Amount | Point | Tmax (°C) | th (s) | Rh (°C/s) | Td,max | Td,avg |
|---|---|---|---|---|---|---|
| 1 wt.% | 1 | 873.0 | 33 | 4.73 | 44 | 17 |
| 2 | 850.0 | 28 | 3.74 | |||
| 3 | 884.0 | 39 | 4.13 | |||
| 3 wt.% | 1 | 893.0 | 63 | 4.33 | 67 | 17 |
| 2 | 862.0 | 59 | 3.93 | |||
| 3 | 888.0 | 74 | 4.67 | |||
| 5 wt.% | 1 | 894.0 | 47 | 5.11 | 22 | 4 |
| 2 | 887.0 | 43 | 4.72 | |||
| 3 | 884.0 | 46 | 4.91 |
| Particle Size (mm) | Point | Tmax (°C) | th (s) | Rh (°C/s) | Td,max | Td,avg |
|---|---|---|---|---|---|---|
| 0.125–0.18 | 1 | 890.0 | 60 | 3.19 | 51 | 15 |
| 2 | 865.0 | 44 | 2.40 | |||
| 3 | 885.0 | 52 | 2.88 | |||
| 0.075–0.125 | 1 | 889.0 | 51 | 4.47 | 53 | 12 |
| 2 | 863.0 | 62 | 3.66 | |||
| 3 | 886.0 | 56 | 4.56 | |||
| 0.05–0.075 | 1 | 894.0 | 47 | 5.11 | 22 | 4 |
| 2 | 887.0 | 43 | 4.72 | |||
| 3 | 884.0 | 46 | 4.91 |
Disclaimer/Publisher’s Note: The statements, opinions and data contained in all publications are solely those of the individual author(s) and contributor(s) and not of MDPI and/or the editor(s). MDPI and/or the editor(s) disclaim responsibility for any injury to people or property resulting from any ideas, methods, instructions or products referred to in the content. |
© 2025 by the authors. Licensee MDPI, Basel, Switzerland. This article is an open access article distributed under the terms and conditions of the Creative Commons Attribution (CC BY) license (https://creativecommons.org/licenses/by/4.0/).
Share and Cite
Yin, H.; Liu, Y.; Yang, L.; Li, Y.; Zhu, X.; Zhang, L.; Ruan, Y.; Ma, M.; Fan, X. Effect of Al2O3 Particle Addition on Fluidized Bed Thermochemical Heat Storage Performance of Limestone: From Instability Mitigation to Efficiency Enhancement. Energies 2025, 18, 1791. https://doi.org/10.3390/en18071791
Yin H, Liu Y, Yang L, Li Y, Zhu X, Zhang L, Ruan Y, Ma M, Fan X. Effect of Al2O3 Particle Addition on Fluidized Bed Thermochemical Heat Storage Performance of Limestone: From Instability Mitigation to Efficiency Enhancement. Energies. 2025; 18(7):1791. https://doi.org/10.3390/en18071791
Chicago/Turabian StyleYin, Hongmei, Yang Liu, Liguo Yang, Yingjie Li, Xiaoyi Zhu, Lei Zhang, Yu Ruan, Ming Ma, and Xiaoxu Fan. 2025. "Effect of Al2O3 Particle Addition on Fluidized Bed Thermochemical Heat Storage Performance of Limestone: From Instability Mitigation to Efficiency Enhancement" Energies 18, no. 7: 1791. https://doi.org/10.3390/en18071791
APA StyleYin, H., Liu, Y., Yang, L., Li, Y., Zhu, X., Zhang, L., Ruan, Y., Ma, M., & Fan, X. (2025). Effect of Al2O3 Particle Addition on Fluidized Bed Thermochemical Heat Storage Performance of Limestone: From Instability Mitigation to Efficiency Enhancement. Energies, 18(7), 1791. https://doi.org/10.3390/en18071791